document resume - files.eric.ed.gov · document resume ed 059 272 tm 001 089 ... michigan drug...
TRANSCRIPT
DOCUMENT RESUME
ED 059 272 TM 001 089
AUTHOR Francis, John Bruce; Patch, David J.
TITLE Student Attitudes Toward Drug Education Programs at
the University of Michigan.INSTITUTION Michigan Univ., Ann Arbor.PUB DATE Sep 69NOTE 30p..
EDR§--PRICE MF-$0.65 HC-$3.29DESCRIPTORS Alcoholism; *College Students; *Drug Abuse; Drug
Addiction; *Drug Education; Educational Programs;Health Education; Lysergic Acid Diethylamide;Marihuana; Narcotics; Program Evaluation;*Questionnaires; School Surveys; Sedatives;Stimulants; *Student Attitudes; Student Motivation;Student Reaction; Tobacco
ABSTRACTDuring the Winter term of 1969, the University of
Michigan Drug Education Committee charged its Survey Sub-Committee to
prepare and administer a survey of University of Michigan student
attitudes toward potential drug education programs, (see TM 001 090).
The purpose of this survey was to determine what kinds of information
about drugs were needed and desired by students and through what
types of formats students were most likely to accept suchinformation. Additionally, the extent and level of drug use on the
campus was assessed with view to more accurate and effective planning
of drug education programs. This report details the findings of that
survey. (Author)

STUDENT ATTITUDES TOWARD DRUG ED6CATION
PROGRAMS AT THE UNIVERSITY OF MICHIGAN
Report of a Survey Conducted for the Drug
Educat ion Survey Sub-Commi ttee
by
John Bruce Francis
and
David J. Patch
Under the Auspices of the
Univers i ty Committee on Drug Education
September, 1969
U.S. DEPARTMENT OF HEALTH,EDUCATION & WELFAREOFFICE OF EDUCATION
THIS (DOCUMENT HAS BEEN REPRO-DUCED EXACTLY AS RCCEIVED FROMTHE PERSON OR ORGANIZATION ORIG-INATING IT. POINTS OF VIEW OR OPIN-IONS STATEO 00 NOT NECESSARILYREPRESENT OFFICIAL OFFICE OF E01.1-CATION POSITION OR PO;.ICY.
- 1

ACKNOWLEDGEMENTS
The authors wish to express their appreciation to the
many persons whose support and help was invaluable in
the preparation and administration of this survey.
Edward S. BordinLenin A. BalerSteven SchwartzThomas A. ButtsStudent Affairs Counseling
Office Staff
Financial support for this study was provided by
Acting Vice-President for Student Affairs, Barbara
W. Newell.

TABLE OF CONTENTS
IIntroduction and Purpose of Survey
II Relevant Research
III Methodology
IV Demographic Characteristics of the Respondents
V Findings
VI Recommendations
VII Appendices
A. The Questionnaire
B. Demographic Characteristics of the Sample

I INTRODUCT!ON
During the Winter term of 1969, the University of Michigan Drug Edu-
cation Committee charged its Survey Sub-Committee to prepare and ad-
minister a survey of University of Michigan student attitudes toward
potential drug education programs. The purpose of this survey was
to determine what kinds of information about drugs were needed and
desired by students and through what types of formats students were
most likely to accept such information. Additionally, the extent
and level of drug use on the campus was assessed with a view to more
accurate and effective planning of drug education programs. This
report details the findings of that survey.
2.
II Relevant Research
Drug use among college populations has been the subject of numerous
studies reported in the literature (Suchman, 1967: Eastern Michigan
University, 1969; Bogg, et.al., 1968; Gallup, 1569; Murphy, et.al.,
1969: Pollcck, 1969; Hinckley, et.al, 1968; Rand, et.al, 1968).
However, attempts to relate these studies to the purposes and find-
ings of this survey were hindered by tem factors: 1.) Most of the
reported research focuses on the incidence and prevalence of drug
use among college students, with a notable few exceptions seeking
to explore student attitudes and motivations for drug use. To the
authors' knowledge no research has dealt specifically with which
types of drug education programs would be acceptable to a college
student population. 2.) Most studies of college student drug use
were weakened by the use of non-representative samples. With the
exception of Suchman's study in California and perhaps a recent Gal-
lup poll, most of the studies were based on only marginally represen-
tative samples within,the University setting, thus, weakening their
generalizability.
Most observers comment on the growing incidence and prevalence of drug
use among junior high, high school, and college age students. Addi-
tionally, it would appear that recent surveys indicate more prevalent
use of "harder" drugs such as LiD, the amphetamines, and narcotics.
Whether this apparent increase is due to actual higher drug use, or
is an artifact of sampling technique and/or the greater willingness
of young people to admit to drug use, must remain an open question.
-

3.
I I I Methodology
On April 2, 1969, 1000 questionnaires were sent to randomly selected
students of the University of Michigan. The students were asked to
report- the i r own usage of a wi de-range of non-medi cal 1 y prescri bed
drugs and to indicate their preferences for various types of drug
education programs.
The instrument used to collect the data for this study was a two-
section questionnaire which is included as Appendix A. Students were
requested first to indicate the history and extent of their drug usage;
and then to respond to further questions about their attitude toward
the content, format, and sponsorship of drug education programs. At
the end of the questionnaire students were asked for demographic in-
formation and were given the opportunity to make open-ended comments.
In a covering letter attached to the questionnaire, students were
assured of the confidentiality of their responses. No record was
kept of to whom the questionnaires were sent; all were requested not
to sign their names: and no code numbers or other identifying symbols
were placed on the questionnaire or return envelope.
A sample of 1000 students was chosen randomly by computer. This
offered as adequate a means of obtaining a representative sample of
the University student population as was available.
Within three weeks approximately 600 questionnaires were returned of
which 580 were found usable for the study. In view of the fact that
the mailing had occurred immediately prior to the final examination

period, the 5P% response would indicate a widespread and generally
high level of interest on the part of the students. It is not pos-
sible to assert that the finai sample (the returned questionnaires)
was random and representative, Thereforelany generalization of
the findings must be tentative. However, to the extent that the
respondeots' demographic configuration approximates that of the
total University student population, our findings would appear to
provide fairly appropriate bases for decision-making in the planning
of drug education programs (see below).
The drugs listed in the first part of the questionnaire were divid-
ed into sey,.n majo- categories according to their pharmacological
properties.
1. NARCOTICS
These were:
2. HALLUCINOGENS 3. AMPHETAMINES 4. TRANQUILIZERS
codeine LSD dexedrine chloral hydrate
heroin mescaline diet pills doriden
morphine peyote methedrine equanil
opium psylocybintetrahydro-cannabinol
miltownnembutalphenobarbitalseconal
5. MARIJUANA-HASHISH 6. IOBACCOL 7. ALCOHOL
Each individual was assigned a level of use for each of the seven dif-
ferent categories based on his highest level of use of any one drug
within that category.
The list of drugs also included the names of two substances which do
not exist; i.e. Phonodentriate (Phonies) and RNR. These names were
included to control for respondents who might tend to overestimate the
extent of their drug use as well as for those who were not responding
seriously. The fact that only tINO out of the 580 respondents indicated
having used these bogus drugs add credence to the conclusion that most
students attempted to answer honestly and to the best of their know-
ledge.
In the second part of the questionnaire, that dealing with student
attitudes toward drug education programs, respondents were coded for
heir favorability orunfavorability of the proposed program content,
and for their receptivity or non-receptivity to different program
formats. Thus, "strong approval" and "approval"; "disapproval" and
"strong disapproval" were combined as favorability and unfavorability
toward drug program content. Similarily,"would definitely attend"
and "probably would attend"; "probably would not attend" and "definite-
ly would not attend" were combined as receptivity and non-receptivity
to different program formats. No attempt was made at this time to
code the many open-ended response of students to any of the items in
the questionnaire. These were simply perused and conclusions drawn
from a general look at them by the data prtcessors.

6.
IV Demographic Characteristics of the Respondents
Appendix B presents summary tables of the demographic characteristics
of the sample. The 60.7% of the sample who were male, and the 39.3%
who were female matches almost perfectly the 60% to 40% male-female
breakdown of the total student population. Similarity, the 30.9%
of the sample who were married and the 69.1% who were single approx-
imates very closely the percentage of the total student population
where 28% are married and 72% single. Certain residence groupings
resemble those of the total University with 34.3% of the sample liv-
ing in University Housing, and 57.5% living in Off-Campus Housing.
Total University figures are 33% for University Housing and 54% for
Off-Campus Housing. Weaknesses in the sample's configuration show
themselves in the breakdown for year in school and for schools and
colleges of the University. Undergraduates make up 49% of survey
sample while comprising 60% of the total University. This perpon-
derance of graduate students in the sample may well affect some of
the findings and should be carefully considered in drawing conclu-
sions. The representation of the various schools and colleges is
limited by the fact that no responses were received from Law, Medi-
cine, and Dentistry, and proportionately few from the School of Ed-
ucation. One discrepancy between the questionnaire and the Univers-
ity methods of reporting led to a large proportion of the sample
listed as members of Rackham Graduate School. According to Univers-
ity reporting, students are not listed as mdmbers of Rackham, but
rather are listed according to the academic unit which the Rackham
9

7.
department adheres to. Consequently, the 40% of the sample listed
as belonging to Rackham should actually be divided up among the
various other schools and colleges. If this could be done it is
quite possible that the configuration of students from LUA and
Engineering, in the sample, would closely approximate that of the
total University.
In summary, it can be said that with regard to sex, marital status,
and, certain residence groupings the sample matches the configura-
tion of the University. There is, however, a larger proportion of
graduate students in the sample than in the total student population.
Parenthetically, one obvious limitation is the small number of seniors
who responded to the questionnaire - only 2.2%, as opposed to 16.5%
for the total University. For this reason, in some cases juniors
and seniors are grouped for presentation of the findings.
- 10

8.
V FINDINGS
Table 1
Usage of Drugs (N-580)By Total Sample
Never Only Once Seldom Often Regularly
Narcotics 83.1% 6.3% 9.9% 0.5% 0.2%
Amphetamines 75.3% 8.5% 12.5% 2.8% 0.9%
Tranquilizers 87.8% 3.1% 7.8% 1.2% 0.0%
Hallucinogens 87.8% 4.7% 5.2% 1.6% 0.7%
Marijuana/Hashish
55.9% 7.3% 21.4% 9.9% 5.4%
Tobacco 43.0% 3.1% 20.6% 8.9% 24.4%
Alcohol 10.1% 0.9% 44.6% 33.6% 10.8%
Table I, above, portrays the percentages of students using different
drugs at different usage levels. This data cleatly Indicates that an
overwhelming percentage of University of Michigan students have had
no experience in using non-medically prescribed Narcotics (83.1%),
Amphetamines (75.3%), Tranquilizers (87.8%), or Hallucinogens (87.8%).
A majority (55.9%) have never tried Marijuana or Hashish, while con-
siderably smaller percentages have never tried Tobacco (43.0%) or
Alcohol (10.1%).
What use there is of non-medically prescribed drugs would appear to
be predominantly of an experimental nature (used drug once or seldom):
Narcotics, 16.2%; Tranquilizers, 10.9%; Hallucinogens, 9.9%; Ampheta-
mines, 21%; Marijuana-Hashish, 28.7%; Tobacoo, 23.4%; and Alcohol,
45.5%. With the exception of Marijuana-Hashish, Tobacco, and Alcohol,

9.
the use of these drugs at levels of "often" or "regularly" is very
smal 1 : Narcotics, 0.7%; Tranquilizers , 1.2%; Hallucinogens, 2.3%;
and Amphetamines, 3.7%; Marijuana-Hashish is used often or regularly
by 14.9% of the sample, while Tobacco is used by 33.3% and Alcohol
by 44.4% of the sample at these levels.
Looking at this data in a different way (summing the last four col-
umns of Table I) shows that 16.9% of the sample used Narcotics at
least once. 24.7% have had such experience with Amphetamines, 12.2%
with Tranquilizers, 12.2% with Hallucinogens, and 44.1% with Mari Juana-
Nashish$57.0% have had some experience with the use of Tobacco, while
89.9% have had some experience with Alcohol.
A finding of particular interest is the large percentage of students
who have used Marijuana-Hashish at least once. This figure is consid-
erably higher than that reported in nxxst recent surveys of college stu-
dent drug use, thus indicating that the use of Marijuana has increased
or is increasing rapidly, or, that students in this sample were more
willing to report their usage of this substance. If the increased
amount of Marijuana use is a result of more accurate reporting by the
respondents, this might be explained by the assurance of complete con-
fidentiai ity in this survey or by lessening social stigma attached to
the use of Marijuana.
Tables II and III, below, present breakdowns of drug use by different
residence groupings and by year in school.

10 .
Un i vers
HousingN=
%
Different
Table I I
Drug Use In
i ty
(n)
Sorori ty
N= 15
% (n)
Co-Op
N= 12
% (n)
Residence Settings
i ty
197
(n)
Off-CampusHousingN= 330
% (n)
FraternN= 1 9
%
Narcotics 14.7% (29) 17.6% (58) 31.6% (6) 13.3% (2) 16.7% (2)
Amphetamines 23.9% (47) 24.8% (85) 21.1% (4) 13.3% (2) 16.7% (2)
Tranqui 1 i zers 8.1% (16) 15.5% (51) 5.2% (1) 000% (0) 000% (0)
Hallucinogens 11.2% (22) 12.1% (40) 26.3% (5) 00.0% (0) 8.3% (1)
Marijuana/Hashish
44.7% (88) 43.0% (142) 579% (11) 33.3% (5) 41.7% (5)
Tobacco 55.3% (109) 59.1% (195) 47.4% (9) 60.0% (9) 25.0% (3)
Alcohol 88.3% (174) 92.4% (3e5) 94.7% (18) 86.7% (13) 50.0% (6)
The figures in Table II demonstrate the fairly uniform use of various
drugs throughout the residence groupings. Several interesting depart-
ures from this uniformity are indicated: Respondents from Fraternities
reported almost twice as much use of Narcotics and Hallucinogens as any
other group of respondents, as well as a significantly higher use of
Marijuana/Hashish; respondents from Co-ops were noticeably lower in
their reported use of Tobacco and Alcohol, while respondents from Sor-
orities indicated no use of Tranquilizers or Hallucinogens. Any inter-
pretation of these findings must be tempered in light of the fact that
the samples for Fraternities, Sororities, and Co-ops were small, al-
though fairly representative.

FreshmenNa 98
% (n)
Table III
Drug Use By
(n)
GraduateN= 296
% (n)
Year in School
SophomoreN= 92
% (n)
Junior-SeniorN= 86
%
Narcotics 19.3% (19) 15.2% (15) 27.5% (24) 13.2% (39)
Amphetamines 24.5% (24) 27.1% (25) 34.6% (30) 21.2% (64)
Tranquilizers 7.1% (7) 9.8% (8) 9.3% (8) 15.5% (46)
Hallucinogens 13.3% (13) 16.3% (15) 22.0% (19) 7.4% (22)
Marijuana!Hashish
46.9% (46) 52.2% (48) 58.1% (50) 36.8% (109)
Tobacco 53.1% (52) 50.0% (46) 61.6% (53) 58.8% (174)
Alcohol 86.7% (85) 92.4% (85) 90.6% (78) 90.9% (269)
Analysis of Table III, above, showing drug use by year in school, indi-
cates a gen,ral tendency for usage figures to increase as students pro-
gress in school until at the graduate level there is a drop in usage
of all substances with the exception of Tranquilizers, which incceases,
and Alcohol which remains stable. It is always dangerous to interpret
cross-sectional data in a longitudinal fashion, and hence, any conclu-
sions must be viewed very tentatively.
Perhaps the most striking, if not surprising, finding of this portion
of the study is the high degree of Tobacco and Alcohol use reported
by respondents in all categories and groupings. 33.3% of the sample
use Tobacco at a level of often or regularly and 44.4% use Alcohol at
these levels. With all the attention paid to the potential dangers of
non-medically prescribed drug use, it is often forgotten that the poten-
tial for abuse (and consequential physical and psychological damage) is
a very real factor in the use of Tobacco and Alcohol. Quite possibly it
is time for studies such as these to look more carefully at the use of

12.
tobacco and alcohol and to include reference to them in drug education
programs. Certainly, the preliminary findings of this survey would
indicate that there is a very real problem with regard to alcohol and
tobacco usage on this campus.
Responses to the various attitudinal items of the questionnaire were
analyzed in terms of the total sample responses by year in school,
responses by residence groupings, and finally, by three sub-populations
grouped on the basis of their choice of sponsorship of drug education
programs. The findings presented here will reflect these different
breakdowns and will attempt to answer six major questions.
1. Are the present campus and community resources ade-quate to meet the needs of individuals with questionsor problems related to drugs?
2. Is there a need for drug programs?
3. Do students trust the University to provide theseprograms?
4. Who should organize and conduct such programs?
5. What content should such programs have?
6. What format should be used to present drug programs?
Section I - Are the present campus and community resources adequate?
In the opinion of most students the existing campus and community re-
sources are not adequate to meet the needs of individuals with ques-
tions or problems relating to drugs. This is the view of 61% of the
total sample and is reflected in all of the figures for each class
year! freshmen 57.1%, sophomores 63%, juniors 69.9%, seniors 69.2%,
and graduates 59.6%. From another point of view it appears that the

percentage of students who are willing to say that programs are ade-
quate decreases from the freshman year, 31.6%, to thts graduate level
where only 15.2% so indicate. This trend might indicate that the
longer students remain on campus, the more aware they become of de-
ficiencies in campus and community resources.
Section II - Is there a need for campus drug programs?
A very definite conclusion of the total sample is that thcre is a
campus need for drug education programs. 80.2% of all students an-
swered yes to this question including 71.4% of the freshmen, 82.6%
of the sophomores, 89% of the juniors, 53.8% of the seniors, and 81.4%
of tl-e graduate students.
Section III - Do students trust the University to provide these pro-
grams?
In general, the students do trust the University to present objective
and unbiased information about drugs and its programs. 59.5% of the
students answered this question affirmatively while 37.2% ansvered it
in the negative. The general trend of trust in the University held
true across all years with the exception of the junior year in which
45.2% said that they did not trust the University. Students in all
residence groupings also tended to trust the University at levels
above 50%. Those who reported that they did not trust made comments
in virtually all cases as to why the University was not trusted. A
brief perusal of these comments indicates a belief that the University
position would be a self-serving one and would bow to the demands of

14.
outside influences such as the Legislature and parents in developing
programs.
Section IV - Who should sponsor and direct such programs?
The answer to this questicn was indicated by the frequency with which
students chose different possible sources of organization and direc-
tion. Types of sponsorship were chosen in the following rank order:
Student-faculty-administration committee 242 choices
Students 214
University counseling agencies 163
Community agencies 98
Faculty 95
Administration 33
On the basis of these choices it was possible to look at the responses
of three different sub-groups: those who chose student-faculty-adminis-
tration committees, those who chose student direction, and those who
chose direction by University counseling agencies. Information about
the content and format of programs will be reported in the findings
from some of these sub-groupings.
Section V - What content should such programs have?
From the standpoint jf developing drug education programs the question
of what purposes they should serve and what content they should have
is among the most important. The results of this study indicate that
three types of programs are approved or strongly approved by 90% or
more of the total sample of students in all years and under all resi-
dence groupings. These approved programs are: 1) Programs which pro-
vide current and objective information about the physical and psycho-
17

logical consequences of drug use. 2) Programs which provide informa-
tion on resources available to assist students with problems relating
to the use of drugs. 3) Programs which provide accurate information
on the legal aspects of drug use.
Students generally disapprove of programs which provide information
designed primarily to discourage the use of non-medically prescribed
drugs. 58.5% of the total group, over 60% of the freshmen, sophomores,
and juniors, 46% of the seniors, and 55% of the graduate students dis-
approved or strongly disapproved such programs. Viewed by choice of
sponsorship of programs, 74.4% of students who wished to have programs
sponsored by students rejected programs aimed at discouraging drug use.
The only substantial approval for such programs came from thqse re-
spondents who wished programs sponsored by counseling agencies 34.6%,
and by those who wanted programs sponsored by student-faculty-adminis-
tration committees, 33%.
To a lesser extent students approve programs which provide objective
information on the social aspects of drug use (71%) and programs geared
to the liberalization of present drug laws (57.8%). There is general
indifference among all years and all residence groupings to programs
of how to get high or to turn on without drugs. The overall percent-
age is in the area of 30% approval.
Section VI - What formats should be used?
Drug education program formats which have the best chance of being
well received by students show results which are far less clear than

16.
the previous question dealing with the content of such programs. Thus,
in general the presentation of drug education programs should always
be geared to the interest and receptivity of specific groups rather
than to the student population as a whole.
However, a degree of agreement exists among all students that articles
in the Michigan Daily would be well received (50.8%). In addition, lec-
tures by well known experts (46%) and lectures followed by discussion
with well known experts (44.1%) also showed a certain amount of attrac-
tiveness to the total sample. One exception to this finding is that
there is less readiness by graduate students to attend lectures by
experts (37.5% said they would attend) or lectures followed by dis-
cussions (32.1%). There is a general non-receptivity across all years
and residence groupings and in the total sample to lectures by Univers-
ity of Michigan faculty members. Only 21.7% would attend such programs.
Additionally, programs over WCBN where only 144 would receive them well
and audio-visual program* (22.9%) are other indications of non-recep-
tivity.
Other possible formats for drug programs did not receive overall accep-
tance or rejection by the total sample but rather seemed to be accept-
able to some groups while not to others.
Discuss;ons led entirely by and for students would be attended by 41.1%
of juniors, by 39.4% of those students who chose student direction of
programs, and by 44.5% of fraternity members. On the other hand, only
13.6% of the graduate students would attend; 22.2% of those students

17.
who chose student-faculty-administration committee sponsorship, 17.6%
of students in off-campus housing, and 20% of sorority members would
attend such programs.
Small group discussion with trained leaders would be attended by 31.6%
of the freshmen, 35.6% of the juniors, and between 35% and 40% of fra-
tern'ities and sororities. However, only 23.8% of sophomores and 18%
of graduate students would attend such programs, while 20.7% of stu-
dents in off-campus housing showed a willingness to attend. Appropri-
ate courses seemed attractive to 47.1% cf those in fraternities and to
53.4% of those in sororities. Courses were also generally attractive
to undergraduates; freshmen 41.9%, sophomores 39.2%, juniors 46.5%.
However, only 25% of graduates indicated that courses would have any
appeal. Non-credit seminars would be attended by 42.4% of the juniors
but by a much smaller percentage of respondents in other categories.
The teach-in was generally well received by freshmen (53.1%), sopho-
mores (51.1%), juniors (50.7%), by students in University housing
(46.6%), and In fraternities and sororities (over 60%). However,
seniors (23%) and graduates (22.6%) showed that they would be less
willing to attend.

18.
Vi RECOMMENDATIONS
On the basis of the findings in the attitudinal portion of the study,
it was possible to put together a series of program content and for-
mat recommendations for specific sub-groups which would appear to have
the greatest chance for success. Five such programs were conceived
and are presented in Table IV on the following page.
Also included in this section is a set of Preliminary Program Recom-
mendations designed for the use of the Program Sub-Committee.
21

Sponsor
Table IV
BASES FOR SPECIFIC DRUG PROGRAM
Content
Format (ranked by preference)
Freshman
Physiological and psyChological
1)
Lectures plus discussion with experts
consequences of drug use
2)
Lectures by well-known experts
Legal Aspects
3)
Campus-wide teachin
Problem Resources
4)
Appropriate courses
5)
Small group discussion with trained
leaders
University Housing
Problem Resources
1)
Daily articles
Consequences of drug use
2)
Lectures plus discussion
Legal Aspects
3)
Lectures by experts
4)
Teach-in
Fraternities
Problem Resources
1)
Teach-in
Consequences of drug use
2)
Lectures plus discussion
Legal Aspects
3)
Appropriate courses
4)
Daily articles
5)
Student-led discussions
Student Government
Consequences of drug use
1)
Daily articles
Council
Legal Aspects
2)
Lectures plus discussion
Problem Resources
3)
Teach-in
Liberalizing Drug Laws
4)
Lectures by experts
University Drug
Consequences of drug use
1)
Lectures by experts
Committee
Legal Aspects
2)
Lectures plus discussion
Problem Resources
3)
Daily articles
Social Aspects of drug use
4)
Teach-in
20 .
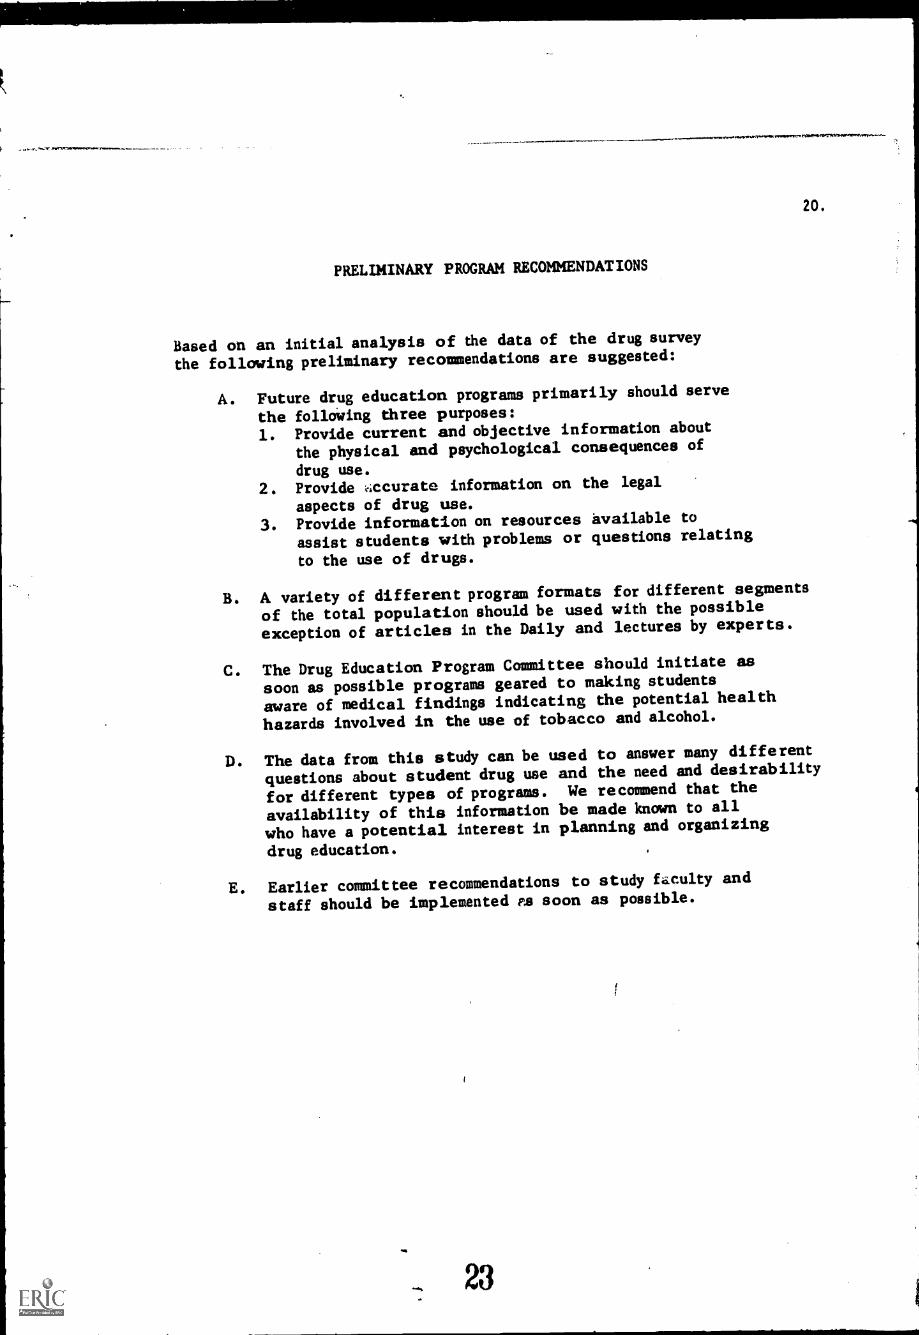
PRELIMINARY PROGRAM RECOMMENDATIONS
Based on an initial analysis of the data of the drug survey
the following preliminary recommendations are suggested:
A. Future drug education programs primarily should serve
the following three purposes:
1. Provide current and objective information about
the physical and psychological consequences of
drug use.
2. Provide .ccurate information on the legal
aspects of drug use.
3. Provide information on resources available to
assist students with problems or questions relating
to the use of drugs.
B. A variety of different program formats for different segments
of the total population should be used with the possible
exception of articles in the Daily and lectures by experts.
C. The Drug Education Program Committee should initiate as
soon as possible programs geared to making students
aware of medical findings indicating the potential health
hazards involved in the use of tobacco and alcohol.
D. The data from this study can be used to answer many different
questions about student drug use and the need and desirability
for different types of programs. We recommend that the
availability of this information be made known to all
who have a potential interest in planning and organizing
drug education.
E. Earlier committee recommendations to study Liculty and
staff should be implemented PS soon as possible.
23

77,77
APPENDIX A
THE QUESTIONNAIRE
Dear Student:
The University Committee on Drugs, a campus-wide group
composed of students, faculty, and administrative staff, would
appreciate your cooperation and assistance in completing the
attached questionnaire. One of this committee's responsibil-
ities is to make recommendations regarding the types of serv-
ices and programs on drugs that students need and want. In
order to obtain an accurate assessment of student desires and
attitudes in this area we have created this questionnaire which
Is being sent to approximately 1000 students chosen at random
by computer.
Inasmuch as we are asking you to give an indication of
your own experience with non-medically prescribed drugs, we
have taken every step to insure the 'confidentiality of your
response: there will be no record kept of tp whom the ques-
tionnaires are sent; we are requesting that you not sign your
name or otherwise ideni)fy yourself( and we are using no code
numbers anywhere on the ,questionnaire or return envelope.
We need your frank and open responses to this study in
order to make reconmendations for the provision of adequate
programs in the drug area and will greatly appreciate your
taking the 10 to 15 minutes necessary bp complete the ques-
tionnaire. Please feel free to communicate any additional
comments, suggestions, or concerns in the space provided on
the back of the questionnaire. Thank you for your assistance.
ESB/mhk
Si ncere I y,
etettivr.4../. A. /3..
University Committee on DrugsEdward S. Bordin, Chairman
24

1.
In this question we are interested in
learning about actual
drugs, outside of those taken under a medical prescription.
left side of the dividing line, circle the number between 1
for each drug listed.
2) On the right side of the dividing
best describes the extent of your use of each drug.
experience you have had in using a variety of
Your answer should be in two parts:
1) On the
and 4 which best describes
your history of use
line, circle the number between 5 and 8 which
HISTORY .7.F USE
Present
Use
Only
Only
Once
EXTENT OF USE
Regularly
Past Use
Never
Only
Past and
Present
Use
Seldom
Often
Alcohol
23
45
67
3
Benzedrine (Bennies)
23
45
67
8
Chlorai Hydrate
23
45
67
Codeine
23
45
67
Dexedrine (0exies)
23
45
67
8
Diet Pills
23
45
67
8
Doriden (Goofers)
23
45
67
8
Equanil
23
45
67
8
Hashish
23
45
67
8
Heroin (Horse, "H")
23
45
57
8
Lysergic Acid Diethytamide
(LSD)
23
45
67
8
Marijuana (Pot, Grass)
23
45
67
Mescaline
23
45
67
Methedrine (Speed)
23
A5
67
Miltown
23
45
67
8
Morphine
23
45
67
8
Nembutal (Yellow Jacketsl
34
56
78
Opium (Op)
23
45
67
8
Tiyote (Cactus)
23
45
67
8
P!,enobarbital (Phennies)
23
45
67
8
Phonodentriate (Phonies)
23
45
6, ,
8
Fsilocybin
23
45
67
8
RNR
23
45
67
8
Seconal (Red Devils)
23
45
67
8
34
56
78
Tetrahydocannabinol (THC)
23
45
67
8
obacco
23
45
67
8
DruA(s) (specify)
23
45
67
8
23
45
6,
8
24
56
73
)
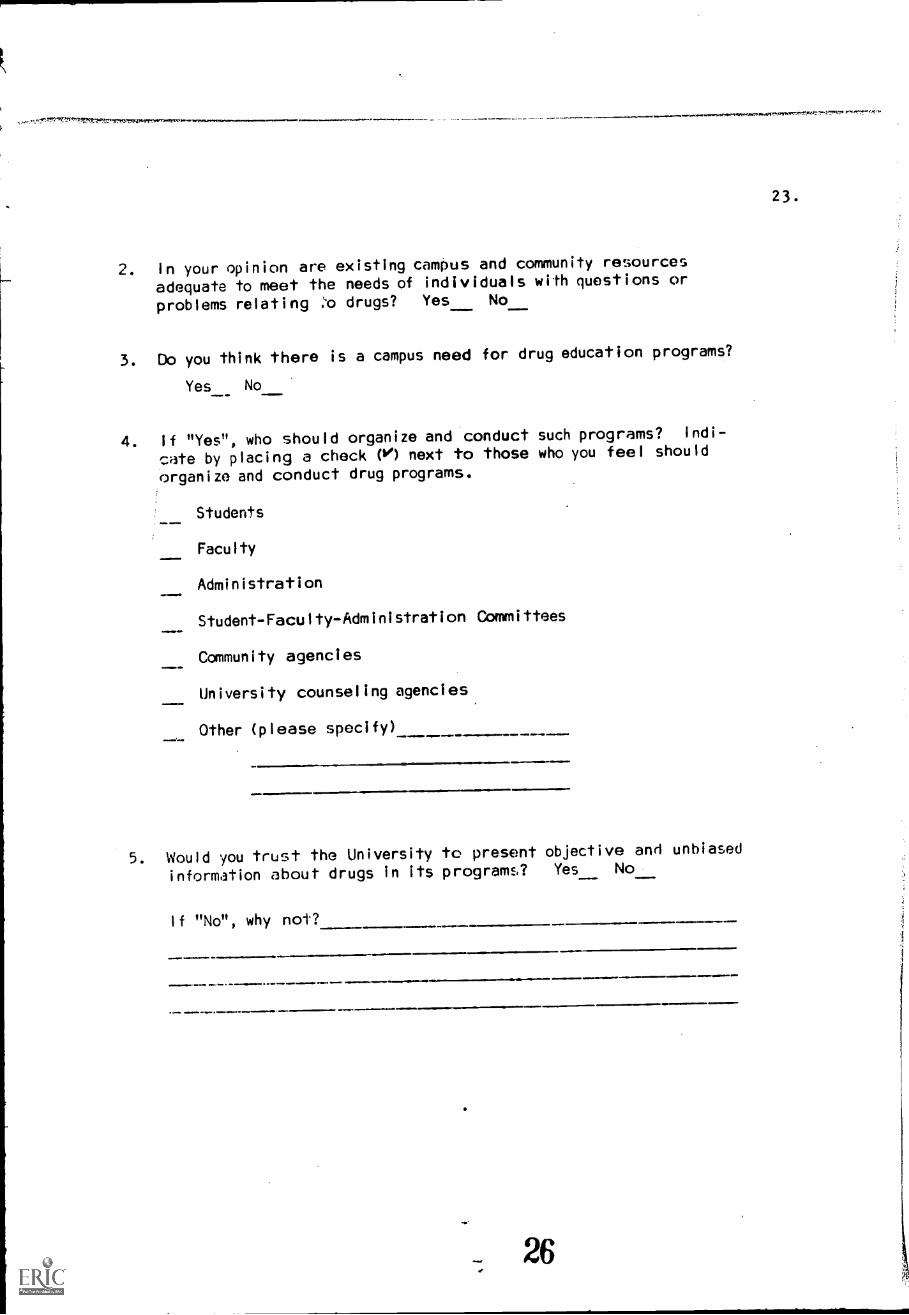
23.
2. In your opinion are existing camOus and community resources
adequate to meet the needs of individuals with questions or
problems relating '.`4D drugs? Yes No
3. Do you think there is a campus need for drug education programs?
Yes No
4. If "Yes", who should organize and conduct such programs? Indi-
cate by placing a check (1°) next to those who you feel should
organize and conduct drug programs.
Students
Faculty
Administration
Student-Faculty-Administration Committees
Community agencies
University counseling agencies
Other (please specify)
5. Would you trust the University to present objective and unbiased
information about drugs in its programs? Yes No
If "No", why not?

6. The sialements below reflect possible purposes drug education
programs might serve. Please rate each statement:
1. strongly approve
2. approve
3. no feelings one way or another
4. disapprove
5. strongly disapprove
Provide current and objective information about the
physical and psychological consequences of drug use
Provide accurate information on the legal aspects of
drug use
Provide objective information on social aspects of
drug use
Provide information designed primarily to discourage
the use of non-medically prescribed drugs
Programs geared to the liberalization of present drug
laws
How to get "high" or "turn-on" without drugs
Provide informaticfl on resources available to assist
s.itudents with problems or questions relating to the
use of drugs
Other fiurpose (specify)

7. Belcw are several possible formats which might be used in prewnt-
ing drug education programs. Please rate each item below on the
basis of likelihood of your attending.
I. would definitely attend
2. probably would attend
3. undecided (might or might not attend)
4. probably would not attend
5. definitely would not attend
Lectures by well-known "experts"
Lectures by U-M faculty and staff
Lectures followed by small group discussions led by
experts
Small group discussions run entirely by and for students
Audio-visual programsfollowed by small group discussions
Small group discussions with trained group leaders
Coverage in appropriate courses
Programs over WCBN
Articles by the Daily_
Non-credit, short-termseminars or symposia
Another campus-wide drug "teach-in" combining several of
these formats
Other format (specify)
Demographic Data:
I. Age_ 2. Sex
4. School or College
3. Are you: Single._ Married__
5. Yr.ar: Frip5:). Soph. Jr. Sr. Grad.
0. ,4:siderice: University Owned Housing Off-Campus Housing
Fraternity Sorority Co-op
Y. relcw 3nd on the reverse side of this sheet feel free to make any
additional comments and/or suggestions about drogs, drug use, drug
euucotion proqrams, etc., that you feel might be helpful to the
Ort4; 0Amitteo in their planning. Thank you for completing the
r,uostionnairf:.
25.
711t115r1TWIF7111,01.MWAW,WsOar,11......",...............
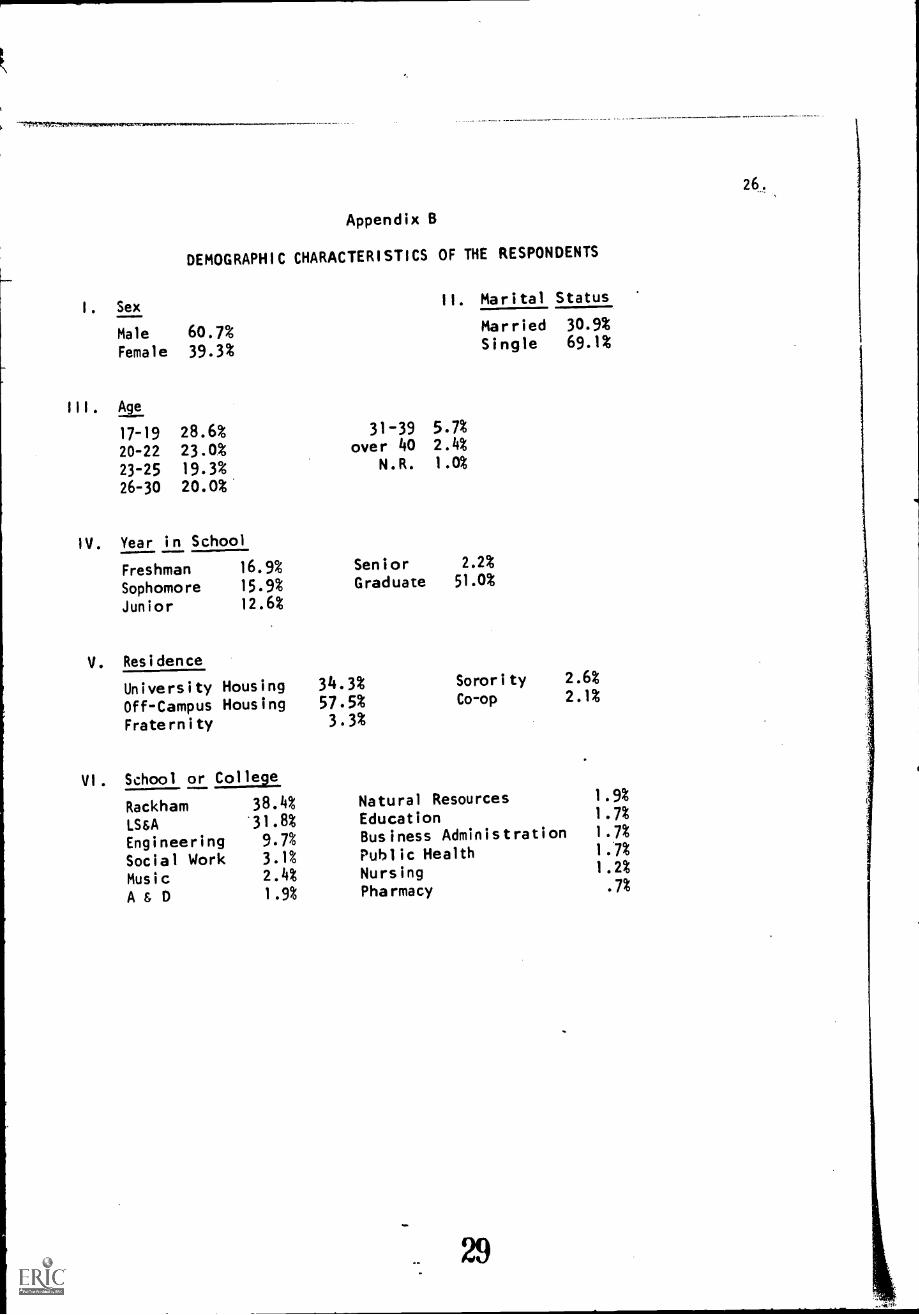
Appendix B
DEMOGRAPHIC CHARACTERISTICS OF THE RESPONDENTS
I. Sex II. Marital Status
Male 60.7%Female 39.3%
III. Age
Married 30.9%
Single 69.1%
17-19 28.6% 31-39 5.7%
20-22 23.0% over 40 2.4%
23-25 19.3% N.R. 1.0%
26-30 20.0%
IV. Year in School
Freshman 16.9% Senior 2.2%
Sophomore 15.9% Graduate 51.0%
Junior 12.6%
V. Residence
University Housing 34,3% Sorority 2.6%
Off-Campus Housing 57.5% Co-op 2.1%
Fraternity 3.3%
VI. School or College
Rackham 38.4% Natural Resources 1.9%
LS&A 31.8% Education 1.7%
Engineering 9.7% Business Administration 1.7%
Social Work 3.1% Public Health 1.7%
Music 2.4% Nursing 1.2%
A & D 1.9% Pharmacy .7%

REFERENCES
Bogg, R. A., et.al.: Drugs and Michigan High School Students, Final
Report of a Study conducted for the Special Committee on Narcotics.
Michigan Department of Public Health.
Eastern Michigan University Psychology Club, Campus Drug Survey, re-
ported in The Eastern Echo, Tuesday, May 27, 1969, p.4.
Gallup Poll of Student Drug Use, reported in New York Times, Monday,
May 26, 1'169.
Hinckley, R. G., et.al.: Non-medical Drug Use and the College Student,
Journal of the American College Health Association, Vol. 17 (1),
October, -1--9-61r-, p. 35-42.
Murphy, B. W., Leventhal, A. M. and Baiter, M. B.: Drug Use on the
Campus: A Survey of University Health Services and Counseling
Centers, Journal of the American College Health Association, Vol.
17, No. 5, June 1g;-§-, 67119-402.
Pollock, M. B.: The Drug Abuse Problem: Some Implications for Health
Education, Journal of the American College Health Association,
Vol. 17 (5), June 196T, p. 403-411.
Rand, M. E., et.al.: A Survey of Drug Use at Ithaca College, Journal
of the American College Health Association, Vol. 17 (1), October
1968, p. 43-51.
Suchman, E. A.: The 'Hang-Loose' Ethic and the Spirit of Drug Use,
Journal of Health and Social Behaviot-, IX (June 1966), pp. 146-
155.
30