document resume - files.eric.ed.gov · document resume ed 075 255 24 se 016 084 title self-paced...
TRANSCRIPT
DOCUMENT RESUME
ED 075 255 24 SE 016 084
TITLE Self-Paced Physics, Documentation Report; ManagementSystem Report 5.4a.
INSTITUTION Naval Academy, Annapolis, Md.; New York Inst. ofTech., Old Westbury.
SPONS AGENCY Office of Education (DREW), Washington, D.C. Bureauof Research.
BUREAU NO BR-8-0446PUB LATE 71CONTRACT NO0600-68-C-0-,49NOTE, 155p.
EDRS PRICE MF-$0.65 HC-$6.58DESCRIPTORS Academic Performance; College Science; *Curriculum
Development; Feedback.; *Operations Research;*Physics; *Programed Instruction; Program Guides;*Program Improvement; Science Education
IDENTIFIERS Self Paced Instruction
ABSTRACTAs a supplement to the principal reports, the
underlying management system of the U. S. Naval Academy Self-PacedPhysics Course is presented in this documentation report. Themanagement system is discussed on three "levels" which are intrinsicin the programmed-instruction format, focused on remedial activities,and related to the handling of student performance data. Detailedinformation is given in connection with the recommended courseimplementation procedures, nature and form of tests, methods ofscoring and recording scores, kinds of feedback provided by students,methods of presenting feedback, record-keeping procedures and forms,and computer-managed operations. Also described are the methods ofutilizing data generated during the course to evaluate and improvethe course material and presentation strategies. Besides a flow chartreflecting the responsibilities of students, clerks, instructors, andmanagers, a total of 25 exhibits and illustrations are provided.(Related documents are SE 016 065 - SE 016 088 and ED 062 123 - ED062 125.) (CC)

S DEPARTMENT OF HEALTH.EDUCATION & WELFAREOFFICE OF EDUCATION
IIII5 DOCUMENT HAS BEEN REPROOUCED ExACIty As RECEIVED FROMIME PERSON OR ORGANI /ATION ORR;INATING I1 KliNIS OE VIEW OR OPINIONS SIAIED DO NOT NECE't,SARIlREPRESENT Of FICIAI OFFICE (TI MUCATION POSITION OH POLICN
UNIENTATIONREPORT
This document is a supplement to theprincipal reports 5.10, 5.9 , and 5.8,developed and produced under the U. S.Office of Education, Bureau of ResearchProject 1/8 -0446, for the U. S. NavalAcadany at Annapolis, Maryland.Contract #N00600 -68C -0749.
visurarounswawsimmanemesolamemori reluman IIIIII MIN MIN am misrowsmame Ear mum ammarlimml
5.4(a) MANAGEMENT SYSTEMREPORTSupersedes Documentation Report 5.41".
CO alumurower NE Nom mourmais sulmrimmeassommimessmism molamilsor worarlimessumrimusil
FILMED FROM BEST AVAILABLE COPY

DOCUMENTATION REPORT 5.4(a)
MANAGEMENT SYSTEM REPORT
NEW YORK INSTITUTE OF TECHNOLOGY
SPRING 1971

MANAGEMENT SYSTEM REPORT
TABLE OF CONTENTS
1. Introduction
2. Course and Data Management Manual 6
2.1 Learning Resourzeo uo be. Managed 7
2.1.1 Problem and Solution Book 10
2.1.2 Remedial Sheets 10
2.1.3 Audiovisuals 14
2.1.4 Texts 16
2.1.5 Instructor 16
2.1.6 Laboratory Sessions 17
2.2 Aaaagement Devices and Controls 19
2.2.1 Study Guides, Progress Checks (including RemedialProgress Check)', and Quarterly Diagnostics 19
2.2.2. Sample Management Reports 26
2.3 Control Points and Orientation 32
2.3.1 Flow Chants and Interfaces--Student, Instructor,Course Hanover, and Clerical Points 33
2.3.2 Instructor/Student Orientation. 36
1. Notes to the Instructor
2. The Management Sequence
3. Course Policy
4. The SelfPaced Laboratory
5. The Student Manual
.2.4 Information, and Data Handling Procedures 55
2.4.1 Data Preparation Prior,to Course Implementation 55.
(Contla

MANAGEMENT SYSTEM REPORT
TABLE OF CONTENTS(Continued)
2.4.1.1 Establish Course Structure 55
1. Student Background and Enrollment
2. Preparation of Course Header File
3. Preparation of Question File
2.4.1.2 Data Verification and Updating 56
2.4.2 Course-in-Progress Procedures 57
2.4.2.1 Student Data 57
1. Data Preparation
2. Progress Check.
3. Quarterly Diagnostic
4. Study Guide
2.4.2.2 Report Descriptions 71
3. Performance Data Analysis for Course Revision and Optimization 92
3.1 Systems Description 93
3.2 'User's Description 123
3.3 Supplement 142
3.4 Copies of Programs 149
ii

MANAGEMENT SYSTEM REPORT
LIST OF EXHIBITS
Student Background Card
Course Header Card
Question Descriptia, Card
Student Performance
Student TO Key Sheet
Class Roster
Course Roster
Student Drop Card
Permanent Header File
Course Structure Summary
Port-a-Punch (5 choice- 4 choice)
Porta-Punch Student Response Card
Student Response OpScan Form
Instructions for Completing Student Diagnostic Answer Sheet
Individual Student Analysis
Terminal Objective Remedial Summary
Remedial Session Lesson Ilan
Remedial Session Roster
Volume Summary
iii

MANAGEMENT SYSTEM REPORT
LIST OF ILLUSTRATIONS
Remedial Sheet
Study Guide
Progress Check
StudEnt Diagnostic Answer Sheet
Progress Check Report Forms
Diagnostic Report Forms
iv

1. INTRODUCTION

MANAGEMENT SYSTEM REPORT
1. INTRODUCTION
Background
This Report is the product of an extensive educational
research and development. effort that was conducted in conjunction with
the U.S. Naval Academy and the N.Y.I.T. Learning, Management & Resources
Center. Documented in this manual are procedures which are based on the
educational philosophy and management techniques developed during an O.E.
sponsored, three-year experiment. We do not purport to have created the
"perfect" management system, but rather a system which contains the founda-
tion for practical implementation and the ability to evolve when dynamic
educational needs become apparent.
The Management System operates on three "levels." The course,
in essence, is made up of sophisticated, multimedia, multi-resources,
'independent study materials presented in a branching programmed-instruc-
tion format, with a maximum of response demand frequency. The student's
progress through a variety of learning experiences, ranging from tests
and conventional lectures to single concept audiovisual materials and
tutorial sessions, is guided by his own responses and is student self-
managed to a high degree.
The first level of management is, therefore, instrinsic in
the programmed-instruction format.
The second level of management derives from instructional
activity focused upon tutorial remediation as indicated necessary by
immediate analysis of student performance on the study guide response
.2
1

sheets and progress (criterion-referenced) checks. This remediation may
be individual, or grouped by student section, and may be based, in part,
upon analysis of individual student performance alone, or as related to
parallel performance of the rest of the sections or to the class as a
whole. The tools for this management are the students' responses and the
item analysis performed by the clerical data management support groups.
The third level is provided by the output of the computer or
Data Management Group which Ltilizes the performance data from the pro-
gress checks and quarterly diagnostic exams to. provide a more in-depth
prescription for independent aiid group remediation.
The input of all student responses into the computer also
provides the basis for Cue revision guidelines for use in optimizing the
course materials.
One of the many factors determined during the experiment was
that, using the system's approach, the data handling capability of the
computer in ,onjunctic,n with the exercise of the instructor's managerial
judgment represented the best of two distinct management methods.
The procedures set forth in this manual reflect the most cur-
rent concepts in course management deriving from the experiences of this
contract.
Purpose
The procedures for Implementation of the management system
are described in two sub - manuals.:
1) The Courser& Data Management Manual, and
2) The Performance Data Analysis for Course Revision& Optimization.
3

The Course & Data Management Manual describes to the course
manager: a) requirements for planning and preparation needed prior to
course implementation; and b) procedures, decisions and record keeping
required while the course is in progress.
The Performance Data Analysis for Course Revision & Optimiza-
tion contains descriptions for utilizing the data generated during the
course in order to evaluate and improve the course material, material
presentation and strategies, and the management system itszif.
Instruments
In order to accomplish the several levels of mauagement, a
large number of recording methodologies, reporting devices, test forms
and instructions to the students, data manager, instructors and course
managers have been created. Examples of these instructions have been
incorporated herein, directly or as exhibits.
Associated Documents
The following documents are a necessary part of understanding
and implementing the full computer managed portion of the system:
Course & Data Management Manual
User's Manual: A350
Operator's Guide: A380
Program Logic Manual: A370
Systems Manual: A360
Performance Data Analysis for Course Revision & Opvidization
Systems Descroption
User's Description
Supplement
Programs

Additionally, many pertinent technical reports have been sub-
mitted during the course of, and as final reports to, the multimedia
physics development program. These reports contain the rationales and
experimental data analyses upon which the management system has been
built. In these technical reports will be found the justification for
all the elements of the management system.

2. COURSE AND DATA MANAGEMENT MANUAL
1
6

2. COURSE AND DATA MANAGEMENT MANUAL
2.1 Learning Resources r Mnnwed
Several purpose the program's development
and operation. The Academy uvIded with a cost-effective physics
course designed with the most modern educational technology. The experi-
ence garnered in the construction of the program is incorporated into a
course development model. to serve as a prototype for construction of
similar programs in other hard science courses. Extensive record keeping
capabilities of the program allow it to serve as a vehicle for educa-
tional research.
The course is individualized, self-paced, and self-healing.
By offering media options and optional routes through the learning mater-
ials, each student's learning experience is individualized. Likewise,
within broad time constraints, the student can progress through these
materials at his own pace.
The self-healing aspect of the program pertains to learning
'materials and processes. These are improved by an iterative process of
successive tryouts and revisions. In this way, the program undergoes an
empirical optimization procedure.
Most standard topics in introductory classical physics are
included in the two-semester course: mechanics, wave phenomena, elec-
tricity, magnetism, and optics. One unusual feature is the omission
of heat and thermodynamics in favor of more intensive developments in
mechanicsand optics to suit the Academy's particular needs. The sub-
ject matter is loosely defined as university physics with calculus at
the level of Halliday and Resnick.
7

Optimization of the program must be attained empirically,
since no satisfactory predictive theory of educational psychology is
known. This situation is well suited to a systems approach when the out-
put of the system can be fed back to modify the system input.
This approach requires that the course objectives are clearly
defined and measurable so that the output of the system is quantitative.
Consequently, over a thousand measurable behavioral objectives (MBOs)
were developed to completely specify the performance which the program
should elicit. MBOs fall into two categories:. terminal objectives (T0s)
which describe the desired final student behavior, and the subordinate
enabling objectives (E0s) which are steps toward the terminal behavior.
The TOs constitute a complete description of course content
and are represented in the course by central core problems. When a stu-
dent can answer .a core problem correctly, he is said to have achieved
that TO. In this way a student knows exactly what is expected u
to content and level of proficiency.
When a student cannot answer a core problem after a single
exposure, he can execumAgibordinate enabling problems s-which correspond
to the EOs. At the end-:an enabling sequence, the student is presented
with another version oflibe-core problem to check his achievement of the
TO. All these problems am-contained in the Problem and Solution Book
volumes.
Videotape presentations are available for forty-nine topics.
Theie tapes average about fifteen minutes apiece. Illustrated texts and
talking books (taped voice-over illustrations in book form) are available
with essentially the same information content as the videotapes.
8
1

(Computer-assisted instruction (CAI) was initially included as a parallel
path for topics in mechanics, primarily to be compared with the other
options for cost effectiveness, and was deleted as a learning option in
the final revision.) Conventional physics texts are also included among
the available lelvalu, -rials.
Each sLud(.E. is provided with a Study Guide which directs
him Carough the problem books and various media assignments. When the
student completes a specified assignment (roughly approximated by a
chapter in Halliday and Resnick), he schedules' a Progress Check (test)
nn the material. This criterion check does not influence his grade but
is used for management and remediation purposes. Grades are determined
by quarterly tests and final examinations for each semester.
Minor remediation is accomplished by distributing a remedial
sheet assomaated with each emblem missed on the progress Check. These
sheets haveza statement of tbe:..-appropriate corelpamblem'together with.-
references ino pertinent auxirinTy material. More..eserious remediation
*is providedahy individual tamrkal sessions withm. professor.
the laboratories have as their objectives the measurement of1
fundamentalqphysical quantities, including the processing and recording
of this dataEwith an error analysis. An innovative aspect of the data
analysis -crsoisr s at a dialogue may be established between the student and
thecomputmEnwhich wuuld culminate in the student's achievement of the
objective. 'ibis computer-dialogue lab format is not an essential ele-
ment.oEtheAmultimedia learning materials, and in the current imple-
mentation tine Navy physics staff is using a conventional laboratory
experience Ian the self - paced. course.
9

2.1.1 Problem and Solution Rook (P & S)
This is bound study material which contains the work of
forty-five (45) segments for a semester. Each Problem and Solution Book
contains:
a) A problem section in which the questions are
presented in a sequential order;
b) A solution section in which the correct method
of answering is presented;
c) Information Panels strategically placed through-
out the problem section.
A description of the topics covered by the segments
is as follows:
Measurement and VectorsVector Multirliccctimmamml VelocityMotion in Oae and Two ElbensionsNewtrn's Laws of MotionLlne...x Motion: 'Friction.
Uniform Ci/cular MotionWork and EnergyConservation of EnergyMotion of the Center of MassLinear MomentumImpulse and Collisions in One DimensionCollisions iu Two Dimensions
, GravitationGravitational PotentiaL.EnergyElectric Charge= and Conlomb's LawThe Electric Fieldtaectric Field :Problemsuric Dipoles and Electric Flux
Gloss's LawE!lnetric PotentialElectric Potential Energy
acitancef gy Stored in Capacitors
1.1t and Resistance
F ectrical Energy & ElectromotiveForce
Circuits & Kirchhoff's RulesAmmeters & VoltmetersCharge in a Magnetic FieldCurrent in a Magnetic FieldMagnetic /lux & the Earth's
Magnetic FieldAmpere's LawThe Riot-Savant LawFaraday's Law of InductionSelf InductanceThe RC CircuitThe LR Circuit
liimenty additional segments wt.reprepaed by the Naval Academy staff.
2.1.2 Remedial Sheets
The student receives a remedial sheet for each question
he misses on the Progress Check (PC). The remedial sheet contains:
10

a) A restatement of the appropriate core
problem;
b) Reading assignments, and
c) Related problems when appropriate.
The remedial sheet serves as a muLti-purpose remediation
elercopending upon the student's achievement level in specifically
ide ntenti. problems on tbr. Progress Check. For example:
1)
illIttodent Achievement
munT.Trogress Check is: Student Use of Remedial
100% correct Retains for revie%r-purposes
2) _2W-70% correct
-147Z. or Bess correct
Reviews remedial and schedulesProgress deck retake only onappropriae core problems
ReviewsmomediaL,..adkedulestutorission= rogress Check
-retake..
It is necessary, thereEnne; that-,a.,suftteient number of
cOrawaineTitanmA._ia advance for each Progress Check_itno to be used.
SemonalleFoROWNof:remedials
11

SAMPLE REMEDIAL SHEET
SEGMENT 1
MEASUREMENT AND VECTORS
Problem 6: Addition of Vectors
6.A plane travels .40 miles due north, then changes its course to a
direction of 37°east of north and travels for 50 miles. Finally it
travels for 30 miles due east. Its total displacement is:
A. 100 milesB. 120 miles
C. 100 miles at 37° east of north
D. 120 miles at 37°. east of north
Halliday and Resnick:.
Semat and Blumenthal:
Reading AssignmFmr.
Ch. 2,a,-,,ort. 1-3
Vol. 11-Mh. 2, Fr 11-18, 36-40
Related Problem=
Schaum:Ch. 1, :itos. 1, 2, 14
12
SAMPLE REMEDIAL SHEET
SEGMENT 1
MEASUREMENT AND VECTORS
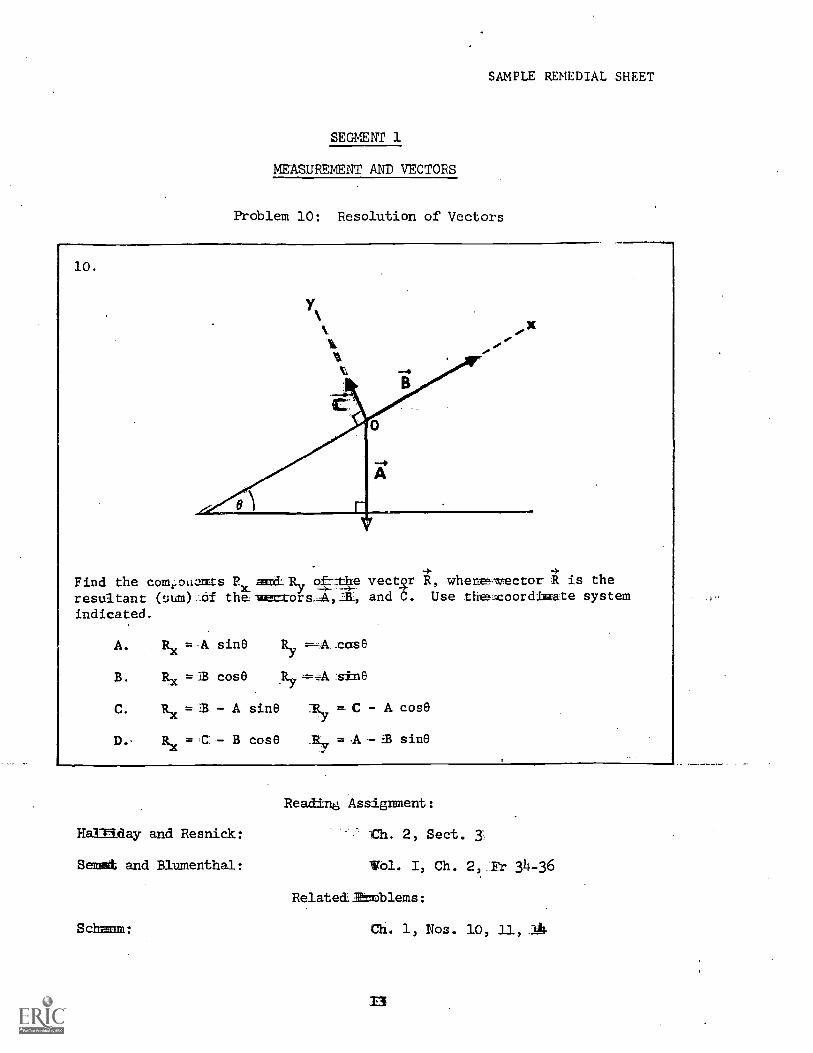
Problem 10: Resolution of Vectors
10.
Find the comi.ow,:mts R and: Ry ofr:the vector R, when.wzector R is theresultant (sum) _of the-vametors..,A,31, and C. Use tlit):coordilaate systemindicated.
A. Rx = A sine Ry =A case
B. Rx = -33 cos° Ry ------.-A sine
C. Rx = B - A sine Ry = C - A cose
D. Rx = C - B cose Ry = A - 33 sine
Hai day and Resnick:
Sept and Blumenthal:
Schommi:
Readily, Assignment:
Ch. 2, Sect. 3
Vol. I, Ch. 2, Fr 34-36
Related.oblems:
Ch. 1, Nos. 10, 11 Al-
13

2.1.3 Audiovisuals
The Audiovisuals, representing the various media support
materials prepared for this course, consist of one complete set of video-
tapes, talking books and illustrated boat), All Lhi, ut the media have
basically the same information content and cover the topics shown on the
list below.
The criteriazused to .determine when an Audiovisual would
be prepared for a partirmlar topic was as follows:
a) If the topic concerned the concept of motion, or
b) If the subject matter was rated difficult and the
text was not sufficiently elaborate, or
c) If material for enrichment did nut appear in the
text at All.
All of Audiovisuals were prepared in order to pro-
vide multimedia paths for the student to -optimize and individualize his
learning process.
The videotapes contain prerecorded illustrated lectures
to beZisplayed on individual monitors. The average playing time is
about fifteen minutes.
The talking book consists of a tape recorded lecture
(on either open reel or cassette) and an accompanying booklet containing
the illustrations for that lecture.
The illustrated book contains the same lecture material
as the talking-book but is presented without the audio medium.
A v4battiteeme, talking book and illustrated book were
pared fox each of the follow±ng_ topics:

Sequence No. Title
1 Projectile Motion2 Newton's First Law3 Newton's Second Law4 Newton's: Third .Law
5 Atwood's Machine6 Circular Motion7 Work When Force Varies in Magnitude
and Direction8 Kinetic Energy9 Potential Energy10 Conservation of Energy11 Movement of Center of Mass12 Conservation of,Momentum13 Impulse and Momentum14 Collisions15 Gravitation16 Angular Quantities Treated as Vectors17 Moment of Inertia18 Rolling Without Slipping19 Angular Momentum20 The Gyroscope21 Simple Harmonic Motion22 Energy in SHPT23 Pendulums24 The Reference Circle25 TraVeling Waves26 Wave Velocity27 Combination of Waves28 Standing Waves29 :Beats and the Doppler Effect30 Reflection and Refraction31 Huygens' Principle32! 'Total. Internal Reflection33' Images by Reflection34 Images by Thin Lenses,35 Calculation of E for an Infinite
Uniformly Charged Wire36 Deflection of Ehectrnns in an
Electric -Field'
37 Flux38 Calculation of 3 Using Gauss's Law39 Capacitors40 The: Capacitor in Actin41 Kirchhoff's Rules42 Definition of a: "B" .35ield
43 Force. Between Ranailel, Current-Carrying.Zonductors
44 Ampere's Law Applied to a LongStraigitim:-.Conductor
45 'The Law of BloSavart.46 Faraday's Law of f-Induction
15

Sequence No. Title
47 Motioa of an Electron in Combined Eand B Fields
48 LR Transients49. RC Transients
2.1.4 Texts
The principal text which is issued to each sent is
Halliday & Resnick; Physics for Students of Engineering alma Science.
Supplementary reading assignments are to be found in other texts, -which
are made available during the classroom period.. These texts=Pm-
Sears and Zemansky, University Physic:
Albert Baez, The New College Physics--A SpiralApproach
Shortley and Williams, Elements of Physics
2.1.5 Instructor
One of the major differences between this monrse and a
conventionally taught course is Oct role of the instructor. 7.7he_instruc-
tor is available during class sessions but does not give.a_lecture. His ve
primary function is to assist students with their problemsIan:La one-to-
one basis or to schedule additional assistam.e in a tutariaLsommextra-
instruction session. Th*s "individualized' instruction appOdeflL:to iden-
tified weaknesses or needs 'constitutes one of the basic foundatIons upon
which the course has been structured.
An average instructor/student ratio of 1=20.-Tga&-
scheduled but varied somewhat in practice because of student dropouts.
Further description of the instructor's role is-to be
found in this report under Section 2.3.2.1, entitled "Notes to the:Instruc-
tor of Self-Paced Physics."

Certain "demonstration" type lectures were prepared
because of the appropriateness of the subject matter. For the first
semester these demonstrations covered the following topics:
Linear Momentum
Angular Momentum
Wave Motion
Sound
Geometrical Optics
The second semester covered these topics:
Electrostatics
Electromagnetism
Physical Optics
Polarization
2.1.6 Laboratory Sessions
Two alternative self-paced laboratory approaches were
developed in conjunction with the physics course.
The conventional approach involved twenty (20) experi-
mental set-ups in the laboratory at any one time. Duration of the experi-
ments was planned to range between 1-3 hours; however, the experiment
need not be completed in one session. Ideally, no more than two students
at a time are recommended to participate in an experiment. A complete
descrlption of the laboratory procedure and policy is in Section.2.3.2.4
of thim,report, including an identification of the twelve (12) exptri,7,
ments scheduled for the first semester. This conventional lab procedure
was demeloped by the Naval Academy physics staff.
17

The laboratory program, in conjunction with the multi-
media physics course developed by New York Institute of Technology, con-
sists of fifteen (15) independent study, computer-supported experiments,
covering the following topics:
1. Probability and Experimental Errors in Science
2. Permutation and Combination
3. The Direct Measurement of Length
4. Electric Fields
5. Current Balance
6. RC Transients
7. Projectile Motion
8. Graphical Analysis of Data and the Method ofLeast Squares
9. Collisions
10. Conversion of Linear Momentum
11. Potential
12. The Magnetic Circuit: and Hysteresis
13. Measurement of Frequency. Response
14. The Inclined Plane
15. Error Analysis
Plus Overview and Summary Report, Instructor's Guide-lines and Answer Lists.
This program is described in detail in the ue.6rate sub-
missionentitled "The Multimedia Labs."
18

2.2 Management Devices and Controls
The management tools that were designed to operate with the
course material while the course is in progress consist of the Study
Guide, the Progress Check and the Quarterly Diagnostic. This section
more fully describes these items and includes sample reports.
2.2.1 Study Guides, Progress Checks (including remedial
progress checks) and Quarterly Diagnostics
Study Guide
This guide is used in conjundtion with the Problem and
Solution Book. Its purpose is to:
a) guide the student through the course segments;
b) provide the student with a mechanism for testing
his understanding of the subject matter with immediate
feedback;
c) indicate reading and audiovisual assignmenL6, and,
d) provide paths for reinforcement and/or remediatiou.
An intrinsic element, of the self-paced concept, embodied
in the Study Guide, is they mechanism for the student to proceed through
the course as fast as, he is able to grasp a thorough understanding of the
subject matter.
It is recommended that if a student schedules a tutorial,
he bring with him his Completed Study Guides as an additional aid for the
instructor to determine the student's problem areas.
An example of a Study Guide page is included in this
section but a. full description of its use is to be found in the Student
Manual, Section 2.3.2 of this report, Instructor/Student Orientation.
19
I

Progress Checks (including Remedial Progress Checks)
The Progress Check is a management device designed to
aid the student as well as the instructor and course manager.
It indicates to the student to what degree he has
achieved a mastery of the Terminal Objectives; it represents the first
formal feedback to the instructor in order to evaluate individual stu-
dent success with the course at an early 'stage so that he can take cor-
rective action; and it forms the basis for the course manager to judge
overall student progress in the course and ascertain problem areas.
When a scuelent completes a certain nuiber of segments
he schedules a Progress Check with his instructor on the material covered.
(A full description of the Progress Check procedure is covered in Sec-
tion 2.4.2.1.2 of this report.)
For the initial half of the fall semester of 1970,
Prugr,,ss Checks were administered on groupings of segments as follows:
a) Segments 1, 2, 3, 4, 5
b) Segments 6, 7, 8, 9, 10'
c) Segments 11, 12, 13, 14
The Progress Check is an "individualized" test in that
it consists of ten questions randomly selected from a large bank of test
items but is not used for the student's grade. (Refer to Preparation of
Progress Checks below.)
The satisfactory completion of the Progress Check per-
mits the student to.continue with the.next series of segments.
A student answering correctly 70% or less is given a
remedial Progress Check on the particular core questions missed on his
20

first Progress Check; i.e., the remedial Progress Check contains vari-
ations of each item incorrectly answered. The remedial Progress Check
is usually scheduled by the student after he has completed appropriate
remediation.
If the student answers correctly on 40% or less on the
Progress Checks, he schedules a tutorial session with his instructor
prior to taking the remedial Progress Check.
Progress Check results are summarized by the Data Man-
agement Group and submitted to the course manager for review.
The first page of a sample Progress Check is submitted
in this section.
Preparation of Progress Checks
The preparation of Progress Checks, while done manually,
is designed to be compatible with a CMI system. That is, the questions
were coded with unique numerical irlmtification and were, for the most
part, multiple-choice to facilitate comput4.1 verification of the manual
grading.
The content of each question was determined by refer-
ence to the core questions in the Problem and Solution Book and to the
Terminal Objectives which the core questions support.
Questions used were of the multiple-choicr, true-false,
or completion type.
Five variat. _h question were produced ;:-.usuailly
by rearranging numerical parameters within the text of the qubstidr rather
than restating the question in completely different language. Although
the Progress Checks were not used for midshipmen's grades, and one
21

Progress Check could have been given to all midshipmen, additional copies
were required for midshipmen who scored low enough to require retakes.
The original questions were stored on cards, one card
per question. The first Progress Check on each group of segments was
limited to ten questions. Tests were prepared by putting several cards
in a holder, masking off certain administrative information, and producing
a ditto master on a commercial copier. The ditto master then was used to
produce the number of copies required. Clerical personne] selected, from
the appropriate group of questions and versions, the specific cards that
made up a test. A pattern was set up to ensure use of all versions of
all questions. Questions required for retakes depended on which ques-
tions the midshipman missed on this Progress Check. Requests for those
questions were passed to the clerical personnel in the form of graded
Progress Checks or listings of specific question numbers.
Course policy required 48 hours notice of intent to take
Progress Checks, but this lead time appeals generous for the production
system employed.
Time alloted for midshipmen to complete a Progress Check
varied with instructor, but was usually .50 minutes. Many midshipmen
frequently took longer. Upon completion of the Progress Check, the
instructor, having been provided an answer key, graded the Progress
Check and either returned it to the midshipman for review or passed. it to
clerical personnel for statistical analysis and preparation or. retalt,Pro-
gress Checks.
c.larte..ly Diagnostics
At four scheduled class periods during the semester, a
Quarterly Diagnostic is administered. Each student section receives an
22

individua-- .co t. These Diagnostics are used both for grading pur-
poses anr st further the instructor in diagnosing any weak areas
of each st achievement. The items thoroughly cover the Terminal
Objectives during the period. Generally, these test items are
created to 1,-, student's performance on general and specific con-
cepts of phofsir z-omplex mathematical procedures are not emphasized.
The diagnostic problem types are categorized as follows:
Lagnostic Problem Types
Recognition of material that should havebeen memorized.
lj Conceptual understanding; single conceptsisolated from problem applications.
:J".R Conceptual relationships; recognition and/orselection for use in problems but no actualsolution required.
At present, all Diagnostic items are multiple-choice
questionso pr(4 ms--to facilitate grading. At the next class ;Period,
each studem i,ves a personalized "Student T.O. Key Sheet" which inaL-
cates his i-: for the test. Also, the test items missed are circled,
and he is deirtLted to the particular locations within each segment he
should review.
(A full description of the Diagnostic procedure is
included in Section 2.4.2.1.3 of this report.)
The results of the Diagnostic form the basis for a
complete,evaluation of the student and the course effectiveness. Sample
summary reports are included in the following section; a complete set
of report fr44 to be found in Section 2.4.2.1.3.
23
I

rr*!.'SFEr
Re.uding: HR 4-4,44-6; 6-3;SZ6-AR 9-5; 9-6
nation Panel, 'Tne 7:ocabu-
of Circular Mr...r-----,an"irP
11-5
T F
(ans)
Information Panel, 'Tha Character-Ntics of Uniform (79-rcular Motion"
B
=1C
11111NIMMIP
411.11
D
2-1_11' your first choice was correct,
aevance to 7.1; if not, ton-ta.nue sequence.
7
B C111
1111111.
T F
L]E7.Ziftikkovisual, CIRCULARIMMION.
SXEP
SAMPLE STUDY GUIDE
SEGrENT 6
10
11
12
13
14
15
26
(an)
24
1.I
nfrmati Panel, "tentr4ot(,tal
nn(ans)
9 'LE nomei=t, advance to P 11; ifmut rorra,--frarre sequence.
A
B
1
D
(ans)
T F
/ws
(ans)
T F
El1111
(ans)
C D111M11 T F
El CIT F
Homework: HR Problem 4-2Q
(ans)

Name ID
Section Date Rem: itifaide
P=otg.r..-, 17.! ck Score out of A
SAMPLE PROGRESS (". 7 E CK (f Srf: )
Pror.e.ws Check (1) See, 2-- 5
Digzex Chard:ea
1-1.1 The (..1.,==: oiz of the.....sirure shown win measured with different.ilafitntin. The ar_m:a should be c.:=ressed in howrcaany
A. a 2-0
B.t
C, i_t__.4...
i
I
-4.00 in
1-13.2A car rrxratnirtg at a constant =ate R covers a distanceD during a timeinteral T. Its rate can be- expreszeci in
A. xtni-swec
B. sec lam ft
C. mai per hr
D. Inrift
25

2.2.2 Sample Management Reparr-
This section contains s..411.144e .r=agement reports which
reflect actual data. A complete set of manapemeirt report forms are
included in Section 2.4.2.
The reports shown here lame:
a) Progress Check Summary
b) Diagnostics
(1) All SectionsSmarr itiszribution
(2) TO Summary CompvT:.,- , -- percents
(3) TO Summary Compa: =-3t1.--3tudents
(4) Bar Chart Percent Attstributions
26

PROGRESS CHECK -- :5111.5.1AR7:' KEIttORT
'NAM PIP'S - :PS211,
S=MENT
SA. NIPI,1.2 R1:7PC:.R T
DATE
II.TaTtIE.. QF sTuDEr,Ts: T
CORRECT artr2 LIC.:ORRECT IT:'espantse
0101 030L (0501- I I ,1: , / x
,-. Ern: .Yrog re 5 s
10)801 1101,/ :. / x
(Check, .:
7sEcmyr-co i-a- 12I- Al:'- ,:) 4 / -3 IMEI l' 57 ,..-
- 6 / 0 /o-. M. 17
I /0WINIMMIMIIIIIMill
, . .
MEI- 0-- 4
;(- 2 _
v
,i
/1_-__
IMINIMMISPA',-2,1 -
_
_
l' 2-
---<;: ,fg Id Y. J- # -3 2 -/
i -1°.2 /2 /7 _
z
Wintiliallz-
:.
,,
-3_
/L,3 -5 .30 .244
g .1..._
1.L- a_ ...
_
4 .t 1.1.111nrill 4- I 2-4'.
, IIMIIIMIIIIMMISIM11
I Mill I
/6
fWiffilliMalINIFTWOMPEnly
i- /
.°
.1:--..
IMMMIIIMMIXIIrentraMIONEWPWArgegi
.
_
P
MI_ -. - b ' -- - - -- _ -_ - - -
- .
y.2.,1 TOTAL 13 -.II 61 .-17 41 -33 ! ---Eg.:17_ jr, t 1 da 1
yd:,:. i.
k PA27

sP24 it*If-14600
PI1
y44
0011
A
A44 MTIONg
sccu. InsTnnUTION
(sEcom gummy IgABNOW 1421)
WVENUA 411 1g79
(100iiides 1111 MAIW-Up T0040
90
80 70
Th4-a
1,0034A
0101.
1- 62
4 P
1A4
7
6 =
35%
514
334
6 mi 35Z
5 - 33Z
60
IA2 I
111
50
6%
13X
SAITIoN
11TALS
iot4
sa,!.ND
TOTAL
Q501
Kappa
1101
Eta
1201
All
So:Itions
,0801
1-
6%
2%
s
=11
1,11
....
=7%
1,0
36,t
11 P
-37s
101
ida
4;:07X
211%
5-31
3-20
252
4.
22%
744%
5-3U
23%
.1- 6Z
4%
30 20 io >
10
TOTAL STIMENTS
18
15
20
18
16
15
102
Ti 0

1
SP211USNA Self-Paced Physics R E PORT
INIAGINasric T.O. ST:IMARY CO:MARLS:ON
Secind Quarterly Magnost"1 Test
:November 6 and 7, 1TZD
PPERCENT
CENT WRONG BY INDIVIDUAL SECTION WRONG BY
* CORE #)
li
QUESTION # 0.101I
L
I
0301 I
1
0501 7
I
nal p 1101 12OI ALL SECTION,
34 34 22
1
13 1
I
5<
1
L______6 r
I
L3 10
_
35 33I
1
I
7 I
I
1
I
11 1 81 13 24
36 3 Il 1
1
40 1
I
20 i
I
22 1 19 1 33 24
_
37 37 11I
II
1
I
I
I
I
,
13 5
38 38 -Ii
13Ti
R
1
loI
t 81 13 27
40 11 ' 33 1 5 1
I
39 1 13
,
1
20
I'
20
41 41 39i
1
,
47I
- L1
3g n 69 I -- 31
42 42 38 I
if
13 1 E5II
i'a it 63 - I 30
41 43 54 4Q 1
1
a 1
II
13 13 20
119
I
33 I
E
25 H
1
EU 1 19 1 20 24
47 22I
1
20 1
!!
45 j4
1 131
47 26
48 laI
1
27 1
1
31S 1.,
1
35 1 13,
I
53 26
SAS-CI 6 I
I
- I
1
1
;I .
I - 1
S45-C8 51.
AA i I
lo
5M ,
I
1,1LJ,,_ :_1I
22 25
1
I145Ct.4 .52
I
39
SA5HE25, 53 1 la1
1 33I
1111 t 28 1 25I
q -.47 29
le-Diegnmstic7Mest Items for Segments 45 are idiermtffied with the Core Question.
(of Segment 45.
29

1
1
1
$F211USNA Self-Paced rhysics SAMPLE REPORT
DIAGNOSTIC T-0 SUMMARY COnhARISUN
Second Quarterly Diagnostic Test
November 6 amd 7, 1970
NUMBER OFSTUDENTS
Ani:AliON!
No. SIL DENTS 6ROVIC BY INDIVIDUAL SECTION
T.O. 11 (or
* CORE #
TESTWESTI0M #
il
1 Theta 1 Larbda, 1.5.1 I Iota ; Kappa 1 Eta0101 0301 ' 0501 OR01 1101 1201
34 34I I I
i_ 1 i .1 I / :
35 I 35 . I -- I1 1
.. /3 2-5z
36 36
__, I _i__i 1
t 4- I4t. i 3 4 X37 37
___I __51-
.2
!
1 I /I i2-___ Ii______T____
38 38I ;I I
I 027 1 kV 1 i f / 3 fl 2 : alff40 40
a
I 1 1
I '6-- :y 1 : 1 1 341 41
.7 , 3/5i7 i 7 u ----9 i //_L__:___1
42 42
d...7
1 g 1c _,2, _It_ 21-"' 1 1 t //) 1 31
43 43
II
-
9 i 1 1 11. 1 2 2 li f
46 46
r92
1 I I 174_ '61,5-111 3 L 3 f,2 6---47 a 2_ 3 1. a .9 .2 1 ' . ,2 7 ,
48
__71
-f-
1
,1
,1 2- 1 11 I 2 7
II II I I I
/ .n $ ,,1
/S45-C1
S45-C8
1
+V i i
I
I I 1 1
__.. / 1
I
3I
1
$
I I 9 I 4Z0S45-C14
S45-C25
I
.1 1 .-- I ii 1.. ....C i!1 9 1 7 c i 30
TOTAL' STUDENTS Mr105CUP1 4 5 ao 16 15 10.2* Diagnostic Teat Items for-Segments 45 are ideal:abed with the Core Question
of Segment 45.
313

.E-g
4D%
1
.1 30%-r41-1O.1-1
20?.0
041 aoz
501
60% -
;
z,
30:',/, -
:4' 20% -o
EI 1 0 % -
>10
ALL SECTIONS
BAR CHART PERCENTILE DISTRIBUTIONS S
(102 Students)
10 20 30 40 50 607 70 80SCORE PERCENTILE
SECTION 0301
TEST LAMBDA
4.
0>10: 10 20 30 40 50 60 70 80
SCORE PERCENTILE. . .
31
90 100
90 100
z0
2.3 Control Points and Orientation
Incorporated in this section is a pictorial description (flow
chart) which reflects a general overview of the operational functions of
the course. Various control points and lines of communication/responsi-
bility have been identified in the flow chart for the benefit of the
instructor and course manager.
pescriptiOns which amplify these items are in the Instructor/
Student Orientation section and other references found throughout this
report.
32

4444
44.4
04,4
,1,1
.,-,4
4444
.1
2.3
Con
trol
Poi
nts
and
Ori
enta
tion
2.3.
1Fl
ow C
hart
(an
d In
terf
aces
)
SEL
F- P
AC
ED
PH
YSI
CS
CO
UR
SE
Stud
ent !Pro
blem
s &
Solu
tions
incl
udes
-1.
Spe
cial
Pen
2. S
tudy
Gui
de S
heet
sw
ith a
ssig
nmen
ts
Proc
eeds
with
Ass
ignm
ent
As
sign
men
tR
efer
ence
s A
/V
No
VR
equi
res
Inst
ruct
or' s
Ass
ista
nce
No
Dat
a M
anag
emen
tC
lerk
Issu
es c
ompl
ete
set o
fm
ater
ials
per
stu
dent
(Pag
e I
of th
ree
page
s)
Inst
ruct
or
Sele
cts
Aud
io/-
7Y
esV
isua
l Med
ia; s
tude
ntre
view
s ap
prop
riat
eT
.0. '
s
Yes
Con
duct
s or
ient
atio
n &
arra
nges
issu
ance
of
mat
eria
l
Rev
iew
s su
bjec
t mat
ter
with
stu
dent
Cou
rse
Man
ager

Stud
ent
Com
plet
esA
ssig
nmen
t
SEL
F-PA
CE
D P
HY
SIC
S C
OU
RSE
( C
ontid
)
Dat
a M
anag
emen
tC
lerk
(Pag
e 2
of th
ree
page
s)
Inst
ruct
or
Rep
eats
Stu
dySe
quen
ce
Rev
iew
sM
ater
ial
Issu
es m
ater
ial f
orne
xt S
egm
ents
Prep
ares
P.C
.R
epor
t
Yes
Sche
dule
s an
dA
dmin
iste
rsPr
ogre
ss C
heck
Res
ults
Satis
fact
ory?
No T
Issu
es r
emed
ial
I
mat
eria
l ass
ignm
ents
and/
or c
ondu
cts
1
tuto
rial
Req
uire
s A
/VM
ater
ial ?
No
Yes
Com
plet
esR
emed
ial
1411
Mat
eria
l
Sele
cts
A/V
Med
ia
.`.:t
'it
Sche
dule
san
dA
dmin
iste
rsR
etak
e
Nfr
I
P.C
.
0
Cou
rse
Man
ager
Rev
iew
s R
epor
t for
Gro
up R
emed
ial
Stra
tegy

Stud
ent
SEL
F- P
AC
ED
PH
YSI
CS
CO
UR
SE(C
ont'd
)
Dat
a M
anag
emen
tC
lerk
Issu
es m
ater
ial
for
next
Segm
ents
(Pag
e 3
of th
ree
page
s)
Inst
ruct
orC
ours
eM
anag
er
Con
duct
sT
utor
ial
Yes
Res
ults
atis
fact
ory
?
Dis
posi
tion
Rev
iew

2.3.2 Instructor/Student Orientation
This section contains information which should be re-
viewed by the instructor to familiarize himself with the course. The
descriptions are divided into five parts consisting of:
a) Notes to the Instructor
b) The Management Sequence
(The following three items consist ofdocumentation which is distributed tothe students during the orientationsession.)
c) Course Policy
d) The Self-Paced Laboratory
e) The Student Manual
2.3.2.1 Notes to the Instructor of Self-Paced Physics
1. Introduction
The methods and operation of the self-paced physics
course may seem strange to new instructors as well as to the students.
This information is presented to assist the instructor in developing tlis
individual class policies. It is presumed you are familiar with the
Student Manual and Course. Policy Statement.
'2. Objective
The objective of the course is to enable each midchip-
man,to complete the tasks defined by the Terminal Objectives (TOs). If
you ,have.not done so previously, you should read the TOs, as they consti-
_tute the most accurate definition of course content. Because of the way
the Problem and Solution books have been constructed, successful comple-
tion of all the core questions should cover all the TOs. Since the core
questions were also designed to provide a path for fast students, they
36

are frequently complex problems that combine elements of several TOs.
Due to the limited time available for testing, the body of TOs is sam-
pled randomly during Progress Checks and Diagnostic Tests.
3. Class Atmosphere
There are few constraints on how you use class time
to move the students through the material. If your class size permits,
you are encouraged to usr Room 203 as your regular classroom. Initially,
a certain amount of encouragement may be needed to steer the midshipmen
to the various media. You should try as many of the media yourself as
time permits so you can recommend a particular Audiovisual if a mid-
shipman is having trouble in a specific area. You may wish to add
additional demonstrations or conduct small topical lectures occasion-
ally. Comprehensive reviews prior to Diagnostic Tests are frequently
given.
4. Student Progress
One of the by-products of the course organization is
the early identification of potential failures, before they reach the
Diagnostic Tests. This early identification can be done most effectively
by careful screening of Study Guide responses and Progress Check responses.
The individual prescription for assistance is in your hands, but the early
identification of these individuils and the variety of materials available
should provide you with considerable flexibility.
5. Areas. of Concern
Minimum Lecture. You, as well as some of
your midshipmen, may feel uncomfortable, initially, because you are not
conducting lectures during most of the class time. Experience has shown
that most students adapt readily to the self-paced class routine within
37

four-l-o six weeks. You may choose to lecture frequently; however, you
will probably have little time left to grade Progress Checks or counsel
slow students, except in EI (Extra-Instruction) Sessions. Another by-
product of the course organization is to move a substantial amount of
student counseling and remedial work into the classroom.
b. Student Progress. Because of the great amount
of material covered by the course, you will soon find students dropping
well behind the average (or, from your view, a desirable) class progress.
Your success in keeping the class moving will be limited only by your
imaginaion. One reason for the apparently slow class progress may be
confusim_tietween a very weak physics student and a good student who
chooses to "pace" himself to the speed of slower classmates. Careful
screening, of Study Guide and Progress Check responses can usually separate
the two.
2.3.'2.2 The Management Sequence
1.. Each student is issued one prime textbook;
at least two other supplementary texts are at all times available in the
physics room or in the library.
2.. Each student is issued a Student Manual
intended to supply the student with all the procedural information required.
3. CcQrse work begins with. the issuance of Seg-
ment 1 of Problem and Solution Book,.and the Study Guide for the same seg-
ment. The Study Guide is a latent image type on which sequencing infor-
nation is revealed by means of a Special pen.
38

4. The Study Guide features are:
(a) A reading assignment indicating prime
reading andf:,.m7rlementary reading, both clearly identified.
(b) Core problems identified by score lines
over and under the problem number.
(c) Remedial loop problems ("enabling pro-
blems"). The instructions for short-circuiting the loops, or following
them, are contained in the Study Guide f each individual set.
(d) Titles surd directions for Information
Panels contaimmffi_an the -PrrmR1Pm and Solution book.
(e) Titles and directions for Audiovisuals.
These are aveHlaffile in three formats:
(1) Videotapes;
c2) Talking books;
(3\ illustrated texts
(f) Homework assignment, generally in the
form of adifttianal prohlems ±n the prime text.
5. The Problem and Solution book features are:
(a) Problems and diagrams in numerical
sequence.
(b) Core problems identified by enclosing
each one in a box.
(c) Information Panels preceding cure.groups.
(d) Scrambled problem solutions: directions
for reaching solution is revealed only in the Study Guide when correct
answer is chosen.
39

(e) Each solurlon for core and core-prime
questions is followed by a true-false quesarbon whose answer is derivable
from the solution to which it pertains. These TF's are answered in
special boxed sections of the Study Guide.t_ NOTE: Each core problem
which is answered incorrectly requires torte student follow the
remedial or enabling loop which always ammedmnes with another problem
having the same conceptual basis as the mot, mociblem initially missed.
Such problems are called "core-primes."
(f) The sciembli0Cp Toocess used for the
solutions is extremely difficult to compommism- Vie: time required to
11
short-circuit the response pattern is e 0,- ed taylbe too great to make
it worthwhile.
1 6. The Progress Check. This is a form of test
which follows a unit of work. The Progress Check is graded by the
lrtJacber. The performance of the student is evalumt-Pd and he is then
guided into aie of the channels indicated bmiow. To be eligible for
the Progress Check, the student must submit -to his instructor all of
the relevant revealed Study Guides for that unit.
(a) Using a preffieceomilomf cut -off grade,
the student is given the "go" signal if his performance is above this
level. He is also given a set of enrichment suggestions in the form
of reading, programmed material, iilms, etc.
(b) If- his performance falls below the
cut-off, he is given a "stop" signal with remedials, after which he
11 retakes a Progress Check. Questions on these checks will be random-
"'
ized so that no two students ever take exactly the same examination,
nor does the same student take the same check on the second round.
40

(c) If his performance falls below cut-off
on the retake,. he will be given individual tutorial assistance and re-
quired to take a third test. Disposition of =fie student after the third
failure will be left to the chairman of the physics committee at the
Academy.
7. Quarterly Diagnostbdc Tests. These teL will
he carefully generated to test for recognition and recall, understa_ding
of concept, ability to recognize concepts rach appear in problems, and
ability to solveynaolems. These tests will !.11 be e& the multiple-
choice variety, with a response mechanism sultable ffor computer grading.
Bee of the Quarterly Diagnmstims will replare the mid -:term examination
and the last of them will be administered about one week before the
standard final examination.
8. At the end of each quarter the instructor
will submit a diagnosis and recommendations based upon Study Guide
sponses, performance on Progress Checks, and Quarterly Diagnostics. Pos-
'sible recommendations include continuation of: sequence, mmetition of
specific segments, further use of other program texts, adattional tutorials,
and dropping out.
41
0

2.3.2.3 Sample Course Policy
SP2777'SELFPACED PHYSICS
Course Policy
- BaCkground, Thfs touLhe is part of an experimental education pro-garimm:which.ihq been conducteA by the U.S. NavalL,Academy and New Yorkliostitutz of Technology since summer 1967. The course is character-ized b57 ralFhTer unconventional teaching methods_nd, as you will see,.
emphasizes,:
Each sr.,dent's proceeding through tilt course at
his owe ace.
Use of instruction -via texts, programmed problemand. solmtion books, videotapes, audiotape record-ings, an instructor consultation.
2. Instructional Methods. A variety of instructional methods will beavailable to you during this course. The large number is provided soMbat you can find 'the combinatluut of materials that is most efficient
liar you. To be sale of optimizimg-your use of classroom time, you arcumged to try each type rd. material at least twice. The materials avail-
able ame.
mitII
Problem and Solution Bocik. This book, together with the
y Guide, is theTrincipal material. Mesciiption and Organ-
ization are contained lip. the Student Mann4I-..
14 Audiovisuals These take several forms; you
.mould try al2.
(1) Videotapes. Prerecorded lectures on specifictopics are'shown on the large monitor in Rm 203.The schedule for this monitor is posted on thewall. If you wish to look at a different video-tape, you may check mme out and play it on thevideotape machines 1.7u..Rm 203.
(2) Talking :Book (TBLa tape recorded lecturecassette) .ancL.a booklettions. liar the lecture..
checke&out in Rm 203.out overnight.
This method consists of(on either open reel-orcontaining the illustra-The TB materials areCassettes may be checked-
42

(3) Illustrated fflook. This is a short illustratedbooklet containimg the same lecture as the Talkingook, but without the audio pantion. Note tMt the
subject matter of the Videotalres, TB, and IllustratedBook is virtuallw the same.
C. Alternate Texts. While the pratncipa] text for this course isHalliday & Resnick, Physics for Students of Engineering and Sci-enceL collateral text for references are provided on the StudyGuides. Copies of all other texts mentioned are available foruse during the classroom period. Because of the limited supply,however, they-must be returned to the supply room at the conclu-sion diff class_
D. Class Instructor. One of the major differences betweenthis course and .a conventionally taught course is the role ofthe iostructor. Your regularly assigned'instructor will beavailable during all class sessions to assist you with prob-lems you encounter. Be will not be lecturing.- You are en-couraged to seek help during the regular classroom period orduring an EI period, if you are having difficulty with thecourse content or mechanics of the course -material.
3. Course Schedule. Every effort has been made for you to determineyour own speed in covering course materials. The Progress Checks,which will 1)u mentioned later in detail, are taken at the completion ofa number of. Problem and Solution Book segments and as= on a fixed date.Obviously, to complete the course in the sixteen (+ ) weeks allowed,some minimum rate of progressmust be maintained. This minimum rate ofprogress is determined by the 'Test areas in the following schedule.
TEST/LECTURE SCHEDULE
9/10 Oct TEST: SEGMENTS 1-1023/24 Oct LECTURE: LINEAR MOMENTUM6/7 Nov TEST: SEGMENTS 11-4513/14 Nov LECTURE: AMGULAR MOMENTUM4/5 Dec TEST: SEGMENTS 46-5211/12 Dec LECTURE: WANE MOTION16/17 Dec LECTURE: SOUND8/9 Jan LECTURE: GEOMETRICAL OPTICS19/20 Jan TEST: SEGMENTS 54-62
Progress Checks to be _completed after the following segments:
5, 10, 18, 46, 48, 52, 58, 62
Midshipmen who complete all of the course segments (and appropriateProgress Checks) early will .be excused from class early except fortests and lectures noted above.
4. Testing. Two types of testing or evaluation are used in thiscourse.
43

A. Progress Checks are completed as noted in course schedule.Each midshipman will notify his instructor one period in ad-vance when he wishrss to take a Progress Check. Each Checkconsists of ten questions, similar t those in the Problemand Solution Book, cowering the material since the last Pro-gress Check. Fifty, minutes per Check :gill be allowed. Theprimary purpose of he iProgress Check Is to identify areaswhere the student is-weak. Although they are scored, thescores are not used in determining course grades. Scoringis as follows:
Questions Correct Action
8 or more Cont lane with next segment
5-7 Schedule recheck with instructor
Less than 5 Schedule ET period
In all cases, midSbipmen will be provided references to appro-priate course matatimIs. for the questions they miss. The re-check 1011 cover only Items -missed .artheTtogress Check andmust be snheduled dm advance..
B. Diagnostic Tests covering more material than the ProgressChecks will be admimlstered as shown nn the class schedule.These tests will be mall for determining progress marks sub-mitted to the registrar- Students who haw difficulty main-taining the minimum class schedule may find themselves takinga test for grade on material for which they have not had aProgress Check. In these cases, the test aill also count asa Progress Check. Midshipmen who 1 an A average inthe four tests will have the test grade minuted as the finalexam grade.
5.. laboratory Work. The opemation of the serf-paced laboratory isoutlined in a separate handout. It is emphasized that completedExperiment Guides represents the work of the miOchipman whose nameappears on the cover. Material from the laboramnry will be coveredon the final examination.
Homework.prOblemcs assigned in the. Study Guide are supple-.mentaty. They will not be collected.
7. ,..Grades. Progress and semester grades remain the perogative of theindividual instructor and will be based on:
Quarterly DiagnosticsFinal ExaminationLaboratory
Weights assigned to each item will be determined by individual instruc-tors.
44

I
2.3.2.4 Sample Procedure Form
UNITED STATES NAVAL ACADEMYPhysics Department
SP211, Engineering Physics I First Semester, 1970-1971
The Self-Paced Laboratory
For the laboratory portion of SP211, Engineering Physics I, you willbe allowed to proceed at your own pace through the experiments listed be-low. Although you have been scheduled for a particular laboratory per-iod, you may disregard .this and report to the laboratory (Room B8,Michelson ?i'11) at any time during the academic day (0755 to 1145 and1315 to 1505, Monday through Firday, and 0755 to 1145, Saturday). Uponreporting to the instructor on duty in the laboratory, you will be givenan Experiment Cu5.de and directed to a laboratory station for the appropri-ate experiment. On the Experiment Guide, you will record your name andsection, your insturctor's name, the date, and the times of arrival anddeparture. Upon completing the experiment you may leave, but you mustgive the completed Guide to the laboratory instructor who will, in turn,give it to your instructor. Your work will be graded and returned toyou.. If you wish, you may complete more than one experiment in a givenweek; however you will probably find it advisable not to out-pace yourclassroom assignments. Should you find it impossible to complete theexperiment in the time available, make a note to this effect on the Guidoand turn it in to the laboratory instructor before you leave. It will beheld in the laboratory so that you may return and finish it later. Inany event, you must complete the experiments within the spans of timegiven in the list below. You must complete all experiments or stand indanger of receiving no credit for the course. All work is to be accom-plished individually, but the instructor in the laboratory will answer:questions and try to ensure that you have adequate' equipment and thoc itis working properly. Laboratory Manuals will be provided at each station,but you should always bring your slide rule, textbook, and a straightedge to the laboratory.
EXPERIMENTS
Number TitleAvailableBeginning
Must be Completedno later than
1 Measurement I 14 Sep 3 Oct2 Acceleration 21 Sep 10 Oct3 : Measurement II 28 Sep 17 Oct.4 Centripetal Force 5 Oct 24 Oct5 'Inclined Plane 12 Oct 31 Oct6 Ballistic Pendulum 19 Oct 7 Nov7 Rotational Inertia 2 Nov 21 Nov8
9
Vibrating Spring
Speed of Sound in Air
16 Nov
30 Nov
5 Dec17 Dec
10 Standing Waves 7 Dec 9 Jan
11 Single Lens 4 Jan. 15 Jan .
12 Lens Combinations 4 Jan 20 Jan
45

ECM Liks11 121 ea El OE MI ES EN OE EU En PE US El EV En
cedceigagatimomem Cal IMIX1
YA5d C.SIA Eli MI El 123. Ell Ea El 111 ria 1212 Ea MI EV1 121 Eil El CB Egi kgrai CM DI ES I
46

STUDENT MANUAL
1. DESCRIPTION OF THE COURSE
The self-paced physics course differs from conventional courses ina number of ways. It is largely student-managed programmed instruction.Most of your learning will be derived from reading carefully selectedpassages in excellent textbooks, simplified written discussions of thehighlights of the various subject areas, and the use of audiovisualaids in the form of videotapes, "talking books", and brief, meaty illus-trated pamphlets called Illustrated Texts. An instructor will be avail-able for tutorial assistance as well as diagnosis of your progress.
The format of the course permits you to monitor your performanceand achievement by means of instant feedback from the visual responsemechanism to be described later.
In addition to self-paced theoretical instruction, you will alsospend an adequate amount of time in the physics laboratory and attenda demonstration-lecture periodically.
You will always know in advance when a check quiz or an evaluationtest is to be given. As a matter of fact, you will determine for your-self when progress checks will be administered to you. In addition tcother periodic tests, a final examination will be used to evaluate yourachievement.
2. COURSE STRUCTURE
Assigned reading - -From standard textbooks, coded as follows:
HR means Halliday and Resnick, PHYSICS FOR STUDENTS OFSCIENCE AND ENGINEERING, fifth edition, combined form;
SZ means Sears and Zemansky, UNIVERSITY PHYSICS, thirdedition, complete;
AB means Albert Baez, THE NEW COLLEGE PHYSICS - A SPIRALAPPROACH, first printing;
SW means Shortley and Williams, ELEMENTS OF PHYSICS, fourthedition.
The'required or prime reading assignment for each segment of thecourse will be identified by one or more asterisks before the chapternumbers. The remaining reading is to be considered supplementary. Atypical reading assignment and its interpretation will be presented asa sample later in this Manual.
47

2 STUDENT MANUAL
For maximum effectiveness, all assigned reading should be completedbefore you begin work on the programmed instruction. This first read-ing need not be exhaustive because it is anticipated that you will returnto certain sections of it time and time again as you work through thesegment.
Information Panels -- Aside from your textbook reading, much ofyour factual and procedural information will come from Information Panelspresented in the PROBLEM AND SOLUTION booklet for each segment. ThesePanels are concise discussions relating to the principles and methods ofsolution involved in the accompanying problems. If you should find thatyou do not fully understand the material in the Panel for a given sectionof your work, you would be expected to return to the textbook assignmentfor clarification.
AudiovisualsThese are important adjuncts to your reading andproblem solving. When you are directed to work with a specified audio-visual, you will usually be given the option of selecting one of threemedia of presentation.
Videotape: a demonstration accompanied by a discussion thatyou view on the screen of a small videotape playback;
Talking Book: a set of carefully constructed pictures anddiagrams accompanied by an audiotape lecture;
Illustrated Text: a set of pictures similar to those used forthe Talking Book accompanied by a formal written discussion matched pageby page to the illustrations.
Progress Checks -- groups of relevant questions which you must answerafter completing a specified number of segments. These checks wi _1 beused for diagnosis, progress evaluation, and tutorial assistance shouldthe latter be needed.
Quarterly Diagnostics -- special test forms administered periodicallyto assist your instructor in diagnosing possible weak areas in yourlearning pattern, and to enable him to prescribe remedial work whererequired. The Quarterly Diagnostics will also be used to evaluate yourachievement.
Final Examinationstandard examination which provides informationrelative to your final grade.
Enrichment Packagesfor those students whose progress warrantsadditional, higher level material; to be a student option.

1
3. PRINTED LEARNING MATERIALS
STUDENT MANUAL 3
PROBLEM AND SOLUTION BOOK. (Hereafter referred to as the P&S.) Thisis bound study material containing the work for three or more segments ina volume. The entire course consists of 45 segments for the semester.The P&S material in a given volume will contain blue title sheets betweensegments to help you find the one you want quickly. Each P&S contains:
(a) A problem section in which the questions and numerical prob-lems are presented in stict numerical order, to be worked on in se-quence.
(b) A solution sectj_cn in which the correct methods of answeringquestions and solving problems are presented in scrambled order. Manyof these'solutions arc terminated by additional "true-false questionsto be answered immediately after you study the individual solutions.
(c) Information Panels strategically interspersed throughout theproblem section.
STUDY GUIDE. This is just what its name implies: a written guidethat you must follow step-by-step, strictly in the order presented, towork your way through the problems, information panels, audiovisuals,reading, solutions, and other check points. The remainder of this Man-
will be devoted an explanation of the way in which all theseaspects of your learning arerelated.
4. HOW TO USE THE STUDY GUIDE
Please refer to the sample Study Guide which is the 1F.st page ofthis booklet. It is a partial mock-up of a segment that doesn't reallyexist, and will be used for explanation purposes only, If you are tounderstand how the system works, if you are to avoid blunders when youstart work on your first actual segment, you must walk through the fol-lowing explanation without missing a step. Take your time; be abso-lutely certain you understand each maneuver perfectly. If you need helpin interpretation, ask for it. .
Before you begin work on L'ily aegffient, ascPctain that you have thecorrect STUDY GUIDE by checking thandmber near the upper right-handcorner, then complete the heading.on,each STUDY GUIDE sheet.
Another preliminary step: look at the bottom of the STUDY GUIDEsheet and note the number of pages you should have in your hand. FewSTUDY GUIDES contain more than two pages. Be sure you have what'youneed before you start work.
49

4 STUDENT MANUAL
The letter P above the left column means "Problem Number;" the
STEPS are also numbered to indicate the sequence of things you must doother than problem solving.
1
'iC
All right. Let's go through the sample.
Step 0.1 The reading assignment for the segment. The requiredreading is in Halliday and Resnick, paragraphs 49-3through 49-6 and paragraph 49-9. The slash-bar (/)always means from one paragraph through the other, in-clusive. The supplementary reading is in Sears andZemansky, paragraphs 45-6, 45-7, and 45-11. This read-ing should be gone through at least once before continu-ing.
Step 0.2 When you have finished your reading, turn to the firstpage in the P&S for this segment. Read the InformationPanel, be sure you understand if fully, then continue.
This is the first problem in the P&S. Note the overocore
and underscore lines. These indicate that the problemis a core type, required of all students in the course.You will find this problem boxed for the same reason inthe P&S. The problem you find in the P&S as number. 1is:
How many gallons of regular gasoline could you havepurchased with 5 Martian zilches in Septimus, Ohioin the year 1960 and still have some change left over?
A. 1
B. 2
C. 3
D. 4
Now Qbviously, to solve this problem you would have toknow the price of gasoline per gallon in U.S. currencyand also the equivalent buying power of a Martian zilch.Presumably, your reading and the Information Panel con-tains this information but let us suppose that youdidn't do any of the reading and so didn't know theanswer. So--you're about to make a wild guess, let'ssay, answer A. At this point you rub the "reveal"-pen provided all over the inside of box A for thefirst. question. As you do so, you will see an X appear,showing that the selection was incorrect. Do it now;
reveal the X in box A with your pen. (Best results areobtained by rubbing the pen lightly over the surface,
-then waiting a few moments for the revealed informationto darken.)
50

STUDENT MANUAL 5
Making another stab at it, you choose answer B and usethe pen bringing out another X. Trying C, you find thatthe pen reveals the characters 29[a]. This tells youto turn to page 29, item [a] in the P&S where you willfind the full explanation of the method used to solvethe problem. For this core question, you will alsofind a very short true-false question immediately afterthe correct solution. This question reads as follows:
A Mart.lan zilch is the equivalent of three U.S.nickels. True or False?
You must now use the reveal pen on either the T-boxor the F-box for question 1.
If you make the correct true-false selection, a willappear in the box. If you choose incorrectly, an X winappear in the box. The true-false questions are usuallyso simple that you will be permitted few, if any, errorsin th:Ls part of the work. Getting one of these T-F'swrong is a pretty sure indication that you are not read-ing the solutions. You must avoid this.
Let's go down to the next step.
Step 1.1 You are now being given an option. If your first choicewas correct, you will be permitted to skip over the nextfour questions and advance to the next Information Panel.If you answered incorrectly, even once, you must gothrough the remedial loop consisting of questions 2through 5.
We are assuming that you missed question 1, so let'sgo through this loop together.
2 Problem 2 in the P&S. It is not scored, hence it isnot a core problem. It reads as follows:
It is predicted'that a gallon of regular gasolinewill sell for $1.05 by the year 1998. If this isroughly 3-1/2 times the price of gasoline in 1960,how much did one gallon cost in 1960?
This is not multiple-choice. It's a completion type ofquestion where you must write in the answer. So, writeyour answer on the line below the rectangle for question2. The answer is, of course, 30Q because $1.05 is 3-1/2
51

STUDENT MANUAL
times 30c. After writing it in, reveal the answer inthe rectangle with the pen; the answer 30c will appearaccompanied by the referral page and item 14[c]. Turn-ing to the referral, you find the solution worked outfor you to check your own thinking. Problems that arenot core types are not accompanied by true-false checkquestions, so you're ready to go to question 3.
Let's interrupt the sequence for a moment. Even if youwere able to answer the original core question correct'.ythe first time, you should go through the remedial loosanyway if you have any doubt at all about th6 method ofsolution or the answer. You may have guessed at theright answer, or you may have made two errors that can-celed out. In any case, if you feel that your choiceof the right answer was a fluke in any way, we urge youto go through the remedial loop.
3 Problem 3 in the P&S; it is not a corc problem. Hereit is:
Ten Martian zilches will buy exactly the same numberof 2-1/2 inch McIntosh apples in a given market on agiven day as two U.S. dollars. Thus, one zilch is theequivalent of
A. 10C
B. 20C
C. 40CD. 60C
A glance at the STUDY GUIDE corroborates the fact thatthis is another multiple-choice question. Apparently10 zilches is the equivalent of $2.00, so one zilchmust be worth 20C. This is answer B, so if you use thereveal pen in boX.B you will bring out the instruction18[b] indicating that page 18, item [b] in the PO hasthe solution. Whether you were right or wrong, in yourselections, it is important that you read and;understandthe solution. If you had chosen any answer other thanB, you would have revealed an X as before. There,is notrue-false question, hence you can now go-on to question4.
Here is your first modified true-false question:
True or false? Five martian.zilches will purchasemore milk than 20 U.S. dimes.
.52

7t"
STUDENT MAN717,47, 7
Note the italicized word. Read the statement and (a)if you decide it is true, simply ink the T-box onthe STUDY GUIDE; (b) if you feel that it is false,write a word that can replace more and thereby makethe statement true. After you have written the correc-tion word on the line under the F rectangle, then, andonly then, you are to reveal the answer with the pen.In this particular instance, the correct answer is"false" and you would write in the -.7ozd "less" in placeof more. Your reveal, pen will bring this out, too.If you had selected "true" as your ans ?r, the penwould have revealed an X inside the T-box. So, afterwriting "less" you would see revealed: "less (21[d])."At this point in an actual lesson; you would turn tothis page and item in the P&S and read it carefullybefore continuing the sequence.
Continuing with the remedial loop:
5 Another multiple-choice question:
In order to have filled your 18-gallon tank withgasoline in 1960 in Septitaus, Ohio, you would havespent at least
A. 15 zilchesB. 21 zilchesC. 23 zilchesD. 27 zilches
The correct answer is, of course, 27 zilches since eachzilch is worth 20c and each gallon costs 30Q, so youwould reveal box D and find inside the instruction"27[b]." After reading the solution, you again encountera check T-F question which is then answered as before byrevealing either the T or F box in question 5. Anyanswer other than D above would have revealed an X justas described for the previous multiple-choice question.
Step 5.1 Everyone is now expected to devote some time.toIhe.Information Panel, "The Currency of Venus" and then:
Step 5.2 select the medium he wants for running through the audio-visual, COINAGE AND BILLS OF THE INNER PLANETS.
After that is finished, everyone starts once again on anequal footing with the core question 6.
And so forth.

-r
it
of
ri
8
U. S. NAVAL ACADEMY
NAMESTUDY GUIDE
STEP
SELF-PACED PHYSICS
SECTION SEGMENT 60
0.1 &Pading: HR*49-3/49-6;*49-9SZ 45-6, 45-7; 45-11
If your first &ioice was correctadvance to 5.1; if not, continuesequence.
Note: In this sample "wait;through", we have not in-cluded the InformationPanels nor any set-up P &The probims that would nal-many appear in the P & Sare given in the StudentManual for explanation pur-poses.
AND SO FORTH
5.2 Audiovisual, COINAGF AND BILLSOF THE INNER PLANET;
F
6.1 hIf your answer was correct, ad-vance to 9.1; if not, continue'with sequence.
54
2.4 Information and Data Handling Procedures
A complete definition of the course content is necessary and
was accomplished by the identification of over one thousand MBOis. These
are to be found in the two volume MBO documentation.
2.4.1 Data Preparation,Prior to Course Implementation
2.4.1.1 Establish Course Structure
1. Student Background and Enrollment File - Prepare
,a student background card for each student to be enrolled in the course.
See Exhibit "A" for data and format. Under CMI, there is an allowable
maximum of one-hundred and eighty-five students per CMi course.
Purpose - This data registers a student in the
course and provides the basis to accomplish the following:
a) Assignment of Course Student Number
b) Creation of Student Roster
c) Couulutation of Capability Index
d) Storage of Background. Data
2. Preparation of Course Header File - Prepare a
course header card (Port-A-Punch format) for each test (or Study Guide)
to be administered during the course. See Exhibit "B" for data and format.
There is an allowable maximum of 48 questions per test.
Purpose - This data establishes the correct answer
matrix for each test to be computer graded and provides certain-lesson
identification data.
3. Preparation of Question (MBO) Description File -
Prepare a question description card for each question within a test (or
Study Guide). See Exhibit "C" for data and format. Following the basic
55
structure of the course, each question should be designed to test the
student's knowledge of a specific Terminal Objective (and Enabling Objec-
tive where applicable).
Purpose - This data will be used in the prepara-
tion of the individual student performance report (Refer to Exhibit "D")
and the TO analysis reports (as described later).
The prescriptions (remedial assignment for a
student) for each question should be carefully constructed and will be
printed for the student only when the question is answered incorrectly.
See AIMS III Systems Manual for more detailed information on these files.
Non-CMI Procedure - If the CMI is not utilized
for generating prescriptions, then a TO Key Sheet should be prepared
as in Exhibit "E." These sheets are issued subsequent to each Quarterly
Diagnostic. Section 4 contains a detailed description of this procedure
and tile Progress Check procedure.
2.4.1.2 Data Verification and Updating
Once the data files have been prepared, CMI reports
are genetqted fo reflect what data has been entered into the system.
These reports should be reviewed to verify accuracy of the data.
1. Student Background and Enrollment
Printed reports consist of the Class Roster
(Exhibit "F") and Course BackgroUndAtoster (Exhibit "0).
The Course Student Number (CSN) is created by
the system and is printed on.the Class.Roster. The CSN is the identifying
number to be used subsequently on all student response input data.
To add a student to the file, prepare a student
background card as above; to drop a student from the file, prepare a
student drop card as in Exhibit "H."
56

2. Course Header
Certain types of errors input to this file, will
automatically be printed by the CMI; however, the temporary (or
Permanent) Header File Listing (Exhibit "I") should be reviewed for
completeness and accuracy. The AIMS III User's Manual contains detailed
instructions on the method of updating this file.
3. Question (MBO) Description
The Course Structure Summary Listing (Exhibit "J")
provides a line-by-line printout of the MED descriptions. Review of the
listing is necessary to verify all question description data. Additional
information is contained in the AIMS III User's Manual.
2.4.2 Course-in-Progress Procedures
2.4.2.1 Student Data
1. Data Preparation
Under CMI, two forms of collecting test data are
possible:
a) Port-a-Punch and
b) Optical scanning form
See Exhibits "K" and "L" for Port-a-Punch formats
and descriptions. See Exhibit "M" for Opscan data.
If the non -CMI procedure is utilized, the Opscan
form is also utilized but as described in Exhibit "N."
Note that "completion time" data is an optional
data requirement.

2. Progress Check Procedure
Responsibility Procedure
STUDENT 1. Schedules Progress Check (PC) with instruc-tor upon completion.of appropriate segments.
2. Submits Study Guide to
INSTRUCTOR 1. Reviews student's Study Guide just prier toPC.
2. Administers PC to student.
3. Grades PC "on-the-spot."
4. Takes following action:
1 5.
6.
COURSE MANAGER 1.
DATA MANAGEMENT GROUP 1.
2.
3.
a) if 40% or les, (noTteet: schedules
tOgaT1-41 6esem 4 .4,4611eS remedial4111 retake PC.
b) if 30'-7(0%; issues remedial material;may reschedule PC.
c) if 80-100%: issues remedial material:464 new Sty Guide.
NOTE: Instructor Option:
Examines Study Guide as aid to diagrosisof student weakness; may conductate tutorial if warranted.
Issues a "filled-in" Study Guide to thestudent for each one he turns in finally.
Forwards PC responses to course manager.
Forwards graded Progress Check to Data Man-agement Group. Do not include "retakes."
Prepares Progres'S Check worksheet (See fol-lowing sample.)
When approximately 33% of all students havetaken the PC, prepares Progress Check-sum-mary report (See following sample.)
Forwards summary report to course manager.
58

Responsibility
COURSE MANAGER
2. Progress Check Procedure (cont'd)
Procedure
1. Reviews summary report with instructor.
2. Determines remedial strategy.

PROGRESS CHECK -- SUMMARY REPORT
NAVY PHYSICS - PS211
SEGMENT
SAMPLE PROGRESS CHECK SUMMARY REPORT
DATE
%TAKEN
% ACHIEVEMENT
CORE PROBLEMS SECTION
0301 0501 0801 1101 1201AVERAGE %AC111EVEmENT0101
r
,.
Total %
60

MIS
IMM
OM
Nfl
#021
1Wil
PRO
GR
ESS
CH
EC
K W
OR
KSH
EE
T
iayw
o,11
1..4
540,
j41
SEG
ME
NT
mai
dM
IMI
MIS
MIN
Iel
k
TO
TA
L (
all s
ectio
ns)
Cor
ePr
oble
m
Sect
ion
0301
0501
0801
1101
1201
.RW
%
Rig
htD
ate
0101
Rig
htW
rong
Rig
htW
rong
Rig
htW
rong
Rig
htW
rong
Rig
htW
rong
Rig
htW
rong
....
.ro r tt .-
:/PO 0 E cn cn o = rn 0 C rn rr
i

3.. Quarterly Diagnostic Procedure
Responsibility Procedure
COURSE MANAGER 1. Prepare a random question Diagnostic foreach section, consisting of one questionfor each TO, drawn from a Multi-VersionQuestion Bank.
2. Prepare sufficient copies of Student TO
Key Sheets.
3. Prepare sufficient copies of each Diagnostic.
4. Prepare correct answer key.
INSTRUCTORS 1. Administer theDiagnostic.
2. Forward the Student Diagnostic AnswerSheet to the Data Management Group.
3. Prepare make-up Diagnostics, administerand grade them.
DATA MANAGEMENT GROUP 1. Sort Diagnostic Answer Sheets into sections.
(See following procedures for items 2-5)
2. Prepare Student TO Key Sheet (one per stu-dent) for Diagnostic.
3. Prepare Diagnostic TO Summary Report foreach section.
4. Prepare Diagnostic Score distribution (Histo-gram) by section.
5. Prepare Diagnostic T.O. Summary ComparisonReport.
6. Forward TO Key Sheets and Reports tocourse manager
COURSE MANAGER 1. Distribute appropriate reports and TO KeyV,eets to instructor.
2. Review Comparison Reports.
INSTRUCTORS 1. Distribute TO Key Sheets to students.
2. Review reports to determine remedial strategy.
62

SAMPLE PROCEDURE
Procedure for MarkingStudent TO Key Sheet and TO Section Summary Worksheet
1. Post student's last name and Academy # to TO Key Sheet from
his Diagnostic Test.
2. Review each Student Diagnostic Test Sheet to determine incorrect
answers.
3. a. For each incorrect answer, use cross-reference list todetermine appropriate TO; circle that TO on the TO Key
Sheet.
b. For each incorrect answer, post a check mark to the TOSection Summary Worksheet.
4. Calculate and post Z wrong -Total wrong
Total students this section taking test
5. Also post % wrong to the Diagnostic TO Summary Report for theappropriate section and the Diagnostic TO Summary Comparison.
Total wrong answers for TO6. Calculate % wrong - all sections - Total students taking test
and pact to Diagnostic TO Summary Comparison.
63

SAMPLE PROCEDURE
Procedure to Prepare Diagnostic Score Distribution
1. Count the number of correct answers on each student test sheet. and post the # correct on upper right:.corner of his test sheet.
. When all student tests have been marked as in (1) above, completethe Score Conversion Table.as follows:
a. Place a mark in the check box for each studentopposite the appropriate Right" line;
b. When all student tests have been checked as abJvc,post the total for each line in "Total" column.
3. Draw Bar Chart for section on Score Distribution Form.
4. Post totals from "Total" column to "All Sections" Score Table.
5. When all sections have been posted as in (4) above, add and posttotals to "Grand Total" column.
6. Draw Bar Chart for all sections on each Score Distribution Sheet.
64

ALL-SECTIONS-- SCORE DISTRIBUTION
DATE
SECTION TOTALS
GRAND
TOTAL
SCORE
0101
0301
0501
0801
1101
1201
All
Sections
100%
90
80
70
60
50
40
30
20
10
>10

t
I
SCORE CONVERSION TABLE
SA MPLEFORM
DATE
SECTION
j/ RIGHT (inclusive) SCORE 4gic"i< 13 c') TOTAL
31 100%
28 - 30 90
25 - 27. ,.
80
..
22 - 24 70
19 - 24 60
16 - 18 50
13 - 15 40
10 - 12 30
7 9 20
4 - 6 10
0 - 3 > 10
66

SECTION
DIAGNOSTIC T.O. SUMARY REPORT
SAMPLE: FORM
DATE
T.0.4E
SECTION% WRONG
ALL SECTIONS% WRONG
1
. 2
3
4
5
6
7
8
9
10
11
'''F. .
-,
26
27
28'
29
30
31
67

DIAGNOSTIC T. O. SUMMARY COMPARISON
SAMPLE FORM
DATE
% WRONG
T.0.# 0101 0301 0501 080.1 1101 1201 All Sections
1
2
3 .
4
5
6
7
8
.
10
11 P,
26 ,
27
28
29
30

SECTION
T.O. SECTION SUMARY WORKSHEET SAMPLE FORM
DATE
TotalStudentsThis SectionTaking Test
T.0.#
CHECK
WRONG
TOTAL
WRONG
% *
WRONG
1
2
3
4
5
6 .
8
-.
.
24
25
26
27
28
29
30
31
69

r.
SAMPLE FORM
QUARTERLY DIAGNOSTIC SCORE DISTRIBUTION
NAVY PHYSICS PS211
ALL SECTIONS
120 -
100-
80
HI
41 60 -
E-1 40 -An
20 -
DATE
>10 10 20 30 40 50 60 70 80 90 100
SECTION
25--
5
0 --
PERCENTILE
>10 10 20 30 40 50 60 70 80 90 100
PERCENTILE70

TY7
2.4.2.1 (Coned)
4. Study Guide
For a detailed listing of the multiple responses
selected by all students, an item analysis report is available. Under
CMI, the report is prepared via the computer and is described iv the
AIMS III User's Manual. Descriptions for the course revisions are con-
tained in the Empirical Course Development Model and the ReviCons Pro-
cess Documentation.
Under CMI, Study Guide responses are also used in
the determination of a student's understanding of a specific TO
2.4.2.2 Report Descriptions
The non-CMI reports have been described in the pre-
ceding sections. The student oriented CMI reports available are briefly
described below and are also contained in the AIMS III Systems Manual,
and incorporated in this report as:
Exhibit "0" Individual Student Analysis; student's per-performance on each individual TO.
Exhibit "P" TO Remedial Summary; listing by TO ofall students who performed above theerror percentage set for a particular
. TO.
Exhibit "Q" Remedial Session Lesson Plan; TOs as-signed to a session (and instructor)according to the number of students whoperformed above the error percentage.
Exhibit "R" Remedial Session Roster; a listing ofstudents assigned to remedial sessionsbased on their TO error percentLge.
Exhibit "S" Volume Summary; a listing of all thetotal performailce for all students bysection.

EXHIBIT "A"
STUDENT BACKGROUND AND ENROLLMENT CARD
Column Number Heading.
1 -.25 Student Name
26 - 34 . Academy Alpha Number
35 - 37 SAT - Math
38 - 40 SAT - Verb
52 53 Calculus
54 55 Chemistry
56 58 Math Achievement
61 63 Rank
64 78 Comments
78 80 Course Number (*)
(*) NOTE
If this number is input as zero, the system assigns the student
a course number; if not, it considers this card an update.
.72

'1
4
EXhIBIT "B"
COURSE HEADER CARD
1
Column Number
2, 6, 8 Number of Selections
7
24, 26 Number of Questions
42, 44 Course Number
48, 50 Sequence Number
,54, 56 Type Number
60, 62 Volume Number
CA, 68 Segment Number
80 Single or Double
f
S
I) A E C1M.LETIONI ME
CO'JR5r 5(0.T
MO DAY YR MIN 0 0 2r?, k u
12 N
Of 1 ) Z 1313 1:I 7
M 2 N 26 0 n 3$
.1 . : (:) : :'. (7,k ::.. '42 44 40 50 54 56 f
g66 62
I:1
) . 0 () ; (-, 1 .t) t....) : i ' , i t," .:1 I (:,)
..,r gr.,IC it11-3I
k..,...:.
J
0 C)I (.:1 C) .
-C.1
0 if) 0 0 . C.) -) ( )
ID (Ti !colII I
till ;fil.
al I II lin 'W ii3 gXli Iggl
LT,' -.01 ,g ,....)::. i'' ____1.-± ______trl: kr.
(A0 ( '-I
Nei
0 62
I cf)
STUDENTID. ND
72 74 76 11 10
iIN ! 7 :1 Ai 4-4 . I 5i :a a.s .1 64 .1 61 it. iatom :.; tow
- .
73

EXHIBIT "C"
QUESTION (4B0) DESCRIPTOR CARD
Column Numbers Heading
1, 2 Volume Number
3 Segment Number
4, 5, 6 TO Number
7, 8 E0 Number'
9 - 42 MBO Description
43, 44 Learning Category
48 Type
49, 50 Question Number
51 Correct Answer
52 - 78 Prescription
79, 80 Course Number
74

ilimma
*awl
owa4
it*rmw.00l
A..4
womili
ammo
VON
IMMO
MO
**** A.I.M.S. REPORT GENERATOR ****
REPORT 'NUMBER
I ****
TIME
- 19.02.21
DATE
- 01/30/70
PAGE NUMBER
STUDENT PERFORMANCE ANALYSIS FOR
VOLUME
8POST TEST
COURSE PHYSICS 5211
SEGMENT
1
SECTION
GROUP
CSN
NAME
ID NUMBER
6IlneIfeattr:C=2:2:211
1201
A
ANSWER C/W
BEHAVrORAL OBJECTIVE
MESSAGE
1 2 3 4 5FRICTION
6W
CENTRIPETAL FORCE
7W
WORK DONE BY A CONSTANT FORCE
X8
WriwER
9C
10
I 1
12
1-0, NON-RELATIVISTIC COLLISIONS
1314
WGRAVITATIONAL FIELD
15
WGRAY. POTENTIAL EMERGY
16
17
IS
W'
CALCULATE ELECTRIC FIELD
19
WELECTRIC FIELD/SUPERPOSITION
20
WWORK IN ELECTRIC FIELD
YOUR GRADE IS_
67_
YOUR_RAW SCORE IS
50.
YOU MUST SEE YOUR INSTRUCTOR THIS WEEK TO DISCUSS THIS TEST.

EXHIBIT "E"
STUDENT TO KEY SHEET
SEGMENT NUMBER - CORE PROBLEM NUMBER*
TO
1
SEC. # CORE
NAME
PROB. TO
ACADEMY NUMBER
SEG. # CORE PROB.
1-13 '16 4-16
2 2-17 17 5-5
3 1-1 18 6-1; 6-2
4 2-1; 2-6 19 6-9; 6-14; 6-15
5 2-10; 2-14 20 7-2
6 3-1; 3-6; 3-9 21 7-1; 7-5
7 3-1; 3-6; 3-9 22 7-10
8 1 -1.3 23 7-15
9 3-1; 3-6 24 8-1
10 3-17 25 7-18
11 2-14 26 8-9
12 3-12; 3-18 27 8-5; 8-18
13 4-1; 4-2 28 9 -'; 9-2
14 4-5; 4-6 29 9-3
15 4-11 30 10-1; 10-5
31 10-13
*CoreTroblems Most Closely Keyed to Diagnostic Questions.The TO number circled was answered incorrectly on the Diagnostic
76

"<
-PsI
iC *
MIR
***
*
1,Tuoc4T
11
IFR
T El
iCL
hM L
SAir.
C
iFO
DJH
CS
tt0
Y
TE
L LI
LA
REPORT
NUMBER 12 ****
*** CLASS ROSTER ***
COURSE, PHYSICS S211
ACADEMY
NC.
COURSE
STO.NO.
1 2 1.
_
4 5 6 7
10
TIME
- 14.39..44
DATE
- 04/28/TO
PAGE NUMBEk
I. N
GC
EtL
R L
'PkV
RJ
LEA
K S
yoK
IC N
GI
01C
TO
UA
NI-
----
-'---
UE
T'J
RY
L
IC
Ky- r J R I L
U
NA
PA
D 4
Aw
OE
TA
BN
BA
LY1T
TE
la0G
0GC
L G
c
17 18
lq-
--
20
7'-
222324
2 26
EL
F-
2 [
28
2930
31 32 3334
36
-3738
-3g
40
4142
-43 44
45 46
4 48

***
AIMS COURSE ROSTER
**
NAME
0.04
MO
NO
&E
MI
MIN
S
JOB
210012
10/06/69 11.32.54
PAGE
.1
ACA0 NUM. NO. CAP INDX. SAT MATH SAT VERB CALC CHEM MATH ACH RANK
COMMENTS
CRSE DROP DATE
DATE
ENTERED
DROPPED
I4
tli4tP.
UE
1Tr,
E T D T
DAV
PPE
4 P.I.ET
D E
_
_
-
t
41
56
.47
67
684
610
00
730
157
009/10/69
60
607
678
473
502
00 0
693
162
0
09/30/69
43
0720
656
0698
157
09/30/69
6S0
160
0
44
70
0
0-
09/30/69
45
73
741
605
00
800
172
009/30/69
46
63
659
518
00
680
252
009/30/69
el- V
TE L
'AL
AAil0'
ET
0 L
N AK
R YIv
DENC NSF
w w I
_L
47
72
732
522
00
740
347
009/30/69
48
64
630
548__
(0)
0654
347
009/30/69
..
49
74
678
644
0698
440
009/30/69
50
65
684
507
0769
157
009/30/69
_.
162
605
708
0565
252
.0
09/30/69
52
61
614
534
00
.
631
345
009/30/69
4,11.
iEV
KfR
AEO
U.TSR6R
DI T
AfL
MpT
HSI
W'A E
EADP
Y T
C
53
64
704
4:-.89
00
611
167
009/30/69
54
59
627
498
00
643
255
009/30/69
----
_55
56
587
509
00
687
160
009/30/69
56
67
732
00
650
162
009/30/69
.596
_._
57
67
685
704
0643
160
009/30/69
.58
71
694
637
00
654
345
009/30/69
J P R
..,ILRYA
cRWL
mt 40TSCVLDA
EIf
NT
1L'N.
4 F .__ ______
59
63
684
603
.0
0596
165
009/30/69
60
64
__ _____
636
692
__
0639
162
009/30/69
61
62
650
547
00
693
165
009/30/69
62
74
764
690_
00
690
157
009/30/59
_____63
69
705
534
00
753
250
009/30/69
64
68
732
548
00
736
157
009/30/69
I 0 0 0/Np
E R l.W
/ITAtI
EI.RtA
f. 1001TiNt
. RUSWGOGW
# MT
Lw M L1 ATE
. C
C A A
H LK
K 0
..._
. .1
65
74
756
642
00
736
'
180
009/10/69
66
58
.623
605
00
574
170.
009/30/60
'
67
69
684
T2
00
639
250
009/30/6q
00
753
255
009/30/69
-
_
__69
65
678
551
00
610
345
0.
09/30/69
X70
83
732
628
00
720
640
009/30/59
71
54
587
521
00
609
162
009/30/59
.
72
75.
742
573
00
753
345
009/30/69
73
61
655
562
00
661
167
009/30/69
74
75
723
656
00
775
250
009/30/59
.._ _ .
_75
54
599
515
00
57
165
009/30/69
76
64
713
493
00
639
250
009/30/69
1M
-..TEN
it
:0.1
AOG..N
,.Si1KNE
, '#:
710CALSA
1E1.0
T.E N
A I E D
YE
H E
WiN
V- D
L_
R H J
3
t'
to T LvE1T
R 0
J F.
77
68
712
623
0'
0690
162
009/10/59
78
55
586
582
00
574
167
001/30/69
_._
.
79
61
614
618
00
620
250
009/30/69
80
62
655
507
00
598
345
009/30/59
THERE ARE 182 RECORDS IN THE STUOENT FILE
OF THESE 182 STUDENTS REMAIN IN THE COURSE

EXHIBIT "H"
STUDENT DROP CARD
Column Number Heading.
1 - 20 Student Name
21 - 77 Blank
78 - 80 Student Number
79

--M
IMI
*410
4:t=
'.0-1
!4r4itWN
t:,14
149
***
AIMS COURSE DESRIPTION
***
PERMANENT FILE
JOB
210012
10/06/69 11.34.06
PAGE
1
1
A
COURSE 21
LESSON
1SEGMENT
1TYPE 1
CONSISTS OF I CARD.
RECORD
1
THERE ARE 12 OUESTIDN&, EACH OF UP TO
5 ANSWERS.
12 WILL BE GRADED.
THERE ARE
48 POSSIBLE SELECTIONS.
23
45
67
89
10
11
aA
AA
AA
AA
A
12
A
COURSE 21
LESSON.-1
-SEGMENT
1TYPE 2
CONSISTS OF
1 CARD.
RECORD
2
THERE ARE 16 QUESTIONS, EACH OF UP TO
5 ANSWERS.
16 WILL BE GRADED.
THERE ARE
64 POSSIBLE SELECTIONS.
23
4.
56
78
910
11
AA
AA_
A-
AA
AA
AW
13
14
15
16
AA
AA
03 O
COURSE 21
LESSON
1SEGMENT
1TYPE 4
CONSISTS OF 1 CARD.
RECORD
3
THERE ARE 24 QUESTIONS, EACH OF UP TO
5 ANSWERS., 24 .,1ILL.BE GRADED.
THERE ARE
96 POSSIBLE SELECTIONS.
_
25
67
89
10
11
B__.
CC
nA
DC
A8.
8D
13
14
15
16
17
IB
19.
20
21
22
23
DC
BC
A8
r_,'
C0
CA
COURSE 21
LESSON
1SEGMENT
2TYPE 4
CONSISTS OF
1 CARD.
RECORD
4
THERE ARE 24 OUESTIONS. EACH OF UP TO
5 ANSWERS.
24 WILL BE GRADED.
THERE ARE
96 POSSIBLE SEL-..TIONS.
.__
23
45
67
Et
910
11
CB
BA
CB
CA
CA
0
13
14
15
16
17
18
19
20
21
22
23
AD
DA
CA
0n
s0
a
12
C 24

**
.1.m.S. REPORT GENERATOR .***
REPORT
NuMRFR
5 ****
TIME
- 11771717
DATE
- Z2217771
PAGE NUMGER
COURSE STRUCTURE SUMMARY
VOLUmF
SEGMENT
COURSE NO.
TYPE QUESTION
TO FO
37
'COURSE NAME
PHYSICS 5211
OFSCPIPTIoN
PRESCRIPTION
ANSWEP
11
21
21
11
3045
G.C.F.
30-203-1-5/11-3-5/
50-91-1,2,5,7,8/40-59-1-8
I1
72
21
12
3066
L.C.M.
11-8-14/40-69-2-3/
500 - 754 -1- 9/40 - 221 -1 -3
A1
12
311
11
1055
NUMERATORS
40-21.9-1-6/
40-721-1-3/50-205-1-5
1- _
1__
4__..
1.1
17
1056
DENOMINATORS
30-193-1-2/
10-192-1-5/50-237-1-3
C1
15
12 21
3043
ORDERING LIKE FPACTIONS
30-186-1-4/500-214-1-5
11
?-.6
17 23
3078
ORDERING UNLIKE FRACTIONS
11-9-16/40-149-1-5
11
7'.
712 22
3044
ORDERING LIKE FRACTIONS
30-187-1-4./11-1-2
A1
17
'
9:._
,_ _
71
14
3049
MULTIPLY BY ONE
11-2-3/
50-71W-19-1-6
1-9
21 I7
1051
LOWEST TERMS
50-218-20-1- 8/11-2-4/11-1-6/11-3-5
I1
710
22 ?3
-4091
ADD LIKE FRACTIONS
40-719-1-3/50-236-1-2
71
21
21 11
1045
G.C.F.
50-90-1-1-8/
11-3-6/50-87-1-3
21
7n ,
21 1?
3066
L.C.M.
50-253-1-11/
50-757 1-5/50-297 -1-4
21
23
22 21
1081
'MING LIKE FRACTIONS
50-237-1-1/10-201-1-4
A2
12
12 21
1078
ORDERING UNLIKE FRACTIONS
11-0-16/50-215-1-4
C2
1Z.
12 21
3043
ORDERING Likr FRACTIONS
10-193-1-7/50-210-1-4
B2
12
12 72
3044
ORDERING LIKE FRACTIONS
11-1-2/30-186-7-1-4
E-:
,.
21
22!
14
3048
MULTIPLY BY ONF
50-221-1-6/40-151-1-2/40-152-1-2
A2
12_ .:
21_17
1051
FACTOr. NUM. AND DFNinm.
11-3,5/50-241-1-6
7 7
1 1
2
it)
2i
11
11
it
12
3055
1056
NHMFRATOR
50- 703 -7/
10-193-1-7/30-310-1-5
DENOMINATOR
50-705 7-5/
30-127-1/30-192-1-5
31
71
ti
18
1070
L.C.O.
30-206-7-1-6/
11-7-12/50-257-1-5/11-7-f
01
17
221 10
1093
EQUIVALENT FRACTION
11-2-4/.40-717-1-4/10-203-1-5
31
23
77 71
3089
ADDITION OF UNIT FPACTIoNS
40-735-1-2/30-201-1-4
AA
12
,4
27 77
1082
(ADD. UNIT AND COMMON FRACTI0N10-207-4-6/20-82-1-7
11
25
27 23
1001
ADDITION OF COMMON FRACTIONS 50-75071-2/400-221
1-3
31
76
2, 24
1094
AOOTTIEIN OF COMMON FRACTIONS 40-224-1-6/50-239-1-5
31
77
2? 25
1099
90-771-1-6/11-3-6/40-217-1-4/11-3-5
31
7R
12 24
1080
OR0FRING IMPROPER FRACTIONS
11-4-7/30-204-1/11-9-17
A1
79
23 32
1085
CHANGE 14PROP.FRACT.TO MIXEDC50-730-1-9/40-224-1-6
A3
12
10
23 15
3081
EQUIV. IMPR7P.FRAr_T:CMIXFO C 10-204-1-5/40-147-4-8
4I
71
.21
10
3093
EQUIVALENT FRACTIONS
10-IR5-1-6/11-2-4/11-2-3
41
72
7-1
19
1070
L.c.Q.
1n-194-1-3/11 9-15/ 11
7-11/11 7-12
41
73
77 22
10117
100.DNYT FRACT.CCOmMON FRAGT.60-749-1/30-201-1-4
47
427 71
3099
ADDITION OF UNIT FRACTIONS
1-3/40-219-1-3
17
577 73
1083
ADDING 60mmny FRACTIONS
53-4?,-2/50-421-3-4
A1
76
77 75
1099
SIMPLEST FriPm
50-218-1-4/
10-198-1-6/11 3-5/11 3-6
I7
'7
22 74
1094
AIOING COMMON FRACTIONS
50- 740 -2- 5/30 - 202 -1 -5
12
812 74
1090
TIRoFRING IMPROPER FRACTIONS
60-741-1-9/11-4-7
01
29
73 12
10135CHANGE IMPRop.FRACT.TOmIXED6 50-24D 1-4/50-238-1-4
D_...
1?
10
3 15
3011
FTJ1VALENT VALUES
50-240-7-5/50-238-1-4
A
r(41 OF PROCESSING

T
I
EXHIBIT "K"
PORT-A- PUNCH
5 Choice Format
...1.C.11.Y.
.AT..1 I COL1Plf TICNTIM E
MO t.).:7-..-.
YR. tiRs i MIN .,. .. , .. . : .... .
*v.SEC.NO. !Tn. taUM. STUDENT ID NO
,1
tz
1
.
,..
1225
t.:.
1.
le.
..%.,
1
.,...,4.......A.
o-1C1
iC1
C.:1
IL).
.
.
4
.4 .,
:I .2
li
f ,
,5
..: z:
Al
l......)
(15
-1,:i.,,
cr.,
Ital
-
4.1.
(21.
.q!
::
. 1
.:
.I .2
4
:
:,
...! 1,
1.S!.
c..->)
.
!XI
'-4Q
coVI;
,.
1-';1
.1; I
:1
2 2
4
.;
.5 51
5 'j
1 1
: 6
±',..!,..
.:-..
..
..;,1L..,
ii
/CD
4114
10...i__-'
2 -
2
1
4 4
5 5
G 6
1 7
:4
9
1,,,u'L
1-,;:i,
.'sCO,. -. ?
14'E,...
,..547,..
cs.1
Iril.'
!-:,:i
Sj1
1L)
-..,,
!c2i,
G
1 1
2 2
4
4 4
5 5
1 7
:: :'
e
...,..,
,
,Li.472-
l'A.:
i:.'1
f',2:h
IX.
!._1:!
0 6
1 I
2 2
4
- t:
i 7
: E.
F.:1-c.'f,
!:.
::.i
0...!611:11
I:Z.
C..:i
17,1
3
1 1
2 2
3 3
4 4
5 1
'-''
7 7
6
Ls:
:'":'
,'..')
ig3
.1!_,"7...,
it:i
.L.-.3
i',.:
1Z?
".-.;,
3 1-L
1 1
2 2
3 3
I 4
' .:
6 ,4*.
1'1
:: E.
7,:-tct.'.
; ::. .'.. . 1
I:
1.
L:'...c.-.
rri.s
f',.!
1;}
11:....
.
c o"..,.-!.$
.1 i
2 2
3 3
4 4
5 5
S '7 7
:-. F
I
i .:
%-::
I.,:T,1
-eflii....,
-i,?,
4;;;.
:Xi
.:4;
..3 61.-17.,:-----
1 i
2 2
3 3
4 4
E, 5
S 6
1 7
E 9
S 9
I;',i
'::%: ::
:::'......
."L.-,.3--
EILT.5.-.
jaf:1
i7g2
)...2
,.., .. -----1
1 !
2 2 2 2
3 2 3 3 -
= 4 4 4
5 5 5 :1
i S E 6 6
17 7 1 1
IS i 1., 2 8
_____ ___,0q; _ep:1,_ ,,,, 7-74-"-j-..., 1. 1 e d4 r._ 71F.-;:o a, J77r 32 -:--:;;iT. r.; '47 Z: 1.4 1.2-) liolViii .1--7- c1 ;;;;;* '..;. .1:,iTie: -- ilcc w i2ii. 741316770766-(PRINT I 1114 013245 - -- IN N
4 Choice Format
I
r.,..,-. 7DATE COm6LETIoN
MO 1 J II (Ft rt 1-1: m : N NG 60i
(21 :f2i14 TE:Tf,: 11. ,, 241 I .1.4 25 10 15 2 IN 3$ 12 44. I 5 SSI 1 l0 I...)
t t -.31lc) I IL,' I 1 i.
ct611 tt::4 I )
ID ti.),j til,I I
I I IItl 1 ill . i al ri:II I Id 11(21
L_.. i..._,J;:;-t
I ':(11, .
1, zi 6Q.5 : :6151 1144.1ei li el li d
11C l'i'l ar(L,
1 ,X).r) c.i . ....
,-- co., ..._.
IL)Cal-0 I
V1 T7 11 pi
1 1
c) lc)1
;(_);I
;1.3 : 1(..-) 'I .,,;(.;), I i, ,
4.) C....) I( -)
(1) II) "iical I Iasi II 1 iii :1)1 6:1 Ili.' :, Ili' iI I t
1
I 1, l'..z: .c.1 1..1:: 1..,: *1 0.1
...:,....,.. ;41..
.i
IN. Ir.,. ,r) .) 1 ,5;....i, ,, ,17.1
(PRINT, i: ..
:7 .4 24 iti I. 3. .0. :t3 37 3-3 i .- ' 3.
I
82
(.1 P
56 56
'
. I C.1
I
-2
1;1
4L1
*:0(NJ
:11
/1,)I. I
11 kl,
i ''l
,a)11._i
.
Ti:ii!
1(-)
'ILL!
1'61]
CO(.`,1
Ic..1
ti.11,,_
ii.Ni!dt
i:/
(r1
41:
v-.`",
C`-1
I
ID
.c\I0
13MF
80 67
':.., Ca
SEc
.-.I:r76 66
.5
.
:
(0
.-...::.76
.:
72
STUDENTID. NO
74 76 78 80
I
...
Ti S li1.105097
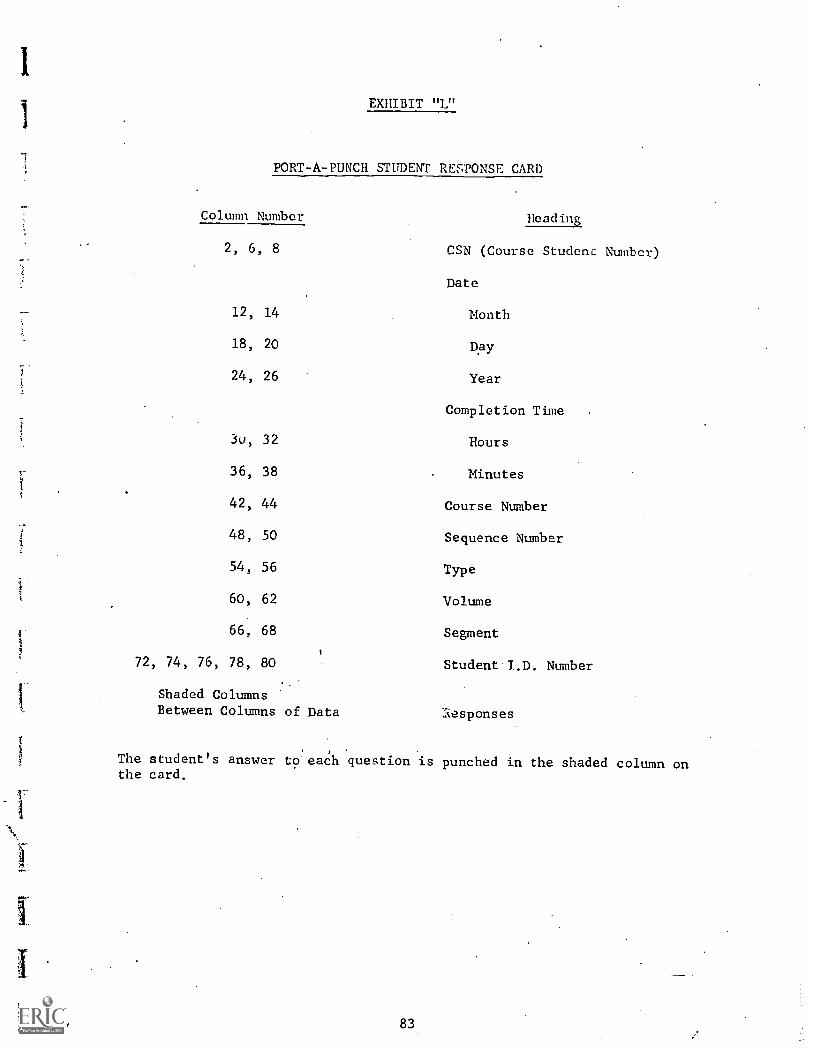
I'
EXHIBIT "L"
PORT-A-PUNCH STUDENT RESPONSE CARD
72,
Column Number Beading
2, 6, 8
12, 14
18, 20
24, 26
3u, 32
36, 38
42, 44
48, 50
54, 56
60, 62
66, 68
74, 76, 78, 80
Shaded ColumnsBetween Columns of Data
CSN (Course Student Number)
Date
Month
Day
Year
Completion Time
Hours
Minutes
Course Number
Sequence Number
Type
Volume
Segment
Student I.D. Number
'responses
The student's answer to each question is punched in the shaded column onthe card.
83

EXHIBIT "M"
Student Response OpScan Form
DATA CONTENT
Student Name
Data
Social Security Number
Course Number
Completion Time
Volume
Segment
Type
Page Number
The student fills in the answer by markingthe appxppriate box (multiple choice) with adark pencil.

EXHIBIT "N"
INSTRUCTIONS FOR COMPLETINGSTUDENT DIAGNOSTIC ANSWER SHEET
(STUDENT RESPONSE)
(Sample attached)
1. Print name in space provided (last name first).
2. Write date in space provided.
3. Write Academy student number below name.
4. Write Section Number below data.
5. Familiarize yourself with the answer sheet. Record your answersin pencil by placing a mark in the appropriate box. Note thatonly the first 31 responses apply to this diagnostic.
6. If the multiple-choice answers are A, B, C, D, use box 1 for A;box 2 for B, etc.
4

I
1
1 2 3 4 5
1 2 3 4 5
1 2 3 4 5
1 2 3 4 5
1 2 3 4 5
1 2 3 4 5
1 2 3 4 5
1 2 3 4 5
0
'22
?.!
1 2 3 1. 5
1 2 3 4 5
1 2 3 4 5
1 2 3 4 5
1 2 .3 4 5
1 2 3 4 5
1 2 3 4 5
1 2 3 4 5
ILCil
Z)
Cr:
00
11
12
13
114
JI
1 2 3 4
1 2 3 4 5
1 2 3 4 5
1 2 3 4 5
1 2 3 4 5
1 2 3 4 5
1 2 3 4 5
I 2 3 4 5
1 2 3 4 5 1 2 3 41 5 1 2 3 4 5
c. 34 3'?I 2 3 4 5 1 2 3 4 5 1 2 3 4 5
t;
43
4 5
1 2 3 4 5 1 2 3 4 55'. 1
1Cr,.L.1 ..
i1 C
......4 ..f L.R ;
CZ. . r...,
1: 4
1 2 3 4 5
1 2 3 4 5
1 2 3 4 5
I 2 3 4 5
57
58
59
60
1 2 3 4 ,5
1 2 3 4 5
1 2 3 4 5
1 2 3 4 5
1 2 3 4 5
831 2 3 4 5
1 2 3 4 5 1 2 3 4 5
77 821 2 3 4 '!
I 2 3 4 5
1 2 3 4 5
33
84
1 2 3 4 5
1 2 3 4 5
61
62
r3
1 2 3 4 5
1 2 3 4 5
1 2 3 4 5
1 2 3 4 5
611 2 3 4 5
r)
1 2 3 4 5
86.2 3 4 5
1 2 3 4 5
38'1 2 3 4 5
..I 2 3 4 5 1 2 3 4 5
(in
66
67
68
69
70
91
92
93
r.9i;
f) r.)
lJe.
I--
7
.,
71 l-F-
c0 ).:
,../ 1 IA
U),f)11,
21 0 0I.-
1.-
7.7: LT)40 1.)I
0 In :..) o 2:7_ < a Ct. Ct.
1 2 3 4 5 1 2 3 4
1 2 3 4 5 1 2 3 4 5
??I 2 3 4 5 1 2 3 4 5
'47;
1 2 3 4 5 1 2 3 4 5
1 2 3 4 5 1 2 3 4 5I;
1 2 3 4 5 1 2 3 4 .5
1 2 3 4 5 I 2 3 4 5
4 7
1 2 3 4 5 1 2 3 4 5
451 2 3 4 5 1 2 3 4 5
1 2 3 4 5 1 2 3 4 5
r1 2 3 4 5 1 2 3 4 5
71
1 2 3 4 5 1 2 3 4 5
721 2 3 4 5 1 2 3 4 5
731 2 3 4 5 1 2 3 4 5
74I 2 3 4 5 1 2 3 4 5
751 2 3 4 5 1 2 3 4 5
961 2 3 4 5 1 2 3 4 5
97I 2 3 4 5 1 2 3 4
93I 2 3 4 5 1 2 3 4 5
991 2 3 4 5 1 2 3 4 5

***
REPORT GENERATOR ****
REPORT
NUMBER 7
tt***
TIME
- 14.47.57
DATE
- 04/28/70
PAGE NUMBER
2
Mte
=S=
I5te
eSar
:112
1==
I.O. 'NUMBER
======b
STuDE%T -IDENTIriED ABOVE7-4S0EkrORME6BELOW-PRE-g--rel!riS Or-PERrORMANCE ON TERMINAL OBJECTIVEISI IN LESSON
L
PERFORMANCE DATA
T.O.
PERCENT
ERR
coTo-Fruvsl
21
833
22
833
33
14
33
41
10
33
41
833
51
27
31
52
50
33

egad
- M
INII
II-1
1111
11ili
tr-
dlitt
difk
****. A.1.M.S. REPORT GENCRATOR ***I.
REPORT
NUMBER 7
*.**
TIME
- 14.4E5.11
DATE
- 04/2B/70
PAGE Num,ArP.
TERMINAL OBJECTIVE REMEDIAL SUMMARY
LESSON
1TERMINAL OBJECTIVE
52
COMPOSED OF
4 QUESTIONS.
A TOTAL OF
1 STUDENTS PERFORMED BELOW THE CUTOFF LEVEL SET AT
33
FOLLOWING STUDENTS HAVE PERFORMED BELOW THE CUTOFF LEVEL-
NAMt OF STUDENT
I.D. NO.
PERCENT ERROR
-50

.I.M.S. REPORT GENERATOR ****
On
iii31
16O
NO
OW
REPORT
NUMBER 7
**4.4,
TIME
14.48.29
DATE
- 04/28/70
PAGE NUMBER
REMEDIAL SESSION - LESSON PLAN - LESSON
1
SESSION
1PP'r. AND/OR LOCATION
PROFESSOR SMITH - ROOM 100
TERMINA
JBJECTIVE
CUTOFF LEVEL
NO. OF STUDENTS
52
33
1

**** A.I.m.S. REPORT GENERATOR 444,**
REPORT
NUMBER 7
**PP
T! -E
14.48.45
DATE
--04/28/70
PAGE NUMBER
I
REMEDIAL SESSION ROSTER
LESSON
1
SESSION
I
PROF AND/OR LOCiTION
PROFESSOR SMITH
ROOM 100
TERMINAL OBJECTIVES
TERmiNAL UdJECTIVE NUMBERS
5Z
LEVELS SET AT
'HE TM:OWING 5IUOiNT
33
SIUUttii NAMEI
NUMBER
PERCENTAGE ERROR ON THE ABOVE TERM/UAL OBJECTIVES
'`:7, CF-'AIMS OUTPUT GENERATOR
23
50

#A-AA4
:kgia4,4
o/i424
.:04
"N.
v66' .A.1.m.S. REPORT GENERATOR ****
REPORT-NUMBER 15 ****
TIME
- ZUZZRZ
DATE
- ZZZUZZ2
PAGE NUMBER
1
ST
UD
EN
T
*** VOLUME SUMMARY ***
COURSE,
3 21
1VOLUME NO.
2THE ** SIGNIFIES THAT NO MATERIALS HAVE BEEN SUBMITTED FOR
PROCESSING
CS%
PRE.
STUDY
STUOY
STUDY
STUDY
STUDY
ASSIGN
HOE
POST
PERF.
Cum.
1ES-T---GDE(1)
GDE(21
GOE(3)
GDE(4)
008(5) -
- ---WOR-KrEST--1140E1-
AYE.
CAPL.
:SAWA
110.
76.
99.
74.
0.
0.
0.**
0.**
O.**
49.
41.
170.
(4
-1 P %N
1 T'OR
c
R
.1.J R L l. i
'
A D L F 4 :. 2
W Y.
I" \
YLE
AIR
A G
1 L A N D,,4
kilasR.
J
3
30.
IC.
P.:. 0.46
IC.
.i. t*
."t7
0.46
98.
98.
93.
97.
95.
85.
63.
30.
$4.
82.
- -0.**
0. **
98.
O.
0.
0.**
91.
0.
C.
0.**
100.
0.
0.
G.**
SC.
0.
0.
0.**
82.
O.
O.
0.**
54.
O.**
0. **
0.**
0.36*
O.**
0.**
50.
58.
56.
16.
146.
42.
139._
C M 04DGLAS
.
EE
4 5 ,
O.**
10.
0.**
60.
O.**
60.
0. **
40.
56.
34.
4.
141.
59.
132.
-OrYN
DELINE
6 7 : 9
49.
54.
41.
143.
21.
139.
0.*a
O.**
0.**
G.**
O.**
0.46
96.
85.
98.
0.
a.
0.0*
88.
-92.
89.
O.
O.
0.6,4-
83.
95.
.93.
O.
0.
0.**
STUL)ENT DOES NOT HAVE ANY MATERIALS T(3-TE-PROCESSED
100.
99.
99.
0. **
O.
O.**
O.**
40.
O.**
60.
0.
55.
47.
I57-.--
58.
142.
4i.-
- P -"-*
1)-1 -a =
C.') 8Z
...
ASE
10
11
-0.
' O.**
------THIS
O.**
--0.-**- -30.
55.
60.
-53.
54.
2.
54.
1..4...
T2 13
0. **
40.
74.
35.
- ;NCJI
.,
0. 0.
',.
%
.. A a 1.. u
,., L E '4
L C r
;311K
JAmIN
4
15
.
20. 0;46
0.**
).
89.
O.**
O.**
sn.
O.**
81.
94.
81.
O.**
O.**
.O.
4.
.**
94.
O.**
0.**
O.**
4..
.,
..
28.
20.
70.
Jo.
20.
S AH
16 IT
91.
0:
-0-
-0.**
88.
O.
O.
O.**
u.**
SO.
0.**
60.
42.
42.
43.
0.
i-r.
--53.
16-.7-
27.
YD -
Y
13 19
-0.6*
0.**
0.**-
O.
-O.
-0:**-----0.**
10.
0. **
O.
O.
O.**
0.**
20.
A t. -
P .ISI-H
A I :
1 ': L ,
,-, I 4 (
4 A
BELLE
A--
-
R.
20
21
--22---2A.
.23
40.
0.**
0.**
C.**
6').
71.
'
O.**-- 15.- ---
40.
O.**
O.**
60.
---roo:
O.**
40.
76.
0. **
100.
O.
O.
Q.**
42.
O.
O.
0.**
0.66
20.
0.**
O.**
33.
36.
28.
26.
0.6A
-0.
O.
0.4-Z!
07*-4-----60.
O.**
0. **
0.**
o.**
O.**
0.**
5.
46=--
O.
37.
'4 LEROY
74
25
97.
----0.
0.
0:-**----0-.-4147---80.
78.
0. **
0.
O.**
0. **
O.**
44-:-----757,----15A,
51.
27.
''2.
L :.
% C
' : % r
(1; :
AYIN
1-8:.
27
).
0.**
0.64-
0.**
-10.
20.
..
D.**
O.**
Z.-44,-
cr.-4,z.----7:7-.
0.**
O.
--87.
95.
100.
10.
794.
...**
fl.7',.
S.
4.
4.
1
50.
0.
0.
0.0,*
J.
.
0.**
50.
U.4*
0.**
0. **
60.
.
16.
23.O.
43.
36.
' slt 49
4.
120.-
41.
125.
43.
265.
33.
152.
30.
133.
21.
151.
28 29---o-7,
u.
0.**
O.**
0.**
O.
0. **
A
3031
85.
-0.
0. ----0.**
0.**
0.**
0.
O.** __
___*
e00
0°
Z5.
10.
0. **
1C.
Ili
4
:*...
)
35 1:--
-11*
*
**
..IE
.
86.
0.O
a0. **
____
r*io
:0
50.
37
20.
46.
3.
____
1...
17;
32.
151.
-----.:76.
74.
75.
000
.t.:3
0
97.
0.
0.
0.**
pg ..
.
0. **
0.**
u.6
60.
...
49.
71.
3: 4
31'
30.
I.
58.
14k.
3.
U.
Si.
O.
0.
0.64

3. PERFORMANCE DATA ANALYSIS FOR COURSE REVISION AND OPTIMIZATION

3.1 SYSTEMS DESCRIPTION
SYSTEM MANUAL
Annapolis Evaluation
INTRODUCTION
This document is intended to describe the structure and opera-
tion of the Evaluation System generated for use with Annapolis
data files. The system has been designed to isolate, subject
to constraint, desired variable subsets and to perform a wide
range of statistical analyses and tests pertinent to evalua-
tions of experimental results.
II. STRUCTURE
The Evaluation system consists of three major components.
Data Files containing all information generatedin the course of the experiment.
Accessing Routine - Program for generating anyconstrained subset of data from the files.
Statistical Routine Permits user selection ofdesired statistical tests and summaries pertinentto data evaluation.
DATA FILES
All information gathered in the course of the experiment is
contained in eight master data files. The structure of these
files is listed in Table II.1 - 11.8 as well as array dimen-
sions needed to write out the fields and frequency of recording
data (See Appendix 1).
93

11.2 ACCESSING ROUTINE
11.2.1 OPERATING CAPABILITIES
This segment can be defined rs the interface between the user,
the data files, and the statistical components of the system.
Its purpose is to retrieve information from the files to the
degree of specification or constraint required by the user.
The system is able to:
A. Retrieve the observations stored on any one or
more than one requested variable. These requested
variables may be of:
i. The same type; i.e., student average con-
fidence for posttest A, for posttest C,
and for posttest I--here student average
confidence is the variable and there are
three variables of the same type requested
for each posttest.
ii. Different types; i.e., retrieve average
student, confidence and the average student
log confidence for posttest A--here there
are two variables, average student confi-
dence and average student log confidence.e
B. Treat all constraints on variables sequentially in the
order that they are imposed by the user. There are
two types of constraints, descriptive constraints
and limiting constraints. (The descriptive con-
straints should be specified first sequentially by
the user.)
94
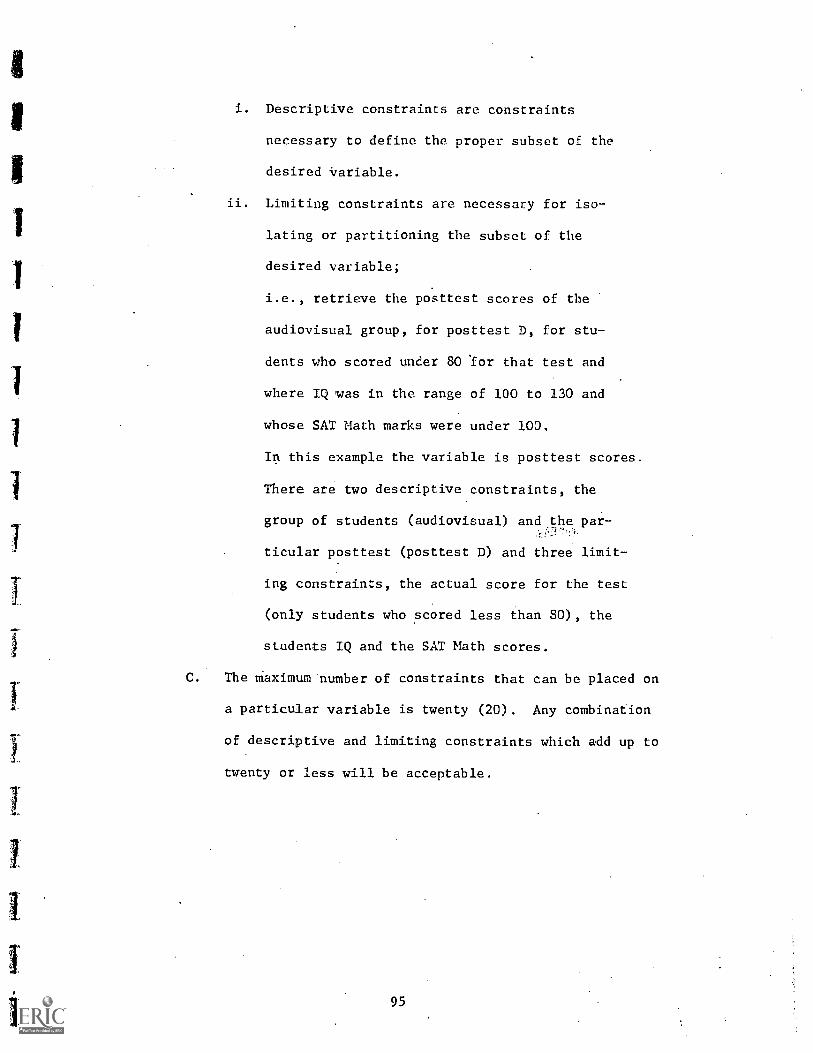
i. Descriptive constraints arc constraints
necessary to define the proper subset of the
desired Variable.
ii. Limiting constraints are necessary for iso-
lating or partitioning the subset of the
desired variable;
i.e., retrieve the posttest scores of the
audiovisual group, for posttest D, for stu-
dents who scored under 80 for that test and
where IQ 'was in the range of 100 to 130 and
whose SAT Math marks were under 100.
In this example the variable is posttest scores.
There are two descriptive constraints, the
group of students (audiovisual) and the par-
ticular posttest (posttest D) and three limit-
ing constraints, the actual score for the test
(only students who scored less than SO), the
students IQ and the SAT Math scores.
C. The maximum number of constraints that can be placed on
a particular variable is twenty (20). Any combination
of descriptive and limiting constraints which add up to
twenty or less will be acceptable.
95

II. 2.2 USER INPUT
The following is a definition of user input required for
retrieval of data
X - the quantity X is the variable Under
consideration, for example, post scores
or average student confidences
Zi - where. i can go from 1 to 20. The quan-
tity Zi is the ith parameter
either limiting or descriptive, to be held in constraint
in a definition of the group X.
Ali - the lower limit for the ith constraint
Ali the upper limit for the ith constraint
such that
Ali < Zi < A,'
For each variable, the user must provide a variable
definition card containing the numerical value of X
and alphanumeric information which will be a defini-
tien of X. For each constraint (limiting or descrip-
tive) to be placed on that variable, the user must pro-
vide one card containing the numerical code for the Zi
and the upper and lower limits under which Zi will be
held, Ali and 'A21 and alphanumeric information descrip-
tive of the constraint.
The above definitions are straightforward when the user
requests a single set of data. When, however, he wishes
to retrieve more than one group, each group must be separ-
ately defined by a variable definition card and a set of
constraint cards pertaining to that group.
961

II. 3. STATISTICAL ROUTINE
II. 3.1 OPERATING CAPABILITIES
It is the purpose of this portion of the system to per-
form required statistical tasks on the accessed data as
specified by user input. In the performance of these
tasks the system will
A - set an output "Flag" if the user re-
quests a listing of the accessed data
B compile a list of statistics (i.e., mean,
standard deviation, range, etc.) to be
computed in the statistic generation
routine. The sources of this liSt are
the direct and indirect commands by the
user.
i - The direct commands require a card
input by the user identifying each
statistic to be computed.
ii The indirect commands result from the
user specification of a statistical
test to be performed (i.e., if the
user determines that a "t" test should
be performed on two sets of data then
the means, standard deviations and sample
sizes of each of the sets are computed
and entered in the call statement for the
"t" test subroutine. These three statis-
tics will then be compared to the existing
97.

list of statistics and added to that
list as required).
C - Call the statistic generation routine, indi-
cating in the call statement the statistics
to be computed and whether or not a listing
of the data is requested by the user.
D - Call each of the requested statistical sub-
routines, setting in the call statement the
magnitude of the statistics which have been
computed for that test.
II. 3.2 USER INPUT
There are three types of user input required for the selec-
tion routine:
A. A zero-one indication for "no-listing" of the data
that is being processed.
B. A list of all statistics to be computed (this is
required only for direct statistic specification
described above). Table II.10 contains list of
possible statistics that can be computed for a
single variable, and Table 11.11 those statistics
applicable to two variables.
C. A list Of statistical tests to be performed on
the accessed data. Table 11.12 contains a list
of possible tests, as well as a summary of in-
ternal quantities calculated for each test and
transmitted to the particular test subroutine.
98

TABLE II.10 - STATISTICAL COMPUTATIONS
- SINGLE VARIABLE
1 - Count to count the number observations in a set
2 - Sum of the observations
3 - Sum of the squares of the observations
4 Mean Value of the set
5 -.Variance of the set
6 - Standard deviation of the set
7 - Minimum and maximum values of the set
8 Range of observations in the set
9 - Ranks of each observation in the set
TABLE II.11 - STATISTICAL COMPUTATIONS
TWO VARIABLES
1 - Sum of crossproducts of two variables
2 - Correlation coefficient between two variables

TEST DESCRIPTION
Student's t Test
F Test'
TABLE 11.12
AVAILABLE TESTS AND ASSOCIATEDINTERNAL STATISTICAL COMPUTATIONS
ADDITIONAL DATASTATISTICS TO BE COMPUTED TRANSMITTED
Sample sizeMeanStandard deviation
None
Sample size NoneStandard deviations
One-Way Analysis No. of groups to beof Variance tested; for each group:
sample sizesum of observationssum of the squares of
observations
Wilccxen signed Sample size for each Set of observa-
Rank Test group, tions to betested
Kendall coeffi- No. of groupscient_of concor- Sample size of each groupdance The rank of observations
within each group
Chi-Square Test No. of groupsNo of cells in each groupNo. of observations in
each cell
Cochran's Test Sample sizeStandard deviations
Least SignificantDifference Test
Sample sizesMeansVariances
100
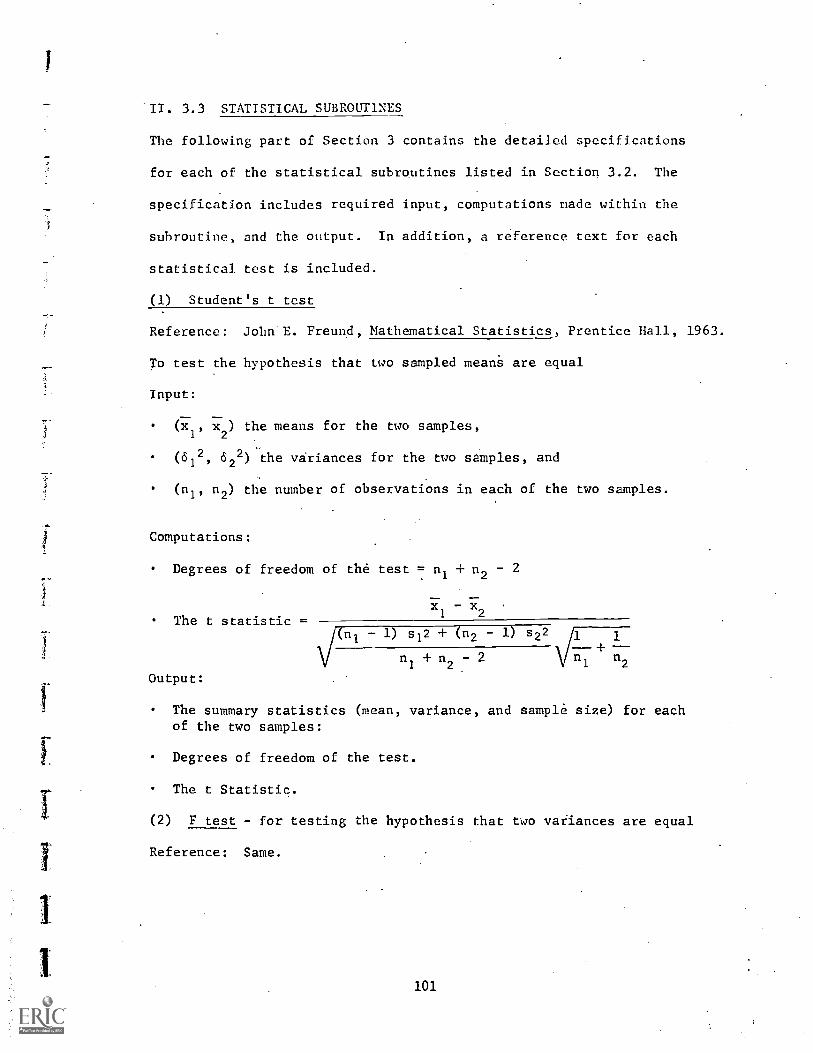
II. 3.3 STATISTICAL SUBROUTINES
The following part of Section 3 contains the detailed specifications
for each of the statistical subroutines listed in Section 3.2. The
specification includes required input, computations made within the
subroutine, and the output. In addition, a reference text for each
statistical test is included.
(1) Student's t test
Reference: John E. Freund, Mathematical Statistics, Prentice Hall, 1963.
To test the hypothesis that two sampled means are equal
Input:
(xl, x2) the means for the two samples,
(612, 622) the variances for the two samples, and
(n1,
n2) the number of observations in each of the two samples.
Computations:
Degrees of freedom of the test = nl + n2 - 2
The t statisticx -
1
x2
- 1) s12 + (n2 - 1) s22 \./1 1+n1 + n
2- 2 11 11
1 2
Output:
The summary statistics (mean, variance, and sample size) for eachof the two samples:
Degrees of freedom of the test.
The t Statistic.
(2) F test - for testing the hypothesis that two variances are equal
Reference: Same.
101

Input:
1
2(s the variances for the two samples, ands ' 2
2)
(n1, n2) the number of observations in each of the two samples.
Computations:
F statistic -Maximum (s12, s22)
Mininum (s12, s22)
Degrees of freedom of numerator = ni - 1, where i is equal to one
or two, corresponding to which of the two sampled variances is the
largest.
Degrees of freedom of the denominator = ni - 1, where i corresponds
to the smaller of the two.
Output:
The summary statistics (mean and variance) of the two samples.
The F statistics.
The degrees of freedom of the numerator and denominator.
(3) One-way analysis of variance program
Reference: Johnson & Leone, Statistics and ExperiMental Desizyl, John
Wiley, 1967.
Input: Each of the h vectors to be compared
t = 1 t = 2 h
1 0. 1 X11 X21 -hl
= 2 X12 X22 Xh2
n Xln X2n Xhn
102

Compute:r n
xl., x2., X. where xl. = X,
S1= SQRT
GTI =
G = (nh)
GT =
E
i = 1
h
E
t = 1
-1
(n)-1
(Xli - x1.)'/
nE x 2
tii = 1
h nE E
t = 1 i = 1
h nE
t = 1 i 1[ !
, x11
Xtl
Xti
2 .4. x 2 .4. .4. x 212 hn
2
(n) -1 X11 X12 Xln)2 (Xhl Xhn)2)
Oytput:
Listing of data in columns, listing of mean and standard deviation of
each column at the bottom of each column.
Table of the analysis of variance as follows:
One-Way Analysis of Variance of the Measured Parameter
SourceSum of,Squares
DegreesFreedom
MeanSquare F -Ratio
Total
Between Groups
Within Groups
GTI -G
GT-G
GTI -GT
nh-1
h-1
nh-h
GT-G
GT-Gh-1
GTI-GT h-1nh-h GTI-GT
nh-h
(4) The chi-square test - for K independent samples
Reference: Siegel, Non-Parametric Statistics, McGraw-Hi11, 1956.
N
103
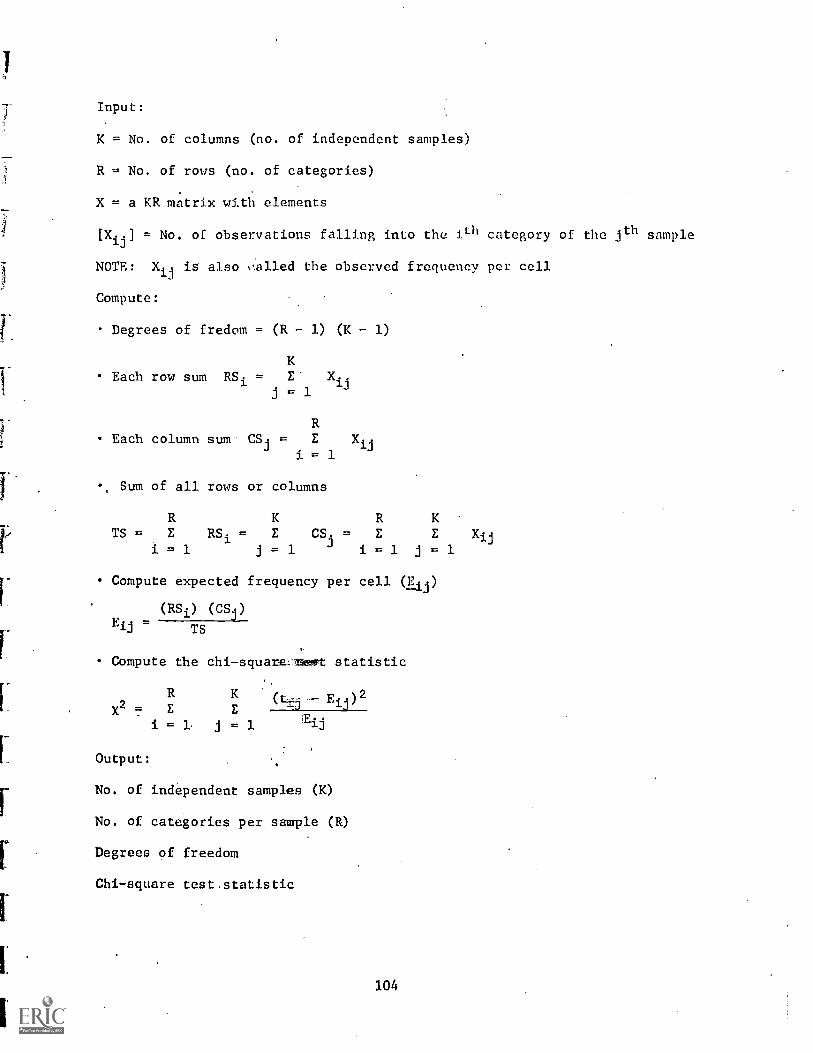
Input:
K = No. of columns (no. of independent samples)
R = No. of rows (no. of categories)
X = a KR matrix with elements
[X..] = No. of observations falling into the ith category of the jth sample
NOTE: Xij is also called the observed frequency per cell
Compute:
Degrees of fredom = (R - 1) (K - 1)
KEach row sum RSi = E Xij
j = 1
REach column sum CS.
J= E Xij
= 1
Sum of all rows or columns
R K R KTS = E RSi = E CS. = E E Xij
i = 1 j = 1 i = 1 j = 1
Compute expected frequency per cell (E.j)
(RSi) (CSj)Eij -
TS
Compute the chi-squarelTmeot statistic
X2 = E E, Eij ) 2
= j = 1 EJ
Output:
No. of independent samples (K)
No. of categories per sample (R)
Degrees of freedom
Chi-square test statistic
104

(5)- Kendall coefficient of concordance - to compute the concordance
(agreement) between K rankings of a set of information
Reference: Siegel, Non-Parametric Statistics, McGraw-Hill, 1956.
Input:
X-matrix which can 1!.! CA ! I set of K vectors of observations or ranks
of observations. The num!), of observations in each vector must be equal.
N = No. of subjects ranked.
K = No. of different rankings
NOTE: The numerical value. of the elements will probably be something
other than ranks (i.e., test scores).
Computations:
Convert each of the column vectors into a column vector of ranks; i.e.,
if X.. (ith element (row) in the jth column) is the minimum value in that
column, then it :s assigned a ra=1, rij = 1.
If Xij is the maximum value in thE column, then it is assigned a rank,
rij = N.
The remaining rfiiiies for ranking and for settling ties,_axe exactly the
same as for theTigilcoxen signed rank test.
NOTE: Each col.= must be'ranked independently of the other columns.
The resulting mix (noted R) is
R =
r11
r21
r1K
rNlrNK
105
Where .rij is the rank of
Xij - the rank of the ith
jth column.element in the

Compute:
K
= E r..a
j = 1
NE Ri
=Al = R3 . -
Compute:
E(t3 -T. -
.312
and (A1) 2
t = no. of observations.in a group tied for a given rank. The compu-
tationofT.J is best exvlained through an example:
j = 1 j = 2 j - 3= k
i = 1 1 2.5 2
2 4.5 1 1
3 2 2.5 4.5
4 4-5 4.5 4.5
5 3 4.5 4.5
6 7.5 8 4.5
7 6 9 8
8 9 6.5 6
9 7.5 10 8
i = 10 = N 10 6.5 10
For j = 1 there are two sets of rank ties, each containing two ties,
i.e.,, 2 - 4.5's
2 - 7.5's
(23 - 2) (23Therefore, T1 =
122)
- 1
106

IFor j are three sets of rank ties, i.e.,
2 2.5's
1Z-- 4.5's
(23 - 2) + (23 - 2). + (23 - 2)Therefore, 1.512
For j = trauma:re are two sets of rank ties,
.1
(43 - 4) (33 - 3)Therefore. 12
Compute
Compirt--'.S-=----=
Kendalni_ :.c(;itEfi_cient of concordance
N -ltimo 200 i0P
N
-K E TJj- 1The tesZ ..F4---gristic is the chi-square
chi test .-.tztis tic (C) = K(N - 1)W
degzff freedom (DF) = N 1
Output
Alphabe=3:t:±dies- crihifitiian of the data
Lis tiLT-thr7..2e jut :matrix a
Listing ffrer riled -matrix R and the computations R1, Ai, and
Ti .
107

j= 1 2 3 R. Ai
i= 1
N
rll
r21
r12 r13 r1K
rNK
1
RN
A1
AN
T.3
T1
T2 TK
Kendall rank coefficient of concordance (W)
Chi-square test statistic (C)
Degrees of freedom (DF)
(6) Wilcoxen matched pairs signed rank test
Reference: Siegel, Non- Parametric Statistics.
Input:
Two vectors (sets) of numbers:
Set A Set B;
X11 X2L
Xi? x
X1n1 X217:
Computations:
Count the number of items in each set,
n1 = no. in Set A; n2 = no. in Set B.
NOTE: If ni = n2 set ni = N'
If n1 V n2, terminate the subroutine wildithe following message
and output:
108

ERROR MESSAGE: "sAmrus A AND B ARE NOT OF EQUAL LENGTH WILCOXEN SIGNED
RANK TEST REQUIRES A COMPLETE SET OF MATCHED PAIRS OF DATA"
Compute the differences (di) - where di = Xli - X2i
Compute the absolute value of differences Idil
Numerically order the 1dilby magnitude
Compute dummy ranks by assigning 0 when Idil = 0 and by assigning
the numerical count to the remaining ordered Idil > 0
Compute actual ranks via the following rules:
L. Idil =,.0; rank.
if Idil - 11 matd 1d11 1di I_ 11 ; rank = dummy rank
1:41.1dil d1 1dii = Idi 11 or both, count the
nedber of that are equal to B, sum over- the associated
clammy ranks:, then
attnal sum over dummy ranks
(see _exampli=s A and B on previans page)
Signed-ranks --.12:,,oc-iat-e---.the sign of the anEginal difference (plus or
minus) to the actUal-ranks
Sum up the positive ranks= T1
Sum up-the negative ranks = T2
Determine T = minimum (TI, T2)
Determine N = N' - number of pairs having a_rzero difference
Computer pT -N(N + 1)
N(N 1) (2N -F 1)aT 24
Z - aT
T- PT
109

1
Output:
List of the two input vectors X1 and X2
The sample size for each vector
Wilcoxen Signed Rank Test
Data table:
Differ- SignedSet A Set 13 ences Ranks Ranks
X11 X21 dir1 ±ri
X12 X.22
d2 .r2
X1N X2N dN rN ±rN
-.Number of pairs (N')
Nuniber of pairs with zemo difference
Test sample size (N)
Sum of positive ranks Cr) I
Sum off negative ranks (T2)
Small sample size test statistic (for cases when < 25)
Wilcoxen test statistic (T)
Large sample size test statistic (N > 25)
Meam (PT)
Standard deviation (dT)
Normal approximation - Wilcoxen test statistic (Z)
(7) Cachran's Test - to compare K variances for homogeneity.
:Reference: Statistics gftd,Mkgerimental Design, Johnson & Leone, Wiley
197.
lb test the hypothesis that K sampaed variances are estimates of the
SEM populations variance.
no

Input:
(S1, S2, . S K) - tho ,lard deviations is 0:Ich of the
K samples
(ni, n2, nK) the sample sizes for each of the K
samples
Computations:
Compare K sample sizes for equality.
ni =.112 = -= nK = N
Degrees of freedom = N - 1
Cochran test statistic
MAXIMUM SC -
E St
t = 1
Output:
Summary statistics, sample size and standard deviations for each
of the K samples
The Cochran test statistic.
(8) Least Significant Difference Test - to compare K means for equality
Reference:, Experimental Statistics, M.G. Natrella, AMCP 706-110.
Input:
(S12, S22, ..., Se) the variances for each of the K samples
(X1, X2, . . . , - the means for each of the K samples
(nl, n2, nK) - the samples sizes for each of the K samples
Computations:
- 1) Sit + + fitx 1.1) S K2pooled variance Se2 -
(n1 4' + nK) K
harmonic sample size aa- K.
Kdegrees of firimmdbm = I (ni - 1)
= 1.

I
w = maximum difference Letween any two of the K means
q = maximum difference converted to units of the standardized range
statistic
x w
q
Output:
Summary statistics including Se?, nil, v, w, and q.
Table of differences between means.
119

APPENDIX 1
AIMS DATA FILES
113
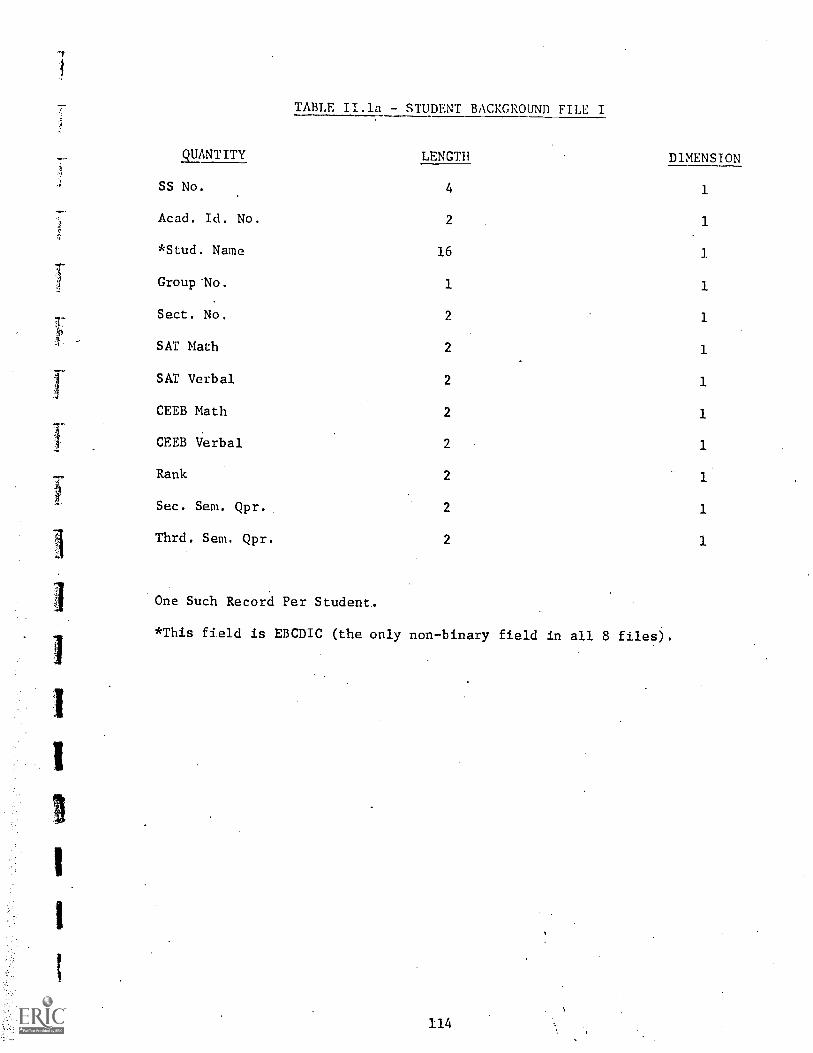
TABLE II .la - STUDENT BACKGROUND FILE I
DIMENSIONQUANTITY LENGTH
SS No. 4 1
Acad. Id. No. 2 1
*Stud. Name 16 1
Group*No. 1 1
Sect. No. 2 1
SAT Math 2 1
SAT Verbal 2 1
CEEB Math 2 1
CEEB Verbal 2 1
Rank 2 1
Sec. Sem. Qpr. 2 1
Thrd. Sem. Qpr. 2 1
One Such Record Per Student.
*This field is EBCDIC (the only non-binary field in all 8 files

QUANTITY
TABLE II.lb - STUDENT BACKGROUND II
DIMENSION.
1
LENGTH
OSPE
OSPE
OSPE
OSPE
Strong Sc 1-
Strong Sc 2
Strong Sc 65
tPP 1
EPP 2
EPP 16
Results of PhysicsValidation.Test
2
2
2
2
2
2
2
2
2
2
2
2
2
2
2
2
2
4
4
4
4
65
65
65
65
65
65
16
16
16
16
16
16
This is a continuation' of the first file.
One Such Record Per Student.
1151.

TABLE TI.2 - STUDENT PERFORMANCE I
QUANTITY LENGTH DIMENSION
Stud. Id.
Group No.
2
Sect., No, 2
Vol. 1
No. Ques. 2
Corr/Inc. 1 20
Conf. 2 20
Log Conf. 2 20
Diff. 2 20
Tot. Corr. 2
Avg. Conf. 2
Avg. Log Conf. 2
Avg. Diff. 2
Sort Stud. Id., Vol.
One Such Record Per Volume Per Student.
116

1
1_UANTITY
TABLE TI.3 - STUDENT PERFORMANCE T1
DIMENSIONLENGTH
Stud. Id. 2
Group No. 1
Sect. No. 2
Vol.
No. Ques. 2
Corr/Inc. 20
Conf. 2 20
Log Conf. 2 20
Diff. 2 20
Tot. Corr. 2
Avg. Conf. 2
Avg. Log Conf. 2
Avg. Diff. 2
Sort by Stud. Id., Vol.
One Such Record Per Volume Per Student

QUANTITY
TABLE 11.4 - STUDENT PERFORMANCE III
DIMENSIONLENGTH
Stud. Id.' 2
Group No. 1
Sect. No. 2
Corr/Inc. 1 60
Tot. Corr. 1 2 6
Tot. Corr. 2 2 6
Tot. Corr. 3 2 6
Tot. Corr. 4 2 6
Tot. Corr. 2 6
Sort by Stud. Id.
One Such Record Per Student.
118

TABLE 11.5 - MATERIAL RATING I
QUANTITY LENGTH
Vo. 1
Div. Nos. 2
No Yes 2
Term Obj. 2
Item Class 2
Cocc/prin 2
Sort by Vol.,
One Such Reconal Question Per.Volume.
119

111
TABLE 11.6 - MATFaAL RAJ
DIMES PON71E:rr7 LENGTH
1
2 3
2
1 .7-ri 2. 20
2 20
2 20
Fa:. 2
Littimg TL: ff. 2
41411. c or_ ng 1 2 20
2 20
2 20
Ezmr 7 2 20
o. car..rtr" rg Cone. 2 20
_No.. 5'oring TO 2 20
Sy Vol., Div. No.
One SutnRemord Per Question Per Volume.
120
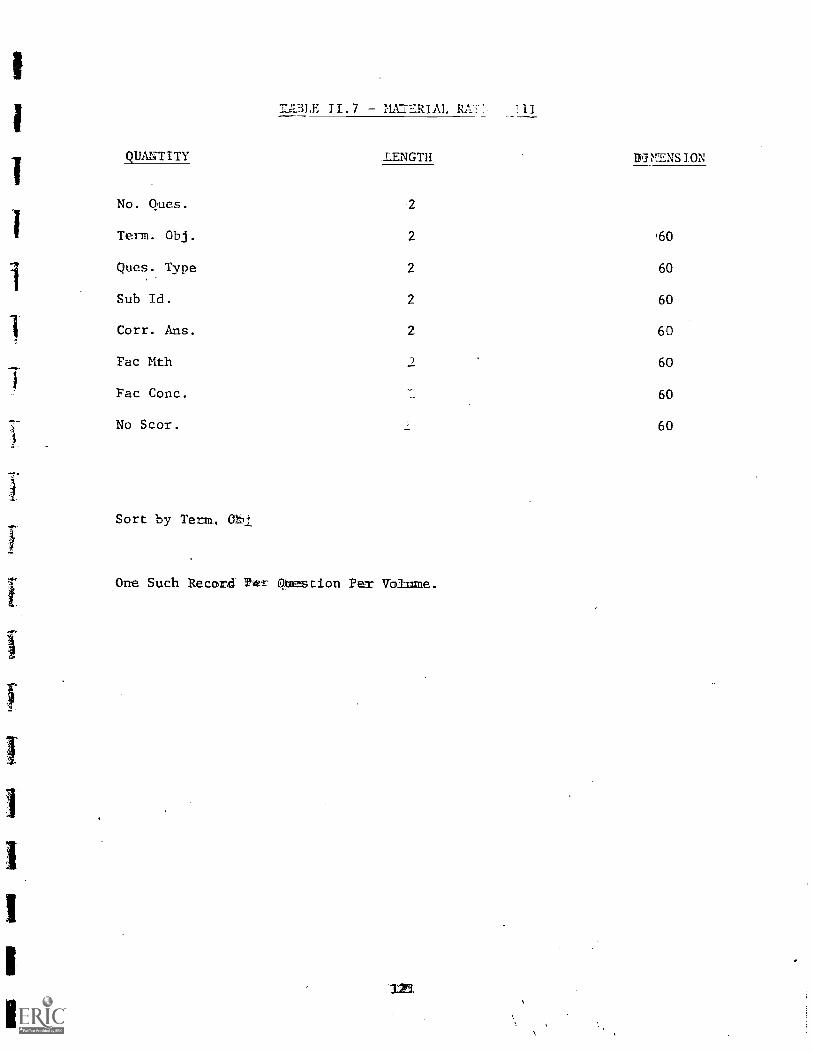
7,1;=ILE 11.7 MA=RIAL RAT'
QUANTITY LENGTH DgMENSION
No. Ques. 2
Term. Obj. 2 460
Ques. Type 2 60
Sub Id. 2 60
Corr. Ans. 2 60
Fac Mth 2 60
Fac Conc. 60
No Scor. 60
Sort by Tem.. 0*-1.
One Such Record Tel- Obestion Per Volume.

QUANTITY
TABLE II.8 STUDENTS TI.n7
LENGTH DIMENSION
Stud. Id.(Acad. No ) 2
Group No. 1
Week. No. 2
Stud. Time 2
Mean Time 2
Overall Time 2
Sort by Stud. Id., Week, Group No.
One Such Record Per Volume.
122

3-2 USER'S DESCRIPTY-,
.AO;NNIII.71.2::.:: EVALUATION SY77'.
VOL_ 2 - MSER'S MANUAT.
I. INTNODUCTION
This document is IntamdetTE to provide time infiation necessary
for the preparatTon of input to the Annapol-,, Evaluation Sys-
tem. For a description of the contents of le 'system as well
as a description of she mature of the test _Invoi-ved, consult
the "System Manual - Annapolis Evaluatiot "
II. -USER INPUT SPECIFICATIMN
A complete user input specification consirrc of We fundamental
input data blocks.
Accessing Input - needed to defin e the cowstr7ined data
subset to be used Lox evaluation.
Statistical Input needed to definE the statistics :and'"
or tests to be performed.
II-1 ACCESSING INPUT
Accessing input consists el naming the nesired variable as -Peal
as specifying the coustraints which serer to de=inP the data
subset.. Et= each 1=ousttraint a separate camod wawa be submierred.
There is an alIbmaiblE maa±mum of 20 diffeaunart <40.11smeraints "far
each vector of_ crumpet Aituta.
The first of each sett,aff conditions is theavaraterl variable and
each successive card Wines one constraint- The funmmat is as
follows:
123
I

FileACDimensionDimension:MinimumMaximumToilume
2
Co.-=ns: 1
3 4
6 - 79 - 10
12 14
1.6 1820 21
1:77 File, AC, DimenT- )1: 1, and Dimensir _ are described on
the following pages.
Iffimilmums and maximums the lower air__ Erpper bounds desired
by +=he mset. The compur:- - will use 07-7: minimum as the lower
bammd and the maximum a the upper boumr1 (i.e., they will be
usel2 im the test, and if one is hit, th te,-.1: will be consid-
ereol_stuccessful). Vol mme selection goes 1-15 covering
volomes A thrangh 0.
If n alphabetic chat is wanted as eirher an upper or
lower bound, its eartvaleut number must be used where A = 2,
13 = 72, Z = 26, Ys +71 the ura_i_ desiznatam
Mar signify one set .D.f its is over, the u.--elarnst put a nine
aim tie- file pol-immlemd leave the rest of Ile card blank.
rthalis utme mien m aseE -even if erk user is_epecifying the maxi-
nmmeher of tests (t-e., 20).
Ile ifkranOWSKIMIrees-* give the File, AC, aimemsion 1, and Dimen-
imam 2-Fivy-mnrin -ieceJaf information A dash signifies that
t particular fie1id-4annot be used in a test.
1MY1j 1: The input rarmmemt be liar sequeece order, ascending
according to the files filast, all the teats for file 1,
ithemljal 2, etc.). ftwever, the First c_ waist designate the
wennEd variable regardffiess of what file it Is contained; =in (i.e.,
card Is no it/minded in the aforementtaned sequence).
124

NOTE 2: For a given variable constraints can be cf,:firied on
either files 1-6 or t .iterial rating files), but not both.
125

File AC
1
2
Dim 1 Dim 2 Field
1
1
SS Number
Academy Number (Id.)
1 Student Name
1 4 Group Number
1 5 Sectio n NMmber
1 6 SAY Math
1 7 SAT Verbal
1 8 CEEB Math
1 9 CEEB Verbal
1 10 Rank in Class
1 11 Second li Semester Qpr
1 12 This'd. tester Qpr
1 -1 1 OSPE #1
1 -1 2 iOSPE.5#2
1 -1 3 ;OSPE on
1 1 4 OSPE #4
1 -2 1 - 65, Strong. Scores (1 - 65)
1 -3 1.- 16 Edwards Personnel PreferenceWs I - 16)
1 13 Itsysics Valldiation Test Re-sults
COMMENT :
This record occur :sauce per-stualPnt and is warted by student Id.
12E

File AC Dim 1 Dim 2 Field
2 1 Student Id
2 2 Group Number
2 3 Section Number
2 4 Volume
2 5 Number Questions
2 -1 *1 - 24 1 Correct/Incorrect
2 -1 *1 24 2 Confidence
2 -1 *1 24 3 Log Confidence
2 -1 *1 24 4 Difficulty
2 6 Total Number Correct
2 7 Average Confidence
2 8 Average Log Confidence
2 9 Average Difficulty
*This corresponds to the question number since these four fields
occur for each question.
COMMENT:
This record occurs one per question and is sorted by Student Id.,
Volume.
127

File AC Dim 1 Dim 2 Field
3 1 Student Id.
3 2 Group Number
3 3 Section Number
3 4 Volume
3 5 Number Questions
3 -1 *1 - 24 1 Correct/Incorrect
3 -1 *1 - 24 2 Confidence
3 -1 *1 - 24 3 Log Confidence
3 -1 *1 - 24 4 Difficulty
3 6 Total Number Correct
3 7 Average Confidence
3 8 Average Log Confidence
3 9 Average Difficulty
*This corresponds to the question number since these four fields occur
for each question.
COMMENT:
This record occurs once per question and is sorted by Student Id.,
Volume.
128

File AC Dim 1 Dim 2 Field
4 1 Student Id.
4 2 Section Number
4 -1 *1 64 Correct/Incorrect
4 -2 1 Total Correct Subtest #1
4 ;-2 2 Total Correct Subtest #2
4 -2 3- Total Correct Subtest #3
4 -2 4 Total Correct Subtest #4
4 -2 5 Total Correct for Test
*This corresponds to the question number since this field appears for
each question.
COMMENT :
This record occurs once per question and is stored by Student Id.
129
I

File AC Dim 1 Dim 2 Field
5 1 Volume
5 -1 1 - 3 Division Numbers
5 2 Number of Questions
5 -2 1 Qustion Number
5 -2 2 Form
5 -2 3 Terminal Objective
5 -2 4 Item Classification
5 -2 5 toncept/Principle Code
COMNENT:
This record occurs once per question and is sorted by Question II,
Volume, Form.
130

File AC Dim 3 Dim 2 Field
6 1 Volume
6 -1 1 3 Division Number
6 2 Number of Questions
6 -2 1 Question Number
6 -2 2 Form
6 -2 3 Terminal Objective
6 -2 4 Item Classification
6 -2 5 Concept /Principle Code
6 3 Number of Faculty RatingDifficulty
6 -3 .*1 - 7 Number Scoring Math Category# 1 - 7
6 -4 *1 - 7 Number Scoring Concepts(Physics)
6 4 Number Scoring Inappropriatefor TO
*This corresponds to the category numbers.
COMMENT:
This record occurs once per question and is sorted by Question #, Volume,
Form.
131

File AC
1
Dim 1 Dim 2 Field
7 Number of Questions
7 -1 1 Question Number
7 -1 2 Terminal Objective
7 -1 3 Question Type
7 -1 4 Subtest Id.
7 -1 5 Correct Answer
7 -2 *1 - 7 Faculty Math Difficulty
7 -3 *1 - 7 Faculty Math Concepts
7 2 Number Scoring Inappropriatefor TO
*This corresponds to the 7 categories.
COMMENT:
This record occurs once per question and is sorted by Question number.
132
I

1
File AC Dim 1 Dim 2 Field
8 1. Student Id.
8 2 Group Number
8 '3 Week Number
8 4 Student Time
8 5 Mean Time
8 6 Overall Time
COMMENT:
This record occurs once per week and is sorted by Student Id, week.

ITA STATISTICAL. INPUT
Statistical input consists of selecting the desired tests and
computations to be performed on the accessed data as well as
naming the accessed variables to be used in each test.
The following contains the detailed instructions for use of
the statistical package including a list of all required and
optional data cards, variable definition, and card format.
NOTE: If the statistical generation routine is called, all
.of the single variable computations will be made, except for
ranking and sorting. If the user desires ranking and sort
ing for each vector, he must set ICODE1 = 1 in card (4).
134
1

Card Variable VariableNo. Cols. Format Name Description
1
2
3
Yea:
Yes
Yes
1 - 2
4
1 - 2
4-5
1 - 4
5-8
12
II
12
12
12
F4.0
F4.0
N
LIST
IR(1)
IR(2)
IR(N)
X(I,J)
The number ofvectors to beincluded in thissequence of anal-ysis.
= 1 Print out asummary of thevectors to beanalyzed and acomplete set ofsummary statistics.
= 0 Do not printout the abovesummary.
The number ofobservations inVector 1.
the number ofcdbservations inVector 2.
The number ofobservations inVector N.
The Ith dataprint observationin the Jth vectorwhereJ = 1, N andI = 1, ..., IR(J).
NOTE: Data cards 2 and .3 will be included only when inputed from cards.
135

Code
No. Required Cols.
Variabgie
Format NameVariableDescription
4 Yes 1 - 4 14 IND = 0003 Compute allof the summary sta-tistics for each ofthe N vectors beinganalyzed.
# 0003 Do not comput:
the summary statistilot each of the N verots.
e
cs
NOTE If a statistical test requires therammigulmmodmn of summary sta-tistics, and IND # 0003, the control pro:vmmr_ldEllset IND = 0003.
4 Yes 5-8
5-12
13-16
14
14
14
136
ICOMEI -=-- 0-Tho mot compute the
=mks ®s sort each oftfflie vectors
TIbmpute the rankmffeach observation
each vector andnumerically sort eachvector-
ICODE2 = 20 Do not compute thecrossproducts or corre-lattmns between any ofthe vectors (called two-vector computations).
= 21 Compute only thecrossproducts betweenthe vectors.
Ciampante the cross-
laroductz and the corre-1Itions; between the vec-tvrs.
INDIC1 = 0 The two-vector compu-tations will be performed.between all combinationsof vectors (i.e., to givea complete correlationmatrix).
= No. of pairs. If INDIC1# 0 then it must be setequal to the no. of pairsof vectors for which thetwo-vector computationswill be made.
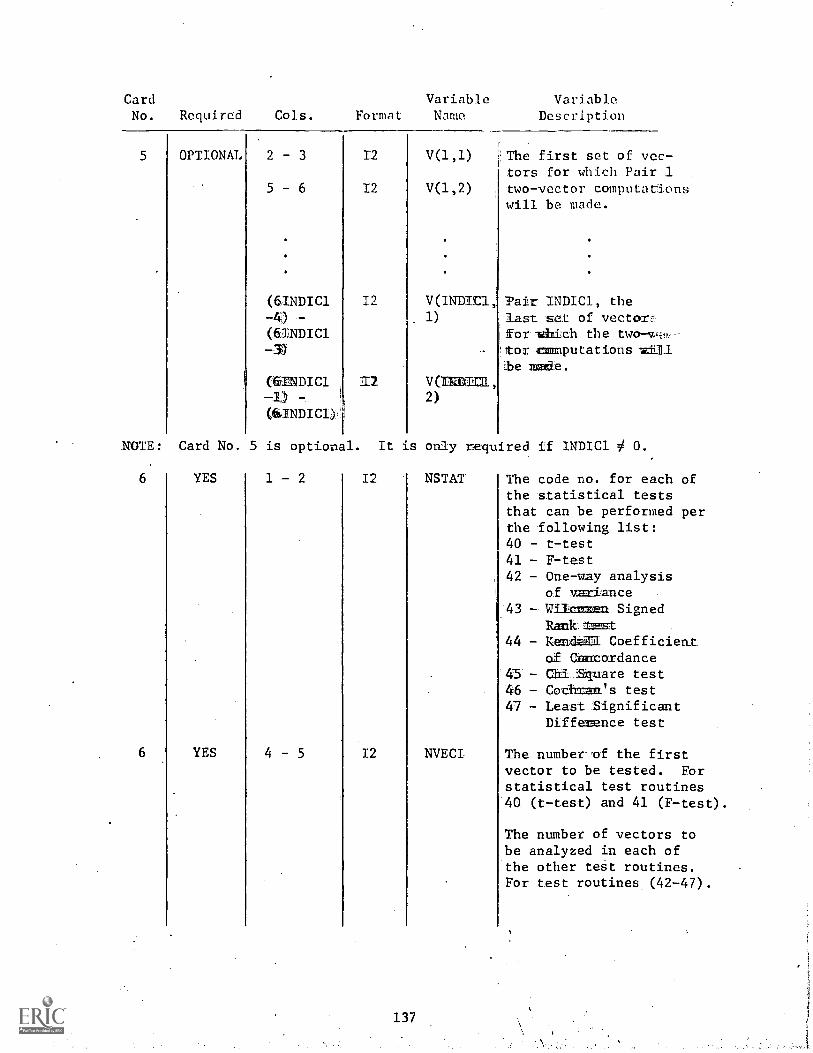
CardNo. Required Cols. Format
Variable VariableName Description
5 OPTIONAL 2 3 I 12
5 6 I 12
(6INDIC1 12
-4)(61NDIC1
(61NDIC1 12-1)
V(1,1)
V(1,2)
,The first set of vec-tors for which Pair 1two-vector computationswill be made.
V(INDIC1, ?air INDIC1, the1) last set of vectors
for ihich the two-vq.-tor computations trb-11
he node.V(2)
111141)
NOTE: Card No. 5 is optional. It is only required if INDIC1 O.
6
6
YES
YES
1 - 2
4 -5
12
12
NSTAT
NVECI
The code no. for each ofthe statistical teststhat can be performed perthe following list:40 t-test
41 F-test42 - One-way analysis
of variance43 Wilaamen Signed
Rank gmat44 Keiasiomi Coefficient.
of Concordance43 - Chi Square test46 - Cochran's test47 - Least Significant
Difference test
The number of the firstvector to be tested. Forstatistical test routines40. (t-test) and 41 (F-test).
The number of vectors tobe analyzed in each ofthe other test routines.For test routines (42-47).

Card Variable VariableNo. Required Cols. Format Name Description
YES
OPTIONAL
I 7-8
II -80
12
20A4
NVEC2
NAME
The number of thesecond vector to hetested for statisticalroutines (40 & 41).
This field is blankfor all of the otherstatistical test rou-tines (42-47).
User supplied des-cription of variables(vectors) being testedwithin a particulartest routine
NOME: The descriptjon is optional; a blank card must be substituted ifuser decides not to use the description option.
8 -YES 3-4
7 - 8
(4NVECI-1) -(4NVEC1),
12
12:
12
NN(1)
NN(2)
NN(NVEC1)
The number of each ofthe vectors to be in-cluded in the analysisfor each of the statis-tical test routines.
NOME:: if statistical testi -routines 40 or 41 are specified, do not in-cl.:1161Pa control card 8 or '9...
NOTE: Control card 9 is only required for statistical test routine 45(Chi Square test). This card provides the user with option of definingthe cell size for the Chi Square test or the option of selecting thenuriber of cells to be used 41 analysis.
9 YES 1 Its
138
LL = 1 If the user desiresto define the limitsfor each cell (definethe cell size).
= 2 If the user doesnot define the limitsfor each cell.

Card.No. Required Cols. Format
Vamiahlewamc
VariableDescription
3 - 4 12 The number of cellsto be used in the
. Chi Square analysisIf LL = 1, K must b,specified. If LL =K need not be sped.fied (see Chi Squar,note at end of thistable.
5 10 F6.0 LI(l,l) Lower limit for thefirst cell if LI
11 16 F6.0 LI(1,2) (1,1) = 99999. Thelower limit for thefirst cell = -00
. . .
. .
. . .
(12K-2) -(123 +4) F6.0 LI(K,2) 10.Der limit for the
''I" cell (interval)
if lam2) = 99999.Tt e.. mapper limit for
the 3h interval isset to +00.
NOTE.: On Chi Square card, ±E the user selects LL = 2 and sets K = 0,then the program will assume six cells for the Chi Square analysis byselecting the minimum (MIN) and maximum (MAX) observations from all ofthe observations available (under analysis) and define the cell width.
1
MAX - MINA =
and define each of the six cells as follows:
CellLowerLimit
1
Upper '.
Limit
, CellLowerLimit
2
UpperLimit -..
CellLowerLimit
6
UpperLimit
MIN MINA M1N+A MIN +2t MIN+5A=
MAX-A
MAX
139

If the user selects LL = 2 and specifies K (the number of cells) as someinteger I then the cell width A will be defined in a like manner.
MAX - MINA -
I
and each of the 1 cells wL11 be defined as follows:
CellLowerLimit
1
UpperLimit . .
CellLowerLimit
1
UpperLimit
. MIN NINA MAX-A MAX
Example Set of Control Cards
Test case given 10 vectors of data (J = 1, ..., 10) each of size IR(J):
1. Compute summary statistics and Iist.
2, Compute correlation for vector sets (.1 and 21,.. (3, and 4), (5 and 6),(7 and 8), (9 and A).
3. Perform t-test om vectors 2 amd 4
4. Perform Kendall Coefficient of arncordance on vectors 1, 3, 5,and 9.
5. Perform Chi Square [with 8 unspecified intervals (rpT1s)] forall 10 vectors.
6. Chi Square test (same vectors with 3 specified antervals (0,10)(10,40) (40,00).
A coding Sheet is attached with the 16 control cards ner-P,ssary to performthe above analysis.
NOTE: Control (data) cards 2 and 3 for the number of observations in eachvector have:not been included.

FOR
TR
AN
Cod
ing
Form
. ,C
aere
Coc
asM
APO
L11
%
FO
RT
RA
N S
TA
TE
ME
NT
'..
,.,,
,.$,I
III.
1I.
i,:
.:,:'
:,
.:4,
,.
-,
50.
S___
0+ .cps
.NT
:),e
.mx.
Ney
.qci
ge20
0+. _
055
0._o
rr...
__os
._Pi
..44
2, _
AN
D40
..__.
_07.
,
1.7_
_.:T
E:s
7-i4
ii-ai _
9'1%
1_
4-)
.4
i .;-..-
.---
-
.
,
off.
1O3
_107
4
05oq
.
,
,
0-1.
7...
4
SquA
R.S
..0
4._
Vr5
c7"e
lizS
-res
-rC
I(7;
SI
A R
=.0
4A
L t.
.C
:
!
0 N
s?ra
-cra
. F=
-Z2>
c...
E.tc
-s
c_91
P9
-
4
C.
__ 4.1
f4S
,ci)
j.?..,
ig.=
421
__ _
.
.i02
, 0.
-rzl
s":1
-03
04...
to,
AR
Tac
.C
oG
A L
I-'ti
ed 7
0ci
a'
cq40
.. eq
.19C
f
RS
zp e
c -
7F.T
.E.-
-DC
C...
.. e-L
S).o
......
-0
____
__40
f___
_.e
57_
C,
--1
.
.
.
.
....
,

3.3 SUPPLEMENT
ANNAPOLIS EVALUATION SYSTEM
VOL. 4 - SUPPLEMENTARY WORK - ITEM ANALYSIS, PMPG
I. INTRODUCTION
In the course of the Annapolis experiment, programs were generated
to perform specific evaluative tasks. not included in the main-
line syStem (Annapolis Evaluation, Vols. 1, 2, and 3). It is
the purpose of this document to describe the nature and use of
these programs, the Item Analysis Program, and PMPG (Percentage
Maximum Possible Gain) Program.
II. ITEM ANALYSIS
II.1 Program Description
The program performs the following analyses for student response
data: a) for all students or keyed groups of students, and b)
on all of the test questions or any keyed subset of questions.
A. Summary Statistics:
1. 'Counts the number of students taking the test.
2. Computes the raw score (no. of items correct)
for each student. The raw score is computed
based on the number of keyed items.
3. Computes the average raw score for all stu-
dents (test average).
4. Computes the standard deviation of student
scores.
142

B. Ttem Sultistics (for each keyed item):
1. Computes the frevency and percentage of the
upper 50% of students' responses for each
category of response.
Categories of Response
Fill-in questions X - Correct
0 - Incorrect
M - Blank
Multiple-choice questions
AB Standard multipleC choice categoriesD
M - Blank
2. Computes the frequency and percentage of lower
50% students for each category of response.
3. Computes the frequency and percentage over all
students for each category of response.
4. Computes the difference in percentage between
upper and lower students for each category of
response.
5. Computes the average raw score for students who
answered the question correctly (AC).
6. Computes the average raw score for students who
answered the question incorrectly (AIC)
7. Computes the proportion of students who answered
the question correctly (PPS).
143

8. Computes the item (question) standard deviation
S = [(PPS) (1 .0 - PPS)) 1/2
9. Compute the point biserial correlation
PBC = (AC - ATC)Test standard & deviation
Additional computations and processing:
1. Computes the Kuder-Richardson reliability (KR20)
KR20(SS)2 - SSI
N - 1.0 (SS)2
N = number of keyed items.
Where : SS = test standard deviation
SSI = (PPS) (1.0 - PPS)
2. Sorts the proportion passing for each keyed item
into ascending order.
3. Sorts the point biserial correlation for each
keyed item into ascending order.
4. Sorts all participating students into descending
order by grade.
11.2 Program Use
The item analysis program was developed specifically for anal-
ysis of the Final Examination. The program via user control
cards can perform an item analysis on 'any subset of keyed
questions for all students or for groups of students. The
program was written in Fortran IV for use on the IBM 360/65
under OS. The control and data cards for analysis of the
Final Exam are as follows :
144

Card No.
1
2
Col. No. Description
1-60 Literal description of the test tobe analyzed.
1-2 Number of questions on the test.
3 The correct responses, one foreach question on the test. The
4 following are acceptable datavalues for each question: Fill-in question: X symbolicallyfor the correct answer. .
62 Multiple-choice question: A, B,C, D, or E whichever is thecorrect response.
3 1-4 The section number of the students.(one cardfor each 7-10 The student's identification no.student)
11-12 The raw score for the student (no.of questions answered correctly.
13 Student's response to each questioncorresponding to the following cate-
14 gories:
Fill-in questions: X - correct re-. sponse, 0 - incorrect response, M
no response.Multiple-choice questions:A, B, C, D, or E - whichever thestudent responded, M - no response.
NOTE: After the last student card, a card with zero's in Columns 7-10is required to indicate that the last student has been processed.
4 1-2 The number of questions to be analyzed
5-6 The number of class sections to beincluded in the analysis.
NOTE: If all students are to be included in the analysis columns, 5-6should be left blank.
5 1-2 The first question to be analyzed.
3-4 The second question to be analyzed.
79-80
145

NOTE: If all the question on the test are to be analyzed, card 5 is notrequired.
Card No. Col. No. Description
6 1-4 The first class section to be inclu-ded in analysis.
5-8 The second class section to be inclu-ded in this analysis
77-80
The card sequence (4, 5, 6) can be repeated as often as required by theuser.
III. PERCENTAGE mAximun POSSIBLE GAIN
III.1 Introduction
A computer program to calculate the percentage of maximum possi-
ble gain (PMPG) was developed per the specifications contained
in a memo by Robert L: Brennan, entitled "Statistical Techniques
for Measuring Effectiveness and Gain with Instructional Programs."
111.2 Program Description
The PMPG program computes the following statistics for student
post- and pretest data for each week (or course unit)
A. Summary Statistics:
1. The number of questions on the test
2. The number of students taking each test
3. A frequency histogram of'student scores
for each test
4. The computed PMPG
146
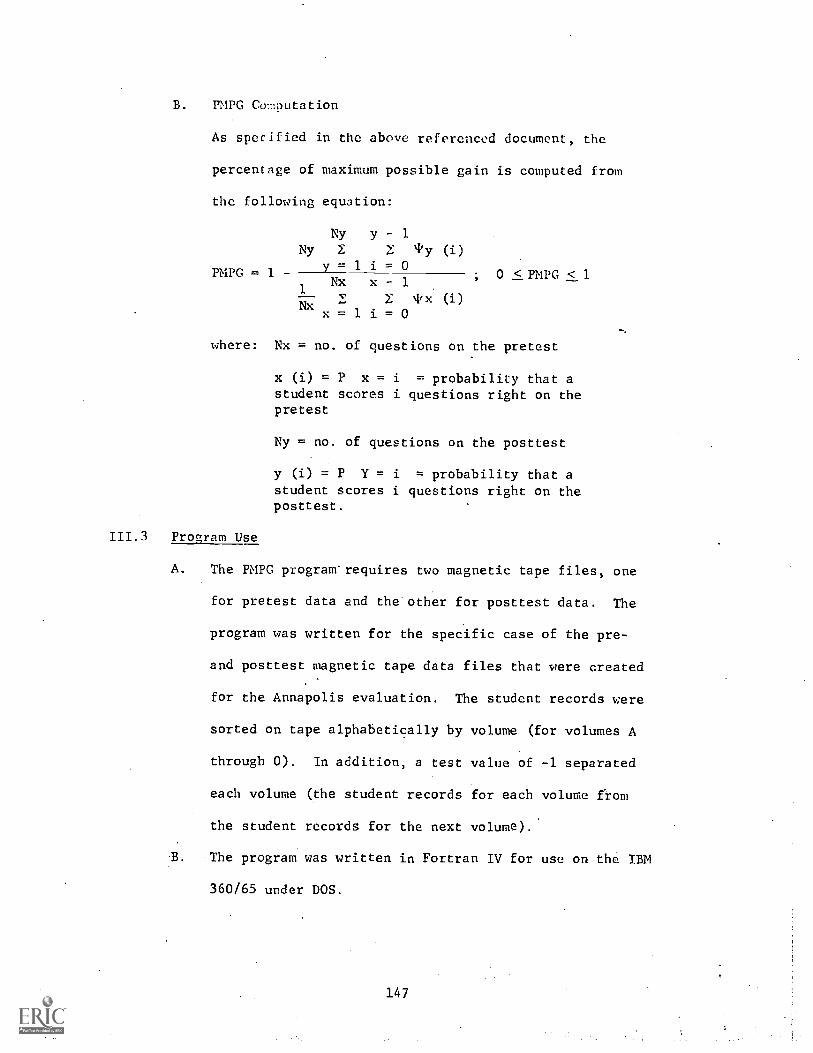
B. PMPG Co-Ilputation
As specified in the above referenced document, the
percentage of maximum possible gain is computed from
the following equation:
Ny y 1
Ny (i)= =PUG = 1 y
Nx1
, 0 < PMPG < 1i
x 1
0
1X 4,X (i)
Nx x =li= 0
where: Nx = no. of questions on the pretest
x (i) =P x=i = probability that astudent scores i questions right on thepretest
Ny = no. of questions on the posttest
y (i) =P Y=i = probability that astudent scores i questions right on theposttest.
111.3 Program Use
A. The PMPG program' requires two magnetic tape files, one
for pretest data and the other for posttest data. The
program was written for the specific case of the pre-
and posttest magnetic tape data files that were created
for the Annapolis evaluation. The student records were
sorted on tape alphabetically by volume (for volumes A
through 0). In addition, a test value of -1 separated
each volume (the student records for each volume from
the student records for the next volume).
B. The program was written in Fortran IV for use on the IBM
360/65 under DOS.
147

C. The following are the input card and tape formats used:
1. Card Format
Card No. Col. No. Description
1 I Vol. = The volume to beprocessed
3-5 NPRE = no. of questionson the pretest
6-8 NPOST = no. of .questionson the posttest
2. Tape record format (for both post- and pretest
tapes)
Record Format Description
A2
3X
Al
140X
The end of volume test value(= -1 indicates the last re-
- cord for that volume has beenprocessed
The volume letter of the cur-rent record
A2 The student's score (no, ofquestions answered correctlyfor this volume.
148

3.4 COPIES OF PROGRAMS
Copies of the programs were submitted bycontractural requirement on 1) a magnetictape and 2) hard copy listings. Copies
of the prograluz are referenced as Anna-polis Evaluation, Vol. 3.
149