document resume - eric · document resume ed 264 551 cs 209 116 author rimmer, tony; bergen, lori...
TRANSCRIPT

DOCUMENT RESUME
ED 264 551 CS 209 116
AUTHOR Rimmer, Tony; Bergen, LoriTITLE Roper Revisited: News Media Preferences from a
Statewide Poll.PUB DATE Aug 85NOTE 21p.; Paper presented at the Annual Meeting of the
Association for Education in Journalism and MassCommunication (68th, Memphis, TN, August 3-6,1985).
PUB TYPE Reports - Research/Technical (143)Speeches /Conference Papers (150)
EDRS PRICE MF01/PC01 Plus Postage.DESCRIPTORS Content Analysis; Demography; Journalism; Local
Issues; *Media Research; *News Media; *Newspapers;Politics; *Public Opinion; State Surveys; *TelevisionViewing
IDENTIFIERS Indiana; *Media Use; *News Sources
ABSTRACTA secondary analysis of data from two Indiana Polls,
the first carried out in January 1983 and the second in November andDecember 1983, was conducted to compare respondents' reports of theirviewing of network television news and local television news, andtheir reading of local newspapers. The intent was to use respondents'preferred source for state news as opposed to national news sourcesused by the Roper polling organization in their surveys of mediapreferences. Since the literature indicated that responses favoredtelevision as the preferred news sotLce for national news, it wasquestioned whether state news would be perceived as being like localnews in which previous responses favored newspapers. A second intentwas to determine whether any change favoring television would be morelikely to appear in communities where television stations werelocated. Results revealed that Indiana respondents overwhelminglypreferred television, when compared with newspapers and radio, as asource of state news and politics. The hypothesis proposing distancefrom a television station as a predictor of news media preference wasnot supported. (HOD)
************************************************************************ Reproductions supplied by EDRS are the best that can be made ** from the original document. *
***********************************************************************

r. 4 T U.S. DEPARTMENT OF EDUCATIONNATIONAL INSTITUTE OF EDUCATI01#
EDUCATIONAL RESOURCIALINFORMATI.:N
CENTER (ERIC)
.>This document has been' reproduce: asreceived from the person or organi.mionoriginating it.
13 Minor changes *4 been made to in provereproduction quality.
Points of view ce opinions stated in 04 document do not necessarily represent ofricial NIEposition or policy,
RADIO-TV DIVISION
ROPER REVISITED: NEWS MEDIA PREFERENCESFROM A STATEWIDE POLL
by
Tony Rimmer and Lori Bergen
School of JournalismIndiana University
Bloomington, Indiana 47405
(812) 335-1717
"PERMISSION TO REPRODUCE THISMATERIAL HAS BEEN GRANTED BY
Tony Rimmer
TO THE EDUCATIONAL RESOURCESINFORMATION CENTER (ERIC)."
N& Paper presented to the Radio-TV Journalism Division, AEJMCAnnual Conference, Memphis, Tennessee, August 1985
BEST COPY AVAILABLE
2

INTRODUCTION
For the last 25 years the Roper polling organization has asked
its respondents W.Iere they get most of their news about what's going
on in the world today. The question the Roper poll asks has been
criticized as being too vague for a valid and reliable response.
Studies which criticize the Roper question have generally
used either national sample data and considered national/inter-
national news, or they have used data from local communities and
considered local news preferences. The present study attempts to
fill in the gap between these two extremes with the use of a statewide
data set where respondents answered a question focussing on their
preferred source for state news. Correlates of these state-based news
source preferences are expected to help further clarify just what the
Roper question might mean to its respondents.
This study also compares respondents' reports of their viewing of
network TV news and local TV news, and their reading of local news-
papers. A geographic predictor of news media preferences is proposed
and tested.
REVIEW OF LITERATURE
Each year since 1959, The Roper Organization has asked its poll
respondents to indicate from which medium they got most of their
news.1 TeL has been cited as the preferred news source since
1Roper Organization, Trends in Attitudes Toward Televisionand Other Media: A Twenty-Four Year Review. (New York: TelevisionInformation Office, 1983). The question is: "First, I'd like toask you where you usually get most of your news about what'sgoing on in the world today--from the newspapers or radio or
3

4
2
1963. Before then newspapers were nominated as the leading source.
The most recent data reported in the Roper series, that for 1984,
show television leading newspapers by 64 percent to 40 percent.2 This
is a lead of 24 percent, the highest margin ever recorded in the
poll. A less impressive lead, b'it still a lead for television, was
reported by the Gallup Organization in a poll for Newsweek in October,
1984.3 Here television lead newspapers by 62 percent to 56 percent,
with radio in third place with 13 percent. These two reports suggest
some consistency in respondent perceptions of news source preference.
Stevenson and White have made four criticisms of the Roper
question:4
1. The question is asked improperly. It calls for a single responseyet multiple answers are accepted. Does that imply to respondentsthat they need not distinguish between different media when answeringthe question?
2. The question is inappropriate. Media, it is argued, are morecomplementary than competitive.
television or magazines or talking to people or where?" (p. 5).The poll is a multistaged, stratified, area probability sample of2,000 respondents representing a nationwide non-institutionalizedpopulation 18 years and older living in the continental UnitedSta,':es. The data was gathered through face-to-face interviews.(p. 24).
2"Public Gives TV News High Rating," Broadcasting, May 13,1985 (p. 58).
3"A Newsweek Poll: Low Marks for the Media?" NewsweekOctober 22, 1984, p. 68. The question read: "Where Do You GetMost of Your News About Current Events?" The question was askedin telephone interviews of 750 adults. The geographic spread ofthe sample was not identified.
4Robert L. Stevenson and Kathryn P. White, "The CumulativeAudience of Network Television News," Journalism Quarterly 57(Autumn 1980): 477-481.
4

y
3
3. The question cannot be answered accurately. Media exposureis too much a part of the web of our daily lives to be accuratelyassessed by respondent self-reporting.5
4. The question is ambiguous. What does "get most of" mean? Isit spend most time with, see most often, saw last, believe to bemost influential, most credible or most rewarding?6
Following these four criticisms, a fifth might be added.
The question wording, "...in the world today," could be perceived
by respondents as focussing on national and international news to
the exclusion of local, and possibly state, news. Further, the
"today" in the question might exploit some sort of recency effect
when, in fact, a cumulative perception is all a respondent can
offer. Both these aspects may favor television, with its apparent
image of immediacy, ei.ld with its high-profile national and inter-
national bureaus and correspondents.
Stevenson and White were particularly concerned with tha problem
of cumulation. They argued that the viewing of television news may
more often be accidental than purposive. If this is so, then respond-
ents may not be able to accurately specify the extent of their TV news
viewing. Respondent replies may tend, then, to be answers reflecting
longer-term perceptions of the general consumption of a medium beyond
just the consumption of news. Perhaps in the longer term, respondent
perceptions of the consumption of one medium may even be a composite
of several media.
5Note, too, the finding by Neuman that the television newsaudience is made up primarily of casual viewers. W. RussellNeuman, "Patterns of Recall Among Television News Viewers,"Public Opinion Quarterly 40 (1976): 115-123.
6Peter Clarke and Lee Ruggels, "Preferences Among News Mediafor Coverage of Public Affairs," Journalism Quarterly 47 (1979):464-471.
$
4
Adams has argued that the problem with the Roper data lies in the
focus of the question.? The responses change, Adams suggests, when
the focus of the question changes. When he asked respondents in three
southern California communities where they got most of their informa-
tion about local events, affairs and activities, the dominant response
was newspapers. Adams concluded that the Roper question had a "cosmo-
politan" flavor to it that may well be satisfied best by television.
But when the question forced respondents to reflect on local affairs
coverage, Adams reported they turned to local newspapers.
Grotta, Larkin and D6Plois found that readers of small newspapers
use them for local news and turn to television for national and
international news.8 Lemert asked the Roper question as it applied to
an Oregon city and found newspapers favored when the emphasis was on
local news.9
The literature reviewed so far has considered responses to
the Roper question from national samples and from samples drawn
from local communities. For national news the responses have favored
television as the preferred news source. For local news the responses
have favored newspapers. But whatof state news? Is state news
perceived as being like local news, or is it something different in
respondent perceptions? Will the correlates of state news differ from
7R.C. Adams, "Newspapers and Television as News InformationMedia," Journalism Quarterly 58 (Winter 1981): 627-629.
8Gerald L. Grotta, Ernest F. Larkin, and Barbara DePlois,"How Readers Perceive and Use a Small Daily Newspaper," Journal-ism Quarterly 52 (1975): 711-715.
9James B. Lemert, "News Media Competition Under ConditionsFavorable to Newspapers," Journalism Quarterly 47 (Summer 1970)!272-280.
6
I
5
those for national and local news source preferences? And how will
they differ?
Stempel, in a 1970 poll, asked respondents in three Ohio commun-
ities to indicate from which medium they got their local, state, and
national and international news.10 While confirming that newspapers
were preferred for local news, he obtained what he called a "mixed"
response for state news. He found a favoring of television news as a
source of national and international news. Stempel did not investi-
gate the nature of this "mixed" response between newspapers and
television. His data suggest that state news occupied a mid-range
preference position between local news and national/international news
for newspapers, radio and television.
In the intervening 15 years between the time of Stempel's study
and the present, there has been dramatic change in the news media
environment. National and local television news coverage has increas-
ed and this change has had an effect on the nature of newspaper
content.11 Local television news has been found to be a revenue
generator and additional resources have been provided in many stations
to exploit this.12 If television is doing a better job of covering
local news following this resource expansion, does it follow that
television will have made gains on newspapers' standing as the
10Guido H. Stempel, III, ""Effects on Performance of aCross-Media Monopoly." Journalism Monographs No. 29, June 1973.
11Leo Bogart, "The Public's Use and Perceptions ofNewspapers." Public Opinion Quarterly 48 (Winter 1984): 709-719.
12Barbara Matusow, The Evening Stars: The Making of theNetwork News Anchor (New York: Ballantine, 1983), pp. 187-194.
I
6
preferred source for local and/or state news?
Further, if television has improved its relative position in
the period since the Stempel study, does it necessarily follow
that this improvement will show up across all demographic groups,
and geographic areas? It is proposed here that any change favoring
television will be more likely to appear in communities where tele-
vision stations are located. It is assumed here that TV stations
gather most of their local news in the communities in which they are
located and that local news is of most interes' to residents of that
community. Thus, respondents living in a dist7nt community on the
fringe of a TV station's signal, might be expected to be less inter-
ested in that station's local news coverage. Respondents who live in
these distant counties might then be expected to prefer their local
newspapers, which presumedly offer more proximate material.
Two research questions are proposed here:
1. Which news medium is preferred by respondents as their mainsource of news about state politics and public affairs, and whatare the demographic and political coryclates of these media prefer-ences and of other media use behaviors reported?
2. Is local TV news more likely to be used, relative to newspapers,in counties where TV stations are located rather than in more distantcounties that fringe TV markets but which do not have TV stationsbased in them?
METHOD
The research questions were tested through a secondary analysis
of data from two Indiana Polls, the first carried out in January 1983,

7
and the second in November-December 1983.13 Comparison of key
demographic variables indicated no significant differences between
respondents in the two polls. The year 1983 was an off-election
year. No other events could be identified which might have had a
significant effect on respondents' reports between the times of the
two polls.
FINDINGS
Research Question 1 -- News Media Preferences and Correlates:
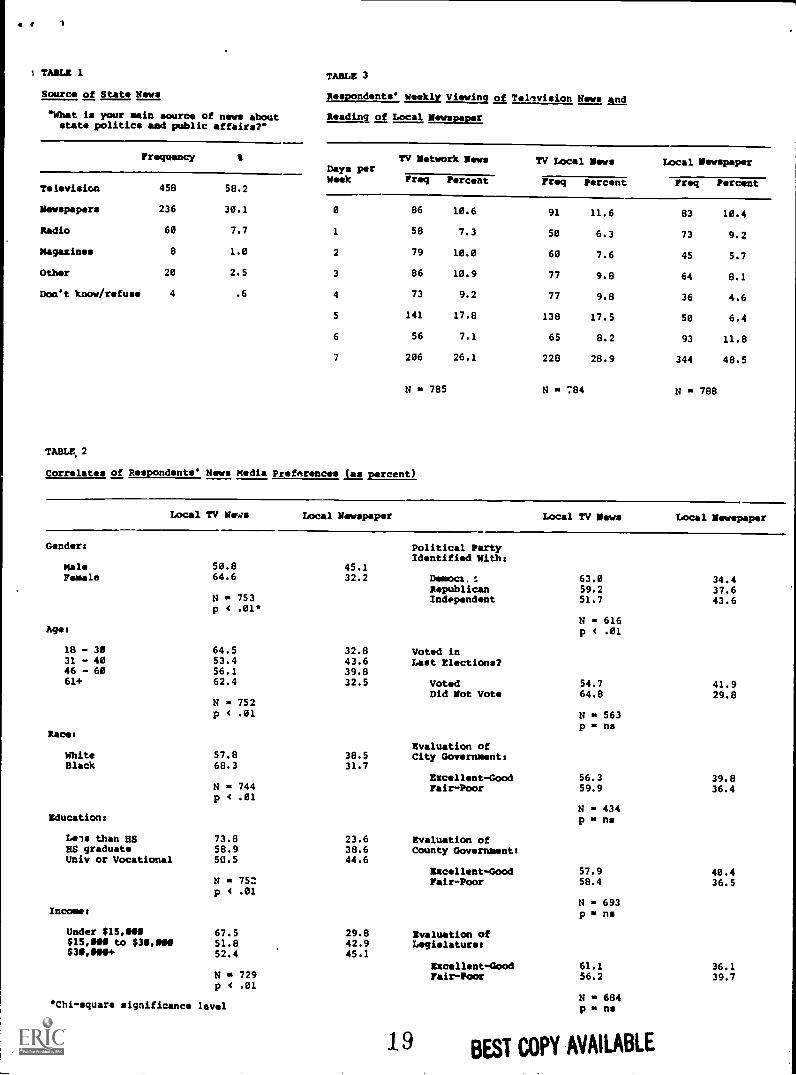
Indiana respondents overwhelming11. preferred television (58.2
percent of respondents), as their source of news about state politics,
when compared with newspapers (30.1 percent), and radio (7.7 percent)
as a source of state news. The preferences are offered in Table 1.
Table 1 about here
Television's margin over newspapers in Table 1 is 28.1 percent
for state news. Recall that Roper's more general news question
obtained a 24 percent lead in 1984. Stempel's lead for television as a
13The Indiana Poll is a computer assisted, telephoneinterviewing (CATI) public opinion poll, carried out two or threetimes a year with approximately 800 respondents from across thestate of Indiana. The polling agency is the Center for SurveyResearch that operates from the Bloomington campus of IndianaUniversity. The Indiana Poll samples are obtained through amodified random-digit dialing of residential telephone exchangeclusters. The sampling error associated with this procedure isplus or minus four percent. In other words, one can be 95percent confident that the survey results are within plus orminus four percentage points of results that could have beenobtained from interviewing all telephone households in the state.
9
#
8
source of state news in 1970 was jus three percent. Roper's question
obtained a lead for television of 12 percent in 1971.
Table 2 offers a series of cross-tabulations of news media
preferences for local TV news and local newspapers with various
demographic and political measures.
Table 2 about here
The data in Table 2 indicate a consistent pattern favoring
local television news over local newspapers. Demographic variables
which have previously been reported as predictors of newspaper usage
rather than television usage were found in this case of media prefer-
ence measures to favor television. For example, higher education and
higher income have in the past been considered to be predictors of
newspaper use.14 But in the present study each education and income
category favored local TV news. Note though, in Table 2, that the
margin favoring local TV news over newspapers decreases as the level
of education and income rises.
The political correlates follow a similar pattern in favoring
television over newspapers. This is in contrast to previously reported
findings, though the earlier findings were based on news media
consumption rather than the news media preference responses reported
in the present study. Weaver and Buddenbaum, for example, reported
that "newspaper use tends to be more strongly associated with voting
14David H. Weaver and Judith M. Buddenbaum, "Newspapers andTelevision: A Review of Research on Uses and Effects," ANPA NewsResearch Report April 20 197' No. 19, p. 2.
10

9
turnout and various other kinds of political activity than does
television use, even when only television public affairs viewing is
measured."15 Respondents in the present study who reported voting in
the previous elections were more likely to nominate TV as their
preferred state news source than they were to nominate newspapers.
Table 3 presents data descrik g the weekly consumption of
network art local television news and local newspapers.
Table 3 about here
For network news, slightly more than one in four (26.1%) respon-
dents reported viewing network news every day, 60.6% reported viewing
four or more days a week, and 39.4% reported viewing three days a week
or less. Stevenson and White, in contrast, have previously reported
that only one in four reported viewing network news four or more days
a week.16 In the present study more than one in two reported viewing
four or more days a week.
By constructing a "typical" network news viewing day it is
possible to build, from Table 3, a basis for comparison between
network TV news, local TV news and newspapers. All respondents
who reported viewing network news seven days a we'ak were included,
six-sevenths of the respondents who reported viewing six days a week
were included, five-sevenths of those who reported five days a week,
etc. From this summary statistic it is concluded that nearly 60% of
15Ibid. p. 7.
16Stevenson and White, p. 479.

10
repondents in Indiana view network news on a "typical" day in the
week.
Stevenson and White, using a similar computation approach,
estimated that less than one adult in five (18%) watched network
news on the authors' "average" day.17
Nearly one in three respondents (2P.9%), reported viewing
local TV news every day, and 64.8% reported viewing local TV news
foLr or more days a week. Constructing a "typical" viewing day
for local TV news (as for the TV network news model above), showed
that 61.7% of respondents view local TV news on a "typical" day. This
is slightly higher than that found for TV network news viewing (60%).
Nearly one in two (43.5%) respondents reported readinj a local
newspaper every day, and 66.4% reported reading a local newspaper four
or more days a week. This is slightly more than those who reported
viewing local TV news, and five percent more than for TV network
news. Again, constructing a "typical" newspaper reading day (as for
the TV network and local TV models), 67.4% reported reading a local
newspaper on that "day." This is five percent more than for local TV
news and eight percent more than reported viewing network news.
Table 4 presents various correlates of viewing and readership.
Table 4 about here
In contrast to the correlates for media preference reported
17Ibid. p. 480.
12

II
11
in Table 2, the data in Table 4 offering correlates of consumption
seele. J fit more with the findings reported from earlier studies--with
some exceptions. For example, females here are more likely to be
heavy consumers of all media than were males. The differences between
genders were significant for network TV news and for local TV news,
but not for newspapers. On the other hand, income and education were
more likely to be associated with decreasing TV news consumption and
increasing newspaper consumption. Blacks tended to be heavier TV news
viewers than wh.. .es, while whites were heavier newspaper readers
than blacks. Note, though, that there were only 42 and 41 blacks
in the samples used here. None of the differences were significant.
Previously reported evidence that media differences were more closely
associated with socioeconomic status than with race itself were found
to hold in the present study.18
For political party identification, however, the tendency was for
respondents to be heavy consumers of TV network news, local TV news
and newspapers. Note, though, that only one medium, TV network news,
showed any significant differences between parties. Newspapers
tended to be the most heavily consumed medium. About 61% of Democrats
reported viewing local TV news and reading local newspapers from five
to seven days a week. Four percent fewer reported being heavy
consumers of network TV news. There was a much clearer distinction
drawn between TV and newspapers in the cases of those identifying
themselves as Republicans and Independents. Here about half the
18Amiel T. Sharon, "Racial Differences in NewspaperReadership," Public Opinion Quarterly 37 (1973-74): 611-617.
13

4 1
12
respondents identified themselves as heavy (5-7 days a week) viewers
of TV network and local news, whereas 60% of Independents and 66% of
Republicans reported being heavy consumers of local newspapers.
Independents and Republicans tended to be heavier consumers of
newspapers than did Democrats. Democrats seemed to favor TV news and
newspapers about equally.
There was no significant difference among viewers of local
TV news in voting behavior in the last election. The table does,
however, suggest that non-viewers tended not to vote and that those
'ho did vote were more likely to be heavy viewers (viewed 5-7 days
week) of local TV news.
Evaluations of government indicated one significant differ-
ence--in the evaluation of city government. Light viewers of local TV
news (1-4 days a week) were seven percent more likely to give city
government a favorable evaluation, whereas heavy viewers were nearly
13 percent more likely to give city government an unfavorable evalua-
tion. Evaluations of county government and of the state legislature
showed no significant differences between favorable and unfavorable
evaluations. Both did show, however, a general tendency for light
viewers to evaluate the two institutions equally favorably or unfavor-
ably, whereas heavy viewers were more inclined to evaluate the two
institutions favorably. There is a hint here, perhaps, of Gerbner et
al's "mainstreaming" effect.19
19George Gerbner, Larry Gross, Michael Morgan, and NancySignorielli, "Political Correlates of Television Viewing," PublicOpinion Quarterly 48 (Spring 1984): 283-300. Note tl,ought thatGerbner et al's argument applies to television viewing generallyrather tEgriTgt to the viewing of television news.
. ) .
13
Research Question 2 -- A Geographic Predictor of News MediaConsumption:
The second research question proposed that the nearer a respon-
dent lived to a TV station the more likely it would be for that
respondent to favor TV news over newspapers. The argument supporting
this was that if TV news is improving then respondent recognition of
this is more likely to be demonstrated at the center of the TV
station's market than at its fringe.
The model was operationalized by constructing a series of
tiers of Indiana counties surrounding each of the TV markets in
the state. Thus, the county where the TV station is located was
identified as the first tier. All counties surrounding the first
tier county, where each shared at least fifty percent of a common
boundary with the first tier county, were identified as second tier
counties. Counties which surrounded the market and shared at least
fifty percent of a common boundary with the second tier counties, were
identified as Third Tier Counties. A progression was thereby set up
so that a county's distance from a TV station could be identified.
Table 5 shows a cross-tabulation of TV and newspaper consumption with
the three tiers of counties in the TV markets.
Table 5 about here
The model is not supported. There was, however, a tendency
15
for light TV news viewers and newspaper readers (1-4 days pex week),
to behave in the manner predicted. Heavy TV news viewers and news-
paper readers (5-7 days per week), however, tended to behave in the
opposite direction from that predicted.
The data tested were for TV network news, rather than for
local TV news. The latter was not available at the time of writing.
A cross tabulation of community type (rural, small town, suburb, city)
with local TV news consumption is offered in Table 5. If it is assumed
that a TV station is more likely to be located in a city than in a
rural area, then the data tend to support the model. This suggests
that a more rigorous test of the data (e.g., dummy variable regres-
sion) might produce more meaningful results.
DISCUSSION
Two general conclusions can be drawn from these findings:
1. Television appears to have made significant i..dvances over
newspapers in the past decade in terms of news media preference
perceptions and in terms of news media consumption. This is not to
say that newspapers have been declared obsolete by the poll respon-
dents. Studies done a decade ago suggested that one in five respon-
dents watched network TV news on a "typical" day. The present study
suggests that this number should now be one in two, at least for the
state of Indiana. Yet slightly better than one in two read newspapers
on a "typical" day. Television has advanced relative to newspapers,
but newspapers still held a slim six percent and eight percent lead
over local and network TV news respectively in the present study.
16

S 41
15
2. The data reported here should be regarded with some caution.
All that is offered here are respondent reports of news media prefer-
ences and news media consumption per week. Stevenson and White's
arguments noted earlier regarding cumulation in media preference
reports seem to be upheld in the present study. The findings regard-
ing news media preferences show more substantial margins in favor of
television than do the findings asociated with media consumption
data. It would seem that poll questions that ask for respondents'
media preferences obtain results which seem inflated when compared
with consumption data. This is because perceptions are measured, not
actual media use. A third type of question not asked in the present
data set, that which asks for media consumption "yesterday, 1120 might
make a useful check on the more general estimate of weekly media
consumption and the even more general media preference question which
Roper uses. But, of course, a "yesterday" consumpticn question i not
responsive to Stevenson and White's cumulation argument.
Early aspirations in this study to address the issue of "state
news" as it pertains to the Roper question must be qualified as a
consequence of item 2 above. The questions asked in the polls did not
clearly delineate perceptions of news about state politics from
perceptions of other kinds of news. Given the apparently inflated
responses a media preference perception report obtains, it does not
seem very useful to continue this line of discussion in isolation from
20See, for example, John P. Robinson, "The Audience forNational TV News Programs," Public Opinion Quarterly 35 (1971):403-405.
16
data involving perceptions and use of other categories of news.
An attempt to build and test a hypothesis proposing distance
from a TV station as a predictor of news media preference was not
successful. Before abandoning this approach, a more rigorous model
should be proposed and tested. Such a model might incorporate the
quality of local newspaper alternatives available to respondents as
their place of residence moves further from local TV stations. It may
well be that very small, perhaps weekly, newspapers serve quite dif-
ferent functions than do distant TV stations. So, if the question
asked involves state news then perhaps it is only the distant TV sta-
tion which can provide this perceived "state" news. The small, local,
newspaper does not attend to "state" news. It is more a purveyor of
village gossip. If this is so, then interest in a TV station's news
may well increase with distance from the station, as the present data
suggest. In effect, the TV station, however distant, is providing an
important "connectedness" (to borrow Robinson's concept2,1) service at
the TV market level, perhaps at the state level, and even at the
national level. Furthermore, respondents perceive this. Individuals
who watch most TV news in absolute and proportional terms may well be
among the least well-educated members of society (the present study
suggests that any gap here has now diminished), but, contrary to
Robinson's argument, these people are "connected" in mass media and
societal terms, if not in Robinson's social and political terms.
21Michael1956-1976," inPublic Opinion1981) 3rd ed.,
J. Robinson, "Television and American Politics:Morris Janowitz and Paul Hirsch (eds.) Reader inand Mass Communication (New York: The Free Press,p. 105.
18
I
t TABLE 1 TABLE 3
Source of State News Respondents' Weekly Viewing of Television News and
'What is your main source of news aboutstate politics and public affairs?'
Reading of Local Newspaper
Frequency %Days perWeek
TV Network News TV Local News Local Newspaper
Television 458 58.2Freq Percent Freq Percent Freq Percent
Newspapers 236 30.1 0 86 10.6 91 11.6 83 10.4
Radio 60 7.7 1 58 7.3 50 6.3 73 9.2
Magazines 8 1.0 2 79 10.0 60 7.6 45 5.7
Other 20 2.5 3 86 10.9 77 9.8 64 8.1
Don't know/refuse 4 .6 4 73 9.2 77 9.8 36 4.6
5 141 17.8 138 17.5 50 6.4
6 56 7.1 65 8.2 93 11.8
7 206 26.1 228 28.9 344 48.5
N 785 084 784 N 788
TABU. 2
Correlates of Respondents' News Media Preferences (as percent)
Local TV News Local Newspaper Local TV News Local Newspaper
Genders Political PartyIdentified With:
Male 50.8 45.1Female 64.6 32.2 DOMOCI.: 63.0 34.4
Republican 59.2 37.6N = 753 Independent 51.7 43.6p < .01*
N.616Ages p < .01
18 - 30 64.5 32.8 Voted in31 - 40 53.4 43.6 Last Elections?46 - 60 56.1 39.861+ 62.4 32.5 Voted 54.7 41.9
Did Not Vote 64.8 29.8N . 752p < .01 N. 563
p nsRace:
Evaluation ofWhite 57.8 38.5 City GovernmentsBlack 68.3 31.7
Excellent-Good 56.3 39.8N . 744 Pair-Poor 59.9 36.4p < .01
N 0 434Education: p ns
Lela than HS 73.8 23.6 Evaluation ofHS graduate 58.9 38.6 County Government:Univ or Vocational 50.5 44.6
Excellent-Good 57.9 40.4N 75:1 Fair-Poor 58.4 36.5p < .01
N mg 693Incomes p ns
Under $15,011 67.5 29.8 Evaluation of$15,111 to $30,111 51.8 42.9 Legislatures$341.11011+ 52.4 45.1
Excellent-Good 61.1 36.1N . 729 Fair-loor 56.2 39.7p < .01
N 684Chi-square significance level p no
.19 BEST COPY AVAILABLE

TABLE 4
Respondents' Rates of Consumption of Network TV Naws,,Local TV News and Local Newspapersampercen-ir
Days per Week
TV Network News
0 1-4 5-7
Local TV News
0 1-4 5-7
Local Newspaper
0 1-4 5-7
Gender:
Male 12.3 41.9 45.8 12.9 36.9 49.2 9.4 27.1 63.5Female 10.1 34.0 55.9 9.8 30.9 59.4 11.6 214.0 60.5
N = 786 N = 784 N= 789p < .01* p < .01 p = ns
Age:
18 - 31 11.9 58.0 30.0 12.2 5.7..2 34.5 14.2 41.7 44.131 - 41 14.6 42.4 43.0 13.8 36.3 49.9 9.8 31.9 58.346 - 60 7.9 25.0 67.1 14.3 20.8 64.9 7.8 17.5 74.761+ 5.9 13.9 80.2 3.6 8.7 87.6 9.6 10.9 76.9
N = 782 N = 782 N = 785p < .01 p < .01 p < .01
Race:
White 10.8 38.4 50.7 11.9 33.5 54.6 10.9 27.7 62.1Black 7.1 25.5 66.7 9.8 29.3 61.0 10.2 31.4 58.4
N = 771 (42 blacks) N = 772 (41 blacks) N = 774 (42 blacks)p = ns p = ns p = ns
Education:
Less than HS 9.4 31.2 59.4 6.4 23.7 69.5 16.5 23.7 59.7HS graduate 11.3 36.0 52.7 11.0 33.0 56.0 11.3 28.7 60.0Univ or Voc 11.7 41.6 46.8 15.0 39.1 45.9 7.3 28.0 64.8
N = 784 N= 781 N = 787p = ns p < .01 p < .05
Income:
Under $15,100 '11.3 35.3 53.4 8.6 33.8 57.6 18.0 25.1 57.0$15,140-$311,144 11.4 38.1 50.5 12.8 31.7 55.5 6.3 34.7 59.0$30,1411+ 10.4 41.3 48.3 16.0 39.5 44.5 5.5 19.8 74.7
N = 741 N= 758 Not 742p = ns p < .05 p < .01
Political PartyIdentified With:
Democrat 9.6 33.4 57.0 8.0 30.7 61.2 11.5 26.9 61.6Republican 9.0 37.7 53.3 12.8 34.9 52.3 7.2 26.7 66.1Independent 12.7 43.0 44.3 12.1 35.1 52.8 10.0 29.4 60.6
N = 772 N = 766 N = 774p < .05 p = ns p = ns
Voted in LastIlection:
Voted NA 10.0 31.1 58.8 NADid Not Vote 16.5 32.7 50.8
N = 585p= ns
20 BEST COPY AVAILABLE

Evaluation of CityGovIrnments
Excellent-GoodFair-Poor
Evaluation of CountyGovernment:
NA
Excellent-Good NAFair-Poor
Evaluation ofLegislature:
Excellent-GoodFair-Poor
NA
Chi-square significance level
TABLE 5
Test of Research Question 2
13.7 36.5 49.8 NA8.0 29.3 62.7
N a 453p < .01
10.2 34.1 55.7 NA11.9 33.5 54.6
N v 723pans
q 9 31.2 59.0 NA1. 34.0 53.8
N a 711pane
Days per Week
TV Network News
0 1-4 5-7
Counties Tiered:
1st Tier(TV stationin county) 9.9 39.5 50.6
2nd Tier(1 county fromTV station) 12.1 37.5 50.4
3rd Tier(2 countiesfrom TV station) 12.0 35.3 52.8
N a 786p a n
Community Type:
Rural area
Small townNA
Suburb
City
Chi-square significance level
Local TV iron Local Newspaper
0 1-4 5-7 0 1-4 5-7
10.3 25.1 64.7
NA 10.5 27.5 62.0
11.1 30.6 58.4
12.9
9.3
36.0
34.1
51.1
56.6
N a 789pane
NA8.7 35.2 56.1
14.9 29.2 56.0
N a 779pane
21BEST COPY AVAILABLE