document resume - eric · document resume. ps 005 371. fuller, joan m. ... community supervisi....
TRANSCRIPT

ED 058 957
AUTHORTITLE
INSTITUTIONREPORT NOPUB DATENOTEAVAILABLE FROM
DOCUMENT RESUME
PS 005 371
Fuller, Joan M.Uprooted Children 1957-1967. Trends in Number ofChicago Area Children in Foster Placements and
Institutions.Welfare Council of Metropolitan Chicago, Ill.
Pub-7005Jun 6958p.Welfare Council of Metropolitan Chicago, 123 WestMadison, Chicago, Illinois 60602 ($3.00, PublicationNo. 7005)
EDRS PRICE MF-$0.65 HC-$3.29DESCRIPTORS *Child Care; Child Welfare; Data Collection;
*Disadvantaged Youth; Family Environment; *FosterChildren; *Institutionalized (Persons); ResearchMethodology; *Residential Care; Tables (Data)
IDENTIFIERS Chicago
ABSTRACTThis report attempts to synthesize the available
information about 16,000 children in the Chicago Area who are living
in "uprootedn circumstances in the sense of having been removed from
their own homes for one reason or other, and having been placed in
substitute homes. Over 100 separate agency facilities and programs
for children are encompassed in this report--both public and private.
The objective of the study was to identify trends in the volume and
type of residential care provided to Chicago Area children in recent
years. The analysis covers the quantity of services, not the quality.
The data collected concern children in agency adoptive homes, in
other foster family homes, in welfare institutions, in institutions
for the mentally retarded, in institutions for delinquents, and in
psychiatric hospitals. A Technical Appendix presents data sources,
methodology, and limitations. (DB)

Welfare Councilof Metropolitan Chicago123 W. Madison,
Chicago, III. 60602
p.
U.S. DEPARTMENT OF HEALTH,EDUCATION & WELFAREOFFICE OF EDUCATION
THIS DOCUMENT HAS SEEH REPRO.
DUCED EXACTLY AS RECEIVED FROM
THE PERSON OR ORGANIZATION OHIGINATING IT POINTS OF VIEW OR OPIN
IONS STATED 00 NOT NECESSARILY
REPRESENT OFFICIAL OFFICE OF EDU
CATION POSITION OR POLICY
MIMM..

U.S. DEPARTMENT OF HEALTH.EDUCATION & WELFAREOFFICE OF EDUCATION
THIS 00CUMENT HAS BEEN REPRO-
DUCE() EXACTLY AS RECEIVED FROM
THE PERSON OR ORGANIZATION ORIG-
INATING IT POINTS OF VIEW OR OPIN-
IONS STATEO 00 NOT NECESSARILY
REPRESENT OFFICIAL OFFICE OF EOU -
CATION POSITION OR POLICY
trends in numberof Chicago Areachildren in fosterplacements and
institutions
uprootedchildren1957-1967
by Joan M. Fuller,Research Associate
publication number 7005price $3.00June 1969
Planning & Research DivisionWelfare Councilof Metropolitan Chicago

PREFACE
On any given day, some 16,000 children in the
Chicago Area are living in "uprooted" circum-
stances in the sense of having been removed from
their own homes for one reason or other, and
having been placed in a substitute home--whether
institution, foster home, or adoptive home. This
large displaced child population stands in spec-
ial jeopardy, since they are no longer under the
immediate supervision of their own parents, and
hence come under the direct responsibility of
the community and its agencies. Their fate and
welfare is therefore of particular concern.
This report represents an attempt to synthesize
the available information about these 16,000
children, and to discern broad trends in services
ovet the ten-year period, 1957-1967. The pic-
ture presented is a revealing but spotty one,
perhaps reflecting more what is not known than
what is known. Child-care services in the
Chicago Area--as in most other metropolitanareas--comprise a classic case of a non-aste'm,
and useable data regarding its scope and clientele
are fragmentary and hard to come by.
Over 100 separate afor children are enboth public and priare independent andspecialized servicewith what other ageSimilarly, the datathese agencies oftca limited amount ofWelfare Council, thChildren and FamilyBureau and other orin service deliveryconsistency or compwhi13informative ancontent--amply doct
It is an anomaly thwhen for example pepolice crime reportaccessible for effilittle about the macommunity supervisithem. Our social pjoint, and in needsafeguard the mostsystematically and
The Welfare Counciation two projectsone a planning and
child care agencic .
care for these yo

ren in thed" circum-removed fromther, andhome--whetherve home. Thisands in spec-ger under theparents, andibility ofleir fate andconcern.
o synthesizese 16,000ds in services
The pic-potty one,known thanin the
'opolitannon-system,e and clientele
Over 100 separate agency facilities and programs
for children are encompassed in this report,both public and private. Most of these agencies
are independent and autonomous and each providesspecialized services, whi--h may or may not mesh
with what other agencies are doing for children.
Similarly, the data and records maintained by
these agencies often do not interface, despite
a limited amount of central reporting to the
Welfare Council, the Illinois Department ofChildren and Family Servlces, the U.S. Children's
Bureau and other organizations. Thus, neitherin service delivery nor in service data is there
consistency or comprehensiveness, and this report--
whileinformative and illuminating in its broadcontent--amply documents these shortcomings.
It is an anomaly that in this age of automation,-
when for example personal credit records, and
police crime reports, are highly centralized and
accessible for efficient referonce--we know so
little about the many thousands of children undercommunity supervision, and what is happening to
them. Our social priorities appear to be out of
joint, and in need of better balance if we are to
safeguard the most vulnerable =mg us moresystematically and responsibly than in the past.
The Welfare Council now has under active consider-
ation two projects to move forward on these fronts--
one a planning and coordination program With local
child care agencies to promote "continuity of
care for these youngsters as they progress through
CV
t.)

the maze of cammunity services; the other a CHILDATA
System to provide improved monitoring, tracking,and data feedback on these children for agencymanagement and community planning purposes.
Despite the limitations noted, Miss Joan Fuller,Research Associate has here assembled a wealthof valuable material on the scope and trends in
child placement services in greater Chicago over
the past decade. The difficulty of data collec-
tion heightens the significance of her perseveranceand achievement in piecing together a highly credit-
able overview of the field. In the process she has
gone beyond the traditional bounds of child welfare
programs, and has included institutional services
to the retarded, the delinquent, and the mentally
A technical appendix document .. the sources--
and gaps--in child care data in thoroughgoing and
definitive fashion.
Miss Fuller was supervised on this complex assign-ment by Mr. F. Dean Luse, Assistani ResearchDirector. They were ably assisted by other membersof the research staff, including Miss Pat Prindiville,
Secretary, Mrs. Dana Putrius, Senior StatisticalClerk, and Mr. Jemmie Turman, Graphics Specialist.
A special debt of appreciation is owed to the manyagencies whose cooperation in sharing informationmade this report possible.
Sidney E. Zimbalist,Research Director
iv

TABLE OF CONTENTS
PART III.
Page5. SUMMAR1
PREFACE iii 6. CHILDR1MENTALI
LIST OF TABLES vi 7. CHILDRIDELIM
LIST OF FIGURES vii 8. CHILDRIAddendum:
INTRODUCTION 1 Unmarr:
PART I. AN OVERVIEW 4 SELECTED 1
TECHNICAL
PARI I. CHILDREN IN FOSTER CARE METHOD(
PLACEMENTS 8 I. AN 01
A. S(
1. SUMMARY 8 I]
B. C1
2. CHILDREN IN AGEMY ADOPTIVE HCMES . 11 II. CHILI
A. AI
3. CHILDREN IN OTHER FOSTER FAIAILY HOMES. 15 Fl
B. C]
4. CHILD!' 14 IN CHILD WELFARE INSTITUTIONS 19 III. CHIL]
a. Treatment-OrientedINST
Institutions 20 A. Cl
b. Congregate-CareInstitutions 22 B. C
c. Temporary-Care InstitutionsDI
and Nurseries 23 C. C.
Addendum: Children in Homes of Parents Addendum:
or Other Relatives 24 UnmIrr

PART III. CHILDREN IN THREE OTHER TYPES
Page
OF INSTITUTIONS 28
Page
iii
5. SUMMARY6. CHILDREN IN INSTITUTIONS FOR THE
28
vi
MENTALLY RETARDED7. CHILDREN IN INSTITUTIONS FOR
30
DELINQUENTS 33
vii 8. CHILDREN IN PSYCHIATRIC HOSPITALS. . 37
Addendum: Maternity Homes for
1 Unmarried Mothers 39
4 SELECTED BIBLIOGRAPHY 42
TECHNI(AL APPENDIX: DATA SOURCES
)STER CARE METHODOLOGY, AND LIMITATIONS 44
8 I. AN OVERVIEW 44
A. Selection of Agencies and
8 Institutions 44
B. Child Population Estimates . . . 44
OPTIVE HOMES . 11 II. CHILDREN IN FOSTER CARE PLACEMENTS . 45
A. Agency Adoptive Homes and Other
TER FAMILY HOMES. 15 Foster Family Homes 45
B. Child Welfare Institutions . . 46
YARE INSTITUTIONS 19 III. CHILDREN IN THREE OTHER TYPES OFINSTITUTIONS 49
20 A. Children in Institutions lorthe Mentally Retarded 51
22 B. Children in Institutions for
,titutions Delinquents 52
23 C. Children in Psychiatric Hospitals 53
Iomes of Parents Addendum: Maternity Homes for
24 Unmarried Mothers 55

Table Page
1 Estimated Child Population in theChicago Area, by County', 1957 and
1967 4
2 Chicago Area Children in Foster 10 Children
Placements and in Three Other Types Child Welf
of Institutions, 1957 and 1967 . . 5 the Chica
3 Children in Foster Placements in 11 Children
the Chicago Area, 1957 and 1967 . . . 8 Welfare Inin the Chi
4 Children in Foster Placements, inthe Chicago Area, by Source of 12 Chicago Ar
Payment for Care, November 30, 1957 Types of I
and 1967 10 Institutio
5 Children in Agency Adoptive Homes 13 Chicago Ar
in the Chicago Area, 1957 and tutions fo
1967 13 1961 and 1
6 Children Adopted Through the Circuit 14 Chicago Ar
Court of Cook County, Annual Total tions for
Number, 1957 and 1967 14 1967 . .
7 Children in Other Foster Family 15 Chicago Ar
Homes in the Chicago Area, 1957 tric Hospi
and 1967 17X Children i
8 Children in Child Wel'.are Insti- tutions in
tutions in the Chicar, Ares, by Auspices a
Type of Institution, .957 and 1957 and 1
1967 20
9 Children in Treatment-OrientedChild Welfare Institutions inthe Chicago Area, 1957 and 1967 . . .
XX Chicago grOther TypeAuspices a
22 1957 and I
vi

in the
957 and
LIST OF TABLES
Page
4Page
roster 10 Children in Congregate-Care
ther Types Child Welfare Institutions in
1967 . . . . 5 the Chicago Area, 1957 and 1967. . . . 23
:nts in 11 Children in Temporary-Care Child
0 1967 . . . 8 Welfare Institutions and Nurseriesin the Chicago Area, 1957 and 1967 . . 23
-nts, in
e ofr 30, 1957
12 Chicago Area Children in Three Other
Types of Institutions, by Type of
10 Insti'ution, 1957 and 1967 28
ye Hames 13 Chicago Area Children in Insti-
andtutions for the Mentally Retarded,
13 1961 and 1967 31
Lhe Circuit 14 Chicago Area Children in Institu-
ual Total tions for Delinquents, 1957 and
14 1967 34
Family 15 Chicago Area Children in Psychia-
, 1957 tric Hospitals, 1955 and 1967... . . . 38
17
Insti-
.ea, by
' and20
X Children in Child Welfare Insti-
tutions in the Chicago Area, by
Auspices and Type of Institution,
1957 and 1967 47
XX Chicago grea Children in Three
ented OtiWr Types of Institutions, by
s in Auspices and Type of Institution,
id 1967 . . 22 1957 and 1967 50
vi

vii
LIST OF FIGURES
Figure Page
A Children in Foster Placements and in
Three Other Types of Institutions,
1957 and 1967
B Children in Foster Placements and
Placements in Three Other Types of
Institutions, by Agency Auspices,
1957 and 1967
6
7
C Children in Foster Placements, by
Source of Payment for Care, 1957
through 1967 9
D Children in Foster Placements, by Type
of Living Situation, 1957 and 1967 . . 11
E Children in Agency Adoptive Homes,
1957 through 1967 12
F Children in Other Foster Family Homes,
1957 through 1967 16
G Children in Child Welfare Institutions,
1957 and 1967 21
H Children in Three Other Types of Insti-
tutions, 1957 and 1967. 29

INTRODUCTION
This report is concerned with a particularly
vulnerable group of children 1--those who have
been uprooted from their natural homes and
placed in some type of foster care or institu-
tion. All of these youngsters have, in a real
sense, been deprived of normal childhoods in
their own homes. &cause of their own inade-quacies or those of their parents, they have
found it necessary to turn to the communityfor the nurture and the compensatory treatment
they require if they are to develop into self-reliant, contributing members of adult society.Thus, they are youngsters for whom the commun-
ity has very special responsibilities.
This is not in any way meant to diminish the
vital importance of day care, homemaker aids,
child guidance clinics, family counseling,financial assistance and the many other types
of programs aimed at strengthening family life
1As used in this document, "children" refer to
persons under 1$ years of age, except when
used to denote child welfare agency clientele.
In the latter instance, "children" refer to
all youngsters served by these agencies, in-
cluding a few 18-21 year olds.
and helping chhomes. Data ccovered in thitime requiremethe scope of tcare.
The objectiveto identify tiresidential CEchildren in r(comparing seriber of Chicag(ments and in :
retarded, del:in two years:
Service stati !agencies and Jthese years w(
2 In this documCook, Lake, aunless otherm

a particularly--those who have'al homes and
.care or institu-3 have, in a realchildhoods inheir own inade-,nts, they have
the communityisatory treatmentvelop into self-of adult society.whom the commun-)ilities.
o diminish thehomemaker aids,counseling,any other typesning family life
adren" refer to, except whengency clientele.iren" refer toagencies, in-
and helping children to remain in their ownhomes. Data on these services could not becovered in this report, because budgetary andtime requirements made it necessary to limitthe scope of the study to one topicresidentialcare.
The objective of this study was a simple one;
to identify trends in the volume and type of
residential care provided to Chicago Area2
children in recent years. This was done by
comparing service statistics on the daily num-
ber of Chicago Area children in foster place-
ments and in institutions for the mentally
retarded, delinquent , and emotionally disturbed
in two years; 1957 and 1967.
Service statistics from local child welfare
agencies and from the other institutions for
these years were analyzed in relation to the
2 In this document, "Chicago Area" refers to
Cook, Lake, and DuPage Counties in Illinois
unless otherwise specified.
t

types of settings in which the children were from the earl:
placed and the types of agencies providing cribed the vo]
care, i.e., governmental, Catholic, or other provided by a
voluntary, welfare agenc:document is cc
The analysis covered only the quantity of particular tyl
residential care services provided to Chicago provided by vz
Area children. No attempt was made to measure of the presen1
the quality of these services, or their effec- statistics on
tiveness. Neither was there an effort to de- for mentally 3
termine the extent of unmet needs for residen- ally disturbe(
tial care. Important as these factors are, welfare facil:
they are too complex to be evaluated on the in these othei
basis of the very limited types of information been to ignor(
provided by present data collection systems, population re(
The present study is, in some respects, an ex-tension of information in previous WelfareCouncil publications on service trends amonglocal child welfare agencies in 1934-53,3 and The hazards oJ
1940-60. 4 However, its focus differs somewhat service statitime from mansto coalesce tl
3"The Proposed Governmental Child Care Service manifold. Son
for Cook County: Its Statistical Context: and much that
1934-1953," Welfare Council of Metropolitan mentary, and (
Chicago, Statistics (Vol. XXI, Nos. 11, 12, are described
4November and December 1954.) Appendix to ti"Trends in Child Placement Programs Serving ification shot
Cook County Children: 1940-1960," Welfare not be regard(
Council of Metropolitan Chicago, Statistics, approximation!
(Vol. XXIX, Nos. 1-5, January-May 1962) define, recen1
2/I

ldren wererovidingor other
tit of
to Chicagoe to measuretheir effec-fort to de-for residen-'tors are,
ed on theinformation
n systems.
ects, an ex-s Welfareends among934-53,3 andfers somewhat
Care ServiceContext:
tropolitans. 11 , 12 ,
s Serving" WelfareStatistics,1962)
2/3
from the earlier reports. Whereas they des-
crited the volume of various types of service
provided by a particular type of resource (child
welfare agencies and institutions), the present
document is concerned with the volume of a
particular type of service (residential care)
provided by various resources. Hence, the scope
of the present study was broadened to include
statistics on children in spedial institutions
for mentally retarded, delinquent and emotion-
ally disturbed, as well as those served by child
welfare facilities. To have omittei youngsters
in these other types of institutions would have
been to ignore an tmportant segment of the child
population receiving residential care.
The hazards of attempting to obtain comparable
service statistics covering a ten-year span in
time from many different sources and of trying
to coalesce them into a meaningful whole are
manifold. Some data were just not available
and much that did exist were scattered, frag-
mentary, and of uneven quality. These problems
are descrited more fully in the Technical
Appendix to this report, but one general qual-
ification should be made here. These data should
not be regarded as refined measures, but only as
approximations that suggest, rather than precisely
define, recent trends.

PART I. AN OVERVIEW
Since the number of "uprooted"children in a
community at a given time depends, in part at
least, upon the total number of children in
the community at the time, estimates of the
child population in the Chicago Area during
the study years are presented in this "over-
view" as background for the service data that
follow. This is not to imply that the total
child population can, or should, be regarded
as the primary determinant of the volume of
residential care. The need for residential
care depends upon many other factors as well,
including.for example, the quantity and qual-
ity of resources available for placing children
and, also, for averting placement through pre-
ventive services to strengthen family life.
TABLE 1. ESTIMATED CHIfBY COUNTY, 1957 AND 1967
County
TOTAL
CookDuPageLake
Estimatedof Childr
July 1957
1,854,000
1,660,000100,00094,000
Source: Derived from U1University of Chicago CcAppendix, Part I.)
Table 1 showschildren undeiby almost 13 1growing from :a gain of 234
Over 85 perceiCook County dlsmall in comiNpopulations o:panded more 1Nchildren in DIthirds, and tlone-third bet

-ed"children in aiepends, in part at
r of children inestimates of thecago Area duringed in this "over-service data that
)1y that the totaliould, be regardedof the volume offor residential
r factors as well,quantity and qual-for placing children
acement through pre-then fmnily life.
TABLE 1. ESTIMATED CHILD POPULATION IN THE CHICAGO AREA,
BY COUNTY, 1957 AND 1967
Estimated Numberof Children Change
Numerical1957-67
Percent
County July 1957 July 1967 Difference Change
TOTAL 1,854,000 2,088,000 +234,000 +12. 6
Cook 1,660,000 1,791,000 +131,000 + 7.9
DuPage 100,000 168,000 + 68,000 +68.0
Lake 94,000 129,000 + 35,000 +37.2
Source: Derived from U.S. Bureau of the Census and
University of Chicago Community Inventory (See Technical
Appendix, Part I.)
4
Table 1 shows that the estimated number of
children under 18 in the Chicagokrea increased
by almost 13 percent between 1957 and 1967,
growing from 1,854,000 to 2,088,000. This was
a gain of 234,000 children in ten years.
Over 85 percent of these children lived in
Cook County during both study years. Although
small in comparison to Cook County, the child
populations of Lake and DuPage Counties ex-
panded more rapidly. The estimated number of
children in DuPage County increased by two-
thirds, and those in Lake County, by more than
one-third between 1957 and 1967.

TABLE 2. CHICAGO AREA CHILDREN IN FOSTER PLACEMENTS AND IN THREE OTHER
TYPES OF INSTITUTIONS, 1957 AND 1967
Agency Auspicesand Typeof Placement
1957Daily No. Percent
Children of Total
1967
Daily No.Children
Percentof Total
PercentChange
TOTAL 13,609 100.0 15,842 100.0 +16.4
Governmental (5,876) (43.2) (8,949) (56.5) (+52.3)
Voluntary (7,733) (56.8) (6,893) (43.5) (-10.9)
AGENCYADOPTIVE HOMES. . 1,095 8.0 1,262 8.0 +15.3
CTHER FOSTERFAMILY HOPES. . . 4,761 35.0 6,807 43.0 +43.0
INSTITUTICNS . . 7,360 54.1 6,857 43.3 -6.8
Child WelfareInstitutions . (3,392) (24.9) (2,530) (16.0) (-25.4)
OtherInstitutionsa . (3,968) (29.2) (4,327) (27.3) (+9.0)
OTHERb 393 2.9 916 5.8 +133.1
Source: Summary of Tables 3 and 12aIncludes institutions for the retarded, delinquent, and psychiatrically ill
bIncludes children in boarding schoois, hospitals, independent living
arrangements and other voluntary institutions located outside the Chicago
Area on November 30 each year.
During the same period, the total number of
uprooted children in foster placements and
in three other types of institutions increased
at about the same rate (16 percent). Table 2
shows that the daily number of Chicago Area
children in fositions for the m(
and psychiatricin 1957 to abou

FOSTER PLACEMENTS AND IN THREE (yTHER
67
rcentTotal
00.043.2)
56.8)
8.0
35.0
54.1
24.9)
29.2)
2.9
1967
Daily No. Percent
Children of Total
15,842(8,949)(6,893)
1,262
6,807
6,857
(2,530)
(4,327)
100.0(56.5)(43.5)
8.0
43.0
43.3
(16.0)
(27.3)
916 5.8
PercentChange
+16.4(+52.3)
(-10.9)
+15.3
+43.0
-6.8
(-25.4)
(+9.0)
+133.1
2
rded, delinquent, and psychiatrically ill.
ols, hospitals, independent living
institutions located outside the Chicago
number ofcements andons increasedt , Table 2icago Area
5
children in foster placements and in institu-
tions for the mentally retarded, delinquents,
and psychiatric patients went from about 13,600
in 1957 to about 15,800 ten years later.
1

Figure A. Children in Foster Placements and in Three Othe
1957
1967
DAILY NUMBER OF CHILDREN
0 2,000 4,000 6,000 8,000 10,000
Source: Table 2
The trend away from institutional placementstoward increased use of foster family homes forapendent children continued during the pjdecade. As Figure A illustrates, the propor-tion of all "uprooteechild7:en from the local
area who were innsubstitute homes," i.e., in
agency adoptive homes and other foster familyhomes rose from 43 percent of the daily case-load in 1957 to 51 percent in 1967.
During this sam"uprooted"childfrom 54 to 43 pVirtually all opercent reductipopulation of c
This downward ttype of child w

Children in Foster Placements and in Three Other Types of institutions, 1957 and 1967
4,000 6,000 8.000 MAX MOW 14,000 16,000
ADOPTIVEHOMESI OTHER
8% 6% I
6,000
ional placementsfamily homes for
during the pastites, the propor-m from the localhomes," i.e., in4er foster familyf the daily case-, 1967.
6
8,000 MOW MOW MOW MOW
During this same period, the proportion of all
uprooted"children in institutions droppedfrom 54 to 43 percent of the daily caseload.Virtually all of this decrease was due to a 25
percent reduction in the total daily residentpopulation of child welfare institutions.
This downward trend was confined to only one
type of child welfare institution--congregate-

Figure B. Children in FosterOther Types of Instity
1957 and
1957Source: Table 2
care facilities for dependent children, or the11orphan asylums
ttof yesteryear.
Other child welfare institutions that provided
treatment-oriented services to emotionally
disturbed youngsters or temporary-care for
older children showed an opposite pattern of
increased resident populations, as did the
three other types of institutions that offered
special care and treatment to retarded, delin-
quent, and disturbed children. The daily
resident population of the latter group in-
creased by 9 percent during the study period.
The shift from vollagencies as the chcare services forpast decade, as isIn 1957, 57 percenChicago Area childinstitutions receiagencies, and 43 p
Ten years later thEturnabout. In 1961
care from voluntar3portion served by fswelled to 57 percE

Figure B. Children in Foster Placements and in ThreeOther Types of Institutions, By Auspices,
1957 and 1967
1957Source: Table 2
dent children, or theryear.
tutions that providedes to emotionally.emporary-care foropposite pattern oftions, as did theitutions that offeredt to retarded, delin-dren. The dailyle latter group in-ng the study period.
1967
The shift from voluntary to governmentalagencies as the chief providers of residentialcare services for children continued over the
past decade, as is illustrated in Figure B.In 1957, 57 percent of the daily total ofChicago Area children in foster placements andinstitutions received care from voluntaryagencies, and 43 percent from public agencies.
Ten years later there had been a completeturnabout. In 1967, only 43 percent receivedcare from voluntary agencies, ithile the pro-portion served by governmental agencies hadswelled to 57 percent.

PART II. CHILDREN IN FOSTER CARE PLACEMENTS
1. SUMMARY
The decade between 1957 and1967 was a period of expansionand change for Chicago Areachild welfare agencies and in-
stitutions. As Table 3 Shows)the number of "uprooted" chil-dren served in foster place-ments by these agencies in-creased by 20 percent duringthis period, growing from anaverage of 9,770 children aday in 1957 to 11,762 in 1967.
Voluntary agencies providedthe bulk of direct care ser-vices throughout the period,but their share of the dailycaseload shrank from 72 per-cent at the beginning to 55percent at the end. The aver-age daily number of childrenin foster placements undervoluntary auspices droppedfrom 7,042 in 1957 to 6,427 in1967.
In contrast, governmental agen-cies had almost twice as mamychildren in foster placementsin 1967 (an average of 5,335per day) as in 1957 (2,728).
At the same time, their shareof the daily caseload expandedfrom 28 to 45 percent.
TABLE 3. CHILDREN IN FOSTER PLAC
AND 1967
Agency Auspicesand Typeof Placement
1957
Daily No.a Per
Children of
TOTALGovernmentalVoluntary
AGENCYADOPTIVE HOMES
GovernmentalVoluntary
OTHER FOSTERFAMILY HOMES.
GovernmentalVoluntary
CHILD WELFAREINSTITUTIONS.GovernmentalVoluntary
OTHERPIACEMENTS b
GovernmentalVoluntary
9 ,770
2 ,728
7 ,042
1 ,095(43)
(1 ,052)
4 ,761(2 ,426)(2 ,335)
3 ,392(70)
(3 ,322)
522(189)(333)
lc
Source: Summary of Tables 5, 7 arkaAverage number under care on last c
bAverage of number of children in bc
living arrangements, and other volt
Chicago Area on last day of each mc
served by child welfare agencies ht
delinquent and disturbed. (Counted

TER CARE PLACEMENTS
ion
67.
er-n
in
TABLE 3. CHILDREN IN FOSTER PIACEMENTS IN THE CHICAGO AREA , 1957
AND 1967
Agency Auspicesand Typeof Placement
1957Dai ly No . a PercentChildren of Total
1967Daily No.a PercentChildren of Total
PercentChange
TOTAL 9,770 100. 0 11,762 100. 0 +20.4
Governmental 2 ,728 27.9 5,335 45,4 +95. 6
Voluntary 7 , 042 72.1 6,427 54.6 -8.7
AGENCYADOPTIVE HOMES 1 ,095 11.2 1,262 10. 7 +15.3
Governmental (43) (186)Voluntary (1,052) (1,076)
OTHER FOSTERFAMILY HOMES. 4 ,761 48.7 6,807 57.9 +43. 0
Governmental (2 ,426) (4,361)Voluntary (2 ,335) (2,446)
CHILD WELFAREINSTITUTIONS. 3 ,392 34.7 2,530 21.5 -25.4
Governmental (70) (180)Voluntary (3,322) (2,350)
OTHERPLACEMENTS b 522 5.4 1,163 9.9 +122.8
Governmental (189) (608)Voluntary (333) (555)
gen-ny Source: Summary of Tables 5, 7 and 8ts aAverage number under care on last day of each month.5 bAverage of number of children in boarding schools, hospitals, independent
living arrangements, and other voluntary institutions located outside there Chicago Area on last day of each month. Also includes some childrended served by child welfare agencies but in institutions for the retarded,
delinquent and disturbed. (Counted in "other institutions" in Table 2).

Hence, as Figure C so clearly illustrates,
governmental agencies accounted for almost all
growth in local child care services over the
past decade.
This expansion in government services was in
large part related to the development of two
new public agencies: the Illinois Department
of Children and Family Services (established
in 1964, to replace the more circumscribed
Child Welfare Services of the Illinois Depart-
ment of Public Welfare) and the Cook County
Department of Public Aid (which resulted from
the merger, in 1958, of the former Cook County
and Chicago Welfare Departments).
In addition to providing direct care services,
public agencies also contributed some payments
toward the care for more than one-half of the
children served by voluntary agencies during
both study years. As Table 4 shows, this
meant that governmental agencies provided some
measure of support to 79 percent of all
youngsters in local foster placements in 1967,
which was a moderate gain over the 68 percent
they aided in 1957.
This increase was entirely due to the increased
number of children receiving care directly from
governmental agencies; the number on November
30 each year increased from 2,753 in 1957 to
5,741 in 1967. In contrast, voluntary facili-
ties received public agency payments for the
care of fewer children in 1967 than in 1957;
the number on November 30 each year dropped
from 3,910 in 1957 to 3,836 in 1967. These
figuresunderscore the fact that a major thrust
of change over the past decade was toward in-
creased provision of direct care services by
9
Figure C.
DAILY NUMBER OF CHILDREN
13,000
11,000
9,000
7,000
5,000
3,000
1,000
01957 '58
Scmmm Same as To
governmentalcare arrangeagencies.

rly illustrates,)unted for almost allservices over the
nt services was indevelopment of twoIllinois Department'vices (establishedre circumscribedthe Illinois Depart-id the Cook Countywhich resulted fromle former Cook Countyments).
lirect care services,ibuted some paymentshan one-half of thery agencies duringe 4 shows, thisrencies provided some)ercent of allplacements in 1967,over the 68 percent
due to the increasedng care directly fromnumber on November
)m 2,753 in 1957 tost, voluntary facili-'y payments for the1967 than in 1957;each year dropped6 in 1967. Theset that a major thrustcade was toward in-t care services by
Figure C.
DAILY NUMBER OF CHILDREN
13,000
11,000
Children in Foster Placements, By Sourceof Payments for Care,
1957 through 1967
TO AL PLACEMENTS
9,000-
7,000
3,000
1,000-
0 /1957 '58 59 '60 3I '62 'a 64 ' '66 '67
GOVERNMENTAL AGENCY PLACEMENTS
VOLUNTA Y AG NCY PLACEMENTSW th Some Govi nm.ntat Payment )
VOLUNTARY AGENCY PLACEMENTS(With No Governmental Payments)
Source, Same as.Table 4
governmental agencies and away fran purchase-of-
care arrangements between public and voluntary
agencies.

TABLE 4. CHILDREN IN FOSTER PLACEMENTS IN THE CHICAGO AREA
BY SOURCE OF PAYMENTS FOR CARE, NOVEMBER 30, 1957 AND 1967.
Agency Auspicesand Sourceof Payments
1957
Number of PercentChildren of Total
1967Number of Percent
Children of TotalPercent
Change
TOTAL 9,736 100.0 12,154 100.0 +24.8
Governmental 2,753 28.3 5,741 47.2 +108.5
Voluntary 6,983 71.7 6,413 52.8 -8.2
Some paymentsfrom government (3,910) (40.1) (3,836) (31.6) (-1.9)
No paymentsfrom government (3,073) (31.6) (2,577) (21.2) (-16.1)
Source: C-1 reports to the Welfare Council and special reports from
the Illinois Department of Children and Family Services and the
Juvenile Court of Cook County for November 30 of each year.
Another important trend among Chicago Areaagencies during the past decade was a continuedshift away from institutional placements toward
more foster home care. As Figure D illustrates,
the proportion of total foster placementsrepresented by children in child welfare insti-
tutions decl.ined from 35 percent in 1957 to 21
percent in 1967. Meanwhile, the proportion of
the daily caseload represented by children in
adoptive and other foster family homes expanded
from 60 to 69 percent.
Most of the decline in institutional placements
occurred in the voluntary sector. The average
daily residential population in voluntary child
welfare institutions dropped from 3,322 at the
beginning of the period to 2,350 at the end.
10
Most of the gainsulted from a sufoster family camental agencies.number of childring adoptive hommost doubled, grchildren per dayboth years the CAid alone accounfoster home carecies.
The proportion ohomes remained tperiod--11 percefoster placementthis care was prwhich served morthis type of set

R PLACEMENTS IN THE CHICAGO AREACARE, NOVEMBER 30, 1957 AND 1967.
1957
of Percentn of Total
1967Numter of PercentChildren of Total
Percent
Change
100.0 12,154 100.0 +24.8
28.3 5,741 47.2 +108.5
71.7 6,413 52.8 -8.2
(40.1) (3,836) (31.6) (-1.9)
) (31.6) (2,577) (21.2) (-16.1)
Welfare Council and special reports from
Children and Family Services and thenty for November 30 of each year.
ong Chicago Areaecade was a continuednal placements towardFigure Dster placementschild welfare insti-ercent in 1957 to 21e, the proportion ofnted by children infamily homes expanded
titutional placementssector. The averageon in voluntary childed from 3,322 at the2,350 at the end.
10
In addition to being specific
to voluntary institutions,this decline was also, in largepart, restricted to one type of
facility: congregate-care in-stitutions for dependent chil-
dren. Temporary-care facili-ties for older children andtreatment-oriented institutionsfor disturbed youngsters showedjust the opposite pattern withdramatic increases in theirresident populations over the
past decade.
Most of the gain in foster home placements re-
sulted from a substantial expansion in the
foster family care services provided by govern-
mental agencies. Between 1957 and 1967, the
number of children in foster families (exclud-
ing adoptive homes) under public auspices al-
most doubled, growing from an average of 2,426
children per day in 1957 to 4,361 in 1967. In
both yers the Cook County Department of Public
Aid alone accounted for almost all of the
foster home care provided by governmental agen-
cies.
The proportion of children in agency adoptive
homes remained the same throughout the study
period--11 percent of the total children in
foster placements each day. Virtually all of
this care was provided by voluntary agencies,
which served more than 1,000 children a day in
this type of setting in both years.

Figure D.DAILY NUMBER OF CHILDREN
1957
1967
2,000 4,000
Children in Foster Placements, By Ty
6,000 8,000 10,000
FOSTER FAMILY HOMES
49%
60%
FOSTER FAMILY HOMES
58%
ADOP-TIVE
HOMES11%
OTHER
5%
ADOPTIVEHOMES
11%
2,000
Source: Table 3
4,000 6,000
Another trend evident among Chicago Area child
welfare agencies during the past decade was a
move toward more utilization of "other" types
of placements, such as boarding schools, special
out-of-state institutions, hospitals, and
boarding schools. The number of children in
"other" settings more than doubled during the
past decade, growing from an average of 522
youngsters per day in 1957 to 1,163 ten years
later.
2. CHILDREN IN AGENCY ADOPTIVE HOMES
There was a 15 percent increase over the past
decade in the average daily number of children
in agency adoptive homes in the Chicago Area.
11
8,000 10,000
The average r1957 to 1,262
As Figure Eall childrenthis period 1In 1957, 13percent of t1,052 childcared for apchildren (1,1
total.
1These figureof childrenlast day ofof childrenstudy year.

Children in Foster Placements, By Type of Living Situation, 1957 and 1967
n Nfl, s 0,LOW o,ww,.. y,... 14,Wli ,,,... i woe
.
-ADOP-
FOSTER FAMILY HOMES TIVEHOMES
490/ 11%
OTHER
5%1
I
I
I
OTHER
14.000
60% I
FOSTER FAMILY
58%
-,
HOMESADOPTIVE
HOMES11% 10%
69%
12000A nnn A nnn A nnn
I10.000
16.0
ong Chicago Area childthe past decade was ation of "other" typesoarding schools, specials hospitals, andumber of children inan doubled during them an average of 522
57 to 1,163 ten years
DOPTIVE HOMES
ncrease over the pastily number of childrenin the Chicago Area.
11
The average rose fram 1,095 children a day in
1957 to 1,262 in 1967.1
As Figure E so clearly illustrates, virtually
all children in agency adoptive homes during
this period were served by voluntary agencies.
In 1957, 13 private agencies accounted for 96
percent of the total caseload (an average of
1,052 children a day), and in 1967 14 agencies
cared for approximately the same number of
children (1,076), which was 85 percent of the
total.
00
0
CO
1These figures represent only the average numberof children in agency adoptive homes on the
last day of the month, and not the total number
of children placed in adoptive homes eachstudy year.

Figure E. Children in Agency Adoptive Homes,1957 through 1967
DAILY AVERAGE NUMBER OF CHILDREN
2,00
1,000
0
19 7
TOTAL
GOVERNMENTAL
adoptive homesfor minority gl
period, the totadoptive homescies rose fromto 787 ten yea/fairly generalvoluntary agencadoptive homesthe size of th(
VOLUNTARYing from avera(
this type of p:
Source: Same as Table 5
60 61 62 r- '64 65 66 '617
While these totals seem to suggest thatvoluntary adoption agencies were, in effect,
'N merely "standing still" during the past decade,vm4 closer examination of the data shows that,
internally, this was not the case. Rather,
the totals represent a balance between two
opposing trends: on the one hand, a decline inthe number of children served in adoptive homesby Catholic agencies and, on the other hand, anincrease in ;11e number served by all othervoluntary agencies.
Table 5 shows that between 1957 and 1967 theaverage daily number of children in adoptive
homes under the care of Catholic Charities(Catholic Home Bureau in the earlier year)dropped from 409 to 289. Agency administratorsattribute this decrease to two factors: the
closing, due to lack of personnel, of theirOverseas Adoption Program in 1965, and in-creasing difficulties in recruiting suitable
12
Reports from sctheir daily mi.;
significant sh:and practices 1
decade. Some 1
changes includlexpansionchildren,place" chiliberalizaments fore.g., oldenatural ch
... a streamliand home srequired,
... increasedagencies w
2Conversation 1Department, Ci
3Letters to tipChildren's HmChildren's Bw.and Lutheran 1(April 1969).

kgency Adoptive Homes,1957 through 1967
64
GOV RNMENTAL
/65 66 '67
uggest thatwere, in effect,ng the past decade,ta shows that,case. Rather.ce between twohand, a decline in
d in adoptive homesthe other hand, an
d by all other
957 and 1967 thedren in adoptivelolic Charitiesearlier year)
ency administratorsNvo factors: the
5onnel, of their2 1965, and in-ruiting suitable
12
adoptive homes in the City Proper, especiallyfor minority group children.2 During the same
period, the total number of children in agency
adoptive homes served by other voluntary agen-
cies rose from an average of 643 a day in 1957
to 787 ten years later. This upward trend was
fairly general with 11 of the remaining 13
voluntary agencies reporting more children in
adoptive homes in 1967 than in 1957. However,
the size of the increases varied widely, rang-
ing from averages of 3 to 40 more children in
this type of placement each day.
Reports from some agencies that had increased
their daily caseloads suggested that somesignificant shifts in professional attitudesand practices had occurred during the past
decade. Some of the frequently mentionedchanges included:
expansion of services to handicappedchildren, Negroes, and other "hard-to-
place" children... liberalization of eligibility require-
ments for adoptive parents to include,
e.g., older couples or those with
natural children... a streamlining of application procedures
and home study methods to reduce the time
required, and
... increased cooperation among adoptionagencies with more intra-agency placements3
2Conversation with the Director, Social Service
Department, Catholic Charities.3Letters to the Welfare Council from IllinoisChildren's Home and Aid Society, JewishChildren's Bureau, Lake Bluff Home for Children,
and Lutheran Welfare Services of Illinois
(April 1969).

TABLE 5. CHILDREN IN AGENCY ADOPTIVE HOMES IN THE CHICAGO AREA,
1957 AND 1967
AgencyAuspices
1957
Daily No. Percent
Childrena of Total
1967
Daily No. Percent
Childrena of Total
PercentChange
TOTAL 1,095 100.0 1,262 100.0 +15.3
Governmental 43 3.9 186 14.7 +332.6
State 17 1.5 119 9.4 +600.0
Other 26 2.4 67 5.3 +157.7
Voluntary 1,052 96.1 1,076 85.3 +2.3
Catholic 409 37.4 289 22.9 -29.3
Other 643 58.7 787 62.4 +22.4
Base: 1957 - 17 agencies (4 governmental and 13 voluntary)
1967 - 17 agencies (3 governmental and 14 voluntary)
Source: C-1 reports to the Welfare Council and special reports
from the Illinois Department of Children and Family Services
(See Technical Appendix, II-A)aAverage number under care on last day of each month.
Increased Services fromPublic Agencies
Governmental agencies also made important
strides during the past decade, increasing the
average daily number of children they served
in adoptive homes from 43 in 1957 to 186 in
1967.
The Illinois Department of Children and Family
Services, established in 1964, accounted for
most of this increase. In 1957, its predeces-
sor, the Illinois Department of Public Welfare,
had supervised an average of only 17 children
a day in adoptive placements, but by 1967 the
13
50 Pe
There were indicmore rapidly thaments during the
Table 6 shows tltotal number of2,484 in 1957 tccent increase WE

VE HatIES IN THE CHICAGO AREA,
1967Daily No.Childrena
Percentof Total
1,262 100.0
186 14.7119 9.4
67 5.3
1,076 85.3289 22.9787 62.4
PercentChange
+15.3
+332.6+600.0+157.7
+2 .3-29.3+22 .4
ental and 13 voluntary)ental and 14 voluntary)
e Council and special reportsildren and Family Services
day of each month.
ortantreasing theey servedo 186 in
and Familyunted fors predeces-)lic Welfare,7 children)3r 1967 the
13
new state agency was super-vising an average of 119, orclose to one-tenth of allchildren in Chicago Areaagency adoptive homes.
In addition to providing directcare services, the new stateagency has offered leadershipto local agencies in develop-ing cooperative inter-agencyservice programs like theCook County Adoption Informa-tion Service through whichvoluntary and public agencieshave worked together in devel-oping programs to publicizeadoption and to recruit moreadoptive homes. The Depart-ment also sponsors the StateAdoption Exchange, a central-ized listing of children avail-able for adoption and offamilies seeking youngsters toadopt.
50 Percent More Adoptions
There were indications that adoptions increasedmore rapidly than agency adoptive home place-ments during the past decade.
Table 6 shows that in Cook County alone thetotal number of children adopted rose from2,484 in 1957 to 3,795 in 1967. This 53 per-cent increase was a substantial one, but it

r-4
TABLE 6. CHILDREN ADOPTED THRCUGH THE CIRCUIT COURT OF COOK COUNTYa,
ANNUAL TOTAL NUMBER, 1957 AND 1967
Type ofAdoption
1957Total No. PercentChildren of Total
1967Total No. PercentChildren of Total
PercentChange
TOTAL 2 ,484 100. 0 3 , 795 100. 0 +52.8
By relatives 818 32.9 1,311 34.5 +60.3
By non-relatives 1,666 67.1 2 ,484 65.5 +49.1
Agencies:Governmentalb (635) (25.6) (1,079) (28.5) (+69.9)Voluntary (1,031) (41.5) (1,405) (37. 0) (+36.3)
Source: Annual Reports from the Cook County Department of Public Aid,Division of Court Services.
aFigures pertain only to adoptions completed in Cook County.available for DuPage and Lake Counties.
bIncludes both "agency" arranged adoptions and "independent"investigated by agency.
was much smaller than the comparable nation-wide gain of 74 percent during the sameperiod.4
In both years, approximately one-third of thechildren were adopted by stepparents or otherrelatives The remaining two-thirds--1,666 in1957 and 2,484 in 1967--were adopted by'non-relatives.
4U.S. Department of Health, Education, andWelfare, Children's Bureau, Adoptions in 1967Supplement to Child Welfare Statistics, 1967,(Statistical Series 92, 1968).
14
Data not
adoptions
Few Adopt
Despite the advthere are indicfailed to keepsurvey conducte1965 revealed ahomes in relatiwhom adoptive pstudy found tha

PTED THRCUGH THE CIRCUIT C(URT OF COOK COUNTYa
957 AND 1967
More than one-half of the"non-relative" adoptions werehandled by voluntary agencies:1,031 in 1957 and 1,405 in1967. Most of these represent-
ed "agency adoptions", in which
the agency had placed the child
1957
tal No. Percent
ildren of Total
1967
Total No. Percent
Children of Total
PercentChange
,484 100.0 3 ,795 100.0 +52.8 in the prospective adoptivehome and supervised the place-
818 32.9 1,311 34.5 +60.3 ment for six to twelve months
,666 67.1 2 ,484 65.5 +49.1 until final papers were granted
by the court.
(635) (25.6) (1 , 079) (28.5) (+69.9)
,031) (41.5) (1,405) (37.0) (+36.3)An increasing number of
s from the Cook County Department of Pulblic Aid,
rices.
o adoptions completed in Cook County. Ihrta not
)ad Lake Counties.arranged adoptions and "independent" adoptions
the comparable nation-t during the same
mately one-third of theby stepparents or other_mg two-thirds--1,666 in
--were adopted by
mlth, Education, andhuNalwa, Adoptions in 1967
Lelfare Statistics, 1967,12, 1968).
14
ftnon-relative adoptions werehandled by governmental agencies:1,079 in 1967, as compared to635 in 1957. Most of thesewere "independent adoptions"in which the public agency con-ducted social studies of homesin which the prospective parentshad obtained the child withoutthe aid of a social agency.
Few Adoptions in Relation to Need
Despite the advances made in the past decades
there are indications that adoption services
failed to keep pace with needs. A special
survey conducted by the Welfare Council in
1965 revealed a chronic shortage of adoptive
homes in relation to the number of babies for
whom adoptive placements were requested. The
study found that in December, 1964 and

January, 1965 14 adoption agencies in Cook
County received more than twice as many re-
quests to place babies in adoptive homes (645)
as they were able to accept (282).5
Since national statistics show that 87 percent
of the children adopted by unrelated persons in
the United States in 1967 were born out of
wedlock,6 it may be pertinent to note that the
total number of children adopted by non-rela-
tives in Cook County that year was very small
in relation to the total number of illegitimate
live births that were reported. There were
over five times more illegitimate births
(14,607) 7 than adoptions by non-relatives (2,484).
This is not to suggest that there is any
necessary relationship between the number of
illegitimate births and the number of adoptions.
Not all unwed mothers want to place their babies
in adoption; many prefer to keep them and make
other arrangements for their care.
Moreover, three-fourths of the babies born out
of wedlock in Cook County in 1967 were Negro8,
and the limited supply of adoptive homes for
Nbgro babies makes adoption an option that is
seldom available to their mothers. How many
Negro womenbabies for aopen to them
There is, hcsmall number
in compariscchildren adcIllinois inand these irwell as Negr
"independen1Division ofDepaitment c
and11865, or
total--were
3. CHILDRE
After nine :
foster famiagencies re
in Figure Faverage numfamily homechildren peage (6,807)level.
5Annie O. Blair, Demand for Adoption Services 9U.S. Depar
in Metropolitan Chicago, (Welfare Council of Welfare, (
Metropolitan Cbicago, Publication NO. 1009, 1°Cook Coun1
May 1965).of Court f
9U.S. Department of Health, Education, and Welfa:e Cc
Welfare, Op. cit.11The /11inc
7 Illinois Department of Public Health, Vital Services,
Statistics, (1967).a foster I
817577175epartment of Public Health, Op. cit. a .. res:
15

in Cookmany re-homes (645)
5
t 87 percented persons inn out ofote that they non-rela-I very small
illegitimate'here were
birthselatives (2,484).
is anynumber ofof adoptions.
e their babieshem and make
ies born outvere Negro8,homes forion that isHow many
.on ServicesCouncil ofNo. 1009,
;ior, and
ilth, Vital
1th, Op. cit.
15
Negro women would choose to relinquish their
babies for adoption if this were an alternative
open to them is not known.
There is, however, ample evidence of the very
small number of Negro children who are adopted
in comparison to Caucasians. Of the 5,243
children adopted by unrelated persons in
Illinois in 1967, only 8 percent were Non-white,
and these included Orientals and Indians, as
well as Negroes.9 Similarly, out of 669
"independent" adoptions processed by theDivision of Court Services of the Cook County
Department of Public Aid during part of 1964
and 1965, only 51 children--or 8 percent of the
total--were Negro.10
3. CHILDREN IN CaTER FOSTER FAMILY HOMES
After nine years of expansion, the volume of
foster family care provided by Chicago Area
agencies reached a plateau in 1966, as shown
in Figure F. Between 1957 and 1966, theaverage number of children in local foster
family homes11 went up 43 percent (from 4,761children per day to 6,810), but the 1967 aver-age (6,807) remained at the previous year's
level.
8U.S. Department of Health, Education and
Welfare,19Cook County Department of Public Aid, Division
of Court Services, Special Report to the
Welfare Council on Independent Adoptions, 1966.
11The Illinois Department of Children and FamilyServices, which licenses these homes, defines
a foster home as "a facility for child care in
a ... residence of a family ... or persons who

Figure F. Children in Other Foster Family Homes.1957 through 1967
DAILY AVERAGE NUMBER OF CHILDREN
5,000
TOTAL
GOVERNMENTAL
m.
3,000.
1,000.
o,1957
Source: Sams as Table 7
'61 '62 '66 '67
It is still too early to determine if the 1967plateau represented only a temporary lull infoster family placements or marked, instead,the beginning of a period of stability. This
lack of growth was, at any rate, not in linewith the U.S. Children's Bureau's 1966 predic-tion of continued expansion in foster familycare throughout the country. 12
receive no more than four children for ...providing family care and training." Illinois
Department of Children and Family Services, ADirectory of Children's Services (1968).
12u.s.A/a...-partment of Health, Education, and
Welfare, Children's Bureau, Foster Care ofChildren Major National Trends and Prosmsts,(1966).
16
Pub
Figureaccountfoster
1957, p2,426 fof allArea.
4,361
total.
One pub]
ment offamily
the vol.(
additiol
direct (
toward 1
foster 1
agencie:
contrib(
childrel
day.13
13It shccompleby theactualof malcomparPurchswith F(Spriron PurCommit1968).

r Foster Family Homs,1957 through 1967
GOVERNMENTAL
'64 '65 66 '67
!termine if the 1967temporary lull inmarked, instead,stability. This
rate, not in lineAreau's 1966 predic-1 in foster family
12
children for ...training." Illinois
d Family Services, Aervices (1968).
, Education, andu, Foster Care ofTrends and Prospects,
16
Public Agencies Provide Most of Care
Figure F also shms that governmental agencies
accounted for virtually all of the increase in
foster family care over the past decade. In
1957, public agencies cared for an average of
2,426 foster children daily, more than one-half
of all youngsters in foster homes in the Chicago
Ar-sa. By 1967, they were serving an average of
4,361 children daily, almost two-thirds of the
total.
One public agency alone--the Cook County Depart-
ment of Public Aid--had more children in foster
family homes, on the average, (3,556) than all
the voluntary agencies combined (2,446). In
addition to the children to which it was providing
direct care, the Department also made payments
toward the support of about one-fourth of the
foster children under the care of voluntary
agencies each day. Hence, it was to some extentcontributing toward the care of three out of four
children in local foster family placements each
day.13
13 It should be noted that some voluntary agenciescomplained that the "full" rupport rates paidby the Cook County Department of Public Aidactually covered less than one-half of the costof maintaining a child in a foster home. For
comparison, see Leroy H. Jones, Public AgencPurchase of Service from Voluntary Agencies,with Focus on Institutional Services(Springfield, Ill.: Report of Sub-committeeon Purchase of Care, Inter-Agency RelationshipsCommittee, Child Care Association of Illinois,1968).

TABLE 7, CHILDREN IN OTHER FOSTER FAMILY HOMESa IN THE CHICAGOAREA,
1957 AND 1967
AgencyAuspices
1957
Daily No. b Percent
Children of Total
1967
Daily No.b Percent
Children of TotalPercentChange
TOTAL 4,761 100.0 6,807 100.0 +43.0
Governmental 2,426 51.0 4,361 64.1 +79.8
State 58 1.2 741 10.9 +1177.6
Dept(s) of Aid 2,289 48.1 3,556 52.3 +55.4
Family Court 79 1.7 64 .9 -19.0
Voluntary 2,335 49.0 2,446 35.9 +4.8
1,259 26.4-1,722 25.3 +36.8
CatholicOther 1,076 22.6 724 10.6 -32.7
Base: 1957 - 19 agencies (4 governmental and 15 voluntary)
1967 - 15 agencies (3 governmental and 12 voluntary)
Source: C-1 reports to the Welfare Council and S?ecial Report from
the Juvenile Court of Cook County.aMost were "boarding homes," some were "free homes," "work-wage homes,"
group homes". (See Technical Appendix, II-A).bAverage number under care on last day of each month.
Although somewhat over-shadowed by the magnitude
of the Cook County Department's program, the
Illinois Department of Children und Family
Services Plso played an important role in the
expansion of foster care services during the last
decade. While its predecesm3r, the IllinoisDepartment of Public Welfare, had in 1957 served
an average of only 58 children a day in foster
family homes, the Illinois Department was in 1967,
only three years after its inception, already
providing foster home care to an average of 741
youngsters a day.
17
This agreemestatutory ltwhich preclumonth in 196family home.capped the Cappropriateof settingstoo, that bomore effectiand other chDepartment,trate on jud
4

R FAMILY HOMESa IN THE CHICAGO AREA,
rcentf Total
100.0
51.01.2
48.11.7
49.026.422.6
Daily No.Children
1967Percentof Total
PercentChange
6,807
4,361741
3,55664
2,4461,722724
100.0
64.1
10.9
52.3.9
35.925.3
10.6
+43. 0
+79.8+1177.6
+55.4- 19.0
+4.8+36.8- 32.7
.rnmental and 15 voluntary)rnmental and 12 voluntary)fare Council and Special Report from
ty.
were "free homes," "work-wage homes,"
kppendix, II-A).st day of each month.
by the magnitudeprogram, theand Family
nt role in thees during the lastthe Illinois
ad in 1957 serveda day in fosterrtment was in 1967,ption, alreadyn average of 741
17
An important milestone inlocal foster home careoccurred in 1966 when theIllinois Department enteredinto an agreement with theJuvenile Court of Cook Countywhereby it was decided thatthe Court would begin tophase out its own foster careprogram and refer all newcases requiring foster place-ment to the Illinois Depart-ment for care, if not eligi-ble for service from the C2Cook County Department of CVPublic Aid.
This agreement was, in part, necessitated bystatutory limitations on County Boarding FUnds,which precluded the Court's paying more than $70 P.
month in 1966 for a child's care in a fosterfamily home. This low rate had seriously handi-capped the Court social workers' efforts to makeappropriate placements for children in the kindsof settings they required. It was thought,
too, that both agencies might serve childrenmore effectively if responsibility for placementsand other child welfare services were left to theDepartment, thereby freeing the Court to concen-trate on judicial matters.

Shifts in Voluntary Sector increa.turbed
As a result of mergers and changes in programs, quire 1
the number of voluntary agencies providingfoster family care in the Chicago Area declined .. a trew
from 15 in 1957 to 12 in 1967. Nonetheless, more r
the volume of children in foster home care under type o
voluntary auspices increased slightly from anaverage of 2,335 children a day in 1957 to 2,446 servic
ten years later, and de
Table 7 shows that this increase was almost en- One executi
tirely due to the efforts of Catholic Charities, foster homc
which expanded its volume of foster family care prohibitiv
by more than one-third during this period. The cost of ca
average daily number of foster children served cies offer
by this agency grew from 1,259 in 1957 to 1,722 iceel5 C
in 1967. In both years Catholic Charities pro- problems a
vided care for more than one-fourth of all serious fi
children in local foster family homes, them to accment from e
CV In contrast, the number of children in foster Children a
family care served by other voluntary agencies Department
declined by one-third during the same period, stated, fu
dropping from an average of 1,076 a day in 1957 rates paid
to 724 in 1967. Of the eleven other voluntary level more
agencies that provided foster family care in be forced t
1967, only two served more children in 1967 than program in
they had in 1957. The remaining nine served from
8 to 141 fewer youngsters each day.
Agency administrators attributed this decreaseto such diverse factors as the following:
increased efforts to provide caseworkservices to children and their familiesin their own homes and to avert placementwhenever possible
18
14Letters tChild Weland Aid SLutheran1969).
15Letter toWelfare S

Sector
.hanges in programs,ncies providinglicago Area declined
67. Nonetheless,oster home care underd slightly from anday in 1957 to 2,446
Tease was almost en-f Catholic Charities,f foster family careng this period. Theter children served259 in 1957 to 1,722holic Charities pro-e-fourth of allmily homes.
children in foster, voluntary agenciesg the same period,1,076 a day in 1957
ven other voluntaryer family care inchildren in 1967 thanining nine served fromach day.
buted this decreasethe following:
lovide casework
1
lu their familiesto avert placement
18
... increased numbers of applicants too dis-turbed for foster home placement who re-quire residential treatment instead
a trend toward public agencies' assuming
more responsibility for providing this
type of care, and
... service cutbacks necessitated by shortagesand depletion of financial resources14
One executive noted, "The cost of operatingfoster home programs has made this increasinglyprohibitive, especially in light of the highcost of casework and the fact that public agen-
cies offer no reimbursement for casework serv-ices".15 Catholic Charities noted similarproblems and in November 1968 announced that a
serious financial crisis made it impossible for
them to accept requests for toster family place-
ment from either the Illinois Department of
Children and Family Services or the Cook CountyDepartment of Public Aid. Agency officialsstated, further, that unless the purchase-of-carerates paid,by public agencies were raised to alevel more commensurate with costs, they wouldbe forced to phase out their entire foster homeprogram in 1969, and refer all children in their
14Letters to the Welfare Council from EvangelicalChild Welfare Agency, /11inois Children's Home
and Aid Society, Jewish Children's Bureau, and
Lutheran Welfare Services of Illinois, (April,
1969).15Letter to the Welfare Council from LutheranWelfare Services of Illinois,(April, 1969).

foster homes to the public agencies for direct
services.18
Brief mention might be made of group homes, aterm given to a variety of foster care facilities
which range from traditional foster homes for four
to eight children to small treatment-oriented in-
stitutions staffed by agency employees calledhouseparents or counselors, rather than foster
parents.
Professionals have, for many years, discussed the
increasing need for group homes, particularly for
adolescents, for young unmarried girls who are
pregnant, and for the youngsters in mental hos-
pitals or institutions for delinquents who are
ready for release but lacking suitable homes of
their own. A group home may help them make the
transition to community life.
Nonetheless, the gap between needs and services
continues to be wide. Although there are no
precise statistics available on the number of
Chicago Area children in this type of setting, a
"guesstimate" based on the maximum capacities ofall known facilities of this type in the local
area in 1967 would place the total at less than
100 children a day.
4. CHILDREN IN CHILD WELFARE INSTITUTIONS
A downward trend in the number of children
served in Chicago Area child welfare institutions
that began in 1939 continued between 1957 and
1967. During the past decade, the number of
local iastitutions of this type decreased from
18Memorandum to the Public Agencies from Catholic
Charities (November, 1969).
19
42 to 35 and, aldaily resident(from 3,392 chi
This decline amto national trezBureau. That adaily populatiozin the United S'tween 1933 and :
local, nor the zall types of ch:Figure G clearlitrend in the Chsharp reductionate-care facilithe same time,the daily resided facilities ftemporary-care
These patternsfessional thinkthat a child shonly when suchyoungster's emoa necessary serwell in a homeare not usuallyments for youngfor a substitutinstitutions th
17US DepartmerWelfare, ChilcChildren, Majc(1966).
18Seo Technicalof the classi

encies for direct
,>1 group homes, aoster care facilitiesfoster homes for four
reatment-oriented in-employees calledrather than foster
years, discussed thees, particularly for
ried girls who areters in mental hos-olinquents who are
g suitable homes of
help them make the
needs and servicesugh there are noon the number ofs type of setting, aaximum capacities oftype in the localtotal at less than
E INSTITUTIONS
er of childrenwel fare institutionsbetween 1957 and
e, the number ofvpe decreased from
er.cies from Catholic
19
42 to 35 and, as Table 8 shows, their average
daily resident population dropped by 25 percent
(from 3,392 children a day to 2,530).
This decline mons local institutions was similar
to national trends described by the U.S. Children's
Bureau. That agency reported that the total
daily population of all child welfare institutions
in the United States declined by 45 percent be-
tween 1933 and 1965.17 However, neither the
local, nor the national, decline was general for
all types of child welfare institutions. As
Figure G clearly demonstrates, the downward
trend in the Chicago Area was entirely due to
sharp reductions in service provided by congreg-
ate-care facilities for dependent children. At
the same time, there were dramatic increases in
the daily resident populations of treatment-orient-
ed facilities for disturbed children and of
temporary-care institutions for older chi1dren.18
These patterns are in line with current pro-
fessional thinking. It is generally asserted
that a child should be placed in an institution
only when such a setting can better meet the
youngster's emotional needs or provide him with
a necessary service that cannot be obtainsd as
well in a home environment. Thus, institutions
are not usually considered to be suitable place-
ments for younger children whose primary need is
for a substitute home, but small specialized
nstitutions that offer treatment services are
17US Department of Health, Education, and
- Welfare, Children's Bureau, Foster Care of
Children Major National Trends and Prospects,
(1966).18See Technical Appendix, 1I-8-1 for a definition
of the classifications used in this report.
-3

C%1
TABLE 8. CHILDREN IN CHILD WELFARE INSTITUTIONS IN THE CHICAGO AREA, BY
TYPE OF INSTITUTION, 1957 AND 1967
Auspices andType of
Institution
1957
Daily No. Percent
Childrena of Total
1967Daily No. Percent
Childrena of Total
PercentChange
TOTAL 3,392 100.0 2,530 100. 0 -25.4
Governmental (70) (2.1) (180) (7.1) (+157.1)
Voluntary (3,322) (97.9) (2,350) (92.9) (-29.3)
Treatment-oriented 128 3.8 576 22.8 +350. 0
Congregate-care 2 ,929 86.3 1,531 60.5 -47.7
Temporary-care 335 9.9 423 16.7 +26.3
Base; 1957 - 42 institutions (3 governmental and 39 voluntary)
1967 - 35 institutions (3 governmental and 32 voluntary)
Source; Summary of Tables 9, 10, and 11aAverage number under care on last day of each month.
regarded as the most appropriate type of settingfor some adolescents and for some younger chil-dren with serious emotional problems.
Twice as Many Treatment-OrientedFacilities in 1967
In this study treatment-oriented institutionsincluded comprehensive and casework group carefacilities that provided special remedial serv-ices, including individual therapy or counseling,to children with serious emotional problems. In
1957 there were, within the Chicago Area, onlyseven such child welfare facilities; and they had
a combined capacity of 146 beds. By 1967 there
were twice as many treatment-oriented facilities
20
(16)
the c
Tablc
popul
tripl
surgi
child
in 19
Each c
tieswas, c
care i
and Lir
the nc
sters
staff.
and pE
itensi
19See Table X, Technica20Events in 1968 sugges
have halted, or evenrise in treatment-ori,the study years. In
institutions operatinmerged with other facverted to other typestrators described risreimbursement from puin their decision totreatment services.Public Agency Purchas,Agencies. )

NRE INSTITUTIONS IN THE CHICAGO AREA , BY
67
'ercentf Total
1967Daily No. PercentChildreiia of Total
PercentChange
100. 0 2 ,530
(2.1) (180)(97.9) (2,350)
100.0 -25.4
(7.1) (+157.1)(92.9) (-29.3)
3 . 8
86.39 . 9
576
1,531
423
22.8 +350. 0
60.5 -47. 7
16.7 +26.3
_overnmental and 39 voluntary):overnmental and 32 voluntary). and 11t. day of each month.
type of settingyounger chil-
terns.
,-iented
institutionsrk group careremedial serv-oy or counseling,1 problems. In
igo Az ea, onlyles; and they hadBy 1967 there
_nted facilities
20
(16) with more than four timesthe combined capacity (725).19Table 9 shows that the residentpopulation of these institutionstripled during this period,surging from an average of 128children a day in 1957 to 576in 1967.20
Each of the treatment facili-ties "added" during this periodwas, originally, a congregate-care facility that had modifiedand upgraded its program to meetthe needs of disturbed young-sters by hiring additionalstaff, including psychologistsand psychiatric consultants,itensifying the in-service
19See Table X, Wchnical Appendix, II-8-4.20Events in 1968 suggest that rising costs may
have halted, or even reversed, the dramaticrise in treatment-oriented facilities duringthe study years. In 1968, four of the 16institutions operating in 1967 had eithermerged with other facilities, closed, or con-verted to other types of service. Adminis-
trators described rising costs and inadequatereimbursement from public agencies as factorsin their decision to terminate residentialtreatment services. (See Leroy H. Jones,Public Agency Purchase of Service from VoluntaryAgencies.)

Figur* G. Children in Child Welfare Institutions,1957 and 1967
DAti t41JV3II Ot C1K11011_14
/JIM'
3,50N
3,000.
2,0013
1,500i
1,0004
5001
I% Of ufANGE!
25
LAID 4111 MIND .1
CONGREGATE CAPE
17 7
a a arial.I TREATMENT
I ORIENTED+ 350 0
-277TEMPORAFY CARE
1957Some: Tobk 8
1967
training programs for houseparents, and re-ducing the number of children under care.21
As a result, the cost of caring for a child
211n 1967 the average capacity of the 16 localtreatment-oriented facilities in Table 9 was
45, as compared to an average capacity of 168
21
was ofter
treatmentviding co
In both s
treatmentwere uncle
voluntarynon-sectaabout eve
non-secta
The Statethe sing]welfare iperiod.
day in 19servicesinto a dachildren.
among ttiea in
22A 1966Welfart
stitutjchild c
stitutj
per chj
facilil
Admini!
Analysj
(WelfaiPublics

Watfans Institutions,1937 and 1967
1967
qits, and re-
ndert for a child
)f the 16 localin Table 9 wascapacity of 168
21
was often two or three times higher in atreatment-oriented facility than in one pro-viding congregate-care.22
In both study years, all but one of the localtreatment-oriented child welfare institutionswere under voluntary auspices. rive of the sixvoluntary institutions in 1957 were undernon-sectarian auspices, but by 1967 they wereabout evenly divided between sectarian (9) andnon-sectarian (6).
The State of Illinois William Healy School wwsthe single governmental treatment-oriented childwelfare institution in operation during the study C 0
period. It served an average of 21 children aday in 1967. In September 1968 its residentialservices were terminated, and it was convertedinto a day school for emotionally diiturbedchildren.
among the 13 volun...._-y congregate-care facili-
ties in Table 10.
01
22A 1966 cost analysis study conducted by theWelfare Council mmyng 21 local children's in-stitutions revealed a median daily cost perchild of $10.07 among six congregate-care in-stitutions as compared to a median daily costper child of $24.84 among 15 treatment-orientedfacilities. (See Leroy H. Jones, New Tools forAdministration of Children's Institutions, AmAnalysis of Time, Costs, and Operations,(Welfare Council of Metropolitan Chicago,Publication No. 1026, 1967).

TABLE 9. CHILDREN IN TREATMENT-ORIENTED CHILD WELFARE INSTITUTIONS IN
THE CHICAGO AREA , 1957 AND 1967
Auspices ofInstitution
1957
Daily Mo.Childrena
Percentof Total
1967
Daily No.
Childrena
Percentof Total
PercentChange
TOTAL 128 100.0 576 100.0 +350.0
Governmental 15 11.7 21 3.6 +40.0
Voluntary 113 88.3 555 96.4 +391.2
Sectarian (14) (10.9) (302) (52.5) (+2057.2)
Mon-sectarian (99) (77.4) (253) (43.9) (+155.6)
Base; 1957-7 institutions (1 governmental and 6 voluntary)1967-16 institutions (1 governmental and 15 voluntary)
Source; C-1 reports to the Welfare Council and Special Reports fromIll. Dept. of Children and Family Services and Sonia ShankmanOrthogenic School. (See Technical Appendix, Part II -E).
aAverage number under care on last day or each month.
Congregate-Care Institutions for DependentChildren Decline by One-Ralf
In contrast to the rapid rise in treatment-oriented facilities, there was a striking de-cline during the past decade in the numter ofchildren served in congregate-care facilities,All local child welfare institutions that didnot provide treatment-oriented or temporary-care services were classified, in this study,as congregate-care facilities.
The number of congregate-care facilities in theChicago Area was halved between 1957, when therewere 30, and 1967, when there were only 14.Only five institutions closed during this period;11 remained open but modified their programs andfacilities into treatment-oriented institutions.
22
Voluntary clthe averagetheir licenpercent lessuggested atrend in th
238ee Table

oRIENTED CHILD WELFARE INSTMITIONS IN Meanwhile, as Table 10 shows,the number of children servedin congregate-care institutions
centrotal
1967Daily No.
Childrena
Percentof Total
PercentChange
for dependent children fell byalmost 50 percent, droppingfrom an average of 2,929 a dayin 1957 to 1,531 in 1967.
0.0 576 100.0 +350.0In both years, voluntary insti-
1.7 21 3.6 4-40.0 tutions served 99 percent of
s.3 555 96.4 +391.2 the children in congregate-
0.9) (302) (52.5) (+2057.2) care facilities. Catholic In-
7.4) (253) (43.9) (+155.6) stitutions alone provided care
vernmental and 6 voluntary)overnmental and 15 voluntary)are Council and Special Reports from
Services and Sonia Shankman1 Appendix, Part II-B).t day of each month.
for Dependentgalf
treatment-striking de-
:lie number of
re facilities,ions that did
temporary-a this study,
cilities in the1957, when therere Jnly 14.
ring this period;eir programs andcd institutions.
22
for around two-thirds of thechildren in this type of in-stitution, serving an averageof 1,752 children a day in1957 (60 percent Of all localyoungsters in this type ofplacement) and 1,065 in 1967(70 percent of the total).
Voluntary congregate-care facilities were, onthe average, operating at only 69 percent oftheir licensed capacity in 1967. Tbis was 12
percent less than their 1957 occupancy rate andsuggested a probable continuation of the downwardtrend in tiLlis type of care in future years.23
23 8ee Table R, Technical Appendix, I1-8-3 & 4.

TABLE 10. CHILDREN IN CONGREGATE-CARE CHILD WELFARE INSTITUTIONS
IN THE CHICAGO AREA, 1957 AND 1967
Auspices ofInstitution
1957
Daily No. PercentChildrena of Total
1967
Daily No. PercentChildrena of Total
Percent
Change
TO/AL 2,929 100.0 1,531 100.0 -47.711 moimo
Governmental 15 .5 22 1.4 +46.7
Voluntary 2,914 99.5 1,509 98.6 -48.2
Catholic (1,752) (59.8) (1,065) (69.6) (-39.2)
Other Sectarian (650) (22.2) (148) (9.7) (-77.2)
Non-sectarian (512) (17.3) (296) (19.3) (-42.2)
Base: 1957-30 institutions (1 governmental and 29 voluntary)
1967-14 institutions (1 governmental and 13 voluntary)
Source: C-1 reports to Welfare Council & Special Reports from Ill.
Dept. of Children and Family Services. (See Technical Appendix, II-B)
aAverage number under care on last day of each month.
Shortage of Temporary TABLE 11. CHILDREN IN TEMPORARY
Care Facilities AND NURSERIES IN THE CHICAGO ARE_
In marked contrast to thegeneral decline among othertypes of congregate-carefacilities for dependentchildren, the number of chil-dren in Cook County's tempor-ary detention facility, the
Arthur J. Audy Home, tripledduring this period. Table 11
shows that there were, on the
average, 137 youngsters a day
in the Audy Home in 1967 await-
ing suitable placemeuts else-
where, as compared to 40 trn
years earlier.
Auspices ofInstitution
1957
Daily No. PerceChildrena of To
Tarn 335 100.
Governmental 40 11.
Voluntaryb 295 88.
Sectarian (236) (70.
Non-sectarian (59) (17.
Base: 1957 and 1967 - 5 agenciesSource: C-1 reports to Welfare C
aAverage number under care on las
bNurseries.
23

bTE-CARE CHILD WELFARE INSTINTIces1967
;7
Percent
of Total
1967
Daily No. Percent PercentChildrena of Taal Change
100.0
. 5
99.5(59.8)(22.2)
(17.5)
1 , 531 100.0
22 1.4
1,509 98.6
(1,065) (69.6)
(148) (9.7)
(296) (19.3)
-47.7
+46.7-48.2
(-39.2)(-77.2)(-42.2)
governmental and 29 voluntary)governmental and 13 voluntary)
re Council & Special Reports from M.ervices. (See Technical Appendix, II -I)ast day of eachmonth.
t-
In 1957 all dependent childrenwere housed in the Arthur J.Audy Home--a closed institutionfor Juvenile delinquents. Theinappropriateness of thisJail-like setting tor young,and already vulnerable, de-pendent youngsters was longrecognized and in 1964 theAUdy Home opened a branch foryounger, dependent youngsters.This is Herrick Rouse, a smallcongregate-care institution ina semi-rural setting outsideof Chicago.
TABLE 11. CHILDREN IN TEMPORARY-CARE CHILD WELFARE INSTITUTICMS
AND NURSERIES IN THE CHICAGO AREA, 1957 AND 1967
1957 1967
Auspices of Daily Pie. Percent Daily No. Percent Percent
Institution Childrena of Total Childrena of Total Change
TOIAL 335 100.0 423 100.0 +26.3
Governmental 40 11.9 137 32.4 +242.5
Voluntaryb 295 88.1 286 67.6 -3.1
Sectarian (236) (70.5) (224) (52.9) (-5.1)
Non-sectarian (59) (17.6) (62) (14.7) (+5.1)
Base: 1957 and 1967 - 5 agencies (1 governmental and 4 voluntary)
Source: C-1 reports to Welfare Council. (See Tech. Appendix I/41)
aAverage numter under care on last day of each month.
bNurseries.
23

By June 30, 1967 Herrick House was alreadyoperating above its physica, capacity of 58, Th
with 60 dependent children under care. There ar
were an additional 99 dependent youngsters in un
the Audy Home on that date, making a total of Ar
159. These 159 children ranged in age fromthree to sixteen years; 50 of them were under th
ten. Some of these youngsters had been in 32
"temporary-care" for as long n l years; and th
no less than one-fourth of them (40) had bunin the institution for six months or more.&'
That young dependent children were being housedin a jail-like atmosphere for months waitingfor placement25 while,at the same time, somevoluntary institutions were operating withone-third of their beds empty, is an obviouscommentary on the uneven quality of childwelfare services provided in the Chicago Area.
Anso
th
sc
ei
Another type of temporary-care facility-- ty
nurseries for infants--were also in high demand cl
during the past decade, operating around 90 th
pa
lc
24Special Report to the Welfare Council from hothe Audy Home, July, 1967.
251n an attempt to stimulate action to improve Du
this situation, Patrick Murphy, an attorney se
for the National Legal Aid and Defender Assoc- vic
iation, filed a lawsuit in February 196926
charging that dependent children in the AudyHome were being deprived of their civil rights 27
since they were not being given equal treat-ment in comparison with dependent children inother institutions and were, in effect, re-ceiving cruel and inhuman punishment by beingheld there. This suit is pending before theU.S. District Court in Chicago.
24

()use was alreadyal capacity of 58,under care. Therendent youngsters in, making a total ofanged in age fromof them were underters had been inng a l years; andthem (40) had beenmonths or more
24
ren were being housed(3r months waitinghe same time, samee operating withpty, is an obviousImlay of childin the Chicago Area.
,!axe facility--
e also in high demand0.ating around 90
Ifare Council from7
te action to improve:-1urphy, an attorney
id and Defender Assoc-in February 1969!hildren in the Audyof their civil rightsg given equal treat-lependent children inere, in effect, re-n punishment by beings pending before thenicago.
24
percent of capacity in both study years.26
There were four nurseries that provided tempor-ary group care to infants and young childrenunder two or three years of age in the ChicagoArea during the study period. All of them were
under voluntary auspices. Between 1957 and 1967,
their total capacity rose slightly from 312 to328, while the average daily number of childrenthey served declined slightly from 295 to 286.27
ADDENDUM
Children in Homes of Parentsor Other Relatives
Any attempt to document the vast volume ofsocial services provided to children living in
their own homes by public assistance programs,schools, courts, family and youth service agen-cies, child guidance clinics, and the many othertypes of organizations active in this field isclearly beyond the scope of this report. None-
theless, brief mention should be made of oneparticular group of youngsters--those served bylocal child welfare agencies while living athome with parents or other relatives.
During the past decade the number of childrenserved in "their own homes" by local childwelfare agencies increased five times, expanding
26e Table X, T*chnical Appendix, II-B-3 & 4.270ne of the four--Augustana Nursery, which
served an average of 21 babies per month in1967--closed its doors in 1968, reportedlybecause its sponsors concluded that they couldnot afford to maintain suitable standards ofoperation in the face of continually risingcosts and the low rate of reimbursement frompublic agencies.

CHILDREN IN HOME OF PARENTS CR OTHER RELATIVES RECEIVING SERVICE
FROM CHILD WELFARE AGENCIES IN THE CHICAGO AREA, 1957 AND 1967ThevaridiftchilChildren in Home
Children in Home of of Parents' or as t
Parents' or Other Other Relatives' alon
Relatives' as Percent of youn
Agency Daily Numbera Percent Total Caseloadb
stud
Auspices 1957 1967 Change 1957 1967 mentServ
TOTAL 450 2,321 +415.8 4.8 15.8 chilin 1
Governmental 286 1,_673 +485.0 5.7 17.9 and
State 224 1,486 +563.4 70.9 48.4 Dep
Other 62 187 +201.6 1.3 3.0 Servtota
Voluntary 164 648 +295.1 3.9 12.2 a d
Lutheran 35 318 +808.6 7.5 39.2
Other 129 330 +155.8 3.4 7,3 Othecre
Base: 1957-20 agencies (4 governmental and 16 voluntary) of t
1967-18 agencies (3 governmental and 15 voluntary) ser
Source: C-1 reports to Welfare Council & Special Reports from youn
Juvenile Court of Cook County. (See Tech. Appendix II-A).
aAverage number under care on last day of each month.
bTotal caseload not shown -- includes children in foster homes,
institutions and other placements.
from an average of 450 a day in 1957 to 2,321
in 1967. The proportion of the agencies' totalcaseload in home of parents or o'cher relativesalso increased. In 1957, for example, the 450children a day represented just under 5 percentof the total caseloads of all the agencies,while in 1967 the 2,321 children per day inhomes of parents or other relatives were nearly16 percent of all children under care.
25
Among voluntaryunder care in pquadrupled from1957 to 648 tenof the decade tpercent of the avoluntary agenciat the beginningamong the differto 50 percent ofThroughout theamong the 1?ade.service.
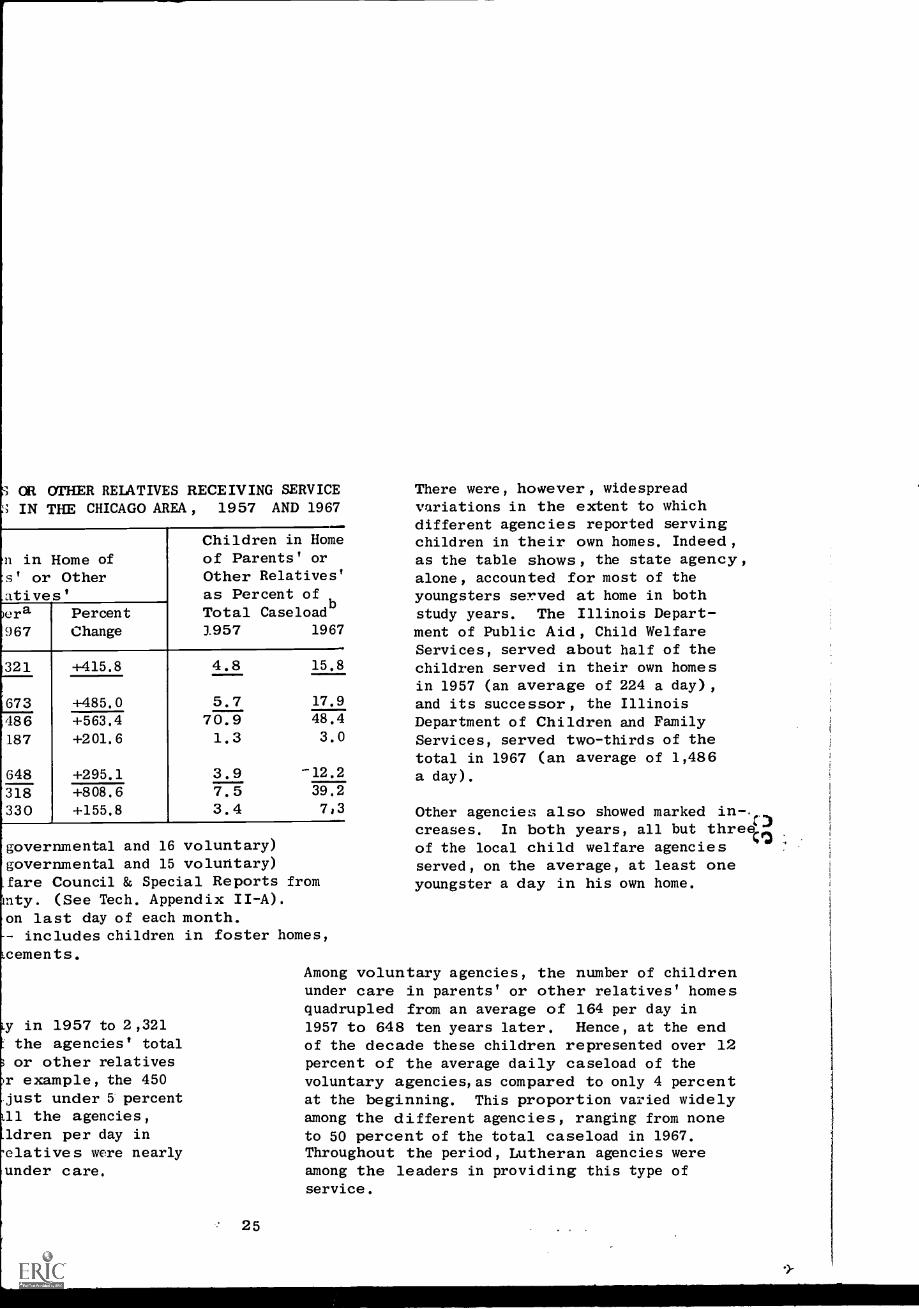
S OR OTHER RELATIVES RECEIVING SERVICES IN THE CHICAGO AREA , 1957 AND 1967
n in Home ofor Other
atives')era Percent967 Change
Children in Homeof Parents' orOther Relatives'as Percent ofTotal CaseloadbJ.957 1967
321 +415.8
673 +485. 0486 +563.4187 +201. 6
648 +295.1318 +808.6330 +155.8
4,8 15.8
5 770,9
1 3
3 , 97.53 . 4
17.948.43.0
-12.239.27,3
governmental and 16 voluntary)governmental and 15 voluntary)
_fare Council & Special Reports fromInty. (See Tech. Appendix II-A).on last day of each month.-- includes children in foster homes,lcements.
ly in 1957 to 2 ,321the agencies' totalor other relatives
)r example, the 450just under 5 percentdl the agencies,.1dren per day inelatives wore nearlyunder care.
25
There were, however, , widespreadvariations in the extent to whichdifferent agencies reported servingchildren in their own homes. Indeed ,as the table shows, the state agency,alone, accounted for most of theyoungsters served at home in bothstudy years. The Illinois Depart-ment of Public Aid, Child WelfareServices, served about half of thechildren served in their own homesin 1957 (an average of 224 a day),and its successor, the IllinoisDepartment of Children and FamilyServices, served two-thirds of thetotal in 1967 (an average of 1,48 6a day).
Other agencies also showed marked in-. C)creases. In both years, all but threernof the local child welfare agenciesserved, on the average, at least oneyoungster a day in his own home.
Among voluntary agencies, the number of childrenunder care in parents' or other relatives' homesquadrupled from an average of 164 per day in1957 to 648 ten years later. Hence, at the endof the decade these children represented over 12percent of the average daily caseload of thevoluntary agencies, as compared to only 4 percentat the beginning. This proportion varied widelyamong the different agencies, ranging from noneto 50 percent of the total caseload in 1967.Throughout the period, Lutheran agencies wereamong the leaders in providing this type ofservice.

To the extent that child welfare agencies were,indeed, providing casework and/or other serv-ices to youngsters in their OWL' homes in orderto avert the need for placement, these figuressuggest an important shift in program direc-tion from foster care to preventive services.A definitive statement that such a shift wasactually taking place cannot be made, however,on the basis of "headcounts" alone, and isbeyond the resources of this study.
26/2.7

CN1.
PART III. CHILDREN IN THREE OTHER TYPES OF INSTITUTIONS
5. SUMMARY
In contrast to the downward trend in theresident population of local child welfare in-stitutions during the past decade, there wasan increase of 9 percent in the number ofChicago Area youngsters in special institutionsfor the retarded, delinquent, and disturbedchild. As shown in Table 12, the estimatednumber of local children in these three typesof institutions grew.from less than 4,000 aday in 1957 to more than 4,300 ten years later.
This upvmentalbulk ofaccountEresideniof thisone-fificeived3,700 di
TABLE 12. CHICAGO AREA CHILDREN IN THREE OTHER TYPES OF IKSTITUTIO/BY TYPE OF INSTITUTION, 1957 AND 1967
Auspices andType ofInstitution
1957Daily No. Percent
Children of Total
1967
Daily No. Percent
Children of TotalPerc(
Chant
TOTAL 3,968 100.0 4,327 100.0 +9,
GovernmentalVoluntary
(3,156)(812)
(79.5)
(20.5)(3,714)
(613)(85.8)
0.4.2)
(+17,
(-24,
Institutions for:Mentally Retarded 2,205a 55.6 1,960 45.3 -11,
Delinquents 1,671 42.1 1,987 45.9 +18
Disturbedb 92c 2.3 380 8.8 +313
Base: 1957 - 18 institutions (13 govermnental and 5 voluntary)1967 - 39 institutions (35 governmental and 4 voluntary)
Source: Summary of Tables 13-15aData is for 1961 because figures not available for 1957bState hospitals only; data for voluntary hospitals not availablecData is for 1955 because figures not available for 1957
28

HUE OTHER TYPES OF INSTITUTIONS
rd trend in thecal child welfare in-t decade, there wasin the number of4 special institutionsent, and disturbed12, the estimatedin these three typesless than 4,000 a
4,300 ten years later.
This upward trend was most evident among govern-mental institutions, which not only provided thebulk of care in both study years, but alsoaccounted for most of the expansion in the daily
resident population. Among public facilitiesof this type the child population rose by almostone-fifth between 1957 (when around 3,200 re-ceived care daily) and 1967 (when more than3,700 did).
HILDREN IN THREE OTHER TYPES OF INSTITUTIONS,_957 AND 1967
1957
hro. Percentof Total
1967Daily No.
Children
Percentof Total
?,)
5a
2c
100.0(79.5)(20.5)
55 642.12.3
4,327
(3,714)(613)
100.0(85.8)
(14.2)
1,960 45.3
1,987 45.9
380 8.8
Percent
Change
+9.0
(+17.7)(-24.5)
-11.1
+18.9
+313.0
ons (13 governmental and 5 voluntary)ons (35 governmental and 4 voluntary)s 13-15
figures not available for 1957a for voluntary hospitals not availablefigures not available for 1957
28
Comparable information aboutthe voluntary sector is in-complete due to lack of datafrom private psychiatric hos-pitals. There was, however,a downward trend in the daily-resident populations of localvoluntary institutions formentally retarded childrenand for delinquents. In 1957,
there were five such institu-tions of this type, all runby Catholic Orders but open tochildren of all religions.Ten years later, in 1967, thenumter of facilities had beenlowered to four and there hadbeen a 25 percent dee-Line indaily resident population(from a total crc about 800down to about 600).

Among governmental institutions, state facilitiesconstituted the major source of care, accountingfor 85 percent of the children in these types ofpublic facilities during both study years. Dur-ing this period, the number of residents under18 in state institutions went up 17 percent,rising from round 2,700 a day at the beginningto close to 3,200 at the end. E7en more impres-sive was the expansion of special state facilitiesfor children. In this ten-year period, thestate established 22 new child care centers, includ-ing four new schools for the retarded, nine newcamps and schools for delinquents, and ninespecial children's units in state mental hospitalsand zone centers. Hence, 2,600 more beds wereadded to these types of state facilities whichnot only provided space to serve more children butalso reduced the overcrowding that prevailed in theearly part of the decade.
Figure H. Ch
DAILY NUMBER OF CHILD
4,500
4,000
3,500
3,000
2,500
2,000
1,500
The overall increase in daily patient populationwas not uniform among the three types oIC special Lowchildren's institutions. As Figure H illustrates,the most dramatic growth took place in psychiatrichospitals. Four times as many Chicago Area children 500
were under care in state hospitals in 1967 (whenabout 400 were "on the books" each day) than in1955 (when there were less than 100). The number
1
of local children in institutions for delinquentsincreased by a more modest 19 percent, rising from Source: Table 12
less than 1,700 a day in 1957 to almost 2,000 in1967, day in 1961
cline is diseem relate
In contrast to these increases was the 11 percent 1,300 new bdecline in the daily patient population of in- during thisstitutions for the retarded in recent years. for a lossThe estimated number of Chicago Area children in Neither didthis type of facility dropped from about 2,200 a of reduced
29

aions, state facilitiesce of care, accountingdren in these types ofxrth study years. Dur-
r of residents underrent up 17 percent,day at the beginning
nd. Even more impres-special state facilities-year period, thehild care centers, includ-he retarded, nine newnquents, and ninen state mental hospitals2,600 more beds wereate facilities whichserve more children buting that prevailed in the
ily patient populationthree types of specialAs Figure H illustrates.,ook place in psychiatricmany Chicago Area childrenospitals in 1967 (whenks" each day) than inthan 100). The numbertutions for delinquents19 percent, rising from957 to almost 2,000 in
ases was the 11 percentnt population of in-d in recent years.icago Area children inped from about 2,200 a
29
Figure H. Children in Three Other Types of Institutions,1957 mmd 1967
4,5001% OF CHANGE)
r--------+313.0 IPSYCHIATRIC
4,000
DAILY NUMBER OE CHILDREN
3,500
3,000
2,500
2,000
1,500
1,000
500
DELINQUENT
+18.9
MENTALLY RETARDED
11.1
1957Source: Table 12
1967
day in 1961 to less than 2,000 in 1967. This de-
cline is difficult to understand. It did notseem related to reduced capacity, because almost1,300 new beds were added to state facilitiesduring this period, which more than compensatedfor a loss of about 150 in the voluntary sector.Neither did the decline appear to be the resultof reduced need, in that the list of accepted
cct?

applicants waiting for openings in statefacilities contained over 60 percent more namesin 1967 than it had in 1960. As a result, someyoungsters had been waiting for as long as eightyears for a vacancy.
6. CHILDREN IN INSTITUTIONS FOR THE MENTALLYRETARDED
There were more than 2,000 Chicago Area childrenin facilities for the mentally retarded duringboth study years, and in addition to these therewere hundreds more in need of institutional carefor whom none was available. Evidence of this
serious and chronic shortage of residentialcare facilities is provided by the long waitinglists, which the Illinois Department of MentalHealth was obliged to keep throughout the studyperiod, of children accepted for admission tostate facilities for wham there were no vacancies.
Growing Gap Between Needsand Facilities
Not only was there a wide gap between needs andfacilities for retarded children, but this gapactually grew wider during the past decade.The estimated number of Cook County chiliren onthe waiting list for care in state facilitiesgrew from 662 in 19601 to 1,083 in 1967,2 an
increase of 64 percent. At the same time, the
lEstimate is for Cook County children in 1960.No data was available on DuPage and Lake Countychildren. See Technical Appendix, III-A-4 fordata source and description of the method usedto derive estimate.
2Ibid., 1967.
30
daily number of cities and in locathe retarded actuAs Table 13 show!5children under cafrom 2,205 a day
Same idea of whatin terms of humanreports of the IlMentally Retarded
This waitingeight yearslist, consishandicappedhome is damafamilies is
A detailed studyin 1964 showed,
'uncontrolleda reason givenfor 80 percem.years of age.
"harmful emotior adults in tpercent of the
...40 percent offast or only p
3Gordon Snow, Menfor the IllinoisConference on Ch

ngs in statepercent more namesAs a result, some
far as long as eight
S FOR THE MENTALLY
Chicago Area childrenlly retarded duringdition to these thereof institutional care
Evidence of this
e of residential1 by the long waiting)epartment of Mentalthroughout the study
2d for admission tothere were no vacancies.
en Needs
op between needs and
ldren, but this gapthe past decade.k County children onn state facilities,083 in 1967,2 anthe same time, the
y children in 1960.
uPage and Lake Countyppendix, III-A-4 for
n of the method used
30
daily number of children served in state facil-
ities and in local voluntary institutions for
the retarded actually declined by 11 percent.
As Table 13 shows, estimates of Chicago Area
children under care in these institutions dropped
from 2,205 a day in 1961 to 1,960 in 1967.
Some idea of what the long waiting lists meant
in terms of human misery may be gleaned from
reports of the Illinois Association for the
Mentally Retarded noting,
This waiting list is sometimes as long as
eight years, and the emergency waiting
list, consisting of children so severely
handicapped that their presence in the
home is damaging to themselves or their
families is often as long as three years.
A detailed study of children on the waiting list
in 1964 showed,
...Ituncontrolled behavior of the applicant as
a reason given for seeking institutional care
for 80 percent of the applicants over six
years of age.
"harmful emotional effects on other children
or adults in the family" was a reason for 55
percent of the applicants.
...40 percent of the applicants were either bed-
fast or only partially ambulatory.
3Gordon Snow, Mental Retardation,(Working Paper
for the Illinois Committee for the White House
Conference on Children and Youth, 1968).

TABLE 13. CHICAGO AREA CHILDREN IN INSTITUTIONS FOR THE MENTALLY
RETARDED, 1961a AND 1967
Auspices ofInstitution
1961a
Daily No. PercentChildren of Total
1967Daily No. PercentChildren of Total
PercentChange
TOTAL
GovernmentalVoluntaryc
Proprietary
2,205 100.0 1,960 100.0 -11.1
1,546b 70.1
659 29.9
NA -
1,458b 74.4502 25.6
(350) -
-5.7-23.8
-
Base: 1961-6 institutions (2 state and 4 vol.); also 5 proprietary1967-9 institutions (6 state and 3 vol.); also 6 proprietary
Source: Estimates based on Ill. Dept. of Mental Health reports.
(See Technical Appendix, III-A).aData is for 1961 because figures not available for 1957.bEstimated for Cook County children only; others not available.cAll voluntary institutions were under Catholic auspices.
...21 percent could not feed themselves.
...one-half were not toilet trained.4
Inadequate State Facilitiesfor the Retarded
Waiting lists notwithstanding, it is importantto note that in both study years state insti-
4 Illinois Association for the Mentally Retarded,Residential Care Needs of the Mentally Retardedin Illinois, 1967).
31
tutithar
Courfacj
13 5
of (
stai
ate(
1,4:
Thi5
seri
thefacj
dur:
In :
fittwoforbotl
sta:
insl
They were LincOln S1and located 180 mil(State School--builtaway.
Between 1961 and 19(of Mental Health confour new children'sthus raising the stto six and, therebycertified beds from
5Illinois Department(April-June 1961 ar

EA CHILDREN IN INSTITUTIONS FCR THE MENTALLY967
1961ao. Percent
of Total
1967
Daily No. Percent Percent
Children of Total Change
100.0
70.129.9
1,960
1,458b502
(350)
100.0
74.425.6
-5.7-23.8
dons (2 state and 4 vol.); also 5 proprietarydons (6 state and 3 vol.); also 6 proprietary.sed on Ill. Dept. of Mental Health reports.ix, III-A).aise figures not available for 1957.unty children only; others not available.tions were under Catholic auspices.
lot feed themselves.
toilet trained. 4
State FacilitiesRetarded
standing, it is importantstudy years state insti-
for the Mentally Retarded,ds of the Mentally Retarded
31
tutions provided care for morethan 70 percent of all CookCounty children in residentialfacilities for retarded. Table13 shows that the daily numberof Cook County children instate institutions was estim-ated to be 1,546 in 1961, and1,458 in 1967--or 88 less.This decline in the numberserved occurred in spite ofthe fact that four new statefacilities were constructedduring this same period.
In 1961 (as in the previousfifty years) there were onlytwo governmental facilitiesfor retarded children, andboth were overcrowded, under-staffed, huge, "barn-like"institutions.
They were LincOln State School--built in 1877,and located 180 miles from Chicago--and DixonState School--built in 1918, and 120 milesaway.
Between 1961 and 1967 the Illinois Departmentof Mental Health completed the construction offour new children's centers for the retarded,thus raising the state-wide total of institutionsto six and, thereby, increasing the number ofcertified beds from 7,026 to 8,314.5
5Illinois Department of Mental Health, Statistics(April-June 1961 and January-June, 1967).

The very fact that thfse were the first newinstitutions for the retarded built by the stateof Illinois in fifty years may be viewed asprogress of sorts. Moreover, the 1,278 additionalbeds undoubtedly alleviated some of the overcrowd-ing in Lincoln and Dixon State Schools. Indeed,
Dixon was "only" 25 percent overcrowded in 1967,as compared to 50 percent in 1961; and Ldncolnwas only 20 percent over-capacity in 1967 ascompared to 36 percent six years before.6
On the other hand, the addition of more than1,000 new beds to state facilities between 1961and 1967 makes the drop in patient populationthat occurred during the same period perplexingand, on the surface at least, in light of thelong waiting list most unfortunate, at leastfor the families involved.
In light of the fact that almost half of thechildren in state institutions for the retardedcome from Cook County7, it seems unfortunatethat only one of the four new facilities waslocated in the Chicago Area. Moreover, thereis little evidence thlt the one facility (theIllinois Pediatric Institute) in the area washaving much of an effect on the magnitude ofunmet needs. On June 30, 1967, the Institutewas serving only 126 occupants, a number equalto less than one-half of its present capacityin certified beds (264)8 and less than one-fourthof its originally planned capacity of 585.9
6 Ibid.'Personal communication wi.th the IllinoisDepartment of Mental Health.
8Illinois Department of Mental Health, Statistics,(January-June 1967).
9Gordon Snow, Op. cit.
32
Hence, in 1967,Chicago childrehoused in the tstill located mstill overcrowd
Private
The number of yvoluntary insLialso declined dtotal of 659 in24 percent deerone institutionprogram for chiprimarily for abetween 1961 anvoluntary instireduced from fcwas lowered fro
10Standards set
Mental Defici(1967 an addit:were needed a.provide minimpopulations a-Op. cit.)
11Note that the;
under the car(ifically desildo not includ(primarily forof voluntary :
12See Table XX s

yore the first new.ded built by the state; may be viewed asrer, the 1,278 additionald some of the overcrowd-
state Schools. Indeed,t overcrowded in 1967,in 1961; and Lincoln-capacity in 1967 asyears before . 6
ition of more thancilities between 1961patient population
ame period perplexingtst, in light of theLortunate, at least
almost half of the.ions for the retarded; seems unfortunatenew facilities wasa. Moreover, therele one facility (theite) in the area was)n the magnitude of1967, the Institute
)ants, a number equalts present capacityInd less than one-fourthcapacity of 585.9
th the Illinoisth.ntal Health, Statistics,
32
Hence, in 1967, as in previous years, mostChicago children under state care were stillhoused in the two antiquated state schools,still located miles away from their homes,still overcrowded, and still understaffec00
Private Institutions Costly
The number of youngsters served in Chicago Areavoluntary institutions for retarded childrenalso declined during this period, from a dailytotal of 659 in 1961 to 502 in 1967.11 This24 percent decrease was largely the result ofone institution's decision to close out itsprogram for children and to provide careprimarily for adult retardates instead. Hence,between 1961 and 1967 the number of localvoluntary institutions for retarded children wasreduced from four to three, and their capacitywas lowered from 662 to 508.12
10Standards set by the American Association forMental Deficiency indicated that in January,1967 an additional 1,573 "front-line" employeeswere needed at Dixon and 1,291 at Lincoln toprovide minimum adequate care for their residentpopulations at that time. (See Gordon Snow,Op. cit.)
11Note that these figures pertain only to childrenunder the care of voluntary institutions spec-ifically designated for retarded children. Theydo not include children served in facilitiesprimarily for adult retardates or in other typesof voluntary institutions.
12See Table XX and Technical Appendix III-A

In both years, all Chicago Area voluntary in-
stitutions for retarded children were run by
Catholic religious orders. Although far less
crowded than state facilities, voluntary in-stitutions found the demand for service sogreat that they were operating at full capacitythroughout the period.13
These voluntary institutions served children of
all races and creeds. Their fees were based on
sliding scales related to the family's abilityto pay, with suggested charges ranging from $75
to $152 a month in 1961,14 By 1967, suggested
fees ranged from $175 to $275 per month.15
In addition to public and voluntary institutions,private corporations,and individuals also provided
residential facilities for retarded children.There were five proprietary institutions in theChicago Area in 1961, and six in 1967. Data on
the 1961 resident population were not available,but in 1967 privately-owned facilities served350 children a day. Like their voluntary counter-parts, proprietary institutions were, also, oper-
ating at maxtmum capacity.16
As would be expected, the range of pricescharged by privately-owned facilities washigher than the range charged by voluntary
13Ibid.14I1linois Council for Mentally Retarded Children,
A Directory of Services for the Mentally Retard-
ed in Illinois, (1962).15 Illinois Association for the Mentally Retarded,
Private Residential Facilities for the Mentally
Retarded in Illinois, (1968).16See Table XX and Technical Appendix III-A
33
institutions. I
proprietary inst$125 charged byinfants to the $a congregate-carBy 1967, the lowrange remained agone up to $470
7. CHILDREN IN
In contrast to tpopulation of inthere was an inethe daily numberinstitutions fora day in 1957, tten years laterwere more locallinquents than istudied.
In Chicago, as iStates, almost adelinquntts wereAs a result, morChicago Area chifor delinquentspublic facilitie
Table 14 shows tlargest providerstudy years, two
17Illinois CouncOp. cit.
18Illinois AssocPrivate Reside

hicago Area voluntary in-ded children were run byrders. Although far lessacilities, voluntary in-demand for service sooperating at full capacity
(1.13
itutions served children ofTheir fees were based on
ed to the family's ability.ed charges ranging from $75961,14 By 1967, suggested5 to $275 per month.15
c and voluntary institutions,and individuals also providedes for retarded children.)rietary institutions in the
and six in 1967. Data on
pulation were not available,y-owned facilities servedLike their voluntary counter-nstitutions were, also, oper-acity.
16
I the range of pricesr-owned facilities wasre charged by voluntary
or Mentally Retarded Children,vices for the Mentall Retard-
962).
on for the Mentally Retarded,1 Facilities for the Mentall
is (1968).
echnical Appendix III-A
33
institutions. In 1961, the monthly fees of
proprietary institutions varied between the$125 charged by a small nursery for mongoloidinfants to the $250 "plus extras" charged bya congregate-care facility for older children.17
By 1967, the lower end of the monthly pricerange remained at $125, but the upper end hadgone up to $470 per month (or $5,640 a year).18
7. CHILDREN IN INSTITUTIONS FOR DELINQUENTS
In contrast to the decline in the residentpopulation of institutions for the retarded,there was an increase of almost 20 percent inthe daily number of Chicago Area children ininstitutions for delinquents. From about 1,700a day in 1957, the number rose to almost 2,000ten years later which meant that, in 1967, therewere more local children in facilities for de-linquents than in any other type of institutionstudied.
In Chicago, as in other parts of the UnitedStates, almost all residential facilities fordelinquents were under governmental auspices.As a result, more than 90 percent of theChicago Area children who were in institutionsfor delinquents during each study year were inpublic facilities.
Table 14 shows that the state was the singlelargest provider of this type of care. In both
study years, two out of three Chicago children
17Illinois Council for Mentally Retarded Children,Op. cit.
18Illinois Association for the Mentally Retarded,Private Residential Facilities.

TABLE 14. CHICAGO AREA CHILDREN IN INSTITUTIONS FCE DELINQUENTS,1957 AND 1967
Auspices ofInstitution
1957
Daily No. PercentChildren of Total
1967Daily No. PercentChildren of Total
Percent
Change
TOTAL 1 671, 100.0 1,987 100.0 +18.9
Governmental 1,518 90.8 1,876 94.4 +23.6
Ill. Youth Comm. 1,075 64.3 1,337 67.3 +24.4
Audy Home 222 13.3 263 13.2 +18.5
Parental School 221 13.2 276 13.9 +24.9
Voluntary (Cath.) 153 9.2 111 5.6 -27.5
Base: 1957-11 institutions (10 governmental and 1 voluntary)1967-20 institutions (19 governmental and 1 voluntary)
Source: C-1 reports to the Welfare Council and estimates based onreports from Illinois Youth Commission, U.S. Dept. of Health,Education & Welfare, and others. (See Technical Appendix,
in institutions for the delinquent were in statefacilits under the aegis of the Illinois YouthCommission.19 Moreover, the daily population from
Chicago in Illinois Youth Cammission facilitiesgrew by almost 25 percent during the past decade,
rising from 1,075 in 1957 to 1,337 ten yearslater.
19The Illinois Youth Commission was establishedby legislation in 1953 to consolidate all state-level services for delinquents under a singleadministrative unit. The Cbmmission is directedby a five member board appointed by, and directlyresponsible to the Governor.
34
In addition to incities under their j1Commission also eximade available to (the nine new instilthree were "specia]small institutionsemphasize remedial
205ee Table XX and215ee Table XX.

CHILDREN IN INSTITUTIONS FCR DELINQUENTS, During this same period, therewas an even greater increasein the number of Illinois YouthCommission facilities available1957 1967
No. Percent Daily No. Percent Percent to delinquents. In ten years
-en of Total Children of Total Change state facilities almost doubledin both number (from 8 to 17)
100.0 1,987 100. 0 +18. 9 and capacity (from 1,315 to2,052).20
90.8 1,876 94.4 +23.6
64.3 1,337 67.3 +24.4 As a result, the overcrowded
13.3 263 13.2 +18.5 conditions which were preval-
13.2 276 13.9 +24.9 ent during the early part ofthe period were substantially
9,2 111 5.6 -27.5 reduced. The average occupancy
)ns (10 governmental and 1 voluntary))ns (19 governmental and 1 voluntary)lie Welfare Council and estimates based on)uth Commission, U.S. Dept. of Health,others. (See Technical Appendix, III-B).
c delinquent were in stateegis of the Illinois Youththe daily population fromuth Commission facilitiesent during the past decade,957 to 1,337 ten years
nission was establishedto consolidate all state-inquents under a singleThe Cbmmission is directedappointed by, and directly
ernor.
34
rate for all Illinois YouthCommission facilities, whichhad been 103 percent of capac-ity in 1957, had dropped to 91percent by 1967. This reduc-tion provided a marked con-trast to the increasinglyovercrowded conditions of pub-lic delinquency institutionsoperated by local county andcity governments.21
In addition to increasing the number of facili-ties under their Jurisdiction, the Illinois YouthCommission also expanded the variety of programsmade available to children under their care. Of
the nine new institutions built during this period,three were "special education schools," i.e.,small institutions for 9-14 year old boys whichemphasize remedial academic instruction. The
"See Table XX and Technical Appendix III-B-1 & 2.21See Table XX.

other six were Ininimumfor 15-21 year old boysin forestry, state parkservices,
security" forestry campswhich offered work programsmaintenance, and community
The importance of trying new programs and approaches
is underscored by the high recidivism rates among
delinquents served in state facilities. For
example, close to one-half of the 3,051 youths
admitted to the Illinois Youth Commission Recep-
tion Center for Boys in 1966 were "recidivists,"
who had either been committed to that institution
previously, or were being returned from probation
or parole, or transferred in from some other in-
stitutions for delinquents.22 Hence, there is
tangible evidence that Illinois Youth Commissionfacilities, like their counterparts throughoutthe country, frequently failed to realize their
stated objectives of "training" and "rehabilitating"
the youngsters committed to their care.
One result of this is that professionals who
work with delinquents,like those in other child
care fields, are beginning to place more
emphasis on community-based out-patient programs.
The theory is that it might be more economical
and more effective, in the long run, to provide
preventive and rehabilitative services to the
child where he lives, i.e., within the social
22Louise T. Jackson and Daisy C. Ligons, Statistics
on Public Institutions for Delinquent Children,
1966. (U.S. Department of Health, Education, andWelfare, Children's Bureau, Statistical Series 89,
1967).
35
environment that he"terms with if he is
Local Publicand Inap
In addition to Milties, two other pub:Area delinquents du]Chicago Board of Edtwith one branch forand the Arthur J. Al
tion facility operaof Commissioners.in antiquated buildand the subject ofand criticism.
The Audy Home provi(delinwents, truantwho are waiting forelsewhere. In 1957average population
23National figuresjuvenile correctiinstitutional caryear, as comparedIn 1965, institutthe total offendetions system, butthe total employe70 percent of thethe President's CAdministration ofin a Free SocietyGovernment Printi

rity" forestry campsh offered work programstenance, and community
programs and approachesecidivism rates amongfacilities. For
f the 3,051 youthsth Commission Recep-were
ftrecidivists,
t?
d to that institutionturned from probationfrom some other in-
2 Hence, there isois Youth Commissionerparts throughouted to realize theirmg" and "rehabilitating"their care.
rofessionals whohose in other childo place moreout-patient programs.be more economicalong run, to providee services to thewithin the social
y C. Ligons, StatisticsDelinquent Children,Health, Education, andStatistical Series 89,
35
environment that he must eventually come,toterms with if he is to "make it outside.""
Local Public Institutions Crowdedand Inappropriately Used
In addition to Illinois Youth Commission facili-ties, two other public facilities served ChicagoArea delinquents during the past decade: the
Chicago Board of Education's Parental School,with one branch for boys and a second for girls,and the Arthur J. Audy Home, a temporary deten-tion facility operated by the Cook County Boardof Commissioners. Both institutions were housedin antiquated buildings, seriously overcrowded,and the subject of intermittent public concernand criticism.
The Audy Home provides temporary shelter fordelinquents, truants, and dependent childrenwho are waiting for appropriate placementselsewhere. In 1957, the Home had a dailyaverage population of 222 delinquents plus 40
23National figures indicated that, within thejuvenile corrections system, the average cost ofinstitutional care vas $3,613 perioffender peryear, as compared to $328 for community services.In 1965, institutions received only 18 percent ofthe total offenders served by the juvenile correc-tions system, but they employed three-fourths ofthe total employees and accounted for more than70 percent of the total operating costs. (From
the President's Commission on Law Enforcement andAdministration of Justice, The Challenge of CrimeilLa Free Societx, (Washington, D.C.: U.S.
Government Printing Office, 1967).

dependent children,24 a total of 262 per day.By 1967, the daily figures had risen to 263delinquents and 137 dependent children, atotal of 400. Hence, in 1967 there were over50 percent--or an average of 138--more childrenunder care each day.25
Meanwhile, the capacity of the institution hadexpanded by only 58 more beds, which were addedwhan a branch for younger dependent childrenwas opened in 1964. As a result, the averageoccupancy . ate for the Audy Home rose from 87percent of capacity in 1957 to 112 percent in1967, indicating a serious degree of overcrowd-ing that year.2
Such conditions are obviously not conducive toproviding the troubled youngster who has, perhapsfor the first time, come in serious contact withthe law, with the typc of understanding that heneeds (and is, by virtue of the Juvenile CcurtAct, legally entitled to receive) at what may bea crucial turning point in his life.
Similar conditions prevailed in the ParentalSchool, established in accordance with an 1899state law that required Illinois cities of over500,000 population (i.e., Chicago) to provideItparental or truant schools .. for the confine-ment, discipline, instruction, and maintenance of
any child of compulsory school age who ...has been guilty of habitual truancy or violatiun
245ee Table 11 in Part 11-4 above, for a discussionof the dependent children in the Audy Home.
"See Table XX and Technical Appendix III-B-2 & 3."Ibid.
36
of the rules oare admitted tthrough Juveni
In 1957 an avcunder care inBy 1967, the apercent more.capacity was iities for girlbut those forthe period (18which was alrewas operatingin even worseoperating at 1the problem stParental Schouor types of clJuvenile Courtchildren cammithis also mealdetermine a chhave to dischasteady streamaverage lengt)three months 2
to effectivelyproblems thatin the institu
In recent yearprofessional gthe Parental 8
27 Illinois Sof28 See Table X)29Louise T. JE

1 of 262 per day.ad risen to 263t children, a7 there were over138--more children
he institution hads, which were addedpendent childrensult, the averageHome rose from 87to 112 percent inegree of overcrowd-
y not conducive toster who has, perhapsserious contact withderstanding that hethe Juvenile Courteive) at what may beis life.
in the Parentaldance with an 1899nois cities of overicago) to provide
... for the confine-n and maintenance ofschool age whotruancy or violation
above, for a discussionin the Audy Home.Appendix III-B-2 & 3.
36
of the rules of the public school." 27 Children
are admitted to the school only by camnitment
through Juvenile Court.
In 1957 an average of 221 children a day wereunder care in the Parental School's two branches.By 1967, the average daily total was 276, or 25
percent more. During this time, the school'scapacity was increased by only 30 beds. Facil-
ities for girls were doubled (from 30 to 60),but those for boys remained the same throughoutthe period (180). As a result, the School,which was already overcrowded in 1957 when itwas operating at 105 percent of capacity, wasin even worse condition in 1967 when it wasoperating at 115 percent of capacity .28 Part of
the problem stemmed from the fact that theParental School has no control over the numbersor types of children admitted to it by theJuvenile Court because it must accept allchildren committed. For all practical purposesthis also means that the School's staff cannotdetermine a child's length of stay because they
have to discharge residents to make room for thesteady stream of new arrivals. As a result, theaverage length of stay for children in 1966 wasthree months 29--scarcely a long enough periodto effectively treat the types of behavioralproblons that lead to a child's being placedin the institution in the first place.
In recent years, various organizations andprofessional groups have expressed concern aboutthe Parental School. They have questioned
27Illinois School Code, Chapter 122, 34.285ee Table XX and Technical Appendix, III-B-2 & 3.29Louise T. Jackson, Op. cit.

whether or not it is appropriate to require theBoard of Education to operate a residentialfacility for children who present problems inrelationship to the schools.
Whether or not the requirement is appropriate,it is clearly impossible to meet it, other than
superficially. within the context of the pres-sures and prob2ems that the school has faced in
recent years. As Robert Havighurst has stated,
This kind of rapid turnover makesprogram and rehabilitative impactpossible only through the moredifficult forms of magic. The
basic problem of the Parental Schoolis that no one scems able to decidewhat it ought to be (detention home,school, residential treatment center,nonparental institution , etc . )30
In an attempt to arrive at some answers to thesequestions, the Welfare Council is currently en-gaged in the development of a proposed jointproject with the Chicago Board of Education andNortheastern State College to assess the opera-tions of the School in more detail and to deviseappropriate plans for directions it may take in
the future.
Few Served by Voluntary Sector
While many local children's institutions havealways served some youngsters whose problems
"Robert J. Havighurst, The Public Schools ofChicago (Chicago: The Board of Education ofthe City of Chicago, 1964).
37
included delinquenlpast decade, onlythe entire Chicagoquents. This wasthe Sisters of themaladjusted" girlstruanted, ran awaydelinquent acts.
As Table 14 revealtion of the House111 ten years latqwas, reportedly, 1trative decisionsprogram by changircare to a small giing a wider rangeincluding severalin conjunction witorganizations. AT
decline is a chroipersonnel to prey'in relation to hot
8. CHILDREN IN PE
The number of Chicstate mental hospi30, 1955 when, as
31Conversation witGood Shepherd.

apropriate to require theperate a residentialho present problems inools.
irement is appropriate,e to meet it, other thanhe context of the pres-the school hasfaced in
t Havighurst has stated,
turnover makeslitative impactugh the moref magic. .. TheLhe Parental SchoolDins able to decide
De (detention home,treatment cemer,
ution,etc.)30
at some answers to theseCouncil is currently en-it of a proposed jointpp Board of Education andege to assess the opera-more detail and to deviseirections it may take in
Voluntary Sector
en's institutions havegsters whose problems
, The Public Schools ofie Board of Education of1964).
37
included delinquency, there was, during thepast decade, only one voluntary institution inthe entire Chicago Area specifically for delin-quents. This was a closed facility operated bythe Sisters of the Good Shepherd for "sociallymaladjusted" girls, i.e., for teenagers whotruanted, ran away or committed other types ofdelinquent acts.
As Table 14 reveals, the average daily popula-tion of the House dropped from 153 in 1957 to111 ten years later. This 27 percent declinewas, reportedly, largely the result of adminis-trative decisions to intensify and improve theirprogram by changing the House from congregate-care to a small group-living plan and by develop-ing a wider rango of rehabilitation services,including several work-study programs operatedin conjunction with local schools and communityorganizations. Another factor accounting for thedecline is a chronic shortage of suitablepersonnel to provide the new services, especiallyin relation to Lousemothers. 31
8. CHILDREN IN PSYCHIATRIC HOSPITALS
The number of Chicago Area children in Illinoisstate mental hospitals quadrupled between June30, 1955 when, as Table 15 shows, there were
31Conversation with Administrator, House of theGood Shepherd.

TABLE 15. CHICAGO AREA CHILDREN IN PSYCHIATRICHOSPITALS, 1955a AND 1967
Auspice sof Hospital
Daily No.Children
1955a 1967PercentChange
Governmental
Voluntary andProprietary
92 380
NA 105
+313 . 0
-
Base: 1955 - 1 state hospital unit1967 - 10 units state; & 10 vol. & prop.
Source: Estimates based on Ill. Dept. of MentalHealth, Ill. Commission on Children, and U.S.Dept. of Health, Education, and Welfare reports.(See Technical Appendix, III-C).
aData is for 1955-figures not available for 1957.
about 92 under care, and 1967 when there were380.32
32These include some mentally retarded childreninappropriately hospitalized after theirbehavior and condition became too serious forthem to be maintained in the community, becauseof lack of space in state facilities for theretarded. Such youngsters are transferred tothe appropriate facilities when space becomesavailable. For example, the Illinois Commissionon Children, Study of Emotionally DisturbedChildren, indicated that 10 percent of thechildren on the books of state hospitals onJune 30, 1964 had been transferred to stateschools on that date three years later.
38
During this sametreatment units fincreased ten timone such unit inGrace Abbott ChilHospital. This rnwere housed in thturbed adults.
By 1967, the statunits with 595 beIn addition, planfor children in scenters", i.e., fby the Illinois Dprovide comprehenservices to residregions or zones.it was estimatedthan three-fourthhospitals were hofrom adult patienrecreational, andfor their age.34
Overall Inc
There were probabnumber of childre:hospitals and inhospitals, but nosubstantiate thisavailable on chil
33See Table XX and34 Il 1 inois Commiss:
mental Committeeof Emotionally D:

IILDREN IN PSYCHIATRIC
i ly No.ildren
1967
380
105
PercentChange
+313.0
pital unitate; & 10 vol. & prop.on Ill. Dept. of Mentaln Children, and U.S.n, and Welfare reports.III-C).not available for 1957.
967 when there were
illy retarded childrenlized after their)ecame too serious for
the community, becausee facilities for thers are transferred to
ies when space becomes, the Illinois Commissionotionally Disturbed
10 percent of thef state hospitals ontransferred to stateee years later.
38
During this same period, the number of specialtreatment units for children in state hospitalsincreased ten times. In 1955, there was onlyone such unit in the entire statethe 30-bedGrace Abbott Children's Center at Peoria StateHospital. This meant that most child patientswere housed in the same wards with older, dis-turbed adults.
By 1967, the state had already set up ten specialunits with 595 beds for children and adolescents.33In addition, plans were being made to provide bedsfor children in some of the new state "zonecenters", i.e., facilities recently constructedby the Illinois Department of Mental Health toprovide comprehensive community mental healthservices to residents of particular geographicalregions or zones. As a n.3sult of these advances,it was estimated that, by November 1967, morethan three-fourths of the children in statehospitals were housed in separate units apartfrom adult patients with special educational,recreational, and treatment programs appropriatefor their age.34
Overall Increase in Psychiatric Care
There were probably similar increases in thenumber of children served in private psychiatrichospitals and in the psychiatric wards of generalhospitals, but no figures could be obtained tosubstantiate this thesis. No data at all wereavailable on children served in private facilities
33See Table XX and Technical Appendix, III-C-1 & 2.34 Illinois Commission on Children, Interdepart-
mental Committee on Children and Youth, Studyof Emotionally Disturbed Children, (1967).

in 1957, and only one statistic was found for1967--105 patients under the age of 20 were re-ported to be in ten private psychiatric hospitals
in Illinois on January 1 that year.35
Even without complete data, one fact stands out:
there was a marked increase over the past decadein the number of Chicago Area children receiving
same type of residential treatment for emotional
problems. If, for example, the number of young-
sters in treatment-oriented child welfare in-stitutions were cambined with the number in state
hospitals, the estimated daily total grew fromaround 200 in 1957 to almost 1,000 in 1967.36In addition to these, there were an unknown number
of children in psychiatric wards of general hos-
pitals and in private psychiatric facilities.
ADDENDUM
Maternity Homes for Unmarried Mothers
As facilities that provide care for only alimited period of time (during the pre- andpost-confinement periods) to unwed pregnantmomen of all ages, maternity homes fall outside
the scope of this report on residential care for
children. At the same time, brief mention ofthis type of care seems apropos, because nurternity
35U.S. Public Health Servica, Patients in Mental
Institutions Part III, Private Mental Hospitalsand General Hospitals with Psychjetric Service,
(1966).36As previously shown in Table 9 in Part 11-4,
there were 128 children in treatment-orientedchild welfare institutions in 1957 and 576 in
1967.
39
WOMENa SERVED BY MAAREA
Annual TotalWomen Served . .
Average DailyPopulation . . .
Capacity . . .
Avg. Percentof Occupany .
Number of Centers
Source: C-4 reportsIII. Dept. of Childports. (See Technic
aIncludes women of afor minors availabl
homes do serve manymany of the babiesin adoptive homes o
The Table shows thain the Chicago Areawith 210 beds in 191967. Like most fStates, all of theauspices. Three we
tarian; two of thetion with adoption

was found forof 20 were re-
hiatric hospitalsar.35
fact stands out:the past decade
ildren receivingnt for emotionalnumber of young-d welfare in-e number in stateotal grew from00 in 1967.35an unknown numberof general hos-
c facilities.
ed Mothers
for only ahe pre- anded pregnantes fall outsidedential care foref mention of
, because maternity
tients in Mentale Mental Hospitalschiatric Service,
in Part 11-4,atment-oriented1957 and 576 in
39
WOMENa SERVED BY MATERNITY HOMES IN THE CHICAGOAREA, 1957 AND 1967
1957 1967
PercentChange
Annual TotalWomen Served . 1,003 1,134 +13.1
Average DailyPopulation . . . 162 173 +6.8
Capacity . . . 210 255 +21.4
Avg. Percentof Occupany . 77.1 67.8
Number of Centers 6
Source: C-4 reports to the Welfare Council and
III. Dept. of Children and Family Services re-
ports. (See Technical Appendix, Addendum).
aIncludes women of all ages. No specific data
for minors available.
homes do serve many teenagers and, also, because
many of the babies born to residents are placed
in adoptive homes or other foster care facilities.
The Table shows that the number of maternity homes
in the Chicago Area increased fram six facilities
with 210 beds in 1957 to seven, with 255 beds, in
1967. Like most facilities of this type in the United
States, all of the local centers were under voluntary
auspices. Three were sectarian and four, non-sec-tarian; two of the latter were operated in conjunc-
tion with adoption agencies.

With the addition of a new facility, local mater-nity centers served a few more wcmen in 1967 (anaverage of 173 per day) as compared to 1957 (162).
During this same period, the annual total numberof women who received care in these centers rosefrom 1,003 to 1,134, an increase of 13 percent.
In both study years, the total number of womenserved in Chicago Area maternity homes was smallin comparison to the number that gave birth toillegitimate children. In 1957 there were ninetimes more illegitimate live births reported inCook County alone (9,207) 37 than women served inmaternity homes (1,003). By 1967 the disparitywas even wider; illegitimate live births in CookCounty (14,607) 38 were twelve times greater than
X9 the women served (1,134).
RJ4
These figures may, in part, reflect a currenttrend away from shelter-type care for illegimatelypregnant women toward therapeutically-orientedout-patient programs. For example, the ChicagoBoard of Education and the Board of Health have,in recent years, provided "Family Living Centers"that offer special classes, counseling and healthservices to pregnant and newly-delivered schoolgirls. Since 1966, the Crittenton ComprehensiveCare Center (sponsored by the Chicago Board ofHealth, the Illinois Department of Public Healthand the Florence Crittenton Association of America)has, also, provided health care and educationaland social services to unwed pregnant school girlswho continue to live in their own homes.
37Illinois Department of Public Health, VitalStatistics, (1957).
380p. cit., (1967).
40/1w

SELECTED BIBLIOGRAPHY
Blair, Annie 0. Demand for Adoption Services in MetropolitanChicago, Welfare Council of Metropolitan Chicago, PublicationNo. 1009, May 1965.
Chicago Community Inventory, University of Chicago. Population,
Growth in the Chicago Standard Metropolitan Area, 1950-57.February 1958.
11Havighurst, Robert J. The Public Schools of Chicago, Chicago:The Board of Education of the City of Chicago, 1964.
Illinois Association for the Mentally Retarded. Private Residen-tial Facilities for the Mentally Retarded in Illinois, 1968.
. Residential Care Needs of the Mentally Retardedin Illinois, Much 24, 1967.
Illinois Commission on Children, Interdepartmental Committee onChildren and Youth, Study of Emotionally Disturbed Children,1967.
. Report of a Committee on Youthful Offenders inIllinois, 1968.
Illinois Committee for the 1960 White House Conference on Childrenand Youth. Cook County Report, 1960.
. Illinois Report, 1960.Illinois Council for Mentally Retarded Children, A Directory of
Services for the Mentally Retarded in Illinois, 1962.Illinois Department of Children and Family Services. 4 Directory,
of Children's Services, 1965 and 1968.. Division of Child Welfare. Movement Table,
June 30 1967.. Group Classification of Child Care Institutions.
Regulation No. 5.17, July 1, 1965.
42
Se
. Su
Information RerIllinois Department
1967.
.
Facilities forMental Health CYear 1967.
and July-DecemtIllinois Department
Approved School. V
Illinois DepartmentJune 30, 1958.
Illinois Youth CommJuly-December,
Ives, Kenneth. Emo
Facilities and
Council of MetrJackson, Louise T.
Institutions feHealth, EducatiSeries 89, 1967
Jones, Leroy H. Ne
Institutions AWelfare Council1967.

Adoption Services in Metropolitan1 of Metropolitan Chicago, Publication
, University of Chicago. Populationandard Metropolitan Area, 1950-57. ,
kilblic Schools of Chicago, Chicago:)f the City of Chicago, 1964.. Mentally Retarded. Private Residen-Mentally Retarded in Illinois, 1968.:1 Care Needs of the Mentally Retarded1967.
Iren, Interdepartmental Committee ony of Emotionally Disturbed Children,
Committee on Youthful Offenders in
1960 White House Conference on ChildrenReport, 1960.eport, 1960.y Retarded Children, A Directory ofLy Retarded in Illinois, 1962.ren and Family Services. A Directory1965 and 1968.f Child Welfare. Movement Table,
sification of Child Care Institutions.y 1, 1965.
42
Service Data, December 1967.. Summary of the Living Arrangements of Children,
Information Report 68, NO. 1, April 1968.Illinois Department of Mental Health. Administrator's Data Manual,
1967.. The Illinois State Plans for the Construction of
Facilities for the Mentally Retarded, Title 1 C, and CommunityMental Health Centers, Title II, Public Law 88-164, FiscalYear 1967.
. Statistics, April-June 1961, January-June 1967,and July-December 1967.
Illinois Department of Public Health. Directory of Hospitals andApproved Schools of Nursing, 1966.
. Vital Statistics, 1957 and 1967.Illinois Department of Public Welfare. Child Welfare Statistics,
June 30, 1958.Illinois Youth Commission. Semi-Annual Statist-Ical Summary,
July-December, 1957 and 1967.Ives, Kenneth. Enotionally Disturbed Children: Number, Treatment
Facilities, and Unmet Needs, in the Chicago Area, WelfareCouncil of Metropolitan Chicago, Publication No. 4005, 1961.
Jackson, Louise T. and Ligons, Daisy C. Statistics on PublicInstitutions for Delinquent Children, 1966. U.S. Depaitment of,Health, Education, and Welfare, Children's Bureau, StatisticalSeries 89, 1967.
Jones, Leroy H. New Tools for Administration of Children'sInstitutions, An Analysis of Time, Costs, and Operations,Welfare Council of Metropolitan Chicago, Publication No. 1026,1967.

Public Agency Purchase of Service from VoluntaryAgencies, with Focus on Institutional Services, Springfield,
Illinois: Report of the Committee on Purchase of Care,lucer-Agency Relationships Committee, Child Care Association
of Illinois, 1968.Mitchell, Marion and Watson, Kenneth. Adoption, A Dumde of
Change: A Time of Concern, Working Paper for the IllinoisCommittee for White House Conference on Children and Youth,
1968.
The President's Commission on Law Enforcement and Administration
of Justice. The Challenge of Crime in a Free Society,
Washington, D.C.: U.S. Govermment Printing Office, 1967.
Smith, Christopher, Parental School Chaplain. The Field Work
Program at the Chicago Parental School, 1967.
Snow, Gordon. Mental Retardation, Working Paper for the Illinois
Committee for the White House Conference on Children and Youth,
1968.
Star, Shirley A. and Kuby, Alma M. Number and Kinds of Children's
Residential Institutions in the United States, U.S. Department
of Health, Education, and Welfare, Children's Bureau, 1967.
U.S. Bureau of the Census. Current Population Reports, Series P-25,
N. 411, "Provisional Estimates of the Population of One
Hundred Large Metropolitan Areas, July 1, 1967," November 1968.
4 3
U.S. Cen!Characteristics of thc
U.S. Department of Health,Bureau. Adoptions inStatistics 1967, Stati
Foster CI
and Prospects, 1966., Public He
Mental Health. PatiewInstitutions for MentaPart III, Private BentPsychiatric Service, 1
Welfare Council of MetropoServices, 1958.
Profiles
Council and the CommunNo. 1024, 1967.
Social S
1958 and 1966 editionsWoessner, Henry J., Direct
Children, Chicago Boarber 24, 1957, to the Cof the Welfare Council

rchase of Service from Voluntaryutional Services, Springfield,ittee on Purchase of Care,
ittee, Child Care Association
th. Adoption, A Decade ofrking Paper for the Illinoisference on Children and Youth,
Enforcement and AdministrationCrime in a Free Society,ent Printing Office, 1967.1 Chaplain. The Field Work
al School, 1967., -.7orking Paper for the IllinoisConference on Children and Youth,
Number and Kinds of Children'she United States,U.S. Departmentfare, Children's Bureau, 1967.nt Population Reports, Series P-25,es of the Population of Oneas, July 1, 1967," November 1968.
43
U.S. Census of Po ulation: 1960, Vol. I,Characteristics of the Population, Part 15, "Illinois."
U.S. Department of Ikalth, Education, and Welfare, Children'sBureau. Ado tions in 1967 Supplement to Child WelfareStatistics 1967, Statistical Series 92, 1968.
Foster Care of Children, Major National Trendsand Prospects, 1966.
, Public Health Service, National Institute of
Mental Health. Patients in Mental Institutions, Part I, PublicInstitutions for Mental Defectives and Epileptics, 1957 andPart III, Private Mental Hospitals and General Hospitals withPsycniatric Service, 1966.
Welfare Council of Metropolitan Chicago. Inventory of Social
Services, 1958.Profiles of Forty Fields of Human Care Service in
Chicago, Part II of the Joint Priorities Study of the WelfareCouncil and the Community FUnd of Chicago, Inc., Publication
No. 1024, 1967.Social Service Director of Metropolitan Chica o
1958 and 1966 editions with 1968 Supplement.Woessner, Henry J., Director, Bureau of Socially Maladjusted
Children, Chicago Board of Education. An address, on Septem-ber 24, 1957, to the Committee on Facilities for Adolescentsof the Welfare Cbuncil of Metropolitan Chicago.

TECHNICAL APPENDIX
DATA SOURCES, METHODOLOGY, AND LIMITATIONS
I. AN OVERVIEW
As an effort to present an overall picture of services provided
to a specific group of clients (Chicago Area children) by a num-
ber of different agencies and institutions, not organized into a
single comprehensive service delivery system with centralized
data collection facilities, this report is necessarily based
on fragmentary statistics, uneven in quality, obtained from a
variety of sources.
Some of these sources'offered no specific service statistics for
Chicago Area children, and others presented the data in forms
that were not comparable to other reports in the field. Hence,
it was often necessary to derive estimates from whatever figures
were available. For the reader who i, interested in these tech-
nical details, this appendix describes the numerous sources from
which the report data wera obtained and the assumptions and
methods by which estinates were derived. It also points out some
RA4 of the gaps in coverage and other data limitations.
A. SELECTION OF AGENCIES AND INSTITUTIONS
A master list of institutions that provided foster placement
services and residential care for mentally retarded, delin-
quent, and emotionally disturbed children during the study years
was obtained from a variety of directories and listings.
Voluntary (and proprietary) institutions on this list were
then screened on the basis of the main age group served and
geographical location. Institutions that were not exclusive-
ly, or primarily, for children under 18 were not included in
this report even if.their minimum age limits were under 18.
Hence, an institution that served clients "from 16 years and
overrr was omitted.
Voluntary (and proprietary) institutions that were not physical-
ly located within the three-connty Chicago Area were also ex-
cluded. This meant that some Chicago Area children, who were
receiving care from voluntary institutions and agencies outside
the three-county area, were inadvertently omitted from the report
and that same children from other locations, who were receiving
44
care from voluntary in:Area, were erroneouslyan a priori basis thatreceiving care from voland that most childrenthis area. Hence, therooted" children receilstitutions in the threc
On the other hand, stalsolely on the basis offor physically-handicapresidential facilitiesregardless of their gettions exclusively for (some were special chil((e.g. adolescent wardsstitutions for both ch:stituted the majorityschools for the retardi
Since most state agenciall parts of the state,clude their total caselHence, for each facilitdata by the child's couArea children under car
B. C
Since no specific iigur18 in the three counticderived as follows:
The proportion of1960 was obtainedof Population: 19
Population," Part
For purposes of esunder 18 years comthe population indid in 1960. Hencwas applied to estcounty in 1957 andpopulation during

IMITATIONS
-e of services providedXrea children) by a num-ts, not organized into aptem with centralizedis necessarily based
lity, obtained from a
- service statistics forted the data in formss in the field. Hence,
cs from whatever figurestterested in these tech-he numerous sources fromthe assumptions andIt also points out some
imitations.
IND INSTITUTIONS
ided foster placementlly retarded, delin-n during the study yearsies and listings.
on this list werege group served andt were nou exclusive-were not included inits were under 18.s "from 16 years and
s that were not physical-Rgo Area were also ex-ea children, who wereIns and agencies outsidely omitted from the reportions, who were receiving
44
care from voluntary institutions and agencies in the ChicagoArea, were erroneously included. However, it was assumed, on
an a priori basis that most "uprooted" Chicago Area childrenreceiving care from voluntary institutions were placed locallyand that most children placed in Chicago Area settings were from
this area. Hence, the report includes the total number of "up-rooted" children receiving care from voluntary agencies and in-stitutions in the three-county Chicago Area.
On the other hand, state institutions and agencies were selectedsolely on the basis of function. With the exception of schoolsfor physically-handicapped, blind, and deaf children, all stateresidential facilities for children were included in the report,regardless of their geographical location. Some were institu-tions exclusively for children (e.g. the state training schools);some were special children's units within adult institutions(e.g. adolescent wards in state hospitals); and some were in-stitutions for both children and adults in which children con-stituted the majority of the resident population (e.g. stateschools for the retarded).
Since most state agencies and institutions care for children fromall parts of the state, it would not have been appropriate to in-clude their total caseloads in this report on local children.Hence, for each facility that did not provide specific servicedata by the child's county of residence, the number of ChicagoArea children under care during the study period was estimated.
B. CHILD POPULATION ESTIMATES
(Re: Table 1)
Since no specific figures were available on the population18 in the three counties in either 1957 or 1967, estimates
derived as follows:
underwere
The proportion of the population under 18 in each county in1960 was obtained from U.S. Bureau of the Census, U.S. Censusof Population: 1960, Vol. I, "Characteristics of thePopulation," Part 15, "Illinois."
For purposes of estimating, it was assumed that childrenunder 18 years composed approximately the same proportion ofthe population in each county in 1957 and in 1967 as theydid in 1960. Hence, the percent of the population in 1960was applied to estimates of the total population in eachcounty in 1957 and in 1967 to obtain estimates of the childpopulation during those years.

Estimates of the total population in each county on July 1,
1957 were taken from the Chicago Community Inventory,
University of Chicago, Population Growth in the Chicago
Standard Metropolitan Area, 1950-57, (February
1958). Similar estimates for 1967 were obtained from U.S.
Bureau of the Census, Current Population Reports, SeriesP-25, No. 411, "Provisional Estimates of the Population of
One Hundred Large Metropolitan Areas, July 1, 1967,"
(November 1968).
It must be emphasized that these estimates do not take account
of any possible shifts in age distribution that may have occurred
during these ten years as a result of changing birth rates, new
migration patterns, or other factors.
CHILDREN IN FOSTER CARE PLACEMENTS
(Re: Tables 3 thru 11)
The second part of the report focuses on trends in the numbers Of
children served in three types of foster care placements; agency
adoptive homes, other foster family homes and child welfare in-
stitutions.
Nearly all of the data on foster placements were obtained from
monthly C-1 reports on children's services which the Welfare
Council has been collecting from child welfare agencies and in-
stitutions in the Chicago Area for almost forty years. While
the C-1 data has proved a valuable source of information, it has
some limitations which should be noted here.
One of the basic limitations of the system is that it does not
include all the child welfare agencies in the local area,
especially in DuPage and Lake Counties. Specific agencies that
do not report to the Council include the following:
- -Catholic Charities of Joliet which has served Catholic
children in DuPage County since 1944.
- -The Juveaile Courts in DuPage and Lake Counties.
--The Department of Public Aid in DuPage and Lake Counties.
--DuPage and Lake County children served by the Illinois
Department of Public Welfare in 1957 and the IllinoisDepartment of Children and Family Services in 1967.
(Both state agencies issued regular reports to theWelfare Council on their services to Cook County
45
children during th(specific reports
The total number of chiliprobably too small to haany of the trends notedservice data on DuPage a:especially during this prapid population growthservice patterns and nee
A second limitation of tinformation about the sothe individual childrensuperficial type of trenpossible; and it is notsimple facts about the ction, or length of time
In addition, present re;of different children s(not by specific type oftype of setting, such al
it is possible to repor:served each day (as bascare on the last day ofthere is no way of dete:children served in each
a year.
A. AGENCY ADOPTIV1
(r
With one exception, allments were secured from
1. Number of Agencies.7 (on other foster ichildren in the homcon data from the to]ving the Chicago Arcwise specified, eacland other foster far
1The Welfare Council Rethe development of a s
type of information av

pulation in each county on July 1,Chicago Conununity Inventory,pulation Growth in the Chicago
Area, 1950-57, (Februaryfor 1967 were obtained from U.S.
rent Population Reports, Seriesal Estimates of the Population oflitan Areas, July 1, 1967,"
ese estimates do not take accountdistribution that may have occurred
result of changing birth rates, newfactors.
iN FOSTER CARE PIACEMENTS
rables 3 thru 11)
t focuses on trends in the numbers ofes of foster care placements: agencyfamily homes and child welfare in-
ster placements were obtained fromren's services which the Welfarefrom child welfare agencies and in-_a for almost forty years. Whileauable source of information, it hasLI be noted here.
of the system is that it does noto agencies in the local area,e Counties. Specific agencies thatinclude the following:
Joliet which has served Catholicity since 1944.
Du Page and Lake Counties.
ic Aid in Du Page and Lake Counties.
children served by the Illinoiselfare in 1957 and the Illinoisand Family Services in 1967.
ssued regular reports to their services to Cook County
45
children during the study period but did not issuespecific reports for children from other counties.)
The total number of children served by these agencies wasprobably too small to have changed the direction or magnitude ofany of the trends noted in the report. However, the lack ofservice data on Du Page and Lake Counties is still regrettable ,especially during this period when both counties are experiencingrapid population growth and--by implication--changes in theirservice patterns and needs.
A second limitation of the C-1 statistics is their omission ofinformation about the socio-economic characteristics and needs ofthe individual children receiving care. As a result, only asuperficial type of trend analysis based on aggregate numbers ispossible; and it is not possible to relate service volumes to suchsimple facts about the children as age , race, sex, family situa-tion, or length of time under care .1
In addition, present reporting provides the annual total numberof different children served for the entire caseload only, andnot by specific type of placements. Hence, for each particulartype of setting, such as adoptive or foster homes or institutions,it is possible to report only the average number of childrenserved each day (as based on the number of children receivingcare on the last day of each month, during a particular year) andthere is no way of determining the total number of differentchildren served in each of the various types of settings duringa year.
A. AGENCY ADOPTIVE HOIES AND OTHER FOSTER FAMILY HOMES
(Re: Tables 5 and 7)
With one exception, all data on adoptive and fester home place-ments were secured from C-1 reports to the Welfare Council.1. Number of Agencies. -- Tables 5 (on agency adoptive homes),
7 (on other foster family homes) and addendum (on services tochildren in the homes of parents or other relatives)were all basedon data from the following list of child welfare agencies ser-ving the Chicago Area during the study period. Unless other-wise specified, each agency provided placements in both adoptiveand other foster family homes in both study years.
Lrhe Welfare Council Research Department is currently proposingthe developnent of a system of reporting that would make thistype of information available for Chicago Area agencies.

Governmental: Chicago Welfare Department (1957); Cook CountyDepartment of Public Aid (1967), and Cook County Departmentof Welfare (1957); Juvenile (Family) Court of Cook County;Illinois Department of Children and Family Services (1967),Illinois Department of Public Welfare, Child Welfare Services(1957).
Voluntary Sectarian: Bensenville Home Society, CatholicCharities (Home Bureau) of Chicago, Central Baptist Children'sHome (foster homes only, both years), Evangelical (Child)Welfare Agency, Jewish Children's Bureau, Lake BluffChildren's Home, Lutheran Child Welfare Association, LutheranHome Finding Society (1957 only), Lutheran Social Service-(1957 only), Lutheran Welfare Rervices of Illinois (1967 only),St. Mary's Home for Children, Youth Guidance (foster homes,19 57 only).
Voluntary Non-sectarian: Chicago Child Care Society; ChicagoFoundlings' Home (adoptive homes only, both years) ; (Child and
Family Services of the) Chicago Home for the Friendless (fosterhomes only, 1957; both adoptive and foster homes, 1967); Cradle
Society (both adoptive and foster homes, 1957; adoptive homesonly, 1967); Easter House (adoptive homes, 1967 only); andIllinois Children's Home and Aid Society.
2. Daily Number of Children. -- For all but ono agency this isan average of the number of children reported on monthly C-1 forms,
as being in each type of home on the last day of every month duringthe year.
Easter House, a non-sectarian adoption agency established in 1964,did not report to the Welfare Council in 1967. The daily number
used in Table 5 for this agency is the total number of childrenreceiving service on June 30 that year, as reported in the IllinoisDepartment of Children and Family Services, Division of ChildWelfare, Movement Table, June 30, 1967 .
It should be noted that the 1957 volume of foster home servicesfor the Juvenile (Family) Court of Cook County may be somewhatunderstated in Table 7. Prior to 1966, the Court reported to theWelfare Council only those children who were placed in freetemporary care homes. Since this was corrected in 1966, the Courthas reported the total number of children placed in all types offoster homes, including boarding homes and work-wage homes, aswell as free homes.
46
B. CHILD
(Re: Tables 8 t
For the reader who is interestcdetailed summary of informatiorin 1957 and 1967 by type of carcategory, the table shows the rity, the daily child populatioryear and the percent of change1957 to 1967. Some of the dattTables 8 thru 11 in the text.
1. Classification of Institutitution in this report was classoutlined in the Illinois DepartServices, Group Classificationulation No. 5.17, July 1, 1965)fined as follows:
a) Treatment-oriented instiproblems -- In the presincludes all facilitiesof the following:
1) "Group I" comprehewhich, the Illinois 17for and serve childreevaluated by a psychior emotional disorderservices, including iresident ia 1 fac ilitie
stitutions are requirsional caseworker for
2) "Group II" -- casewo
which, the Departmentserve children whoseadjustment are such adividualized caseworksupervised, or directcasework staff. Thes
have at least one prothirty children.
b) Congregate-care institutchildren -- This classiall other" institutions

ent (1957); Cook Countyook County Departmentourt of Cook County;mily Services (1967),Child Welfare Services
Society, Catholicntral Baptist Children'sEvangelical (Child)au, Lake Bluff'e Association, Lutheranleran Social Serviceof Illinois (1967 only),idance (foster homes,
d Care Society; Chicagoboth years) ; (Child and
or the Friendless (fosteroster homes, 1967);Cradle:s, 1957; adoptive homesniles, 1967 only); and
but one agency this isted on monthly C-1 forms,day of every month during
ncy established in 1964,967. The daily numberal number of childrenreported in the Illinois, Division of Child
foster home servicesunty may be somewhate Court reported to there placed in freeected in 1966, the Courtplaced in all types ofwork-wage homes, as
46
B. CHILD WELFARE INSTITUTIONS
(Re: Tables 8 thru 11 and Appendix Table X)
For the reader who is interested in particulars, Table X offers'adetailed summary of information about child welfare institutionsin 1957 and 1967 by type of care provided and auspices. For eachcategory, the table shows the number of institutions, their capac-ity, the daily child population, and occupancy rates during eachyear and the percent of change in the daily child population from1957 to 1967. Some of the data in this table also appears inTables 8 thru 11 in the text.
1. Classification of Institutions. -- Each child welfare insti-tution in this report was classified on the basis of definitionsoutlined in the Illinois Department of Children and FamilyServices, Group Classification of Child Care Institutions, (Reg-ulation No. 5.17, July 1, 1965). The three categories were de-
fined as follows:
a) Treatment-oriented institutions for children with emotionalproblems -- In the present study, this classificationincludes all facilities that were judged as being eitherof the following:
1) "Group I" -- comprehensive group care facilities --which, the Illinois Department prescribes, providefor and serve children who have been diagnosed andevaluated by a psychiatrist as presenting behavioralor emotional disorders of such degree that specializedservices, including intensive psychotherapy, inresidential facilities, are recommended. These in-
stitutions are required to have at least one profes-sional caseworker for every fifteen children.
2) "Group II" -- casework group care facilities --which, the Department prescribes, provide for andserve children whose problems of care and emotionaladjustment are such as to require regular and in-dividualized casework services, administered,supervised, or directed by professionally qualifiedcasework staff. These institutions are required to
have at least one professional caseworker for everythirty children.
b) Congregate-care institutions for dependent, neglectedchildren -- This classification, in effect, includesall other" institutions that provide long-term care

TABLE X. CHILDREN IN CHILD WELFARE INSTITUTIONS IN THE CHICAGO AREA BY AUS
1957
Auspices and No. of Capac- Chiloren No. 0
Type of institution Insti- ity Average Percent Percent Insti
tutions Dec. 31 Daily No. of Total Occupancy tutio
Total 42- - 3,392 100.0 - 35
Governmental (3) - (70) (2.1) - (3)
Voluntary (39) (4,038) (3,322) (97.9) (82.3) (32)
Catholic 9 2,369 1,965 57.9 82.9 7
Other Sectarian 16 878 687 20.3 78.2 13
Non-sectarian 14 791 670 19.7 84.7 12
TREATMENT-ORIENTEDTotal 7 146 128 100.0 87.7 le
Governmental (Healy) (1) (24) (15) (11.7) (62.5) (1)
Voluntary (6) (122) (113) (88.3) (92.6) (15)
Catholic 0 - - - - 1
Other Sectarian 1 15 14 10.9 93.3 8
Non-sectarian 5 107 99 77.4 92.5 6
CONGREGATE-CARETotal 30 - 2 929 100.0 - 14
Governmental (Soldiers & Sailors) (1) - (15) (.5) - (1)
Voluntary (29) (3,604) (2,914) (99.5) (80.9) (13)
Catholic 8 2,169 1,752 59.8 80.8 5
Other Sectarian 14 835 650 22.2 77.8 4
Non-sectarian 7 600 512 17.5 85.3 4
TEMPCMARY-CARETotal 5 - 335 100.0 - 5
Governmental (Audy) (1) - (40) (11.9) _ (1)
Voluntary (Nurseries) (4) (312) (295) (88.1) (94.6) (4)
Catholic 1 200 213 63.6 106.5 1
Other Sectarian 1 28 23 6.9 82.1 1
Non-sectarian 2 84 59 17.6 70.2 2
,
Source: C-1 reports to the Welfare Council and Special Reports from the Illinois Department of Chil
and the Sonia Shankman Orthogenic School.
aAverage number under care on last day of each month.
47

CHILD WELFARE INSTITUTIONS IN THE CHICAGO ARFA t_BY AUSPICES AND TYPE OF INSTITUTION 1957 AND 1967
1957 1967 PercentChange1957-1967(Daily No.Children)
Capac-ityDec. 31
ChildrenPercent
Occupancy
No. ofInsti-tutions
Capac-ityDec. 31
ChildrenPercent
OccupancyAverageDaily No.a
Percentof Total
Average
Daily No.a
Percentof Total
3,392 100.0 35 2,530 100.0 -25,4
(70) (2.1) (3) (180) (7.1) (+157.1)
(4,038) (3,322) (97.9) (82.3) (32) (3,214) (2,350) (92.9) (73.1) (-29.3)
2,369 1,965 57.9 82.9 7 1,914 1,318 52.1 68.9 -32.9
878 687 20.3 78.2 13 561 421 16.6 75.0 -38.7
791 670 19.7 84.7 12 739 611 24.2 82.7 -8.8
146 128 100.0 87.7 16 725 576 100.0 79,4 +350.0
(24) (15) (11.7) (62.5) (1) (24) (21) (3.6) (87.5) (+40.0)
(122) (113) (88.3) (92.6) (1f,) (701) (555) (96.4) (79.2) (+391.2)1 65 50 8.7 76.9
15 14 10.9 93.3 8 321 252 43.8 78.5 +1700.0
107 99 77.4 92.5 6 315 20 43.9 80.3 +155.6 6'd
2929 100.0 14 1,531 100.0 -47.7
(15) (.5) (1) - (22) (1.4) (+46.7)
(3,604) (2,914) (99.5) (80.9) (13) (2,185) (1,509) (98.6) (69.1) (-48.2)
2,169 1,752 59.8 80.8 5 1,643 1,065 69.6 64.8 -39.2
835 650 22.2 77.8 4 204 148 9.7 72.5 -77.2
600 512 17.5 85.3 4 338 296 19.3 87.6 -42.2
335 100.0 5 423 100.0 +26.3
(40) (11.9) (1) (137) (32.4) (+242.5)
(312) (295) (88.1) (94.6) (4) (328) (286) (67.6) (87.2) (-3.1)
200 213 63.6 106.5 1 206 203 48.0 98.5 -4.7
28 23 6.9 82.1 1 36 21 4.9 58.3 -8.7
84 59 17.6 70.2 2 86 62 14.7 72.1 +5.1
Id Special Reports from the Illinois Department of Children and Family Services
month.
47

for children who are over two or three years of age. --Weli
These facilities were judged as meeting the standards Fori
prescribed by the Illinois Department of Children andII c
Family Services for "Group III" institutions.Cour
(Pul
c) Temporary-care facilities -- This classification in-cludes all institutions (or nurseries) that were --Wel:
specifically designated as providing temporary-care Ser,
and/or as providing care for infants and very young1961
children exclusively. The latter groups were, bytheir very nature, assumed to be temporary-carefacilities because of the generally accepted pro-fessional dictum that since institutions cannotadequately meet the needs of the very young child,any infant placed in one should be removed to a home
setting as soon as possible.
Since the temporary-care institutions are self-defined,
the task of classification was largely one of sorting
out the treatment institutions from the others. Since
limitations of budget and time made it impossible toseek classification data directly from the institutions,
each was classified on the basis of information con-cerning its program, purpose and personnel obtainedfrom secondary sources. It is, therefore, possible
that some institutions may have been inaccuratelyclassified on the basis of inadequate or outdated in-
formation, but in most cases, descriptive material was
sufficient enough to regard the classifications used as
reasonably accurate.
Specific references used in classifying the institutions
included the following:
- -Illinois Department of Children and Family Services,
A Directory of Children's Services, (1965 and 1968).
- -Kenneth Ives, Emotionally Disturbed Children: Number,
Treatment Facilities, and Unmet Needs, in the Chicago
Area, (Welfare Council of Metropolitan Chicago,
Publication No. 4005, 1961).
--Leroy H. Jones, New Tools for Administration of
Children's Institutions, An Analysis of Time, Costs,
and Aa3rations, (Welfare Council of MetropolitanChicago, Publication No. 1026, 1967).
4 8
2. Number oftions,as class
(Note: Rx =1Temporary-carecare; * = Merg
Governmental:
Arthur J. Au
Ill. SoldierWilliam Heal
Voluntary-CattCatharina ICE
Chicago InchKetteler MarMaryville A(Mission of (Polish Mama(St. Hedwig':St. Joseph':
for the Fi
St. Vincent

three years of age.eeting the standardsment of Children andnstitutions.
s classification in-ries) that wereing temporary-carents and very younggroups were, bytemporary-carely accepted pro-tutions cannotvery young child,e removed to a home
-ions are self-defined,rgely one of sortingom the others. Since
ide it impossible tofrom the institutions,
of information con-personnel obtained-herefore, possibleReen inaccuratelyuate or outdated in-scriptive material wasclassifications used as
sifying the institutions
ren and Family Services,ervices, (1965 and 1968).
isturbed Children: Ndmber,
nmet Needs, in the Chicagotropolitan Chicago,
or Administration ofAnalysis of Time, Costs,uncil of Metropolitan26, 1967).
48
- -Welfare Council of Metropolitan Chicago, Profiles of
Forty Fields of Human Care Services in Chicago, Part
II of the Joint Priorities Study of the Welfare
Council and the Community Fund of Chicago, Inc.,
(Publication No. 1024, 1967).
- -Welfare Council of Metropolitan Chicago, Social
Service Directory of Metropolitan Chicago, (1958 and
1966 editions with 1968 Supplement).
2, Number of Institutions. -- A list of child welfare institu-
tions,as classified in Table X for each study year, follows:
(Note: Rx = Treatment-oriented; Cc = Congregate-care; Tc =
Temporary-care; and - = closed or not offering institutional
care; * = Merged, operating under new name)
Governmental: 1957 1967
Arthur J. Audy HomeIII. Soldiers' & Sailors' Children's SchoolWilliam Healy School
Voluntary-Catholic:Catharina Kasper Industrial School for GirlsChicago Industrial School for GirlsKetteler Manual Training School for BoysMaryville AcademyMission of Our Lady of MercyPolish Manual Training School for BoysSt..Hedwig's Industrial School for GirlsSt. Joseph's Carondelet Child Center (Home
for the Friendless)St. Vincent's Infant Hospital
Tc
Cc
Rx
CcCcCcCcCcCc
Cc
Cc
Tc
Tc
CcRx
CcCcCcCcCc
RxTc

Voluntary-Other Sectarian:Augustana NurseryBensenville Home SocietyCentral Baptist Children's HomeChildren's Home of the Croatian FraternalUnion of America
Children's Receiving HomeDanish Lutheran Children's HomeEdison Park Home (Norwegian Lutheran
Children's Home)Illinois Masonic Children's HomeJewish Children's BureauLake Bluff Children's HomeLawrence HallLutherbrookLydia Children's Home AssociationProtestant Child Haven AssociationRandall HouseUhlich Children's Home
Voluntary-Non-Sectarian:Allendale School for BoysArden Shore Home for BoysChapin HallChicago Foundlings HomeChicago Home for GirlsChildren's Home of I.C.H.A.S.Cradle SocietyGlenwood School for BoysHephzibah Children's HomeMary Bartelme Home (Club) for GirlsPark Ridge School for GirlsRidge FarmSonia Shankman Orthogenic SchoolSunny Ridge Home for Children
3. Capacity. -- Capacity figureswere taken from their C-1 reportsDecember 30 of each study year onthe institution or receiving homeand facilities."
Tc TcCc -Cc Rx
Cc CcCc RxCc -
Cc RxCc CcRx RxCc RxCc RxCc RxCc CcCc -
Cc RxCc Cc
Cc RxCc CcCc RxTc TcRxRx RxTc TcCc CcCc CcRx RxCc RxRxRx RxCc Cc
for most child welfare facilitiesto the Welfare Council for"the maximum number of childrencan serve with available staff
For three institutions that did not report capacity data to theWelfare Council in 1967 their licensed capacities on December 30of that year were taken from the Illinois Department of Childrenand Family Services, A Ddrectory of Children's Services, (1968).
49
For the Sonia Shankmaldata were secured fro)]
Capacity figures for ISoldiers' and SailorsJ. Audy home -- were 1institution had a specyoungsters from the CIdetention facility bnhas no specific capac:Soldiers' and Sailorssters from all areas (Chicago Area resident;
4. Daily Number of CIC-1 reports except th(the Illinois Soldieraof Cook County childr(1967 was taken from tlServices, Summary of 1tion Report 68, No. 1
III. CHILDRI
(Re: Ta)
The third part of th(served by three othe]tutions for the ment !
and psychiatric hosp:
A detailed summary olinstitutions, includ:daily child populati(study year, and thefrom 1957 to 1967. !
shown in briefer forr
Unlike the child wel:institutions studiednor are they all mem!This made it necesmudifferent sources an("bits and pieces" ofsome limitations of 1in subsequent sectior

Tc Tc
Cc
Cc Rx
Cc Cc
Cc Rx
Cc
Cc Rx
Cc Cc
Rx Rx
Cc Rx
Cc Rx
Cc Rx
Cc Cc
Cc -
Cc Rx
Cc Cc
Cc Rx
Cc Cc
Cc Rx
Tc Tc
RxRx Rx
Tc Tc
Cc Cc
Cc Cc
Rx Rx
Cc Rx
RxRx Rx
Cc Cc
child welfare facilitieslfare Council formum number of children1 with available staff
capacity data to thecities on December 30epartment of Childrenn's Services, (1968).
49
For the Sonia Shankman Orthogenic School, capacity and service
data were secured from the staff of the School.
Capacity figures for two governmental institutions -- IllinoisSoldiers' and Sailors' Children's School and Cook County's Arthur
J. Audy home -- were not included in Table X because neither
institution had a specific number of beds set aside for dependent
youngsters from the Chicago Area. The Audy Home, as a multi-functiondetention facility for both delinquents and dependent youngsters,has no specific capacity for the latter group, and the IllinoisSoldiers' and Sailors' Children's Home, as a facility for young-sters from all areas of the state, has no specific capacity forChicago Area residents.
4. Daily Number of Children. -- All of these data were based onC-1 reports except the Orthogenic School, as noted previously, andthe Illinois Soldiert' and Sailors' Children's School. The number
of Cook County children in the latter institution on November 30,1967 was taken from the Illinois Department of Children and FamilyServices, Summary of the Living Arrangements of Children (Informa-
tion Report 68, No. 1, April 1968).
CCHILDREN IN THREE OTHER TYPES OF INSTITUTIONS
(Re: Tables 12 thru 15 and Appendix Table XX)
The third part of the report offers data on Chicago Area youngstersserved by three other types of institutions for children: insti-
tutions for the mentally retarded, institutions for delinquents,and psychiatric hospital facilities for children.
A detailed summary of information is shown in Table XX about theseinstitutions, including their total number by auspices, capacity,daily child population in residence, and occupancy rates for eachstudy year, and the percent of change in the daily child populationfrom 1957 to 1967. Some of the information in this table is also
shown in briefer form in Tables 12 thru 15 in the text.
Unlike the child welfare agencies, almost none of the specialinstitutions studied make regular reports to the Welfare Councilnor are they all members of any other common data collection system.
This made it necessary to secure the statistics from a number ofdifferent sources and then attempt to put together the various"bits and pieces" of information. The specific resources used and
same limitations of the data are described, by type of institution,
in subsequent sections.

TABLE XX. CHICAGO AREA CHILDREN IN THREE OTHER TYPES OF INSTITUTIONS BY AUSPICES AN
Auspices andType of Institution
1957
No. ofInsti-tutions Capacity
ChildrenPercentOccupancya
No. ofInsti-tutions CapDaily No.
Percentof Total
Total 18 3,968 100.0 39
Governmental 13 3,156 79.5 35
State (11) (8,381)b (2,713) (68.4) (33) (lcOther (2) (443) (11.1) (2)
Voluntary (Catholic) . . .5 807 812 20.5 100.6 4
INSTITUTIONS FOR THEMENTALLY RETARDEDCTf,tal 6 2 205 100 0 9---L-
Governmental (State) . 2 7,036b 1,546d 70.1 142.7 6 8
Voluntary (Catholic) . 4 662 659 29.9 99.5 3
Proprietarye (5) (259) N A (6)
INSTITUTIONS FORDELINQUENTSTotal 11 1,671 100.0 20
Governmental 10 - 1,518 90.8 19
Illinois Youth Commission (8) (1,315)b (1,075) (64.3) (103.2) (17) (2
Other (2) (443) (26.5) (2)
Audy Home 1 300 222 13.3 87.3 1
Parental School 1 210 221 13.2 105.2 1
Voluntary (Catholic) 1 145 153 9.2 105.5 1
PSYCHIATRIC HOSPITALSGovernmental (State)g. 1 30h 92 10
Private (voluntary andproprietary)e NA NA NA NA
Source: Estimates based on reports from Illinois Association for the Mentally Retarded, Illinois CommissiorIllinois Youth Commission, U.S. Department o'.! Health, Education and Welfare, C-1 reports to the Welfare Cour
?Calculated on basis of total daily resident population.uflefers to total institutional capacity for residents from all areas of the state.
°Data are for 1961 and 1967 because figures for 1957 were not available.dEstimated for Cook County children only because data not available for children from DuPage and Lake CountieNot included in totals.
fRefers to total physical capacity for both dependent and delinquent children.gData are for 1955 and 1967 because figures for 1057 were not available.Refers to total number of certified beds in special units for child or adolescent patients in state hospitr
NA: Not Available
50

REA CHILDREN IN THREE OTHER TYPES OF INSTITUTIONS BY AUSPICES AND TYPE OF INSTITUTION, 1957 AND 1967
1957 1967 PercentChange1957-1967(Daily No.Children)Capacity
ChildrenPercentOccupancya I.
No. ofInsti-tutions Capacity
ChildrenPercentOccupancyaDaily No.
Percentof Total Daily No.
Percentof Total
3,968 100.0 39 4 327 100.0 +9.0
3,156 79.5 35 3,714 85.8 +17.7
(8,381)b (2,713) (68.4) (33) (10,961)b (3,175) (73.4) (+17.0)
(443) (11.1) (2) (539) (12.4) (+21.7)
807 812 20.5 100.6 4 638 613 14.2 96.1 -24.5
2,205 100 0 9 1 960 100.0 -11.1
7,036b 1,546d 70.1 142.7 6 8,314
b1,458d 74.4 114.3 -5.7
662 659 29.9 99.5 3 508 502 25.6 98.8 -23.8
(259) N A (6) (359) (350) (97.5)
1,671 100.0 20 1,987 100.0 +18.9
- 1,518 90.8 19 - 1,876 94.4 - +23.6
(1,315)b (1,075) (64.3) (103.2) (17) (2,052)b (1,337) (67.3) (90.7) (+24.4)
(443) (26.5) (2) (539) (27.1) (+21.7)
300 222 13.3 87.3 1 358f 263 13.2 111.7 +18.5
210 221 13.2 105.2 1 240 276 13.9 115.0 +24.9
145 153 9.2 105.5 1 130 111 5.6 85.4 -27.5
30h 92 10 595h 380 +313.0
NA NA NA NA (105)
linois Association for the Mentally Retarded, Illinois Commission on Children, Illinois Department of Mental Health,
:If Health, Education and Welfare, C-1 reports to the Welfare Council, and others.
t population.'residents from all areas of the state.for 1957 were not available.zause data not available for children from DuPage and Lake Counties.
dependent and delinquent children.for 1957 were not available.h special units for child or adolescent patients in state hospitals and zone centers.
50
A. CHILMEN IN INSTITUTIONS FOR THE MENTALLY RETARDED
(Re: Table 13)
Table XX (like Table 13 in the body of the report) presents informa-tion about institutions for the retarded in 1961 and in 1967. Lack
of data for 1957 made it necessary to substitute 1961 figures, whichwere the earliest set available.
1. Number of Institutions. -- A list of the institutions included inTable YX follcs unless specified otherwise; each facility providedcare to i,hicago Area children during both study years.
Governmental (State); Dixon State School, Lincoln State School,A. L. Bowen Children's Center (1967 only), Warren G. MurrayChildren's Center (1967 only), William W. Fox Children's Center(1967 only), Illinois State Pediatric Institute (1967 only).
Voluntary (Catholic); Lt. Joseph P. Kennedy School for Excep-tional Children, Misericordia Home, Mt. St. Joseph School (1957only), St. Mary of Providence School.
Proprietary; Elaine-Boyd-Creche, Inc., Klingberg School forMentally Retarded, Little City Training and Treatment Center,Mark Lund Hilltop, Inc., Thelma Lindquist Home (1967 only),Walter's Private Nursery.
2. Capacity. -- Institutional capacities for 1961 were obtained
from the following sources:
a) State Institutions. -- Certified bed capacities on1961 were obtained from the Illinois Department ofHealth, Statistics, (April-June 1961); and on June
1967, from Statistics, (January-June 1967).
b) Private Institutions. -- The 1961 capacities of allvoluntary institutions and of most proprietary facilities
were obtained from the Illinois Council for MentallyRetarded Children, A Directory of Services for the Mentally
Retarded in Illinois, (1962). For three proprietary in-stitutions not included in the Directory, it was necessaryto substitute their 1964 capacities as reported in theIllinois Department of Children and Family Services, A
Directory of Children's Services, (1965). The 1967
capacities of most voluntary and proprietary institutionswere obtained from the Illinois Department of Children and
Family Services, A Directory of Children's Services, (1968).For two small proprietary institutions that were not listed
June 30,Mental30,
51
in the DirectoAssociation foFacilities for
3. Daily Number of Con the number of Chictarded in 1961, estim
a) State Institutthe proportionwho were underas in 1967. T
June 30, 1967Mental Health,percent was apJune 30, 1961,(April-June 19of children in
On the basis othe 1960 WhiteCook County Refrom Cook Counof children in
Unfortunately,ating the numtwho were in stHence, these cfrom Tables 12only to the eswho were in redata reportedCounty childreCook County whou June 30, 19tion with theall of the stuinstitutions fbecause they aCounties and p
b) Private Institin voluntary ifrom the Deparcomparable dattutions which,Statistics rep

THE MENTALLY RETARDED
e report) presents informa-in 1961 and in 1967. LackIstitute 1961 figures, which
he institutions included inse; each facility providedstudy years.
ool, Lincoln State School,ly), Warren G. MurrayW. Fox Children's CenterInstitute (1967 only).
ennedy School for Excep-. St. Joseph School (1957
, Klingberg School forg and Tmatment Center,ist Home (1967 only),
s for 1961 were obtained
aed capacities on June 30,)is Department of Mental61); and on June 30,ane 1967).
, capacities of allt proprietary facilitiespuncil for MentallyServices for the Mentallyr three proprietary in-rectory, it was necessaryps as reported in thead Family Services, A,(1965). The 1967proprietary institutionsapartment of Children andlaldren's Services, (1968).Lions that were not listed
51
in the Directory, capacity figures were taken from IllinoisAssociation for the Mentally Retarded, Private ResidentialFacilities for the Mentally Retarded in Illinois, (1968).
3. Daily Number of Children. -- In the absence of specific dataon the number of Chicago Area children in institutions for the re-tarded in 1961, estimates were derived as follows:
a) State Institutions. -- It was arbitrarily assumed thatthe proportion of resident patients in state facilitieswho were under 18 years of age was about the same in 1961as in 1967. The percent of resident patients under 18 onJune 30, 1967 was obtained from the Illinois Department ofMental Health, Administrator's Data Manual, (1967). Thispercent was applied to the total resident population onJune 30, 1961, as reported in the Department's Statistics,(April-June 1961), to arrive at an estimate of the numberof children in residence.
On the basis of a statement in the Illinois Committee forthe 1960 White House Conference on Children and Youth,Cook County Report (1960), it was ammmed that childrenfrom Cook County constituted one-half of the total numberof children in state facilfties on June 30, 1961.
Unfortunately, adequate data were not available for estim-ating the numbers of children from DuPage and Lake Countieswho!were in state institutions for the retarded in 1961.Renee, these children are omitted from Table XX and alsofrom Tables 12 and 13 in the text, all of which pertainonly to the estimated number of children feom Cook Countywho were in residence. To be consistent, the 1967 servicedata reported in these tables also pertain only to CookCounty children. The number of patients under 18 fromCook County who were in state institutions for the retardedon June 30, 1967 was obtained from a personal communica-tion with the Illinois Department of Mental Health. Hence,all of the study figures on Chicago Area children in stateinstitutions for the retarded are somewhat understatedbecause they all exclude youngsters from DuPage and LakeCounties and pertain only to Cook County children.
b) Private Institutions. -- The number of patients under carein voluntffiry institutions on April 1, 1961 were obtainedfrom the Department's Statistics, (April-June, 1961). Nocomparabl6 data were available for the proprietary insti-tutions Which, with one exception, were not included in theStatistiOs report.

-teglIP
The number of patients under care in both voluntary and
proprietary institutions on June 30, 1967 was obtained from
the Illinois Department of Mental Health, The Illinois StatePlans for the Construction of Facilities for the Mentally
Retarded, Title I C, and Community Mental Health Centers,Title II, Public Law 88-164, F.lscal Year 1967.
This publication also gave a complete report on the numbers
of "preschool" and "school age" retarded children undercare in adult facilities and in other types of children's
institutions on June 30, 1967. However, these figures werenot incorporated in Table XX (or in Table 13 in the text),
because there was no comparable information for 1961.
4. Waiting Lists. -- In the absence of specific data, it was
necessary to estimate the number of children from the Chicago Area
who were on waiting lists for state institutions.
Since it was not possible to secure any information on the 1961
list, the total list in 1960 was substituted as a base for estim-
1.s ating. This was taken from Gordon Snow, Mental Retardation,
tlp: (Working Paper for the Illinois Committee for the White House
re/ Conference on Children and Youth, February 1968). The total num-
ber of names on the waiting list on March 1, 1967 was obtained
from Illinois Association for the Mentally Retarded, Residential
Care Needs of the Mentally Retarded in Illinois, (March 24, 1967),
which, in turn, cited a report from the Illinois Department of
Mental Health, the Division of Mental Retardation Services.
Estimates of the number of Cook County children under 18 on thewaiting list for each study year rest on two assumptions. First,
it was assumed that 85 percent of the people on the 1960 and the
1967 waiting lists were under 18 years of age. This assumption
is based on the fact that 85 percent of the 1964 waiting list
were under 18. This finding was obtained from the IllinoisAssociation for the Mentally Retarded, Residential Care Needs,citing the Illinois Department of Public Health, The WaitingList - A Study of the Mentally Retaxded, (Report to theInterdepartmental Committee on Mental Retardation, December 1965).
It was also axbitrarily assumed that, because Cook Countychildren made up one-half of the total resident population under18 in state schools in both study years, they also constitutedone-half of each waiting list.
52
B. CHILDRI
Since institutions thEoperated under severalservice statistics frcquality as well as quEon Children, Report oiIllinois, (1968).
Even the basic,e]are collected indoes not ... lencin program effectIllinois has thewith one other Stavailable for thc
President's Commd
1. Number of Institutdtutions included in Tswise, each facility scstudy years.
Illinois Youth ComnTraining School forReception and DiagrCamps for Boys (5 i
Education Schools f
Other Governmental.Board of Education
Voluntary. The Hou
2. CaTecity. Sources
were:
a) Illinois Youth Ccapacities of trwere obtained frDirectory of Metwith 1968 Supple

eth voluntary and967 was obtained fromth, The Illinois Statees for the Mentallytal Health Centers,ar 1967.
report on the numbersed children undertypes of children'sr, these figures wereble 13 in the text),ation for 1961.
ific data, it wasfrom the Chicago Areaons.
motion on the 1961as a base for estim-al Retardation,the White House
*68). The total num-1967 was obtained%tarded, Residential
is, (March 24, 1967),ois Department ofItion Services.
ren under 18 on theassumptions. First,on the 1960 and the
e. This assumption1964 waiting listom the Illinoisential Care Needs,1th, The Waitingport to the,ation, December 1965).e Cook Countyent population underv also constituted
52
B. CHILDREN IN INSTITUTIONS FOR DELINQUENTS
(Re: Table 14)
Since institutions that serve Chicago Area delinquents areoperated under several auspices, it was necessary to secureservice statistics from a variety of sources that were uneven inquality as well as quantity. As noted in the Illinois Commissionon Children, Report of a Committee on Youthful Offenders in
Illinois*(1968)-
Even the basic,elementary data on youthful offendersare collected in a non-uniform, irregular manner thatdoes not ... lend itself to use in developing insightsin program effectiveness, trends, or crucial areasIllinois has the dubious distinction of being classedwith one other State as having the least amount of dataavailable for the National Survey conducted for thePresident's Commission on Law Enforcement.
1. Number of Institutions. -- A list of the delinquency insti-
tutions included in Table XX follows. Unless specified other-
wise, each facility served Chicago Area children during both
study years.
Illinois Youth Commission. Industrial School for Boys, StateTraining School for Boys, State Training School for Girls,Reception and Diagnostic Center for Boys (1967 only), ForestryCamps for Boys (5 in 1957 and 10 in 1967), and 3 SpecialEducation Schools for Boys (1967 only).
Other Governmental. The Arthur J. Audy Home and the Chicago
Board of Education Parental School.
Voluntary. The House of the Good Shepherd
2. Capacity. Sources of capacity data, by institutional auspices,
were:
a) Illinois Youth Commission Facilities. -- The physical
capacities of the Illinois Youth Commission facilitieswere obtained from the Welfare Council, Social Service
Directory of Metropolitan Chicago, (1958 and 1966 editions
with 1968 Supplement.)

b) The Arthur J. Audy Home. -- As a multi-function temporary
detention facility for both dependent and delinquent
youngsters, the Audy Home has no specific capacity for
delinquents. However, in order to provide a base formeasuring comparative rates of occupancy during the two
study years the Home's total physical capacity for both
delinquents and dependent children on Decemter 31, 1957
and 1967 Ac:"e obtained from its C-1 reports to the Welfare
Council anc reported in Ttble XX.
c) The Chicago Board of Education's Parental School. --
Capacity figures given in two special reports to the
Welfare Council were used: for 1957, Henry J. Woessner,
Director, Bureau of Socially Maladjusted Children, Chicago
Board of Education, Address to the Committee on Facilities
for Adolescents of the Welfare Council of MetropolitanChicago, (September 24, 1957); and for 1967, the Reverend
Christopher Smith, Parental School Chaplain, The Field
Work Program at the Chicago Parental School, 111777----
d) The House of the Good Shepherd. -- The estimated maximum
number of children that could be served with available
staff, physical plant, and other resources on December 31
of each study year were secured from this institution's
C-1 reports to the Welfare Council.
3. Daily Number of Children. -- Data were derived from the
following sources:
a) Illinois Youth Commission Facilities. -- In the absence of
specific data on the daily number of Chicago Areachildren in institutions for delinquents, estimateswere derived from three sets of figures reported in the
Illinois Youth Commission, Semi-Annual StatisticalSummary, (July-December, 1957 and 1967). These includedthe average total daily resident population in IllinoisYouth Commission facilities, the total number of childrencommitted to the Youth Commission, and the sub-total ofthose committed from Cook, &Wage and Lake Counties dur-ing the last six months of each study year.
In the absence of contradictory evidence, it seemedreasonable to assume that the proportion of residentsfrom the Chicago Area to total residents was equivalentto the proportion of Chicago Area commitments to total
commitments. Therefore, the percent of ccmositmente
53
represented bytotal average dtsix months of eof the averageresidence.
b) The Arthur J. A.children receivduring 1957 andreports to the 1dependent child:in Table X) wasdaily delinquen1
c) The Chicago BoaIn lieu of 1957"membership" of1958 was,substilKenneth Ives, EATreatment Facil1Area, (Welfare (Publication No.of Education,and ActivitiesChildren, Octot*also not avallaParental Schoolwas taken from 1Statistics on Pt
ano (U.S. De;Children's &well
d) The House of tiltgirls under carstudy years werreports to the
C. CB
Although it is commonchildren receive carepsychiatric wards of Atics were forthcomingpsychiatric care thatin the body of the re

As a multi-function temporarydependent and delinquents no specific capacity forder to pmvide a base forof occupancy during the twophysical capacity for bothildren on December 31, 1957its C-1 reports to the Welfaree XX.
on's Parental School. --o special reports to thejor 1957, Henry J. Woessner,F Maladjusted Children, Chicagoto the Committee on Facilitiesxe Council of Metropolitan); and for 1967, the ReverendSchool Chaplain, The FieldParental School,
rd. -- The estimated maximumd be served with availablether resources on December 31red from this institution'souncil.
ta were derived from the
ilities. -- In the absence ofnber of Chicago Arealelinquents, estimates,)f figures reported in themi -Annual Statisticaland 1967). These included
ent ppulation in Illinoisthe total number of childrension, and the sub-total ofPage and Lake Counties dur-ch study year.
qlr evidence, it seemedproportion of residents
U residents was equivalenttree commitments to total'Percent of commitments
53
-
represented by Chicago Area children was applied to thetotal average daily resident population during the lastsix months of each study year to arrive at an estimateof the average daily number of Chicago Area children inresidence.
b) The Arthur J. Audy Home. -- The average number ofchildren receiving care on the last day of each monthduring 1957 and 1967 was taken from the Home's C-1reports to the Welfare Council. The average number ofdependent children under care each month (already shownin Table X) was subtracted from the total to obtain thedaily delinquent population shown in Table XX.
c) The Chicago Board of Education's Parental Schools. --In lieu of 1957 data, which were not available, the"membership" of Chicago Parental School on November 30,1958 was substituted. This fivre was obtained fromKenneth Ives, Emotionally Disturbed Children: Number,Treatment Facilities, and Unmet Needs._ in the ChicagoArea, (Welfare Council of Metropolitan Chicago,Publication No. 4005, 1961), citing the Chicago Boardof Education, Department of Special Education, Functionsand Activities of the Bureau of Socially MaladjustedChildren, October 1960. In lieud 1967 data which werealso not available, the number of children in theParental School on June 30, 1967 was substituted. Thiswas taken from Louise T. Jackson and Daisy C. Ligons,Statistics on Public Institutions for Delinquent Children,1226 (U.S. Department of Health, Education and Welfare,Children's Bureau, Statistical Series 69, 1967).
d) The House of the Good Shepherd. -- The average number ofgirls under care on the last day of each month in bothstudy years were secured from this institution's C-1reports to the Welfare Council.
C. CHILLI= IN PSYCHIATRIC HOEOUTALS
(Re: Table 15)
Although it is common knowledge that substantial numbers ofchildren receive care in private psychiatric hospitals and in thepsychiatric wards of general hospitals, very few service statis-tics were forthcoming from these facilities. Thus, the data onpsychiatric care that is presented in Table XX (and in Table 15in the body of the report) are, for the most part, limited to
C D

those made available by the public sector. Even these were hardto come by for the earlier part of the study period, and lack ofsufficient data for 1957 made it necessary to use figures for 1955
instead.
1. Number of Hospital Units. -- Psychiatric facilities included
in Table XX are listed below. With the exception of Peoria StateHospital which opened its special unit for children in 1951,none of the other state facilities for children were in operation
in 1955. The list of private facilities includes all privatepsychiatric hospitals mentioned in Department of Mental Healthsemi-annual statistics reports for 1967. It is not known howmany of them actually had special units for child patients.
btate Hospitals and Zone Centers with Special Units forChildren and/or Adolescents: Chicago State Hospital (inconjunction with Read Zone Center) (3 units); Elgin StateHospital (2 units); Galesburg State Hospital (3 units);Peoria State Hospital (1 unit); Tinley Park State Hospital(1 unit).
I.. Voluntary Psychiatric Hospitals: Nicholas J. Pritzker
1.3 Center, Pinel Hospital, and Ridgeway Hospital. (Mercyville
Hospital which is outside the Chicago Area was also in-cluded in the state's statistical report and used as asource for this report)
Proprietary Psychiatric Hospitals: Fairview Hospital, Forest
Hospital, North Shore Hospital, Riveredge Hospital. (Resthavenand Norbury Hospitals, which are outside the Chicago Area,were also included in the statt's statistical report and usedas a source for this report).
2. Capacity. -- No data were available on the number of children'sbeds ineither private psychiatric hospitals or psychiatric wardsof general hospitals. As a result, Table XX shows capacities foronly one type of psychiatric in-patient facility for children:special children's and adolescents' units in state hospitals and
zone centers. The number of beds available in the Peoria StateHospital Children's Center in 1955 was obtained from the IllinoisCommission on Children, Interdepartmental Committee on Children andYouth, Study of Emotionally Disturbed Children, (1967). Certified
bed capacities of all special units for children and adolescents instate facilities as of December 30, 1967 were obtained from theIllinois Department of Mental Health, Statistics (July-December,1967).
54
3. Daily Number of Chil(figures on the number 0patients in Chicago Arciperiod, estimates were
a) State Hospitals.who were on the'on June 30 in 19Illinois CommissDisturbed Childrcthose patients ptthe count was tali
home visits, and
It was estimated4the books" in eacThis percentage wtwo special studistudy reported bydicated that apprDepartment of Menwere residents ofthe Illinois Common Children and Vof the children 0December 30, 195(
b) Private hkuppitalsunder 20 years ohospitals in Ill1967) was obtainoEducation and Weltuts of Mental HcPart III, PrivatoPsychiatric Servifacilities were Iassumed for pumixpatients, also, c
Ne data were forthospitals in 1951with psychiatric

,or. Even these were hard
study period, and lack of
ary to use figures for 1955
iatric facilities included
u exception of Peoria State
for children in 1951,
children were in operation
ies includes all privateartment of Mental Health
7. It is not known how
s for child patients.
th Special Units for
go State Hospital (in
(3 units); Elgin State
Hospital (3 units);
ley Park State Hospital
Nicholas J. Pritzker
ty Hospital. (Mercyvilleego Area was also in -
.eport and used as a
Fairview Hospitil, Forest
veredge Hospital. (Resthaven
utside the Chicago Area,statistical report and used
Jie on the number of children's
ispitals or psychiatric wards
able XX shows capacities for
:nt facility for children:
mita in state hospitals and
lilable in the Peoria State
as obtained from the Illinois
lital Committee on Children and
Children, (1967). Certified
lor children and adolescents in
1967 were obtained from the
Statistics (July-December,
54
3. Daily Number of Children. -- In the absence of specific
figures on the number of children under 18 years of age who were
patients in Chicago Area psychiatric hospitals during the study
period, estimates were made as follows:
a) State Hospitals. -- The total number of children under 18
who were on the books" of state hospitals and zone centers
on June 30 in 1955 and in 1967 were obtained from the
Illinois Commission on Children, Study of Emotionally
Disturbed Children. The "on the books" population includes
those patients physicallypresent in the institution when
the count was taken as well as those on overnight passes,
home visits, and other temporary absences.
It was estimated that 60 percent of the child patients "on
the books" in each study year were from the Chicago Area.
This percentage was based on similar findings rerorted in
two special studies of children in Atate hospitals. One
study reporten by the Illinois Commission on Children in-
dicated that approximately67 percent of the children in
Department of Mental Health facilities on June 30, 1964
were residents or the Chicago Area. An earlier finding in
the Illinois Committeefor the 1960 White House Conference
on Children and Youth, IllinoisReport, was that 59 percent
of the children under 19 years of age in state hospitals on
December 30, 1956 were from Cook County alone.
b) Private Hospitals. -- The total number of resident patients
under 20 years of age reported to be in ten private mental
hospitals in Illinois onDecember 31, 1966 (and on January 1,
1967) was obtained from the U.S. Department of Health,
Education and Welfare, Public Health Service, National Insti-
tute of Mental Health, Patients in Mental Institutions,
Part III, Private Mental Hospitals and General Hospitals with
Psychiatric Service, (1966). Since seven out of ten of these
facilities were located in the Chicago Area, it was arbitrarily
assumed for purposes of this report that all of their young
patients, also, cane from this region.
No data were forthcoming on children served in private mental
hospitals in 1957, or on those served in general hospitals
with psychiatric facilities during either stilly year.

ADDENDUM: MATERNITY }MRS FCR UZG1ARRIED MOTILERS
The data presented in Addendum pertain to women of all agesserved by maternity homes in the Chicago Area. Although nospecific figures for services to minors were available, it isthe consensus of workers in the field that most of the womenwho use this type of facility are under 25, and probably under
21.
1. Number of Homes. -- The maternity homes included in this
stndy were as follows:
Voluntary Sectarian; Misericordia Home; St. Vincent'sInfant Asylum and Maternity Hospital; Salvation Army,Booth Memorial Hospital.
Voluntary Non-Sectarian: Chicago Foundlings Home; Chandler
House of the Cradle Society; Florence Crittenton Anchorage;Fox Hill, Inc. (1967 only)
2. Capacity. -- The "number of beds provided for regular use"on December 31, 1957 and 1967 were taken from C-4 reportssubmftted to the Welfare Council by all of the homes except
Fox Hill, Inc. The latter facility opened in 1966 and itslicensed capacity on December JO, 1967 was obtained fromthe Illinois Department of Childres. and Family Services,A Directory of Children's Services, 1968.
9. Daily Resident Population. -- Average daily residentpopulations of six homes for each study year were calculatedfrom the number of women each reported, on C-4 forms, tobeunder care at midnight on the last day of each month. For
Fox Hill, the number of children (i.e. mothers) receivingcare on one day -- June 30 -- in 1967 was obtained from the
Illinois Department of Children and Family Se.wices,Division of Child Welfare, Movement Table, for that date.
4. Total Number of Different Women Served. -- These figures
were obtained from the same sources-a the daily residentpopulations.
55