document resume - eric · document resume. ed 234 819 ir 050 453. author eckels, diane cole ... we...
TRANSCRIPT

DOCUMENT RESUME
ED 234 819 IR 050 453
AUTHOR Eckels, Diane ColeTITLE Introductory Data Collection and Analysis;INSTITUTION Medical Library Association, Chicago, Ill;PUB DATE 78NOTE 71p;; Medical Library Association Courses for
Continuing Education: CE 41;PUB TYPE Guides Classroom Use -_Materials (For Learner)
(051) Reference Materials Bibliographies (131)
EDRS PRICE MF01/PC03 Plus Postage.DESCRIPTORS Course Content; *Data Collection; Library
Administration; *Library Research; ProfessionalContinuing Education; *Questionnaires; ResearchMethodology; *Statistical Analysis; statistits
IDENTIFIERS *Library Statistics
ABSTRACTDesigned for persons with no prior knowledge_of
statistics, this continuing education course syllabus presents basicinformation on methods of data collection and analysis in libraries.It is noted :hat emphasis is placed on concepts rather thanmathematical formulas and on reasons for using particular techniques;Topics covered include problem definition; study design; theadvantages and disadvantages of using direct observation, historicalrecords, published surveys;_ interviews, and questionnaires for datacollection; the design, administration, and evaluation ofquestionnaires; ra%dom sampling; the tabulation and graphical_representation of_descriptive statisticsl statistical estimation;statistical decisions; variance tests-(the F test and analysis ofvariance); the Chi-Square_test; correlation; and regression. Examplesare provided_of the use_of data collection-_ and analysis techniques inlibraries. Also_provided_are a series of 12 problemsto be completed,a list of important equations, an 11-item bibliography, and a corelist of journals that report the results of research in libraryscience. (ESR)
************************************************************************ Reproductions supplied by EDRS are the best that can be made *
* from the original document. *
***********************************************************************

\j
MEDICAL LIBRARY ASSOCIATIONCOURSES FOR CONTINUING EDUCATION
U.S. DEPARTMENT OF EDUCATIONNATIONAL INSTITUTE OF EDUCATIONDUCA IIONAI II !;0(.111CI INI 011MA 110N
(IN UM (HOUve, 1111,, dm tirriorit rTraitio ott
orvi,t tralt the' pt,.11,1
11,j1,1,11,,j .1
h.lv.. titIi 11110, 111 ilT11111,,
C 41Introductory Data
Collection and Analysis
Diane Cole Ecl-elsHoUStOn Academy of MedicineTexas Medical Center Library
Houston; Texas
"PERMISSION TO REPRODUCE THISMATERIAL HAS BEEN GRANTED BY
Barbara Baxter
TO THE EDUCATIONAL RESOURCESINFORMATION CENTER (ERIC).-

syllabus is not intended to stand alone. It is onlyone patt of an integrated instructional package involvinga qualfiod instructor, the instructional environment, sup-plementary materials and program evaluation; CEU's may beqtatitod only by the Medical Library Association in accordancewith it's Continuing Education Program;
Medical Library Association, Inc. 1973
Revised edition
1978
CI-T 41: Introductory Data Collection and Analysis
This course is int=s.ncic-ci as an introdt.ction to methods of dataet.Vt tier; and artily is in libraries. No pr'or knowledge of statistics
assur nod
The topics include J should provide background both for personsinterested in ccnducting E;imple quantitative studies themselves and forhose who are interested in bett:er understanding quantitative articlesn the literature.
Lmphasis will be given to the questionnaire and direct samplingnethods of data collection: Data analysis methods discussed willntlude descriptive statistics-, regression, correlation and testa ofsignificance. The use of these techniques in a library setting will
discussed with examples familiar to the participants;
Concepts will be stressed rather than mathematical formulasalthough examples will be worked in class. Problf.m formulation;reasons for using particular techniques, advantages and disadvantagesDf the various methods, and the interpretation and presentation of-esults will be emphasid.
flourse objectives
At the conclusion of the course, participants will be -able t
1; design and administer a simple questionnaire or directtimpling investigation using appropriate methodolocjy;
2 . critically evaluate questionnaire ; and direct samplingStudies as reported in the library literature,
evaluate and improve existing data collection andanalysis methods within their own institution.

INTRODUCTION
The course is intA.;nggd to serve as n introduction to the.collection and analysis of data as an aid to decision-making.
Terminology and applications are the main focus, the intention
being to provide you with a starting point for you to read and
evaluate the literature of quantitative techniouos as used in
libraries.
If you want to lea-n more, choose rally introductory books.
(some examples are given in the bibliography) and read from
several different sources; It is advantageous to see the same
concepts expressed in different ways.
A word of advice: if you are interested in conducting substan-
tial studies; get someone with some experience to help you rhere
should be someone around your work place who routinely uses
statistical techniques. This person will probably be willing to
advise you in designing your study providing that you actually do
the work.
AS for actually solving mathematical problems, there are
many different computer programs: such as Omnitab and SPSS
5

Whi-ch can perform the actual calculations necessary in solving statistical
protlems; So don't get. mired in the Mathematics; of the problems you
lv linwnve:, you HW,t hloW wh-eit techniques to use; dod how to interpret
We results of the computer riroge-ciri-IF:.
It is important that you read this Syllabus before you come to
the session. Exercises in the .vilabus as well as additional example
problems will be gone over in class; Class attendees will have the
opportunity to discuss problems particular to their institutions as
time permits. It will be helpful to bring a pocket calculator.
ii

OUT LINE
Data Col lection and Analysts
A . Problem Definition/Purpose of Study
B . Study Des ion
. Data Collecnon
1 Data Sources
a. D..rect Observation
b. 1-I'Storical Records
c. Published :purveys
Ir tervievvs
e Questionnaires
on-Response Problem in Questionnaires
Other Guidelines for Questionnaires
Introduction to Random Sampling
D Data Ar ialys is
Descr iptive Statistics
. Statistical Estimation and Statistical Decision
3. Variance Tests
a. F Test
b. Analysis of VariancE-
4. Chi-Square Test
iii

5, Correlation
6. Regression
E; Presentation of ResultS
II; Problems
Equations
IV. Recommended Readings
k
iv

Data Collection and Analysis
A; Problem Definition/Purpose of Study
aollection and analysis of data (statistics)
is merely a tool; as such; it can be used for good
or evil; The real power of this toot depends upon
its ability to shed light on a particular problem.
Defining the problem or determining the goal of the
study is the most crucial step in the entire process;
It is all too easy to become overly concerned with
numbers and forget the real problem.
There are certainly many ways to solve
problems, for example; accepting the advice of a
trusted person, reading the literature, or using
quantitative methods; Numerical methods are not
necessarily better than other-S. The fact that a
technique is quantitative does not mean that it is
"scientific". A good quantitative study is appropri-
ately designed and addresses the real problem to be
solved.
This course introduces some techniques
which may help you glean from data infor=
mation that will help solve a problem. One must
.(4

keep in mind that there is a lot or judgment involved in
applying quantitative methods; because the right problem
has to be addressed. A very real danger in defining a
problem is nsuboptimization". This means that you
don't look far enough for the problem and therefore
concentrate on only a portion of the problem or even on
the wrong problem. IF the problem that you have de
Fined is not the real problem but only a symptom of it;
all the sophisticated mathematical analyses in the world
will not help you solve the problem that you \A/anted to
attack. For example; you might define the prOblern as
being how to encourage people to read more books;
whereas the broader problem, and the one you should be
studying is how can more people be educated. The
latter problem would Lead to investigation of methods
of education; nonprint media, books, computer re
trieval systems and so Forth instead of merely pur
chasing more bookS or initiating reading pr ograms.
In summary, the first step in any quantitative
study is to define the problem to be investigated; thus
clarifying the objectives of the study.
Class participants should bring some examples
of problems to be discussed

B. Study Design
After the purpose of the Study has been defined,
the study is designed. The following questions shou:d
be answered before beginning a study:
Questions Related to Background and Problem Definition
1. IS the study necessary?
2. How much is known about the subject from the
literature or other studies?
3, What information is to be determined from the
study; i.e., what type of information is required
to achieve the purpose of the Study?
Questions Related to Data Collection and Analysis
4. Where and how can that information be obtained?
5. What is the target population?
6. Should there be a sample or a complete census?
7; If you sample, how important is it that the
information be accurate, and how much time and
money are available?
8. What type of data source is most appropriate?
9. What type of analysis techniques would be useful?
Once the problem is defined and steps 1 and 2
completed, the appropriate data to solve the problem
roust be isolated. Consider a fairly tightly con-
strained problem such as selection of a jc",ber forI

journal purcfiesa Wli,it inrormation i 11(.0ded to
solve the problem? l-first, determine what you
think is most important to make a jobber effective;
ror. example, you might choose:
3.
Reliability
Cost
Time ram order to receipt
If it is not possible to measure some aspect
of effectiveness, a surrogate measure can be chosen;
Foy' example, reliability is difficult or impossible
to measure, so the number of claims made might
be substituted for lack of a better measure. ThuS,
in evaluating one jobber's performance against
another's, the time, cost, and number of claims
might be used for comparison.
Now steps 4 through 7 must be completed.
Try to choose the. most costbeneficial method of
getting the information. Additional accuracy in
data often is obtained only at additional cost vvhich
may or may not be justified by the use to which you

5
put the data; For example; to address the problem;
"how is the library meeting the needs of the users?"
You might consider the following data collection
methods:
1. Ask every user exiting the library a group of
well-selected questions
2; Take a sample of users and ask them certain
questions
3. Put up a suggestion box
4. Wait for comments by users.
The first approach requires quite a bit Of time
for carefully designing the questions; asking them;
and analyzing the results as well as time from the
users. The second method takes time for designing a
sampling technique but less time than questioning all
users. With a carefully designed sample and good
questions; quite accurate results can be obtained at a
lower cost than by the first method. The third methbd
is cheap but will definitely result in biased results.
For example, the suggestions will be based on the
expectations of the users. Users will probably not
make a suggestion unless they feel the library can make

lJ
a change. They might suggest longer operating hours
but not better reference service because they have
grown to accept mediocre service. The last approach
will probably result in even more of a biased result
thar the third.
In summary, good study design means choosing
the method which will get the most useful information
in the most accurate and cheapest way for a particular
problem; defining the population from which data is to
be collected; and selecting a data analysis technique.
The study design stage involves planning the entire
study, ih other words; through the data analysis stage.
Consider the problem which has been
defined as
How much card catalog space will be required
in five years?
Co through steps 1 through 7 with this problem.
Could the problem be defined in another way?
The class will have time to discuss some problems
of special interest to them.

Data Collertion
Data may be obtained either by a complete
count (census) or a sampling of the group being investi-
gated; In practical cases a census is often unwieldy
because of the Size of the group to be investigated; a
correctly ta'<en sample can yield accurate enough re-
sults at a much tower cost and in a shorter time than
a census. In fact, sometimes a sample can be more
accurate than a census because the larger amount of
data collected by a census introduce a greater chance
of inaccuracies in the data.
A litt Of data collection methods and some
advantages and disadvantages of each folloW. No
method is particularly better than another; but the
most appropriate source of data should be chosen
for each problem.

8
1. Data Sources
Using either a census or a sample, there
are several sources of data:
a. Direct Observation
Advantages
-- All assumptions are known
-- Data are usually -consistent
-- Data are usually not Subject to
misinterpretation
Disadvantages
-- Time-consuming
-- May be difficult to obtain a random
sample
b. Historical Records
Advantages
Simple to collect data if it already
exists
-- Data are usually consistent if records
are kept consistently
16

9
-advantage
-- The data desired may not be avail
able in its complete form
c Published Surveys
Advantages
The data are already compiled;
saving time and expense
-- The responsibility for accuracy may
be shifted
Disadvantages
-- The data obtained by the primary
investigation cannot be verified
- The statistical technique used
not be ascertainable and therefo e the
Jaccuracy of the results may noI t bei
verifiable
- Subjective compiling and interpreta
tion may have influenced the result
shown
The purpose of the study may have
prejudiced the choice of material and
technique adopted

10
A representative sample may not
have been taken
d Interviews
Advantages
- A higher degree of accuracy is
attained through the acquisition of
data direct from the source
Data are often obtained that cannot
be obtained through a question-
naire alone
There is opportunity personally to
check information acquired
The "no response" proportion iS
usually minimized
DisadVantages
Only relatively small samples can
be gathered because of the cost
-- The subjective Factor is involved in
recording by interviewer
e Questionnaires
Advantages
-- large area may be easily and
18

11
quickly covered
The method of collecting data is
relatively inexpensive
Disadvantages
Frequently questions cannot be
answered without supplementary
explanations
In many cases the results are unre-
liable due to a large "non response"
- Questions may be misinterpreted or
Enswered incorrectly
For the following problems which would be the most
appropriate data source and why?
1; What amount of space will be required for housing materials
in five years?
2. How satisfied are users with the library's service?
3. What type of materials are used by practicing physicians?
4. What Should the operating budget of a nursing library be?
Because questionnaires have been so frequent'y used in library
studies; guidelines for conducting a questionnaire and a discussion of
the problem of non-response Follow:

12
Non - Response Problem in Questionnaires
The effectiveness of the questionnaire method depends not
only on the size of the original sample but also on the percentage
of returns. The return rate is very important in questionnaires
becauSe of potential bias i results due to the non-respon-
dents being different from the respondents in some important
way(s). An attempt shuAld be made to discover who does not re-
turn the questionnaire and every effort made to encourage response
in order to minimize problems with non-respondent's bias;
Some ways of encouraging response are
incentives
--follow-ups
--include stamped self-addressed envelope
--g.jarantee anonymity
--make questionnaire attractive and easy to complete
-- communicate the importance of the questionnaire
--establish reasonable deadlines
--offer the results of the survey to in'epeSted
respondents

Other Guidelines for Questionnaires
- Pe sure that all Lhe que!Aions are necessary; there is a temptation
to ask too much.
Re sure that each question is understanuable and precise; ambiguity
discourages response and accuracy.
- - Define terms carefully to avoid misinterpretation.
- - Pretest the questionnaire with a similar group; a pretest can
indicate where there are problems with ambiguous questions.
- Do not ask people to answer questions they cannot. Questions
should be easy to answer; if they require looking up from various
sources, respondents may make up answers.
- - Send the questionnaire to the person most likely to know the answer.
-- Sequence the questions in a to order; the order of questions is
important for a train of thought.
Precoded questions (those that provide for only certain; set
answers) are easier to complete than open ended ones;
- Pay attention to length and physical layout; long, unattractive
questionnaires have lower response rates than short, attractive
ones.
-- The questionnaire should be easy to analyze;
-- Questions should be objective, not "loaded".

14
How well does the following questionnaire folloW the guidelines?
To Reference Librarian, University L:brary
QUESTIONS
I. BooksNo of No. Of
Classification Titles Volumes
General Works
Philosophy
Social Science
Pure Science
Art, (F ine)
History
T ravel
Biography (medical)
F iction
Medicine
How are paperback acquired?
Used?
Name five periodicals- subscribed to:
22

15
List other, periodicals available;
Are some periodicals maintained in back files?
List Five.
HoW are they kept?
Are visual aids available?
Check Below
Motion Pictures
Film Strips
Slides
Recordings
Tapes
Discs
Transparencies
Number Available

1b
SECTION D.1. SHOULD RE READ BEFORE THIS SECTION.
2. Introduction to Random Sampling
Certain statistical laws enable us to infer
things about a population from a sample taken
from that population. If the sample is chosen
according to certain rules, the accuracy of the
information collected from the sample can be
determined. This theory makes it possible to
do inferential statistics--tests of significance;
hypothesis testing, and estimation of population
parameters from a sample. The basic concept of
sampling theory is closely related to the normaldiStribution.
A normal distribution is symmetrical
(the curve looks identical on either side of
the mean), bell-shaped, and asymptotic to
the horizontal axis; i.e., never touches the
horizontal axis.
mean
A lot of phenomena in the world follow
this normal distribution. Sampling theory is

17
based or, the fact that the means of all possible
sample--; of a population follow a normal diStri-
bi:i:ion and the mean of all possible sample
means equals the mean of the population;
This permits us to infer information about the
entire population from a small sample because
of certain known properties of the normal
distribution.
in order to properly utilize inferential
statistics, the sample from which you wan',. to
infer something about the population must be
representative of the population; One way to
accomplish this objective is by simple random
sampling (each member of the population has
an equal chance of being selected). Two
methods that are commonly used to select
random samples are, (1) systematic sampling,
(taking every "ith" item on a list) and (2) using
a random number table, frequently found in the
back of statistics books, to determine which
items in a list to include in the sample. Both
methods will be explained in class
18
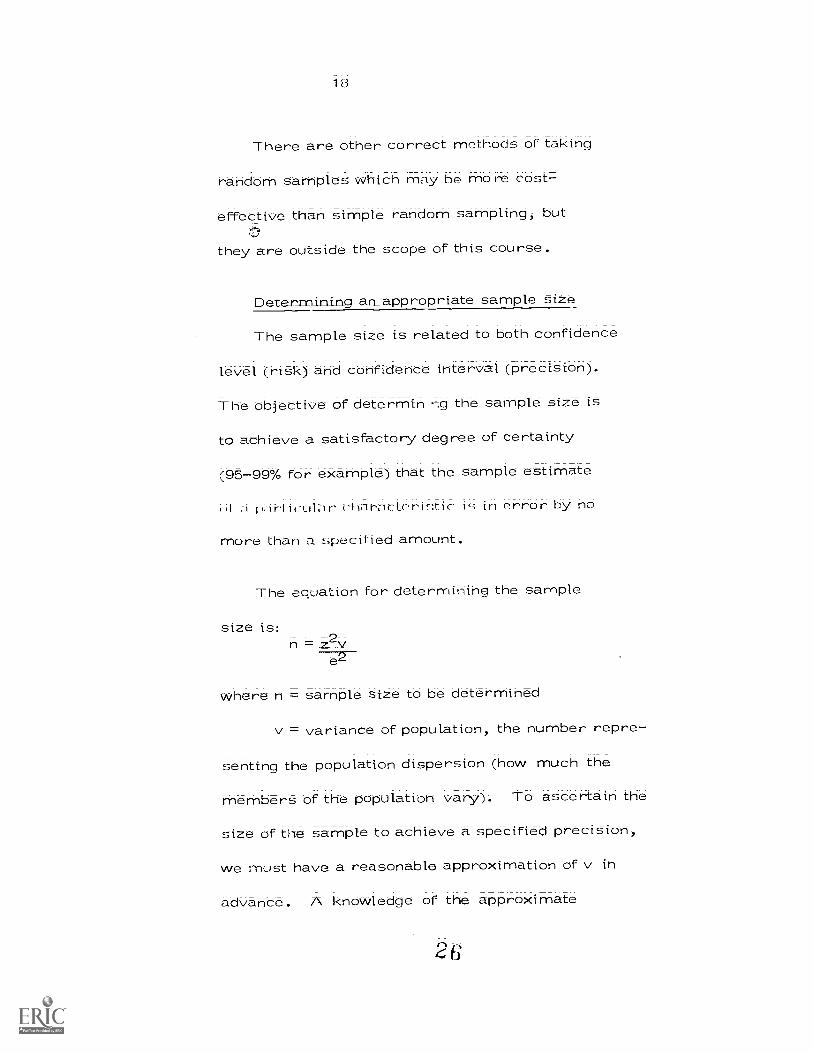
There are other correct methods of taking
random samples which may be more cost-
effective than simple random samplingi but
they are outside the scope of this course.
Deter_mining an_appropriate sample,. size
The sample size is related to both confidence
level (risk) and confidence interval (precision).
The objective of determin the sample size is
to achieve a satisfactory degree of certainty
(95-99% for example) that the sample estimate
irtractori!-Itic. in error by no
more than a specified amount.
The equation for determinina the sample
size is:2- z ve2
where n --= sample size to be determined
v -4-- variance of population the number repre-
senting the population dispersion (how much the
members of the population vary). To ascertain the
size of the sample to achieve a specified precision,
we must have a reasonable approximation of v in
advance. A knowledge of the approximate
2 6

19
'ize of v may he available From past experi-
ence. 11 not, some pret(-;tinn and preliminary
study may be necessary in order to l-ave an
approximate value for it.
If the population has little variance, the Size
of the sample can be small. For example, if
every member of the population were exactly
alike, you could just sample one member and you
would then know about all the others.
e = number representing confidence
interval (precision) required; The size of the
sample required is tremendously affected by
the size of e (error tolerated or precis-ion
required).
z = number representing confidence level
(risk) required. The value selected for z
determines the probability that the sample
result will have an error no greater than e.
z and e are chosen by the investigator
baSed on what the information will be used for
and the amount of time and money available.
Problem 3 on page 55 is related to thiS
section; other examples of sample size determination
will be worked in class.

20
Data Analys=is
Quantitative studies may be descriptive such as
describing the average salary in a sample or analytical,
F(J- " xample, predicting next year's salary increase for
a group based on samples of data. In an analytical
study; the planning of the analysis you conduct is
essential.; Do not gather a multitude of data and then
try to decide what to do with it.
The type of analysis you perform with any set OF
data depends upon the qualitV of the data and should not
be more sophisticated than the data nor Inconsistent
with the. aim of the study: statistical manipulation and
decimal points can give an aura of conviction which is
unwarranted.
1. Descriptive Statistics
Descriptive statistics includes the tabu-
lation; classification; graphical representa-
tion, and calculation of certain summary
values which describe group characteriSticS,

21
Distributions are graphs which describe
the occurrence of values. Histograms and line
graphS' are used to describe values that can be
dissected into discrete parts; curves are used to
describe continuous values (those which can takeon any value).
Histogram Line Graph
Measures of C-ent_r_al 1 endency
Curve
Measures of central tendency provide a
Single number which, in a sense, summarizesa group of data. The most common one are:
- Mean- -The total of all the values divided
by the number of values--also -called
the average. Equation = n_X =; x;
Median--If all values are arranged in ascending
or descending order, the value which is the
middl one is the median. This number
is not as sensitive to extremely
large or small numbers as is

22
the mean. Therefore the median may
sometimes be more meaningful than
the mean;
Mode--The value which occurs most
frequently. A distribution may have
more than one mode.
NAeasurec (-)f F)ipersi_on
Measures of dispersion are singlevalues which describe the scatter or differ-ences among values. Those which are mostuseful &re:Range--Simplest of all measures of
dispersion, the range can be the difference
between the largest and smallest
values or the largest and smallest
numbers themselves.
Variance---The arithmetic mean of
the squared deviations from the mean.
Equation =
V =
where x = the mean
Xi to n = each value
n = number of values
30

23
Thesedifferencesa resquaredandsummed
If the vertical distances shown above(the deviations from the mean) were justadded and not squared before adding, theresult would always be 0.
Standard Deviation--The square root
of the variance. This measure is in
the same units as the original values.
s = "V-/
Two sets of numbers may have
the same average but be quite different.
The set with the larger variance and
standard deviation would be more
scattered.
Problems 1 and 2 on page 55
are related to this section.
31

24
2. StatiStical Estimation and Statistical Decisions
The techniques of inferential statistics pro=
vide you with the ability to make sound conclusions
about a population on the basis of a sample.
Statistical inference may be used to make an esti-
mate of a population value based on a limited
sample (statistical estimates) or it may oe used
to test some hypothesis by means of information
from an experiment or sample (statistical
decisions).
Statistical Estimations_
A population parameter can be esti-
mated on the basis of a sample; For
example, if the average price of a journal
is unknown, an estimate can be obtained from a
sample; The estimate of the average price of
all journals is obtained from the sample mean.
The type of estimate that consists of a single
value is called a point estimate. An interval
estimate states in terms of probability the

25
likelihood that the population mean will occur
in a specified range.
An interval estimate of a sample mean is
represented by:
X ZS
where x = mean calculated from sample
z :=-= represents the level of confidence
required and
=-- standard deviation of the sample
means; esthmated byNn
Problem 4 on page 56 is related to this section.
Statistical Decisions
Procedures which enable us to decide
whether to accept or reject hypotheses or to
determine whether observed samples differ
significantly from "xpected results are called
tests of hypotheses, tests of significance, or
rules of deciSion. A Statistical hypothetit is
a tentative stateme-' about cne or more para-
meters (values which describe the entire population)
of a population or group of populations.

26
In the literature you will see statements
Such as:
The difference between the sample
means is significant at .01=P
Sample means differed at the 0.05
level of significance;
Null hypothesis was rejected at the
0.05 level.
This section will teach you what such
statements mean. Hypotheses are usually
made about populations and the data eathered
from a Sample or samples of the population are
used to test the hypotheses. Hypotheses
are stated in terms of differenceS between
populations; Such as the difference between
the population of male librarians and the
population of female librarianS. The
numbers obtained from tne uata from the
populations are then subjected to tests of
significance described later.
Tf the numbers from the two Samples are
different it may be only because of
34

27
sampling error; You must, therefore,
determine if there is enough difference
between them to say that the two samples
come from different populations.
The null hypothesis states that there
is no difference between the two groupS.
Rejecting the null means there is a real.
difference between the groups. However,
an hypothesis can be rejected when it
should have been acceptedi and conceivably
it can be accepted when it should have been
rejected.
These two types of errors associated
with rejection of the null are called "Type I"
and "Type II". Type I error is rejecting a
true hypothesis and Type TI is accepting a
false hypothesis. They are tabulated below.
True
FalSe
Accept RejectCorrectDecision
II Correct. .
We usually specify the level of significance
of a Type I error to be 0.05 Or 0.01. Five
percent (.05) means that there are five
chances out of one hundred that we might
35

28
make a mistake and say there is a reril
difference between the two groups when there
is not (reject the null hypothesis when it should
not be).
Not being able to reject the null
hypothesis does not mean that it can
necessarily be accepted. That could
result in a Type II error. Do not accept
the null unless the probability of a Type II
error is known. Just do not reject the null.
A t-test can be used to test an
hypothesis about the mean of a population.
For example; the 'oinding company says they
can return items in an average of 12 days.
We take a sample of ten and the mean is
16. Could the population mean really be 12?
Ho = 12
n = 10
x = 16 degrees of freedom = n-1 = 9
s = 4

29
X-4,c1 n-1s
t = i6-12 r9-4
t = 3
.05 significance -2.26 to 2.26
t at , 01 Significance -3.25 to 3.25
3 > 2.26 Reject null at .05, but
cannot reject at .01
The parameters of two samples can
be compared using a c-test.
Equation: x-x1 2
E
sx ---X2 \ri /ni +1//n,
Where1 6 2
li
S5Zi -x- --- hi_ 1 -411 22
degrees of freedom = n1 +n2 -2
Problem 10 on page 59 is related to this
section.

30
3. Variance Tests
As stated previously, standard deviations
and variances reflect the amount of scatter in
collected data.
a. E Test
The F test is used to determine whether
one sample has more scatter than
another or if the difference it really due
to sampling error. Large samples do
not require as large a F ratio for signi-
ficance as small samples because there
is less sampling error in larger samples.
F ratio = Langer varianceSmaller variance
Example
Medical students circulation of
nate r iat s : n = 41
s2 = v = 33.5
RetidentSt circulation of materials:
n =50
v = 74.1
F ratio = 74.1 = 2.2133.5

31
The F ratio is lbciked up in an
F table in most statistics books using
also the number in each of the samples;
If the F ratio is large enough the null
hypothesis can be rejected and there is
a significant difference in the scatter.
In this case the F ratio for sample sizes
41 and 50 is around 1.6 which is less than
2.21 to the null can be rejected. Problem
6 is related to this section.
b. Analysis of Variance (ANOVA)
This method actually compares means of
samples rather than variance; but the variance
measures are used to compare the means. To
compare the means of two samples to see if
they differ significantly a t test could be used;
To compare several samples ANOVA would be
used. The purpose is to show that the variance
estimate between the samples is significantly
larger than the ./ariance estimate within the
samples

32
ANOVA indicates if there is an overall
difference among the means; it doet not
indicate which groups produced the difference.
ANOVA can be used to decide whether samples
were drawn from the same population.
Example of the use of ANOVA
Three methods of supervisory counSeling
on absenteeism are being analyzed. The null
hypothesis says there it no difference in the
effectiveness of thete methods. You would
expect some variability among absence rates
of the three samples just due to -Sampling
error. Is the variability among absence
rates of the sarnplet large enough to reject
the null and say there is e difference in the
effectiveness of the methods?
Procedure:
1; Calculate within-groups variance for
each of the three samples, then com-
bine the three estimates to obtain
one estimate.

33
2. Calculate the between-groups variance
estimate using the mean of each of
the samples and compute a variance
estimate using these three means and
the size of the samples.
An F ratio is computed between the
two variance estimates using the between
groups variance at the numerator and the
within-groups variance as the denominator.
If the means of the groups really explain
the variation (not from the same population)
the numerator has much more variance than
the denominator.F = Betweeo-groups variance
Within-groups variance
A computer program can be us ,d to
calculate the F ratio for ANOVA. The
results printe( will usually be the .1- ratio
and the Level of significance at which the groups
differed. You must then decide if the level is
tufficiently high to reject the null hypothesis.
Another example of the use of ANOVA
might he when designing an automated

circulation system to determine the type of
record format one might wish to see if there
is a difference in the average length of titles
between journals, monographs and audiovisuals.
Often it is desirable to test hypotheses
concerning two variables. In the previous
example of the record length,--the question was
whether or not there were significant differences
between types of materials. To carry this a
step further assume there were two languages.
The investigator might be interested in
testing to see if there was a significant
difference between the two languages in the
average length of the titlet. ThiS is called
two-way analysis of variance.

35
4 Chi Square
The chi square test determines whether there is
a statistically significant difference between the
frequency of events among groups; (It does not
reveal how much difference there is and if the test
faits it does not really prove that the groups are the
same; This test is used when comparing frequencies
of events among several groups and can be used with
qualitative data, e g., hair color.
Characteristics of the Chi Square Method
Non-parametric method, i.e., it makes no
assumptions about the distribution of the item
sampled. The assumptions of non-parametric
methods are usually easier to satisfy than
parametric;
-- Deals with frequencies rather than scores.
-- Can be used with several groups and attributes.

36
The Chi Square Te St can be used:
To test the significance of a statistic; do
the groups differ significantly? AS in all
sampling Situations, there is a possibility
that the difference in the numbers may be
due to sampling error; A significant dif=
Terence means that the observed frequencies
differ enough from the expected frequencies
( those we would expect to occur by chance)
to justify rejection of the null hypothesis of
no difference in the groups.
To test the goodness of fit. How will the
data gathered fit a theoretiCal distribution; for
example, the normal? If the data fits a stan-
dard distribution about which certain proper-
ties are known, those properties can be used
for prediction.
44

37
Definition of Chi Square
Chi Square is a statistic V2 which supplies a
measure of the discrepancy existing between
observed and expected frequencies.
2 = o the observed and theoretical
(or expected) frequencies agree exactly; the
larger the value of the greater the dis-
crepancy_ At some point the null hypothesis
of no significant difference can be rejected.
There are Chi Square tables on the back of most
most statistics books. You need to know the
number of categories studied and the level of
risk to use the table. If Chi Square is larger
in your study than in the table the null hypothesis of
no difference can be reje.cted.

38
Equation for Chi Square:
1.1
=f
-2i)
Example 1
In 200 people using the library (randomly
selected) 115 doctors and 85 nurses are found.
The diffe..rence may be d._ie to sampling error.
Test the hypothesis that there really are an
equal number of doctors and nurses using the
library..._--------Observed frequencies: fo1 = 115; fog = 85
Expected frequencies: fei = 100; fe2 = 100
= (foi-fe j )2 + (fob -fe2)2fei fe2
115-100)2 + (85-100)2 = 4.5100 100
Number of categories = 2, d.f = 2-1 = 1/1, for 1 degree of i edom = 3.84, since
4.5 > 3.84, reject null hypothesis at 0.05
level of significance.
(P) for 1 degree of freedom = 6.63, since
4.5 < 6 . 63 , cannot reject null hypothesis
at 0.01 level.

39
There probably is a significant difference
and there probably are not an equal number
of doctors and nurses using the library; how-
ever, the difference could be due to sampling
error.
_Example_2
Is there a difference in the frequency of
reading foreign language journals between
clinicians and researchers? A random sample
of 200 scientists was taken using the alpha-
betical campus directory and systamatic
Sampling. The results were:
80 researchers, 40 of which read foreign
language journals
120 clinicianS, 50 of which read foreign
language journals

Clinician
Researcher
Total
I -oreign
40
No I 'oreign btal
50 70 120
40 40 80
90 110 200
fo table
(observedfrequencies)
If there were no difference between the groups as
to proportion who read foreign language journals:
Researcher
Total.
Clinician
Researcher
Foreign N Foreign TotaL
54 66 120
36 44- 80
90 110 200
Differences between the two tableS:
Foreign No Foreign -.
+4 -4
-4 +4
table
(expectedfrequencytable)
f- - fe table
(=1:4)2 + (-4)2 (-4)2 F (+4)254 36 66 44
What does the answer mean?
46
1.34

41
Since /2(.95; = 3.84 for 1 d.f. and
3.84> 1.34 it cannot be said that there is a
significant difference in the proportion of
clinicians and researchers who read foreign
language journals. The difference was likely
due to sampling error.
Problems 5 and 7 on page 56 are related to
this section.
Can you think of some other library problems
for- which Chi Square would be an appropriate
data analysis technique?

A2
5. Correlation
Correlation indicates how related two
variables are. One variable can be pre-
dicted from another if they are highly re-
lated. Correlation does not indicate a
causal relationship. A third undiscovered
variable may cause the effe..ct or the re-
lationship may be purely accidental
(spurious correlation).
The statistic which is the measure of
the correlation (closeness of the relation-
ship between two variables) is the coefficient
of correlation (r). The coefficient of cor-
relation is useful in judging the relative
strengths of association and indicating signi-
ficant relationships between two variableS.
coefficient of 1 is perfect, 0 is none.

43
Scatter Diagrarn
r=.86
r=.54
r= -.9
r=0
Equation for coefficient of correlation:
r= xY
\l(g)(2) Es/2)

Li 4
ri:kample:
11 14
Y 1 2 4 4 5 7 8 9
X Y 5c=xR s,---=--`(";7 x2 xy y2
1 1 6 -4 36 24 16
8 16 12 9
.=-
6 4 -= 1 1 1
8
9 7 2 2 4 4 4
11 8 4 3 16 12
14 9 7 4 49 28 16
X=565<=7
ky=40
`7=-5
x2=132
fL xy=84
2 St2=56
.977)( \F(132)(56)
52
45
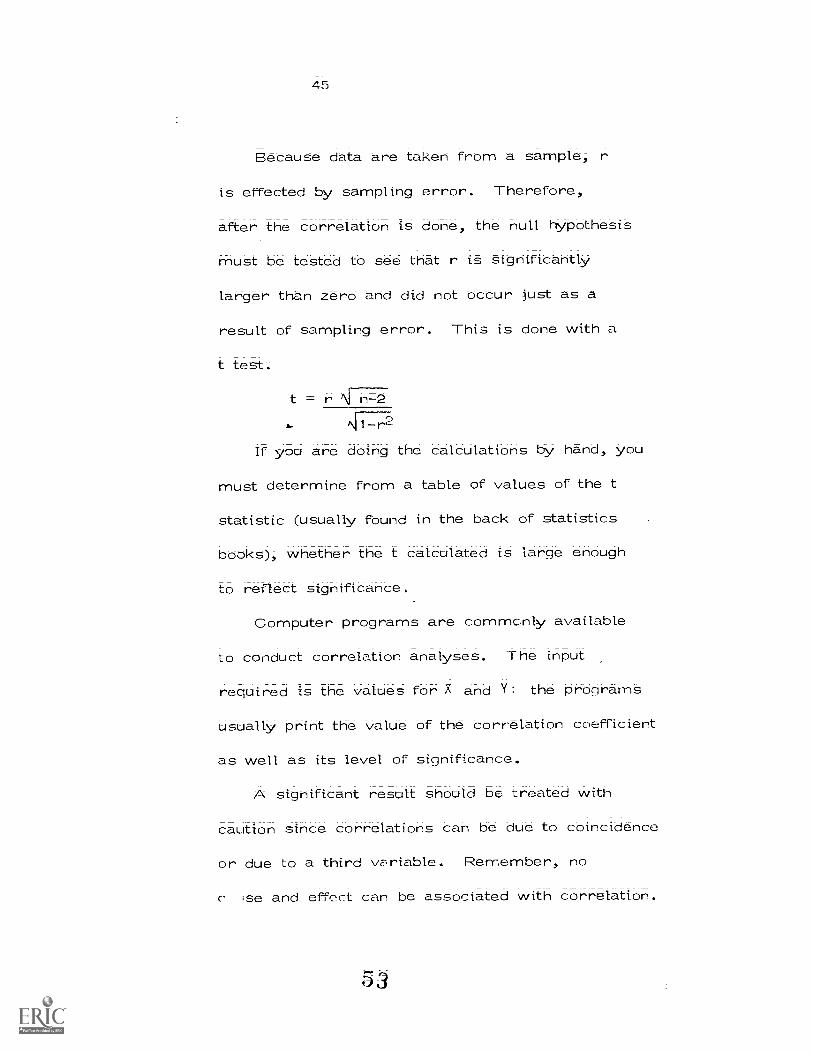
Because data are taken from a sample, r
is effected by sampling error. Therefore,
after the correlation is done, the null hypothesis
must be tested to see that r is Significantly
rger than zero and did not occur just as a
result of sampling error. This is done with a
t test.
t = r 1\i n-2/11-r2
If you are doing the calculations by hand, you
must determine from a table of ValueS of the t
statistic (usually found in the back of statistics
books); whether the t calculated is large enough
to reflect signific:ance.
Computer programs are commonly available
to conduct correlation analyses; The input
required is the values for X and Y: the programs
usually print the value of the correlation coefficient
as well as its level of significance.
A significant result should be treated with
caution since correlations can be due to coincidence
or due to a third variable. Remember, no
;Se and effect can be associated with correlation.

46
Examples of items which might be related
and thuS which might be Subject to correlation
analysis:1. Books checked out and grade point
2. Operating expeditures and circulation
Book budget and circulation
4. Use of materials in house and
ci rculation
What are some other examples?

If a relationship is found to exist between
variables, you might want to express this
relationship in mathematical form with an
equation connecting the variables.
Linear NonlinearThe simplest type of approximating curve is a
straight e, whote equation can be written:y = a + bx
y interceptslope, amount ofchange in y forunit change in x
x
Using the least squares method, solving
for a and b:
a = )(Z ) X ) < ---XY)of X2 (X)2-
nZXY (2><)(Y)n X2 ;><)2

Ll 8
The method of least squares finds the
c oeffirients a and h which make the sum
of tl e squares of the distances from the line
the least possible; This technique can also
be used with more than two variables and is
called multiple regression. Again, comput?r
programs are available to calculate solutions.
After the regression line has been found,
you need to know how well the line fits the
data; If all the points of the scatter' lie on the
line, it is perfect linear correlation. The quantity
r is called the coefficient of correlation;
,Ir = explained variationtotal variation
r varies fnom -1 to +1 and is a measure of the
linear correlation between two variables.
The standard error of the estimate indicates
the accuracy of the estimate. It is a measure
of the scatter about the regression line;

/P)
has uSeci rcclrc icn to predict total
r.,,xpenses library from numtic..r of
personnel and other variables; Can you think of
other example.s?
Regression is a powerful tool for prediction,
but it does not mean that a value outside the
previously examined sphere will fit the line.

Presentation of IRc-sulls
The final Stagt, k)i- a study is the fair
interpretation and clear presentation of the re-
sults. The interpretation should include some
consideration of the level of risk and the pre-
vision bf the results. It is also essential that
the reader be made aware of any diStOrtiOnS
in the data due to sampling bias, as well as the limi-
tations of the analysis procedures used. For
?.-Etrripl-e, it ShOUld be made el-ear that corre-
lation does not indicate cause and effect.
Ti--)e well-analyzed and presented study
acknowledges its weaknesses; indicates whai-
results are' doubted, and suggests what remains
to be done; In writing the report; emphasis
should not be placed only on results which con-
firm the investigator's opinions: all significant findings,
supporting or not, should be reported.

1 he senta tior Of r Octil<i hi0h-
the i i not obfuscate them
with data Vast amounts 01 statistical data in
raw form only confuse the issue The data
should be presented in an organid way to help
communicate the facts to the reader. The
organization can take two basic forms: sta-
tistical tables and figures. A statistical
table is a presentation of numbers in a logical
arrangement, with some brief explanation to
si !ow what they are A figure: is a chart;
graph, map, or some other illustration design-
d to present statistical data in picture Form .
H igu re. s The making and understanding
of figures requires neither artistic nor mathematical
Ski common sense ang the :ability t b u.Se. a rule r
and cDmpass are heeded

15k
14k
13k
12k
ilk10k_
9k8k
7k
5')
Line gr,r)phs are particularly good for
indicating trends over periods.
11 1 1 I I I 1 1
D J F M A M J A SONCirculations
However; truncation or changing the proportion
between the ordinate and the abscissa
can distort the true picture if thiS is
not made clear to the reader.

ordinate
20,000,000
19,500,000
f5;
months
30
20
10
abscissamonths
Column or Bar charts are usefil when
a number of different groups are compared.
1200
900
600
300
EXIT COUNT
The reader should be presented with
comparable figures. Often a percentage
or ratio figure may be more informa-
tive in a column chart than only the
raw figures.
Ave ragely
Count

Problem
1. Calcu!ate the mean, median and mode for the
two sets of data below:
Croup 12 5 9
2 6 6
Group 22 3
9
7 10
2 Calculate the Standard deviation and variance
for the numbers in problem 1. Which set of
data is the more scattered?
3. You wish to find the average time to answer
a reference question. A preliminary sample
dicates that the variance in questions is 9
minutes. You wish to have no more than one
minute on eithc side of the mean ,th a
level of risk of only five per cent (95% Con-
fidence Level)-, z = 1.96. Using the equation
for sample size, calculate what size a random
sample should be taken,

1. The Standard deviation of a group of data on
the width of books is 2 inches. The Mean
01 the sample wcs 5 incheS. At a 95% con-
fidence level, what is the confidence interval?There were 25 books in the sample;
5; A personnel director is interested in trying to
determine if the season of the year has any
effect on the number of employees who resign.
His records give the following information:
Season Number of resignations
Winter 10
Spring 22
Summer 19
60
Test at a si -)ificance level of 0.05 to deter-
mine if there is a significant deviation between
the obServed distribution and a uniform distri-
button (equal for all seasons). H-- = null0
hypothesis, no difference, that is, the proportion
of resignations is independent of the season of
the year. A significance level of 0.05 requires

57
2_-
Voluie of 7.1,3i (eolunm in the ehi :,quare
table heocied n.n:, with three de(frees of Ireeciorn)
reject Ho if TY:2- > 7.815.
e3; Make a significance test to determine if it can
be assumed that the variance in width of books
and journals is the Same as the Varian-
width of joui-nals.
Sample 1: Books
n1 = 16
sa = 5,
Sample 2: Journals
= 21
= 2.5"
F ratio for d.f.-- = 15 and d -9 = 20
at 0.05 2.3:i.
The library speculated that if they offered a
free MEDLINE search they would incr pse tl
percentage of questionnaires returned. o
theory they sent questionnaires to a ande:n
ple of 30 persons on the list with the offer of a
MEDLINE search. They sent another
30 with no MEDLINE offer. The results.
shown below:

MEDI_ INE
Offered
Nbt Offered
5H
Returned Not retur_nLci Total.;
14 16 30
24 60
The problem is to test at 0.05 level to see if
there is a significant difference in the propor-
tion of returns when the MEDLINE is offered.
An 0.05 level required a Chi Square value of
3.841 (Column 0.05 with 1 degree of freedom
8. YOU took some observatiOn8 oh the number Of
persons exiting the library and books used in the
library each hour for eight hours. X = people,
exiting the library, Y = becks used in the library.
3 4 6 8 g 11 145_ 7 a 9
Using the equation for the correlation coefficient,
see if these variables are highly correlated, is
the t significantly greater than 0?
9. Find the least squares lines for the data in
problem 8; a = ; b = . What is the equation
for the line?

X 2 xy
1 1 1 1 1
0
4 1 1r 1 i 15
4 ;?T; 24 10
5 54 40 25
9 7 81 08 49
11 E_-3 121 8 04
14 9 190 126 81
X =56 fY -----40 fX2-524 f:Xy,.-364 2,s-,2,
10. Using the data in problem 6 and the fact tT . le
sample mean of books =--- 6 and the sample mean ofjournals = 0 use a t-test to determine who .er thereis a significant difference between the means.
11 . The amounts o T rY1 iney spent on foreign mono-
9ra phs and don'. esti c monographs , For-eiyr
and domestic serials are given below Using a compass
construct a pin chart of the following data.
Foreign monographs 25;000 10%Domestic monographs 50,000 20%Foreign seriFils_ 75,noa 30%Domestic serials 100,000 40%
ial-At. 250; 000_ 100%

19, ( you match the fr.illbWing probiernS to an aripi-opriate daua
Analysi; techniqUe?
Problemo
i. -1 he average number of
hooks checked out by each
;tudent last year was 3. Is
it the SaMe thiS year?
b. What's the average width
of a journal volume?
c. Is the price of itiatehials
in chemistry and physics
about the same?
Is there a relationship
bc.,,tween the number of
in--house uses and -cir-
culations?
. I want to estimate in-house
uses From circulations;
F. Do nurses use the library
more Frequently than physicians?
Techniques
Chi Square
2 Analysis of variance
3. t-test for the mean of
a population
4 Regression
5. Correlation
6. t-test for the means
of two samples
Fstimati:-)r, of a
parameter

there a difference in
the length of tenon., of
emit gees in Technical
Public fle.rvieeS
and Administration Divisions?
68

2n = v
Vctriar-),-c.
v x.t
St:Indard
s_
Me -an
x
62
tTo.ncicArci EH l. 1.hc. :n
s
FT-
Corri:!lation C_,o6fTiciert
r --=
Reoression Coefficients
a = (Y)(;EX )(.,t
ritX (1><)
b = nixy - () 4.;()(f_x
G !J

;
(Driv,Ai )
L umol; W.J, and Marcus; M. ! onomics of AcademicLibraries. (Washington, H.':.: American Council onHduccition; 1973).
F-3-erdit-L.:, D.P., and AndL-...;-=-,on, QuestibrinaireS: r)uSignand Use. (Motucaen; N Son 'ec row, 1974);
'(..)okStein; A. "How to Sample F-3adly. Lit.,r,:ry Quarter44, pp. 124-32, M74;
1,2rtyj R.M. and i .J. 1\.lanagern.?.ntcif I-ibriry nportations (New `fork: bcarecrow,
F . A f= irst fZ2ader in Statistics. (Monterey,Prooks /Cole; 1974).
I lamburg, M. ; Clelland; F,J.0 Bommet-, M.R.W. , Ramist,L.E., and Whitfield, P.M. Library Plannino arilDocisir- ilaking Systems. (Carnbridge,Mass.:MIT Press;1! I
tuff, H. How to Lie with St,itistics. (New York: Norton,
Lancaster, F .W. 7he Measurement and 1-_,aluation of LibraryServices. (Washington, D.C.:Infbrmation ResourcesPress, 1977).
Line, M.! . Library Surveys. (1--lampdan, Conn.:AnchorBooks, 1967).
Simpson, I.S. Basic Statistics for Libraries. (London:C1 ive Bengley, 1975 .
Slonim; M.J. Sampt nri in a f\Jut,..ThC.11. (M Ai York: SimonSchuster, 1960).
* I-lighly Recnri- -nondod

C-()r i of -.Hournalf-->
in ry Sc
1. ASLIR Proceedinijs
Rullc,tin of the 1\",edical Library Association
3. ,c-je and Rosea. ch Libraries
1. Information _Storage and Retrieval
International Library view
Journal of the American Society ForInformation Science
7. Journal of Documentation
S. Journal or- Librarianship
9. .lournal of Library Automation
10. Law Library Journal
I 1 Library Quarterly
Library Resources and Technical Services
13. Libri