document resume - ericdocument resume. ed 231 777 sp 022 476. author. butcher, janice; hall, m. ann....
TRANSCRIPT
DOCUMENT RESUME
ED 231 777 SP 022 476
AUTHOR Butcher, Janice; Hall, M. AnnTITLE Adolescent Girls' Participation in'Physical
Activity.SPONS AGENCY Alberta Dept. of Education, Edmonton.PUB DATE 28 Feb 83NOTE 24p.; Funded by the Planning Services Branch.PUB TYPE Reports - Research/Technical (143)
EDRS PRICEDESCRIPTORS
MF01/PC01 Plus Postage.Adolescent Development; *Adolescents; ElementarySecondary Education; Family Influence; *Females;Intramural Athletics; Longitudinal Studies;*Participant Satisfaction; Peer Influence;Personality Traits; Physical Activities; *PhysicalActivity Level; Physical Education; RecreationalActivities; *Student Attitudes; *StudentParticipation; Womens Athletics
ABSTRACTA longitudinal study of girls from the sixth through
tenth grades sought to determine if the extent and type of.participation in physical activities changed with age. A sample of207 girls was selected with 140 completing the survey over 5 years.Participation was'ineasured by activities in interschaol teams,intramural activities, community-organized activities, average amountof time per day spent in activities, total number of activities, andfrequency of participation in four favorite activities. Included inthe study were three major factors related to participation: personalattributes; influence of peers and parents; and opportunity. Findingsincluded: (1) Physical activity declined as the girls matured; (2)Participation in interschool teams an2 intramural activities droppedoff abruptly in grade 10; (3) Satisfaction with and attitude towardphysical education-was lowest in junior high school; (4) Physicalactivity for release of tension increased with advancing age whilecompetition declined; (5) Positive influence toward sports bysignificant others declined along with the image of the temaleathlete; and (6) Socialization and socioeconomic status separatedparticipants and non-participants in community organized activities.Ten tables, demonstrating the findings, are included in the text.(JD)
***********************************************************************Reproductions supplied by EDRS are the best that can be made
from the original document.***********************************************************************

Adolescent Girls' Participation in Physical Activity
Janice Butcher, Ph.DFaculty of Physical Education
and Recreation StudiesUniversitypf Manitoba
Winnipeg,AkanitobaR3T 2N2
83-3
by
M. Ann Hall, Ph.DFaculty of Physical Education
and RecreationUniversity of Alberta
Edmonton, AlbertaT6G 2H9
Funded by the
Planning Services Branch
Alberta Education
Edmonton, Alberta
February 28, 1983
US. DEPARTMENT OF EDUCATIONNATIONAL INSTITUTE OF EDUCATION
EDUCATIONAL RESOURCES INFORMATIONCENTER (ERIC)
Th document has been reproduced asre wed from the pers)n or organization
iginating ItMinor changes have been made to improve
reproduction quardy.
Ponts of view or opinions stated in this docu-
ment do not necessardy represent oft NIE
position or policy.
"PERMISSION TO REPRODUCE THISMATERIAL HAS BEEN GRANTED BY
P, Edotbj,,
TO THE EDUCATIONAL RESOURCESINFORMATION CENTER (ERIC)."

Table of Contents
.:. Page
INTRODUCTION 1
A. Overview of the Study 1
B. Purpose of the Study , 1
DESIGN OF THE STUDY 1
A. Variables Included in the Study 1
B. The Sample 2
C. Collection of Data 3
RESULTS 3
A. Analysis of Physical Activity Participation 3B. Changes in Related Variables by Grade 10C. Relationship between Participation and Related
Variables 13
SUMMARY AND CONCLUSIONS 18
RECOMENDATIONS 19
,
APPENDIX
A. Variables ind Instruments Included in Study 21
List of Tables
Table Page
1. Subjects Completing the Survey - Year 1'-5 32. Comparison of Participation Variables by Grade 53. Number of Girls Participating in Increasing Activities 7
4. Number of Girls Showing Change in Participation 85. Number of Girls Showing Change_ in Participation -
Grades 6 to/10 , 9
6. Girls Who Never Participated or Consistently Par-ticipated Over 5 years 10
7. Comparison Of-Related Variables by Grade - 118. Related Variables Showing Significant Differences
between Above and Below Average Participants 149. Comparison of Non-Participants and Participantg at
Least One Year: Interschool Teams 1610. Comparison of Non-Participants and Participants for
all Five Years: Community Organized Activitiee 17
_
-1-
INTRODUCTION
A. Overview of the Study
A five year longitudinal survey was undertaken in the Edmon-
ton Catholic School District from May, 1978 to May, 1982 to assess
the physical activity participation of adolescent girls. A ques-
tionnaire was designed to obtain data on adolescent girls' parti-
cipation in physical activity and on other variables related to
that participation. The questionnaire was first administered to
Grade 6 girls in May, 1978 and was readministered to the same girls
for the next four years.
B. Purposes of the Study
The purposes of the study were twofold:
1. To determihe if the extent and type of adolescent girls' par-
ticipation in prlysical activity\c.hanged with age.
2. To determine what variables were most related to physical ac-
tivity partiCip'ation as the girls matured.
DESIGN OF THE STUDY
A. Variables Included in the Study
a. Physical Activity Participation Variables
ways:
Physical activity participation was measured in six
1. number of interschool teams
2. number of intramural activities
3. number of community-organized activities
4. average hours per day spent in physical activity
5. total number of ,activities participa±ed in
6. frequency of participation in four favouriteactivities.
.4

-2-
b. Variables Related to Participation in Physical Activity
Several variables felt to be related to participation in
physical activity were included in the study. A theoreti-
cal model explaining involvement in phisical activity
' suggests that three major factors are impertant:
1. Personal attributes
2. Socializing agents (significant others)
3. Socialization situations (opportunity set)
Variables from each of these categories were selected
and instruments chosen or constructed to measure each.
The related variables included in the study and the instru-C
ments used to measure them are outlined in Appendix A.
B. The Sample
The sample was taken from the population of all Grade 6 girls
in the Edmonton Catholic School District in May, 1978. All elemen-
tary and elementary-junior high schools in the district were ran-
domly sampled. An original sample of at least 200 girls was desired.
Based on average Grade 6 enrollments in the schools, it was esti-
mated,that 13 schools would be needed to provide 200 girls. Thus,
13 schools were chosen.using a random number table and all Grade 6
girls enrolled in those schools were selected into the sample. As
it turned out, the 13 schools had 213 girls in Grade 6, of which
207 girls completed the questionnaire in year 1 of the study. Table
1 outlines the number of girls who were resurveyed in the subsequent
four years. Attrition was due to moving from Edmonton, withdrawing
from sChool, or being ill/truant on the testing days. Nevertheless,
the dropoff rate was minimal for the longitudinal study as 140 girls
(67.6% of the original sample) completed the survey in each of the
five years. The saraple_w.as_mo_s_t stable_during the junior high school
years with the major dropoffs occurring between elementary and
junior high, and between junior and senior high school.
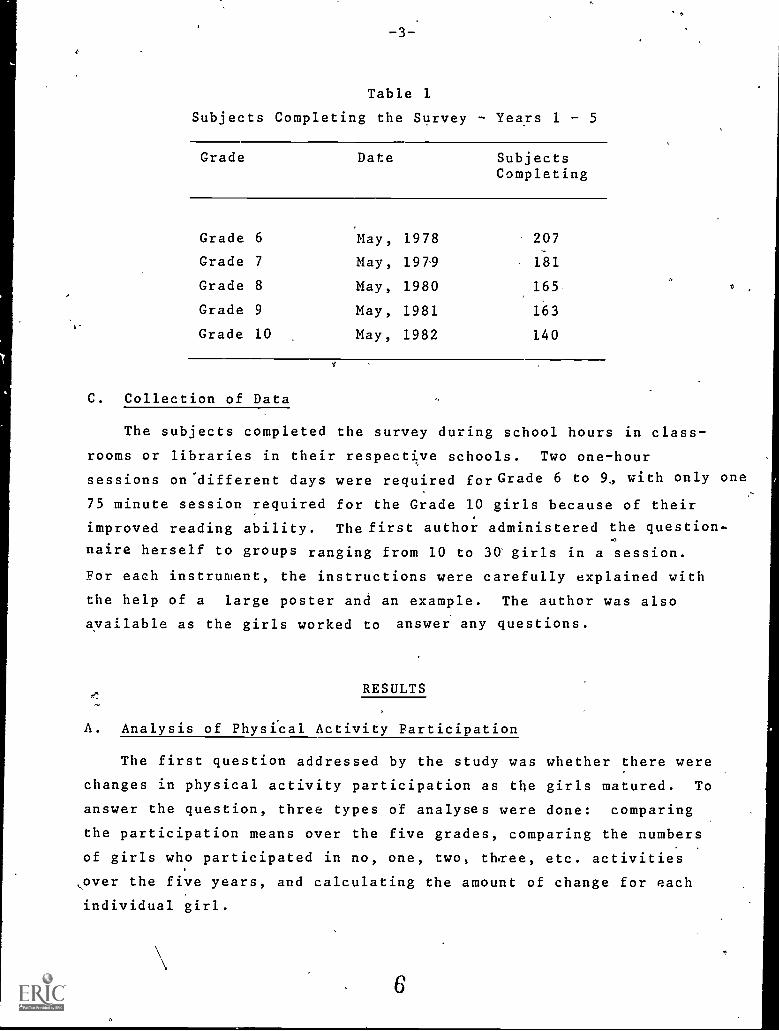
Table 1
Subjects Completing the Survey Years 1 - 5
Grade Date SubjectsCompleting
Grade 6 'May, 1978 207
Grade 7 May, 197-9 , 181
Grade 8 May, 1980 165-
Grade 9 May, 1981 163
Grade 10 May, 1982 140
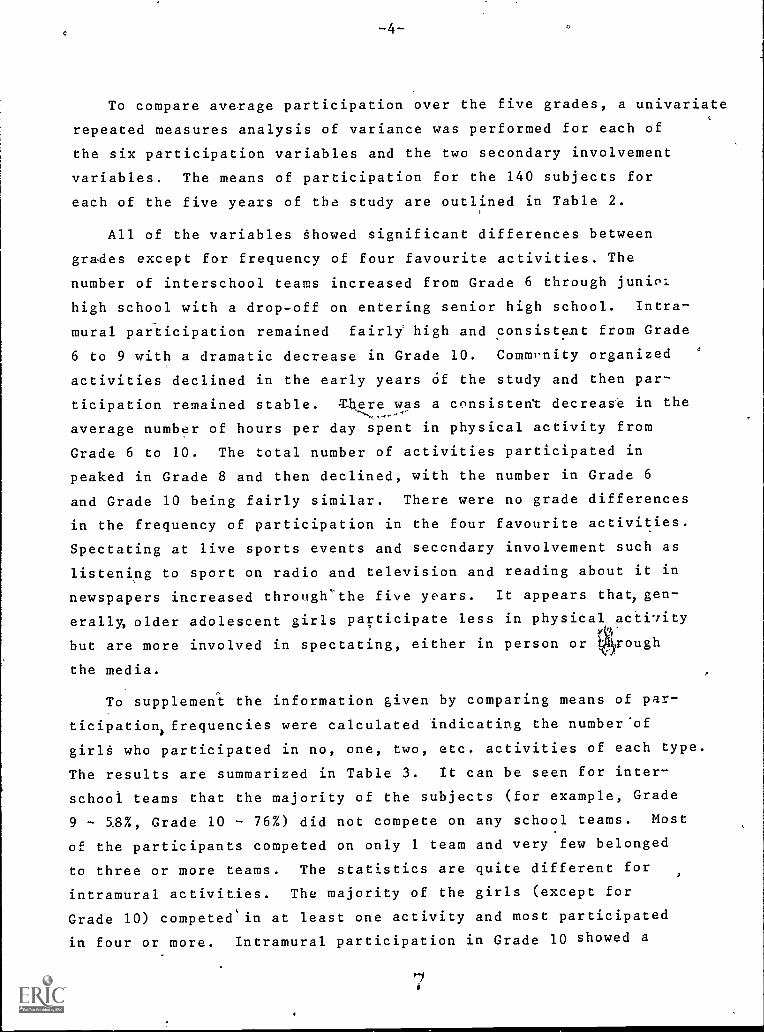
C. Collection of Data
The subjects completed the survey during school hours in class-
rooms or libraries in their respective schools. Two one-hour
sessions on'different days were required for Grade 6 to 9, with only one
75 minute session required for the Grade 10 girls because of their
improved reading ability. Thefirst author administered the question-
naire herself to groups ranging from 10 to 30 girls in a session.
For each instrument, the instructions were carefully explained with
the help of a large poster and an example. The author was also
ayailable as the girls worked to answer any questions.
RESULTS
A. Analysis of Physical Activity Participation
The first question addressed by the study was whether there were
changes in physical activity participation as the girls matured. To
answer the question, three types of analyses were done: comparing
the participation means over the five grades, comparing the numbers
of girls who participated in no, one, two, thiree, etc. activities
\over the five years, and calculating the amount of change for each
individual girl.
6
0 -4-
To compare average participation over the five grades, a univariate
repeated measures analysis of variance was performed for each of
the six participation variables and the two secondary involvement
variables. The means of participation for the 140 subjects for
each of the five years of the study are outlined in Table 2.
All of the variables §howed significant differences between
grades except for frequency of four favourite activities. The
number of interschool teams increased from Grade 6 through juniol
high school with a drop-off on entering senior high school. Intra-
mural par-ticipation remained fairly high and consistent from Grade
6 to 9 with a dramatic decrease in Grade 10. Commrnity organized
activities declined in the early years Of the study and then par-
ticipation remained stable. There was a consistent decrease in the
average number of hours per day spent in physical activity from
Grade 6 to 10. The total number of activities participated in
peaked in Grade 8 and then declined, with the number in Grade 6
and Grade 10 being fairly similar. There were no grade differences
in the frequency of participation in the four favourite activities.
Spectating at live sports events and secondary involvement such as
listening to sport on radio and television and reading about it in
newspapers increased through-the five years. It appears thatIgen-
erally, older adolescent girls participate less in physical acti7ity
but are more involved in spectating, either in person or ,,rough
the media.
To supplement the information given by comparing means of par-
ticipation) frequencies were calculated indicating the number'of
girlg who participated in no, one, two, etc. activities of each type.
The results are summarized in Table 3. It can be seen for inter-
school teams that the majority of the subjects (for example, Grade
9 5,8%, Grade 10 - 76%) did not compete on any school teams. Most
of the participants competed on only 1 team and very few belonged
to three or more teams. The statistics are quite different for
intramural activities. The majority of the girls (except for
Grade 10) competeein at least one activity and most participated
showed ain four or more. Intramural participation in Grade 10

- 5-
Table 2
Comparison of Participation Variables by Grade
ParticipationVariable Grade
Number ofActivities
StandardDeviation Statistic Significance
InterschoolaTeams 6 1.29 .77 5.12 .001
N = 137 7
8
1.341.49
.63
.769 1.64 .91
10 1.31 -.69
Total 1.42 .77
IntramuralaActivities 6 3.60 1.81 37.82 .000
N = 1377
8
3.763%44
1.361.58
9 3.49 1.5010 1.86 1.28
Total 3.24 1.66
CommunityaOrganizedActivities. 6 2.02 1.08 4.29 .003
N . 132 7
8-,1.891.67
1.03.86
9 1.68 .9410 1.63 .94
Total 1.78 .98
Average HoursPer Day 6 4.45 2.27 16.36 .000N . 99 7 3.65 1.66
8 3.27 1.569 2.58 1.44
10 2.43, 1.58
Total 3.27 1.87
TotalActivities 6 11.40 5.08 4.77 .001
N . 133 7
8
12.6813.42
4.605.39
9 12.60 4.6910 11.85 4.63
Total 12.39 4.93-
cstFrequency ofFavoriteActivities b
6 3.17 .74 1.50 .21
N . 131 7
8
3.152.99 a.
.73
.789 3.03 .77
10 2.98 .71
Total 3.06 .75
8

400- 6-
Table 2 cont.
Participation Number ofVariable Grade Activities
StandardDeviation Statistic Significance
SpectatingSports Eventsb 6 2.68 1.51 6.02 .000
7 285 1.43N = 132
8 2.61 1.30 4
9 3.14 1.2210 3.06 1.22
Total
SecondaryInvolvement(T.V., Radio,Newspaper)b 6 2.87 1.09 5.80 .000
N . 133 7 3.15 1.11.
8 3.21 1.109 3.47 1.17
10 3.25 1.24
Total
aCoded Values: 1. no activities2. one activity3. two activities4. .three activities5. four or more activities
b Coded Values: 1. less than once a month2. at le st once or twice a month3. once a week or every weekend4. at least two or three times a week5. every day wiithout fail in season
i -

- 7 -
Table 3
Number of Girls Participating in Increasing Activities
0
Grade6
Grade7
Grade8
Grade9
Grade10
Interschool Teams
no teams 115 101 91 81 107l team 17 32 34 38 21
2 tbams 3 6 11 12 6
3 or more 5 1 - 4 9 3
Tctal N 140 140 140 140 137
Intramural Activities
no activities 42 9 29 17 80.
1 activity 4 26 10 27 27
2-3 activities 12 43 41 36 18
4 or more 82 62140
60140
60mo
12137Total N 140
-
Organized Activities
no activities 57 64 72 79 79
1 activity 39 42 46 36 41
2 activities 27 22 14 16 8
3 or more 15 12 6 8 8
Total N '138 140 138. 139 136.
Hours Per Day
1 - 1.9 15 20 17 40 49
2 - 3.9 33 45 73 55 59
4 - 5.9 38 52 36 26 14
6 or more 40 14 8 5 6
Total N 126 131 134 126 128
'Total Activities
1 - 5 13 6 6 8 8
6 - 10 53 42 40 41 51
11- 15 50 58 45 56 48
16- 20 15 27 31 28 22
21 and over 8 7 17 7 6
Total N 139 140 139 140 135
Frequency of Favourite Activitiesvalue
Once/Year (.25 - 1) 1 1 0 4 1
Once/Month(1.25- 2) 15 8 19 12 12
Once/Week (2.25- 3) 44 59 60 59 65
2-3 Times/week (3.23-4) 66 62 49 56 51
Everyday (4.25-5) 12 10 11 7 6
Total N 138 140 139 138 135
a

-8-
reverse trend with the major4.ty not participating. It would be
valuable to know if this dramatic change in participation is due
more to lack of interest or opportunity. Approximately half of
the subjects participated in at least one community organized
activity with slightly more in,Grade 6.
For average hii-urs per day spent in activity, Grade 6 girls
tended to give responses of four hours or more while Grade 10 girls
7 answered with less than four hours per day. For both total activi-,--
ties participated in and frequency of four favourite activities,
the number of responses in each category was cluite similar across
the five grade levels.
The amount of participation change over the five years was calculated
for each individual girl to determine how many girls had increasee
or decreased in participation or had remained the same. The sta-
tistics are displayed in Tables 4 and 5. For interschool teams,
the comparison was made between Grades 7 and 10 because some elemen-
tary schools (Grade 6) did not have interschool teams and the results
Table 4
Number Jf Girls Showing Change in Participation
Interschnol Intramural Community
Gr. 7-10 Gr. 7-9 Gr. 6-10 Gr. 7-9 Gr. 6-10
Remained same
no participation 80 63 23 3 40
1 or 2 teams 6 14 2 18 27
3 or more teams 0 0 . 11 58 3
Decreased
3 teams to i 2 teams 1 0 76 30 12
1-2 teams to none 27 18 5 10 31
Increased
none to it 1 team 18 38 19 6 14
one to a 2 teams 5 7 1 15 8
137 140 137 140 135

-9-
would have been misleading. A comparison within junior high (Grades
7-9) was also made for interschool teams and intramural ac=tiVities
because the consistent nature of the programs within that setting
would yield very meaningful participation changes..
The majority of the subjects remained tsame in interschoolWf
participation (most not participating) from Grade 7 to 9/10, with
about the same number decreasing and increasing in number of teams.
For intramural teams, the results were quite different between the
Grade 7-9 2omparison and the Grade 6-10 comparison. For Grade 7-9,
over half the subjects remained consistent in their participation,
while a few more girls decreased in participation than increased.
However, comparing Grades 6 to 10, the majority decreased in par-
ticipation, as would be expected frOm the previously reported mean
scores. The community organized activities showed fairly con-
sistent participation (40 not participating), with slightly more
girls decreasing the number of activities compared to increasing.
The changes in participation for the remaining three variables
(presented in Table 5) were more difficu/t to categorize. The com-
parison between* Grade 6 and 10 participation for each variable was
made relative to the average value for all five years combined. The
results are also more difficult to interpret. Average hours per day
tended to decrease from Grade 6 to 10, while the total number of
Table 5
Number of Girls Showing Change in Participat,ion Grades 6 to 10
Hours/Day Total FavouriteActivities Frequency
Remained same
above average 12 19 33
below average 34 73 36
Decreased 63 15 41
Increased 7 27 24
116 134 134
1 -1
-107
activities participated in tended to remain unchanged. The fre-
quency of folr favourite activities seemed to either remain stable
or to decrease.
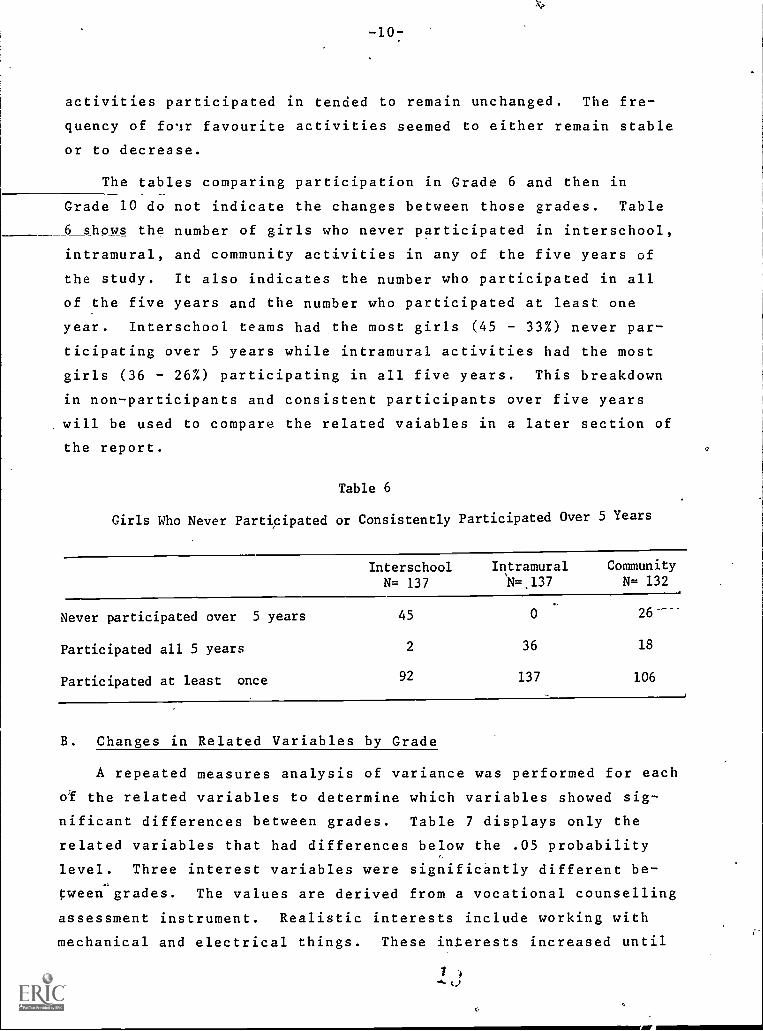
The tables comparing participation in Grade 6 and then in
Grade 10 do not indicate the changes between those grades. Table
6 shows the number of girls who never participated in interschool,
intramural, and community activities in any of the five years of
the study. It also indicates the number who participated in all
of the five years and the number who participated at least one
year. Interschool teams had the most girls (45 33%) never par-
ticipating over 5 years while intramural activities had the most
girls (36 - 26%) participating in all five years. This breakdown
in non-participants and consistent participants over five years
will be used to compare the related vaiables in a later section of
the report.
Table 6
Girls Who Never Participated or Consistently Participated Over 5 Years
Interschool Intramural Community
N= 137 N=.137 N= 132
Never participated over 5 years 45 0 26--
Participated all 5 years 2 36 18
Participated at least once 92 137 106
B. Changes in Related Variables by Grade
A repeated measures analysis of variance was performed for each
oT the related variables to determine which variables showed sig-
nificant differences between grades. Table 7 displays only the
related variables that had differences below the .05 probability
level. Three interest variables were significantly different be-
tween grades. The values are derived from a vocational counselling
assessment instrument. Realistic interests include working with
mechanical and electrical things. These interests increased until
Alf

Table 7
Comparison of Related Variables by Grade
RelatedVariable Grade Value
StandardDeviation Statistic Significance
RealisticInterests 6 .43 .27 3.42 .011N= 130 7 .47 .29
8 .50 .309 .45 .33
10 .41 .33
InvestigativeInterests 6 .52 .24 13.06 .000N . 127 7 .51 .26
8 .45 .269 .44 .26
10 .36 .25
ArtisticInterests 6 .71 .19 6.50 .000N = 130 7 .62 .22
8 .62 .239 .65 .22
10 .62 .24
PhysicalEducationSatisfaction 6 3.78 .45 3.36 .012N.131 7 3.64 .47
8 3.61 .539. 3.64 .49
10 3.71 .53
PhysicalActivity forSocialExperience 6 5.71 .66 3.76 .006N.135 7 5.64 .71
8 5.55 .709 5.58 .74
10 5.80 .71
PhysicalActivity forRelease 6 5.28 1.05 3.62 .008N.130 7 5.33 .83
8 5.30 .90T--- 5.42 1.09
10 5.60 .83

-12--
,
Table 7 cont.
RelatedVariable Grade Value
StandardDeviation
F
Statistic Significance
PhysicalActivity
1
4 for Competition 6 5.61 .96 6.93 .000
N=.121 7 5.48 1.068 5.19 1.059 5.37 .90
10 5.08 1.04
Image of FemaleAthlete 6 5.88 .85 2.51 .046
N.121 7 5.90 .88
8 5.72 .91
9 5.74 .92
10 5.66 .85
Father'sSocializationInfluence 6 4.55 1.01 8.53 .000
N.107 7 4.51 1.158 4.33 1.079 4.14 1.10
10 3.99 1.08
Mother'sSocializationInfluence 6 4.52 1.04 8.53 .000
N.117 7 4.51 1.04
8 4.25 1.05
9 4.13 1.07
10 3.97 1.08
Significantother'sparticipation 6 4.93 .97 4.06 .004
N.132 7 5.01 .90
8 4.92 .83
9 4.75 .91
10 4.66 .90
Sports equipmentavailable 6 2.98 1.66 33.54 .000
N.91 7 3.66 1.58
8 5.10 2.409 5.30 2.63
10 5.15 1.88
7 .-

-13-
Grade 8 and then declined again. Investigative interests include
interests in the physical sciences (chemistry, physics) and scien-
tific experiments while artistic interests involve art, drama, poetrymusic, and photography. Both of these interests significantly de-
clined with age.
Satisfaction with physical education classes tended to decline
during junior high school and was approximately equal in Grades 6and 10. Attitudes toward three reasons for physical activity also
differed by grade. Physical activity for a social experience was
more important in Grades 6 and 10 than in junior high. Release oftension became more important with age while competition becameless important. The image of the female athlete declined through
the five years. Yearly decline was also seen for three of the
socialization variables: father's and mother's socialization
influence and significant others' participation. The girls per-ceived less encouragement, support, and example from significant
others as they grew older. However, they did report more sports
equipment available to them in later years.
C. Relationship between Participation and Related Variables
To investigate the relationship between participation and related
variables, means for subjects showing above average participation
over the five years were compared to means of subjects with below
average participation using the Students'tstatistic. The related
variables showing significant differences between the two groupsfor each of the six participation variables are ineluded in Table 8.
For interschool teams five of the interests 1from the vocational
counselling instrument showed significant differences with the above
average participants expressing greater interest in all cases. The
1Social interests include interacting with people and attendingsocial/public functions while enterprising interests involvepolitics, business, influencing others and being a leader. Theother three interests were described earlier.
16

-14--
Table 8
Related Variables Showing Significant Differences between
Above and Below Average Pafticipation
Related Variables Above AverageParticipationMean
Below AverageParticipation
Mean
T-Value
2 Tail
Probability
I. Interschool Teams N . 48 N = 89
Realistic intes .50 .37 2.23 .027
Investigative iL:erests .42 .33 2.05 .042
Artistic interests .71 .59 2.82 .005
.Social interests .82 .74 3.83 .000
Enterprising interests .57 .49 2.09 .038
Movement satisfaction 3.90 3.67 2.96 .004
Independent, ,self-asser-
tive, self-descriptions-.01 .34 -3.84 .000
Physical activity firrelease of tension .5.79 5.49 1.99 .049
Prefer active over seden-tary activities 3.44 2.93 3.77 .000
Significant others'
encouragement 4.91 4.58 2.47 .015
II. Intramural Activities N = 71
no variables with sig-nificant differences
N = 66
III. Community Organized Acti- .
vities N . 62 N . 71
Investigative interests .42 .32 2.08 .040
Movement satisfaction 3.88 3.63 3.40 .001
Independent, assertive
self-descriptions .01 .40 -4.45 .000
Satisfaction with phys.
educ. 3.83 3.63 2.12 .036
Physical activity forbeauty 6.15 5.79 2.49 .014
Physical activity forrelease of tension 5.76 5.48 1.99 .049
Physical activity for
training 4.71 4.29 2.16 .032
Physical activity forcompetition 5.28 4.88 2.10 .038
Image of female athlete 5.89 5.50 2.63 .010
Prefer active oversedentary activities 3.29 2.94 2.58 .011
Father's socializationinfluence 4.27 3.61 3.59 .000
Mother's socializationinfluence 4.17 3.65 2.83 .005
Significant others'encouragement 4.85
,
4.56 2.27 .025
Socio-economic status 2.89 2.01 3.81 .000
Sports equipmentavailable 5.41 4.66 2.09 .038

IMP
715-
Table 8 cont.
Related Variables Above AverageParticipation
Below AverageParticipat;ou---Mean
T-Value2 Tail
ProbabilityMean-
IV. Average Hours Per Day N = 51 N = 48Enterprising interests .58 .47 2.60 .011Prefer active over
sedentary activities 3.33 2.98 2.31 .023Sports equipment available
p
5.68 4.49, 3.37 .001
V. Total Activities N = 60 N = 75Realistic interests .48 .36 2.20 .030Artistic interests .68 .59 2.05 .042Social interests .80 .74 2.93 .004Movement satisfaction 3.85 3.67 2.28 .024Independent, asseitive
self-descriptions -.02 .42 -5.25 i" .000Image of female athlete 5.88 5.53 2.38 .019Prefer active over
sedentary activities 3.42 2.87 4.34 .000Father's socialization
influence 4.19 3.74 2.39 .019Significant others'encouragement 4.88 4.55 2.62 .010
Sports equipment available 5.79 4.41 3.95 .000
VI. Frequency of Four FavouriteActivities N = 69 N = 62Movement satisfaction 3.85 3.65 2.73 .007Body cathexis 3.64 3.44 2.72 .007Independent assertive
self-descriptions .12 .29 -2.02 .045Physical activity forhealth 5.89 5.57 2.09 .038
Physical activity forthrill 4.82 4.41 2.36 .020
Physical activity for'beauty 6.14 5.79 2.37 .019
Physical activity fortraining 4.75 4.27 2.52 .013
Physical activity forcompetition 5.30 4.82 2.45 .015
Image of female athlete 5.88 5.49 2.54 ,012Father's socialization
influence. 4.11 3.71 2.08 .039
Sports equipment available 5.41 4.63 2.17 .031
-16-
other significantly different variables included four personal
attributes: movement satisfaction, independent, assertive self-
descriptions,2 attitude toward physical activity for release of
tension, and preference for active over sedentary activities.
Finally, sIgnificant others' encouragement also showed significant
differences between above and below average interschool par-
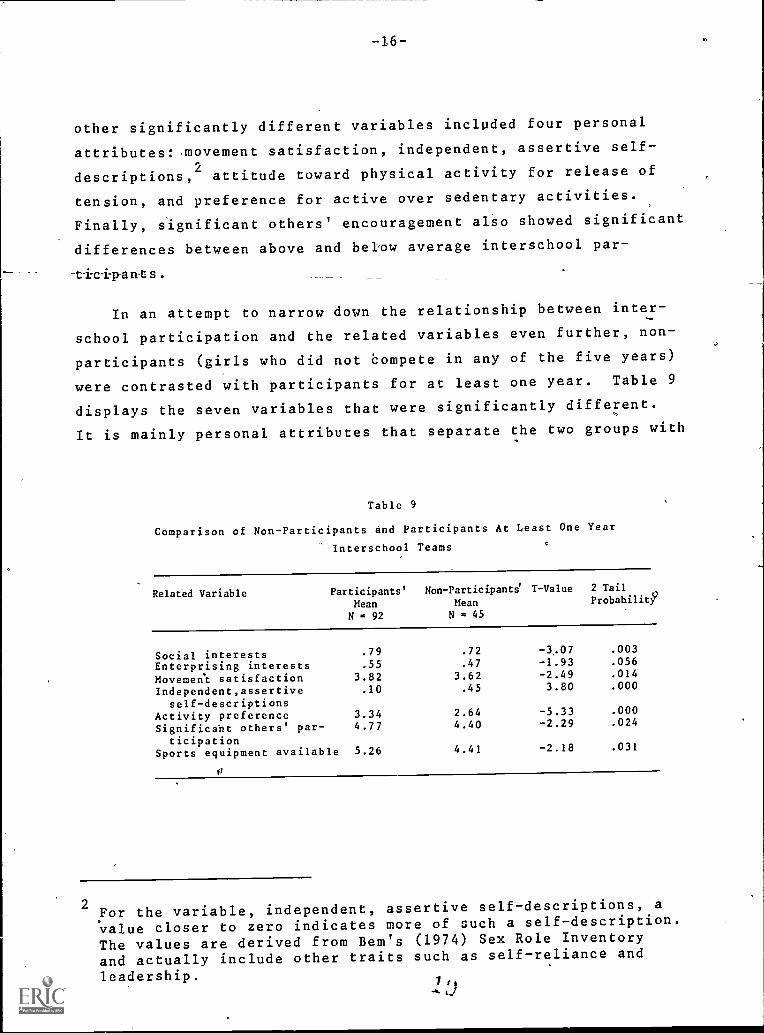
In an attempt to narrow down the relationship between inter--
school participation and the related variables even further, non-
participants (girls who did not Eompete in any of the five years)
were contrasted with participants for at least one year. Table 9
displays the seven variables that were significantly different.
It is mainly personal attributes that separate the two groups with
Table 9
Comparison of Non-Participants and Participants At Least One Year
Interschool Teams
Related Variable Participants'MeanN = 92
Non-Participants'Mean
N = 45
T-Value 2 TailProbabilitY
Social interests .79 .72 -3,07 .003
Enterprising interests .55 .47 -1.93 .056
Movemen't satisfaction 3.82 3.62 -2.49 .014
Independent,assertiveself-descriptions
.10 .45 3.80 .000
Activity preference 3.34 2.64 -5.33 .000
Significabt others' par-ticipation
4.77 4.40 -2.29 .024
Sports equipment available 5.26 4.41 -2.18 .031
2 For the variable, independent, assertive self-descriptions, a'value closer to zero indicates more of such a self-description.
The values are derived from Bem's (1974) Sex Role Inventory
and actually include other traits such as self-reliance and
leadership.

1 -17--
traits of confidence in their movement (movement satisfaction,
activity preferences) and themselves (independent, assertive self-
descriptions) coming out strong. Enterprising interests also require
leadership qualitities. These traits seem to encourage adolescent
girls to compete in highly organized and competitive interschool
teams.
For intramural activities there were no variables with sig-
nificant differences between above and below average participants.
The related variables included in the study could not distinguish
between the two groups and it would appear that there are no iden-
tifiable charctdristics of above average intramural participants.
Because all girls in the study (Table 6) participated in intramurals
for at least one year, further analysis could not be undertaken.
Above average participants in community organized activities
had significantly higher values on 15 of the 26 related Variables
(Table 8), so there was a great deal of difference between the two
groups. Again, to try and narrow down these variables, non-par-
ticipants (never participated in any of the five years) were com-
pared to girls who had participated every single year for the fiveyears. The eight significant variables are outlined in Table PlO.
,
Table 10
Comparison of Non-Participants nd Participants for All Five Years
Community Organized Activities
Related Variable Participants' Non-Participants' T-Value 2 TailMean Mean Probability
N . 18 N . 26
Investigative interests .48 .32 -2.11 .04iIndependent, assertive .04 .53 3.34
-2.25
.002,,--self-descriptions
5.51-Physical activity for 4.73 .030competition
Father's socialization 4.56 3.30 -4.34 .000influence
Mother's socialization 4.46 -3.373.44 .002influence
Significant others' 5.07 4.41 -2.67 .011participation
Significant others' 5.04 4.54 -2.36 .023encouragement
Socio-economic status 2.94 1.68 -3.21 .003
21,1

-18-
The majority of the variables were socialization variables showing
the importance of significant others encouragement, support and
example. High socio-economic statu would also help provide the
means and the opportunities to participate in community organized
activities. For'this participation varLable, then, personal
attributes were not as important as socialization factors.
There were only,three variables that separated girls who par-
ticipated in above average hours per day from below average parti-
cipants (Table 8). However, since /average hours per day' was a continuous --
variable, this made further analysis difficult. There did not appear to be much
identifiable difference between the two groups.
For the two remaining v,ariables, total activities participated in
and frequency of four favourite activities, there were respectively
10 and 11 significantly different related variables between above
and below average participants (Table 8). Both of these participa-
tion variables are difficult to interpret. Subjects with the same
total number of activities could have quite different amounts of
participation time depending on how often and how vigorously they
were involved. Also, the frequency of four favourite activities
could be misleading,if the girls' favourite activities (for exam-
ple, skiing, roller skating, wind tirfing) were not participated
in as frequently as other activities due te) the cost and lack of
apportunity. Nevertheless, it is interesting to note the reoc-
currence ofseveral significantly different variables: movement
satisfaction; independent, assertive self-descriptions; image of the
female athlete; father's socialization influence; and sports equip-
ment available. These same variables appeared for some of the other
participation variables.
SUMMARY AND CONCLUSIONS
Based on the results of the study, the following conclusions
can be made:
1. Overall, participation in physical activity declined as
the girls matured from Grades 6 to 10. Five of the six
participation variables had significantly lower values
in Grade 10.
0 I
4

-19-
2. Participation in interschool teams and intramural activitiesdropped off abruptly in Grade 10. The dropoff was more gra-dual for community organized activities and average hours perday
3 Several related variables also changed over the five years asthe girls moved from elementary to senior high school:
a) Realistic,investigative, and artistic interestsdeclined.
b) Satisfaction with physical education was lowest injunior high school.
c) Attitudes toward physical activity for a socialexperience was Low in junior high school. Physicalactivity for release of tension became more importantwith age while competition became less important.
d) The image of the female athlete declined.e) Father's and mother's socialization influence and
significant others' participation declined.f) Amount of sports equipment available increased over,
the five years.
4. Personal attributes expressing confidence in their movement'and themselves separated participants and non-participants ininterschool teams.
5. There were no related variable differences between aboveand below average participants in intramural activities.
6. Socialization variables and socio-economic status separatedparticipants and non-participants in community organizedactivities.
7. Several significantly different related variables reoccuredfor many of the,participation variables:
a) movement satisfactionb) independent, asserrive self-descriptionsc) Socialization variableAd) Sports equipment available
These variables seem very impprtant for explaining partici-pation in different types of physical attivity.
RECOMMENDATIONS
Several recommendations can be made for further action in
school physical education programs:
1. Girls must be encouraged to remain active in physicalactivity throughout adolescence and adulthood.
2. The opportunities available to girls in senior highschools for intramural and interschool participationshould be investigated. Every effort should be made toensure that intramural and interschool programs areavailable to all girls who desire them.
2
-20-
3. An examination of the related variables that changed sig-nificantly over the five years 'points to some strategiesthat could be used to enhance participation:
a) Because physical activity for release of tensionbecame more important with age while competitionbecame less important, types of activities inphysical education classes must change with ageto cater to these changing motives. The number'of competitive activities must be decreased andthe number of cathartic activities increased.
b) Unfortunately, it still appears that the image ofthe female athletetparticipant must be enhanced.. It
declined with age and also showed significant dif-ferences between above and below average participants.
c) Socialization variables (significant other's par-ticipation and encouragement) were highlyrelated to physical activity participation, par-ticularily to community organized activities.However, the influence declined with age coincidingwith a decline in participation. Somehow, sig-nificant others, especially parents, must be made
to recognize the importance of girls' lifelong par-ticipation in activity and must be encouraged tosupport girls in their activities throughout senior
lligh school.
4 Socio-economic status and sports equipment available were im-portant for participation, especially for non-school relatedactivities. Because individual girls cannot change thesevariables, school, recreational and community programmers shouldstrive to provide low-cost programs that would be feasible forgirls from lower socio-economic backgrounds.
5. Physical education programs should strive to enhance girls'movement satisfaction (confidence in physical skills) as thiswas strongly related to all types of participation. This couldpartially be done by improving sport skill and personal fitnesslevels.
-21-
APPENDIX A
VARIABLES AND INSTRUMENTS INCLUDED IN STUDY
A. Personal Attributes
1. Self esteem - Rosenberg's (1965) Self Esteem Scale
2. Body cathexis Secord and Jourard's (1953) Body CathexisScale
3. Movement satisfaction - Nelson and Allen's (1970) Scale forAppraisal of Movement Satisfaction
4. Imterest in six types of Activities - Holldnd's (1972) Self-Directed Search
5. Tomboyism -,Author-constructed item
6. Activity preference - Author-constructed item
7. Sex role orientation Bem's (1974) Sex Role Inventory
8. Image of the femle athlete - Semantic differential
9. Satisfaction with physical education - Author constructedinstrument
10. Attitude toward physical activity (7 sub-domains)7 Simon andSmoll's (1974) Children's Attitude Toward Physical ActivityInventory
B. Socializing Agents (Author-Constructed Items)
1. Significant others' participation
2. Significant others' encouragement
3. Father's socialization influence
4. Mother's socialization influence
5. Sibling sex status
C. Socialization Situations
---1-ocio-economic status - Blishen and McRobert's (1976) Socio-Economic Index
2. Amount of sports equipment - author-constructed item
9