document resume ed 373 134 ud 030 045 title … · document resume ed 373 134 ud 030 045 title...
TRANSCRIPT

DOCUMENT RESUME
ED 373 134 UD 030 045
TITLE State Chapter 1 Participation and AchievementInformation--1991-92. Summary Report.
INSTITUTION Westat, Inc., Rockville, MD.SPONS AGENCY Department of Education, Washington, DC. Office of
the Under Secretary.PUB DATE 94
CONTRACT LC89015001NOTE 94p.
PUB TYPE Reports Evaluative/Feasibility (142)
EDRS PRICE E:F01/PC04 Plus Postage.
DESCRIPTORS *Academic Achievement; Child Abuse; *Child Neglect;*Compensatory Education; *Delinquency; DisadvantagedYouth; Elementary Secondary Education; *FederalGovernment; Government Role; Program Evaluation;Program Improvement; Resource Allocation; SchoolDistricts; *State Programs; Urban Schools
IDENTIFIERS *Education Consolidation Improvement Act Chapter 1
ABSTRACTThis report summarizes the 1991-92 State Performance
Reports a- the Chapter 1 Local Education Agency (LEA) program andthe Chapter 1 State Agency Neglected or Delinquent Program. As thelargest single investment in elementary and secondary education bythe Federal government, Chapter 1 provides funding to about 90percent of school districts nationwide, with over 5.9 millionstudents in 1991-92. In 1991-92, 40 percent of these students wereWhite (non-Hispanic), 27 percent were Black, and 28 percent wereHispanic Ametican. A review of the achievement of studentsparticipating in the LEA program shows that, nationally, 22 percentof Chapter 1 schools were identified for program improvement in1991-92 because the Chapter 1 students in those schools showed nochange or a decline in achievement scores over the course of theyear. The total allocation of Chapter 1 funds to state agencyneglected or delinquent programs in 1991-92 was $36.1 million. Aseries of 51 tables presents information about expenditures andrecipients of program services. Thirteen graphs illustrate trend, andfive appendixes provide additional technical information and theevaluation requirements. (SLD)
************************************************************* Reproductions supplied by EDRS are the best that can be made
from the original document.***********************************************************************

. , ,.,.,.,,,, .,;.,.."0,c"--',,-',0:.(...,..-",;.",;;;:',...,..
-. 4A.1.,,s.-.LN-7,144.4*,'''''',", , -Irv; -- 4.,,, ,...". 47Fgo,-.1'f, kt . ... .. -- . . i ,I.F
P,'....`-',',.:1...',--.'N'::',!.',i..,',':,.
'., -. ,,,.... .. .4peg.,,,i;-,'"tez;:,ki4.4f,v.o,-Pdp0. 1,Map. -,. 1,-,c,"*.- ',,,,,,,-. "., -...,,, -e,,,,..., Z., ,,,,,,,
.4y-...,.
U 3 DEPARTMENT OF EDUCATION011.ce of bducaPonal Research lvvi Imort,ort,r,n1ireED CATIONAL RESOURCES INFORMATION
CENrER (ERIC)This document has been reproduced as
ceived from the person or orgaruralionoriginating it
0 Minor changes have been made toimprove reproduction quality
:
Points of view or opinions stated in thisdoct.ment do not necessarily representofficial OERI position or policy
- ' ' `' ..,ra100,,,,,,,,,,,,:., Iiiii,-;,, -rst ' ,; .e..:-`,%,7-..-'''; . .- - it.pailo-..,,:' i'',,,V.It70-", 41%.40-,. ,....,.......,,,-, ..."- - - ..- ....,-,...A.,,,,,,,..&,;.;..e,k..,t.a......z..,-..u.a.arte.....:
, t.-y,11,`,7-,,-..,,-..,-t" i ,,.,`;13. -..`1,';'.,', ,, Z.t,-.4..4,tie,.. --'''' -,---' -,,r,,,....-:.. "..;--,...,,,,_,,,,,,,,,,-,,-- ,,,..,,-4., -,,...,_
..1,.,..-^' n''' 1.,...0.., I,. -.4, v..44.,..,..,;.,."` .,..., -;..: A '`' , 1.k419.': 7 '.1
. .
4'sr

CONTENTS
Page
HIGHLIGHTS OF DATA SUBMITTED ON Tim 1991-92 STATE PERFORMANCEREPORTS 1
Background 1
1. CHAPTER 1 PARTICIPATION, SERVICES, AND STAFFING PATTERNS 3
Chapter 1 Participation 3Chapter 1 Service Patterns 5Chapter 1 Staffing Patterns 7Characteristics of Chapter 1 Students 8
2. ACHIEVEMENT INFORMATION FOR THE CHAPTER 1 LEA PROGRAM 11
Number of States Reporting 11
Basic Skills Achievement 12Advanced Skills Achievement 13
3. ALLOCATION AND COST INFORMATION FOR rffE CHAPTER 1 LEAPROGRAM 14
Chapter 1 LEA Program Allocations 14Chapter 1 Allocation Per Participant 14Concentration Grants 14State Program Improvement Grants 14
4. INFORMATION ON THE CHAPTER 1 STATE AGENCY NEGLEC1LD ORDELINQUENT PROGRAM 15
Participation by Institutional Designation 15Participation by Age Span 15Participation by Service Area 16Characteristics of State Agency N or D Participants 16Percent of Eligible Participants Receiving Chapter 1 Services 16Chapter 1 State Agency N or D Allocations 17

Contents (coned)
page
APPENDIX A. CHAPTER 1 EVALUATION REQUIREMENTS A-1
APPENDIX B. REPORTING PROBLEMS B-1
APPENDIX C. DATA COLLECTION FORM, SCHOOL YEAR 1991-92 C-1
APPENDIX D. PERCENTILE RANKS AND NORMAL CURVE EQUIVALENTS . . D-1
APPENDDC E. METHODOLOGY E-1
4

List of Tables
Lage
Table 1.1 Chapter 1 Participants: Public, Nonpublic, Local Neglected orDelinquent, and Total -- 1979-80 to 1991-92 18
Table 1.2 Number and Percent of Chapter 1 Public, Nonpublic, and Local N or DParticipants, by State -- 1991-92 19
Table 1.3 Chapter 1 Participants by Grade Span, Public, Nonpublic, Local N or D,and Total -- 1990-91 and 1991-92 20
Table 1.4 Chapter 1 Total Participants by Grade -- 1990-91 and 1991-92 22
Table 1.5 Public School Enrollment and Chapter 1 Public Participation for Pre-Kthrough Grade 6, and Grades 7 through 12, 1991-92 23
Table 1.6 Percent of Total Chapter 1 Participants by Grade Span: 1979-80through 1991-92 24
Table 1.7 Total Chapter 1 Participants by Service Area -- 1990-91 and 1991-92 . . 25
Table 1.8 Pe:cent of Total Chapter 1 Participants Served, by Service Area --1979-80 to 1991-92 26
Table 1.9 Chapter 1 Public School Participants by Service Area -- 1990-91 and1991-92
Table 1.10 Chapter 1 Nonpublic School Participants by Service Area -- 1990-91and 1991-92 28
Table 1.11 Chapter 1 Local Neglected or Delinquent Participants by Service Area --1990-91 and 1991-92 29
Table 1.12 Chapter 1 1-1E Staff by Classification 1990-91 and 1991-92 30
Table 1.13 Number and Percent of Chapter 1-Funded 1-1b Staff Who WereTeachers and Teacher Aides, 1991-92 31
Table 1.14 Chapter 1 F1E Teachers and Teacher Aides -- 1979-80 through 1991-92 . . 32
1
List of Tables (cont'd)
Page 1Table 1.15 Number of Chapter 1 Participants Per Chapter 1-Funded Teacher and
Teacher Aide, 1991-92 33
Table 1.16 Chapter 1 Participants by Racial/Ethnic Classification -- 1990-91 and1991-92 34
Table 1.17 Number and Percent of Chapter 1 Participants by Racial/EthnicClassification and State, 1991-92 35
Table 1.18 Number and Percent of Chapter 1 Participants by Racial/EthnicClassification, 1979-80 through 1991-92 36
Table 1.19 Chapter 1 Participants by Year of Birth -- 1990-91 and 1991-92 37
Table 1.20 Chapter 1 Participants by Gender -- 1990-91 and 1991-92 38
Table 1.21 Number and Percent of Public Chapter 1 Students Eligible, by State,1990-91 and 1991-92 39
Table 1.22 Number and Percent of Nonpublic Chapter 1 Students Eligible, by State,1990-91 and 1991-92 40
Table 1 23 Number and Percent of Total Chapter 1 Participants with Disabilities,by State, 1990-91 and 1991-92 41
Table 1.24 Number and Percent of Total Chapter 1 Participants with LimitedEnglish Proficiency, 1990-91 and 1991-92 42
Table 1.25 Number of Schools with Schoolwide Projects, by State, 1990-91 and1991-02 43
Table 1.26 Number of LEAs Operating Innovation Projects, by State, 1990-91 and1991-92 44
Table 2.1 Basic Skills Reading Achievement Results for Chapter 1 StudentsTested on an Annual Cycle -- 1991-92 45
Table 2.2 Basic Skills Mathematics Achievement Results for Chapter 1 StudentsTested on an Annual Cycle 1991-92 45

List of Tables (cont'd)
Page
Table 2.3 Basic Skills Other Language Arts Achievement Results for Chapter 1Students Tested on an Annual Cycle -- 1991-92 46
Table 2.4 Advanced Skills Reading Achievement Results for Chapter 1 StudeatsTested on an Annual Cycle -- 1991-92 47
Table 2.5 Advanced Skills Mathematics Achievement Results for Chapter 1Student- Tested on an Annual Cycle -- 1991-92 47
Table 2.6 Basic Skills Reading Achievement Results Expressed in NCEs forChapter 1 Students Tested on an Annual Cycle -- 1991-92 48
Table 2.7 Basic Skills Mathematics Achievement Results Expressed in NCEs forChapter 1 Students Tested on an Annual Cycle -- 1991-92 48
Table 2.8 Basic Skills Other Language Arts Achievement Results Expressed inNCEs for Chapter 1 Students Tested on an Annual Cycle -- 1991-92 . . 49
Table 2.9 Advanced Skills Reading Achievement Results Expressed in NCEs forChapter 1 Students Tested on an Annual Cycle -- 1991-92 50
Table 2.10 Advanced Skills Mathematics Achievement Results Expressed in NCEsfor Chapter 1 Students Tested on an Annual Cycle -- 1991-92 50
Table 2.11 Number and Percent of Chapter 1 Schools Identified for ProgramImprovement, by State, 1990-91 and 1991-92 51
Table 2.12 Number of LEAs with Schools Identified for Program Improvement, byState, 1990-91 and 1991-92 52
Table 3.1 Chapter 1 LEA Program Allocations and Participation 1990-91 and1991-92 53
Table 3.2 Allocation Per Participant for the Chapter 1 LEA Program -- 1990-91and 1991-92 54
Table 3.3 Number of LEAs Receiving Basic Grants and Number of LEAsReceiving Basic Grants that Also Received Concentration Grants, byState, 1991-92 55
Table 3.4 State Program Improvement Grants, by State, 1991-92 56

List of Tables (cont'd)
page
Table 4.1 Chapter 1 State Agency Neglected or Delinquent Students byInstitutional Designation, 1991-92 57
Table 4.2 Total Chapter 1 State Agency Neglected or Delinquent Students by AgeSpan -- 1990-91 and 1991-92 57
Table 4.3 Neglected, Delinquent, and Adult Correctional Chapter 1 State AgencyNeglected or Delinquent Students by Age Span -- 1990-91 and 1991-92 58
Table 4.4 Total Chapter 1 State Agency Neglected or Delinquent StudentsReceiving Chapter 1 Services by Service Area -- 1991-92 59
Table 4.5 Neglected, Delinquent, and Adult Correctional Chapter 1 State AgencyNeglected or Delinquent Students Receiving Chapter 1 Services byService Area -- 1991-92 60
Table 4.6 Chapter 1 State Agency Neglected or Delinquent Students byRacial/Ethnic Classification -- 1990-91 and 1991-92 61
Table 4.7 Chapter 1 State Agency Neglected or Delinquent Students by Gender --1990-91 and 1991-92 62
Table 4.8 Number and Percent of Eligible State Agency N or D ParticipantsReceiving Chapter 1 Services, by State, 1991-92 63
Table 4.9 Chapter 1 Allocations for the State Agency Neglected or DelinquentProgram -- 1990-91 and 1991-92 64
1
o

HIGHLIGHTS OF DATA SUBMITTED ON THE1991-92 STATE PERFORMANCE REPORTS
This report summarizes the 1991-92 State Performance Reports for the Chapter 1 LEAprogram and the Chapter 1 State Agency Neglected or Delinquent program.0
BACKGROUND
Chapter 1 represents the single largest investment in elementary and secondaryeducation by the Federal government. This Federal aid program was funded in 1991-92 atalmost $6.2 billion. Since the passage of the authorizing legislation in 1965, almost $75billion--89 percent of which was distributed under the Chapter 1 Basic Grants to LocalEducational Agencies (LEAs) program--has been distributed to public school districts; about90 percent of districts nationwide receive Chapter 1 funding.
What is now Chapter 1 evolved from landmark legislation, the Elementary andSecondary Education Act (ESEA) of 1965, which was the first major piece of legislationenacted as part of President Lyndon Johnson's War on Poverty. Title I of ESEA was thebeginning of Federal aid to the nation's elementary and secondary schools. The intent ofTitle I was to provide fmancial assistance to local educational agencies serving areas withconcentrations of children from low-income families so that the schools could expand andimprove their educational programs.3 The original ESEA Title I legislation was also the firstmajor piece of social legislation to require an evaluation.
'State performance reports were received from the 50 States, the District of Columbia,Puerto Rico, and the Buz-au of Indian Affairs.
'The Chapter 1 State Neglected or Delinquent program, administered through Statecorrections and youth agencies, serves youths in State-operated adult and juvenile correctionalfacilities and in facilities for neglected ch;.1dren. The State N or D program differs from thelocal N or D program, in which local and privately operated corrections and juvenile facilitiesreceive services through LEAs.
3Funds are first distributed to counties based primarily on counts of low-income children.The State is then responsible for allocating the funds to lot.al districts based also on counts oflow-income children. At the district level, schools are selected for Chapter 1 services basedon their relative poverty levels; however, within eligible schools, services are delivered on thebasis of children's educational rather than economic needs.
1

Enacted in 1967 as part of Title I of ESEA was the Formula Grants to States forNeglected or Delinquent Children program (State N or D). The purpose of this program wasto provide financial assistance for compensatory education to State agencies directlyresponsible for providing free public education to children in institutions for neglected ordelinquent children and juveniles in adult correctional institutions. The State N or D programhas been included as part of all Title I legislation ever since.
In 1981, Title I was replaced by Chapter 1 of the Education Consolidation andImprovement Act (ECIA), which retained the basic intent of Title I but in a simpler, moreflexible manner.
The Augustus F. Hawkins - Robert T. Sta'ord Elementary and Secondary SchoolImprovement Amendments of 1988 (P.L. 100-297) repealed Chapter 1 of ECIA and made anumber of important changes to Title I of ESEA. The amendments mandated accountabilityfor student outcomes, created or strengthened mechanisms for involving local practitioners inState-level decisions and involving parents in the educational program, and required strongercoordination between Chapter 1 and other instruction within the schools.
21 0

1. CHAnER 1 PARTICIPATION, SERVICES, ANDSTAFFING PATTERNS
CHAPTER 1 PARTICIPATION
Overall Participation Patterns
After earlier declines in the number of students participating in Chapter 1(1980-1983), States reported that participation increased to a level of over 5.9million students in 1991-92 (5,594,718 public, 163,329 nonpublic, and 145,572local N or D). This total exceeded the previous high of over 5.5 millionparticipants reported in 1990-91. (Table 1.1)
Chapter 1 LEA. Program Total Participation1979-80 through 1991-92
Participation(in millions)6.0
5.5
5.0
4_5
4.0 .. . -
3.5
3.011 L I I
79-80 80-81 81-82 82-83 83-84 84-85 85-86 86-87 87-88 88-89 89-90 90-91 91-92
Year

Grade-Level Participation
In 1991-92, public and nonpublic student participatio- wasconcentrated in the elementary grades, and local N or Dparticipation was primarily in the secondary grades. (Table 1.2)
Percent80
Chapter 1 Participation by Grade SpanPublic, Nonpublic, and Local N or D
1991-92
Pre-K and K 1-3 4-6 7-9 10-12
Grade Span
1111 Public 0 Noopublic 0 LocaTIVor
Total 1991-92 Panicipatioo = 5.903.619
The distribution of participants by grade level remained virtuallyunchanged over the last thirteen years, while the overallparticipation increased substantially. (Table 1.6)
Parent50
Percent of Chapter 1 Participants, by Grade Span1979-84 through 1991-92
10
o
Grecs 1.3
4-6
Crot 7-9
Pro-8 NOtt
I F,..10.:12 II I I
79-80 80-81 81-82 82-83 83-84 84-85 85-86 86-87 87-88 88-89 89-90 90-91 91-92
Year

CHAPTER 1
Instructional
SERVICE PATTERNS
Services
During 19°1-92, States reported that nearly three-quarters (72percent) Chapter 1 participants received instruction in reading,and almost one-half (48 percent) received instruction inmathematics. (Table 1.7)
Reading
Other Language Arts
Mathematics
Other Instructional
Percent of Chapter 1 ParticipantsServed by Instructional Service Area
1990.91 and 1991-92
*.M.17P KVe*NiQZ0
We. ran nat ;MAW
20 ao 60Percent
1990-91 111 1991.92
Total Participants 1990-91 = 5.547,711Total Participants 1991-92 = 5,903,619
80 100
Service patterns in reading and mathematics remained fairlyconstant over the thirteen-year period, while the category ofother instructional services has shown some fluctuation fromyear to year and the provision of other language arts hasincreased over the years. (Table 1.8)
Percent of Total Chapter 1 Participants Servedby Instructional Service Area
1979-80 through 1991-92
I I I I t
79-80 80-81 1142 82-83 13-84 11445 85-86 11647 87-U 88-89 89-90 90-91 91-9
Year
Reeling
MattaccraUca
Otter LanguageArts
Oder Inerscuonal41r

Supporting Services
As in previous years, in 1991-92 fewer participants receivedsupporting services than received instructional services. In 1991-92, 18 percent of Chapter 1 participants received attendance,social work, and guidance services and 11 percent of participantsreceived health and nutrition services. (Table 1.7)
Percent of Chapter 1 ParticipantsServed by Supporting Service Area
1990-91 and 1991-92
Attendance, SocialWork, and Guidance
Health and Nutrition
Transportation
Other Supporting
0E.K44;V:It
20 40 60 80 100Percent
1990-91 1111 1991-92 I
Total Participants 1990-91 = 5,547.711Total Participants 1991-92 = 5,903.619
The percentage of Chapter 1 students receiving supportingservices fluctuated more over the thirteen-year period than thepercentage of participants receiving instructional services.(Table 1.8)
Percent of Total Chapter 1 Participants Servedby Supporting Service Area
1979-80 through 1991-92
079-80 10-81 *1-82 82-13 13-14 114-15 t5-86 8647 rt-Sli 0-19 19-90 90-91 91-92

CHAPTER 1 STAFFING PATTERNS
Almost one-half of the staff funded by Chapter 1 in 1991-92were teachers. Teachers and teacher aides constituted 86 percentof the total staff funded by Chapter 1 dollars. (Table 1.12)
Chapter 1 FrE Staff by Classification1991-92
Total FTE Staff = 171.830Percents may not add to 100 due to rounding.
Teacber Aides 41%
The percentage distribution of staff across categories hasremained fairly constant since 1981-82. (Table 1.14)
Percent50
20
10
Chapter 1 FIT Staff by ClassificationTeachers, Teacher Aides, Administrative Staff,and All Other Staff, 1979-80 through 1991-92
OI1940 1041 1-a 11243 044 11443 15-16 $6.17 S7-11 8149 19-90 90-91 91.42
Year
Tacten
Ter-InrAkin
ALI Oder Sag
Admin. Ste
7
15

CHARACTERISTICS OF CHAPTER 1 STUDENTS
Racial/Ethnic Classification
In 1991-92, 40 percent of the Chapter 1 participants were white,not Hispanic. (Table 1.16)
Chapter 1 Participants byRacial/Ethnic Classification
1991-92
In the thirteen-year period from 1979-80 through 1991-92, thepercentage of Hispanic Chapter 1 participants increased from 15to 28 percent, while the percentage of white, not HispanicChapter 1 participants has decreased from 51 to 40 percent.(Table 1.18)
Percent60
30
20
10
Percent of Total Chapter 1 Participantsby Racial/Ethnic Classification
1979-80 through 1491-92
0 ! !II III I
79-80 90-81 81-82 E2-83 83-84 84-15 15.36 8647 87-U E8-89 8990 90-91 91-92
Year
Velite. woc Hapric
BLIck. mot Hispinie
Mein Americanor Asian
16

Gender
Fifty-four percent of Chapter 1 participants were male.(Table 1.20)
Percent of Eligible Students Served'
The 50 States, the District of Columbia, Puerto Rico, and theBureau of Indian Affairs reported the number of public studentseligible, and 49 States, the District of Columbia, and Puerto Ricoreported the number of nonpublic students eligible for Chapter 1services. Among these States, 61 percent of public and 61percent of nonpublic students identified as eligible to participatein the Chapter 1 urogram received services.5 (Tables 1.21 and1.22)
'The number of public and nonpublic students eligible to participate in Chapter 1 includespublic and nonpublic students located in all eligible public school attendance areas during theregular school year who were educationally disadvantaged as defmed by local standards (i.e.,children whose educational attainment is below the level that is appropriate for children oftheir age).
Section 1013 of Chapter 1 and §200.30 of the regulations require an LEA to conductits projects in attendance areas selected on the basis of an annual ranking of all eligibleattendance areas. Eligible Chapter 1 attendance areas are those with high concentrations ofchildren from low-income families.
Section 1014 of Chapter 1 and §200.31 of the regulations require an LEA to conductan annual assessment of educational needs that identifies educationally deprived children inall eligible attendance areas. "Educationally deprived children" means children whoseeducational attainment is below the level that is appropriate for children of their age.
5National eligibility figures should be viewed with caution. Three States (California,Pennsylvania, and Texas) reported that an eligible public students received services and sixStates (Arkanas, Idaho, Kansas, New Jersey, Oklahoma, and Pennsylvania) reported that alleligible nonpublic students were served.
9
1 7

Participants with Disabilities and Limited English Proficiency (LEP)
In 1991-92, 49 States, Puerto Rico, and the Bureau of IndianAffairs reported the number of students with disabilitiesreceiving Chapter 1 services. Among these States, 5 percent oftheir Chapter 1 participants were classified as having disabilities.(Table 1.23)
Fifty States, the District of Columbia, Puerto Rico, and theBureau of Indian Affairs reported the number of limited Englishproficient (LEP) students receiving Chapter 1 services. Amongthese States, 17 percent cf. their Chapter 1 participants wereclassified as LEP in 1991-92. (Table 1.24)
Schoolwide and Innovation Projects
A total of 2,306 schoolwide projects were reported by 41 States,Puerto Rico, and the Bureau of Indian Affairs. (Table 1.25)
Twenty-eight States reported 320 LEAs operated innovationprojects in 1991-92. (Table 1.26)
10
18

2. ACHIEVEMENT INFORMATION FOR THE CHAPTER 1LEA PROGRAM6
NUMBER OF STATES REPORTING'
Forty States, the District of Columbia, Puerto Rico, and theBureau of Indian Affairs submitted annual basic skills readingachievement data, and 40 States, the District of Columbia, PuertoRico, and the Bureau of Indian Affairs submitted annual basicskills mathematics data. In addition, 35 States and the Bureau ofIndian Affairs reported basic skills other language arts data.(Tables 2.1 through 2.3 and Tables 2.6 through 2.8)
Armual advanced skills achievement data were submitted by 47States, the District of Columbia, and the Bureau of IndianAffairs in reading comprehension and by 48 States, the Districtof Columbia, and the Bureau of Indian Affairs in mathematicsproblems and applications. (Tables 2.4 and 2.5 and Tables 2.9and 2.10)
6Basic and advanced skills achievement information are presented as percentiles inTables 2.1 through 2.5 and as NCEs in Tables 2.6 through 2.10.
7Due to the nature of the tests given by Puerto Rico, its achievement data were notcomparable to that provided by the States, the District of Columbia, and the Bureau of IndianAffairs.
1 1
1 9

BASIC SKILLS ACHIEVEMENT
Number of Chapter 1 Students Tested
In the States that reported data, a total of 1,885,149 Chapter 1students were tested in basic skills reading, 1,194,849 Chapter 1students were tested in basic skills mathematics, and 475,278Chapter 1 students were tested in other language arts.(Tables 2.1 through 2.3 and Tables 2.6 through 2.8)
Achievement Results
Among Chapter 1 students tested in reading, posttest scores werehigher than pretest scores at every grade level. Pretest toposttest percentile increases ranged from 1 to 6, with the highestincreases for Chapter 1 students in grades 2 through 4 and 7.Pretest percentiles ranged from 17 in grade 12 to 21 in grades 9through 11. Posttest percentiles ranged from 18 in grade 12 to25 in grade 4. (Table 2.1)
Among Chapter 1 students tested in mathematics, posttest scoreswere higher than pretest scores at every grade level. Pretest toposttest percentile increases ranged from 1 in grade 12 to 11 ingrade 2. The largest increases occurred in grades 2 through 4.Pretest percentiles ranged from 19 in grade 10 to 24 in grade 12,while posttest percentiles ranged from 23 in grade 10 to 33 ingrade 2. (Table 2.2)
Among Chapter 1 students tested in other language arts, posttestscores were higher than pretest scores at every grade levelexcept grade 12. Pretest to posttest percentile increases rangedfrom 0 in grade 12 to 6 in grade 3. Pretest percentiles rangedfrom 17 in grade 3 to 22 grade 8. Posttest percentiles rangedfrom 20 in grade 12 to 26 in grade 6. (Table 2.3)
12
20

ADVANCED SKILLS ACHIEVEMENT
Number of Chapter 1 Students Tested
In the States that reported data, a total of 1,559,382 Chapter 1students were tested in advanced skills read' .g (readingcomprehension), and 901,317 Chapter 1 students were tested inadvanced skills mathematics (problems and applications) on anannual cycle. (Tables 2.4 and 2.5 and Tables 2.9)
Achievement Results
For Chapter 1 students tested in reading comprehension, posttestscores were higher than pretest scores at every grade level.Pretest to posttest percentile increases in advanced skills readingranged from 2 in grade 11 to 7 in grades 2 and 3. Pretestpercentiles ranged from 16 in grade 12 to 25 in grades 10 and11. Posttest percentiles ranged from 19 in grade 12 to 27 ingrades 10 and 11. (Table 2.4)
For Chapter 1 students tested in problems and applications,posttest scores were higher than pretest scores at every gradelevel. Pretest to posttest percentile increases in advanced skillsmathematics ranged from 2 in grade 9 to 10 in grade 2. Pretestpercentiles ringed from 17 in grades 10 through 12 to 22 ingrade 5. Posttest percentiles ranged from 20 in grade 12 to 31in grade 2. (Table 2.5)
Program hnprovement
Nationally, 22 percent of ,Chapter 1 schools were identified forprogram improvement in 1991-92 because the Chapter 1 studentsin those schools showed no change or showed a decline inaggregate achievement scores over the course of the year.(Table 2.11)
13
2 1

3. ALLOCATION AND COST INFORMATION FOR THECHAPTER 1 LEA PROGRAM
CHAPTER 1 LEA PROGRAM ALLOCATIONS
Allocations for the Chapter 1 LEA program to the 50 States, thLDistrict of Columbia, Puerto Rico, and the Bureau of IndianAffairs for 1991-92 totaled approximately $5.5 billion, a 17percent increase from the 1990-91 allocations of slightly under$4.8 billion. (Table 3.1)
CHAPTER 1 ALLOCATION PER PARTICIPANT
The average allocation per participant under the Ckapter 1 LEAprogram was $938 in 1991-92. This figure represents a 10percent increase from 1990-91's figure of $857. (Table 3.2)
CONCENTRATION GRANTS
Concentration grants are designed to augment basic grants inLEAs with very high concentrations of children from low-income families. Across the 50 States, the District of Columbia,and Puerto Rit.:3, over 6,000 LEAs received concentration grantsin 1991-92. (Table 3.3)
STATE PROGRAM IMPROVEMENT GRANTS
State Program Improvement grants are distrilAted to LEAs foruse in establishing and implementing program improvementplans. Sixteen States received $90,000 (the minimum grantamount) and 36 States and Puerto Rico received greater than$90,000. Of these States, (California and New York) receivedgrants of greater than $1.0 million. (Table 3.4)
14
22

4. INFORMATION ON THE CRAFTER 1 STATE AGENCYNEGLECTED OR DELINQUENT' PROGRAM
PARTICIPATION BY INSTITUTIONAL DESIGNATION
Sixty-one percent of the State Agency N or D participants were classified asdelinquent, 34 percent were classified as adult correctional, and 4 percent wereclassified as neglected. (Table 4.1)
Cbapter 1 State Agency Neglected or DelinquentPartidpants by Institutional Designation
1991-92
PARTICIPATION BY AGE SPAN
Fifty-six percent of the State Agency N or D participants were 17 through 20years old. By institutional designation, neglected and delinquent participantswere concentrated in the 14-16 age span and adult correctional participantswere concentrated in the 17-20 age span. (Tables 4.2 and 4.3)
Chapter 1 State Agency Neglected or DelinquentPartidpants by Age Span and Institutional
Designation, 1991-92
A4.0-9,<ISNg 1013 21* Age 10.13 66
,
Age 1416 31%
NegiectodTots1=2,122
Ap 0.9 611
kr 17.20 22%
Ai, 10.13 21Aie 1416 611
Total Participants = 63,691
Adult CorrectionalTotala21.748
Aic 17.20 9211
DeilaquestTotala39.121
1743 SA
15 2 3

PARTICIPATION BY SERVICE AREA
About two-thirds of the State Agency N or D participantsreceived reading and about two-thirds received mathematicsinstruction. (Table 4.4)
Attendance, social work, and guidance and health and nutritionare the only supporting services provided to a significant numberof State Agency N or D participants. (Table 4.4)
CHARACTERISTICS OF STATE AGENCY N OR D PARTICIPANTS
Forty-eight percent of the State Agency N or D participants wereblack, not Hispanic and 91 percent were male. (Tables 4.6 and4.7)
Chapter 1 State Agency Neglected or DelinquentPartidpants by Racial/Ethnic Classification
1991.92
_,erWhite, rot Hispanic
*4
t **Av.*:%
ZZZA::.lmsnmelosmar
Native American 2%Asian 1%
Hispanic 16%
Black. not Hispanic 48%
Total participants for which data were reported = 63.734
PERCENT OF ELIGIBLE PARTICIPANTS RECEIVING CHAPTER 1 SERVICES
The 50 States, the District of Columbia, and Puerto Ricoreported 109,614 students as eligible to participate in the StateAgency N or D program. Fifty-eight percent of eligibleparticipants received State Agency N or D services in1991-92. (Table 4.8)
16
24

/CHAPTER 1 STATE AGENCY N OR D ALLOCATIONS
The total allocation for the Chapter 1 State Agency N or Dprogram in 1991-92 was $36.1 million, a 10 percent increasefrom the 1990-91 allocation of $32.8 million. (Table 4.9)

Tab
le 1
.1
Cha
pter
1 P
artic
ipan
ts:
Publ
ic, N
onpu
blic
, Loc
al N
egle
cted
or
Del
inqu
er.,
and
Tot
al--
197
9-80
to19
91-9
2w
Yea
rPu
b he
ti
Perc
ent
Cha
nge
Yea
r-to
-Yea
rN
onpu
blic
='
Perc
ent
Cha
nge
Yea
r-to
-Yea
r
Loc
alN
egle
cted
and
Dcl
inqu
eng
Perc
ent
Cha
nge
Yea
r-to
-Yea
rT
otal
Perc
ent
Cha
nge
Yea
r-to
-Yea
r
1979
-80
4,97
3,70
818
9,11
45,
162,
822
1980
-81
4,86
2,30
8-2
213,
499
135,
075,
807
-219
81-8
24,
434,
447
-918
4,08
4-1
44,
618,
531
-919
82-8
34,
270,
424
-417
7,21
0-4
4,44
7,63
4-4
1983
-80
4,38
1,97
53
190,
660
84,
572,
635
319
84-8
54,
528,
177
318
4,53
2-3
4,71
2,70
93
1985
-86Y
4,61
1,94
82
127,
922
-31
4,73
9,87
01
1986
-871
14,
594,
761
*13
7,90
08
4,73
2,66
1*
1987
-88
4,80
8,03
05
136,
618
-14,
944,
648
4
1988
-89Y
4,77
7,64
3--
137,
656
131,
574
5,04
6,87
32
1989
-90
5,01
4,61
75
151,
948
1016
1,25
523
5,32
7,82
06
1990
-91
5,25
2,14
15
157,
360
413
8,06
9-1
45,
547,
570
419
91-9
25,
594,
718
716
3,32
94
145,
572
55,
903,
619
6
Les
s th
an 1
per
cent
.
a/G
uam
rep
orte
d pa
rtic
ipan
t inf
orm
atio
n in
197
9-80
and
198
0-81
; the
Tru
st T
erri
tori
es r
epor
ted
part
icip
ant i
nfor
mat
ion
in 1
979-
80, 1
980-
81, 1
981-
82,
and
1983
-84;
and
the
Vir
gin
Isla
nds
repo
rted
par
ticip
ant i
nfor
mat
ion
in 1
979-
80.
b/Pu
blic
Cha
pter
1 p
artic
ipat
ion
coun
ts f
or th
e ye
ars
1979
-80
thro
ugh
1985
-86
have
bee
n re
vise
d si
nce
the
1985
-86
repo
rt to
ref
lect
a r
eadj
ustm
ent o
fth
e pu
blic
par
ticip
atio
n co
unts
rep
orte
d by
Cal
ifor
nia.
Pub
lic p
artic
ipat
ion
coun
ts r
epor
ted
by C
alif
orni
a w
ere
also
adj
uste
d fo
r th
e ye
ars
1986
-87
thro
ugh
1991
-92.
c/B
y-pa
ss s
tude
nts
in M
isso
uri a
nd V
irgi
nia
wer
e no
t inc
lude
d pr
ior
to 1
983-
84.
d/T
he n
umbe
r of
loca
l N o
r D
par
ticip
ants
by
grad
e w
as r
epor
ted
sepa
rate
ly f
rom
pub
lic a
nd n
onpu
blic
par
ticip
ants
for
the
firs
t tim
e in
198
8-89
.e/
The
lim
bers
for
non
publ
ic p
artic
ipan
ts in
Cal
ifor
nia
for
1983
-84
wer
e ad
just
ed to
ref
lect
the
aver
age
of th
e nu
mbe
rs r
epor
ted
for
the
year
s 19
82-8
3an
d 19
84-8
5.f/
Stat
e re
port
ed d
ata
follo
win
g th
e A
guila
r v.
Fel
ton
deci
sion
(fr
om 1
985-
86 to
pre
sent
).o
Star
ting
in 1
986-
87, t
he n
onpu
blic
par
ticip
atio
n co
unt i
nclu
des
part
icip
ants
in s
choo
ls w
ith r
elig
ious
aff
iliat
ion
in P
uert
o R
ico.
The
incl
usio
n of
thes
e pa
rtic
ipan
ts in
198
6-87
ove
rest
imat
es th
e ac
tual
per
cent
age
incr
ease
fro
m 1
985-
86.
h/C
hang
es in
the
tota
l num
ber
of p
ublic
and
non
publ
ic p
artic
ipan
ts f
rom
198
7-88
to 1
988-
89 a
re d
ue in
par
t to
chan
ges
in r
epor
ting.
Sin
ce th
enu
mbe
r of
loca
l N o
r D
par
ticip
ants
is n
ow r
epor
ted
sepa
rate
ly, c
hang
es a
re d
ue in
par
t to
the
rem
oval
of
thes
e st
uden
ts f
rom
the
publ
ican
dno
npub
lic c
ateg
orie
s. A
s a
resu
lt, p
erce
nt c
hang
ein
publ
ic a
nd n
onpu
blic
par
ticip
atio
n be
twee
n 19
87-8
8 an
d 19
88-8
9 is
mis
lead
ing
and
is n
otpr
esen
ted
in th
is ta
ble.
27
NO
MI
MI M
I MI M
I MI N
W O
M M
I OM
INS
IIIIII
IIM
O

Table 1.2
Number and Percent of Chapter 1 Public, Nonpublic, and Local N or DParticipants, by State - 1991-92
PublicState Participants %
Nonpublic
Participants %
Local N or DParticipants %
Total
ParticipantsAlabama 131,989 98 519 1.630 1 134.138
Alaska 7,278 9'7 31 211 3 7,520
Arizona 13,048 96 1,458 2 1,671 2 86,177
Arltanu s 75.538 99 796 1 254 76,588
California 1,113,191 92 26,770 2 69,939 6 1,209,900
Colorado 37,390 97 497 1 663 2 38,550
Connectima 50,063 94 2,023 4 1,440 3 53,526
Delaware 10,040 93 758 7 0 0 10,798
District of Columbia 14,077 95 686 5 0 0 14.763
Florida 178,539 94 2.610 1 9,044 5 190,193
Georgia 153,565 99 324 991 1 154.890
Hawaii 14,585 99 84 1 0 0 14,669
Idaho 25,453 98 453 2 121 26,027
Illins 164,362 95 7,930 5 1.358 1 173,650
Indiana 85,448 91 1.796 2 6,423 7 94,167
Iowa 34,739 92 2,119 6 924 2 37.782
Kansas 34.078 94 564 2 1,758 5 36,400
Kentucky 103,488 98 1,545 1 931 1 105,964
Louisiana 131.524 96 3,748 3 2.161 2 137,433
Maine 27,624 99 320 1 19 * 27,963
Maryland 64.711 94 2.766 4 1,124 2 68.601
Massachusetts 89,294 95 4,383 5 595 1 94.272
Michigan 171,204 99 1,596 1 104 172,934
Minnesota 72,568 93 3,008 4 2,215 3 77,791
Mississippi 155.004 99 1,897 1 176 157,077
Mimouri 88,711 95 3,785 4 1,138 1 93,634
Montana 14,760 95 174 1 633 4 15.567
Nebraska 26,956 89 1,771 6 1,467 5 30,194
Nevada 10.924 95 112 1 512 4 11.548
New Hampshire 13,403 9'7 287 2 190 1 13,880
New Jersey 165.400 94 8.203 5 1,816 1 175.419
New Mexico 42,137 95 916 2 1,223 3 44.276
New York 400.499 91 28.670 7 9,558 2 438,727
North Carolina 123,340 99 344 * 740 1 124,424
North Dakota, 10,421 96 311 3 74 1 10,806
Ohio 133,202 91 6,620 5 6,521 4 146,143
Oklahoma 57,760 99 299 1 536 1 58,595
Oregon 46.432 96 437 1 1,590 3 48,459
Pennsylvania 206,570 89 20.022 9 4,346 2 230,938
Rhode Island 13,870 92 1.168 8 69 15,107
South Carolina 64,864 99 225 390 1 65,479
South Dakota 13,641 95 352 2 366 3 14.359
Tennessee 126,201 99 473 1.054 1 127,728
Texas 443.351 97 5,132 1 6.876 2 455,359
Utah 32.512 100 75 0 0 32.587
Vermont 11.118 98 150 1 126 1 11,394
Virginia 73,459 99 611 1 18 74.088
Washington 58,854 98 764 1 665 1 60,283
West Virginia 33.111 99 178 1 43 33,332
Wisconsin 66,902 95 2,532 4 1.032 1 70,466
Wyoming 5,186 99 52 1 16 5,254
Puerto Rico 263,557 96 10,975 4 321 274.853
Bureau of Indian Affairs 18.777 103 0 0 0 0 18.777
!Nation 5,594,718 95 163,329 3 145.572 2 5,903,619
Less than 1 percent
Percents (across) may not add to 100 due to rounding.
19 2 8
BEST COPY AVMLABLE
I

Table 1.3
Chapter 1 Participants by Grade Span, Public, Nonpublic,Local N or ID, and Total 1990-91 and 1991-92
1990-91 1991-92PercentChangeNumber PercentY Number Percents
Public
Pre-K and Kindergarten 478,939 9 492,111 9 3Grades 1-3 2,138,725 41 2,256,482 40 6Grades 4-6 1,619,162 31 1,729,686 31 7Grades 7-9 812,524 15 887,306 16 9Grades 10-12 202,244 4 224,842 4 11Ungraded-b-' 547 * 4,291 * 684Total 5,252,141 100 5,594,718 100 7
Nonpublic
Pre-K and Kindergarten 6,770 4 8,289 5 22Grades 1-3 72,236 46 70,999 43 -2Grades 4-6 52,359 33 53,470 33 2Grades 7-9 20,907 13 24,597 15 18Grades 10-12 4,899 3 5,974 4 22UngradedV 189 * 0 0 -100Total 157,360 100 163,329 100 4
Local N or D
Pre-K and Kindergarten 515 *. 585 * 13Grades 1-3 3,170 2 4,179 3 32Grades 4-6 8,695 6 9,679 7 11Grades 7-9 46,179 33 51,055 35 11Grades 10-12 74,950 54 76,568 53 2Ungradee 4,560 3 3,506 2 -23Total 138,069 100 145,572 100 5
Total
Pre-K and Kindergarten 486,224 9 500,985 8 3Grades 1-3 2,214,131 40 2,331,660 39 5Grades 4-6 1,680,216 30 1,792,835 30 7Grades 7-9 879,610 16 962,958 16 9Grades 10-12 282,093 5 307,384 5 9Ungraded 5,296 * 7,797 * 47Total 5,547,570 100 5,903,619 100 6
20
29
1
1

Table 1.3 (continued)
Less than 1 percent.
a/ Percents may not add to 100 due to rounding.
b/ Public ungraded participants were reported by five States (Connecticut, Illinois,Kentucky, Michigan, and Rhode Island) in 1990-91 and three States (Connecticut,Kentucky, and Michigan) in 1991-92.
c/ Nonpublic ungraded participants were reported by one State (Illinois) in 1990-91.
d/ Local N or D ungraded participants were reported by seven States (Arizona,Connecticut, Iowa, Kansas, Kentucky, Michigan, and Missouri) in 1990-91 and by fiveStates (Alabama, Connecticut, Michigan, Missouri, and Virginia) in 1991-92.
21
3 9
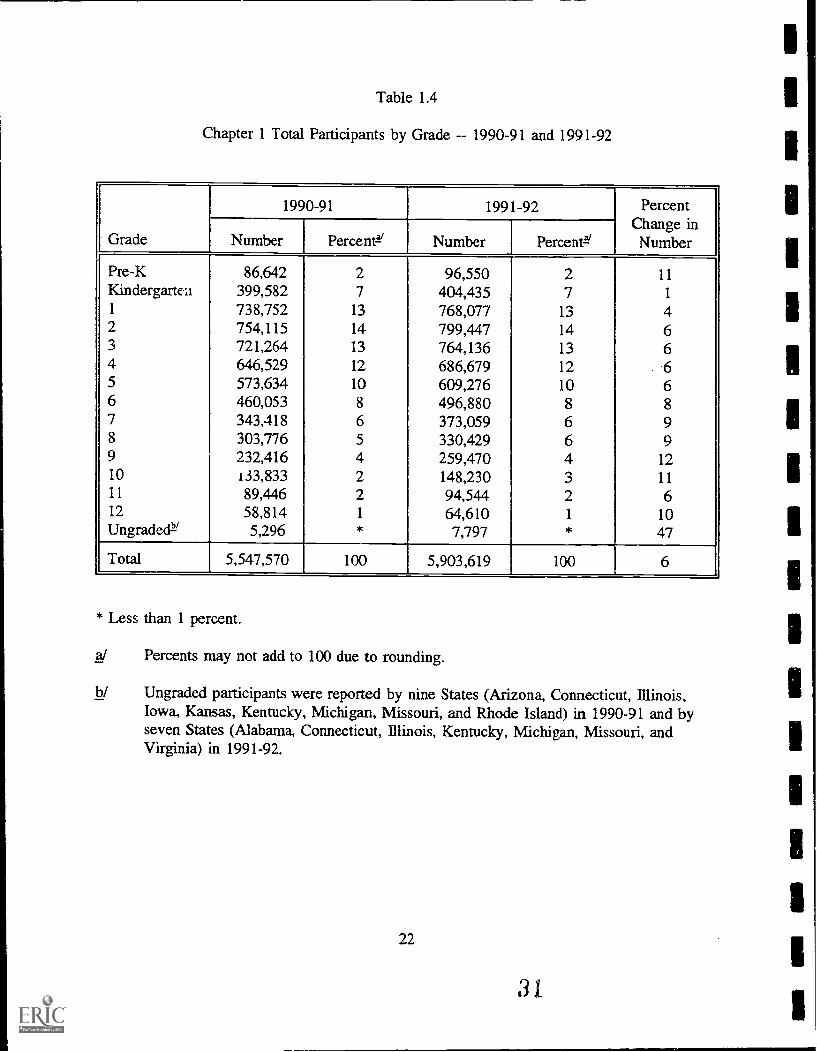
Table 1.4
Chapter 1 Total Participants by Grade -- 1990-91 and 1991-92
Grade
1990-91 1991-92 PercentChange inNumberNumber Percent!' Number Percent!'
Pre-K 86,642 2 96,550 2 11Kindergartea 399,582 7 404,435 7 1
1 738,752 13 768,077 13 42 754,115 14 799,447 14 63 721,264 13 764,136 13 64 646,529 12 686,679 12 65 573,634 10 609,276 10 66 460,053 8 496,880 8 87 343,418 6 373,059 6 98 303,776 5 330,429 6 99 232,416 4 259,470 4 1210 133,833 2 148,230 3 1111 89,446 2 94,544 2 612 58,814 1 64,610 1 10Ungraded:2' 5,296 * 7,797 * 47
Total 5,547,570 100 5,903,619 100 6
* Less than 1 percent.
a/ Percents may not add to 100 due to rounding.
b/ Ungraded participants were reported by nine States (Arizona, Connecticut, Illinois,Iowa, Kansas, Kentucky, Michigan, Missouri, and Rhode Island) in 1990-91 and byseven States (Alabama, Connecticut, Illinois, Kentucky, Michigan, Missouri, andVirginia) in 1991-92.
22
31
1
1
1

Table 1.5
Public School Enrollment and Chapter 1 Public Participationfor Pre-K through Grade 6, and Grades 7 through 12, 1991-92
State
Pre-K through Grade 6 Grades 7 through 12
Public SchoolEnrollment
Public Chapter IParticipants
% ReceivingCliapter 1
Public SchoolEnrollment
Public Chapter 1Participants
% ReceivingChapter 1
Alabama 408,95! 115,901 28 313,053 16,088 5
Alaska 71,802 6,714 9 46,878 564 1
Arizona 391.303 63,202 16 265,677 19,846 7Arkansas 744,173 59,697 24 194,345 15,841 8
California 2,479,619 824,190 28 2,127,526 289,001 14
Colorado 348,148 30,785 9 244,882 6,605 3
Connecticut 285,792 39,278 14 195,258 10,697 5
De Irware 58,877 9,265 16 43.319 775 2District of Columbia 50,151 11,863 24 30,467 2,214 7Florida 1,147,531 168,264 15 784,600 10.275 1
Georgia 687,910 121,538 18 489.659 32.027 7Hawaii 102,550 11.085 11 72,197 3,500 5
Idaho 124.888 20,157 16 100,792 5.296 5
Illinois 1,052,938 124,663 12 795,228 39.699 5
Indians 525,153 76,426 15 431.841 9.022 2
Iowa 274.183 32,067 12 217,180 2,672 1
Kl. Mat 258,370 29,314 11 187,020 4,764 3
Kentucky 364,589 75.489 21 281.435 24,032 9Louisiana 453,370 125,048 28 312,219 6,476 2Maine 124,535 24.241 19 91,865 3.383 4
Maryland 437301 64,711 15 298,937 0 0Massachusetts 493,597 71,956 15 352,558 17,338 5
Michigan 917,801 148,239 16 673,319 22,729 3
Minnesota 440,713 68,284 15 332,858 4,284 1
Mississippi 289.245 107.298 37 214,882 47706 22Missouri 466,924 79,917 17 360,480 8,794 2Montana 88,778 8,930 10 67,001 5,830 9Nebraska 159.356 24,536 15 120,196 2.420 2Nevada 126,377 9,271 7 85,433 1,653 2New Hampshire 102,974 11.210 11 74.164 2.193 3
New Jersey 635,868 117,068 18 473,928 48.332 10
New Mexico 169,632 32,742 19 139,035 9,395 7New York 1,477,631 280.581 19 1,166,362 119.918 10
North Carolina 624,185 95,912 15 473,413 27,428 6
North Dakota 66,884 8,846 13 51,492 1,575 3
Ohio 1,004,515 128,579 13 779,252 4,623 1
Oklahoma 344,138 47,148 14 244,125 10,612 4Oregon 281.723 36.560 13 216,891 9.872 5
Pennsylvania 940.534 166,302 18 752.263 40,268 5
Rhode Island 82,838 9.937 12 59,306 3,933 7
South Carolina 357,263 52,275 15 270,207 12.589 5
South Dakota 75,951 11.779 16 55,625 1,862 3
Tennessee 473,306 110,577 23 360.345 15.624 4
Texas 2,057.172 382,823 19 1,407,199 60,528 4Utah 255,893 27,361 11 200.537 5.151 3
Vermont 58,360 9,417 16 38.777 1,701 4Virginia 584,635 68,569 12 431,569 4,890 1
Washington 502.727 50,567 10 366,600 8,287 2
West Virginia 169.315 28,331 17 150,934 4,780 3
Wisconsin 459,721 52,726 11 354,950 14,176 4
Wyoming 58,260 4.537 8 43,814 649 1
Puerto Rico 365,403 179.991 49 276.989 83.566 30
Bureau of Indian Affairs 12,112 6,665
Nation .l4.158,481 4.478.279 19 17.841,862 1.112,148 6
Data not available
Source: Data on the total number of students enrolled in public schools were obtained from the Digest of Education Statistics,National Center for Education Statistics, 1994.
2332
BEST COPY AVAILABLE

Table 1.6
Percent of Total Chapter 1 Participants by Grade Span:1979-80 through 1991-92:21
Year Pre-KKinder-garten
Grades1-3
Grades 4-6
Grades 7-9
Grades10-12
TotalStudents
1979-80 1% 5% 38% 33% 17% 4% 5,162,822
1980-81 1 6 37 33 19 5 5,075,807
1981-82 1 6 36 34 18 5 4,618,531
1982-83 1 6 37 34 17 5 4,44'7,634
1983-84 1 6 37 33 18 5 4,572,635
1984-85 1 6 37 32 18 5 4,712,709
1985-86 1 7 39 31 17 5 4,739,870
1986-87 1 6 40 31 17 5 4,732,661
1987-88 1 6 40 31 16 5 4,944,648
1988-89 2 6 40 31 16 5 5,046,873
1989-90 2 7 41 31 16 5 5,327,820
1990-91 2 7 40 30 16 5 5,547,570
1991-92 2 7 39 30 16 5 5,903,619
a/ Percents (across) may not add to 100 due to rounding.
b/ Total students hiclude ungraded participants. The ungraded participants comprise lessthan 1 percent of overall participation in each of the 12 years.
24
33'7 °t

1
Table 1.7
Total Chapter 1 Participants by Service Area -- 1990-91 and 1991-92
1990-91 1991-92
PercentChange inNumberYNumber
PercentServed Number
PercentServed
Instructional
Reading 3,971,569 72 4,230,160 72 7Other Language Arts 1,299,903 23 1,340,809 23 3Mathematics 2,515,186 45 2,804,283 48 11Other Instructional ServicesY 717,239 13 920,648 16 28
Supporting
Attendance, Social Work,and Guidance 875,537 16 1,084,561 18 24
Health and Nutrition 755,237 14 640,805 11 -15Transportation 213,106 4 235,530 4 11Other Supporting Services2 393,027 7 628,291 11 60
Unduplicated Participant 5,547,570 5,903,619Count
a/ See Tables 1.8 through 1.10 for explanations of year-to-year changes in public, nonpublic,and local neglected or delinquent participant figures.
111 b/ Other instructional services include preschool/early childhood, tutoring, basic skills, readiness,and English as a Second Language (ESL)/bilingual, among others.
c/ Other supporting services include home/school, speech therapy, clothing, media, field trips,nurse, and dental, among others.
25
34

Table 1.8
Percent of Total Chapter 1 Participants Served, by Service Area --1979-80 to 1991-92g
Year
Instructional
ReadingOther Language
Arts MathematicsOther
Instructional
1979-80 77 16 44 161980-81 72 13 40 51981-82 71 17 41 181982-83 74 16 44 91983-84 75 19 44 91984-85 74 18 45 121985-86 74 18 45 151986-87 76 20 47 161987-88 71 19 45 181988-89 72 19 45 171989-90 71 21 46 141990-91 72 23 45 131991-92 72 23 48 16
Year
Supporting
Attendance,Social Work,and Guidance
Health andNutrition Transportation
OtherSupporting
1979-80 15 25 3 8
1980-81 21 20 5 11
1981-82 20 16 6 131982-83 16 14 5 5
1983-84 16 14 4 71984-85 15 12 4 61985-86 19 13 4 71986-87 18 13 4 61987-88 15 9 4 7
1988-89 13 13 6 81989-90 16 14 5 8
1990-91 16 14 4 7
1991-92 18 11 4 11
a/ Guam reported service area information in 1979-80 and 1980-81; the TrustTerritories reported service area information in 1980-81, 1981-82, and 1983-84; and the Virgin Islands reported service area information in 1979-80.
26 35
1

Table 1.9
Chapter 1 Public School Participants by Service Area -- 1990-91 and 1991-92
1990-91 1991-92
PercentChange in
NumberNumberPercentServed Number
PercentSenied
Instructional
Reading 3,748,047 71 4,015,814 72 *-/'
C ther Language Arts 1,204,306 23 1,248,697 22 4Mathematics 2,349,309 45 2,642,426 47 1212
Other Instructional Servicesii 662,848 13 855,860 15 291/
Supporting
Attendance, Social Work,and Guidance 854,723 16 1,043,638 19 22
Health and Nutrition 738,965 14 636,572 11 -14sITransportation 206,072 4 226,720 4 10Other Supporting ServicesY 359,834 7 603,106 11 68E'
Unduplicated Participant 5,252,141 5,594,718Count
a/ The increase in the number of public school par-icipants receiving reading (267,767) is due primarily to increasesin three states (California, Florida, and Texas). The largest increase was in California, where the number ofstudents receiving this service increased 77,448, from 819,469 in 1990-91 to 896,917 in 1991-92.
b/ The increase in the number of public school participants receiving mathematics (293,117) is due primarily toincreases in seven states (California, Florida, Mississippi, New York, Puerto Rico, Tennessee, and Texas). Thelargest increase was in California, where the number of students receiving this service increased 68,642 from690,706 in 1990-91 to 759,348 in 1991-92.
c/ Other instructional services include preschool/early childhood, tutoring, basic skills, readiness, and ESL/bilingual,among others.
d/ The increase in the number of public school students receiving other instructional services (193,012) is dueprimarily to increases in five states (Illinois, Massachusetts, Missouri, New York, and Texas). The largestincrease was in New York, where the number of students receiving this service increased 53,512 from 31,403 in1990-91 to 84,915 in 1991-92.
e/ The dcerease in the number of public school students receiving health and nutrition services (102,393) is dueprimarily to decreases in two states (California and Texas). The largest decrease was in Texas, where thenumber of students receiving this service decreased 66,816, from 182,675 in 1990-91 to 115,859 in 1991-92.
f/ Other supporting services include home/school, speech therapy, clothing, media, field trips, nurse, and dental,among others.The increase in the number of public school students receiving other supporting services (243,272) is dueprimarily to increases in four states (California, Louisiana, Puerto Rico, and Texas). The largest increase was inTexas, where the number of students receiving this service increased 168,163, from 4.8,307 in 1990-91 to216,470 in 1991-92.
27nJ 0

Table 1.10
Chapter 1 Nonpublic School Participants by Service Area -- 1990-91 and 1991-92
1990-91 1991-92
PercentChange inNumberNumber
PercentServed Number
PercentServed
Instructional
Reading 108,782 69 108,657 67 *
Other Language Arts 19,521 12 17,970 11 -82'Mathematics 64,152 41 62,053 38 -3Other Instructional Service# 17,108 11 20,460 13 20E/
Staportigi
Attendance, Social Work,and Guidance 10,176 6 22,872 14 125-11
Health and Nutrition 12,414 8 2,993 2 -765-'Transportation 5,727 4 7,138 4 25Other Supporting Services!' 7,618 5 5,133 3 -33
Unduplicated Participant 157,360 163,329Count
Less than 1 percent.
a/ The decrease in the number of nonpublic school students receiving mathematics services (2,099) is due primarilyto a decrease in California, where the number of students receiving this ;.4rvice decreased 9.502 from 9,577 in1990-91 to 75 in 1991-92. Three states (Illinois, New Jersey, and Ohio) showed an increase in the number ofnonpublic students receiving math services.
b/ Other instructional services include preschool/early childhood, tutoring, basic skills, readiness, and ESIJbilingual,among others.
c/ The increase in the number of nonpublic school students receiving other instructional services (3,354) was dueprimarily to California, where the number of students receiving this service increased 1,614 from 20 in 1990-91to 1,634 in 1991-92.
d/ The increase in the number of nonpublic school students receiving attendance, social work, and guidance services(12,696) was due primarily to increases in three states (California, New Jersey, and Puerto Rico). The largestincrease was in California, where the number of students receiving this service increased 10,187 from 667 in1990-91 to 10,854 in 1991-92.
e/ The decrease in the number of nonpublic school students receiving health and nutrition services (9,421) is dueprimarily to California where the number of students receiving this service decreased 7,428 from 7,478 in 1990-91 to 50 in 1991-92.
f/ Other supporting services include home/school, speech therapy, clothing, media, field trips, nurse, and dental,among others.
2837

Table 1.11
Chapter 1 Local Neglected or Delinquent Participants by Service Area --1990-91 and 1991-92
r90-91 1991-92
PercentChange
inNumber
NumberPercentServed Number
PercentServed
Instructional
Reading 114,740 83 105,689 73Other Language Arts 76,076 55 74,142 51 -3Mathematics 101,725 74 99,804 69 -2Other Instructional Services.ki 37,283 27 44,328 30 195'
Supporting
Attendance, Social Work,and Guidance 10,638 8 18,051 12 70.4/
Health arid Nutrition 3,858 3 1,240 1 -68Transportation 1,307 1 1,672 1 28Other Supporting Servicesf 25,575 19 20,052 14
Unduplicated Participant Count 138,069 145,572
a/ The decrease in the number of local N or D students receiving reading (9,051) is due primarily to a decrease inCalifornia, where the number of students receiving this service decreased 11,694 from 69,889 in 1990-91 to58,195 ;n. 1991-92. The number of students receiving this service increased by 1,108 in New York from 1990-91 to :-91-92.
b/ Other instructional services include preschool/early childhood, tutoring, basic skills, readiness, and ESL/bilingual,among others.
c/ The increase in the number of local N or D students receiving other instructional services (7,045) is due toincreases in two states (Ronda and New York). The largest increase was in New York, where the number ofstudents receiving this service increased 2,552 from 4,896 in 1990-91 to 7,448 in 1991-92.
cl/ The increase in the number of local N or D students receiving attendance, social work, and guidance services(7,413) is due to an increase in California, where the number of students receiving this service increased 7,031,from 6,476 in 1990-91 to 13,507 in 1991-92.Other supporting services include home/school, speech therapy, clothing, media, field trips, nurse, and dental,among others.
f/ The decrease in the number of local N or D students receiving other supporting services (5,523) is due primarilyto decreases in two states (California and Louisiana). The largest decrease was in California where the numberof students receiving this service decreased 8,922 from 20,549 in 1990-91 to 11,627 in 1991-92. Two states(Indiana and New York) show a significant increase in the number of local N or D students receiving thisservice.
29 3 3

Table 1.12
Chapter 1 I-1E Staff by Classification -- 1990-91 and 1991-92
Staff Classification
1990-91 1991-92PercentChange
inNumberNumber Percental Number PercentY
Administrative 3,601 2 3,835 '-) 6
Teachers 71,109 45 77,344 45 9
Teacher Aides 65,232 41 69,806 41 7
Supportine 7,033 4 8,390 5 19
Clerical 5,603 4 6,521 4 16
Othert.2.2 5,692 4 5,934 3
Total 158,270 100 171,830 100 9
a/ Percents may not add to 100 due to rounding.
b/ The H E staff category "other" includes such positions as home/school counselor,curriculum specialist, tutor, evaluator, parent coordinator, bus driveilaide, janitor, andcomputer technician, among others.
30
39
1
1

Table 1.13
Number and Percent of Chapter 1-Funded FTE StaffWho Were Teachers and Teacher Aides, 1991-92
State
TotalFTE Staff
FrETeachers %
FTE TeacherAides %
Alabama 3,913 1,791 46 1,609 41
Alaska 219 62 28 125 57
Arizona 2,266 918 41 1.058 47Arkansas 3,061 915 30 1.939 63California 17.565 2,613 15 11,215 64Colorado 1,447 864 60 478 33
Connecticut 1,690 737 44 694 41
Delaware 391 104 27 252 64
District of Columbia 501 169 34 248 50Flonda 6,473 2.617 40 3.223 50Georgia 4,122 2,622 64 1,207 29Hawaii 502 203 40 150 30Idaho 862 265 31 567 66Illinois 5,817 3,586 62 1.384 24Indiana 4,244 823 19 3.113 73Iowa 1,177 1,045 89 99 8Kansas 1,188 709 60 366 31
Kentucky 3,484 1.819 52 1,347 39Louisiana 5,163 1,599 31 2,679 52Maine 1,386 307 22 1,006 73Maryland 2,676 738 28 1,461 55Massachu.setts 3,572 2.221 62 887 25Michigan 5,904 2.178 37 2,860 48Minnesota 2,653 942 35 1,611 61
Mississippi 4.738 1.539 32 2,459 52Missouri 3,084 2,089 68 877 28Montana 569 309 54 249 44Nebraska 836 509 61 264 32Nevada 318 133 42 160 50
New Hampshire 580 219 38 290 50New Jersey 5.805 3.221 55 1.729 30New Mexico 1,454 664 46 667 46New York 12,526 6,229 50 4,8443 39
North Carolina 3,238 2,330 72 684 21
North Dakota 505 297 59 203 40Ohio 4.632 3,550 77 761 16
Oklahoma 1,976 1.448 73 457 23Oregon 1,330 561 42 668 50
Peunsylvania 6,654 3,067 46 1,272 19
Rhode Island 454 322 71 74 16
South Carolina 2,680 1,142 43 1,215 45South Dakota 796 380 48 387 49Tennessee 4,098 2,079 51 1,628 40Texas 13,337 5,117 38 6,776 51
Utah 1,083 122 11 915 84
Vermont 501 236 47 237 47Virginia 3,025 1,581 52 1.090 36
Washington 1,447 583 40 762 53
West Virginia 1,369 777 57 451 33
Wisconsin 1,940 1,375 71 444 23
Wyoming 214 116 54 79 37
Puerto Rico 11.299 7.145 63
Bureau of Indian Affairs 1,067 361 34 590 55
Nation 171,830 71,344 45 69.806 41
31
HST COPY AVAILABLE 4 q

Table 1.14
Chapter 1 1- 1 h, Teachers and Teacher Aides -- 1979-80 through 1991-92!-'
Year
Teachers Teacher Aides
Number ofTotal Staffb71Number
Percent ofTotal Staff Number
Percent ofTotal Staff
1979-80 77,782 40 86,826 45 194,4031980-81 80,078 43 80,938 44 185,9251981-82 74,786 45 67,536 40 '57,7481982-83 68,590 46 58,093 39 :9,2201983-84 68,627 46 57,479 38 150,2771984-85 72,797 46 61,380 39 158,9671985-86 69,014 45 59,058 39 151,9361986-87 64,143 46 55,530 39 140,6911987-88 65,668 46 56,078 39 143,6751988-89 68,149 45 60,544 40 150,8161989-90 68,554 46 61,282 41 149,2751990-91 71,109 45 65,232 41 158,2701991-92 77,344 45 69,806 41 171,830
a/ Guam reported staff information in 1979-80 and 1980-81; the Trust Territoriesreported staff information in 1979-80, 1980-81, 1981-82, and 1983-84; and the VirginIslands reported staff information in 1979-80.
b/ Total staff includes teachers, teacher aides, administrators, curriculum specialists(through 1987-88), supporting staff, clerical staff, and other staff.
32
4 4

Table 1.15
Number of Chapter 1 Participants Per Chapt . 1-FundedTeacher and Teacher Aide, 1991-92
State
TotalNumber of
Participants
Number of FTETea:hers and
Teacher Aides
Number of ParticipantsPer Teacher and
Teacher AideAlabama 134,138 3,400 39.5Alaska 7,520 187 40.2Arizona 86,177 1,976 43.6Arkansas 76,588 2,854 26.8California 1,209.900 13,828 87.5Colorado 38,550 1,342 28.7Connecticut 53,526 1,431 37.4Delaware 10,798 356 10.3District of Columbia 14,763 417 35.4Florida 190,193 5.840 32.6Georgia 154,890 3.829 40.5Hawaii 14,669 353 41.6Idaho 26,027 832 31.3Illinois 173,650 4,970 34.9Indiana 94,167 3.936 23.9Iowa 37,782 1.144 33.0Kansas 36.400 1,075 33.9Kentucky 105,964 3,166 33.5Louisiana 137.433 4,278 32.1Maine 27.963 1.313 21.3Maryland 68.601 2,199 31.2Massachusens 94,272 3.108 30.3Michigan 172.904 5.038 34.3Minnesota 77,791 2,553 30.5Mississippi 157.077 3.998 39.3Missouri 93,634 2,966 31.6Montana 15,567 558 27.9Nebraska 30,194 773 39.1Nevada 11,548 293 39.fNew Hampshire 13.880 509 27.3New Jersey 175,419 4,950 35.4New Mexico 44.276 1,331 33.3New York 438.727 11,069 39.6North Carolina 124.424 3,014 41.3North Dakota 10,806 930 21.6Ohio 146,343 4,311 33.9Oklahoma 58.595 1,905 30.8Oregon 48,459 1.229 39.4Pennsylvania 230.938 4,339 53.2Rhode Island 15,107 396 38.2South Carolina 65,479 2,357 27.8South Dakota 14,359 767 18.7Tennessee 127,728 3,707 34.5Texas 455,359 11,893 38.3Utah 32,587 1.037 31.4Vermont 11.394 473 24.1Virginia 74,088 2.671 27.7Washington 60,283 1,345 44.8West Virginia 33,332 1,228 27.1Wisconsin 70,466 1.819 38.7Wyoming 5,254 195 26.9
Puerto Rico 274,853 7,145 38.5BUICall of Indian Affairs 18.777 951 19.7
Nation 5.903.619 147,150 40.1
33 4 0

Table 1.16
Chapter 1 Participants by Racial/Ethnic Classification -- 1990-91 and 1991-92
Racial/Ethnic Classification
1990-91 1991-92 PercentChange inNumberNumber PerceneJ Number Percenta1
Native American orAlaskan Native 92,219 2 104,709 2 14
Asian or Pacific Islander 164,527 3 183,644 3 12
Black, not Hispanic 1,487,977 28 1,590,927 27 7
Hispanic 1,439,549 27 1,608,146 28 12
White, not Hispanic 2,183,894 41 2,316,446 40 6
Total 100 100 85,368,166k1
1
5,803,8725-.1
* Less than 1 percent.
a/ Percents may not add to 100 due to rounding.
b/ In 1990-91, the total number on this table will not correspond to the total on Table 1.1because in 16 States, the total number reported by racial/ethnic classification was not thesame as the total number reported by grade. Thirteen States reported more participants bygrade than by racial/ethnic classification. (The largest difference was in California, whichreported 155,367 more by grade than by race.) Three States reported more participants byracial/ethnic classification than by grade. (The largest difference was in New Jersey, whichreported 2,157 more by race than by grade.)
cl In 1991-92, the total number on this table will not correspond to the total on Table 1.1because in 20 States, the total number -.ported by raciallethnic classification was not thesame as the total number reported by Sixteen States reported mk.re participants bygrade than by racial/ethnic classification. (The largest difference was in California, whichreported 84,456 more by grade than by race.) Five States reported more participants byraciallethnic classification than by grade. (The largest difference was in Mississippi, whichreported 716 more by race than by grade.)
34
4 3

Table 1.17
Number and Percent of Chapter 1 Participants by Racial/EthnicClassification and State - 1991-92
StateBlack, Not
Hispanic % Hispanic %
White, NotHispanic %
Native
American
or Asian % TotalAlabama 73,714 55 295 59.176 4.4 953 1 134,138Alaska 630 8 294 4 2,679 36 3,917 52 7,520Arizona 6,434 7 35,251 41 26,566 31 17,923 21 86,176Arkansas 32,258 42 503 1 43,285 57 542 1 76,588California 154,130 14 627,521 56 226,670 20 117,123 10 1,125.444Colorado 3,692 10 15,858 41 17.759 46 1,241 3 38,550Connecticut 13,103 25 14,876 28 24.192 45 1,036 2 53.207Delaware 4,570 42 627 6 5.493 51 104 1 10.794District of Columbia 14,172 96 524 4 33 34 14,763Florida 89,765 47 31,716 17 66,974 35 1,738 1 190,193Georgia 94,925 61 1,921 1 57,207 37 837 1 154,890Hawaii 249 2 1,035 7 1.255 9 12,130 83 14,669Idaho 107 * 3,544 14 21,326 82 1.050 4 26,027Illinois 81,949 47 23,041 13 67,214 39 1,446 1 173,650Indiana 21,340 23 2,907 3 68.590 73 520 1 93,357Iowa 1,503 4 666 2 34,822 92 791 2 37,782Kansas 7.696 22 3,108 9 22,884 66 954 3 34,642Kentucky 14.718 14 202 90.810 86 234 105,964Louisiana 87,131 63 1,899 1 46,621 34 1,782 1 137,433Maine 229 I 99 27,355 98 313 1 27,996Maryland 41,007 60 2,597 4 23,593 34 1,404 2 68,601Massachusetts 17,296 18 20.690 22 50,112 53 6.182 7 94,280Michigan 61,304 35 6,435 4 102.209 59 2,956 2 172,904Minnesota 5,174 7 3,001 4 63,624 82 5.864 8 77,663Mississippi 110,747 70 238 46,227 29 641 157,853Missouri 24,514 26 985 1 66.839 71 1,501 2 93,839Montana 97 1 326 2 11,976 77 3,168 20 15,567Nebraska 3,640 12 1.791 6 23,595 78 1,168 4 30,194Nevada 2.491 22 2,767 24 5,505 48 785 '7 11,548New Hampshire 212 2 514 4 13.046 94 108 1 13,880New Jersey 63,340 36 41,171 23 66.460 38 4,707 3 175,678New Mexico 1.032 2 26,662 60 7,980 18 8,602 19 44,276New York 139,772 32 139,812 32 139.600 32 19,543 4 438,727North Carolina 64,274 52 1,304 1 53.506 43 5,166 4 124,250North Dakota 95 1 125 I 9,240 86 1,346 12 10,806Ohio 36,950 25 2,511 2 105.678 72 1,204 1 146,343Oklahoma 10,622 18 2.760 5 34.605 59 10,608 18 58,595Oregon 2,222 5 4,281 10 35,440 80 2,332 5 44,275Pennsylvania 68.399 30 14,516 6 138.030 61 5,647 2 726,592Rhode Island 2,346 16 2.519 17 9.095 so 1,087 7 15,047South Carolina 45,101 69 462 1 19,551 30 365 1 65,479South Dakota 140 I 101 1 10.780 75 3.338 23 14,359Tennessee 51.034 40 394 " 75.795 59 482 127,705Texas 77,567 17 272,323 60 97.181 22 3.631 1 450,702Utah 526 2 3,292 10 25.473 78 3,221 10 32.512Vermont 79 1 31 11.131 98 153 1 11,394Virginia 34.488 47 1,503 2 37,287 50 810 1 74,088Washington 4.492 7 9,662 16 40,755 68 5,374 9 60.283West Virginia 2.015 6 49 31.186 94 55 33.305Wisconsin 17,559 25 3,941 6 45.876 65 3,084 4 70,460Wyoming 77 1 643 12 4,160 79 374 7 5,254
Puerto Rico 0 0 274,853 100 0 0 0 0 274,853Bureau of Indian Affairs 0 0 0 0 0 0 18,777 100 18,777
I Nation 1.590.927 27 1.608,146 28 2,316,446 40 288,353 5 5,803,872 I
* Less than one percent
Percents &Cross may not add to 100 due [0 rounding.
35 4 4BEST COPY AVAItABLE

Tab
le 1
.18
Num
ber
and
Perc
ent o
f C
hapt
er 1
Par
ticip
ants
by
Rac
ial/E
thni
c C
lass
ific
atio
n,19
79-8
0 th
roug
h 19
91-9
2
Yea
r
Nat
ive
Am
eric
anor
Asi
anPe
rcen
t of
Tot
al
Bla
ck,
Not
His
pani
c
Perc
ent o
fT
otal
His
pani
c
Perc
ent o
fT
otal
Whi
te,
Not
His
pani
c
Perc
ent o
fT
otal
Tot
alR
acia
l/E
thni
c
1979
-80
173,
685
41,
371,
304
3070
2,94
015
2,32
4,43
351
4,57
2,36
219
80-8
118
6,12
04
1,29
9,72
530
859,
108
202,
049,
795
474,
394,
748
1981
-82
131,
789
41,
002,
116
2958
2,40
817
1,69
9,03
050
3,41
5,34
319
82-8
313
8,72
14
1,04
0,51
030
730,
669
211,
558,
123
453,
468,
023
1983
-84
188,
138
51,
122,
407
2892
4,51
723
1,74
7,69
144
3,98
2,75
319
84-8
517
4,87
04
1,25
2,81
729
898,
994
211,
962,
436
464,
289,
117
1985
-86
192,
984
41,
319,
907
281,
106,
902
242,
089,
988
444,
709,
781
1986
-87
199,
585
41,
301,
106
281,
144,
865
242,
054,
558
444,
700,
114
1987
-88
226,
491
51,
367,
197
281,
231,
874
252,
121,
428
434,
946,
990
1988
-89
227,
938
5.
1,36
8,89
327
1,27
5,52
625
2,16
5,59
143
5,03
7,94
8
1989
-90
244,
177
51,
445,
326
281,
359,
025
262,
162,
953
425,
211,
481
1990
-91
256,
746
51,
487,
977
281,
439,
549
272,
183,
894
415,
368,
166
1991
-92
288,
353
51,
590,
927
271,
608,
146
282,
316,
446
405,
803,
872
4 5 E
NB
ININ
MI M
IMI M
I MU
NN
MI-
- M
I NM
in=
I M
INI

Table 1.19
Chapter 1 Participants by Year of Birth -- 1990-91 and 1991-92
Year of BirthY
1990-91 1991-92PercentChange
inNumberNumber PercentR Number PercentS
Born 1989-85 (preschool) 450,102 8 518,784 9 15Born 1991-86
Born 1984-79 (elementary) 3,620,528 67 3,884,025 67 7Born 1985-80
Born 1978-76 (junior high) 947,685 18 1,014,314 17 10Born 1979-77
Born 1975-73 (high school) 329,600 6 359,045 6 9Born 1976-74
Born 1972-68 (> 18 yrs old) 36,308 1 49,223 1 36Born 1973-68
Total 5,384,223R 100 5,825,391R 100 8
a/ Percents may not add to 100 due to rounding.
b/ The year ranges for 1991-92 are indented below the year ranges for 1990-91.
c/ In 1990-91, the total number on this table will not correspond to the total on Table 1.1because in 17 States, the total number reported by year of birth was not the same as the totalnumber reported by grade. The largest difference was found in California, which reported143,986 fewer participants by year of birth than by grade.
d/ In 1991-92, the total number on this table will not correspond to the total on Table 1.1because in 19 States, the total number reported by year of birth was not the same as the totalnumber reported by grade. The largest difference was found in California, which reported69,485 fewer participants by year of birth than by grade.
37
4 7

Table 1.20
Chapter 1 Participants by Gender -- 1990-91 and 1991-92
Gender
1990-91 1991-92
Number Percent Number Percent
Male
Female
2,928,631
2,457,820
54
46
3,153,027
2,647,941
54
46
Total 5,386,45 PI 100 5,800,968' 100
a/ In 1990-91, the total number on this table will not correspond to thetotal on Table 1.1 because in 16 States, the total number reported bygender was not the same as the total number reported by grade. Thelargest difference was found in California, which reported 139,980fewer participants by gender than by grade.
b/ In 1991-92, the total number on this table will not correspond to thetotal on Table 1.1 because in 18 States, the total number reported bygender was not the same as the total number reported by grade. Thelargest difference was found in California, which reported 93,897 fewerparticipants by gender than by grade.
38
4 6
1

Table 1.21
Number and Percent of Public Chapter 1 StudentsEligible, by State, 1990-91 and 199 1-92
Number of Public StudentsEligible for Chapter 1
Number of PublicChapter 1 Participants
Percent of EligibleServed ai
State 1990-9 1 1991-92 1990-91 1991-92 1990-9 1 1991-92Alabama 194,145 196,554 127,166 131,989 66 67Alaska 20,144 25,578 5,758 7,278 29 28Arizona 214,704 246,387 78,898 83,048 37 34Arkansas 149.477 148,811 71,344 75,538 48 51
California 1,062,979 1,118,440 1,062,978 1.113,191 100 100Colorado 237,410 254,171 36,634 37,390 15 15
Connecticut 60.826 74,724 46,303 50,063 76 67Delaware 9,407 11,003 9,410 10.040 100 91
District of Columbia 17,501 17,082 13,849 14,071 79 82Florida 391.356 499,318 171,382 178.539 44 36Georgia 262.989 306,962 141,731 153,565 54 50Hawaii 14.500 16,849 14,482 14,585 100 87Idaho 40,832 44,409 21,635 25,453 53 57Dlinois 215.174 212,853 153,382 164,362 71 77Indiana 253.438 249,172 85,598 85,448 34 34Iowa 89.402 96,091 35,817 34,739 40 36Kansas 60.880 59,813 32,762 34,078 54 57Kentucky 178.529 195,967 95,408 103,488 53 53Louisiana 222,496 140,125 103,513 131,524 47 94Maine 52.691 50,006 26,025 27,624 49 55Maiyland 109,836 97,702 65,794 64,711 60 66Massachusetts 103,004 113,568 70,584 89,294 69 79Michigan 249,373 269.387 156,575 171,204 63 64Minnesota 110,159 136,283 65,940 72,568 60 53Mississippi 185.030 200,795 143.087 155,004 77 77Missouri 208,340 2.55,856 76,905 88,711 37 35Montana 30,756 31,905 12,791 14,760 42 46Nebraska 64,081 65,201 25,077 26,956 39 41Nevada 24,765 27,801 9,574 10.924 39 39New Hampshire 38.465 37,952 12,678 13.403 33 35New Jersey 167,368 167,463 167,368 165.400 100 99New Mexico 65,358 71,941 37,154 42,137 57 59New York 490,025 592,118 364,178 400,499 74 68North Carolina 245,459 245,240 114,528 123,340 47 50North Dakota 16,830 17,408 9,681 10,421 58 60Ohio 495,146 548,859 139,521 133.202 28 24Oklahoma 172,606 224,333 56,750 57,760 33 26Oregon 61,962 '76,348 43,903 46,432 71 61
Pennsylvania 202,883 206.570 202,883 206,570 100 100Rhode Island 34.245 54,606 14,538 13,870 42 2.5
South Carolina 181,925 219,028 60,636 64,864 33 30South Dakota 32,989 33,233 12,814 13,641 39 41Tennessee 167,972 210.382 116,881 126,201 70 60Texas 398,267 443,351 392,385 443,351 99 100Utah 44,494 52,455 31,135 32,512 70 62Vermont 20,013 33,561 9,886 11,118 49 33Virginia 120,416 130,669 71,402 73,459 59 56Washington 169,800 117,854 58,466 58,854 34 50West Virginia 36.659 35,902 36,126 33,111 99 92Wisconsin 120.156 132,611 63,193 66,902 53 50Wyoming 12,641 15,958 4,955 5,186 39 32
Puerto Rico 352,548 353,171 2.53,510 263,557 72 75Bureau of Indian Affairs 17,168 39,507 17.168 18,777 100 48
Nation 8,499.619 9,223,330 5,252,141 5,594,718 62 61
a/ Percent of eligible students receiving services should not be compared across Statesas eligibility criteria vary based on the decisions made by State and local education officials.
39
BEST COPY AVAILABLE 4 3
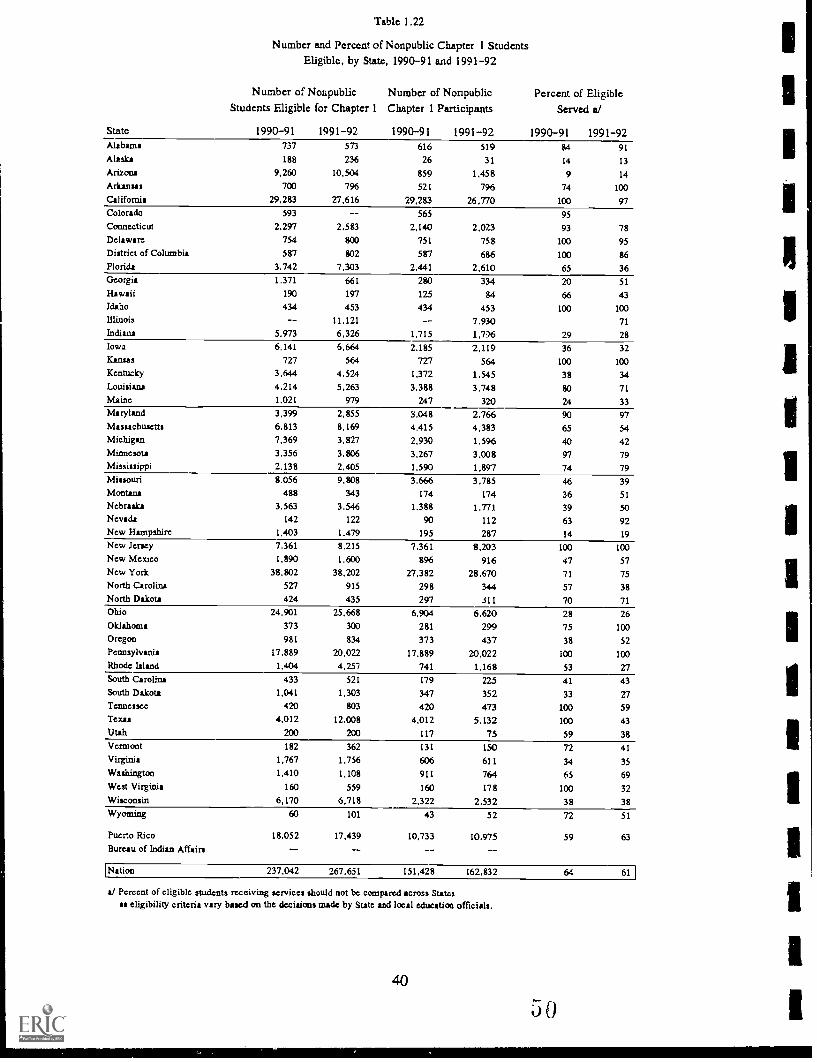
Table 1.22
Number and Percent of Nonpublic Chapter 1 StudentsEligible, by State, 1990-91 and 1991-92
State
Number of NonpublicStudents Eligible for Chapter 1
1990-91 1991-92
Number of NonpublicChapter 1 Participants
1990-91 1991-92
Percent of EligibleServed a/
1990-91 1991-92Alabama 737 573 616 519 84 91Alaska 188 236 26 31 14 13
Arizona 9,260 10,504 859 1,458 9 14
Arkansas 700 796 521 796 74 100
California 29,283 n.616 29,283 26,770 100 97Colorado 593 -- 565 95Connecticut 2,297 2,583 2,140 2,023 93 78Delaware 754 800 751 758 100 95District of Columbia 587 802 587 686 100 86Florida 3,742 7,303 2,441 2,610 65 36Georgia 1,371 661 280 334 20 51
HIV/Jai 190 197 125 84 66 43Idaho 434 453 434 453 100 100Illinois -- 11,121 -- 7.930 71
Indiana 5.973 6,326 1,715 1,706 29 28Iowa 6,141 6,664 2.185 2.119 36 32Kansas 727 564 727 564 100 100Kentucky 3.644 4.524 1,372 1,545 38 34Louisiana 4,214 5,263 3,388 3,748 80 71Maine 1.021 979 247 320 24 33Maryland 3,399 2,855 3.048 2,766 90 97Massachusetts 6,813 8,169 4,415 4,383 65 54Michigan 7,369 3,827 2,930 1.596 40 42Minnesota 3,356 3,806 3,267 3,008 97 79Mississippi 2.138 2,405 1,590 1,897 74 79Missouri 8.056 9,808 3,666 3,785 46 39Montana 488 343 174 174 36 51
Nebraska 3,563 3,546 1,388 1,771 39 50Nevada 142 122 90 112 63 92New Hampshire 1.403 1.479 195 287 14 19New Jersey 7,361 8,215 7,361 8,203 100 100New Mexico 1,890 1.600 896 916 47 57New York 38,802 38,202 27,382 28,670 71 75North Carolina 527 915 298 344 57 38North Dakota 424 435 297 311 70 71Ohio 24,901 25,668 6,904 6,620 28 26Oklahoma 373 300 281 299 75 103Oregon 981 834 373 437 38 52Pennsylvania 17,889 20,022 17.889 20,022 100 100Rhode Island 1,404 4,251 741 1,168 53 27South Carolina 433 521 179 225 41 43South Dakota 1,041 1,303 347 352 33 27Tennessee 420 803 420 473 100 59Texas 4,012 12,008 4,012 5,132 100 43Utah 200 200 117 75 59 38Vermont 182 362 131 150 72 41Virginia 1,767 1,756 606 611 34 35Waahington 1,410 1,108 911 764 65 69West Virginia 160 559 160 178 100 32Wisconain 6,170 6.718 2,322 2,532 38 38Wyoming 60 101 43 52 72 51
Puerto Rico 18.052 17.439 10,733 10.975 59 63Bureau of Indian Affairs
Nation 237.042 267.651 151,428 162,832 64 61 I
a/ Percent of eligible students receiving services should not be compared across Statesas eligibility criteria vary based on the decisions made by State and local education officials.
40
5 0

1
Number and Percewith Disabilities,
Table 1.23
nt of Total Chapter 1 Participantsby State, 1990-91 and 1991-92
Total Chapter 1Participants
Total Chapter I Studentswith Disabilities Percent of Total
State 1990-91 1991-92 1990-91 1991-92 1990-91 1991-92Alabama 129,131 134,138 4,684 8,264 4 6
Alaska 5,828 7.520 815 1.174 14 16
Arizona 80,642 86,177 2,015 2,481 2 3
Arkansas 72,050 76,588 2,138 2.316 3 3
California 1,164.728 1,209,900 61,080 70,979 5 6
Colorado 37,800 38,550 3,499 2380 9 7
Connecticut 50,123 53,526 3,058 3.539 6 7
Delaware
District of ColumbiaFlorida 182,145 190,193 25,815 26,282 14 14
Georgia 142,554 154.890 6,378 7,672 4Hawaii 14,607 14,669 217 282 1 2
Idaho 22,184 26.027 1,031 1.020 5 4
Illinois 160,479 173,650 6,459 8,816 4 5
Indiana 94,258 94,167 9,050 9,847 10 10
Iowa 38,630 37 .782 1.794 1,449 5 4
Kansas 35.065 36,400 1.320 1,377 4 4
Kentucky 97,786 105,964 3,269 3,152 3 3
Louisiana 108,791 137.433 743 645 1
Maine 26,288 27,963 1.669 1,893 6 7
Maryland 69,901 68,601 4,141 4,169 6 6
Massachusetts 75,432 94,272 5,350 9,436 7 10
Michigan 159,806 172,904 3,373 3,386 2 2
Minnesota 71.397 77.791 5,597 5,910 8 8
Mississippi 145,192 157.077 825 636 1
Missouri 81,471 93.634 3,147 3,313 4 4
Montana 13,801 15,567 1,132 1,253 8 8
Nebraska 27,218 30.194 1,748 1,818 6 6
Nevada 10.206 11,548 176 357 2 3
New Hampshire 13.149 13.880 851 1,090 6 8
New Jersey 176.639 175,419 3,263 3,723 2 2
New Mexico 39,032 44,276 1,517 2.649 4 6
New York 399,499 438.727 18,790 19,838 5 5
North Carolina 115,526 124,424 3,545 829 3 1
North Dakota 10.037 10.806 465 420 5 4
Ohio 151.347 146,343 4,014 6,496 3 4Oklahoma 57,506 58,595 1.956 1,972 3 3
Oregon 44,693 48,459 4,265 5.104 10 11
Pennsylvania 224,570 230,938 65 313Rhode Island 15,361 15.107 1,147 918 7 6
South Carolina 61.187 65,479 6,086 6,579 10 10
South Dakota 13.498 14,359 988 1,132 7 8
Tennessee 118.188 127,728 5,859 9,612 5 8
Texas 402,283 455,359 24,534 42,000 6
Utah 31,252 32.587 3,051 2.409 10 7Vermont 10,086 11,394 1,205 1,331 12 12
Virginia 72,025 74,088 2,340 2,593 3 3
Washington 60,091 60,283 4,337 4.366 7 7West Virginia 36,334 33.332 906 943 2 3
Wisconsin 66,326 70.466 3,074 3.521 5 5
Wyoming 5(315 5.25.4 357 363 7
Puerto Rico 264,648 274.853 4,568 2.767 2 1
Bureau of Indian Affairs 17,168 18.777 1,852 1,679 11 9
NAtion a/ 5,522,973 5.878,058 259.558 306,893 55-1
Less than one percent
a/ The total participation figures reported here are only for those States that reported disability data. As a result, the total fiugreswill not match the participation figures reported in Table 1.1.
41

Table 1.24
Number and Percent of Total Chapter 1 Participantswith Limited English Proficiency, 1990-91 and 1991-92
Total Chapter 1Participants
Total Chapter 1 Studentswith Limited English
Proficiency Percent of Total
State 1990-91 1991-92 1990-91 1991-92 1990-91 1991-92Alabama 129,131 134,138 6./ 1.131 1
Alaska 5.828 7,520 1,087 1,316 19 18
Arizona 80.642 86,177 13.555 15,938 17 18
Arkanus 72,050 76,588 115 117
California 1,164,728 1,209,900 464,352 523,029 40 43Colorado 37,800 38,550 1,507 1,682 4 4Connecticut 50,123 53,526 8,447 8,467 17 16
Delaware 10,161 10,798 104 222 1 2
District of Columbia 14,436 14,763 375 558 3 4Florida 182,145 190,193 6,300 20,555 3 11
Georgia 142,554 154,890 600 828 1
Hawaii 14,607 14,669 750 863 5 6
Idaho 22,184 26,027 1,926 2,132 9 8Illinois 160,479 173,650 4.312 8,795 3 5Indiana 94,258 94,167 314 485 1
Iowa 37,782 -- 407 1
Kansas 35,065 36,4C0 528 648 2 2
Kentucky 97,786 105,964 146 89Louisiana 108,791 137,433 433 208Maine 26.288 27,963 152 172 1 1
Maryland 69,901 68,601 1,508 1,370 2 2
i. asiichusetts 75,432 94,272 7,345 17,120 10 18
Michigan 159.806 172,904 3.379 4,580 2 3Minnesota 71,397 77,791 2,294 3,978 3 5Mississippi 145.192 157,077 215 259Minouri 81.471 93,634 187 79Montana 13,801 15,567 1.124 1,040 8 7Nebraska 27,218 30,194 171 156 1 1
Nevada 10,206 11,548 247 514 2 4New Hampshire 13.149 13.880 87 206 1 1
New Jersey 176,639 175,419 14.072 16,913 8 10
New Mexico 39.032 44,276 7,059 11,681 18 26New York 399,499 438,727 63,733 72,495 16 17
North Carolina 115.526 124,424 450 4,909 4North Dakota 10.037 10,806 205 220 2 2Ohio 151.347 146,343 1,516 737 1 1
Oklahoma 57.506 58,595 1.588 1,405 3 2Oregon 44,693 48,459 1,643 2,310 4 5
Pennsylvania 224,570 230,938 4,915 3.266 2 1
Rhode Island 15.361 15,107 860 1,991 6 13
South Carolina 61,187 65,479 154 131
South Dakota 13.498 14,359 253 725 2 5
Tennessee 118,188 127,728 175 348Texas 402,283 455,359 86.866 122,945 22 27Utah 31.252 32,587 1,394 1,520 4 5
Vermont 10,086 11,394 23 35 *
Virginia 72,025 74,088 345 445 1
Washington 60,091 60,283 3,491 4,415 6 7
West Virginia 36,334 33,332 53 26Wisconsin 66.326 70,466 1.703 1,656 3 2Wyoming 5.015 5,254 66 94 1 2
Puerto Rico 264,648 274.853 255.601 158,872 97 58Bureau of Indian Affairs 17,168 18,777 5,422 6,466 32 34
I Nation a/ 5,508,940 5,903,619 973,214 1,030,549 18 17 I
Less than one percent
a/ The total participation figures reported here are only for those States that reported limited English proficiency data. As aresult, the total figures will not match the participation figures reported in Table 1.1.
42
5'

Table 1.25
Number of Schools with Schoolwide Projects,by State, 1990-91 and 1991-92
Number of Schools withSchool wide Projects
State 1990-91 1991-92Alabama 68 59Alaska 6 9Arizona 36 56Arkanus 34 47California 259 773Colorado 2 4ConnecticutDelaware
District of Columbia 17Florida 113 136Georgia 28 43HawaiiIdaho 4 3
Illinois 13 25Indiana 6 7Iowa 1 1
Kansas 1 19Kentucky 59 79Louisiana 12 20Maine --Maryland 29 30Massachusetts 44 78Michigan 36 92Minnesota 2 4MI ssissippi 86 124Missouri 10 41Montana
NebraskaNevada
New HampshireNew Jersey 16 25New Mexico 2_5 39New York 122 145
North Carolina 37 65North Dakota 1 2Ohio 30 60Oklahoma 7 7Oregon 10 12Pennsylvania 104 136
Rhode Island 1 3
South Carolina 7 34South Dakota 12 12Tennessee 130 129Texas 164 278Utah 4 12Vermont --Virginia 7 16Washington 3 3
West Virginia 23 23Wisconsin 20 20Wyoming
Puerto Rico 9 50BUIVAII of Indian Affairs 48 68
Total Among thoseStates that Reported Data 1.629 2.306
Number of States Reporting 42 43
4353

Table 1.26
Number of LEAs Operating Innovation Projects,by State, 1990-91 and 1991-92
Number of LEAs OperatingInnovation Projects
State 1990-91 1991-92Alabama 2 2
Alaska 4 1
Arizona 6 7
Arkansas 5 7California 66 73
ColoradoConnecticutDelawareDistrict of ColumbiaFlorida 1 2
Georgia 6
HawaiiIdaho
Illinois 20 1
IndianaIowa
KansasKentucky 1
LouisilD2MaineMaryland 17 19
MassachusettsMichiganMinnesota 7 9
Mississippi 20 11
MissouriMontanaNebraskaNevada 1 2New HampshireNew Jersey 5 28New Mexico 2 2New York 124 34North Carolina 1 3
North Dakota 1 2Ohio 1 1
Oklahoma --Oregon 1 1
Pennsylvania 17 18
Rhode Island 2 2
South Carolina 1 1
South Dakota 1
Tennessee 16 7Texas 28Utah 8 5
Vermont 7 10
VirginiaWashingtonWest VirginiaWisconsin 30
Wyoming
Puerto RicoFureau of Indian Affairs 3
Total Among thoseStates that Reported Data 371 320
Number of States Reporting 29 28
44

1
Table 2.1
Basic Skills Reading Achievement Results for Chapter 1Students Tested on an Annual Cycle 1991-92
Grade
WeightedNumberTested
Number ofStates
Reporting
Percentile
Pretest Posttes'. Change
2 315,549 42 18 24 63 341,247 42 18 24 64 315,514 43 20 25 55 283,296 43 20 24 46 '20,778 43 20 24 47 139,069 42 19 24 58 125,836 41 20 23 39 67,489 39 21 24 3
10 37,484 37 21 23 211 26,197 36 21 23 212 12,680 36 17 18 1
Grades 2-12 forthe 42 States that
reported data
1,885,149 19 24 5
Table 2.2
Basic Skills Mathematics Achievement Results for Chapter 1Students Tested on an Annual Cycle -- 1991-92
Grade
WeightedNumberTested
Number ofStates
Reporting
Percentile
Pretest Posttest Change
2 163,605 41 22 33 11
3 196,216 42 22 30 84 203,756 43 22 ..)0 85 193,905 43 23 29 66 154,866 43 23 29 67 93,114 43 22 26 48 94,089 40 22 25 39 43,749 38 21 25 410 24,793 36 19 23 411 17,537 34 21 25 412 9,219 34 24 25 1
Grades 2-12 forthe 42 States that
reported data
1,194,849 22 29 7
45 55

Table 2.3
Basic Skills Other Language Arts Achievement Results forChapter 1 Students Tested on an Annual Cycle -- 1991-92
Grade
WeightedNumberTested
Number ofStates
Reporting
Percentile
Pretest Posttest Change
2 51,285 33 18 22 43 67,159 34 17 23 64 64,284 35 19 24 5
5 66,204 36 21 25 46 62,984 35 21 26 5
7 42,960 36 20 24 48 47,494 36 22 24 29 31,586 32 21 23 2
10 18,395 32 19 21 2
11 14,380 28 19 22 2
12 8,547 28 20 20 0
Grades 2-12 forthe 36 States that
reported data
475,278 20 24 4
1
1
46
150
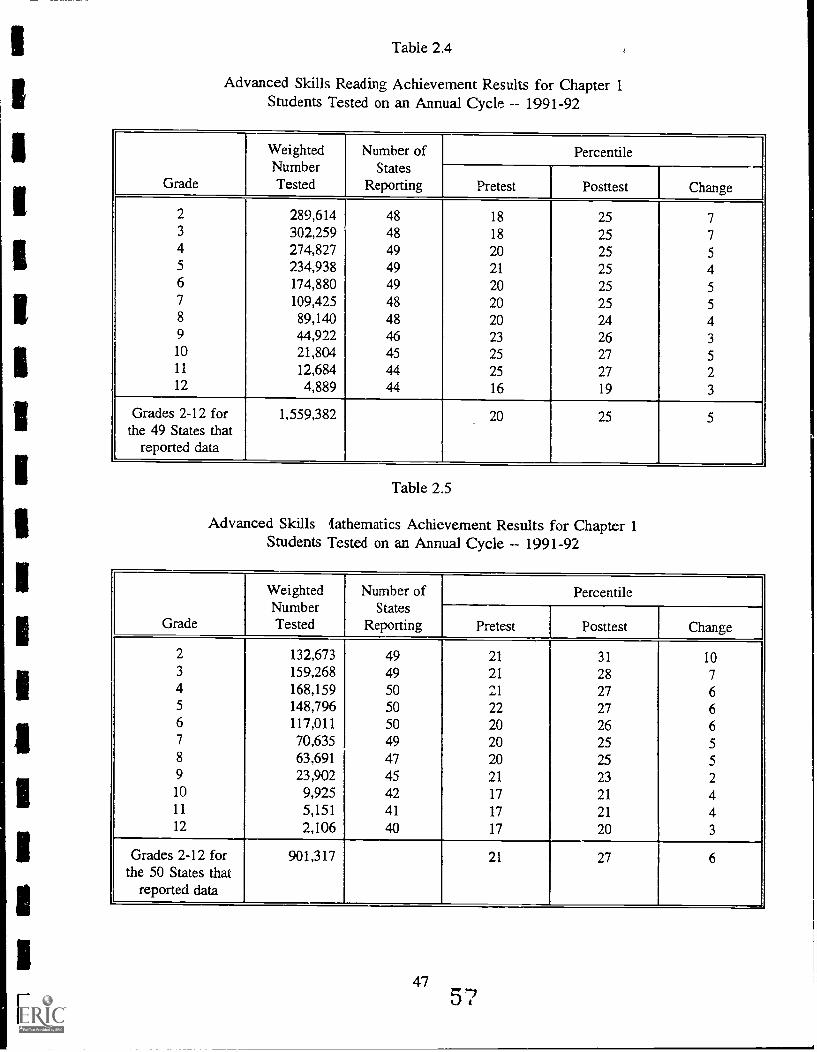
1
1
1
Table 2.4
Advanced Skills Reading Achievement Results for Chapter 1Students Tested on an Annual Cycle 1991-92
Grade
WeightedNumberTested
Number ofStates
Reporting
Percentile
Pretest Posttest Change
2 289,614 48 18 25 73 302,259 48 18 25 74 274,827 49 20 25 55 234,938 49 21 25 46 174,880 49 20 25 57 109,425 48 20 25 58 89,140 48 20 24 49 44,922 46 23 26 310 21,804 45 25 27 511 12,684 44 25 27 212 4,889 44 16 19 3
Grades 2-12 forthe 49 States that
reported data
1,559,382 20 25 5
Table 2.5
Advanced Skills lathematics Achievement Results for Chapter 1Students Tested on an Annual Cycle -- 1991-92
Grade
WeightedNumberTested
Number ofStates
Reporting
Percentile
Pretest Posttest Change
2 132,673 49 21 31 103 159,268 49 21 28 74 168,159 50 21 27 65 148,796 50 22 27 66 117,011 50 20 26 67 70,635 49 20 25 58 63,691 47 20 25 59 23,902 45 21 23 210 9,925 42 17 21 4ll 5,151 41 17 21 412 2,106 40 17 20 3
Grades 2-12 forthe 50 States that
reported data
901,317 21 27 6
4757

Table 2.6
Basic Skills Reading Achievement Results Expressed in NCEs for Chapter 1Students Tested on an Annual Cycle -- 1991-92
Grade
WeightedNumberTested
Number ofStates
Reporting
NCE
Pretest Posttest Change'
2 315,549 42 31.4 35 7 4.33 341,247 42 31.3 35.7 4.44 315,514 43 32.6 35.9 3.35 283,296 43 33.0 35.8 2.86 220,778 43 32.7 35.5 2.87 139,069 42 32.0 35.2 3.28 125,836 41 32.9 35.1 2.29 67,489 39 33.4 35.5 2.110 37,484 37 33.4 35.0 1.611 26,197 36 33.2 34.9 1.712 12,680 36 30.5 30.8 0.3
Grades 2-12 forthe 42 States that
reported data
1,885,149 32.2 35.6 3.4
Table 2.7
Basic Skills Mathematics Achievement Results Expressed in NCEs for Chapter 1Students Tested on an Annual Cycle -- 1991-92
Grade
WeightedNumberTested
Number ofStates
Reportiqg
NCE
Pretest Posttest Change
2 163,605 41 34.4 41.1 6.73 196,216 42 34.3 39.2 4.94 203,756 43 34.1 39.1 5.05 193,905 43 35.0 38.4 3.46 154,866 43 34.5 38.6 4.1
7 93,114 43 33.8 36.6 2.88 94,089 40 34.3 35.9 1.69 43,749 38 33.4 35.8 2.410 24,793 36 31.9 34.6 2.711 17,537 34 33.4 36.1 2.712 9,219 34 35.1 36.2 1.1
Grades 2-12 forthe 42 States that
reported data
1,194,849 34.3 38.5 4.2
48
II
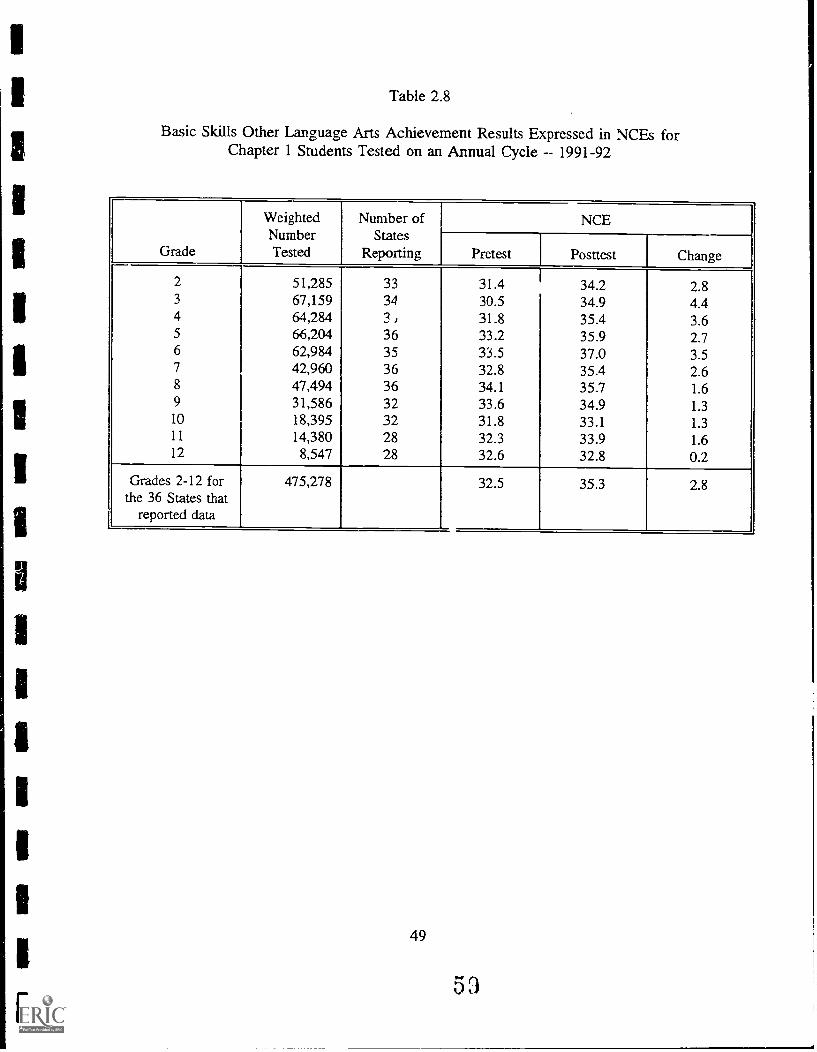
1
1
It
Table 2.8
Basic Skills Other Language Arts Achievement Results Expressed in NCEs forChapter 1 Students Tested on an Annual Cycle -- 1991-92
Grade
WeightedNumberTested
Number ofStates
Reporting
NCE
Pretest Posttest Change
2 51,285 33 31.4 34.2 2.83 67,159 34 30.5 34.9 4.44 64,284 I , 31.8 35.4 3.65 66,204 36 33.2 35.9 2.76 62,984 35 33.5 37.0 3.57 42,960 36 32.8 35.4 2.68 47,494 36 34.1 35.7 1.69 31,586 32 33.6 34.9 1.310 18,395 32 31.8 33.1 1.311 14,380 28 32.3 33.9 1.612 8,547 28 32.6 32.8 0.2
Grades 2-12 forthe 36 States that
reported data
475,278 32.5 35.3 2.8
49
53

Table 2.9
Advanced Skills Reading Achievement Results Expressed in NCEs for Chapter 1Students Tested on an Annual Cycle -- 1991-92
Grade
WeightedNumberTested
Number ofStates
Reporting
NCE
Pretest Posttest Change
2 289,614 48 31.4 36.3 4.93 302,259 48 31.5 36.2 4.74 274,827 49 32.5 36.3 - 1.85 234,938 49 33.1 35.8 2.76 174,880 49 32.6 36.0 3.47 109,425 48 32.6 35.9 3.38 89,140 48 32.9 35.7 2.89 44,922 46 34.9 36.9 2.010 21,804 45 36.0 37.5 1.511 12,684 44 36.2 37.5 1.312 4,889 44 29.5 32.2 2.7
Grades 2-12 forthe 49 States that
reported data
1,559,382 32.4 36.1 3.7
Table 2.10
Advanced Skills Mathematics Achievement Results Expressed in NCEs for Chapter 1Students Tested on an Annual Cycle 1991-92
Grade
WeightedNumberTested
Number ofStates
Reporting
NCE
Pretest Posttest Change
2 132,673 49 33.5 40.1 6.63 159,268 49 33.3 38.2 4.94 168,159 33.3 37.6 4.35 148,796 50 33.7 37.5 3.86 117,011 50 32.9 37.0 4.17 70,635 49 32.5 36.1 3.68 63,691 47 33.0 36.1 3.19 23,902 45 33.1 35.1 2.010 9,925 42 30.7 33.1 2.411 5,151 41 29.9 33.5 3.612 2,106 40 29.9 32.9 3.0
Grades 2-12 forthe 50 States that
reported data
901,317 33.2 37.6 4.4
50
1
1
1

Table 2.11
Number and Percent of Chapter 1 Schools Identifiedfor Program Improvement, by State, 1990-91 and 1991-92
Number of Schoolswith Chapter 1
Number of Chapter 1Schools Identified
for Program Improvement a/
Percent of Chapter 1 SchoolsIdentified for Program
Improvement
State 1990-91 1991-92 1990-91 1991-92 1990-91 1991-92Alabama 921 932 219 455 24 49Alaska 178 186 33 22 19 12Arizona 572 601 166 190 29 32Arkansas 907 1,087 230 405 25 37California 3,877 4.062 797 396 8 10Colorado 616 553 96 110 16 20Connecticut 618 595 47 70 8 12Delaware 110 110 8 11 7 10District of Columbia 136 120 64 74 47 62Florida 1,011 1,087 356 365 35 14
Georgia 1.078 1,106 266 228 25 21Hawaii 103 100 56 58 54 58Idaho 397 410 100 100 25 24Illinois 2,365 2,396 426 726 18 30Indiana 1,126 1.116 326 199 29 18Iowa 896 899 89 105 10 12Kansas 739 740 130 126 18 17Kennzcky 960 988 109 284 11 29Louisiana 830 826 310 346 37 42Maine 551 551 60 100 11 18Maryland 404 411 283 208 70 51Massachusetts 983 1,071 178 139 18 13Michigan 2,073 2.035 429 638 21 31Minnesota 997 1,010 109 153 11 15Mississippi '778 757 478 412 61 54Missouri 1,036 1,049 233 197 22 19Montana 581 582 67 29 12 5Nebraska 322 315 180 213 56 67Nevada 107 132 12 15 11 11New Hampshire 305 319 40 16 13 5New Jersey 1,896 1.962 292 287 15 15New Mexico 442 442 97 91 22 21New York 2,915 3,121 206 285 7 9North Carolina 1,313 1,320 458 465 35 35North Dakota 350 328 56 50 16 15Ohio 2,371 2.348 264 386 11 16Oklahoma 1,086 1,064 90 91 8 9Oregon 790 790 16 32 2 4Pennsylvania 2.312 2,320 705 587 30 25Rhode Island 154 159 73 71 47 45South Carolina 540 534 112 158 21 30South Dakota 432 439 90 58 21 13Tennessee 908 916 508 327 56 36Texas 5.520 5,520 616 605 11 11
Utah 274 280 61 47 22 17Vermont 299 299 70 70 23 23Virginia 885 866 200 225 23 26Washington 955 918 90 106 9 12
West Virginia 579 535 151 180 26 34Wisconsin 1,379 1,378 370 332 27 24Wyoming 129 134 13 18 10 13
Puerto Rico 1,360 1,505 184 967 14 64Bureau of Indian Affairs 167 169 116 108 69 64
I Nation 52,633 53.494 10,235 11,936 19 22 j
a/ Schools may be identified for program improvement for more than one year.As a result, the total figures from one year to the next may include someof the same schools.
5161
BEST COPY AVAILABLE

Table 2.12
Number of LEAs with Schools Identified forProgram improvement, by State, 1990-91 and 1991-92
State
Number of LEM1990-91 1991-92
Alabama 62 87
Alaska 15 10
Arizona 82 90
Arkansas 124 146
California 86 97
Colorado 52 71
Connecticut 22 30
Delaware 8 6
District of Columbia 1 1
Florida 44 51
Georgia 85 88
Hawaii 7 7
Idaho 48 52
Illinois 192 205
Indiana 139 88
Iowa 71 76
Kansas 65 60
Kentucky 60 123
Louisiana 50 44
Maine 38 60
Maryland 20 20
Massachusetts 59 43
Michigan 175 251
Mirmesota 79 99
Mississippi 121 115
Missouri 122 129
Montana 53 25
Nebraska 113 124
Nevada 7 6
New Hampshire 25 13
New Jersey 162 145
New Mexico 30 24
New York 121 53
North Carolina 102 103
North Dakota 38 33
Ohio 109 144
Oklahoma 65 71
Oregon 15 18
Pennsylvania 247 206
Rhode Island 20 23
South Carolina 65 51
South Dakota 66 41
Tennessee 139 88
Texas 242 211
Utah 23 22
Vermont 32 31
Virginia 64 61
Washington 42 56
West Virginia 37 47
Wisconsin 148 140
Wyoming 8 15
Puerto Rico 1 100
Bureau of Indian Affairs 116 108
Fat' ic, 3.917 4,008
52

Table 3.1
Chapter 1 LEA Program Allocations and Participation1990-91 and 1991-92
Basic and ConcentrationGrants Combined Total Chapter 1 Participation
Percent PercentState 1990-91 1991-92 Change 1990-91 1991-92 ChangeAlabama $103,648,970 $121,559,125 17 129.131 134,138 4Alaska 7,871,670 9,039,059 15 5.828 7,520 29Anzona 52,616.311 58,873,468 12 80,642 86,177 7Arkansas 57,643,608 67,386,728 17 72,050 76.588 6California 463,174,140 511,559,444 10 1,164,728 1.209,900 4Colorado 42,950,446 4.4,320,124 3 37,800 38,550 2Connecticut 50,454,091 58,508,S83 16 50,123 53,526 7Delaware 13,390,099 15,851,668 18 10,161 10,798 6District of Columbia 22,021,751 2.5,838,942 17 14.436 14,763 2Florida 204,201,699 235,930,168 16 182,145 190,193 4Georgia 130.492,327 160,691,129 23 142,554 15 1 890 9Hawaii 13.440,172 15,063,746 12 14.607 14,669 0Idaho 13,784,286 15,963,264 16 22,184 26,027 17Illinois 224,098,707 270,088,512 21 160,479 173,650 8Indiana 71.751,410 84,502,450 18 94,258 94.167 -0Iowa 39.469,513 43.582,243 10 38,630 37,782 -2Ktnsas 30,706,261 35,667,933 16 35,065 36,400 4Kentucky 85,951.394 100,669,520 17 97.786 105,964 8
Louisiana 115,032,506 134,603,712 17 108,791 137.433 26Maine 22,896,996 27,642,158 21 26.288 27,963 6Maryland 79,058,419 92,137,272 17 69,901 68.601 -2Massachusetts 109,596,178 128,376,639 17 75.432 94.272 25Michigan 184,616,537 215,307,156 17 159,806 172,904 8Minnesota 55,234,446 62.601,024 13 71,397 77,791 9Mississippi 93,466,026 109,345,974 17 145,192 157,077 8
Missoun 80,059,093 93,971,900 17 81,471 93,634 15Montana 13,221,188 14,337,183 8 13,801 15,567 13Nebraska 22,509,710 24,739,701 10 27,218 30,194 11Nevada 8,219,405 12,115,649 47 10,206 11.548 13New Hampshire 11.505,334 12,936,207 12 13.149 13,880 6New Jersey 156,949,117 182,322.803 16 176,639 175,419 -1New Mexico 37,054,810 40,185,168 8 39.032 44.276 13New York 516.825,606 606,413,788 17 399.499 438,727 10North Carolina 112.045,540 134,520,722 20 115.526 124,424 8North Dakota 9,791,008 13,285,888 36 10,037 10,806 8Ohio 165,715,710 199,388,668 20 151,347 146.343 -3Oklahoma 46,595,384 54,05E,507 16 57,506 58,595 2Oregon 38,312,811 43.294,628 13 44,693 48,459 8
Pennsylvania 231,883.563 Z75.159,841 19 224,570 230,938 3Rhode Island 18.091,544 21,112.145 17 15,361 15,107 -2South Carolina 74,310,903 86,854,170 61,187 65,479 7South Dakota 14.571,984 17,041,718 17 13,498 14,359 6Tennessee 101,478,690 119,194,285 17 118.188 127.728 8Texas 307,473,887 352,572,785 15 402,2E3 455,359 13Utah 16,388.535 18,988,132 16 31,252 32,587 4Vermont 10,740,482 12,425,464 16 10,086 11,394 13Virginia 97,562,531 114,253,374 17 72,025 74,088 3
Washington 53,042,389 58,630,638 11 60,091 60,283 0West Virginia 43,037,845 46,405,373 8 36,334 33,332 -8Wisconsin 68,076,535 80,564,195 18 66.326 70,466 6Wyoming 5,827,410 6.687.103 15 5,015 5.254 5
Puerto Rico 176.099.991 221.583,987 26 264,648 274,853 4Bureau of Indian Affairs 27,3.44,592 31.276,152 14 17,168 18,777 9
Nation $4,752.304,117 55.539.430,016 17 5,5.47,570 5,903,619 9

Table 3.2
Allocation Per Participant for the Chapter 1 LEA Program -1990-91 and 1991-92 a/
State 1990-91
Allocation Per ParticipantPercentChange1991-92
Alabama $803 $906 13
Alaska 1.351 1,202 -11Arizona 652 683 5
Arkansas 800 880 10
California 398 423 6
Colorado 1,136 1,150 1
Connecticut 1,007 1.093 9
Delaware 1,318 1.468 11
District of Columbia 1.52_5 1,750 15
Florida 1.121 1,240 11
Georgia 915 1,037 13
Hawaii 920 1,027 12
Idaho 621 613 -1Illinois 1.396 1,555 11
Indiana 761 897 18
Iowa 1.022 1,154 13
Kansas 876 980 12
Kentucky 879 950 8
Louisiana 1,057 979 -7Maine 871 989 13
Maryland 1,131 1.343 19
Massachusetts 1.453 1,362 -6Michigan 1.155 1,245 8
Minnesota 774 805 4
Mississippi 644 696 8
Missouri 983 1,004 2
Montana 958 921 -4Nebraska 827 819 -1Nevada 805 1,049 10New Hampshire 875 932 7New Jersey 889 1.039 17
New Mexico 949 908 -4New York 1,294 1,382 7North Carolina 970 1,081 11
North Dakota 975 1,229 26Ohio 1,095 1,362 24Oklahoma 810 923 14
Oregon 857 893 4Pennsylvania 1,033 1,191 15
Rhode Island 1,178 1,398 IV
South Carolina 1,214 1.326 9
South Dakota 1,080 1,187 10
Tennessee 85? 933 9
TEX.13 764 774 1
Utah 524 583 11
Vermont 1.065 1,091 2
Virginia 1,355 1,542 14
Washington 883 973 10
West Viq,:iii 1,185 1,392 18
Wisconsin 1,026 1,143 11
Wyoming 1,162 1,273 10
Puerto Rico 665 806 21
Bureau of Indian Affairs 1,593 1.666 5
Nation $857 $938 10
a/ Mae Chapter. 1 allocation per participant figures were computed in the following way:the allocation to the State for a given year war divided by the number of total Chapterpaiticipants the State reported during that year. The allocation information was obtained fromthe El) Budget Office. This calculation does mot take into account funds that may have beencarried cot er from the previous year.
64BEST COPY AVAILABLE

Table 3.3
Number of LEAs Receiving Basic Grants and Number of LEAsReceiving Basic Grants that Also Received Concentration Grants,
by State, 1991-92
State
Number of LEAsthat ReceivedBasic Grants
Number of LEAsthat also Received
ConcentrationGrants
Alsbama 128 124
Alaska 53 35
Arizona 215 138
Arkansas 321 283California 980 347
Colorado 175 62Connecticut 161 14
Delaware 19 13
District of Columbia 1 1
Florida 67 60Georgia 183 147
Hawaii 1 0Idaho 114 82Illinois 881 222
Indiana 292 26Iowa 425 150
Kansas 304 57Kcntucky 175 136
Louisiana 66 61
Maine 181 87Maryland 24 7
Massachusetts 323 27
Michigan 558 140
Minnesota 425 176Mississippi 154 148
Missouri 595 256Montana 314 147
Nebraska 400 210Nevada 16 4New Hampshire 235 132
New Jersey 582 141
New Mexico 88 73New York 717 268
North Carolina 133 107
North Dakota 243 192Ohio 610 163
Oklahoma 565 384
Oregon 244 250Pennsylvania 501 92Rhode Island 38 4South Carolina 91 79South Dakota 172 133
Tennessee 139 103
Texas 960 535
Utah ao 31
Vermont 252 147
Virginia 121 70Washington 284 50
West Virginia 55 51
Wisconsin 421 56
Wyoming 46 19
Puerto Rico 1
Bureau of Indian Affairs a/ 169
Nation 14.308 6.241
a/ The Bureau of Indian Affairs does not receive Concentration Grant funding.
55
6 5
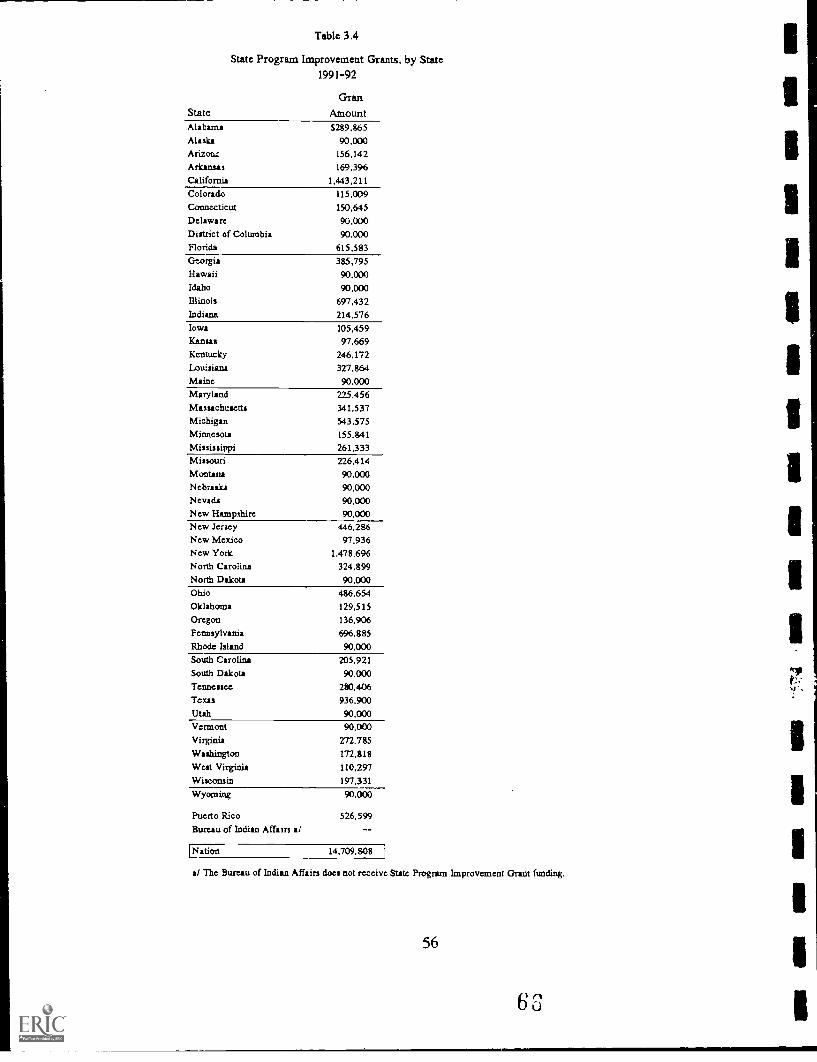
Table 3.4
State Program Improvement Grants, by State1991-92
GranState AmountAlabama $289,865Alaska 90.000Arizon2 156,142Arkansas 169,396California 1,443.211Colorado 115,009Connecticut 150,645Delaware 90,000District of Columbia 90,000Florida 615,583Georgia 385,795Hawaii 90,000Idaho 90,000Illinois 69'7,432Indiana 214.576Iowa 105,459Kansas 97,669Kentucky 246,172Louisiana 327,864Maine 90.000Maryland 225,456Massachusetts 341,537Michigan 543,575Minnesota 155.841Mississippi 261,333Missouri 226.414Montana 90,003Nebraska 90,000Nevada 90,000New Hampshire 90,000New Jersey 446.286New Mexico 97,936New York 1,478,696North Carolina 324,899North Dakota 90,000Ohio 486,654Oklahoma 129,515Oregon 136,906Pennsylvania 696.885Rhode Island 90.000South Carolina 205.921South Dakota 90,000Tennessee 280.406Texas 936,900Utah 90.000Vermont 90,000Virginia 272,785Washington 172,818West Virginia 110,297Wisconsin 197,331
Wyoming 90.000
Puerto Rico 526,599Bureau of Indian Affairs a/
Flatic-Tin 14,709.808
a/ The Bureau of Indian Affairs does not receive State Program Improvement Grant funding.
56

1
Table 4.1
Chapter 1 State Agency Neglected or Delinquent Studentsby Institutional Designation, 1991-92
Number Percent
Neglected 2,822 4
Deliiiquent 39,121 61
Adult Correctional 21,748 34
Total 63,691 100
Table 4.2
Total Chapter 1 State Agency Neglected or Delinquent Studentsby Age Span -- 1990-91 and 1991-92
1990-91 1991-92 PercentChange in
Age Span (Years) Number Pcrcent2" Number Percent!' Number
0 9 209 * 174 * -1710 13 2,812 5 3,219 5 1414 16 23,473 38 24,369 38 417 - 20 35,185 57 35,929 56 2Total 61,679 100 63,691 100 3
* Less than 1 percent.
Percents may not add to 100 due to rounding.
57
67

Table 4.3
Neglected, Delinquent, and Adult Correctional Chapter 1 State AgencyNeglected or Delinquent Students by Age Span -- 1990-91 and 1991-92
Age Span (Years)
1990-91 1991-92 PercentChange inNumberNumber Percent-q Number Percent!'
Neglected
0 - 9 195 8 172 6 -1210 13 662 26 602 21 -914 - 16 1,376 53 1,438 51 517 20 343 13 610 22 78Total 2,576 100 2,822 100 10
Delinquent
0 - 9 14 * 2 * -8610 - 13 2,145 6 2,256 6 514 16 21,420 55 21,521 55 *
17 - 20 15,225 39 15,342 39 1
Total 38,804 100 39,121 100 1
Adult Correctional
0 - 9 0 010 13 5 * 361 2 7,12014 16 677 3 1,410 6 10817 - 20 19,617 97 19,977 92 2Total 20,299 100 21,748 100 7
* Less than 1 percent.
a/ Percents may not add to 100 due to rounding.
58
IIIIIIII1
IIIIIII1

1
Table 4.4
Total Chapter 1 State Agency Neglected or Delinquent StudentsReceiving Chapter 1 Services by Service Area 1991-92
Total
NumberPercentServed
Instructional
Reading 39,584 62
Other Language Arts 20,510 32
Mathematics 40,336 63
Other Instructional 10,285 16
Supporting
Attendance, Social Work, and Guidance 7,755 12
Health and Nutrition 5,376 8
Transportation 148 *
Other Supporting 2,938 5
Participant Counts 63,691
Less than 1 percent.
a/ This figure represents the number of participants reported byinstitutional designation. (See Table 4.1)
59

Table 4.5
Neglected, Delinquent, and Adult Correctional Chapter 1 State AgencyNeglected or Delinquent Students Receiving Chapter 1 Services by
Service Area -- 1991-92
Neglected Delinquent Adult Correctional
NumberPercentServed Number
PercentServed Number
PercentServed
Instructional
Reading 2,285 81 24,725 63 12,574 58
Other Language Arts 83 3 13,340 34 7,087 33
Mathematics 1,799 64 25,873 66 12,664 58
Other Instructional 122 4 7,111 18 3,052 14
Supporting
Attendance, Social Work,and Guidance 49 2 3,383 9 4,323 20
Health and Nutrition 0 -- 1,053 3 77 *
Transportation 0 148 * 0 --
Other Supporting 19 1 2,360 6 559 3
Participant Count!! 2,822 39,121 21,748
* Less than 1 percent.
a/ These figures represent the number of participants reported by institutional designation. (SeeTable 4.1)
60
70

Table 4.6
Chapter 1 State Agency Neglected or Delinquent Students byRacial/Ethnic Classification -- 1990-91 and 1991-92
Racial/Ethnic Classification
1990-91 1991-92PercentChange
inNumberNumber Percent Number Percent
Native American orAlaskan Native 1,095 2 1,135 2 4
Asian or Pacific Islander 1,175 2 906 1 -23
Black, not Hispanic 28,880 47 30,516 48 6
,
Hispanic 9,594 16 10,338 16 8
White, not Hispanic 21,103 34 20,822 33 -1
Total 61,847s 100 63,734S 100 3
a/ In 1990-91 and 1991-92, the totals will not correspond to the totals on Table 4.2because, for both years, the total number reported by racial/ethnic classification wasnot the same as the total number reported by age span.
61
7
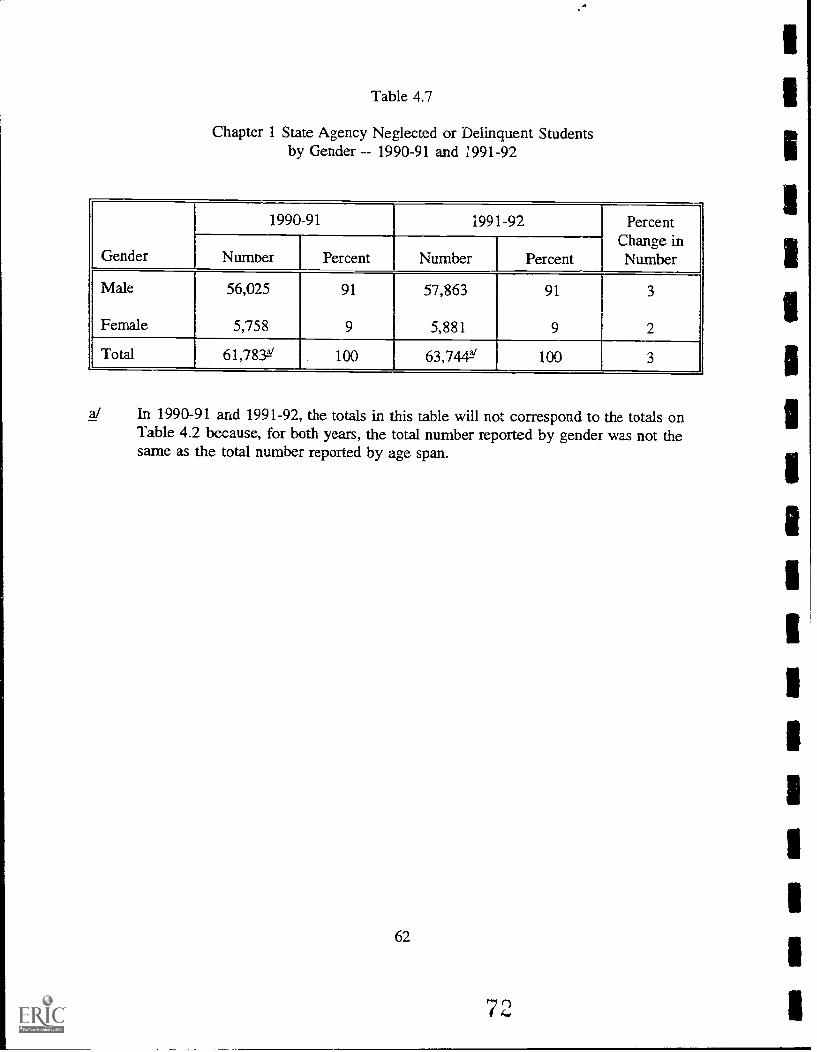
Table 4.7
Chapter 1 State Agency Neglected or Delinquent Studentsby Gender -- 1990-91 and 1991-92
Gender
1990-91 1991-92 PercentChange inNumberNumoer Percent Number Percent
Male
Female
56,025
5,758
91
9
57,863
5,881
91
9
3
2
Total 61,783Y 100 63,744 100 3
a/ In 1990-91 and 1991-92, the totals in this table will not correspond to the totals onTable 4.2 because, for both years, the total number reported by gender was not thesame as the total number reported by age span.
62
IIIIIiIIIIIIIIII1
I72 1

State
Table 4.8
Number of Percent of Migiblc State Agency N or D ParticipantsReceiving Chapter 1 Services, by State. 1991-92
Number of Students Percent ofEligible to Total Number Eligible Students
Receive Services of Participants ServedAlabama 5,126 2,364 4-6
Alaska 316 273 86Arizona 1.668 1,571 94Arkansas 1,146 480 42California 9,750 2,700 28Colorado 498 381 77Connecticut 2,186 2,186 100Delaware 77 97 100District of Columbia 2,105 541 26Florida 2.368 2,156 91Georgia 2,753 1,184 43Ha Waii 701 701 IGO
Idaho 380 165 43Illinois 2,210 1,775 80Indiana 2,260 1245 55Iowa 570 462 81Kansas 1,271 1,164 92Kentucky 1,750 1,006 57Louisiana 2,156 1,272 59Maine 632 630 100Maryland 2,291 1,381 60Massachusetts 1,521 713 47Michigan 2,645 1.602 61
Minnesota 342 273 80Mississippi 647 452 70Missouri 910 910 100Montana 422 382 91Nebraska 1,044 799 77Nevada 576 519 90New Hampshire 271 127 47New Jersey 2,903 1,238 43New Mexico 1,187 924 78New York 11.183 5,304 47North Carolina 5,978 2,849 48North Dakota 56 56 100Ohio 5.110 3,395 66Oklahoma 501 430 PA
Oregon 1,116 1,081 97Pennsylvania 1.129 921 82R.hode Island 536 435 81South Carolina 3,862 1,381 36South Dual 258 154 60Tennessee 2,747 1,104 40Texas 5.390 2,543 47Utah 938 758 81Vermont 419 364 87Virginia 2,120 2,120 WO
Washington 7,515 4,548 61West Virginia 960 516 54Wisconsin 2.147 1,563 73Wyoming 416 222 53
Puerto Rico 2,531 2,531 100Bureau of Indian Affairs a/
1 Nation 109,614 63,948 58
a/ The Bureau of Indian Affairs does not receive State N or D funding.
63
i3EST COPY AVAILABLE

Table 4.9
Chapter I Allocations for theState Agency Neglected or Delinquent Program -
1 990-9 1 and 199 1-92
State
State N or D AllocationsPercentChange1990-91 1991-92
Mabama $353,923 $347217 -2Alaska 157,971 175,627 11
Arizona 406,356 354,055 -13Arkansas 244,006 271,083 11
California 3,009,989 3,257,473 8
Colorado 267,869 247,148 -aConnecticut 456,647 448,153 -2Delaware 93,750 85,317 -SDistrict of Columbia 366,872 615,129 68Florida 899,554 1,044,664 16
Georgia 677,282 715,018 6
Hawaii 52,088 72,865 40Idaho 86,898 96,898 12Illinois 949,125 1,100,054 16
Indiana 632,084 792,677 25Iowa 313,293 308,814 -1KAMA! 706,103 652,983 -8Kentucky 523,116 552,549 6
Louisiana 544,409 604,458 11
Maine 238,537 268,959 13
Mary Lind 1,121,332 926,586 -17Massachusetts 713,026 751.824 5
Michigan 1,401,112 1,335,818 -5Minnesota 256,146 273,067 7
Mississippi 322.847 408,932 27Missouri 436.771 477,629 9
Montana 137,996 133,338 -3Nebraska 200,354 192,265 -4Nevada 210,056 198,099 -6New Hampshire 127.230 171.588 35
New Jersey 1.772,206 1,864,419 5
New Mexico 265,839 267,046 s
New York 3,447.730 4.191,699 22North Carolina 1,030,693 1.018,966 -1North Dakota 38,035 38,981 2
Ohio 2,293,159 2,766,000 21
Oklahoma 171,494 202,447 18
Oregon 657,800 675,413 3
Pennsylvania 1,018,996 1.198,246 18
Rhode Island 245.157 280,312 14
South Carolina 759,065 1,011,083 33
South Dakota 80,568 90,553 12
Tennessee 707,271 736,539 4
Texas 1,339.900 1,322,357 -1Utah 166.315 192,065 15
Vermont 119,125 109,638 -8Virginia 519.245 863,092 66Wathington 1,063.206 1,137,567 7
West Virginia 220. 535 240.134 9
Wisconsin 641,480 696,254 9
Wyoming 158,834 136,580 -14
Puerto Rico 167,605 187,853 12
Bumau of Indian Affairs al
Total $32,791,000 536.107.531 10
Less than 1 percent.
a/ Bureau of Indian Affairs does not receive State N or D funding.
647

11111111111111111111111111111111.11-11111611111101101111111111111011111-111111M

APPENDIX A
CHAPTER 1 EVALUATION REQUIREMENTS
Evaluation requirements have been part of the Title I/Chapter 1 law since its inception,but States were not required to report to the Federal government in a uniform way until 1979.Beginning with the 1979-80 school year, each State educational agency (SEA) compiledreports from each of its public school districts, or an approved representative sample of itsdistricts, and submitted a State report (known as the State Performance Report) to the U.S.Department of Education (ED).' The State Performance Report used for the 1991-92 schoolyear is the fourth to incorporate the new provisions of P.L. 100-297.
Under the revised form, beginning with the 1988-89 school year, States are required tosubmit the following information annually to ED:
The Chapter 1 LEA Program
the number of school districts receiving basic and concentrationgrants;
the number of schools operating Chapter 1 programs;
the number of public and nonpublic students eligible toparticipate in Chapter 1;
the number of Chapter 1 participants by gender, racial/ethnicclassification, and year of birth;
the number of public, nonpublic, and local neglected ordelinquent (N or D) participants by grade;
the number of participants who are handicapped or limitedEnglish proficient;
'If a State sampled its school districts for reporting participation and staffing information,the inclusion or exclusion of districts in any reporting year may account for fluctuations in thefigures from year to year. The 1986-87 school year was the last year that any States reportedparticipation and staffing information based on a sample of school districts.
A-1

the number of public, nonpublic, and local N or D participantsby type of instructional and supporting services received;
the number of full-time equivalent (1.1E) staff funded byChapter 1 by category;
the number of school districts and schools subject to schoolprogram improvement provisions;
the number of schools operating schoolwide projects;
the number of school districts operating innovation projects;
achievement information in reading, mathematics, and languagearts for an annual test cycle; and
achievement scores for more advanced skills for reading andmathematics.
The Chapter 1 State Agency Neglected or Delinquent (N or D) Program
Number of participants:
by gender;
by age span by institutional designation (neglected, delinquent,and adult correctional);
by service area by institutional designation;
by race/ethnicity; and
eligible for and receiving services.

APPENDIX B
REPORTING PROBLEMS
Although State Performance Report data has been collected and reported since the1979-80 school year, in recent years concerns have been raised regarding the appropriate useand interpretation of the data. Some of these issues are examined below.
Data Quality
Although the yearly data submitted by the States goes through an extensive edit checkprocess, data anomalies occur. For example:
Since the 1979-80 school year, California has reported a figure that includesstudents in Chapter 1 programs plus those enrolled in State compensatoryeducation prograrris. This combined figure overstates the actual number ofChapter 1 participants. To resolve this situation, in 1987, the U.S. Departmentof Education and the California State Department of Education reached anagreement to allocate to Chapter 1 only a portion of the total number ofparticipants and staff in California, according to a formula based on theproportion of funding received from Federal versus State programs.' Thisadjustment serves as a proxy for actual counts of Chapter 1 students.
For the last several years, Missouri's counts of Chapter 1 students byrace/ethnicity, gender, year of birth, and grade have differed, and attempts havebeen made to reconcile these totals. Nevertheless, the total count of childrenhas resulted in large year-to-year fluctuations in the count used for this report.State officials have said that they believe that the reported data are sufficientlyaccurate if the total counts are within 10 percent of each other.
'For a given year, a percentage is determined by dividing California's Chapter 1 fundingby the sum of its Chapter 1 and State Compensatory Education (SCE) funding (Chapter 1/((Chapter 1 + SCE)). The resulting percentage is then applied to the reported number ofparticipants and staff in order to eqimate the number of Chapter 1 participants and staff inCalifornia. This percentage has ranged from 70.5 percent in 1979-80 to 86.6 percent in1991-92.
B-1
7 3

For the 1990-91 school year, Texas reported serving a total of 512 LEPstudents under Chapter 1. Although this figure did not appear reasonable, Stateofficials were unable to revise it. Therefore, the figure reported for 1989-90(86,866) was used as a proxy.
Several States do not appear to be collecting actual information on participants'year of birth from school districts. Instead, for the purposes of Federalreporting, birth years are estimated for different grade levels.
The Chapter 1 Implementation Study2 collected district level achievemeri . informationand, in the course of this data collection, determined that many Chapter 1 coordinators are notwell grounded in standardized testing and how to assess the completeness of test scoreinformation. This may result in the submission of incomplete or implausible information.Examples include:
Districts submitted data where the number of Chapter 1 students pretested wasgreater than the number of students enrolled in Chapter 1; and
The number of students reported by the district with matched pre- and post-testscores exceeded the number of students pretested.
Since the same Chapter 1 coordinators are also responsible for compiling and reportingthe achievement data for the State Performance Reports, it is possible that these data havesimilar problems.
Unit of Analysis
Although the data presented in this report provide a picture of Chapter 1 participationat the national and State levels, it is limited in several respects. First, the smallest unit ofanalysis available is the State level. It is not possible to examine Chapter 1 participation byindividual district or analyze the data in conjunction with other databases at the LEA level(such as the Common Core of Data or the General Education Provisions Act (GEPA) Section406A data collection). Second, since the data collected are not matched information, it is notpossible to perform student-level analysis (e.g., service delivery by grade or achievement
2The Chapter 1 Implementation Study: Interim Report, Abt Associates, 1992.
B-2

results by gender). Similarly, we know how many students received each instructional andsupporting service, but do not know how many of the services each individual studentreceived. Finally, the instructional and supporting service data do not give any indication ofthe intensity of services received by each student.
Use of Norm Referenced Tests (NRTs)
While NRTs have a number of strengths (particularly that they can produce objective,reliable information for an investment of relatively little time and money), the NRTachievement data collected by the State Performance Reports do not reflect the advancesmade in cognitive science in recent years. Unlike the NRTs, newer student assessmentinstruments evaluate the students' ability to synthesize information and demonstrate theirskills in solving real-world problems. Also, the State Performance Reports' dependence on anormative standard has been questioned. Setting program goals toward average performanceof other students can Limit what is expected and what is taught. In addition, the presentreporting system does not fully support the legislative mandate to examine advanced skills.Reporting reading comprehension and mathematics applications/problem solving subtests fallsshort of the mandate. Although these subtests approach an assessment of advanced skills, themultiple choice format limits the student to one problem solving strategy rather than applyingthe variety of skills necessary to answer open-ended questions.
There are substantial limitations to using NRTs to select schools for programimprovement. Currently a school is targeted for program improvement if the aggregateachievement scores of Chapter 1 students show no change or decline over the course of theyear. However, because of the tests' relatively large standard error, some schools areidentified for program improvement -- only to show a score gain without any intervention.Many program improvements may take longer than an academic year to be reflected inresults--and implementation of reforms sometimes causes an initial decline in test scores.Moreover, narrow em,lhasis on scores can encourage coaching students to score well on thetest, rather than focusing on mastering the curriculum. Finally, the NRTs provide littleguidance on how to improve individual instruction or modify school programs.
Alternative Chapter 1 Data
Many of the problems discussed above are absent from the Congressionally-mandatedProspects study, which measures the characteristics and achievement of a nationallyrepresentative cohort of Chapter 1 and non-Chapter 1 participants. The use of commonparticipation and achievement measures provides reliable point-in-time and longitudinal datafor reliable analysis of school poverty, parent involvement, teacher preparation, the range ofprograms offered to students, and other factors influencing student achievement.
B-3

Differences in the methods used to collect State-reported versus Prospects data arereflected in analyses and findings. While State-reported data indicate pre- to post-test gainsfor Chapter 1 students in reading, math, and other areas between 1991 and 1992, comparablenational data in Prospects show relatively little change, overall, in student achievement withChapter 1 students failing to close the achievement gap with other students and unlike theState-reported data which cannot be disaggregated below the State level, Prospects identifieslagging student achievement as a particular problem in schools with high conceAtrations ofpoverty.
B-4

APPENDIX C
DATA COLLECTION FORM, SCHOOL YEAR 1991-92

Form approvedOMB No.1810-0037Expiration Date: 07/31192
U.S. DEPARTMENT OF EDUCATION
WASHINGTON, D.C. 20202
INSTRUCTIONS FOR COMPLETING STATE PERFORMANCE REPORT
(CHAPTE1 I BASIC GRANTS AND STATE NEGLECTED AND 1ELINQUENT)
PART L CHAPTER 1 PARTICIPATION INFORMATION - REGULAR SCHOOL TERM
ITEM A. Enter the number of local educational agencies (LEAs) that received (1) Chapter 1 Basic Grants and (2) Chapter 1 ConcentrationGrants.
ITEM B. Enter the number of public schools that operated Chapter 1 projects during the regular school year.
ITEM C. Enter the number of public and nonpublic students located in all eligible public school attendance areas during the regular schoolyear who were educationally disadvantaged (i.e., children whose educational attainment is below the level that is appropriate for children oftheir age). Note: include in children in all eligible attendance areas and all grades (K-12), whether or not the attendance area or grade isparticipating in the Chapter 1 program.
ITEM Dl. Enter the number of Chapter 1 participants during the regular school year by gender. Enter total.
ITEM D2. Enter the number of Chapter 1 participants during the regular school year who were of each designated raciaVethnic group.Enter total.
ITEM D3. Enter the number of Chapter 1 participants born in each indicated year. Enter total.
ITEM D4. Enter for each grade the number of Chapter 1 participants during the regular school year in (a) public schools, (b) nonpublicschools, and (c) local institutions for the neglected or delinquent (n or d). Do not include students in State institutions. Enter combinedpublic, nonpublic, local n or d total. The totals for items D1, D2, D3 and D4 should be thesame. if not, explain any discrepancies.
!TEM 05. Enter the number of participants in 04 with handicapping conditions (i.e., children with individualized educational plans requiredby P.L 94-142).
ITEM 06. Enter the number of participants in D4 with limited English proficiency as determined by State or local criteria.
ITEM E. Enter the number of participants whoreceived each category of service as (a) public school students, (L) nonpublic schoolstudents, or (c) students from local institutions for the n or d. Enter the total of each category of service in the lastcolumn.
PART II. CHAPTER 1 STAFF iNFORMATION
Enter the number of full-time equivalent staff during the regular school year funded by Chapter 1 according to job category. "Staff providingsupprting services" should include only non-clerical staff providing the supporting services listed in Part I, Item E.
PART III. CHAPTER 1 PROGRAM INFORMATION - REGULAR SCHOOL TERM
ITEM A. Enter the number of school districts that have schools planning or implementing School Program Improvement plans, underSection 1021 of the Act.
!TEM B. Enter the number a schools that are planning and/or implementing Schooi Program Improvement plais underSection 1021 of theAct.
ITEM C. Enter the number of schools that have school wide projects, under Section 1015 of the Act.
ITEM D. Enter the number a school districts that have innovative projects, as specifiod in Section 1011(b) of the Act.
PART IV. CHAPTER 1 ACHIEVEMENT INFORMATION - REGULAR SCHOOL TERM
Complete a separate page (use extra sheets as necessary) for achievement data for each subject matter area listed, and mark theappropriate label. In assessing achievement in language arts, an LEA may use tests designed to measure language arts or reading.
83
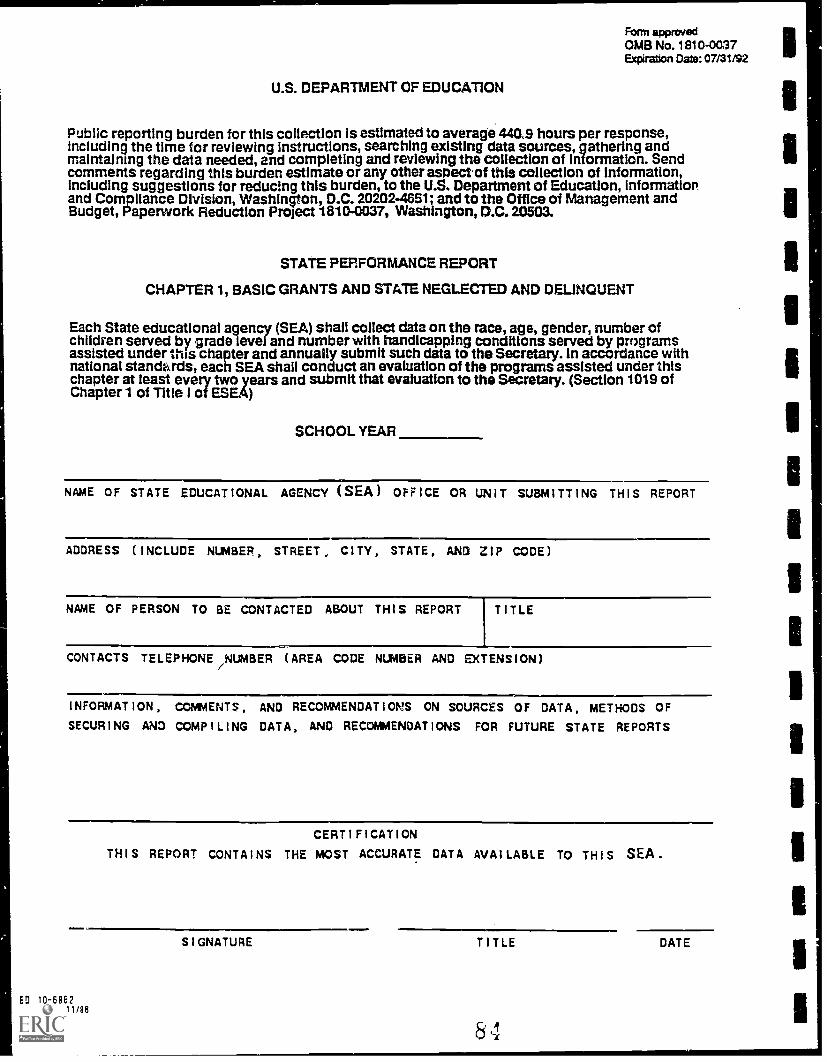
Form approved
OMB No. 1810-0037Expiration Date: 07/31/92
U.S. DEPARTMENT OF EDUCATION
Public reporting burden for this collection is estimated to average 4409 hours per response,including the time for reviewing instructions, searching existing data sources, gathering andmaintaining the data needed, 2nd completing and reviewing the collection of information. Sendcomments regarding this burden estimate or any other aspectof this collection of information,including suggestions for reducing thls burden, to the US. Department of Education, informationand Compliance Division, Washington, D.C. 20202-4651; and to the Office of Management andBudget, Paperwork Reduction Project 1810-0037, Washington, D.C. 20503.
STATE PERFORMANCE REPORT
CHAPTER 1, BASIC GRANTS AND STATE NEGLECTED AND DELINQUENT
Each State educational agency (SEA) shall collect data on the race, age, gender, number ofchildren served by grade level and number with handicapping conditions served by programsassisted under this chapter and annually submit such data to the Secretary. In accondance withnational standhrds, each SEA shall conduct an evaluation of the programs assisted under thischapter at least every two siears and submit that evaluation to the Secretary. (Section 1019 ofChapter 1 of Title I of ESEA)
SCHOOL YEAR
NAME OF STATE EDUCATIONAL AGENCY (SEA) OFFICE OR UNIT SUBMITTING THIS REPORT
ADDRESS (INCLUDE NUMBER, STREET, CITY, STATE, AND ZIP CODE)
NAME OF PERSON TO BE CONTACTED ABOUT THIS REPORT I TITLE
CONTACTS TELEPHONE NUMBER (AREA CODE NUMBER AND EXTENSION)
INFORMATION, COMMENTS, AND RECOMMENDATIONS ON SOURCES OF DATA, METHODS OF
SECURING ANO COMPILING DATA, NW RECOMMENDATIONS FOR FUTURE STATE REPORTS
CERTIFICATION
THIS REPORT CONTAINS THE MOST ACCURATE DATA WAILABLE TO THIS SEA.
SIGNATURE
ED 10-6862REV I sED 11/88
TITLE DATE
8 4

1
1
1
1
COQ No. 18 10-0037PART I. CHAPTER 1 PARTICIPATION INFORMATION REGULAR SCHOOL TERM Ep. Nte: 07/31/92
STATE NAME
FOR THE PERIOD COVERED BY THIS REPORT:
A. GIVE THE NUMBER OF SCHOOL DISTRICTS RECEIVING CHAPTER 1 FUNDS.
BASIC GRANTS CONCENTRATION GRANTS
B. GIVE THE NUMBER OF SCHOOLS OPERATING CHAPTER 1 PROJECTS.
C. GIVE THE NUMBER OF CHILDREN ELIGIBLE TO PARTICIPATE IN CHAPTER 1 DURING THEREGULAR TERM. PUBLIC NONPUBLIC
D. GIVE THE NUMBER OF CHAPTER 1 PARTICIPANTS DURING THE REGULAR TERM.1. BY GENDER MALE FEMALE TOTAL
2. BY RACIAL/ETHNIC GROUP
AMERICAN INDIAN OR ALASKAN NATIVE
ASIAN OR PACIFIC ISLANDER
BLACK, NOT HISPANIC
HISPANIC
WHITE, NOT HISPANIC
TOTAL
3. BY YEAR OF BIRTH
1968
1969
1970
1971
1972
1973
1974
1975 1982
1976 1983
1977 1984
1978
1979
1980
1981
1985
1986
1987
1988
TOTAL
4. BY GRADE AND PUBLIC / NONPUBLIC / LOCAL NEGLECTED OR DELINQUENT DESIGNATION
GRADE PUBLIC NONPUBLIC LOCAL NEGLECTED OR DELINQUENT TOTAL
PREKK
2
3
4
5
6
7
8
9
10
11
12
TOTAL
85

PART I. CHAPTER PARTICIPATION INFORMATION REGULAR SCHOOL TERM (CON'T)
. STATE NAME
EXPLAIN ANY DISCREPANCIES AMONG THE TOTAL COUNTS REPORTED IN RESPONSE TO
QUESTIONS 0 1-4.
OMB No. 1810-003'Exp. Dote: 01/31/S2
5. OF THOSE COUNTED IN NUMBER 4, GIVE THE NUMBER OF STUDENTS WITH
HANDICAPPING CONDITIONS.
6. OF THOSE COUNTED IN NUMBER 4, GIVE THE NUMBER OF LIMITED ENGLISH
PROFICIENT STUDENTS.
E. GiVE THE NUMBER OF CHAPTER 1 PARTICIPANTS DURING PIE REGULAR TERM BY
TYPE OF SERVICE AND PUBLIC / NONPUBLIC / iNSTITUTIONAL DESIGNATION.
SERVICE AREA PUBLIC NONPUBLIC LOCAL NEGLECTED TOTALOR DELINQUENT
INSTRUCTIONAL
READING
OTHER LANGUAGEARTS NOT ABOVE
MATHEMATICS
OTHER (SPECIFY)
SUPPORTING
GUIDANCESOCIAL WORK
HEALTHNUTRITION
PUPILTRANSPORTATION
OTHER (SPECIFY)
8 '1
1

PART II. CHAPTER 1 STAFF INFORMATION
STATE NAME
OMB No. 1810-0037Exp. Date: 07/31/92
FOR THE PERIOD COVERED BY THIS REPORT:
GIVE THE NUMBER OF STAFF EMPLOYED IN CHAPTER 1 PROJECTS DURING THE REGULAR TERM.
REPORT IN FULLTIME EQUIVALENTS BY JOB CLASSIFICATION.
JOB CLASSIFICATION FULLTIME EQUIVALENTS
ADMINISTRATORS (NON CLERICAL)
TEACHERS
TEACHER AIDES
STAFF PROVIDING(NON CLERICAL)
SUPPORTING SERVICES
CLERICAL :',AFF
OTHER (SPECIFY)
1
1
PART III. CHAPTER 1 PROGRAM INFORMATION REGULAR SCHOOL TERM
FOR THE PERIOD COVERED BY THIS REPORT:
GIVE THE NUMBER OF LEAs WITH SCHOOLS SUBJECT TO SCHOOL
PROGRAM IMPROVEMENT PROVISIONS.
GIVE THE NUMBER OF SCHOOLS SUBJECT TO SCHOOL PRQGRAM
IMPROVEMENT PROVISIONS.
GIVE THE NUMBER OF SCHOOLS OPERATING SCHOOLWIDE PROJECTS.
GIVE THE NUMBER OF LEAs OPERATING INNOVATIVE PROJECTS.

PART IV. CHAPTER 1 ACHIEVEMENT INFORMATION REGULAR SCHOOL TERM
SUBJECT MATTER: BASIC SKILLS
STATE NAME
READING MATHEMATICS
OTHER LANGUAGE ARTS
ADVANCED SKILLS READING COMPREHENSION
MATH PROBLEMS & APPLICATIONS
FOR THE PERIOD COVERED BY THIS REPORT:
A. STATEWIDE ACHIEVEMENT FOR THE REGULAR SCHOOL YEAR BY GRADE LEVEL
FOR ANNUAL EVALUATIONS.
OMB No. 1810-0037Exp. Date: 07/31/92
CHAPTER 1
PARTICIPANTSBY GRADE
CHAPTER 1
PARTICIPANTS WITHPRE AND POSTTEST
SCORES(N)
PRETEST NCESCORE (WEIGHTED
MEAN)
POSTTEST NCESCORE (WEIUHTED
MEAN)
2
16
7
8
ni11112
B. TOTAL NUMBER OF CHAPTER 1 STUDENTS INCLUDED IN THE ABOVE STATEWIDE
ACHIEVEMENT DATA WHO ATTEND NONPUBLIC SCHOOLS.
ARE YOUR ACHIEVEMENT DATA INCLUDED IN THE ABOVE SUBJECT MATTER SUMMARIES
COLLECTED: FROM ALL SCHOOL DISTRICTS
IN CONFORMANCE WITH AN APPROVED SAMPLING PLAN
NEITHER
IF NEITHER, EXPLAIN THE REASON(S).
8 .U

m, 1810-0037Exp. Ntc 07/31192
PART IV. CHAPTER 1 ACHIEVEMENT INFORMATION REGULAR SCHOOL TERM (CON'T)
SUBJECT MATTER: BASIC SKILLS
STATE NAME
READING MATHEMATICS
OTHER LANGUAGE ARTS
ADVANCED SKILLS READING COMPREHENSION
MATH PROBLEMS & APPLICATIONS
FOR THE PERIOD COVERED BY THIS REPORT:
C. STATEWIDE ACHIEVEMENT FOR THE REGULAR SCHOOL YEAR BY GRADE LEVEL
FOR FALL-SPRING EVALUATIONS (ONLY FOR SCHOOL YEARS 1988-89 AND 1989-90)
CHAPTER 1
PARTICIPANTSBY GRADE
CHAPTER 1
PARTICIPANTS WITHPRE AND POST-TEST
SCORES(N)
PRE-TEST NCESCORE (WEIGHTED
MEAN)
POST-TEST NCESCORE (WEIGHTED
MEAN)
2
3
4
5
6
7
4
9
10
11
12
D. TOTAL NUMBER OF CHAPTER 1 STUDENTS INCLUDED IN THE ABOVE STATEWIDE
ACHIEVEMENT DATA WHO ATTEND NONPUBLIC SCHOOLS.
ARE YOUR ACHIEVEMENT DATA INCLUDED IN THE ABOVE SUBJECT MATTER SUMMARIES
COLLECTED: FROM ALL SCHOOL DISTRICTS
IN CONFORMANCE WITH AN APPROVED SAMPLING PLAN
NEITHER
IF NEITHER, EXPLAIN THE REASON(S).
89

DAB No. I8ic-on7PART V. PARTICIPATION INFORMATION--NEGLECTED OR DELINQUENT CHILDREN IN E.p. Date: 07/3!192
STATE ADMINISTERED INSTITUTIONS
STATE NAME
FOR THE PERIOD COVERED BY THIS REPORT:
A. GIVE THE NUMBER OF INSTITUTIONS PROVIDING CHAPTER 1 SERVICES
DURING THE SCHOOL YEAR.
B. GIVE THE NUMBER OF CHILDREN IN INSTITUTIONS
1. ELIGIBLE FOR CHAPTER 1 SERVICES DURING THE SCHOOL YEAR
2. RECEIVING CHAPTER 1 SERVICES DURING THE SCHOOL YEAR3. OF THOSE INDICATED IN B2 ABOVE PROVIDE THE NUMBER SERVED:
a. BY GENDER MALE FEMALE TOTAL
b. BY RACIAL/ETHNIC GROUP
AMERICAN INDIAN OR ALASKAN NATIVE
ASIAN OR PACIFIC ISLANDER
BLACK, NOT HISPANIC
HISPANIC
WHITE, NOT HISPANICTOTAL
c. BY AGE AND INSTITUTIONAL DESIGNATION
AGE NEGLECTED DELINQUENT ADULT CORRECTIONAL TOTAL
0-9
10-13
14-16---,
17-20
TOTAL
ARE THE TOTALS IN B3(8, b, AND c) THE SAME?
IF NOT, EXPLAIN ANY DISCREPANCIES.YES NO
C. GIVE THE NUMBER OF CHAPTER 1 PARTICIPANTS BY TYPE OF SERVICES ANDINSTITUTIONAL DESIGNATION.
SERVICE AREA NEGLECTED DELINQUENT ADULT CORRECTIONALI
TOTALINSTRUCTIONAL
READING
OTHER LANGUAGEARTS NOT ABOVE
MATHEMATICS
OTHER(SPECIFY)
SUPPORTING
GUIDANCESOCIAL WORK
HEALTHNUTRITION
PUPILTRANSPORTATION
OTHER(SPECIFY)
jU
1

APPENDIX D
PERCENTILE RANKS AND NORMAL CURVE EQUIVALENTS
The achievement information in the body of the text is presented in percentile ranks.Percentile ranks indicate the percentage of students nationwide that obtained scores lower thanthat particular achievement level. A percentile rank of 50, for example, indicates theachievement level which 50 percent of all students scored below. Percentile ranks must beinterpreted cautiously because they are not based on an equal-interval scale. This means thata child who increases achievement by 10 percentile points, from 45 to 55 for example, hasnot learned the same amount as a child who increases from 85 to 95. Percentile ranks cannot,therefore, be used for averaging student achievement gains since each point of gain does notrepresent the same amount of learning.
Another measure, which is derived from percentile rankings, the Normal CurveEquivalent (NCE), is an equal-interval scale. Therefore, any identical increase represents thesame amount of increase, whether the increase came between 45 and 55 NCEs or between 85and 95 NCEs.
ranks.Figure D.1 is a graphic depiction of the relationship between NCEs and percentile
D-1
9 1
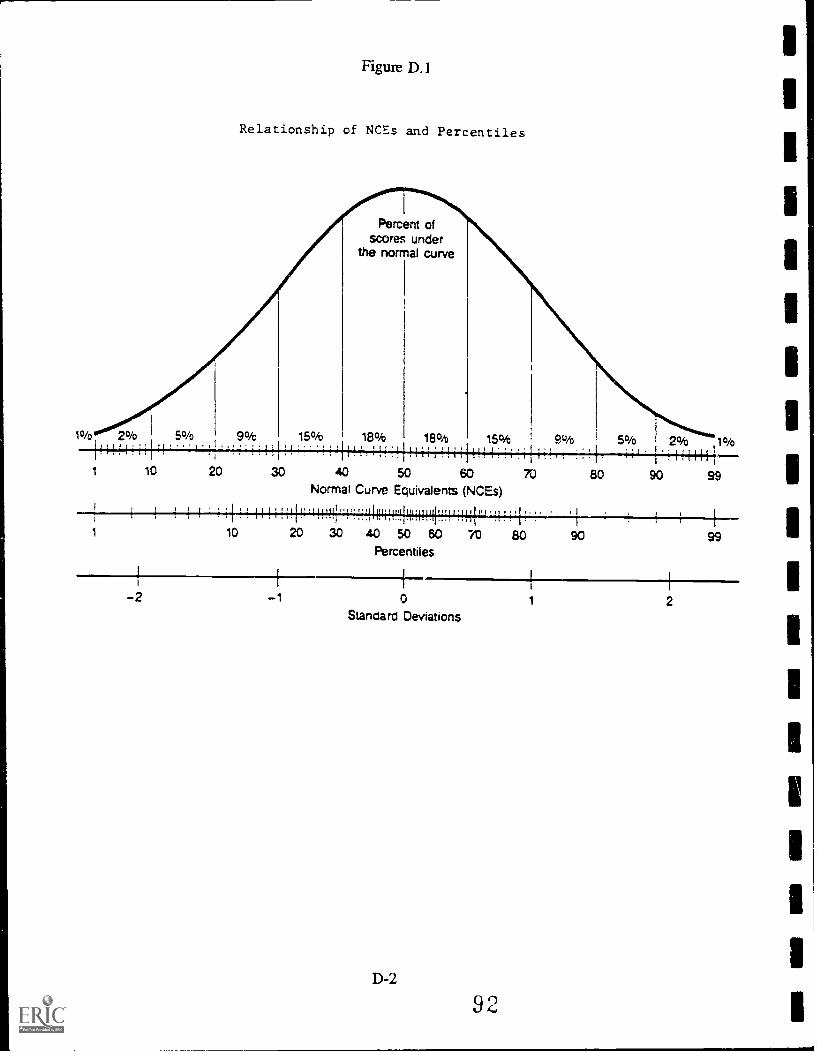
1%
Figure D.1
Relationship of NCEs and Percentiles
Percent ofscores under
the normal curve
10
5%
30
15% 18% 18% 15%
40 50 60Normal Curve Equivalents (NCEs)
9% 50/0i I '
80 90 99
1 10 20 30 40 50 60
Percentiles
70 80 90 99
-2 -1 0
Standard Deviations
D-2
9 4
1 2

APPENDIX E
METHODOLOGY
State Performance Reports for the ESEA Chapter 1 LEA program and the Chapter 1State Agency Neglected or Delinquent program funded in school year 1991-92 weresubmitted to the U.S. Department of Education (ED) in the winter and early spring of 1993.These reports consisted of participation data and achievement data.
Westat, Inc. was contracted by the Office of the Under Secretary to review, correct,and summarize the State Performance Reports. Once Westat received the State PerformanceReports from ED, the participation data were entered into a Lotus 1-2-3 file.
The achievement data were entered into a single master Lotus 1-2-3 file. Five .
individual files were then created from the master file for the ammal testing cycle for studentstested in basic and advanced skills in reading, mathematics, and other language arts (ba'icskills only). The annual cycle consisted of both fall-fall and spring-spring testing and, whennecessary, the two were combined into one overall annual achievement figure.
After all the data were entered, data checks were conducted. The purpose of the datachecks was to flag potential problems, not to claim that the information was necessarily inerror. In the case of the participation data, internal consistency checks were performed thatconsisted of verifying that the totals for gender, year of birth, grade, and racial/ethnic groupequalled the sum of their parts. In addition, comparisons were made between the 1990-91data and the 1991-92 data. Particular emphasis was placed on changes from 1990-91 to1991-92 that appeared to be very high, taking into account both the absolute numbers and thepercentage Mvolved. No specific percentage was targeted, but any shifts that might indicatenew programmatic trends were noted. These changes were highlighted on State-by-Statelistings of the reported data.
The highlighted State-by-State listings were then sent by Westat to the State Chapter 1coordinators with a letter explaining the edit check process. One week after the State-by-State listings were sent, Westat began contacting the Chapter 1 coordinators by telephone toverify that highlighted items were correct or to receive explanations for reported year-to-yearchanges.

In several instances, States provided revisions to their 1990-91 and/or their 1991-92data.' In most cases, the information was correct, and explanations were provided for thehighlighted items.
At the conclusion of this process, Westat entered the revisions into the Chapter 1 databases and produced three documents for ED. These documents were a PreliminaryTabulations Report, a State Feedback Report for each State educational agency, and thissummary report entitled Chapter 1 Participation and Achievement Information for 1991-92Summary Report.
'To the extent that States revised their figures for 1990-91, the numbers found in thisreport will not correspond to those found in previous documents displaying State PerformanceReport information.
E-2
ED/0US94-26
9 4