document resume ed 321 983 author tuckermanty, elizabet
TRANSCRIPT
DOCUMENT RESUME
ED 321 983 SE 051 491
AUTHOR Tuckermanty, Elizabet..; Gallagher-Allred, CharletteR.
TJTLE Normal Diet: Age of Parental Control. Nutrition inPrimary Care Series, Number 5.
INSTITUTION Ohio State Univ., Columbus. Dept. of FamilyMedicine.
SPONS AGENCY Health Resources and Services Administration(DHHS/PHS), Rockville, MD. Bureau of HealthProfessions.
PUB DATE 80CONTRACT 232-78-0194NOTE 40p.; For related documents, see SE Or' 486-502. See
SE 051 503-512 for "Nutrition in Health Promotion"series.
PUB TYPE Guides - Classroom Use Materials (For Learner)(051)
EDRS PRICE MF)1/PCO2 Plus Postage.DESCRIPTORS Biochemistry; *Children; *Dietetics; Disease Control;
Health Education; *Independent Study; *MedicalEducation; *Medical Evaluation; Medicine; Nutrition;*Nutrition Instruction; Physiology; PreventiveMedicine; Science Education; Therapeutic Environment;Therapy; Toddlers
ABSTRACT
Nutrition is well-recognized as A necessary componentof educational programs for physicians. This is to be valued in thatof all factors affecting health in the United States, none is moreimportant than nutrition. This can be argued from variousperspectives, including health promotion, disease prevention, andtherapeutic management. In all cases, serious consideration ofnutrition related issues in the practice is seen to be one means toachieve cost-effective medical care. These module were developed toprovide more practical knowledge for health care providers, and inparticular primary care physicians. This module deals with thenutritional needs and feeding practices of a child between ages 1 and12. A care study of a typical 4-year-old is used to test thestudent's knowledge of the nutritional care of a child. Included arethe learning goals and objectives, and references for the physicianand for the physician to give to the patient. The appendices includegrowth charts, a chart of triceps skinfolds, a chart of blood groupand urine data, a sample nutrient breakdown chart, and a chart ofsample listings of vitamin supplements. (CW)
*k*********************************************k***********************
Reproductions supplied by EDRS are the best that can be made *
from the original document. *
*************************************1:*********************************
1

"PERMISSION TO REPRODUCE 1l-ISMATERIAL HAS B..IFN GRANTED BY
Joni Rehner
TO THE EDUCATIONAL RESOURCESINFORMATION CENTER (ERIC)."
U S. DEPARTMENT OF L')UCATIONOnce of Educational Research and Improvement
EDUCATIONAL RESOURCES INFORMATIONCENTER IERICI
s document has beer. reproduced asreceived from tne person 0 organizationoriginating
O Minor changes nave been made to improvereproduction c uatty
Points o' new or opinions stated in thisdocument d ) not necessari. represent officialOERI Position or policy
5 Normal. Diet:Age of Parental ControlElizabeth Tuckermanty
Charlette R. Gallagher-Allred
Nutrition in Primary Care Department of Family Medicine1The Ohio State University
41111
Columbus, Ohio 43210
2

The Nutrition in Primary CareSeries Contains These Modules:
1. Nutrient Content of FG3ds, NutritionalSupplements, and Food Fallacies
2. Appraisal of Nutritional Status3. Nutrient and Drug Interactions4. Normal Diet: Age of Dependency5. Normal Diet: Age of Parental Control6. Normal Diet: Adolescence7. Normal Diet: Pregnancy and Lactation8. Normal Diet: Geriatrics9. Dietary Management in Obesity
10. Dietary Management in Diabetes Mellitus11. Dietary Management in Hypertension12. Dietary Management in Hyperlipidemia13. Dietary Management in Gastrointestinal
Diseases14. Dietary Management for Alcoholic Patients15. Nutritional Care c.f. Deteriorating Patients16. An Office Strategy for Nutrition-Related
Patient Education and Compliance
Department of Family MedicineCollege of Medicine The Ohio State University456 Clinic Drive Columbus, Ohio 43210
3
5 Normal Diet:Age of Parental Control
Elizabeth Tuckermanty, Ph.D.Project CoordinatorComputer Assisted instruction ProjectThe Ohio State UniversitySchool of Allied Medical -ProfessionsMedical Dietetics DivisionColumbus, Ohio
Charlette R. Gallagher-Allred, Ph.D., R.D.Assistant ProfessorThe Ohio State UniversitySchool of Allied Medical ProfessionsMedical Dietetics DivisionColumbus, Ohio
Project Staff
Tennyson Williams, M.D.Principal InvestigatorLawrence L. Gabel, Ph.D.Project DirectorPatrick J. Fahey, M.D.Family Medicine CoordinatorCharlette R. Gallagher-Allred, Ph.D., R.D.Nutrition CoordinatorJoan S. HickmanProject AssistantMadelon Timmons PlaistedProduction CoordinatorWendy WallutGraphics Coordinator
Contract Number. 232.78-0194
U S. Department of Health and Human ServicesPublic Health Service Health Resources AdministrationBureau of Health Professions Division of Medicine
Project Officer: Margaret A. Wilson, Ph.D.

Acknowledg-ments
Advisory Committee
Paul Dorinsky, M.D , Resident, Department of Family Medicine, The Ohio StateUniversity, Columbus, OhioDavid R Rudy, M.D., Director, Family Practice Residency Program, RiversideMethodist Hospital, Columbus, OhioMaria Steinbaugh, Ph.D., Associate Director, Nutrition Services, Ross Labor-atories, Inc , Columbus, OhioCarl D. Waggoner, M.D. Resident, Department of Family Medicine,, The OhioState University, Columbus, OhioWilburn H. Weddington M.D ,, Family Physician, Columbus, Ohio
Nutritional Consultants
John B. Allred, Ph.D ,, Professor, Fe 3 Science and Nutrition, College of Agri-culture,, The Ohio State University,, i_olumbus, OhioRobert E Olson, M.D.,, Ph D., Professor and Chairman, Edward A. Doisy De-partment of Biochemistry, St. Louis University Medical Center, St Louis, Mis-souri
Educational Consultants
C Benjamin Meleca, Ph.D., Director, Division of Research and Evaluation inMedical Education, The Ohio State University, Columbus,, OhioA. John Merola, Ph.D., Professor,, Department of Physiological Chermstry, TheOhio State University,, Columbus, Ohio
A special note of appreciation is extended to persons in family practice residencyprograms and universities throughout Ohio for reviewing the materials, and tothe faculty and residents where the materials were piloted.Grant Hospital, Columbus, OhioRiverside Methodist Hospital, Columbus, OhioUniversity Hospital, Columbus, Ohio
Production Assistants
Carol Ann McClish, Lynn Copley-Graves, Clint, Bachman, Linda Farnsworth
Composition Pony-X-Press, Columbus, OhioCamera Work Printers' Serv.,', Columba'., OhioReproduction and Binding PI', Store 51', Columbus, Ohio
Library of Congress Catalog Card Number 80-82859
Copyright C 1980 by the Department 01 iamilv Medicine 01 Ine Ohio State Linn ersitvAll rights reserved
5 Normal Diet:Age of Parental Control
Nutrition in Primary Care

Tables andFigures
Table 5-1Table 5-2
Table 5-3
Table 5-4
Table 5-5Table 5-6
Table 5-7
Table 5-8Table 5-9
Figure 5-1
Figure 5-2
Figure 5-3
.:igure 5-4
Figure 5-5
Suggested Meal Plan for the 1- to 3-Year-Old 2
Foods Included in a Good Daily Diet (Average Amounts for EachAge) 5Carbohydrate, Protein, Fat, and Kilocalorie Content of VariousTypes or Milk 7
Nutrient Composition of a 24-Hour Diet Recall and Recom-mended Dietary Allowances for a 4- to 6-Year-Old Child 8
Recommended Kilocalorie Intake for Infants and Children 12Percentiles for Triceps Skinfoids for Whites of the Ten-State Nutri-tion Survey of 1968-1970 27
Historical Development of the Ten-State Nutrition Survey 1968-1970 28
Nutrient Breakdown of Some cf the Foods Jenny Eats 29Sample Listing of Vitamin Supplements Typically Found inHealth Food Stores 30
Schematic Illu3tration of the Role of Carbohydrates in DentalDisease 15
Growth ChartPercentiles 23
Growth ChartPercentiles 24
Growth ChartPercentiles 25
Growth ChartPercentiles 26
Girls: 2 to 18 Years Physical Growth NCHS
Girls: Prepubescent Physical Growth NCHS
Boys: 2 to 18 Years Physical Growth NCHS
Boys: Prepubescent Physical Growth NCHS
Introduction
Goals
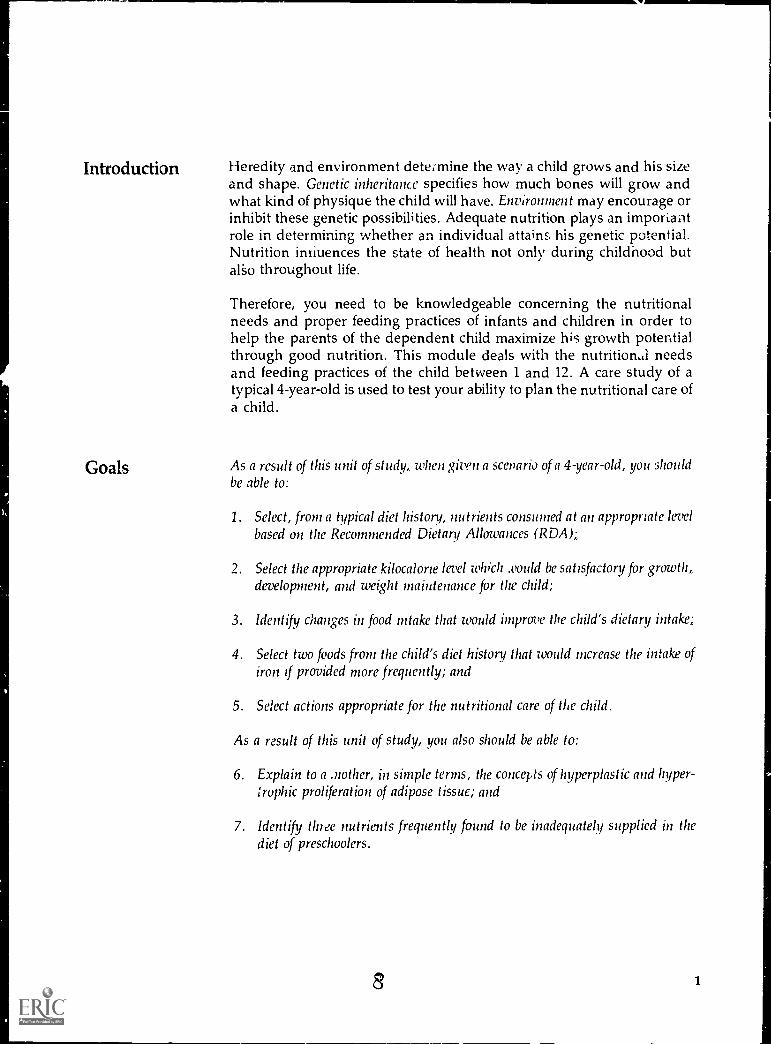
Heredity and environment determine the way a child grows and his sizeand shape. Genetic inheritance specifies how much bones will grow andwhat kind of physique the child will have. Environment may encourage orinhibit these genetic possibilities. Adequate nutrition plays an importantrole in determining whether an individual attains his genetic potential.Nutrition inriuences the state of health not only during childhood butalso throughout life.
Therefore, you need to be knowledgeable concerning the nutritionalneeds and proper feeding practices of infants and children in order tohelp the parents of the dependent child maximize his growth potentialthrough good nutrition. This module deals with the nutrition.' needsand feeding practices of the child between 1 and 12. A care study of atypical 4-year-old is used to test your ability to plan the nutritional care ofa child.
As a result of this unit of study, when given a scenario of a 4-year-old, you shouldbe able to:
1. Select, from a typical diet history, nutrients consumed at an appropriate levelbased on the Recommended Dietary Allowances (RDA);
2. Select the appropriate kilocalorie level which .vould be satisfactory for growth,,development, and weight maintenance for the child;
3. Identify changes in food intake that would improve the child's dietary intake;
4. Select two foods from the child's diet history that would increase the intake ofiron if provided more frequently; and
5. Select actions appropriate for the nutritional care of the child.
As a result of this unit of study, you also should be able to:
6. Explain to a .nother, in simple terms, the concepts of hyperplastic and hyper-;ruphic proliferation of adipose tissue; and
7. Identify three nutrients frequently found to be inadequately supplied in thediet of preschoolers.
s 1

2 Nut ittion at Primary Care
Nutrient Needs and FeedingPractices in Children Aged 1 to 12Years 1 to 3
During the second and third years oflife, the child's diet must be balaucedwith foods in all four food groups. In-take at different times will vary greatly.
By the time the baby is 1 year old, good feedingpractices should already have been established.By this age, the baby's meals probably includemilk, cereals, eggs, breadstuffs, butter or fr,rtifiedmargarine, meats, soups, vegetables, fruits, andpuddings. Teeth usually have developed, and theselection of food should include foods that All en-courage chewing.
During the ages 1 to 3 years, the need for pro-tein for growth of muscles and other tissue is rela-tively great. These needs are easily met if the tod-dler consumes a pint of milk and 1 to 2 ounces ofmeat daily. Although milk is high in protein, un-limited consumption that leads to neglect of othernecessary foods should be discouraged. Becausethe RDA for iron is not easily met with the usualdiet at this age, an iron supplement may be neces-sary. In areas where iodine in the soil is limited,such as northern and Great Lakes states, a smallamount of iodized salt in cooking and seasoningwill provide the recommended amount of iodine.Foods high in ascorbic acid and vitamin A shouldbe served daily. A vitamin D supplement will benecessary if fortified milk is not used, A variedmenu such as that shown in Table 5-1 provides anadeq :ate intake of vitamins if the toddler's appe-tite permits its consumption.
Compared to the infant, the 1- to 3-year-old
Table 5-1 Suggested Meal Plan for the 1- to 3-Year-Old
BreakfastFruit or juiceCereal with milkToastButter or margarineMilk
LunchHaIn dish includingmeat, eggs, fish,poultry, dried beansor peas, cheese orpeanut butter
Vegetable or saladBreadButter or margarineFruit or pudding1,141k
DinnerMeat, poultry or fishVegetableSaladBreadButter or margarineFruit or puddingMilk
Snacks Between MealsDry cereal, with or without milkPlain cookie or crackerRaw vegetablesCanned, fresh or dried fruitCheese sticksFruit sherbet or ice creamToast, plain or butteredFruit juiceFruit drinks made with milk
or juice
11111711R.Adapted from Your Child Ito 3 U S Dept of Health, Education and Welfare, Children's Bureau, 1966 Re% ised 1967, reprinted 1969.
9

5. Normal Diet: Age of Parental Control 3
child becomes more selective and more independ-ent about what he eats. Usually by 6 to 9 months,girls and boys decrease their milk intake marked-ly. For girls, decreased milk intake continues untilage 2 to 3, but then milk intake begins to rise Incontrast, boys decrease their milk intake fastcithan do girls but recover more rapidly, by 2' 2,boys have reached a higher level of milk intakethan girls.
The 1- to 3-year-old period is sometimes diffi-cult for parents because the child's appetitewanes, the rate of growth is slow and irregular,weight often drops, and the child begins to findwider horizons of activity offering greater inter-ests. Desire for food often becomes erratic, andthere is a noticeable drop in consumption of foodbetween the second and third years of life. The 1-to 3-year-old may go for weeks or even monthswithout gaining weight. Fascination with testingnew motor skills exceeds interest in food. The"won't eat" era is a normal phase of developmentand is much harder on the parents than the child.If you tell parents th It this decline in eating is to beexpected, many problems can be avoided Parentsshould also by encouraged not to foster poor eat-ing habits by being over-anxious or by bribing thechild to eat. During this ptriod, you will often beasked "Shouldn't we be gi ing our child a vitaminpill" You should respond that the decrease in ap-petite is usually brief and that the child's health isnot in danger. However, it is still a good idea to as-sess the child's nutritional intake before answer-ing the parents' question. If the child's diet is ex-tremely inadequate, the use of a multivitamin andmineral supplement that meet the RDA isemporanly justified. Emphasize to parents that
what the child does eat should be as nutritious aspossible. Also tell parents that appetite usuallytends to improve as the child approaches schoolage, and an increase in wowth and weight isbound to follow.
Years 3 to 5".
Portion sizes served the 3- to 5-year-oldshould be about half the size servedadults. Colorful and simple foods arewell-liked. Snacks and desserts, ifserved, should be highly - utritious.
1 0
The daily food guide (Table 5-2) serves as thebasis of the diet for the 3- to 5-year-old child. Sizeof servings is about half the average size used forolder children and adults. Approximately 3 table-spoons for the 3-year-old and 4 tablespoons for the4-year-old are good estimates for size of servings atmeals. The 3- to 5-year-old should be encouragedto drink 2 to 3 cups of milk (regular or skim) daily.Some of the requirement for milk may be providedin creamed soups and custards or in other dessertsincluded in the child's meals or snacks. The pre-schooler finds helping to prepare and serve "in-stant puddings" fun. This is an excellent way toencourage increased milk consumption in this agegroup.
Two-, three-, and four-year-olds want toidentify food. Colorful and attractive foods thatare easy to handle as well as eat are appealing tochildren. Successful eating patterns can be en-couraged by an environment when is conduciveto enjoying foods and by utensils which makehandling food easy. Children of this age prefersimple foods which they can handle as opposed tofoods that are puréed, or mixed dishes. Graviesand cream sauces are not popular. Foods such asbite-sized pieces of fruits, vegetables, and meats,ready-to-eat cereals, eggs, cottage cheese, andother mild cheeses are all very good foods to addto the child's diet at this age. Very small portions (1to 2 Tablespoons) seem to encourage the toddler toeat.
Exclusive eating of a few favorite foods is com-mon with 4- and 5-year-old children. They maywant to eat nothing at a particular sitting exceptpeanut butter sandwiches and fruit juice, or 2 to 3hard cooked eggs. These patterns usually do notpersist for very long, and soon they will settledown to normal meals again. Five- and six-year-old youngsters are imitators. During this age,emotional impressions become associated withfood; thus aversions to food develop for many rea-sons. Emotional experiences at the table shouldtherefore be pleasant When unpleasant associa-tions are aroused by food, they need to be recog-nized and understood.
Mid-morning and mid-afternoon snacks are im-portant for this age group unless they interferewith food consumption at mealtimes.
Good snacks, which are part of the whole day'smeal plan, might include the following:

4
Dry cereal, with or without milkGraham crackers or simple unfrosted cookiesToast, plain or cinnamonCanned, fresh, or oried fruitFruit juiceFruit drinks made with milk and juiceRaw vegetablesMilkCheese wedgeFruit sherbet or ice cream
Desserts, to be appropriate for the 3- to 5-year-old child, should furnish the essential protein,minerals, and vitamins as well as necessary kilo-calories. They should not be given as rewards forfinishing a meal nor should they be withhek: aspunishment for not doing so.
Years 5 to 12
School-aged children require the samebasic foods as younvr children, but re-quire larger quantities. Meals are oftenarranged around the school schedule.Peers have &reat influence on a child'seating practices.
During the early school years, there is a rela-tively constant increase in food intake. Growth inheight and weight is slow but steady. During theseearly school years, the child may add 10 to 12inches in his height and 30 to 35 p,unds to hisweight.
School-age children, 6 to 12, require the samebasic foods as when they were younger, but thequantities are increased to take care of their greaterneeds (see Table 5-2). During this period, energyneeds gradually increase and approach those ofadults. Mothers learn that the meal schedule mustbe spaced in relation to the school routine ratherthan to the child's nerds or desires. It seems thateating patterns and attitudes toward food varydaily. Children must decide whether to eat lunchin the cafeteria at school or carry it from home. Thedecision often rests on the practices of peers. Theexcitement of school, new contacts, and differentroutines when approached as new challenges willoften help to continue or promote good eatingpractices and regular meals. When children are
Nutrition in Prtinary Cave
eating at home, mothers should plan sufficienttime for eating all meals, including an adequatebreakfast
Teachers and peers, especially, miluence theschool-age children's selection of foods. They pre-fer meat, potatoes, bread, crackers, milk, icecream, cereals, and raw fruit; they tend to dislikefat meat, fish, cooked vegetables, cheese, andmixed meat and egg dishes. Because intake of ,-ro-tein, calcium, vitamin A, and ascorbic acid is ant tobe low, mothers should plan after-school snacksand dinners rich in these foods. Spaghetti andmeat sauce, pizza, and macaroni and cheese arewill liked by school-age children and are goodsources of protein, calcium, and vitamin A. Cou-pled with fruits and raw vegetables, these foodscombine to make a nutritious dinner.
By age 6 or 7, children are willing to try newfoods and to accept foods previously disliked. Byage 8, they have a ravenous appetite and refusefew foods; however, strong preferences are com-mon. By age 9, children usually have a keen inter-est in foods; they like to help prepare food and arepositive in likes and dislikes. The 9-year-old stillprefers plain foods. The 10- to 12-;ear-old usuallyeats well and enjoys a variety of foods. See Table5-2 for foods which should be includea in this laterelementary school-aged child's diet. Note the dif-ference in recommended portion sizes for variousage children.
Care StudyMrs. Wilson is in your office with her 4-year-old
daughter, Jenny, for a preschool checkup. Thechild appears sulky and pale. You look at her labo-ratory reports taken earlier in the week and findthe following:
hemoglobin: 9.4 gm/100 mlhematocrit: 28%weight: 18.0 kg (40 lb)height: 102 cm (40.5 in)
Jenny is reported to be in good health exceptthat according to her mother she has not been eat-ing right. Both parents are 10% to 15% over theirideal weight. Jenny's 10- year-old brother is at !vsideal weight for height and age. Both the grand-mother and the great-grandmother on the mater-nal side have maturity-onset diabetes mellitus.
11

5. Ncrnal Diet: Age of Parental ControlIKE MIKIIIMMIIIMM=1.iM,
5
a V1IMMEMI=fTable 5-2 Foods Included in a Good Daily Diet (Average' Amounts for Each Age)
FoodPreschool3-5 Years
Early
Elementary6-9 Years
LaterElementary10-12 Years
Early
Adc'escence13-15 Years
MilkEggs
Meat, poultry, fish
Dried beans, peas(also an occasionalreplacement for meat,poultry or fish)
Potatoes (may occasion-ally be replaced by equalamount of enriched maca-roni, spaghetti, or rice)
2 cups1 whole egg
2-3 cups1 whole egg
3 cups or .or21 whole egg
2 ounces (1/4c) 2-3 ounces 3-4 ounces(1 sm serving)(1 sm serving) (1 serving)
3-4 Tbsp
Other cooked vegetables(often a green leafy ordeep yellow vegetable)
3-4 Tbsp
3-4 Tbsp
at 1 or more
mealsRaw vegetables (lettuce,carrots, celery, etc.) 2 or more sm
piecesVitamin C source(Citrus fruits,
tomatoes, etc.)
Other fruits
Cereal, whole grain,restored or enrichedBread, whole grain orenriched
Butter or fortifiedmargarineSweets
Vitamin D source
1 med -sizedorange orequivalent
1/3 cupat 1 or more
meals
1/2 cup or more
2 or moreslices
4-5 Tbsp
4-5 Tbsp
4-5 Tbsp.at 1 or more
meals
cup
1 med -sizedorange or
equivalent1/2 cup or more
at 1 or moremeals
5-6 Tbsp
1/2 cup or more
3-4 cups or more1 or more wholeeggs
4 ounces or more(1 serving)
1/2 cup or more
3/4 cup or more
1/3 cup or more 1/2 cup or more atat 1 or more 1 or more meals
meals
1/3 cup
1 med -sizedorange orequivalent
1/2 cup or more
at 1 or more
meals
3/4 cup or more 1 cup or more
2 or irore
slices
1 Tbsp. 1 Tbsp1/3 cup simple 1/2 cup simple
dessert at 1 dessert at 1
or 2 meals or 2 meals
2 or moreslices
1/2 cup or more
1 large orangeor equivalent
2 servings
1 cup or more
2 or more slices
1 Tbsp or more 1 Tbsp. or more1/2 cup or more 1/2 cup or more at
simple dessert 1 or 2 mealsat 1 or 2 meals
Enou,b to provide 40 I.U. of vitamin D daily
From food, for GroionN Itoifc anti Girls Battle Creek, The Kellogg Coinpain, 1964 U,,ed nail permission eat the Kellogg c_umpany,1964, Battle Creek, MI

6 Nutrition in Primary Care
Jenny's activity level is iow. in the past sixmonths, many of her favorite neighborhood pla!-mates have moved. Jenny has since spent most ofher time watching television and snacking. Mrs.
Test YourKnowledge
Wilson states that she and Jenny used to go onwalks fairly often but they halve "gotten out of thehabit recently."
1. Using the growth charts in Appendix A at the end of this module, into whatpercentile for height and weight does Jenny fall? (Answers are at the back ofthis module )
Height
Weight
2. Your records indicate that Jenny's tricep- skinfold is 12 mm. Using the tri-ceps skinfold standards in Appendix B, determine the percentileF, in whichJenny's triceps measure falls.
Triceps skmfold percentage
3. Using the table in Appendix C, compare Jenny's hemoglobin and hematocritlevels with normals levels How do they compare?
Hemoglobin
1-lematocrit
13
MOMINNIr=IMMEMINIWINIIIIMI, ,IIIMMEMOwm. a 111111=MIMOM
5. Normal Diet: Age of Parental Control 7
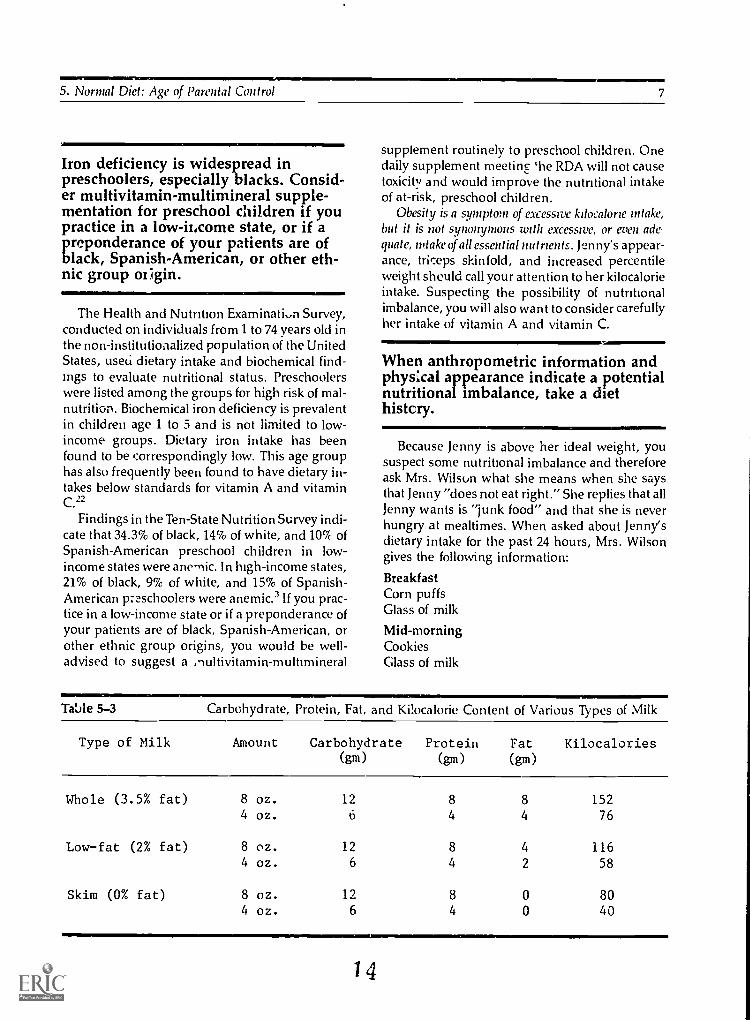
Iron deficiency is widespread inpreschoolers, especially blacks. Consid-er multivitamin-multimineral supple-mentation for preschool children if youpractice in a low-ilicome state, or if apreponderance of your patients are ofblack, Spanish-American, or other eth-nic group of ;gin.il' AMIMIMMIM
The Health and Nutrition Examination Survey,conducted on individuals from 1 to 74 years old inthe non-institutionalized population of the UnitedStates, useci dietary intake and biochemical find-ings to evaluate nutritional status. Preschoolerswere listed among the groups for high risk of mal-nutrition. Biochemical iron deficiency is prevalentin children age 1 to 5 and is not limited to low-income groups. Dietary iron intake has beenfound to be correspondingly low. This age grouphas also frequently been found to have dietary in-takes below standards for vitamin A and vitaminC.22
Findings in the Ten-State Nutrition Survey indi-cate that 34.3% of black, 14% of white, and 10% ofSpanish-American preschool children in low-income states were anemic. In high-income states,21% of black, 9% of white, and 15% of Spanish-American preschoolers were anemic.' If you prac-tice in a low-income state or if a preponderance ofyour patients are of black, Spanish-American, orother ethnic group origins, you would be well-advised to suggest a )multivitamin-multmineral
supplement routinely to preschool children. Onedaily supplement meeting he RDA will not causetoxicity and would improve the nutritional intakeof at-risk, preschool children.
Obesity is a symptom of excessive kilocalorie intake,but it is not synonymous with excessive, or even ade-quate, intake of all essential nutrients. Jenny's appear-ance, triceps skinfold, and increased percentileweight should call your attention to her kilocalorieintake. Suspecting the possibility of nutritionalimbalance, you will also want to consider carefullyher intake of vitamin A and vitamin C.
When anthropometric information andphysical appearance indicate a potentialnutritional imbalance, take a diethistory.
Because Jenny is above her ideal weight, yoususpect some nutritional imbalance and thereforeask Mrs. Wilson what she means when she saysthat Jenny "does not eat right." She replies that allJenny wants is "junk food" and that she is neverhungry at mealtimes. When asked about Jenny'sdietary intake for the past 24 hours, Mrs. Wilsongives the following information:
BreakfastCorn puffsGlass of milk
Mid-morningCookiesGlass of milk
Table 5-3 Carbohydrate, Protein, Fat, and Kilocalorie Content of Various Types of Milk
Type of Milk Amount Carbohydrate Protein Fat Kilocalories(gm) (gm) (gm)
Whole (3.5% fat) 8 oz. 12 8 8 1524 oz. 6 4 4 76
Lowfat (2% fat) 8 oz. 12 8 4 1164 oz. 6 4 2 58
Skim (0% fat) 8 oz. 12 8 0 804 oz. 6 4 0 40
14

Nutrition in Thimory Care
LunchBowl of chicken noodle soupPeanut butter and jelly sandwichGlass of milk
Mid-afternoonCookiesGlass of milk
DinnerHamburger patty
BedtimeCookiesGlass of milk
Portion sizes are as critical in a diethistory as the kind of food eaten. Collectprecise data. Interpreting a diet historywithout precise data can lead to seriouserrors.
As given, this 24-hour recall is not very useful.If you assume what size portions i re meant or useyour own interpretation of what types of foodswere eaten, you can easily misinterpret the actualnutrient intake. An example in Jenny's case ismilk. Compare the kilocalorie differences betweenwhole, low-fat, and skim milk in Table 5-3.
By asking questions about the amounts andtypes of foods Jenny ate yesterday, you learn thatJenny ate the following quantities and types offood:
BreakLtstc corn puffs
8 oz whole milk
Mid-morning5 cookies, each 2 in. dia-meter
8 oz whole milkLunch1/2 c chicken noodle soup1 sl bread1 Tbsp peanut butter2 tsp jelly8 oz whole milk
Table 5-4 Nutrient Composition of a 24-Hour Diet Recall and Recommended Dietary Al-lowances for a 4- to 6-Year-Old Child
Food Amount Calories Protein Fat
(gm) (gm)
Carbohydrate
(gm)
Calcium(mg)
Milk (3.5%) 40 ounces 780 42.0 42.0 58.8 1416
Corn Puffs 1/2 ounce 60 1.2 1.0 12.0 3
ChickenNoodle Soup 4 ounces 26 1,4 0.8 3.3 4.0
PeanutButter 11/2 teaspoon 116 5.5 9.9 3.4 13
CrackedWheat Brea, 1 slice 66 2.2 0.6 13.0 22
Jelly 2 teaspoons 27 -0- -0- 7.0 2
Hamburger 2 ounces 131 16.0 7.0 -0- 7
Cookies 1) 720.0 7.6 30.3 106.0 56
Totals
for Day 1926 76.0 91.6 204.0 1523
RDA 1980
4-6 yr. old Child 1700 30.0 * * 800
* No recommendation established.
15

5. Normal Diet: Age of Parental Control
Mid-afternoon5 cookies, each 21/2 in. diameter8 oz whole milkDinner2 oz hamburger pattyBedtime5 cookies, each 21/2 in. diameter8 oz whole milk
Test YourKnowledge
When Mrs. Wilson said that Jenny had a peanutbutter sandwich, did you picture a sandwich with2 slices of bread or the half sandwich she actuallyhad?
Look at the nutrient breakdown from the24-hour recall in Table 5-4. Compare Jenny's in-take with the RDA listed at the bottom of the table.
4. Looking at the nutritional analysis of Jenny's dietary intake yesterday, listthe 5 nutrients which were consumed at a level lower than recommended.
1
2.
3.
4.
5
Table 5-4 (continued)
Phosphorus
(mg)
Iron
(mg)
Sodium(mg)
Potassium
(mg)
Vitamin A(R.E.)
Thiamin(mg)
Riboflavin
(mg)
Niacin Vitamin C(N.E.) (mg)
1116 Trace 600 17''8 336 0.36 2.04 1.2 12.0
14 0.9 159 -0- -0- 0.13 0.03 0.40 0
15 0.2 408 23 4 0.01 0.01 0.30 Trace
81 0.4 121 134 -0- 0.03 0.02 3.10 0
32 0.3 132 34 -0- 0.03 0.02 0.33 Trace
10.2 2 8 -0- -0- -0- 0.02 0.4
138 2.1 29 335 3 0.05 0,,14 3.60 0
245 1.1 548 101 24 0.05 0.08 0.60 Trace
1642 5.2 1999 2363 367 0.66 2.34 9 .55 12.4
450- 77a-
800 10.0 1350 232f' 500 0.9 1.0 11.00 45
16

10...
Nutrition in inia Care
-a Of IIIIIIMINI
Recommended dietary allowances(RDA) and minimum daily require-ments (MDR) are not the same. TheRDA have a built-in margin of safety,whereas the MDR do not.
./711IMItAThe Recommended Dietary Allowances (RDA)
should not be confused with nutrient require-ments. The allowances represent:
. . levels of intake of essential nutrients considered,in the iudgment of the Committee on Dietary Allow-ances of the Food and Nutrition Board on the basis ofavailable scientific knowledge to be adequate to meetthe known nutritional needs of practically all healthypersons
National Academy of Sciences, 1980'
Requirements, on the other hand, are levels ofnutrient intake below which deficiencies are likelyto occur.
The allowances are calculated to include aver-age requirements for each age and sex. Statisticalvariation is calculated so that persons with higherrequirements are protected under the RDA. Thus,allowances will have a safety margin for most peo-ple. The one exception is the energy level; the en-ergy lel. el was set in this manner in order not to en-courage excessive kilocalorie intake.
The RDA do not cover therapeutic needs or ex-cessive requirements caused by altered metabolicstates, strenuous physical activity, climate ex-tremes, or chronic diseases. For a more thoroughexplanation, see the National Academy of Sci-ences publication "Recommended Dietary Allow-ances, 1980"' and Module 1 on the nutrient con-tent of foods.
At one time, Minimum Daily Requirements(MDR) were widely used on food packaging to in-dicate the nutrient composition of foods in relationto human needs. The MDR were just that mini-mum requirements. These levels were often mis-construed by the lay public to be "recommended"nutrient levels. Actually, though, the MDR are in-adequate for large segments of the population.
Much of the confusion caused by minimum dai-ly requirements has been clarified since legislationconcerning nutrition labeling has been enacted.The Food and Drug Administration has set valuesderived from the RDA which are called UnitedStates Recommended Daily Allowances (US
RDA). These are now used as nutrient labelingstandards.
Because Jenny is showing biochemical and clin-ical evidence of inadequate intake of iron and ex-cessive kilocalorie intake, you might assume thather requirement is not being met for iron and thather kilocalorie requirement is being exceeded.
A 24-hour recali provides importantinformation, but it should always besupplemented by a cross-check in whichyou ask the patient about the number ofservings of foods typically eaten daily orweekly in the four food groups. Thiswill help place the 24 -hour recall intoproper perspective and give you a muchmore accurate picture of how the patienttypically eats on a daily basis.
As a cross-check of Jenny's 24-hour recall, youasked Mrs. Wilson what foods Jenny typically eatsdaily in each of the following food groupings. Herresponses are as follows:
Milk
Fruits
Vegetables
Grains
Butter ormargarine
Meat
17
5 to 6 glasses a day (8 ounces each)
4 to 6 ounces of orange juice mostmornings; likes other fruits suchas apples, oranges, bananas andraisins, but these are not oftenpurchased
1 medium carrot most afternoonsdoes not eat other vegetables
1,2 cup oatmeal or sugar-frostedcornflakes or corn puffs or raisinbran or Frankenberry for break-fast1 or 2 slices of bread
I teaspoon per slice bread
2 ounces chicken, beef, pork, orham; likes pork and beans,cheese, nuts, and eggs, in addi-tion to meat

5. Normal Diet: Age of Parental Control 11
Des3erts at least 1 serving of dessert eachday likes cookies, ice cream,pies, cakes, jello, custard, andpudding
If you had not asked about these food groups,you could have missed the fact that Jenny usuallyhas orange juice every day. Thus, her intake ofvitamin C probably is not as low as it appears inTable 5-4. As you evaluate Jenny's diet more care-fully, you will note a high kilocalorie intake and avitamin and mineral intake which is adequate forthe most part.
Foods that have few nutrients, yet arehigh in kilocalories are those with a lownutrient density per kilocalorie ratio.Such foods should be avoided whenweight reduction is desired or whenchildren are being encouraged to "growinto" their weight.
It is important to consider nutrient density perkilocalorie of the food Jenny eats. Jenny's high in-take of cookies gives her a large number of kilocal-ories with proportionately few other nutrients,since the nutrient density per kilocalorie of cook-ies is low. Look at the nutrient density of some ofthe other foods that Jenny eats (see Appendix D).Carrot sticks and raisins, for instance, have amuch higher nutrient per kilocz:orie ratio thancookies do.
Because you know that Mr. and MI s. Wilson areoverweight, it would be wise to ask Mrs. Wilson todescribe the eating pattern of the whole family.You find out that Mrs. Wilson likes to cook andbakes a lot of cookies and cakes. She says that shelikes a variety of foods but that her husband doesnot. As an example, she explains that he will eatonly two vegetables, Brussels sprouts and greenbeans. She admits also that she has been eating alot of cookies and "goodit. between meals. Shehas been compensating foi this practice, however,by using a small plate at dinner and not eating"too much." Recently she has not enjoyed cook-ing because "her husband is too picky, her son istoo busy to eat, and Jenny is not hungry.' Mrs.Wilson now adds that because Jenny "isn't eatingright" she started yesterday to give her vitamins.
18
Mrs. Wilson has revealed a great deal abouthow Jenny's eating patterns have evolved. Jenny,like all other children, is influenced by how herfamily eats; she learns by imitation. Her nutrition-al problems may be a perfect stimulus to begin toimprove the entire family's eating patterns. Im-press on Mrs. Wilson how important her eatingexample is to her children. Encourage Mrs.Wilson's appreciation of a variety of roods.
Stress to Mrs. Wilson that the most effectiveway parents can help children improve their eat-ing patterns is to improve their own eating pat-terns. The following are suggestions which youmight give Mrs. Wilson in an attempt to improvethe entire family's eating patterns:
1. Make mealtimes pleasant.L. Prepare foods in ways that optimize color and
texture. Prepare "pretty foods" such as carrotcurls, deviled egg boats with a paper sail stuckin the top, and broccoli-tomato-cauliflowerpoles covered with cheese sauce. Be creative;children love to create pretty foods, too, andthey wii: eat them after they make them es-pecially if the parent will eat them with thechildren.
3. Serve and eat a variety of foods.4. Give children small portions.5. Cut "hard-to-ear foods into pieces which the
child can handle.6. Prevent a lot of before-meal snacking.7. Feed children early in the evening before they
are physically tired after a full day of play.8. Introduce new foods often,, but do not force
them on an unwilling child.9. Know what foods of strong flavor or odd tex-
ture may not be immediately accepted.
Mrs. Wilson states that Jenny "is not hungry."It is probable that Jenny is following her mother'sexample of snacking between meals and then noteating much for dinner. It should be rememberedthat it is not uncommon for preschoolers to losetheir appetites in response to a slowing of growth.However, in Jenny's case, more than likely it is thehigh satisfaction value of her between-mealsnacks that is decreasing her appetite at meal-times.
Each snack Jenny ate yesterday added between200 and 300 kilocalories to her intake. Her energy

12
MiVRININIVINavv. V
1\littntion in Pitman/ Care
intake yesterday was over 200 kilocalories in ex-cess of the recommended allowance for her agegroup. If you calculate Jenny's kilocalorie allow-ance according to figures that allow for size dif-ferences in children, you will find the energy rec-
Table 5-5.11=.1"
ornmendations even lower. Table 5-5 indicates therecommended kilocalorie intake per kilogram andpound of body weight for various ages of infantsand children.
Recommended Kilocalorie Intake for Infants and Children
Age
Birth-6 months7 months to 1 year13 to 36 months4 to 6 years7 to 10 years
RecommendedKilocalorieIntake
kcal/kg kcal/lb
117 53
108 50
100 45
90 41
80 36
Recommended Dietary Allowances Washington, D.0 , National Academy of Sciences, 1980.
Test YourKnowledge
5. Using Table 5-5, calculate the recommended energy allowance for Jenny.You should remember that Jenny is a 4-year-old who currently weighs 18 kil-ograms (40 pounds).Recommended energy ailowance
19

SIMONE AIMMMINIMEN.
5. Normal Diet: Age of Parental Control
=11Miii, MIMMII
Overweight parents tend to have over-weight children. Overweight childrenfrequently become overweight adultswith increased risk of chronic disorderssuch as diabetes mellitus, arthritis, gall-bladder disease, and cardiovascular dis-ease.
Jenny is following her parents' example of ex-cessive kilocalorie intake. Overweight adults tendto nurture obesity in their children; the problemsare both hereditary and environmental. The riskof obesity in children with parents of normalweight is 7%. When one parent is obese, there is a4.0% chance that the children will be obese. Whenboth parents are obese, there is an 80% chance thatthe children will be, also. t' If a child in a family oflean individuals is obese, the onset of obesity canoften be traced to some form of psychological trau-ma, such as the loss of a parent, surgery or phys-ical injury.`'
Health problems begin at an early age in obesechildren. Fat infants appear to have more frequentand more severe respiratory infections than donon-obese infants, obese children are more likelyto have orthopedic problems of the legs than arenon-obese children Decreased exercise toleranceis also common in these children.
A recent study by Zack indicated that child-hood obesity contributes significantly to adoles-cent obesitv.24 Therefore, it is advisable for physi-cians to employ relative weight and height tables,growth charts, and measurements of skinfoldthickness to assess the degree of adiposity fromchildhood into adolescence and adulthood.
Obesity during childhood appears to predes-tine the child to adult obesity and to related com-plications, including the chronic disorders of dia-betes, cardiovascular disease, gallbladder disease,and arthntis.4 In addition, the psychological im-pact of juvenile-onset obesity may have lastingeffects upon the individual's life.`'
20
Obesity is characterized by excessivefatness. Hypertrophic obese people havea normal number of over-filled adiposecells whereas hyperplastic obese peoplepossess an excess number of adiposecells. Obese children tend to develop hy-perplastic obesity while adults becom-ing obese as adults tend to have hyper-trophic obesity.
The 'fat-cell hypothesis,"' first proposed byHirsch in 1966,"' suggests that if excess kilocalo-ries are provided during the period of hyperplasiaof adipose cells (infancy, adolescence), the bodyresponds by increasing the number of adiposecells in addition to increasing their size. Once gen-erated, the number of adipose cells remains con-stant throughout life. Successful weight loss in hy-perplastic people results in decreased adipose cellsize. It has been theorized that for the hyperplashcperson, the obese state is the normal one. The"fat-cell hypothesis" is not without controversy.
An obese person's adipose tissue has metaboliccharacteristics that differentiate it from adiposetissue of the non-obese. In afro studies of non-obese and obese adipose tissue demonstrate di-minished response to the lipolvhc effect of the hor-mone epineplinne.14 In a review of informationavailable on adipocytes of obese patients, Angelstated that adipocytes from the obese person havea greater propensity for replication and lipid stor-age than do adipocytes from a non-obese person.'It has been suggested that chronic overnutritiontriggers by means of substrate flow or tropic hor-mone excess, the replicative and anabolic poten-tial of adipocyte precursors to differentiate andstore lipid.
There is some indication in the literatoie thatthe hypertrophic adult obesity and the hyperplas-tic obesity that begins in childhood may not be soeasily separated There are periods of life duringwhich obesity seems to be hyperplashc in nature.

14
But it appears that once all adipocytes are filledwith a certain amount of lipids, preadipocytesmay form to take over the excess. This probably oc-curs at any time that extreme excess kilocalorie in-take occurs.
Jenny is at an age where increasing adipocyte-numbers is likely. Thus, it is very important tocurb habits now that could lead to further over-weight.
Growing children should be allowed to"grow into" their weight rather than goon a severely restricted weight-loss diet.Increasing energy output by increasingactivity is important.
Once present, excess body fat is notoriouslyhard to lose Traditional dieting measures such asthose used in the adult population should not beused in treating childhood obesity. Results ofstudies done where mild or severe kilocalorie re-striction has been used with obese children indi-
Test YourKnowledge
1.111.0MINIMani um In Primal n Care
cate a high drop-out rate from therapy. Most pa-tients lose only a small amount of weight (less than10% lose more than 10 pounds).
Because of the side effects and potential forabuse, use of drugs to treat childhood obesityshould never be recommended. In the first 2 to 4years of life, kilocalorie restriction should beavoided.
A growing child like lenity should not be placedon a markedly restricted diet for weight loss. Thefact that growing takes energy works in favor ofimproving her weight status. If kilocalories are se-verely restricted, her growth and developmentmight be compromised. Generally, the recom-mended allowance for a child from 4 to 6 years isabout 90 kilocalories per kilogram. At her presentweight this allowance would be approximately1,620 kilocalories. This level would probablymaintain her weight. Rather than restricting herintake, it would be wiser to increase her energyoutput by increasing her level of activity. More ac-tivity would probably also take her away fromsnacks. Her appetite at mealtime might increase asshe decreases her between-meal snacks.
6. How would you suggest that Jenny's activity level be increased?

AllMMil5. Normal Diet: Age of Parental Control 15
Carbohydrate-containing foods, espe-cially foods that stick to the toothsurface, contribute to dental caries andperidontal disease by creating anoptimal medium for growth of micro-organisms on teeth which cause toothdemineralization and breakdown oftooth-bone structure,
Jenny's intake of sugar is fairly high because ofall her between meal snacks. It would be wise tocut down her intake of carbohydrates for two rea-sons. First, many of the foods that are high ,n car-bohydrate have a low nutrient per kilocalorie dsity. Second, high carbohydrate intake, espec.,,Ilywhen teeth are not brushed after eating, contrib-utes to the development of dental caries.
Carbohydrates (sucrose, lactose, glucose,fructose, maltose, and starch) are critical in dentalcariogenicity and the development of peridontaldisease. Carbohydrate is used as a fermentable en-ergy source by microorganisms on teeth which
produce lactic acid through glycolysis. The aciditycaused by the lactic acid solubilizes calcium fromthe tooth and demineralizes tooth structure. In ad-dition, carbohydrate is chemically changed by thebacteria into extracellular adhesive polymerswhich allow for plaque formation, adhesion toteeth, and further fermentation of carbohydrate.Carbohydrate is stored extracellularly in theplaque and intracellularly within the microorgan-isms, allowing the microorganisms to survive longperiods of nutritional deprivation. Microorgan-isms present in plaque produce macromoleculesincluding enzymes and mediators of inflamma-tion that further break down tooth and tooth-bonestructure. See Brown` for an in depth discussionof the schematic illustration (see Figure 5-1) on therole of carbohydrates in dental disease.
The cariogenicity of carbohydrate is related tothe length of time the carbohydrate is available tooral flora. Sticky carbohydrates tend to be morecariogenic than non-sticky carbohydrates becausethey adhere to the teeth longer. Complex carbohy-drates tend to be slightly less cariogenic than su-crose and monosaccharides. All carbohydrates,
Figure 5-1 Schematic Illustration of the Role of Carbohydrates in Dental Disease
extracellularpolysaccharides
anaerobic plaquecarbohydrate metabolism
(glycolysis)
lactic pcid
Diet
4,
All Carbohydrates
1microorganisms
plaque accumulation
-=>aaesive polymers
increa
/
e acidic environment
). synthesis of macromolecules(enzymes and mediators of
inflammation)
tooth demineralization dental caries I peridontal diseases
Adapted from Brown, A T "The Role of Dietary Carbohdrate., in Plaque hamation and Oral Diseaw Pre.ent know/Mgt' m Mart-thin, 4th ed., WashmOon, DC, The Nutrition Foundation, Inc , 1976.
22

16 Murillo,' in Primary Care
however, can be used as a metabolizable source ofenergy for the microorganisms. Therefore, clean-ing teeth regularly is important to prevent dentalcaries Fluoride helps prevent dental caries by en-tering the hydroxyapatite structure replacing a hy-droxyl group, resulting in lower mineral solubili-ty, greater crystal size, and a more perfectstructure, thereby making the tooth more resist-ant to demineralization. A 507( to 70`7 reductionof dental caries has been reported as a result ofwater fluoridation.11
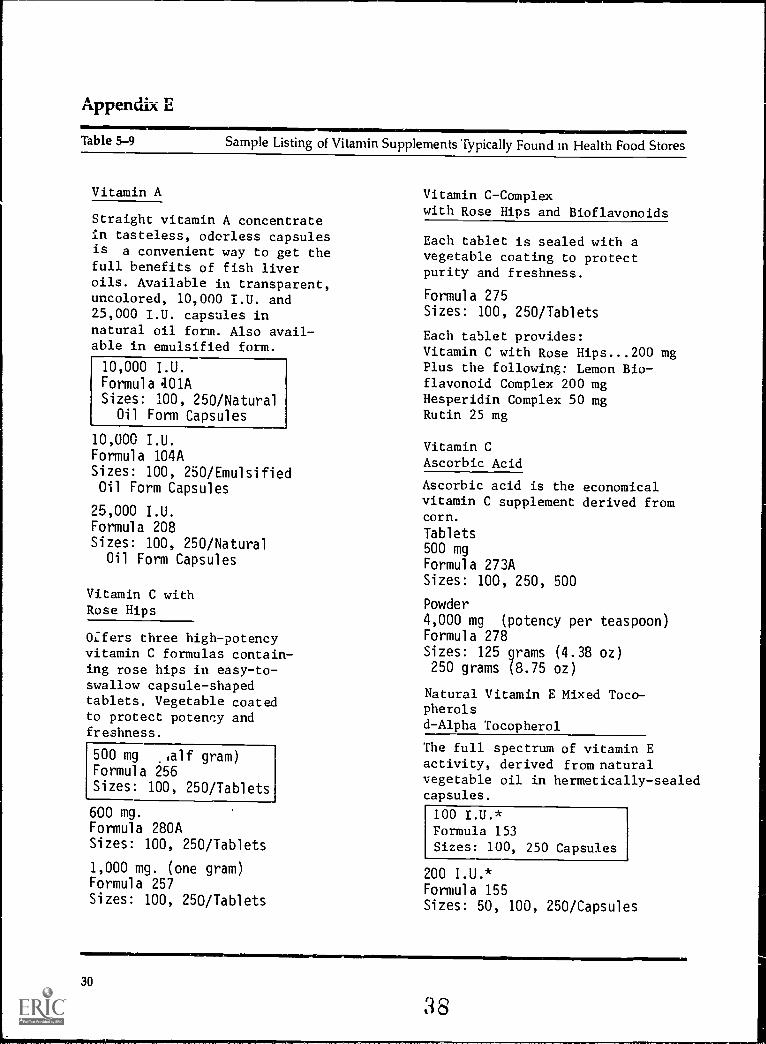
You note that Mrs. Wilson stated she began giv-ing Jenny multivitamins recently. This is informa-tion that you should pursue with Mrs. Wilson.Therefore, you ask her what kind of vitamins shegives Jenny. She reveals that she gives threedifferent vitamin pills recommended in healthfood magazines vitamins A, C, and E.
Mrs. Wilson's comments should alarm you!Health food magazines often print unsoundclaims about foods and nutrients. Their content iscommorly erroneous and misleading, and, if fol-lowed, can lead, in many cases, to serious nutri-tional problems. In such health food magazines, itis frequently ie:ommended that persons consumemegadoses of fat-soluble and water-soluble vita-mins.
Massive quantities of any vitamin arenot wise. All the vitamins in amountsneeded are available from a varied diet.If any vitamin sli.pplement is taken, itshould be a multiple vitamin supple-ment providing no more than the RDA.Vitamin A toxicity can be manifestedacutely by central nervous system symp-toms and chronically by skin disorders.MOP
Vitamin A toxicity can be acute or chronic. Thesymptoms of acute vitamin A poisoning includedrowsiness, irritability, headache, vomiting, andan elevated serum vitamin A level. Chronic hyper-vitaminosis A symptomology includes dermato-sis, alopecia, anorexia, nausea, demineralizationof hone, enlarged liver, and enlarged spleen. Pat-terns of symptomology vary with the age of the M-dividuai. Infants and children are morequickly and dramatically affected than adults.Hydrocephalus may occur in infants with hyper-
vitammosis A. Another manifestation of toxicity isincreased intracranial pressure,, also called pseu-dotumor cerebri.
Hayes and 1-1egsted reviewed reports fromstudies done in the late 1960s which suggestedchronic toxic doses of vitamin A for infants lessthan a year to be from 18,000 to 60,000 IUFor the 1- to 5-year-old group,, the chronic toxiclevel was estimated to be from 80,000 to 500,000 IUdaily. These levels are by no means conclusive. Itis recommended that daily intake of vitamin Ashould never exceed 5 to 10 times the RDA unlessthere is careful supervision by a qualified physi-cian or nutritionist.i"
Tmicity symptoms of vitamin C in children re-ceiving 1,000 milligrams daily for 17 weeks includeabdominal symptoms such as diarrhea,, nausea,gastroenteritis with flatus, and anal irritation.Other symptoms of high intakes of vitamin Cinclude oxalate stone formation, possible copperdeficiency, and decreased anticoagulant effect ofheparin and dicumarol-type anticoagulants. He-molysis of erythrocytes, particularly in peoplewho have depressed mechanisms for handlingoxidant stress such as occurs in glucose -6-phosphate dehydrogenase deficiency also hasbeen observed. Deficiency of vitamin B12 in peo-ple who ingest marginal amounts of vitamin Bitmay occur in persons who consume largeamounts of ascorbic acid. False negative tests fortest-tape measures of urine glucose in diabetic pa-tients may also occur with ingestion of largeamounts of vitamin C.
Althou,;11 toxicity Fvmpt um s of vitamin F havenot been identified, there are many reasons toquestion the prevailing concept that largeamounts of vitamin E can be ingested safely overprolonged periods of time. Ingestion of largeamounts of vitamin E may unbalance the ratio be-tween vitamin E and vitamin K and may, thereby,lead to impairment of blood coagulation.
Appendix E includes samples of vitaminsoffered at health food stores. Those which areboxed are the vitamins given to Jenny. Fortunate-ly,, the levels that Mrs. Wilson was giving Jennywere not toxic, although they were in excess of herneeds. If Jenny is encouraged to eat a better varie-ty of food, she probably will not have need for ad-ditional vitamins. Vitamins should never be substi-tuted fcr food and good eating.
23
5. Normal Diet. Age of Parental Control 17
Test YourKnowledge
7. List the actions you might suggest to help Mrs. Wilson and Jenny improveJenny's nutmional intake.
1
2
3.
4
5
6
7
8.
9
10
8. Select 2 foods from Jenny's diet history that would increase her intake ofiron.
1.
2
9. What 2 changes in Jenny's milk intake would you recommend?
1.
2.
10. What kilocalorie level would you select for Jenny to permit growth and de-velopment, yet reduce adiposity?
24

18 Nutrition in Minion/ Care
11. What 3 nutrients are most often found to be inadequate in the diet of thepreschooler?
1
2
3
12. Explain the role of dietary carbohydrate in the development of dental cariesin a way Mrs. Wilson would understand.
25

5. Normal Diet: Age of Parental Control 19
References andBibliography
1 Angel, A.. "Pathophysiologic Changes in Obesity." Canadian Medical Journal,119:1401, 1978.
2. Brown, A.T "The Role of Dietary Carbohydrates in Plaque Formation andOral Disease." Present Knowledge of Nutrition. 4th ed., Washington, DC, TheNutrition Foundation, Inc., 1976.
3. Carter, J.: "The Ten-State Nutrition Survey: An Analysis." Atlanta, GA,Southern Regional Council, Inc., 1974.
4. Craddock, D : Obesity and Its Management. 3rd ed. Edinburgh, ChurchillLivingston, 1978.
5. Food and Nutrition Board, National Research Council: "Recommended Di-etary Allowances." Washingto.i, DC, National Academy of Sciences, 1980.
6. Frisancho, A.R.: "Triceps Skinfold and Upper Arm Muscle Size Norms forAssessment of Nutritional Status." American Journal of Clinical Nutrition,27:1052, 1974.
7. Goodhart, R.S. and Shils, M.E.: Modern Nutrition in Health ana Disease. 5thed. Philadelphia, Lea and Febiger, 1973.
8. Hayes, K.C. and Hegsied, D.M. "Toxicity of the Vitamins." Committee onFood Protection, Toxicants Occurring Naturally in Foods, 2nd ed. Washing-ton, DC, National Academy of Sciences, 1973, 235-253.
9. Heald, P.P.: "Juvenile Obesity," in Winick, M. (ed ) Childhood Obesity. NewYork, Wiley, 1975, 81-90.
10. Hirsch, J.: "Cell Number and Size as a Determinant of Subsequent Obesity,"in Winick, M. (ed.): Childhood Obesity. New York, Wiley, 1975.
11. Horowitz, H.S.,: "A Review of Systemic and Topical Fluorides for the Pre-vention of Dental Caries." Community,, Dentistry, and Oral Epidemiology,1:104-114, 1973.
12. Knittle, J.L.: "Basic Concepts in the Control of Childhood Obesity," inWinick, M. (ed.): Childhood Obesity. New York, Wiley, 1975. 135-140.
13. Knittle, J.L.: "Obesity in Childhood: A Problem in Adipose Tissue CellularDevelopment." Journal of Pediatrics, 81:1048, 1972.
14. Knittle, J.L. Ginsberg-Fenner, F. and Blown, R.E.: "Adipose Tissue Devel-opment in Man." American Journal of Clinical Nutrition, 30:762-766, 1977.
15. Mayer, J.: "Obesity in Childhood," in Winick, M. (ed.): Childhood Obesity,New York, Wiley, 1975, 73-80.
16. Naiional Nutrition Consortium Inc. Committee on Safety, Toxicity, andMisuse of Vitamins and Trace Minerals: "Vitamin-Mineral Safety, ibxicity,and Misuse." Chicago, IL, The American Dietetic Association, 1978.
17. Nesser H.H. and Singer, L.: "Fluoride," in Nutrition Foundatit -, 4th ed.Nutrition Reviews' Present Knowledge of Nutrition. New York, The NutritionFoundation, Inc., 1976, 337-344.
18. The Nutrition Foundation. Nutrition Reviews Present Knowledge of Nutrition.New Yerk, The Nutrition Foundation, Inc , 1976.
19. Pipes, P.L.: Nutrition in Infancy and Childhood. St. Louis. MO,, C.V. Mosby,1977.
26

20 N !!!on 1): :I no
Resources forthe Patient
Answers
20. Prewitt-Rice, E. and Ande,son, J J.13.: Nutrition in Chlldl..rud and AdolescenceChapel 1 till, NC, I lealth Sciences Consortium, 1978.
21. Schneider, H A.: Nutritional Support of Medical Practice I lageistown, MD,Harper & Row,, 1977.
22. United States Department of Health, Education, and Welfare: PreliminaryFindings of the First Health and Nutrition bammatum Survey, United Stith-,1971-1972, DHEW Pub. No. (HRA) 74- 1219 -I, Washington, DC, 20402, U.S.Government Printing Office.
23. Winick, M (ed.) Childhood Obesity. New York, Wiley, 1975.
24. Zack, P M., et al.: "Longitudinal Study of Body Fatness in Childhood andAdolescence. Journal of Pediatrics, 9.126, 1979.
'Deutsch, R.M.. The Neu, Nuts Among the Berries. Palo Alto, CA, Bull Publishing,1977.
Book about "nutrition nonsense " A record ` food faddists' beliefs andinfluences.
Deutsch, R.M.: Funnily Glade to Better Food and Better Health. Des Moines, IA,Meredith, 1971.
A general, basic book on nutrition in a 'er:, readable form the lay public willenjoy.
McWilliams, M.: Nutrition for toe Growmg Yi'ars 2nd ed. New York, Wiley, 1975.Covers nutrition basics and problems often faced by health professionals indealing with patients in the growing years. Practical application.
Lansky Vicky: Feed Me,, I'm Yours. Bantam, 1974.Good nutrition hints for the lay reader.
1. Height 50th percentileWeight 75th percentileIt would be important to know in what percentile Jenny was during earliervisits to your office. Consider also what Jenny's mother's and father'sheights and weights are, as well. This information is iraportant to interpretcorrectly Jenny's height and weight percentile.
In your records, you find that Jenny has consistently fallen in the 50th per-centile for both height and weight throughout her first 3 years. You knowthat Mr. and Mrs Wilson are of average frame and height. You, therefore,can consider that Jenny's final height will most likely be about the average ofner parents' heights.
2. Triceps skinfold percent:, 85%
3. Both hemcg,lobir. and hematocrit are deficien
Parameter Jenny' s values Acceptable values
Hemoglobin
Hematocrit
9.4 gm %
28%
> 11.0 gm %
> 34%
27

M11111=MMIIINSiii
5. Normal Diet Age of Parental Control 21
4. IronVitamin' AThiaminNiacinVitamin C
5. Recommended energy allowance from Table 5-5 is 1,620 to 1,640 kilocalories.Recommended energy allowance from the RDA (Table 3-5) is 1,70U kilocalo-ries.
6. Mrs. Wilson mentioned that she and Jenny used to take walks. Encouragingthis activity would likely succeed since it recently has been part of their dailyroutine. It would also help Jenny see potential playmates in her own neigh-borhood. Community facilities might be available for swimming lessons orother organized physical activities.
7. There are many ways to approach Jenny's nutritional problems. Here aresome suggestions:1. Stop Mrs. Wilson's use of vitamin pills, unless she will switch to a once-
daily, multiple -vitamin.2. Encourage Mrs. Wilson to have a larger variety of foods and meals, espe-
cially fruits and vegetables.3. Encourage Mrs. Wilson to limit bud ing and making high-kilocalorie des-
serts.4. Encourage the use of foods high in iron.5. Encourage the use of foods high in vitamin C to enhance absorption of
iron.6. Encourage Mrs. Wilson to help Jenny become more physically active. It
may help "?nny forget about food and increase her energy output.7. Encourage Mrs. Wilson to cut down the amount of milk Jenny drinks.8. Encourage Mrs. Wilson ,, use 2% milk for kilocalorie reduction.9. Suggest snack foods high in vitamin A and iron.
10. Encourage Mrs. Wilson to cut down ',er own kilocalorie intake; let Jennykt, -IN that she enjoys eating vegetables and fruits.
8. Eggs and raisins are good sources of iron which Jenny usually eats.
9. 1. Cut down the total amount of milk Jenny consumes to 4 cups daily.2. Substitute skim or low-fat milk for whole milk to decrease the kilocalorie
content of Jenny's diet.
10. Considering an allowance of 90 kilocalories/kilogram for the 4- to 6-year oldchild, calculations for an appropriate allowance would lead to an answersomewhere between 1,600 and 1,700 kilocalories. Because there are manysimple modifications that can be made in Jenny's diet in order to reduce un-necessary kilocalories, a specific kilocalorie level is probably not necessary atthis point. If you can convince Mrs. Wilson to increase vegetables and fruitsand cut down on milk and/or milk fat and sweet desserts, chances are goodthat Jenny will lose her excess adiposity and continue to grow normally. Ifher eating habits have not improved by the next visit, a planned kilocaloriediet may become necessary.
28

22 Nutnhon m Prunary Clue
11. Vitamin AVitamin CIron
12. You should have included the following concepts in your answer:1. Carbohydrates allow bacteria always present in the mouth to make sub-
stances that break down the structure of the tooth and bone, causingdental caries and peridontal disease.
2. Sticky carbohydrates adhere to the teeth and allow bacteria a long timeto cause dental caries.
3. You could also add the following:a. brushing and flossing teeth after eating is wiseb. fluoride helps make the tooth structure stronger;, use of fluoride-
containing toothpaste is wise.c. Jenny should have regular dental checkups.

Appendix A-1
Figure 5-211.0
Growth Chart Girls: 2 to 18 Years Physical Growth NCHS Percentiles
77 0 11 12
HEM=13
:
17
HEM"' EMIlllas
=
77
76
47372
7°169
68
6;6:
:32
76
75 ;
7473 185
71 1 -=
7 . NM= '
REHMEIN1111.:
77 ER67°9
6687 166:16564
EH IIIMEMEIHREMI
RIMMEMENELMEMHENN : =WEEll1 miNIMEINLINTMEN:
6231:
6059-
:7
56-55
54
525,_
5049-48
:4543
4 2^
:1-1.Hriair33:
33
33
3332
21:
tillINIMENFAriEMPITM50
'4;1.11
A,0
13 e
125
120
110
i05111Efliall
9!rara
sumllnomrargrammon
EINIMMEWANNErial
:
HIMEMPardrArdinE WAN : 11 :
.
: 954-21
0
80
75
7°
200
- 190
-180
160
-150
-140
130
120
110
i.-90
80
70
MENTral : ; r.rMArA 1111100.
HEMENEWM.
' Es En 5
60
55
50
35
ginimir
ktafPAM
EHr V
HRHH HI
KalgirdillEnoransommin
EmarrArnm-HEENNBEEMIn'
80
7
..MIMPREEREI
NH IIMEMENIPVAIMEHMENIMOI
30
60
NH_iv.25
204040
3I
00-001r00,-.1.e-AMMk:Pilig
2 3 4 SMEE.
MEEMEM HE ki: I
7 i 8 9 1) 11 12 13 i 14 15 16 17 18
23
30

Appendix A--2
Figure 5-3 Growth Chart Girls: Prepubescent Physical Growth NCHS Percentiles
02far.
(I)
48
V
DATE AGE STATURE WEIGHT 111111/1111/1.1 11111
1111 11111111111 UM 50 -110EIMEUESUIMEEEEI -4---.:
nommonamoinum 4:-;11:10111110010011111111 *05EMEMMENEEEMIE4---IEEIENIESIEll OW 465100
---IEMEECEI--1 NE -zit,-mmeammossomiums 954
311011=umummumm11113=MINE 42plim1101111111112MENIMal 40
EMENEEEEEEllm KmEMEMEEZEIEME11 85
EMEMMUMIMEMEINMONEMEINEEMEM 800EMIWA-F/EMEIERBIEEIMEIESEEMEIEW 75
70
3n
i-6-
, 6C
2254 5
2
i3 5Ci2i
E
2,,-
4(
17
EN MIMIIIMIEMEE
65
60
55
50
45
40
5
30
25lb
millennium/1m ME 11111MEAREIEE3310 ITIEMEMIIMMEEMES=ERNSWAIEMENE29 11111llEMEMEEMENBENEffEAMEINEME28
MEPOMOMMEEEEMEM=IIVAIIEWMAINEE---EN
'-INEMEEUEEMEMEMFAIMEEENIMEEMEMEMIESEESEVIEWAKEMEM2iNEVENNIEMENEEVArMEMIEllmtiME
2254 Emma IIIMEEEMEEEIVAISIBUEMMIEMEIEres23 MMEMEIMMEMENSEIEWFAISPISINIEMEMIEM
isammumboniummremarwrirammomurs2221 MEIMWEINIMWMPAMM2111MMOMMIESMa t- ' um mamoutirszommummom16 EN18 MIMMINSUMIONfirdraMirdEllOMEMINIMINIEV8-17- omen16MIEUE-rAMOrderMINEMEIMEMINEMEMES16011111MLArarigormadmm-nmismolummommoZ
-I me AcrenosouranniumumussumPlitraileiWAMEEMIEUEMEM
3,
14
3(
1,2
2!
kg It
-, mumumaoplumammoutlimammummumummf mumaradommuummuumummuniummemme132- mumumunammummummommoomminummus
MINIMMUMIIIIIIMMME11111111111111111111111MINIEF-kg -4 gighluiErMIDEMILM REVIIIEEMEEEMEM=
cm 85 ILCUEZINIZI 105 1 110 1 115 11120 , 125 1130 , 135 140 ' 145 Iin 34 35 36 37 38 39 40 41 42 43 44 45 46 47 48 49 50 51 52 53 54 55 56 57 58
2/E
31

IMA
M'
1..1111MIN
IIIMIllgil
L?1,
88
1-
-IIM
IEIN
FR
OM
MI E
OM
ill111111
*11
iE
EL=
.1111111111, 111, VI
E 1111111116. X
V E
N t M
EO
IL1 N
EM
'INN
EN
', '1',ZIN
NIM
ME
11111E
li1111:94111116:11.
111111 'UM
SIB
O, E
N1111
Mu.
0..I.&
ME
E111.,. a
'9"B
OA
.E
M%
Anon=
hi, 'mom
NE
TA
PAR
VIIC
Mil
ilkallEIV
ISIIIIIIIL
.M. M
E M
K=
likklitillM
EM
'ME
INillisillne
EM
&:
I ME
II1 NE
S111M
ILIO.
ME
I ME
MIII
1111111L,N
NE
1111M
ILAM
IL.I M
EM
IMM
INIM
IL111
011100 1161110110111111M
ME
ME
NIC
EN
INR
IER
EE
MIN
IEM
EN
NE
111 II1 11E1111 M
in ME
MB
ER
ME
MU
AH
EM
2

:.
_0
-a
a.
..
..
1t1t9.......
B%
....v77)12.
jziam.
-.-
.-
RI
.6IdiuguillardiS
IMM
Eaffiglaifillindril
KO
MM
EN
ITL
ER
INN
EL
.'N
EM
EM
ME
MIN
IMM
INk.
.
II.. 11,11001110111111L IM
OM
INI.
ImillIIIIIIIIIIIN
E1110111111111 M
IMI
011111O
MM
IMM
EM
Iffiimm
omm
om N
EI_
;
:i111110
II 1111111111111111M
EN
EM
MIV
il MIN
IMIN
EM
EM
MIE
-
- TN
.11.1............
...,
.
li1
I liI 1 M
EM
MO
M1
II II
NII
11111111111110 lir 'IL
4#9111
Im
iiimm
ompuellue
_1ii
IIII
1 ii 01111lluum
mlum
might
. k. a111.43
IHT
lip g 1.11. Iljili 11111111E1 n
CO
In',T
Cn N

Table 5-6 Percentiles for Triceps Skinfolds for Whi:es of the Ten-State Nutrition Survey of1968-1970
Triceps skinfold percentiles (mm)
Age GroupMales Females
(years) 5th 15th 50th 85th 95th 5th 15th 50th 85th 95th
0.0-0.4 4 5 8 12 15 4 5 8 12 130.5-1.4 5 7 9 13 15 6 7 9 12 151.5-2.4 5 7 10 13 14 6 7 10 13 152.5-3.4 6 7 9 12 14 6 7 10 12 143.5-4.4 5 6 9 12 14 5 7 10 12 144.5-5.4 5 6 8 12 16 6 7 10 13 165.5-6.4 5 6 8 11 15 6 7 10 12 156.5-7.4 4 6 8 11 14 6 7 10 13 177.5-8.4 5 6 8 12 17 6 7 10 15 198.5-9.4 5 6 9 14 19 6 7 11 17 249.5-10.4 5 6 10 16 22 6 8 12 19 2410.5-11.4 6 7 10 17 25 7 8 12 20 2911.5-12.4 5 7 11 19 26 6 9 13 20 2512.5-13.4 5 6 10 18 25 7 9 14 23 3013.5-14.4 5 6 10 17 22 8 10 15 22 2814.5-15.4 4 6 9 19 26 8 11 16 24 3015.5-16.4 4 5 9 20 27 8 10 15 23 2716.5-17.4 4 5 8 14 20 9 12 16 26 31
Ada ted from Fnsancho, A R "Triceps Skinfold and Upper Arm Muscle Site Norms for Assessment of Nutritional Status Ameri-can ournal of Clinical Nutntwn, 27:1052, 1974.
27
34

Appendix C
Table 5-7 Historical Development of the Ten-State Nutrition Survey 1968-1970
Guidelines for Classification andInterpretation of Group Blood andUrine Data
Determination
Classification Category
Less than acceptable AcceptableDeficient Low
Hemoglobin, g/100 ml6-23 months2- 5 years
6-12 years13-16 years, r.A.,
13-16 years, female>16 years, male>16 years, female
Pregnant, 2nd trimesterPregnant, 3rd trimester
Hematocrit, %6-23 months2- 5 years6-12 years13-16 years, male13-16 years, female>16 years, male>16 years, female
Pregnant, 2nd trimesterPregnant, 3rd trimester
<
<
<
<
<
<
<
<
<
<
<
<
<
<
<
<
<
<
9.010
10
12
10
12
10
9.5
9.0
28
30
30
37
31
37
31
30
30
9.0- 9.910.0-10.910.0-11.412.0-12.910.0-11.4
12.0-13.910.0-11.99.5-10.99.0-10.4
28-3030-3330-35
37-3931-35
37-4331-37
30-34
30-32
>=>
>=>
>=>=>=>=>=
>
>=>=>
>=>=>
>=>=
10.0
11.0
11.5
13.011.5
14.0
12.0
11.0
10.5
3134
36
40
36
44
38
35
33
Adapted from Ten-State Nutrition Survey, 1968 -1970 I Historical Development. II. Demographic Data. U 5 D.II.E.W., HealthServ-ices and Mental Health Administration, p. 1-115.
28
3 5

Appendix D
Table 5-8 Nutrient Breakdown of Some of the Foods Jenny Eats
Foou Amount Ki calories Protein Fat
(gm) (gm)
Carbohydrate Calcium Phosphorus Iron
(gm) (mg) (mg) (mg)
Sodium
(mg)
Potassium Vitamin A Thiamin Riboflavin Niacin Vitamin C
(mg) (R.E.) (mg) (mg; (N.E.) (mg)
Carrots 1 meditun
raw
42 1.1 0.2 9.7 37 36 0.7 47 341 11,000 0.06 0.05 0.6 8
Oatmeal 1/2 cup 55 2.0 1.0 9.7 9 57 0.6 218 61 0 0.08 0.02 0.1 0
Orange
juice
1/2 cup 54 0.8 0.1 12.8 11 19 0.1 1 223 240 0.11 0.01 0.4 54
Raisins 31/2 ounces 289 2.5 0.2 77.4 62 101 3.5 27 763 20 0.11 0.08 0.5 1
Eggs One 81 6.5 5.8 0.5 27 103 1.2 61 65 590 0.05 0.14 0.05 0
Cheese, 1 ounce 133 8.3 11.0 0.7 250 159 0.3 233 27 437 0.01 C.15 0.03 0Cneddar
Custard 1/2 cup 115 5.4 5.5 11.1 112 117 0.4 79 146 350 0.04 0.19 0.1 Tram
363 ri
A Al- lrriFpcituut
Table 5-9 Sample Listing of Vitamin Supplements Typically Found in Health Food Stores
Vitamin A
Straight vitamin A concentratein tasteless, odorless capsulesis a convenient way to get thefull benefits of fish liveroils. Available in transparent,uncolored, 10,000 I.U. and25,000 I.U. capsules innatural oil form. Also avail-able in emulsified form.
10,000 I.U.
Formula 401ASizes: 100, 250/NaturalOil Form Capsules
10,000 I.U.Formula 104ASizes: 100, 250/EmulsifiedOil Form Capsules
25,000 I.U.Formula 208Sizes: 100, 250/Natural
Oil Form Capsules
Vitamin C withRose Hips
0:fers three high-potencyvitamin C formulas contain-ing rose hips in easy-to-swallow capsule-shapedtablets. Vegetable coatedto protect potency andfreshness.
500 mg 'galf gram)Formula 256Sizes: 100, 250/Tablets
600 mg.Formula 280ASizes: 100, 250/Tablets
1,000 mg. (one gram)Formula 257Sizes: 100, 250/Tablets
Vitamin C-Complex
with Rose Hips and Bioflavonoids
Each tablet is sealed with avegetable coating to protectpurity and freshness.
Formula 275
Sizes: 100, 250/Tablets
Each tablet provides:Vitamin C with Rose Hips...200 mgPlus the following: Lemon Bio-flavonoid Complex 200 mgHesperidin Complex 50 mgRutin 25 mg
Vitamin CAscorbic Acid
Ascorbic acid is the economicalvitamin C supplement derived fromcorn.
Tablets500 mgFormula 273ASizes: 100, 250, 500
Powder4,000 mg (potency per teaspoon)Formula 278Sizes: 125 grams (4.38 oz)250 grams (8.75 oz)
Natural Vitamin E Mixed Toco-pherols
d-Alpha Tocopherol
The full spectrum of vitamin Eactivity, derived from naturalvegetable oil in hermetically-sealedcapsules.
100 I.U.*Formula 153
Sizes: 100, 250 Capsules
200 I.U.*Formula 155Sizes: 50, 100, 250/Capsules
30

Table 5-9 (continued)
Natural Vitamin E Mixed Tocopherols(continued)
300 I.U.*Formula 156
Sizes: 50, 100, 250/Capsules
400 I.U.*Formula 157Sizes: 50, 100, 250/Capsules
*Potency claimed for "d-Alpha"tocopherol only; also containsd-Beta, d-Gamma and d-Deltatocopherols.
Emulsified Vitamin E
Natural Vitamin E (mixedtocopherols) are emulsified withapple pectin. Emulsifyingbreaks oil globules into tinyparticles so that even thosewho experience difficulty digestingoils can receive the benefitsof natural vitamin E in its oilform. Available in two potencies,in transparent, uncolored capsules.
100 I.U.*Formula 152Sizes: 100, 250/Capsules
200 I.U.
Formula 154ASizes: 50, 100, 250/Capsules
*Potency claimed for "d-Alpha"tocopherol only; also containsd-Beta, d-Gamma, and d-Deltatocopherols.
Natural Vitamin Ed-Alpha Tocopheryl Acetate
This vitamin E is derivedfrom natural vegetable oils.Hermetically-sealed incapsules for freshness.
Natural Vitamin E (continued)
100 I.U.
Formula 159Sizes: 100, 250/Capsule
200 I.U.
Formula 162Sizes: 100, 250/Capsules
300 I.U.
Formula 163Sizes: 50, 100, 250/Capsules
400 I.U.
Formula 164Sizes: 50, 100, 250, 500/Capsules
500 I.U.Formula 165Sizes: 50, 100, 250, 500/Capsules
600 I.U.
Formula 166Sizes: 30, 100/Capsules
800 I.U.Formula 168Sizes: 30, 100 /Capsules
3931

Some Abbrevati-ms Used in theNutrition in Primary Care Series
ATP adenosine triphosphatec cupcc cubic centimeterCNS central nervous systemFDA Food and Drug Administrationgm gramIBW ideal body weightIll International Unitslc:al kilocaloriekg kilogramlb poundlg largeMCV mean corpuscular volumeMDR minimum daily requirementmed mediummEq tnilliequivalentmg milligramMJ megajouleml milliliteroz ounceRDA Recommended Dietary AllowancesRE retinol equivalentssl slicesm smallTbsp TablespoonTPN total parenteral nutritiontsp teaspoonUSDA United States Department of Agriculture