document resume ed 304 811 author title … · document resume ed 304 811 ec 212 501 author...
TRANSCRIPT

DOCUMENT RESUME
ED 304 811 EC 212 501
AUTHOR Ysseldyke, James E.; And OthersTITLE Regular Education Teachers' Perceptions of
Instructional Arrangements for Students with MildHandicaps. Research Report No. 8. InstructionalAlternatives Project.
INSTITUTION Minnesota Univ., Minneapolis.SPONS AGENCY Office of Special Education and Rehabilitative
Services (ED), Washington, DC.PUB DATE Jan 88GRANT G008630224NOTE 51p.
PUB TYPE Reports - Research/Tecnnical (143) --Tests /Evaluation Instruments (160)
EDRS PRICE MF01/PC03 Plus Postage.DESCRIPTORS Classroom Environment; *Classroom Techniques;
Elementary Secondary Education; Grouping(Instructional Purposes); *IndividualizedInstruction; *Mainstreaming; *Mild Disabilities;Surveys; Teacher Aides; *Teaching Methods
ABSTRACTA survey of 197 regular education teachers
representing 35 states indicated few changes in structuralarrangements or adaptive instruction as a function of havinghandicapped students in their classes. Elementary and secondary levelteachers completed a 2-page survey which explored the use of otheradults in the classroom, size of instructional groups, primary methodof instruction used, and degree of classroom structure. Number ofadults used in the classroom differed from what it typically would befor only 26 percent of respondents. Sixty percent reported directinstruction as the preferred method for handicapped students. Morethan half reported that the degree of classroom structure (typicallydescribed as "highly structured") would not change if handicappedstudents were not present. Adaptive instructional techniques werealmost unanimously viewed as desirable, with teachers at bothelementary and secondary levels indicating that the most desirableapproach is holding the student accountable for performance andquality of work. It is concluded that regular education teacherseither do not see a way to make the classroom environment differentfrom what it would be without a handicapped student, or are unable toimplement potential changes. A copy of the survey is appended.(JW)
Reproductions supplied by EDRS are the best that can be madefrom the original document.
nesota
RCH REPORT NO. 8
U $ DEPARTMENT OF EDUCATIONoffice of Educational Research and Improvement
EDUCATIONAL RESOURCES INFORMATIONCENTER (ERIC)
trirhis document hes been reproduced asreceived from the person or organozattonortgonattng .1Mawr changes have been made to improvereproduction qualttY
Points of view or options staleu tn rhos doCument do not necessarily represent officialOERI posibon or policy
James E. Ysseldyke, Martha L. Thurlow,Joseph W. Wotruba and Paula A. Nania
INSTRUCTIONAL ALTERNATIVESPROJECT
January, 1988
"PERMISSION TO REPRODUCE THISMATERIAL HAS BEEN GRANTED BY
James E. Ysseldyke
TO THE EDUCATIONAL RESOURCESINFORMATION CENTER (ERIC)."

Research Report No. 8
REGULAR EDUCATION TEACHERS' PERCEPTIONS OF INSTRUCTIONALARRANGEMENTS FOR STUDENTS WITH MILD HANDICAPS
James E. Ysseldyke, Martha L. Thurlow,Joseph W. Wotruba and Paula A. Nania
Instructional Alternatives Project
University of Minnesota
January, 1988
3

Abstract
Nearly 200 regular education teachers from across the nation provided
information on instructional arrangements they u ;e with "mildly
handicapped" students assigned to their classes. They reported their use
of other adults in the classroom, instructional grouping practices, primary
inelhods of instruction, degree of classroom structure, and adaptive
instruction. These teachers, on the average, noted few differences in
structural arrangements and adaptive instruction as a function of having
handicapped students in their classes. Differences were noted primarily as
d function of grade level of students (elementary vs. secondary) and,
minimally, as a function of geographic location. Implications of these
findings for services for handicapped students are discussed.
This project was supported by Grant No. G008630224 fromthe U.S. Department of Education, Office of SpecialEducation and Rehabilitative Services (USERS). Pointsof view or opinions do not necessarily represent officialposition of USERS.
g

Regular Education Teachers' Perceptions of InstructionalArrangements for Students with Mild Handicaps
Increasing numbers of children with mild learning problems are being
identified as handicapped and eligible for special education services. When
this occurs, however, most of these students continue to spend the majority of
their school day in mainstream classrooms. Essentially, their education is the
responsibility of the mainstream teacher, who is faced with the added problem of
having to devise educational arrangements for students who leave the classroom
for anywhere from 30 minutes to three hours to receive services from a special
education professional. We assume that teachers in such mainstream settings use
a variety of instructional procedures and arrangements for these students.
In fact, we know very little about the instructional arrangements teachers
use for mildly handicapped students in regular education settings, and very
little about the effectiveness of various instructional arrangements. About the
only factors for which we have some information are related to class size or
student-teacher ratio (Ysseldyke, Thurlow, & Wotruba, 1987), and grouping
practices (Ysseldyke, Thurlow, Christenson, & McVicar, in press).
This study was undertaken to obtain information from a national sample of
teachers about the types of instructional arrangements used in regular education
classrooms for students with mild handicaps. Two fundamental types of
instructional arrangements were given primary attention: "structural
arranyements" and "adaptive instruction."
r-J

2
Method
Subjects were 197 full-time regular education teachers who served mildly
handicapped students in their regular education classrooms. The teachers
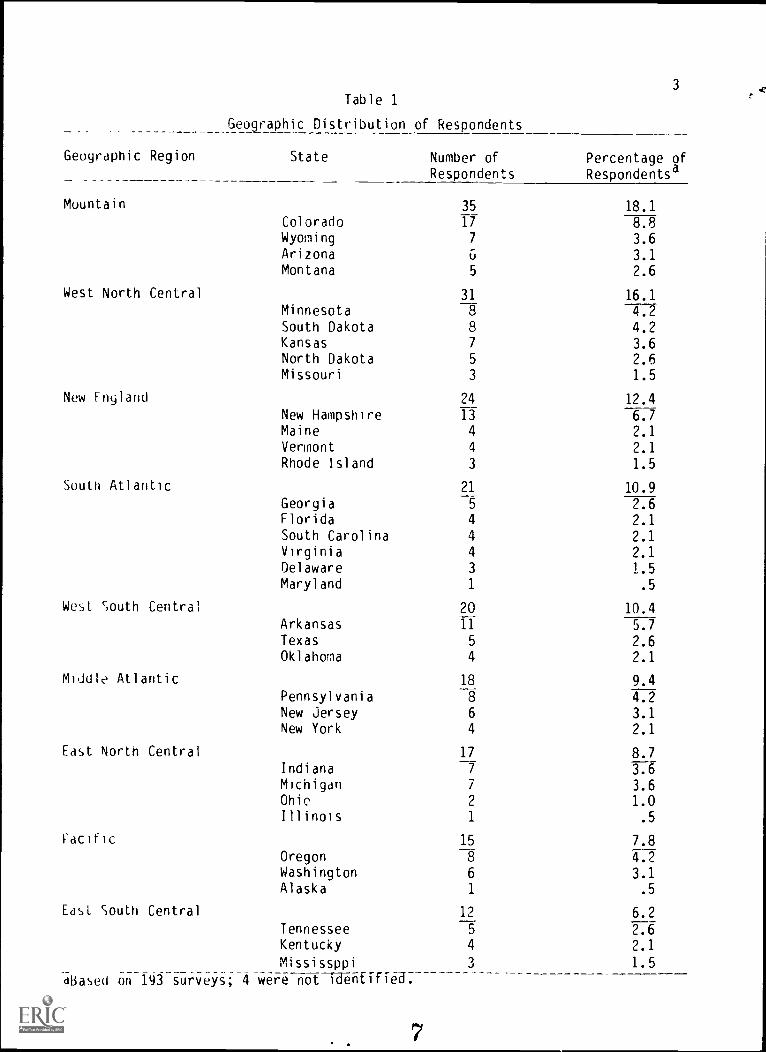
represented 35 states, which included all nine geographic division
classifications used by the U.S. Bureau of Census (see Table 1). Sixty-eight
percent of the sample indicated that they worked in elementary settings and 32%
specified secondary/middle school settings. Over two-thirds of the teachers
indicated that the socioeconomic level of the majority of the students served in
their schools was either "low to moderate" (43.1%) or "moderate" (28.4%); the
categories of "moderate to high," "low," and 'high" were checked by 17.3%, 9.6%,
and 1.0%, respectively; one respondent did not indicate students' socioeconomic
status (see Table 2).
The majority of the respondents (53.3%) indicated that they served between
one and five mildly handicapped students, with two (15.2%), three (12.7%), and
tour (10.7%) being the most frequently reported numbers of students served.
With the exception of one respondent, all teachers reported serving fewer than
25 mildly handicapped students (see Table 3). One secondary level teacher
reported having 75 mildly handicapped students. This number, though much higher
than those reported b all of the others, was still possible depending upon how
classes were scheduled. On the other hand, it is possible that an error
occurred in subject selection procedures, and that this teacher was not a
regular education teacher, but rather a resource room teacher, a consultant, or
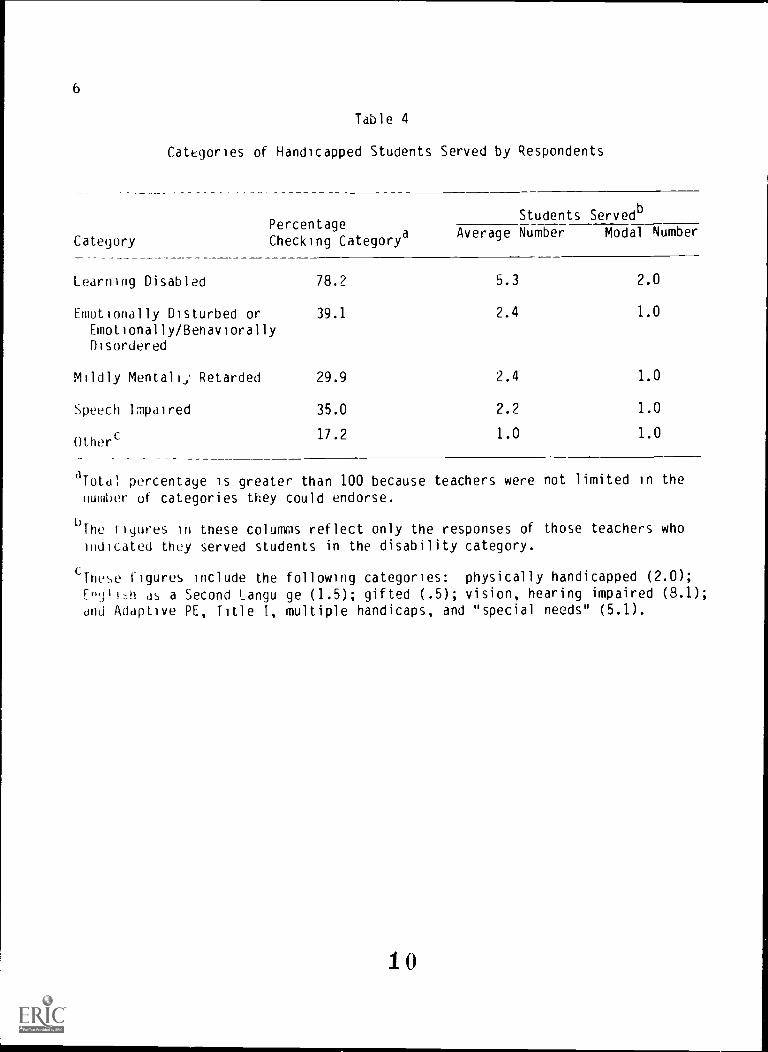
some other specialized staff member. Approximately 78% of the respondents
indicated that they served learning disabled students; approximately 39% served
emotionally disturbed or emotionally/behaviorally disordered students, 35%
6
- --
3
Table 1
Geographic Distribution of Respondents
Geographic Region State Number of Percentage ofRespondents Respondentsa
Mountain 35 18.1
Colorado 17 8.8Wyoming 7 3.6Arizona 6 3.1Montana 5 2.6
West North Central 31 16.1Minnesota 8 4.2South Dakota 8 4.2Kansas 7 3.6North Dakota 5 2.6Missouri 3 1.5
New England 24 12.4New Hampshire 13 6.7Maine 4 2.1
Vermont 4 2.1Rhode Island 3 1.5
South Atlantic 21 10.9Georgia 5 2.6Florida 4 2.1South Carolina 4 2.1Virginia 4 2.1Delaware 3 1.5Maryland 1 .5
West South Central 20 10.4Arkansas 11 5.7Texas 5 2.6Oklahoma 4 2.1
Middle Atlantic 18 9.4Pennsylvania 8 4.2New Jersey 6 3.1New York 4 2.1
East North Central 17 8.7Indiana 7 3.6Michigan 7 3.6Ohio 2 1.0Illinois 1 .5
Pacific 15 7.8
Oregon 8 4.2Washington 6 3.1Alaska 1 .5
Edsi South Central 12 6.2Tennessee 5 2.6Kentucky 4 2.1
Mississppi 1J 1.5
abased on 193 surveys; 4 were not idenfiff6d.
7

4
Table 2
Socioeconomic (SES) Levels of Students Served by Respondents
SES Level Number Checking
Low
Low-to-Moderate
Moderate
Moderate-to-High
High
No response
andsed on 197 cases.
Percentage of
Category Respondents
19
85
56
34
2
1
9.6
43.1
28.4
17.3
1.0
.5
Table 3
Total Number of Students on Respondents' CaseloadsClassified as "Mildly Handicapped"a
Number of
StudentsNumber of
RespondentsPercentage ofRespondentsa
1-5 105 53.5
b-10 37 18.9
11-19 22 11.0
24 1 .5
75 1 .5
dReportec frequencies and percentages are based on 197 respondents.However, percentages do not equal 100 and frequencies do not equal 197due to the omission from this table of the 31 respondents who eitherdid riot respond to this question or Alho responded with "0".

5
served students with speech impairments, and 30% served students labeled as
mildly mentally retarded. An "other" category, which included vision and
hearing impaired, physically disabled, gifted, English as a Second '..anguage,
and others, was cnecked by a total of 17.2% of the subjects (see Table 4).
Materials
The two-page survey developed for this study was based on the literature in
the field of Adaptive Education/Adaptive Instruction, which focuses on the use
of alternative instructional arrangements to meet the diverse needs of
individual students within regular education classrooms. The survey asked for
intormation about the students served by the respondents and the respondents'
practices and opinions concerning "structural arrangements" and "adaptive
instruction" in their classrooms. A copy of the survey can be found in the
Appendix.
Procedure
Possible subjects for this study were sol'cited through 240 special
education teacher, from across the country who had responded to an earlier
survey on student-teacher ratios in sr,ecial education classrooms (see Thurlow et
al., 1987). The original sample of spcc;a1 education teachers was identified
through state and district level specie' education offices. Each of the 240
special education teachers who responded to a student-teacher ratio survey was
sent two of the surveys developed for the current study, and was asked to
distribute them to two regular education teachers who served mildly handicapped
students in their classrooms. Of the 480 surveys sent out for distribution to
the special education teachers, 197 surveys were completed and returned by the
regular education teachers, accounting for a return rate of 41X.
9
6
Table 4
Categories of Handicapped Students Served by Respondents
PercentageAverage Number Modal Number
Category Checking Categorya
Students Servedb
Learning Disabled
Emotionally Disturbed orEmotionally/BenaviorallyDisordered
Mildly Mental Retarded
Speech Impaired
Other'
78.2
39.1
5.3
2.4
2.0
1.0
29.9 2.4 1.0
35.0
17.2
2.2
1.0
1.0
1.0
dTold; percentage is greater than 100 because teachers were not limited in thenumber of categories they could endorse.
pThe figures in tnese columns reflect only the responses of those teachers who
indicated they served students in the disability category.
cThese figures include the following categories: physically handicapped (2.0);
Erhjl1h as a Second Langu ge (1.5); gifted (.5); vision, hearing impaired (8.1);
dnd Adaptive PE, Title 1, multiple handicaps, and "special needs" (5.1).
10

7
Results
Structural Arrangements
Teachers were asked about the structurL arrangements they used for
handicapped students in their classrooms in terms of four variables: (a) the
use of other adults in the classroom, (b) the size of groups used for
instruction, (c) the primary method of instruction used, and (d) the degree of
structure in the classroom. Almost one-half of the sample indicated that some
other adult(s) helped out in their classrooms. The "other adults" most
frequently mentioned were aides (14.7%), other teachers (17.6%), and volunteers
(17.1%). Thirty-seven percent of the sample said that no other adults were used
in their classrooms, and 14.7% did not respond. When the subjects were asked
whether their reported use of other adults differed from what it would be if
they had no handicapped students in their classrooms, 56% indicated that it did
nut differ, while 26% reported that it did. Eighteen percent of the sample did
no respond (see Table 5).
Teachers were asked to indicate the size of the small groups they used for
instruction. Of those indicating group size, the greatest number of
respondent_ specified sizes of four to six students (16.8% of the total sample)
and one to three students (13.7% of the total sample). Fight percent of the
respondents said that they individualized instruction and 11.1% gave group sizes
of 10 or more. Nineteen percent did not respond to this question, 6.6% reported
that they did not use small groups, and 18.3% implied that they used small
gr9up,, for instruction, but did not report a group size (see Table 6). Just
over halt of the sample (51.3%) indicated that their use of small groups for
instruction, and the corresponding size of the group, did not differ from what
11

8
Table 5
Structural Arrangements: Other Adults Used in Classrooms by RegularEducation Teachers when Handicapped Students are Present
Adult Used Number of
RespondentsPercentage of
Respondents
No other adults used 73 37.1
Aide(s) 29 14.7
Unnamed Adulta 26 13.2
Another teacher 15 17.6
Volunteer 14 17.1
Tutor 8 4.1
Counselor 1 .5
Paraprofessional 1 .5
Student teacher 1 .5
No response 29 14.7
"Does this differ from what you would do if no handicapped studentswere in your classroom?"
Yes 5?
No 110
No response 35
26.4
55.8
17.8
dRespondents described activities performed by adult(s), but did not"name" them.
12

9
Table 6
structural Arrangements: Size of Small Groups used for Instruction byRegular Education Teachers when Handicapped Students are Present
Group Size
Number or
RespondentsPercentage of
Respondents
Individualized 16 8.1
1-3 students 27 13.7
4-6 33 16.8
1 -9 12 6.1
1U -12 5 2.5
13-15 9 4.6
16-18 4 2.0
19-20 3 1.5
21+ 1 .5
Indicated use of small groupsout did not give size
36 18.3
Did not use small groups 13 6.6
No Response 38 19.3
"Does this differ from what you would do if no handicapped studr -swere in your ,lassroom?"
Yes 77 39.1
No 101 51.3
No response 19 9.6
13

10
it would be if they had no handicapped students in their classes; 39.1%
indicated that these patterns of group structure and size would change if no
handicapped students were involved.
Respondents were asked ) name up to two primary methods of instruction
tnat they used for the hanuicapped students in their classes. The most
frequently named method was "direct instruction" (named by 60% of the sample).
Otner frequently mentioned methods included cooperative/group (20.4%), discovery
(17.8%), independent (17.3%), and multi-method (12.2%). Nine percent of the
sample did not respond. (The total percentage is greater than 100 because up to
two methods per teacher were recorded; see Table 7.) Almost 60% of the sample
said tndt they would not change their methods of instruction if no handicapped
students were present, while 35.5% said that they would change their methods of
instruction (see Table 7).
When asked about the degree of structure they used for the handicapped
students in their classrooms, over 40% of the sample indicated that their
classrooms were highly or extremely structured. Approximately 14% of the sample
used words such as "moderate" or "a lot" to describe the degree of structure in
their classrooms, while only 4.1% used words like "low," "open," or "flexible."
Many respondents indicated that the degree of structure they imposed depended on
some variable such as the curriculum or subject matter (4.6%) or the "learning
style" (2.5%). (See Table 8.) More respondents than not (55.3% vs. 34.5%)
indicated that the degree of structure did not differ from what it would be if
no handicapped students were in the classrooms.
14

11
Table 7
Structural Arrangements: Primary Methods of Instruction Used byRegular Education Teachers when Handicapped Students are Present
Method Number of Percentage of
Respondents Respondeiltsd
Direct 118 59.9
Cooperative (group) 40 20.4
Discovery 35 17.8
Inaependent 34 17.3
Multi-method 24 12.2
Tactile 6 3.0
Other 5 2.5
No Response 18 9.1
"Does this differ from what you would do if no handicapped students
were present in your classroom?"
Yes
No
70 35.5
118 59.5
No response 9 4.6
aTotal is greater then 100% because teachers were allowed to name two
clethods.
15

Table 8
Structural, Arrangements: Degree of Structure used by RegularEducation Teachers when Handicapped Students are Present in theClassroom.
Degree of Structure
12
Elementary Secondary
"Highly"/"Extremely"/"Very" 83 42.1
"Moderate"/"Much"/"A lot" 27 13.7
"Low"/"Open"/"Flexible" 8 4.1
"Dependent on InstructionalTechniqies, Learning Centers" 11 5.6
"Structure Depends on DisabilityServe.." 9 4.6
"Depends on Curriculum/Subject Matter" 9 4.6
"Traditional"/"Self-Contained"/"Structure with Least Distractions" 5 2.5
"Depends on Learning Style/Individual Performance" 5 2.5
"Quiet Environment with HighExpectations" 3 1.5
No !,curable respcns or blank 37 18.8
"Does this differ r, . what you would do if no handicapped studentwere present in yoT c: ;src.m?"
Yes 68 34.5
No 109 55.3
No Response 20 10.2
16

13
Adaptive Instruction
Fifteen statements describing various instructional adaptations were
included in the survey (see page 2 of the survey in appendix). The respondents
were asked to rate each statement on a scale of 1 to 7 (with "1" being low and
"7" being high) on two dimensions: (a) the desirability of the adaptation, and
(b) the extent to which the teacher is able to make the adaptation in his or her
classroom. In general, the teachers found all of the adaptations highly
desirable; the modal response for each statement was "7," and average
"desirability" ratings for all 15 statements ranged from 5.5 to 6.6. The two
adaptations receiving the highest average "desirability" ratings were "holding
stIment accountable for his/her performance and quality of work" (average rating
= 5.6), and "altering instruction so that the student can experience success"
(average rating = 6.4). In relative terms, the two least desirable adaptations
were "modifying tasks until student makes no errors or only infrequent mistakes"
(average rating = 5.5), and "using other goals to instruct failing student"
(average rating = 5.6) (see Table 9).
Overall, teachers' ratings of their own ability to make the preferred
adaptations were lower than the adaptations' "desirability" ratings; in fact,
all 15 t tests comparing average "desirability" and "able to do" ratings for
each item were significant at the .001 level. Average "able to do" ratings
ranged from 4.1 to 5.8, with modal ratings from 4 to 7. The adaptation that
teachers were, on the average, most able to carry out in their classrooms
(average rating = 5.8) was also the adaptation that received the highest average
"desirability" rating: holding student accountable for his/her performance and
quality of work. The adaptation with the second highest average "able to do"
17

14
Table 9
Adaptive Instruction: Teachers' Reports of the Desirability of VariousInstructional Adaptations for Handicapped Students and the Extent towhich they are Able to Make the Adaptation in their Classroomsa
Desirability Able-to-Do
1. Altering instruction so student can experiencesuccess
2. Identifying alternative instructional modificationsfor teaching students
3. Identifying alternative ways to manage studentbehavior or affect
4. Modifying curricula in a variety of ways5. Using alternative methods to instruct failing student6. Using different materials to instruct failing student7. INing other goals tc, instruct failing student8. Usino increased practice opportunities9. Using alternative group placements
10. Adjusting lesson pace to meet student's rate ofmastery
11. Monitoring of student's errors and prescribingactivities to correct responses
12. Modifying tasks until student makes no errors oronly infrequent mistakes
13. Monitoring effectiveness of alternativeinterventions
14. Informing student frequently of his/herinstructional needs
15. Holding student accountable for his/herperformance and quality of work
Averages:
Mean Mode Mean Mode
6.36 7.0 4.95 5.0
6.13 7.0 4.68 5.0
6.14 7.0 5.01 5.0
5.85 7.0 4.68 5.0
6.24 7.0 4.69 5.0
5.90 7.0 4.49 5.0
5.65 7.0 4.56 5.0
6.16 7.0 5.09 6.0
5.71 7.0 4.51 4.0
6.16 7.0 4.67 5.0
6.24 7.0 4.95 5.0
5.46 7.0 4.09 4.0
5.71 7.0 4.28 4.0
5.75 7.0 5.02 4.0
6.55 7.0 5.80 7.0
6.00 7.0 4.76 4.9
dRating scale ranged from 1 (low) to 7 (high). All 15 t-tests between average"desirability" and "able-to-do" ratings for each item were significant at the .000level. Sample sizes for the t-tests ranged from 187 to 195.
18

15
rating (5.1) was "using increased practice opportunities." The statement that
received the iowe',t "desirability" rating, "modifying tasks until student makes
HO errors or only infrequent mistakes," also received the lowest average "able
to do" rating (4.1). Also receiving low "able to do" ratings (average rating =
4.3) was the statement "monitoring effectiveness of alternative interventions".
(See Table 9 for complete summary data.)
Compari-- on of Elementary and Secondary Teachers' Responses
Several differences were found between the response patterns of those
teachers who identified themselves as working in elementary school settings (68%
of the total sample; n = 134) and those who stated that they worked in
secondary/middle school settings (32%; n = 63). According to teacher reports,
the students served by the elementary teachers were, on the average, of a lower
socioeconomic level than were the secondary/middle school students. A greater
percentage of elementi.,1 school teachers than secondary/middle school teachers
estimated the socioeconomic level of their schools' students to be "low" or "low
to moderate," while the pattern was reversed when the socioeconomic designations
were "moderate," "moderate to high," and "high" (see Table 10 for responses).
Tne secondary/middle school regular education teachers reported having, on
the average, more "mildly handicapped" students in their classes than did the
elementary teachers. Secondary/middle teachers reported having an average of
9.4 "mildly handicapped" students, while the average for an elementary teacher
was 4.3 (see Table 11), Almost two - thirds (62.7%) of the elementary school
respondents served a total of between one and five mildly handicapped students;
only 33.3% of the secondary school respondents reported such small numbers.
Nearly 32% of the secondary/middle teachers reported having between 6 and 10
19

16
Table 10
Comparison of Student Socioeconomic Statusby Elementary and Secondary School 'Avel
Elementary Secondary/MiddleSES N % N %
Low 19 14.2 0 0.0
Low to Moderate 59 44.0 26 41.3
Moderate 34 25.4 22 34.9
Moderate to High 21 15.7 13 20.6
High 0 0 2 3.2
Table 11
Regular Education Teacher Caseloads of Mildly Handicapped Students
Total Number Percentage ofElementary Teachersa
Percentage ofSecondary Teachersb
U 6.0 6.3
1-5 62.7 33.3
6-10 12.7 31.7
11+ 6.5 23.8
No response 11.9 4.8
Mean 4.3 9.4
Mode
a% based on 134 cases
b% based on 63 cases
2.0 4.0
20

17
mildly handicapped students; 23.8% had 11 or more students. Only 12.7% and
6.5%, respectively, of the elementary teachers had as many mildly handicapped
students (see Table 11). About 6% of botn levels of teachers gave a response of
"0" when asked for the total 'lumber of students in their classes classified as
"mildly handicapped." However, each of these 12 respondents did indicate serving
some children within specific disability categories. It is possible that these
children had not been formally classified, or that they had handicaps of a
moderate or severe degree.
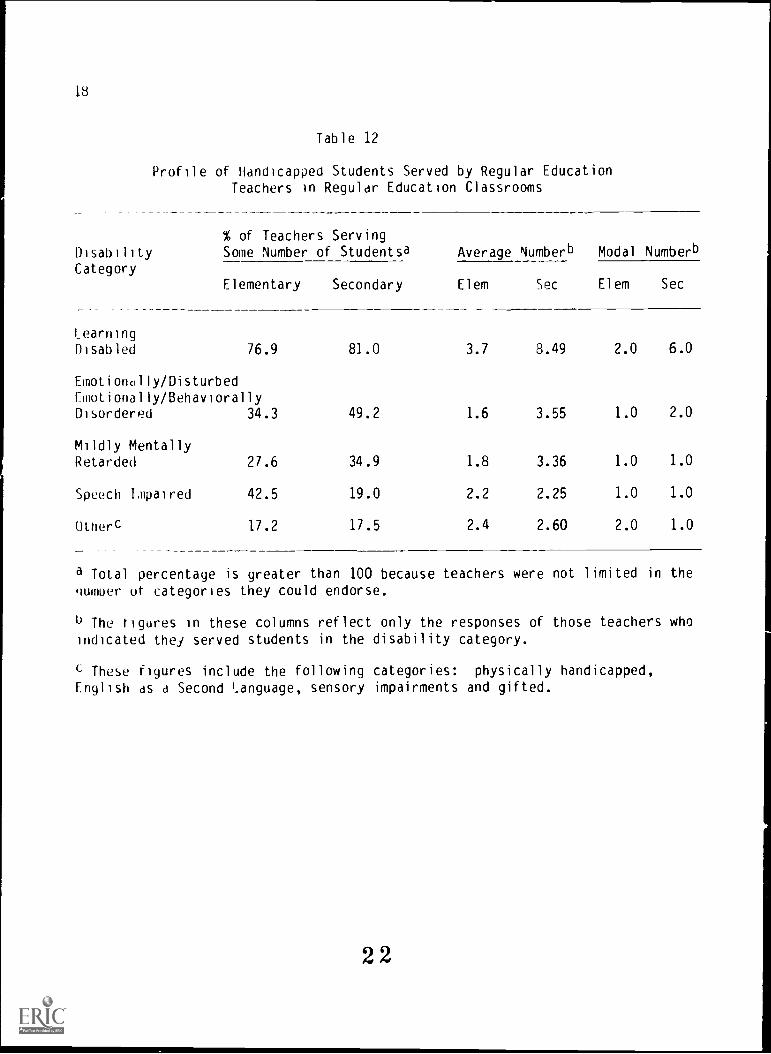
Over two-thirds of both elementary (76.9%) and secondary/middle school
(81.0%) teachers reported having learning disaVed (LD) students; however,
secondary/middle teachers had a larger average number of LO students than the
elementary teachers (8.5 compared to 3.7). More secondary/middle teachers than
elementary teachers reported serving some number of both emotionally/
behaviorally disordered (EBD) students (49% vs. 34%) and mildly mentally
retarde6 (MMR) students (35% vs. 28%); and, on the average, they also served
larger numbers or those students. The two populations that more elementary
teachers than secondary/middle teachers mentioned serving were speech impaired
(42% vs. 19%) and sensory impaired (i.e. vision and hearing) students (11% vs.
2%)(see Table 12).
Use of other adult aides in classrooms. On the average, over 50% of
elementary teachers used some other adult in the classroom while only about 35%
of secondary/middle school regular education teachers reported having some
additional assistance during their classroom instruction (see Table 13). Of the
elementary level regular education teachers reporting additional assistance,
16.4% used an adult teacher's aide; 9.7% used volunteers; 6.0% used another
21
18
DisabilityCategory
LearningDisabled
Table 12
Profile of Handicapped Students Served by Regular EducationTeachers in Regular Education Classrooms
% of Teachers ServingSome Number of Studentsa Average Numberb Modal Numberb
Elementary Secondary Elem Sec Elem Sec
76.9 81.0
Emotionally /DisturbedEmotionally/BehaviorallyDisordered 34.3
3.7 8.49 2.0 6.0
49.2 1.6 3.55 1.0 2.0
Mildly MentallyRetarded 27.6 34.9 1.8 3.36 1.0 1.0
Speech Impaired 42.5 19.0 2.2 2.25 1.0 1.0
Otherc 17.2 17.5 2.4 2.60 2.0 1.0
a Total percentage is greater than 100 because teachers were not limited in thenumuer of categories they could endorse.
P The figures in these columns reflect only the responses of those teachers who
indicated they served students in the disability category.
c These figures include the following categories: physically handicapped,
English as a Second Language, sensory impairments and gifted.
22

Table 13
Structural Arrangements: Other Adults Osed in Classrooms byElementary and Secondary/Middle Teachers When Handicapped Students
are Present
AOult(s) Used
19
Elementary Secondary
No Other Adult Used 33.6 44.4
Aide 16.4 11.1
Volunteer 9.7 1.6
Another Teacher 6.0 11.1
Tutor 4.5 3.2
Counselor .7 0
Student Teacher .7 0
Paraprofessional .7 0
Unspecified Othera 15.7 7.9
No Response 11.9 20.F
"Does this differ from what you would do if no handicapped studentswere present in your classroom?"
Yes
No
No Response
27.6 23.8
58.2 50.8
14.2 25.4
aRespondent mentioned duties/activities performed by adult, but did
not name
23

20
teacher; 4.5% used a tutor, and 15.7% had some other, unspecified, adult
assistance. Counselors, student teachers, and paraprofessionals were, each,
reportedly used by less than 1.0% of responding teachers. Thirty-three percent
reported that they used no other adult in the classroom.
Secondary/middle level regular education teachers used an adult aide in the
classroom less f-oquently than did the elementary level teachers: 11.1%
reported using an adult aide; 1.6% reported using volunteers; 11.1% reported
using another teacher; 3.2% reported using a tutor; and 7.9% reported using an
unspecified "other adult." Counselors, students, or paraprofessionals were not
used by these respondents. Almost half of the secondary/middle school level
respondents (44.4%) reported not using another anult in their classrooms.
Instructional arrangement and size of groups. About one-fourth of
elementary level teachers (27.6%) and secondary level teachers (23.8%) reported
a difference in their instructional arrangements as a result of serving
handicapped students in their classrooms. However, the majority of both
elementary (58.2%) and secondary (50.8%) teachers reported no difference in
their classroom instructional arrangements when serving handicapped students.
Elementary and secondary level regular education teachers reported that a
group range of between one to three or four to six students represented typical
sizes for instructional groups (see Table 14). Less -i,an 10% of elementary
teachers (9.0%) and secondary/middle school teachers (6.3%) reported using
individualized instruction when handicapped students were present in their
classes. The group sizes reported most often by elementary level teachers were
one to three students (14.9%) and four to six students per group (21.6%). The
group size reported most often by secondary/middle school level teachers was one
24

21
Table 14
Structural Arrangements: Size of Small Groups Used for Instruction byElementary and Secondary/Middle School Teachers When Handicapped
Students are Present
Group Size
Individualized
1-3 students
4-6
7-9
1U -12
13-15
16-18
19-2O
21+
Elementary Secondary
9.0 6.3
14.9 11.1
21.6 6.3
6.7 4.8
1.5 4.8
2.2 9.5
.7 4.8
1.5 1.6
0 1.6
"Does this differ from what you would do if no handicapped studentswere present in your classroom?"
Yes 38.8 39.7
No 53.0 47.6
No Response 8.2 12.7
25

22
to three students (11.1%). No groups of over 20 students were reported by
elementary teachers.
Primary methods of instruction. Elementary and secondary level ,:.achers
were asked to designate their primary method of instruction when handicapped
students were present in the classroom (see Table 15). Over half of both the
elementary teachers (61.9%) and the secondary teachers (55.6%) reported using
direct methods of instruction. Cooperative group instruction was used by 21.7%
of the elementary teachers and 1i.5% of the secondary level teachers. Higher
percentages of secondary than elementary teachers reported using "discovery"
(25.4% vs. 14.2%) and "independent" (23.8% vs. 14.2%) methods of instruction.
A multi-method approach was reported more frequently by elementary level
teachers (14.4%) than by secondary level teachers (9.5%) as a primary method of
instruction.
The primary methods of instruction reported by elementary and secondary
regular education teachers when handicapped students were present in their
classroom were ranked slightly differently. For elementary teachers, the order
of frequency was: (1) direct method, (2) cooperative group method, (3) multi-
method, (4 & 5) direct and discovery methods, and (6) tactile methods. The
order for secondary teachers was: (1) direct method, (2) discovery method, (3)
independent study method, (4) cooperative group method, (5) multi-method, and
(6) tactile methods, respectivel,.
When asked whether the primary method of instruction differed when
handicapped students were present in the classroom, 35.8% of elementary level
and 34.9% of secondary level teachers reported "yes." Most teachers in both
groups (58.2% and 63.5%) indicated that the primary method of instruction did
not differ when handicapped students were in the classroom.
26

Table 15
Structural Arrangements: Primary Methods of Instruction Used byElementary and Secondary/Middle School Teachers When Handicapped
Students are Present
Method Elementary
23
Secondary
Direct 61.9 55.6
;.operative (Group) 21.7 17.5
Discovery 14.2 25.4
Independent 14.2 23.8
Multi-Method 14.4 9.5
Tactile 1.4 1.6
Utner 3.0 1.6
No Response 9.0 9.5
"Does this differ from what you would do if no handicapped studentswere present in your classroom ?"
Yes
No
No Response
35.8 34.9
58.2 63.5
6.0 1.6
aTotal percent is greater than 100 because teachers wee allowed toname two methods.
27

24
Very little variability was found when comparing elementary and secondary
level teachers on the degree of structure in the classroom. Over 42% and 41%,
respectively, indicated that their classrooms were "highly or extremely"
structured when handicapped students are present. Differences noted were that
7.9% of secondary level respondents versus 3.0% of elementary level respondents
indicated that "structure depends on the disability served." Another area of
difference in degree of structure between elementary and secondary level
respondents was dependent on "curriculum subject matter" '3.0% vs. 6.3%) and
"learning style and individual performance" (.7% vs. 6.3%), respectively (see
Table 16).
Adaptive instruction. The respondents were asked to rate, on a Likert type
scale, the desirability of using, and their ability to use, adaptive
instructional techniques in their classrooms (see Table 17). Elementary and
secondary teachers variEd in a number of areas, and the difference for some
items reached significance at the .05 level.
Elementary level teachers generally responded to the desirability of using
adaptive instructional methods in a slightly more positive manner than did the
secondary level teachers. On the average, elementary teachers more often than
secondary teachers indicated significantly greater desirability for: (a)
identifying alternative ways to manage a student's behavior or "affect"; (b)
using alternative methods to instruct failing students; (c) using different
materials to instruct failing students; and (d) using an alternative group
placement.
Altering instruction so that the student can experience success, modifying
the curriculum in a number of ways, adjusting the lesson pace to meet a
28

25
Table 16
Structural Arrangements: Degree of Structure Used by Elementaryvs Secondary /Middle Teachers When Handicapped Students are Present
Degree of Structure Elementary Secondary
"Highly"/"Extremely"/"Very" 42.5 41.3
"Moderate"/"Much"/"A lot" 13.4 14.3
"Low"/"Open"/"Flexible" 3.7 4.8
"Dependent on InstructionalTechniques, Learning Centers" 5.2 0
"Structure Depends on DisabilityServed" 3.0 7.9
"Depends on Curriculum/Subject Matter" 3.0 6.3
"Traditional"/"Self-Contained"/"Structure with Least Distractions" 2.2 3.2
"Depends on Learning Style/Individual Performance" .7 6.3
"Quiet Environment with HighExpectations" 2.2 0
No scorable response or blank 22.4 9.5
"Does this differ from shat yo' would do if no handicapped studentwere present in your cla :croorn ?"
Yes 32.1 39.7
No 56.7 52.4
No Response 11.2 7.9
29

26
Table 17
Adaptive Instruction: Elementary vs. Secondary Teachers' Reports ofthe Desirability of Various Instructional Adaptations for Handicapped Students
and the Extent to which they are able to Make the Adaptation in their Classroomsa
Elementary
Mean
Desirability
Elementary
Able to Do
-v
ModeMode
Secondary Secon?
Mean Mode Mean Mode Mean
1. Student experience success 6.36 7.0 6.36 7.0 4.96 5.0 4.92 6.0
Z. Identity instructionalmodifications 6.17 7.0 6.05 7.0 4.55 4.0 4.95 5.0
3. Manage behavior or affect 6.30 7.0 *5.81 7.0 5.05 5.0 4.94 5.0
4. Modify curricula 5.87 7.0 5.82 6.0 4.59 5.0 4.86 5.0
5. Use alternative methods 6.42 7.0 *5.87 7.0 4.82 5.0 4.42 4.0
6. Use different materials 6.12 7.0 *5.63 7.0 4.69 5.0 *4.08 4.0
1. Use other goals 5.87 7.0 *5.21 6.0 4.76 5.0 *4.16 4.0
b. Use increased practice 6.25 7.0 5.95 7.0 5.15 6.0 4.95 6.0
9. Use alternative group placements 5.90 7.0 *5.32 7.0 4.74 6.0 *4.03 4.0
10. Adjust lesson pace 6.19 7.0 6.10 7.0 4.73 5.0 4.52 7.0
11. Monitor student errors 6.30 7.0 6.11 7.0 5.02 5.0 4.79 5.0
12. Modify tasks for no errors 5.58 7.0 5.21 5.0 4.24 4.0 *3.76 4.0
13. Monitor effectiveness ofalternative interventions 5.82 7.0 5.49 7.0 4.35 4.0 4.12 4.0
14. Inform student of needs 5.74 7.0 5.77 6.0 5.02 4.0 5.02 4.0
15. Hold student accountable 6.51 7.0 6.66 7.0 5.72 7.0 5.95 7.0
Averages 6.09 7.0 5.82 6.7 4.8 5.0 4.6 4.9
dAll 15 t-tests between "desirability" and "able 'cc do" average ratings significant at
.00U. Elementary teacher sa-ple sizes ranged from 126 to 132, and secondary sample sizesfrom 60 to 63 subjects.
*t-test between means of elementary vs. secondary teachers significant at .05 level.
: 0
27
student's individual rate of mastery, and informing students frequently of their
instructional needs were viewed as equally desirable by elementary and secondary
teachers. Holding the student accoil able for performance and quality of work
was ranked by both elementary and secondary teachers as being the most desirable
adontive instructional method.
Elementary level teachers generally also reported that they were better
able, on the average, to incorporate adaptive instructional methods than were
secondary level teacher.s. In some areas, elepientary level teach rs
significantly differed from secondary level teachers in their ability to use
adaptive instructional methods in the classroom. Other areas identified by t
tests at the .05 level of significance were: using different materials to
instruct failing students, using other goals to instruct failing students, using
alternative group placements, and modifying tasks until students make no errors
or only infrequent mistakes.
Elementary and secondary level regular education teachers reported with
equivalent frequency an ability to use the adaptive instructional method of
inf wing a student frequently of instructional need. Finally, both elementary
and secondary level teachers ranked as their highest priority the ability to
hold students accountable for their performance and quality of work.
Regional Comparisons
Data were further analyzed by examining results for each of the nine U.S.
geographic divisions. These geographic regions display little diversity in many
of the study's chief questions about instructional arrangements for mildly
handicapped students used by regular education teachers. The distribution, by
31

28
region, of elementary versus secondary level regular education teachers is
reported in Taole 18.
Teachers' estimates of the socioeconomic status of their students are
reported in Table 19. Generally, most geographical regions reported that the
student populations they served represented a predominantly low-moderate to
moderately-high range. Table 20 displays the average range in the number of
students being served, by handicapping label, by regular education teachers' in
each of the nine geographic divisions. In the West South Central region, one
teacher reported an extremely high number of J:udents with the LO label. It is
unclear whether this reported figure of "75 students" is an outlier or an
inaccuracy due to a misinterpretation of the item. The number of students
reported as being served by categorical label, or caseload, in the nine
geographical regions displays concoroance with what would be expected regarding
services provided to these students (i.e., higher numbers of LO students served
in the mainstream than students classified as EBD or MR).
Use of other elult aides in classroom. The frequency of using another
adult to assist in the classroom is reported in Table 21. The West North
Central region displayed the greatest diversity in the use of another adult to
aid instruction; the South Atlantic and Mountain states also reported the use of
a variety of other adult aides in their classrooms. All other regions displayed
limited diversity in the use of additional adults as supports to instruction.
Furthermore, it was found that all regions displayed a greater percentage of
respondents who reported that there would be no difference in their use of
another adult as support in the classroom based on the presence of mildly
handicapped students (see Table 22).
32

Table 18
Number of States in Each Region Represented byElementary and Secondary Levels
29
Elementary Secondary
New England 19 79.2% 5 20.8%
Middle Atlantic 7 38.9% 11 61.1%
East North Central 13 76.5% 4 23.5%
West North Central 19 61.3% 12 38.7%
South Atlantic 12 57.1% 9 42.9%
East South Central 11 91.7% 1 8.3%
West South Central 17 85.0% 3 15.0%
Mountain 21 60.0% 14 40.0%
Pacific 11 73.3% 4 26.7%
Table 19
Number of States by Regional Div:slon ReportingStudent Socioeconomic Status
Low Low-Moderate Moderate Moderate-High High
New England 2 8 5 8 0
Middle Atlantic 0 6 9 3 0
East North Central 1 7 6 3 0
West North Central 0 16 9 5 1
South Atlantic 2 9 C 4 0
East South Central 2 3 6 1 0
West South Central 3 11 3 2 1
Mountain 8 14 8 5 0
Pacific 1 9 3 2 0
33

30
Table 20
Average Range of Handicapped Students onTeachers' Caseloads by Label and Regional Division
LD EBD MMR SP Other
New England 1-13 1-3 0 1-3 2
Middle Atlantic 1-20 1-5 1-5 1 6
East North Central 1-14 1-5 1-4 1-4 1-2
West North Central 1-16 1-6 1-9 1-4 1-9
South Atlantic 1-10 1-4 1-10 1-10 1-2
East South Central 1-5 1-2 2-7 1-3 2-7
West South Central 1-75 1-6 1-5 1-5 1-2
Mountain 1-18 1-10 1-6 1-6 1-9
Pacific 1-6 1 1-3 1-4 0
34
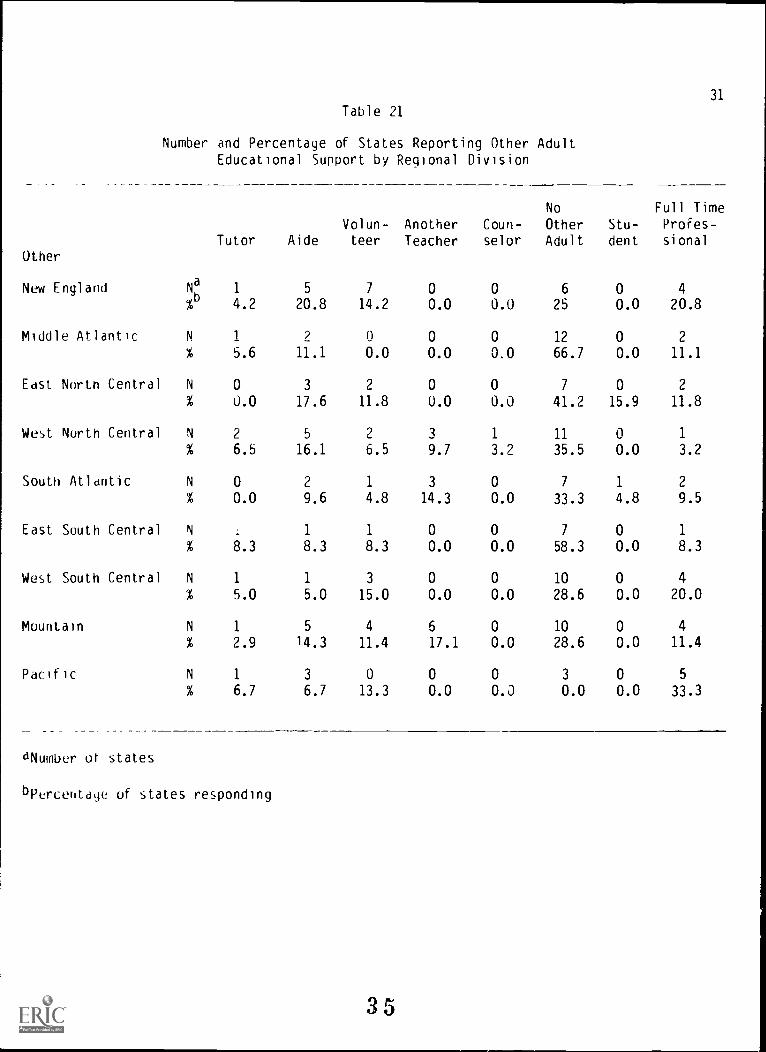
Table 21
Number and Percentage of States Reporting Other Adult
Educational Support by Regional Division
31
No Full TimeVolun- Another Coun- Other Stu- Profes-
Tutor Aide teer Teacher selor Adult dent sional
Other
New England Na 1 5 7 0 0 6 0 4
%b
4.2 20.8 14.2 0.0 0.0 25 0.0 20.8
Middle Atlantic N 1 2 0 0 0 12 0 2
% 5.6 11.1 0.0 0.0 0.0 66.7 0.0 11.1
East North Central N 0 3 2 0 0 7 0 2
% 0.0 17.6 11.8 0.0 0.0 41.2 15.9 11.8
West North Central N 2 5 2 3 1 11 0 1
% 6.5 16.1 6.5 9.7 3.2 35.5 0.0 3.2
South Atlantic N 0 2 1 3 0 7 1 2
% 0.0 9.6 4.8 14.3 0.0 33.3 4.8 9.5
East South Central N 1 1 0 0 7 0 1
% 8.3 8.3 8.3 0.0 0.0 58.3 0.0 8.3
West South Central N 1 1 3 0 0 10 0 4
% 5.0 5.0 15.0 0.0 0.0 28.6 0.0 20.0
Mountain N 1 5 4 6 0 10 0 4
% 2.9 14.3 11.4 17.1 0.0 28.6 0.0 11.4
Pacific N 1 3 0 0 0 3 0 5
% 6.7 6.7 13.3 0.0 0.0 0.0 0.0 33.3
dNumber of states
bPercentage of states responding
35

32
Table 22
Ndmber of States Reporting "Would Practices Differ if No Handicapped Studentwas Present in the Classroom" (by Regional Division)
Use ofOther
Yes
Adult
No
Size of
InstructionalGrouping
Method ofInstruction
Degree ofStructure
Yes No Yes No Yes No
New England 6 13 8 13 8 14 4 17
Middle Atlantic 3 12 9 8 7 11 7 9
East North Cntrl. 5 10 3 14 6 11 6 9
West North Cntrl. 11 14 15 13 10 21 11 17
South Atlantic 3 11 10 8 7 il 4 13
East South Cntrl. 1 7 2 6 3 7 1 9
West South Cntrl. 6 10 7 11 9 11 11 8
Mountain 11 22 17 17 14 19 18 14
Paciric 4 9 2 11 5 9 4 11
36

33
Size of groups. In Table 23 the typical size of small groups used to
provide instruction to students with mild handicaps is reported by geographic
division. The West Mountain states displayed greater diversity than other
regions in the size of instructional groupings of students with mild handicaps.
However, all regions generally appeared to favor instructional groups of smaller
size. It was found that some of these regions (Middle Atlantic, West North
Central, and South Atlantic) did indicate that the size of the groups made a
difference if a student with handicaps was present in the class (see Table 22).
Primary methods of instruction. The primary method of instruction employed
with mildly handicapped students is reported, by region, in Table 24. The West
North Central, West Mountain, and New England states display the greatest degree
of diversity in instructional methods, with the East South Central states
displaying the least diversity. The percentages reported from each region
indicate that the primary method of instruction used with mildly handicapped
students is the direct instructional method. Furthermore, it was found that ali
geographic regions showed that a greater percentage of teachers would not use
different instructional methods when mildly handicapped students were present in
the class (see Table 22).
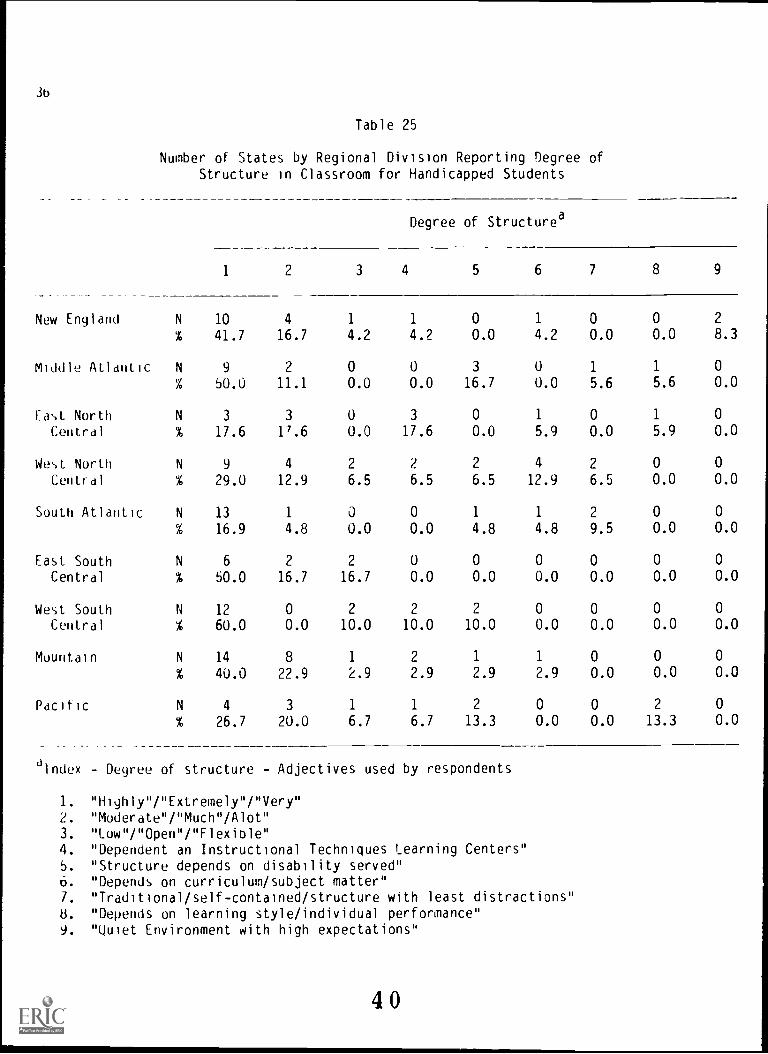
Degree of structure reported by teachers in the nine regions is presented
in Table 25. In all but two of the regions (East North Central and South
Atlantic), more than 25% of the respondents indicated that the degree of
structure in their classrooms was very high. The extent to which degree of
structure would change if handicapped students were not present is shown in
Table 22.
Adaptive instruction. In compiling the regional results for "desirability"
and " ability to used adaptive instructional methods in the classroom, teachers
37

34
Table 23
Number of !tates by Regional Division ReportingDifferent Sizes of Instructional Groupings
Size of Group
Ind 1-3 4-6 7-9 10-12 13-15 16-18 19-20 21+
New England Na 3 5 2 1 0 0 0 0 0
%u 12.5 20.8 d.3 4.1 0.0 0.0 0.0 0.0 0.0
Middle Atlantic N 1 0 3 2 1 1 1 0 0
% 5.6 0.0 16.7 11.1 5.6 5.6 5.6 0.0 0.0
East North Central N 0 0 7 0 1 1 0 1 1
% 0.0 0.0 41.2 0.0 5.9 5.9 0.0 5.9 5.9
West Norin Central N 2 6 2 3 0 2 1 0 0
% 6.5 19.4 6.5 9.7 0.0 6.5 3.2 0.0 0.0
south Atlantic N 2 4 2 2 2 0 0 0 0
% 9.5 19.0 9.5 9.5 9.5 0.0 0.0 0.0 0.0
East South Central N 2 1 3 1 0 0 0 0 0
% 16.7 8.3 25.0 8.3 0.0 0.0 0.0 0.0 0.0
West South Central 3 2 2 1 0 0 1 1 0
% 15.0 10.0 10.0 5.0 0.0 0.0 5.0 5.0 0.0
Mountain N 1 6 10 2 1 3 1 1 0
% 2.9 17.1 28.6 5.7 2.9 8.6 2.9 2.9 0.0
Pacific N 1 1 2 0 0 0 0 0 0
dNumber of states
% 6.7 6.7 13.3 0.0 0.0 0.0 0.0 0.0 0.0
5Percentage of states responding
38

Table 24
Number of States by Regional Division ReportingMethods of Instruction
Methods of Instruction
35
Cooper- Indepen- Multi- Tac-Di-ect Discovery ative dent Method tile Other
New England Na 9 5 3 0 3 1 1
%b
37.5 20.8 12.5 0.0 12.5 4.2 4.2
Middle Atlantic N 9 1 3 1 2 0 0
% 50.0 5.G 16.7 5.6 11.1 0.0 0.0
East North Central N 10 0 2 2 1 0 0
% 58.8 0.0 11.8 11.8 5.9 0.0 0.0
West North Central N 15 1 4 2 4 1 1
% 48.8 3.2 12.9 6.5 12.9 3.2 3.2
South Atlantic N 12 0 3 1 1 0 1
% 57.1 0.0 14.3 4.8 4.8 0.0 4.8
East South Central N 10 0 0 0 1 0 0
% 83.3 0.0 0.0 0.0 8.3 0.0 0.0
West South Central N 17 0 1 0 1 0 0
% °J.0 0.0 5.0 0.0 2.9 0.0 0.0
Mountain N 17 4 4 1 5 0 1
% 48.6 11.4 11.4 2.9 14.3 0.0 2.9
Pacific N 12 0 0 0 1 0 1
% 80.0 0.0 0.0 0.0 6.7 0.0 6.7
aNumber of states
bPercentage of states responding
39
3b
Table 25
Number of States by Regional Division Reporting Degree ofStructure in Classroom for Handicapped Students
Degree of Structurea
1 2 3 4 5 6 7 8 9
New England N 10 4 1 1 0 1 0 0 2
% 41.7 16.7 4.2 4.2 0.0 4.2 0.0 0.0 8.3
Middle Atlantic N 9 2 0 0 3 0 1 1 0
% 50.0 11.1 0.0 0.0 16.7 0.0 5.6 5.6 0.0
East North N 3 3 0 3 0 1 0 1 0
Central % 17.6 17.6 0.0 17.6 0.0 5.9 0.0 5.9 0.0
West North N 9 4 2 2 2 4 2 0 0
Central % 29.0 12.9 6.5 6.5 6.5 12.9 6.5 0.0 0.0
South Atlantic N 13 1 0 0 1 1 2 0 0
% 16.9 4.8 0.0 0.0 4.8 4.8 9.5 0.0 0.0
East. South N 6 2 2 0 0 0 0 0 0
Central % 50.0 16.7 16.7 0.0 0.0 0.0 0.0 0.0 0.0
West South N 12 0 2 2 2 0 0 0 0
Central % 60.0 0.0 10.0 10.0 10.0 0.0 0.0 0.0 0.0
Mountain N 14 8 1 2 1 1 0 0 0
% 40.0 22.9 2.9 2.9 2.9 2.9 0.0 0.0 0.0
Pacific N 4 3 1 1 2 0 0 2 0
% 26.7 20.0 6.7 6.7 13.3 0.0 0.0 13.3 0.0
dindex - Degree of structure - Adjectives used by respondents
1. "Highly"/"Extremely"/"Very"2. "Moderate"/"Much"/Alot"3. "Low"/"Open"/"Flexible"4. "Dependent an Instructional Techniques Learning Centers"S. "Structure depends on disability served"6. "Depends on curriculum/subject matter"7. "Traditional/self-contained/structure with least distractions"8. "Depends un learning style/individual performance"9. "Quiet Environment with high expectations"
40

37
representing the regional divisions Jf New England, East South Central and West
Mountain gave the highest ratings. In contrast, the East North Central states
gave the overall lowest ratings. (see Table 26 for summary data.)
Discussion
There has been much discussion about the difficulties created for regular
education teachers when students with handicaps are placed within their
classrooms. Yet, we have little information on actual changes in instructional
methods that occur when a student with handicaps is introduced into the
classroom. The results of this survey of regular education teachers who have
mildly handicapped students in their classrooms provide little indication that
anything different occurs because of the presence of handicapped students in a
classroc.d. For example, the number of adults used in the classroom differed
from what it typically would be for only 26% of the respondents. Only 39% indi-
cated that their grouping practices (typically, fewer than six students in a
group) would change if there were no students with handicaps in the classroom;
and only 36% indicated that their methods of instruction (usually, "direct
instruction") would change. Only 36% indicated that the degree of structure in
the classroom (typically described a "highly structured") would change if no
handicapped students were present. these findings held true when comparisons
were made between responses of elementary and secondary level teachers, although
secondary teachers seem to encounter greater embers of handicapped students
duriny a school day. Secondary teachers also make less use of other adults in
the classroom.
Adaptive instructional techniques were almost unanimously viewed as
desirable, particularly holding the student accountable for work and altering
41

38Table 26
Average Ranking by Regional Division for "Desirability" and "Ability to Do"Adaptive Instruction with Handicapped Sudents
Regional Divisiona
1 2 3 4 5 6 7 8 9
Student Experience SuccessDesirab:lity 6.6 6.8 5.6 6.4 6.6 6.6 6.6 6.2 6.4
Ability to Do 5.4 5.0 A.7 4.6 4.6 4.' 4.9 5.1 5.1
Alternative Instructional ModificationsDesirability 6.4 6.3 5.4 5.9 6.4 6.4 5.9 6.3 6.1
Ability to Do 5.0 4.6 4.1 4.6 4.6 4.4 4.7 5.0 4.8
Management of BehaviorsDesirability 6.4 5.9 5.4 5.8 6.2 5.6 6.7 6.1 6.4
Ability to Do 5.4 4.5 4.3 4.5 5.1 5.1 5.5 5.5 5.4
Curricula ModifiedDesirability 6.3 6.1 4.8 5.8 6.0 6.1 5.5 5.8 6.4
Ability to Do 5.3 4.7 4.3 4.5 4.4 4.8 4.2 4.9 5.1
Alternative MethodsDesirability 6.7 6.0 5.R 6.2 6.4 5.8 6.3 6.3 6.3
Ability to Do 5.1 4.7 4.1 4.4 4.1 4.7 4.4 5.3 4.9
Different Material,Desirability 6.6 5.8 5.7 5.8 6.1 5.5 5.8 6.1 5.7
Ability to Do 5.5 4.5 4.2 4.1 4.0 4.4 4.2 4.8 4.4
Change GoalsDesirability 6.1 4.8 5.5 5.5 6.0 5.8 5.7 5.7 5.6
Ability to Do 5.1 3.4 4.4 4.6 4.1 4.2 4.7 5.2 4.8
Increased PracticeDesirability 6.3 6.4 6.1 6.1 6.2 6.6 6.3 5.9 6.1
Ability to Do 5.0 5.1 4.1 4.8 5.3 5.7 5.8 5.3 5.1
Alternative PlacementsDesirability 6.4 5.4 5.1 5.3 5.4 6.1 5.6 5.8 6.4
Ability to Do 5.2 4.3 3.2 4.1 3.6 5.3 4.6 5.0 5.4
Adjust Lesson PlaceDesirability 6.4 6.4 5.5 6.0 6.5 6.3 6.1 6.1 6.4
Ability to Do 5.2 5.0 4.7 3.8 4.2 4.9 5.1 5.] 4.4
Monitor Student ErrorsDesirability 6.2 6.3 6.2 6.0 6.5 6.4 6.3 6.2 6.4
Ability to Do 4.9 4.3 5.1 4.4 5.0 5.7 5.2 5.1 5.2
Modify TasksDesirability 5.7 5.3 4.8 5.0 6.1 6.1 5.6 5.6 5.3
Ability to Do 4.5 3.4 3.6 3.8 4.0 4.6 4.2 4.6 3.9
Monitor Alternative InstructionDesirability 6.0 6.0 5.1 5.3 5.9 6.2 5.3 5.7 6.4
Ability to Do 5.0 4.1 2.8 3.7 3.8 5.2 4.4 4.7 4.8
Inform Student of NeedsDesirac'Ity 5.2 5.4 6.2 5.6 6.0 6.1 5.7 5.9 5.7
Ability t.:, Do 4.7 4.9 4.8 5.0 5.1 5.8 5.3 5.1 4.6
Hold Student AccountableDesirability 6.3 6.6 6.6 6.5 6.4 6.8 6.6 6.5 6.6
Ability to Do 5.8 5.9 5.8 5.8 5.4 5.9 5.8 6.0 5.5
dKey for Regional Divisions: 1. New England, 2. Middle Atlantic, 3. East North Central,
4. West North Central, 5. South Atlantic, 6. Fast South Central, 7. West South Central,
8. Mountain, and 9. Pacific
42

39
instruction so the studeril- can experience success. Tait "ability to" ratings for
the various techniques were ordered in a manner similar to the ratings of
desirability, although these ratings were not as high. In addition, the ratings
of elementary level teachers were slightly higher than the ratings of secondary
level teachers, for both "desirability" and "ability to do."
The use of adults in the classroom, the degree of structure in the
classroom, and the primary method of instruction were more variable in some
regions than others. Particularly variable regions were those in the
Northwestern and Northeastern sections of the nation.
The results of this survey suggest that regular education teachers either
do not see a way to make the classroom environment different from what it would
be without a handicapped student, or they are unable to implement potential
changes for one reason or another. These types of findings once again emph4size
the need to enter the regular education classroom to observe how haodicapped
students are Spending their time in mainstream settings. The findings also
raise issues relevant to recent pushes toward the reorganization of special
education and regular education and their interactions (cf. Reynolds, Wang, &
Walberg, 1987; Stainback & Stainback, 1984; Will, 1986).
Tne structural arrangements that teachers provide to handicapped students,
use of other adults, size of small groups for instruction, primary methods of
instruction and degree of structure in the classroom suggest that the more
intensive the instructional setting, the becter the educational experience.
Aides, volunt.,:ers, or another teacher typically were identified as being used in
the classroom to assist instruction. The use of another adult to aid
instruction did not appear to differ when handicapped students were present in
43

4U
the clasroom, with 56% of the respondents reporting that there was no
d fterence.
The size of small groups for ir:tAruction with handicapped students typi-
cally ranged from 4 to 6 and 1 to 3 students. Instructional groups are depen-
dent on the ability of the student to interact in a socially appropriate fashion
with other students, or to work ,00peratively. Groups sizes appear to suggest
that teachers are concerned with the manageability of the group.
"Cooperative/group" was reported by 20.4% of the sample as a primary method of
instruction, second to "direct instruction" which was reported by 60% of the
sample as being the preferred method of instruction for handicapped students.
The overall degree of structure provided for instruction to handicapped
students, reported by 40% of the teachers surveyed, suggested that the higher
the degree of structure, the better. Few teachers maintained "flexible" or
"low" levels of structure in the instruction of handicapped students. However,
this appeared to not differ for many teachers (55.3%) who reported that the
degree of structuro would not change if handicapped students were not present in
the classroom.
Adaptive instruction is apparently desirable when teaching handicapped
studs ,ts. Results show Oat elementary level teachers find they are more able
to incorporate adaptive educational methods into their instructional
interventions than seconda:y level teachers are. In any case, the use of
adaptive instructional meth(is seems to be desirable at both the elementary and
secondary levels, with teachers at both levels responding that the most
desirable adaptive instructional approach is holding the student accountable for
performance and quality of work.
44

41
The results of this survey provide a limited picture, yet an interesting
one, of some of the practices employed by elementary and secondary level regular
education teachers in teaching mildly handicapped students. Certainly these
results suggest other questions. What is the impact of different instructional
groupings in teaching students with mild handicaps? What impact do different
adaptive educational approaches have on instruction? These quescions and others
definitely need to be addressed through continuing research.
,
45

42
References
Reynolds, M. C., Wang, M. C., & Walberg, H. J., (1987). The necessaryrestructuring of special and regular education. Exceptional Children,53(5), 391-398.
Stainback, W., & Stainback, S. (1984). A rationale for the merger of specialand regular education. Exceptional Children, 51, 102-111.
Thurlow, M. L., Ysseldyke, J. E. & Wotruba, J. W. (1987). State guidelinesfor student-teacher ratios for mildly handicapped children. (ResearchReport No. 6) Minneapolis: University of Minnesota; instuctionalAlternatives Project.
Will, M. C. (1986). Educating children with learning problems: A sharedresponsibility. Exceptional Children, 52, 411-415..
Ysseldyke, J. E., Thurlow, M. L., Christenson, S. L., & McVicar, R. (in press).Instructional grouping arrangements used with mentally retarded, learningdisabled, emotionally disturbed, and nonhandicapped elementary students.Journal of Educational Research.
Ysseldyke, J. E., Thurlow, M. L., & Wotruba, J. W. (1987). Student-teacherratios for mildly handicapped children in special education settings(Research Report No. 7). Minneapolis: University of Minnesota,Instructional Alternatives Project.
46
APPENDIX
COPY OF SURVEY
47

Name
School Address
Telephone Number ( )
Elementary Secondary/Middle
1. Please indicate your teaching employment status.
Full-Time Part-Time Other, specify
2. How would you best estimate the socioeconomic level of the majority of studentsserved in your school? (Mark only one response.)
Low Low to Moderate Moderate Moderate to High High
3. How many handicapped students in each of the following categories do you teach?(Count students' primary classification.)
Learning DisabledEmotionally Disturbed/Emotional/Behavior DisordersOther, specify
Mildly Mentally RetardedSpeech Impaired
4. Please indicate the number of students you teach who are classified as "mildlyhandicapped" or "special needs" students.
Total number of students on your caseload classified as "mildly handicapped"
5. Structural Arrangements: Teachers sometimes believe that certain classroomstructural arrangements work best for teaching mildly handicapped students. For
each of the following structural arrangements, identify (1) what you do for thehandicapped student(s) in your classroom, and (2) whether this differs from whatyou would do if you had no handicapped students in your class.
(1) What do you do? (2) Does this differ?a, Use of other adults a. Yes No
in the classroom.
b. Size of the small b. Yes Nogroup for instruction.
c. Primary method ofinstruction (e.g.,direct, discovery,cooperative independentwork, etc.).
c. Yes No
d. Degree of structure. d. Yes No
48

i
6. Adaptive Instruction: Teachers sometimes believe that instruction must be adaptedfor handicapped students who are in the regular education classroom. For each of thefollowing statements indicate (1) the desirability of the adaptation, and (2) theextent to which you are able in your own classroom to make the adaptation (forwhatever reason).
(1) Desirabilty (2) Able to Do1 2 3 4 5 6 7 1 2 3 4 57-7
Please Circle Your Answer Low High Low High
1. Altering instruction so student can 1 2 3 4 5 6 7 1 2 3 4 5 6 7experience success.
2. Identifying alternative instructional 1 2 3 4 5 6 7modifications for teaching students.
3. Identifying alternative ways to manage student 1 2 3 4 5 6 7behavior or affect.
4. Modifying curricula in a variety of ways. 1 2 3 4 5 6 7
1 2 3 4 5 6 7
1 2 3 4 5 6 7
1 2 3 4 5 6 7
5. Using alternative methods to instruct failing 1 2 3 4 5 6 7 1 2 3 4 5 6 7student.
6. Using different materials to instruct failing 1 2 3 4 5 6 7 1 2 3 4 5 6 7student.
7. Using other goals to instruct failing student. 1 2 3 4 5 6 7 1 2 3 4 5 6 7
3. Using increased practice opportunities. 1 2 3 4 : 6 7 1 2 3 4 5 6 7
9. Using alternative group placements. 1 2 3 4 5 6 7 1 2 3 4 5 6 7
10. Adjusting lesson pace to meet student's rate 1 2 3 4 5 6 7 1 2 3 4 5 6 7of mastery.
11. Monitoring of student's errors and prescribing 1 2 3 4 5 6 7 1 2 3 4 5 6 7activities to correct incorrect responses.
12. Modifying tasks until student makes no errors 1 2 3 4 5 6 7 1 2 3 4 5 6 7or only infrequent mistakes.
13. Monitoring effectiveni.!ss of alternative 1 2 3 4 5 6 7 1 2 3 4 5 6 7interventions.
14. Informing student frequently of his/her 1 2 3 4 5 5 7 1 2 3 4 5 6 7instructional needs.
15. Holding student accountable for his/her 1 2 3 4 5 6 7 1 2 3 4 5 6 7performance and quality of work.
Comments:
Thank you for your cooperation. Please indicate whether you would be interested inreceiving a brief summary of the results of this survey. Yes No
49

IAP PUBLICATIONS
Instructional Alternatives Project350 Elliott Hall
University of Minnesota75 East River Road
Minneapolis, MN 55455
Research Reports
No. 1 Time allocated to instruction of mentally retarded, learning disabled,emotionally disturbed, and nonhandicapped elementary students by J. E. Ysseldyke,M. L. Thurlow, S. L. Christenson, & J. Weiss (March, 1987).
No. 2 Instructional tasks used by mentally retarded, learning disabled, emotionally
disturbed, and nonhandicapped elementary students by J. E. Ysseldyke, S. L.Christenson, M. L. Thurlow, & D. Bakewell (June, 1987).
No. 3 Instructional grouping arrangements used with mentally retarded, learningdisabled, emotionally disturbed, and nonhandicapped elementary students by J. E.Ysseldyke, M. L. Thurlow, S. L. Christenson, & R. McVicar (July, 1987).
No. 4 Academic engagement and active responding of mentally retarded, learningdisabled, emotionally disturbed and nonhandicapped elementary students by J. E.Ysseldyke, S. L. Christenson, M. L Thurlow, & R. Skiba (July, 1987).
No. 5 The qualitative nature of instruction for mentally retarded, learning disabled,and emotionally disturbed elementary students in special education by J. E.Ysseldyke, S. L. Christenson, & M. L. Thurlow (July, 1987).
No. 6 State guidelines for student-teacher ratios for mildly handicapped children byM. L. Thurlow, J. E. Ysseldyke, & J. W. Wotruba (July, 1987).
No. 7 Student-teacher ratios for mildly handicapped children in special educationsettings by J. E. Ysseldyke, M. L. Thurlow, & J. W. Wotruba (November, 1987).
No. 8 Regular education teachers' perceptions of instructional arrarpments forstudents with mild handica's by J. E. Ysseldyke, M. L. Thurlow, J. W. Wotruba, &157-V.--(ifinTa (January, 1988).
No. 9 Differences in the qualitative nature of instruction for LD and EBD students inregular and special education settings by J. E. Ysseldyke, S. L. Christenson, &M. L. Thurlow (January, 1988).
Monographs
No. 1 Instructional environment scale: Scale development and training procedures byJ. E. Ysseldyke, S. L. Christenson, R. McVicar, D. Bakewell, & M. L. Thurlow(December, 1986).
No. 2 Instructional psycholo y and models of school learnin : Implications fore tective instruction o handicappe' stu ents by L. hristenson, J.Ysseldyke, & M. L. Thurlow (May, 1987).
50

IAP PUBLICATIONS
Page Two
No. 3 School effectiveness: Implications for effective instruction of handicappedstudents by M. L. Thurlow, S. L. Christenson, & J. E. Ysseldyke (May, 1987).
No. 4 Instructional effectiveness: Implications for effective instruction of
handicapped students by S. L. Christenson, M. L. Thurlow, & J. E. Ysseldyke (May,1987).
No. 5 Teacher effectiveness and teacher decision making: Implications for effectiveinstruction of handicapped students by J. E. Ysseldyke, M. L. Thurlow, & S. L.Christenson (May, 1987).
No. 6 Student cognitions: Implications for effective instruction of handicappedstudents by M. L. Thurlow, J. E. YsseIdyke, & S. L. Christenson (May, 1987).
No. 7 Instructional factors that influence student achievement: A'i integrative reviewby J. E. Ysseldyke, S. L. Christenson, & M. L. Thurlow (September, 1987).
No. 8 Adults in the classroom: Effects on special education instruction by A. E. Dear,M. L. Thurlow, & J. E. Ysseldyke (September, 1987).
IAP RRI (IAP-PUB1)
51