document resume ed 284 909 tm 870 473 - eric · document resume. tm 870 473. raivetz, mark j.; ......
TRANSCRIPT

ED 284 909
AUTHORTITLE
PUB DATENOTP
PUB TYPE
DOCUMENT RESUME
TM 870 473
Raivetz, Mark J.; Bousquet, Robert J.How They Spent Their Summer vacation: Imp ct of aTutorial Program for Students "At-Risk" of Fail ng aState Mandated High School Pioficiency Test.Apr 8713p.; Paper presented at the Annual Meeting of theAmerican Educational Research Association(Washington, DC, April 20-24, 1987).Speeches/Conference Papers (150) -- Reports -Research/Technical (143)
EDRS PRICE Mr01/PC01 Plus Pos age.DESCRIPTORS Cutting Scores; Elementa y Second ry Education; Grade
9; *High Risk Students; *Improvement Programs;Mathematics Tests; *Minimum Compet:sncy Testing;*Program Effectiveness; Reading Tests; State S7District Relationship; State Standards; SummerPrograms; *Tutorial Programs; writing Evuluation
IDENTIFIERS *New Jersey High Sch,',11 Proficiency Test; OperationSchool Renewal NJ; Trenton Public Schools NJ
ABSTRACTThe administration of the High School Proficiency
Test (HSPT) in the Trenton (New Jersey) School District and theimpact of a voluntary summer tutorial program on HSPT scores wareexamined. New Jersey requires that all ninth graders take the HSPT,and that all school districts achieve a 75 percent passing rate tobecome state-certified. The same rate is required for testing ingrades 3 and 6, The Trenton district, a large, urban, lowsocioeconomic status district, set up a summer tutorial program inreading, writing, and mathematics to improve HSPT scores. The programwas funded by New Jersey's Operation School Renewal program. Studentswho completed the program were tested again along with the otherninth graders. Pass rates for tutorial vs. non-tutorial students were67.6 vs. 47.6 percent in reading; 58.1 vs. 36.2 percent inmathematics; and 65.4 vs. 43.3 percent in writing. Tutorial students'mean scores ware significantly higher than the non-tutorial students.Although the tutorial students' mean scores were above the passingscores in all subjects, 75 percent of the students did not achievebeyond the state standard. However, the pass rates were higher thanfor the whole student body, meaning the at risk students outperformedthose students not at risk. (JGL)
** * **************** ********** ** **** *** *** ********Reproductions supplied by EDRS are the best that can be made
from the original document.******* ********************** ******
HOW THEY SPENT THEIR SUMMER VACATION: IMPACT OF ATUTORIAL PROGRAM FOR STUDENTS RAT-RISK" OF FAILING A
STATE MANDATED HIGH SCHOOL PROFICIENCY TEST
U $. OCPAM. OF EDUCATION0 d rd,aKynsi roc/CA TIONAI. flroucis NFORMATION
CLNIUR IL MCIr4orlirnorq hp twen ICti,X1o(Md dt,
'tom th p4flon i (34-go,,tio!,0e.
pwnt nomcmsffsiod tn^* OCACt.4-,At io nt eCPSSAnty ,tWfivseM utbcialor poky
'PEOMI5ION 10 P
mATEHIAL HAS flEM
/11' Aitt
A
1;7
10 THE LQUCMtONALFLINFORMATION CEN TER IE
Prepared by
ii
Mark J RaivetZand
Robert J. Bousquet
Trenton Public SchoolsTrenton, New Jersey
Paper presented at the Annual Meeting of theAmerican Educational Research Association, Washington, D.C., April 1987

Toct in Now Jersey
The State of New Jersey, be. fore the creation of the Na ional
Comisslon on Excellence in Education, established sta- requirements
for earning a high school diploma. Included among these requirements
as the passage of a grade nine statewide test in reading and
mathema ics: the M nimum Basic Skills Test (MBS). Students failing the
test in grade nine were re-tested annually until they passed.
Individual schnel districts in the state could nnt At
cert fica n" unless at least 75% of their ninth grade students
passed.
Recognizing the need to assess writing, and responding to criticism
that a test of "minimum" skills was no longer adequate, the Sta e
Department of Education developed the more rIgorous High School
Proficiency Test (HSPT). Beginning in Spring 1986, this "graduation
test" was administered to all ninth grade students statewide. Higher
order skills in the areas of reading, mathemati:s and writing (including
a 30 minute essay) were assessed.
This paper describes the impact of the state's new testing pro r m
on Trenton, New Jersey public schools, and reports the results of a
summer school program designed to prepare "at risk" students to
successfully pass tne tests.
Trenton Public Schools
Trenton serves as the state capitol of New Jersey. Government may
be characterized as the city's largest industry. City population
exceeds 90,000. During working hours, these numbers swell to inc ude
thousands of sta e workers - most of whom do not live in Trenton, and few

m send their children to the public schools. The city itself is
located within Mercer County. Neighboring suburban towns and their
respective school districts bare little resemblance to Trenton.
Within Mercer County, Trenon city accounts fo 73% of all
minorities 75% of all Blacks; 70% of all Hispanics. Comparing the
Trenton schools with the remain ng Merro,' County districts, the dis rict
accounts for: 72% -f all minorities;, all Black students; and 85%
of all Hispanics !Judomts. McIt of these children are poor.
Trenton is one of the state's larger districts, enrolling
approximately 14,000 students in 26 schools. The student population is
69-:; Black, 18% Hispanic and 13 White. It is one of the 56 urban
districts (there are 611 districts statewide), and it ranks in the
lowest of the 12 District Factor Groupings (indicators of the
socioeconomic status of citizens living in the districts) used by the
tate in comparative reporting of testing results.
Achievin S ate Certificajon
Although the urban districts comprise only nine percent of the
state total, they account for over 40% of the student population. For
;ts part, the stPte department treats all districts alike. The urbans
quest'an openly the sta:;e's definition of equity.
The state department of education is virtually omnipotent. The
governor of the state has attempted to build a national reputation on
the reforms of his comissioner of education. These reforms, many of
which impact most heavily on the urban districts, include a
multi-faceted monitoring process. Districts are monitored once every
five years. Those failing to pass even one of 51 indicators in the

s ar-
prepare
apprnv(
SI
indico
to see 1
II monitoring. Here, a district must
,Tective action plan which the state must
Arn in a r; not only to check on any
y failed, but also to recheck all other indica
c, been maintained.
,iling to achieve certification under Level T, even
th state assistarce, are triggered into Level III. Level I I
districts unable to show reasonable progress are candidates for state
takeover and are characterized by the governor as educationally
bankrupt.'
Trenton is in the first year of Level II monitoring. I s major
failing is in the area of student achievemen'. Although NCE's are above
the 50th percentile for reading from K-6 and mathematics from K-9,
Trentcn has been unable to achieve minimal levels of proficiency (MLP)
in the three grades identified by the state for monitoring: grades 3, 6
and 9.
To attair certification, 75% of all children in ev2ry third grade
and every sixth grade in every school must meet or exceed the MLP.
MLP's are freguently`above the Seth and (in the case of third grade
math) 60th national percentile ranks on na ionelly normed achievement
tests.
New Jersey standards are demonstrably higher. Test publishers who
spend millions to develop a national percentile rank of 5() struggle with
state standards that call for 75% of students to be above the 63rd
percentile.
No urban district has attained sta e certification under these
guidelines. It is unlikely that any will.

ln ninth grade, cer i-ication is dependent upon the High School
Proficiency Test. As with grres 3 and 6, 75% of the students must
exceed state standards.
r-113-ar-S0).1:
Although the H.S.P.T did not "coun " for graduation until April
1986, practice administration to ninth graders in Spring 1984 and Spring
1985 indicated that as few as 167 of the students might pass the tests.
Despite claims that the test was unfair and discriminated against poor
children in urban districts, its administration was non-negotiable.
Trenton administrative staff moved to design instructional prog ams
to raise student performance levels to stat., standards. One such
strategy involved the development of a summer tutorial program in the
areas of reading, $Ariting and mathematics for students entering ninth
grade who were considered to be "at risk" in terms of passing the High
School Proficiency Test. The program was voluntary. No course credit
was given.
Funding was provided by the state as a part of the Operati n School
Renewal (n.S.R.) program. Trenton was one of three districts statewide
selected for O.S.R. consideration. The district was fully responsible
for the 0.5.R. summer school's des an, implementation and evaluation.
The O.S.R. Summer School
The summer school program had two objec ives:
. To raise student performance levels in reading, mathematicsand writing to state standards, and
To provide a summer tutorial program in the areas of reading,mathematics and writing for students who are considered tobe "at risk" in terms of passing the High School ProficiencyTest.

In developing the summer school program, the method of student
selection was based on the results of a pretest. The district pretested
students at the end of the eiahth grade with the 1985 version of the
H.S.P.T. Based on these results, students judged to be "at r sk" of not
passing the test in ninth grade were invited to attend a six week summer
school program. The program began with 175 students; 163 remained at
the end of the program. A total of 136 students completed testing in
April 1986. No initial achievement differences tmuld be found between
at risk students who participated in the tutorial and those that did
not. Participants received 45 minutes of instruction in each of the
three areas in classes with a teacher/pupil ratio of approximately 1 to
15. Materials were selected for their relevancy to student needs.
Weekly tests were administered to dieck progress and reports were sent
home to parents at the end of eao week's instructional cycle.
Staffing included an administrator, a guidance counselor, three
writing teachers, three reading teachers and three mathematics teachers.
At the completion of th ,. program, students were post tested with
the same 1985 version of the test. Results showed average gains of 9.6
points in reading, 6.4 points in mathematics, and 10.1 points in
writing. This six week experience, however, was not enough to evaluate
the true value of the summer model.
The real impact of this program could not be determined unt l the
1986 version of the H.S.P.T. was administered to all ninth graders in
April 1986. It was expected that these results would show that summer
school students' passing rates would exceed those of students who did
not have the summer experience.
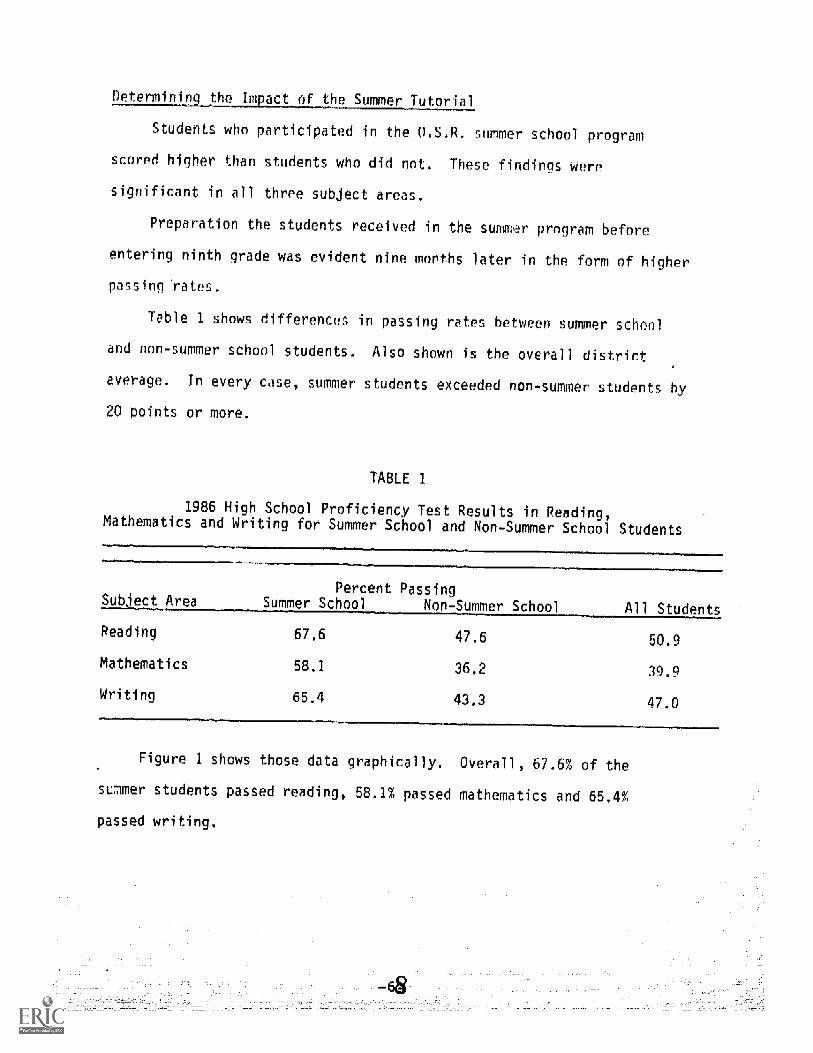
Determ ning the Impact of the Summer Tutorial
Students who participated in the 0.S.R. summer school progr c
scored higher than students who did not. These findings were
significant in all three subject areas.
Preparation the students received in the summer program before
entering ninth grade was evident nine months later in the form of higher
passing rates.
T ble 1 shows differences in passing rates between summer school
and non-summer school students. Also shown is the overall district
average. In every case, summer students exceeded non-summer students
20 points or more.
TABLE 1
1986 High School Proficiency Test Results in Reading,Mathemat cs and Writing for Summer School and Non-Summer School Students
Percent PassingSubject Area Summer School Non-Summer School All S ud
Reading 67.6 47.6 50.9
Mathematics 58.1 36.2 39.9
Writing 65.4 43.3 47.0
Figure 1 shows those data graphically. Overall, 67.6% of the
summer students passed reading, 58.1% passed mathematics and 65 4%
passed writing.

1985 0
68
443
READINtl
SIRUP SCHOOL
FIGURE 1
S 'U'iE SCHOOL FRA'MARYrum SCOTTS
S8
MATH MUG
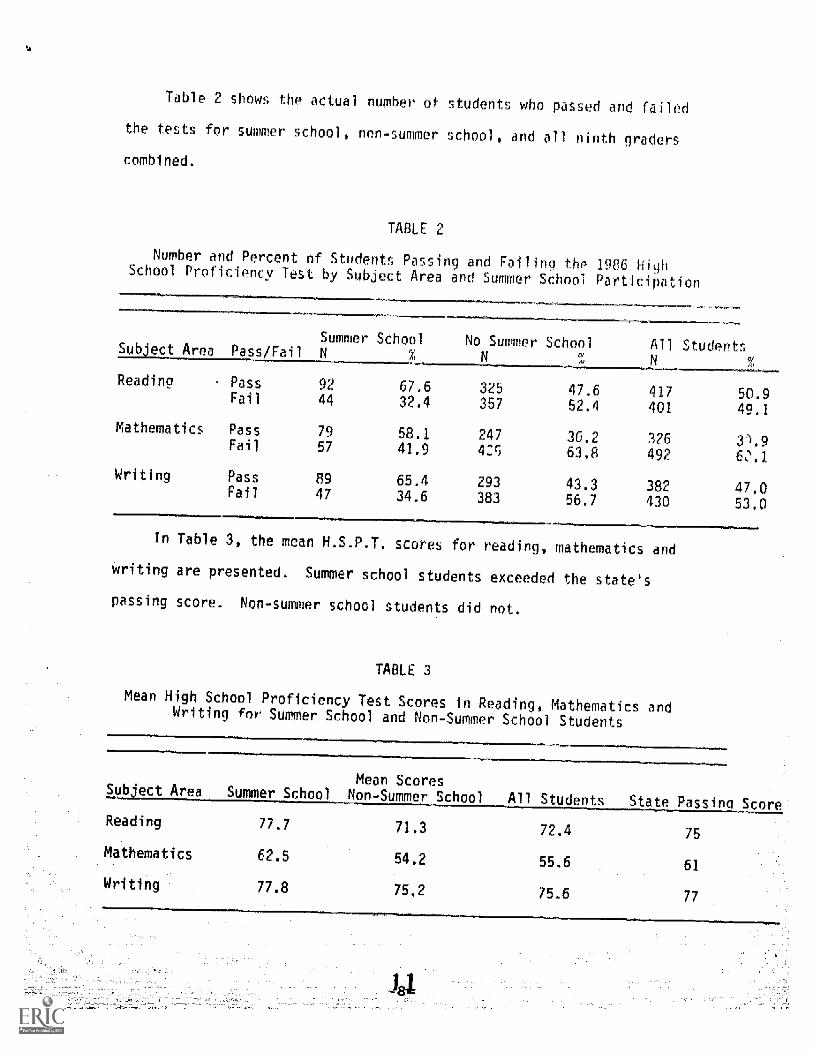
Table 2 shows the actual number of students who passed and failed
the tests for summer school, non-summer school, and all ninth graders
combined.
TABLE 2
Number and Percent of Students Passing and Failing the 1986 HighArea and Summer School Participation
School Proficiency Tesl by Subjec
Summer School No Sunnwr School All
Reading Pass 92 67.6 325 47.6 417 50.9Fail 44 32.4 357 52.4 401 49.1
Mathematics Pass 79 58.1 247 36.2 326 31.9Fail 57 41.9 45 63.8 492 6:.1
Writing Pass 89 65.4 293 43.3 382 47.0Fail 47 34.6 383 56.7 430 53.0
In Table 3, the mean H.S.P.T. scores for reading, mathematics
writing are presented. Summer school students exceeded the state's
passing score. Non-summer school students did not.
TABLE 3
Mean High School Proficiency Test Scores in Reading, Mathematics anding for Summer School and Non-Summer School Students
S b ect Area Summer SchoolMean Scores
Non-Summer School All Students State Passina Score
Reading
Mathematics
ing
77.7
62.5
77.8
71.3
54.2
75.2
72.4
55.6
75.6
75
61
77
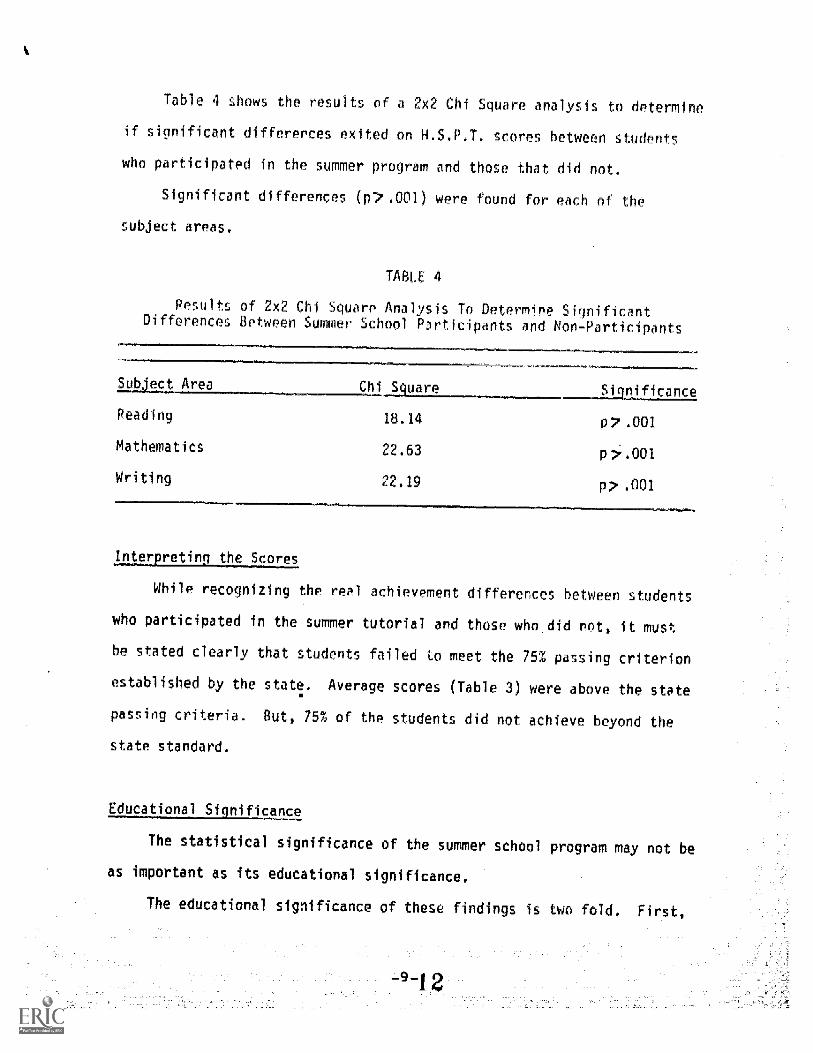
Table 4 shows the res- ts of a 2x2 Chi Square analysis to determine
if significant differences exited on H.S.P.T. scores between students
who participated in the summer program and those that did not.
Significant di ferences (r).001) were found for each of the
subJect areas.
TABLE 4
Peults of 2x2 Chi Square Analysic To Determine SignificantDi ferences Bptwpen Summer School P3rticipants and Non-Participants
Sub'ect_Area Chi Squa Significance
Reading 18.14 p 7 .001
Mathematics 22.63 p.001
Writing 22.19 13,, .001
tterprngtheScores
While recognizing the real achievement differences between student
who participated in the summer tutorial and those who.did not, it must
be stated clearly that students failed to meet the 75% passing criterion
established by the state. Average scores (Table 3 ) were above the state
passiog criteria. But, 75% of the students did not achieve beyond the
state standard.
Educational _Significance
The statistical signi icance of the summer school program may not be
as important as its educat onal significance.
The educational significance of these findings is two fold. Firs
the Trenton Public Schoolt, have developed a program that, aftpr a
thorough evaluation, has proved successful. For the district, a model
has been developed which may be used to increase the number of students
meeting minimum state standards.
Second, in line with the recent report from the U.S. pepar meet of
Education, it is important to report "what works." Students attending
summer school who were categorized as "at risk" of failino a state
mandated test actually out performed students not at risk. If higher
standards are nsed to evaluate the effectiveness of a local district's
educational product, and the district is able to develop an effective
strategy for meeting the standards, then those strategies and practices
that work must be disseminated.
13