document resume ed 262 944 - ericfiles.eric.ed.gov/fulltext/ed262944.pdf · document resume ed 262...
TRANSCRIPT

DOCUMENT RESUME
ED 262 944 RC 015 516
AUTHOR Juarez, Rumaldo Z.; And OthersTITLE Preliminary Findings of a South Texas Elderly Needs
Assessment Survey: A Rural-Urban Comparison ofHispanic and Non-Hispanic Elderly Family Support.
PUB DATE 24 Aug 84NOTE 27p.; Paper presented at the Annual Meeting of the
Rural Sociological Society (College Station, TX,August 24, 1984;.
PUB TYPE Reports - Research/Technical (143) --Speeches /Conference Papers (150)
EDRS PRICE MF01/PCO2 Plus Postage.DESCRIPTORS Anglo Americans; Blacks; Comparative Analysis;
Cultural Differences; Educational Attainment;Extended Family; Family (Sociological Unit); *FamilyInvolvement; *Hispanic Americans; Mexican Americans;Middle Aged Adults; *Needs Assessment; *Older Adults;*Quality of Life; Rural Population; *Rural UrbanDifferences: Socioeconomic Status; UrbanPopulation
IDENTIFIERS Family Responsibility; Texas (Cameron County); Texas(Hidalgo County); *Texas (South); Texas (WillacyCounty)
ABSTRACTElderly Hispanic and non-Hispanic rural and urban
noninstitutionalized residents of three Texas counties (Hidalgo,Cameron, and Willacy) which border Mexico showed significantdifferences in educational attainment, income, occupation, and familysupport. Face-to-face interviews were conducted by mostly bilingualelderly volunteers. Age distribution was similar for 646 Hispanicsand 155 non-Hispanics--140 Anglos and 15 Blacks; 90% of Hispanics and33% of non-Hispanics did not complete high school; 75% of Hispanicshad incomes less than $5,000, derived primarily from governmentassistance; four-fifths of urban and two-thirds of ruralnon-Hispanics had incomes greater than $5,000 and were several timesmore likely to have retirement pensions or private income; 50% ofnon-Hispanics and 15% of Hispanice had held white collar jobs. Morenon-Hispanics lived alone or with spouses; more Hispanics lived withspouses and children, children, or other kin. Both urban and ruralHispanics evidenced a more extensive, more supportive kinshipnetwork. Hispanic elderly had greater frequency of interaction withfamily members and received more frequent monetary support and twiceas much service support from family. Survey findings may helppolicymakers avoid overestimating family support when reducing publicservices and may promote understanding of cultural differences intreatment of the elderly. (LFL)
*****************************************************************k*****
Reproductions supplied by MRS are the best that can be madefrom the original document.
***********************************************************************

DOC
PRELIMINARY FINDINGS OF A SOUTH TEXAS ELDERLY NEEDSASSESSMENT SURVEY: A RURAL-URBAN COMPARISON OFHISPANIC AND NON-HISPANIC ELDERLY FAMILY SUPPORT
"PERMISSION TO REPRODUCE THISMATERIAL HAS BEEN GRANTED BY
TO THE EDUCATIONAL RESOURCESINFORMATION CENTER (ERIC)."
Rumaldo Z. Juarez
Manuel M. Lopez
Pan American University
and
Leobardo L. Garcia
Area Agency on Aging
August 24, 1984
U.S. DEPARTMENT OF EDUCATIONNATIONAL INSTITUTE OF EDUCATION
EDUCATIONAL RESOURCES INFORMATIONCENTER (ERIC)
This document has been reproduced asreceive,: from the person or organizationong.nating it
C 1 Minor changes have been made to improvereproduction quality
Points of view or opfilons stated in this document do not necessarily represent official NIEposition or policy
Paper presented at the annual meetings of the RuralSociological Society. College Station, Texas. TheAuthors acknowledge the support of theArea Agency on Aging and the Lower Rio GrandeDevelopment Council, McAllen, Texas.
PRELIMINARY FINDINGS OF A SOUTH TEXAS ELDERLY NEEDSASSESSMENT SURVEY: A RURAL-URBAN COMPARISON OF
HISPANIC AND NON-HISPANIC ELDERLY FAMILY SUPPORT
It is customary in most of these types of research efforts to credit the
lack of literature and/or research in one's particular topic as the motivation
or reason for doing the research. In this instance, however, the motivation for
the needs assessment study surfaced from the flagrant social, economic, and
health needs of elderly in South Texas that are most apparent to the persons who
have direct contact with elderly as service workers of elderly service agencies.
Specifically, those persons who work in the Area Agency on Aging
funded by the Lower Rio Grande Development Council. This is not to deemphasize
the apparent lack of literature and research, as will be pointed out later,
rather it is to recognize a community grass-roots effort to meet the social,
economic, and h .alth needs of an increasing elderly population in South Texas.
In this cooperative effort between the Area Agency on Aging and
Pan American University, an elderly needs assessment survey was conducted in
July-August 1983. At this time, it is the intent of this paper to share with
you some preliminary results of the survey. The focus of the paper will be on
a rural-urban comparison of Hispanic and Non-Hispanic elderly needs and the role
of the family in helping to meet these needs.
The role of the family in caring for the needs of the elderly is of
concern for several reasons. From a social policy perspective is the concern for
who is caring for needy elderly who have no active family support system and the
3

Page 2
elderly public services are not reaching them either. On the other hand, if the
family support system is playing a role, is it possible that the real magnitude
of the elderly's problems and needs is greatly underestimated by federal, state
and local programs for the elderly since the family is absorbing those needs.
Also, is it posible that federal, state, and local programs for the elderly
are being decreased or not as 'xtensive as they should be because these programs
assume that the family is fulfilling the needs. In essence, what these false
assumptions could be contributing to is development of gaps in the elderly's
welfare and security net where neither the family nor the public programs are
helping to meet the needs of elderly.
From a value perspective, the role of family support in caring for the
elderly could be raised from a moral or ethical view. Should society expect
that the family will take on the responsibility of caring for its elders? Put
more directly, should a needy parent assume and expect that when they grow old,
they should be cared for by their family rather than depend on public programs
for support? This concern is increasingly gaining importance as public-policy
makers realize ever more that our country's current public support system for
the elderly population (Social Security, Medicare, Medicaid, etc.) is gradually
becoming obsolete amidst the increasing and older population of persons age 65
and over in the United States (Fowles, 1983).
Further complicating this concern of the role of family support in caring
for the elderly is the factor of culture. For the Mexican American, the factor
is believed to be a significant factor. Howeve-, as will be pointed out later,
the research to date is inconclusive. Some researchers support the contention

Page 3
that the Mexican American family "take care of its elderly" while other claim
it does not. Cursory ethr.-_,Jraphic research by the authors in the region where
these aata were obtained also point to contradictory outcomes. Directors of
programs for the elderly in the region, largely as a result of their position,
have identified and are aware of neglected and abused elderly who have been
ignored by their family. The extent of this problem, however, is not known.
In contrast, contact with individuals who are known to have elderly persons in
their family appear very adament about their responsibility of caring for their
elders and are even abhorred by the thought of some family member neglecting
their elders. In cases where some elders are known to be neglected Ly their
family, it is not surprising to see the family members scorned by other members
of the extended family, friends/neighbors, or staff of public service agencies.
Still, what is lacking amidst this controversy are empirical studies that
could help to enlighten the understanding of the family's role in caring for
elderly.
While considerable research has been conducted on the role of the family
in caring for elderly in the general population, (Shanas, 1979; Kart, 1981: 149-171;
and Ward, 1979: 293-307) research of this type is in its infancy stage for Mexican
American elderly and practically nonexistant on rural Mexican American elderly.
As indicated earlier though, what literature does exist on the Mexican American
elderly seems to identify two contrasting opinions. On the one hand, investigators
such as Streib (1977), Leonard (1967), Madsen (1969), Sotomayor (1971) and Rubel
(1966), support the idea that the extended family is the most important social
support system and that it takes care of the Mexican American elderly in a
positive and rewarding manner. On the other hand, investigators such as Maldonado
5

Page 4
(1975), Wilson and Heinert (1977), Montiel (1970) and Crouch (1972), suggest
that this may be a stereotype and a myth. According to Wilson and Heinert
(1977: 24),
An extensive ethnographic literature exists whichhas attribi:ted a distinctive family character toMexci:m Americans. It can be summed up asportraying the Chicano as contemporary representativesof the folk society, with kinship bonds far strongerand more supportive than are found in the contemporary,urbanized, nuclear, Anglo family unit. It was onlyamong Mexican American respondents themselves thatthese popular viewpoints were forcefully repudiatedas stereotypical myths.
The most recent research on this issue of family support of Mexican American
elderly is that of Markides, Martin and Gomez (1983). Markides et al. study was
based on a sample of 363 Mexican Americans and 156 Anglo elderly age 60 and over
living in San Antonio, Texas. The data were collected in 1976. Using an
"intergenerational solidarity index" Markides et al. concluded that comparisons
between Chicano and Anglo elderly:
...did not indicate the older Chicanos were morelikely to report closer relations or exhibitgreater solidarity with their children. Thesefindings suggest a minimum that the traditionalview of the Mexican American family in whicholder members enjoy a sheltered position issomewhat overdrawn. While this view may havehad validity at an earlier time when the Chicanopopulation was mostly rural, the place of olderChicanos in the family must be evaluated in itsurban-industrial context. (1983: 39-40)
In the discussion which follows, an attempt is made to elucidate further
the issue of the family support system of both Mexican American and Anglo
elderly living in rural and urban areas. At this preliminary stage of analysis
the discussion will be largely descriptive and of an exploratory nature.
6

Page 5
METHODS:
Data for this study were obtained from an elderly needs assessment survey
conducted by the Area Agency on Aging of South Texas. The area served by this
agency covers Hidalgo, Cameron, and Willacy counties. All three counties are
on the border with Mexico. The data were collected in July-August 1983 througri
personal interviews. A stratified random sampling process was used to obtain
the sample 801 non-institutionalized elderly. The population consisted of
45,777 households which had one or more persons age 60 or over in the three
counties. This age category was selected because the persons served by the Area
Agency on Aging starts at age 60. By this method, 52 census tracts were
canvassed in Cameron county, 53 in Hidalgo and 3 in Willacy. Willacy county was
oversampled to ensure a larger number of sampled elderly in the largely rural
county. Of the 801 elderly 646 (80.6 percent) were Hispanic and the remaining
155 (19.4 percent) were Non-Hispanic. Not surprisingly, 98 percent of the
Hispanic sample was of Mexican origin. Of the Non-Hispanic sample, 88 percent
were Anglo and about 10 percent were Black (n=15). Overall, about three-fourths
of the sample was urban. While most of the places identified as urban had a
population of 2,500 or more, a few communities were classified as rural based
on knowledge about these communities by the authors. Examples of these were
Port Isabel and La Feria, two relatively isolated communities in Willacy
county.
The data were collected by face-to-face interview using a questionnarie
that took approximately 20-35 minutes to administer. The questionnaire was
translated to Spanish and pre-tested. Twenty-seven interviewers were used for
7

Page 6
conducting the survey. Most of them (85 percent) were elderly volunteers
recruited from the various organizations that serve the elderly. For the
most part, all of these interviewers were bilingual Spanish/English-speaking
persons. Interviewers who spoke only English were assigned to census tracts
known tb be inhabited by English-speaking persons only. Put another way, the
"Anglo" part of town. The interviewer's received an eight-hour training session
on interviewing techniques and canvassing instructions. Prior to the start of
the survey a public media campaign was launched in the areas where the survey
was to take place.
DISCUSSION:
In general, the age distributions of our sample of Hispanic and Non-Hispanic
elderly are relatively similar with only a few small differences. Realizing that
there are significant socioeconomic, functional, and health differences within
the aged population, the sample was grouped into three age-categories: young-old
(60-65), middle-old (65-75), and old-old (76+). Roughly 30 percent of elderly
from both groups (Hispanics and Non-Hispanics) are in the young-old category and
slightly over forty percent from both groups are in the middle-old category. The
two groups do differ slightly in the old-old category which has about one-fourth
of the Hispanic elderly compared to 32 percent of the Non-Hispanic. This outcome
was not surprising in light of vital statistics data which indicate that white
elderly persons have a slight longevity edge over the Hispanic aged (Juarez, 1981).
About three-fourths of all elderly live in urban areas. Nevertheless, there do
seem to be some slight differences when the two groups are compared within age
categories by rural-urban residence. Among the young-old, there are a smaller
proportion of Non-Hispanic elderly (23.5 percent) living in rural areas than
8

Page 7
Hispanic (31 percent). This outcome is reversed in the middle-old category
where a larger proportion of Non-Hispanic than Hispanic elderly live in
rural areas. In the old-old category, more of the Non-Hispanic elderly live
in urban areas than the Hispanic.
[ Table 1 about here ]
Other than the slight difference in rural-urban residence between the two
groups, the age homogeneity of the two groups can be observed in Table 2. The
almost identical low age-range of 60 for the two groups is explained by the
selection criterion established for the sample, i.e. persons aged 60+. The
high age-range for Hispanics was 97 and for Non-Hispanics, 91. Again, in light
of vital statistics information, this age difference in longevity "favoring"
the Hispanic was not expected. One probable explanation might be that the
older Non-Hispanics were not in the sample because they may be in nursing homes.
Since this was a sample of non-institutionalized elderly, they were excluded
from the sample. One similarity between the two groups is that the high age for
either Hispanic or Non-Hispanic elderly was in the urban category. Both the
mean and the median for both groups regardless of area of residence are very
similar, i.e. about age 70.
[ Table 2 about here ]
That females outnumber the males in both groups regardless of where they
lived is not surprising, Table 3. This outcome was expected since there are
more women in the population aged 60 and above. The only notable difference is
the smaller proportion of Non-Hispanic males (29.4 percent) living in rural
areas.
[ Table 3 about here ]
Almost half of the elderly from all four groups (Hispanic rural and urban
and Non-Hispanic rural and urban) reported that they were married, Table 4.
9

Page 8
As expected, the next largest category of marital status for all groups was the
widowed. For the most part, rural-urban comparisons for the two ethnic groups
are very similar across all marital status categories with one exception, the
"never married." A larger proportion of never married Hispanics (6.7 percent)
were in the urban areas than Non-Hispanic in the same group (0.8 percent;. In
contrast, there were more never married Non-Hispanics (15.2 percent) living in
rural areas than there were never married Hispanics (4.7 percent) living in
rural areas.
[ Table 4 about here ]
Not surprisingly, Hispanic and Non-Hispanic elderly differed considerably
in their levels of education attained, Table 5. Over ninety percent of Hispanics
from either rural or urban areas had not completed high school as compared to
about one-third of Non-Hispanic elderly. Among the Non-Hispanic elderly, however,
those from rural areas were less likely to have completed high school. The
largest proportion of Non-Hispanic elderly from either rural or urban areas had
completed high school or technical school. Only two percent of Hispanic elderly
had completed college compared to about 18 percent of the Non-Hispanics.
[ Table 5 about here ]
Hispanic elderly from both rural and urban areas are also largely concen-
trated in the low income category ($5,000 or less). Nearly three-fourths of
the Hispanics reported a family income of $5,000 or less compared to about
one-fifth of the urban Non-Hispanics and one-third of the rural Non-Hispanics.
While over one-third of rural and urban Non-Hispanics are in the high income
category ($10,000 or more), there are only about one-twentieth Hispanics. The
largest proportion of Non-Hispanics are in the middle income category ($5-$10K).
[ Table 6 about here ]
The most frequent source reported by all elderly was Social Security, Table
7. Considerably more of the Hispanic elderly from both rural and urban areas
10

Page 9
were on Supplemental Security Income (SSI) and Food Stamps. In light of the
discussion on family income and levels of education for Hispanic elderly,
these sources of income are not surprising. Nearly three times as many urban
Non-Hispanics than urban Hispanics reported income from a retirement pension.
In the rural areas, this difference was more drastic, i.e. nearly eight times.
One probable explanation for such a large difference in the rural elderly is
the larger number of elderly whose occupation was farmworker. About equal pro-
portions of Hispanic and Non-Hispanic elderly reported receiving some income
from other family members. This similarity, however, disappears for the rural
elderly where about 16 percent of the rural Hispanic elderly reported family
support compared to three percent of the rural Nch-Hispanic. One other major
difference is in the category of income from private sources. Nearly seven
times as many urban Non-Hispanics than Hispanics and two times as many urban
Non-Hispanics than urban Hispanics reported income from private sources.
[ Table 7 about here j
In response to a question about the repondent's quality of life, nearly
half of the Hispanic rural elderly and one-third of the rural Non-Hispanics
indicated a condition that was worse than five years ago. Among the urban
respondents, Hispanic elderly responded in the negative at more than twice
the rate of Non-Hispanic elderly, Table 8.
r Table 8 about here 3
The previous discussion of elderly's education and income levels set the
groundwork for wnat's to be expected about their occupational status. Both
rural and urban Hispanics were poorly represented in the white collar occupa-
tions when compared to the rural and urban Non-Hispanics. Nearly half of the
latter reported a current or past occupation in the white collar category
compared to about 15 percent. of the Hispanics, Table 9. Since traditionally
Hispanic females have not been part of the labor force, it was not surprising
11

Page 10
to find half of the rural Hispanics in the housewife occupation and over 40
percent of the urban. Of those who indicated an occupation, however, only
about 10-15 percent of both Hispanics and Non-Hispanics were currently em-
ployed, Table 10. The majority of both Hispanics and Non-Hispanics that were
employed were on a part-time basis, Table 12. Not unexpected, among both
groups those who reported that they were unemployed, the 16ajority were retired,
Table 11. Worthy of noting, however, is the larger proportion of Hispanics than
Non-Hispanics who reported a handicapped condition.
[ Tables 9, 10, 11 and 12 about here ]
One indicator of family support is the type of residential accomodations
of the elderly. Table 13 illustrates the distribution of six different types
of residential accomodations. Hispanic and Non-Hispanic differences are clearly
evident. Regardless of area of residence, proportionately more Non-Hispanics
live alone than Hispanics. Larger proportions of Non-Hispanics than Hispanics
live with their spouse but larger proportions of Hispanics live with their
spouse and children. Also, larger proportions of Hispanics than Non-Hispanics
live with their children only and more of the Hispanic than Non-Hispanic elderly
live with other kin.
[ Table 13 about here ]
In an effort to assess the extent of relatives' assistance to the elderly,
the respondents were asked to list their relatives, indicate the frequency of
visits, and the type of assistance the family members provided. These results
are reported in Tables 14, 15 and 16.
The figures indicated in Table 14 represent a conservative estimate of the
number of the e'..lerly's relatives. In general, it indicates that urban Hispanic
elderly have about four times as many relatives living in the same house with
them as Non-Hispanics and about six times those living in rural areas. Urban
Hispanics also have 2.8 relatives living in the Valley Region compared to the

Page 11
1.2 for urban Non-Hispanics. Among rural elderly, Hispanics have about 3.3
relatives living in the region compared to 1.6 for Non-Hispanics. In contrast,
Non-Hispanic elderly have about twice as many relatives living out-of-state as
Hispanics. In other words, the extended family among Hispanics in the Valley
appears to be more frequent than for Non-Hispanics.
[ Table 14 about here ]
Having relatives living close-by does not mean family support for the elder
takes place. There must also be some contact between the elderly person and
his/her relatives. To measure this, a question about frequency of contact
followed the question about proximity of relatives. These results are illust.ated
in Table 15. The pattern of visitation evident among both rural and urban elderly
is one of more frequent daily and weekly visitations among Hispanics than Non-
Hispanics. As the distance between visits increases, the frequency of visitations
decreases for Hispanic elderly but shows a slight increase for the Non-Hispanics.
[ Table 15 about here ]
Proximity to the elderly and frequency of visitations still does not indi-
cate that some type of assistance is being provided. To measure this another
follow-up question was used to assess whether any assistance was being provided
and if so, what type of assistance. These results are presented in Table 16.
Basically, the results indicate that urban Hispanics are frequented with more
monetary assistance than urban Non-Hispanics but rural Non-Hispanics are fre-
quented with more monetary assistance than rural Hispanics. When it comes to
services, Hispanics from both rural and urban areas are frequented with services
at about twice the rate of Non-Hispanics. Very few of both Hispanics and Non:
Hispanics are provided with both money and services and about equal prciortions
of elderly from both groups do not receive any assistance at all.
[ Table 16 about here ]
13

Page 12
Another area indicative of family support is the issue of transportation.
The Hispanic elderly, both rural and urban, are more likely to rely on rela-
tives for transportation assistance than either urban or rural Non-Hispanics;
nearly three times as likely for urban Hispanics compared to urban Non-Hispanics
and about one-third more likely for rural Hispanics vis-a-vis rural Non
Hispanics, Table 17. Conversely, urban Non-Hispanics are more than twice as
likely to drive themselves than their urban Hispanic counterparts. In a reversal
of the earlier pattern, rural Non-Hispanics are one-third more likely to drive
themselves than are rural Hispanics. Hispanics are also more likely to rely on
others for transportation assistance than their Non-Hispanic counterparts. While
these differences are partially explained by ethnic diFferentials in the num-
ber of respondents with a physical condition restricting activity to the home,
they are also indicative of a greater need for self-reliance among Non-Hispanics
resulting from a less extensive support network of kin (see Tables 15 and 16).
The more extensive reliance of Hispanic elderly on assistance from non-relatives
when compared to urban, and to an unexpectedly lesser extent rural, Non-Hispanics
can indicate their greater integration into the total community as opposed to a
possible insulation from the same larger community on the part of urban Non-
Hispanics.
[ Table 17 about here ]
Focussing our attention on the homebound, we see again the more extensive
and developed kinship m.twork of the Hispanic elderly. Whereas nineteen percent
of the urban and roughly sixty-three percent of the rural Hispanic homebound
elderly receive no monetary or service assistance from relatives, the comparable
figures for the Non-Hispanic elderly are 42 percent for urban residents and 92
percent for rural respondents, Table 18. For the bed-ridden homebound the con-
trast is even more striking: only 7 percent of the bed-ridden urban and 27 per-
cent of rural Hispanic elderly receive no assistance from their relatives. The
14
Page 13
corresponding figures for the bed-ridden Non-HispaNic elderly are one-third of
urban residents receiving no assistance and all cases (N= 3) of rural elderly
receiving no assistance. The evidence appears indicative of a more extensive,
more supportive Hispanic than Non-Hispanic kinship network within, the Valley
region.
[ Table 18 about here ]
15

Conclusion:
As indicated by the title of our paper, these results are preliminary.
A more sophisticated level of analysis using multivariate models lies ahead.
Clearly, controlling for such variables as ethnicity and social class will
greatly strengthen our results and help to examine further the issue of
family support.
Overall, there appears to be room for improvement for family support of
both Hispanic and Non-Hispanic elderly. The Hispanic elderly seems to have
greater frequency of interaciton with family members than Non-Hispanic and
also seem to receive more frequent support of a monetary and service nature
than Non-Hispanic. Especially apparent are the much larger proportions of
Hispanic elderly than Ncn-Hispanic who rely on relatives for transportation.
The type of support received most frequently by both Hispanic and Non-Hispanic
elderly is services rather than monetary Being that Hispanic elderly are for
the most part in a low class status, this could be one area of needed increased
support. Also evident between the two groups is the greater degree of support
received by Hispanic elderly than Non-Hispanic elderly who are homebound or
bed-ridden. Obvious For both groups are the proportions who aren't receiving
any type of support from the family.
What remains to be investigated is a measure of "Need" for family support
in both groups. Also, what are the advantages and disadvantages of presence
of the extended family for both the elderly and the family members affected.
16
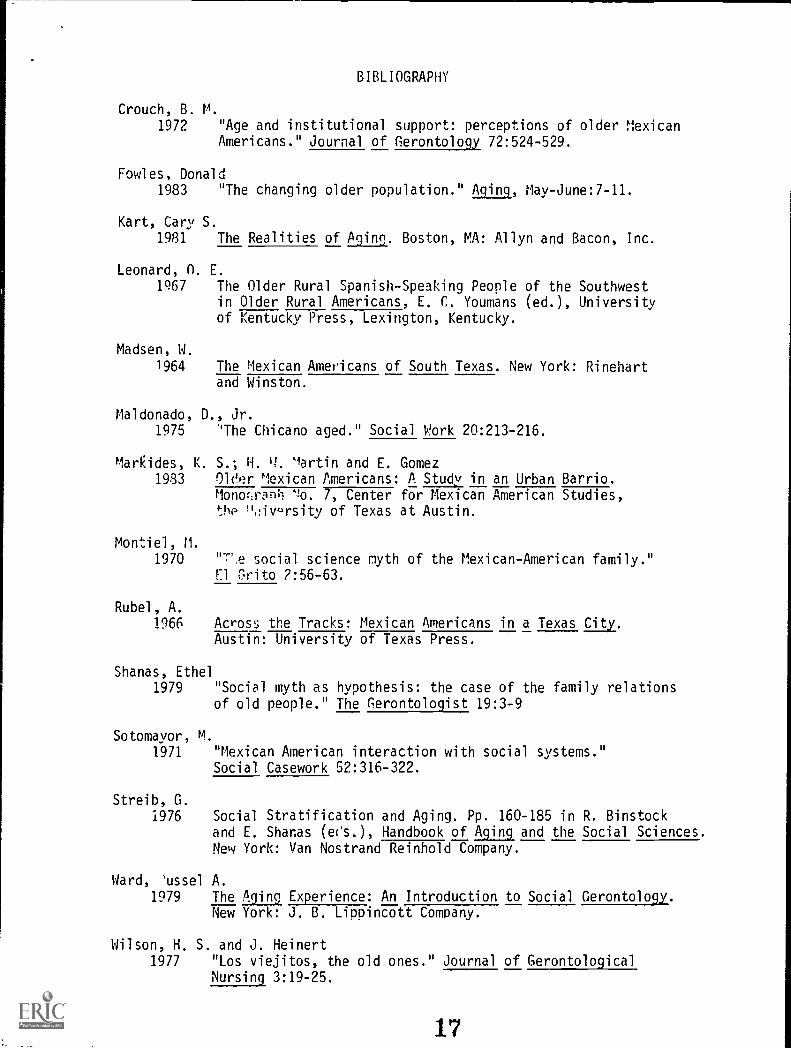
BIBLIOGRAPHY
Crouch, B. M.
1972 "Age and institutional support: perceptions of older MexicanAmericans." Journal of Gerontology 72:524-529.
Fowles, Donald1983 The changing
Kart, Cary S.1981
Leonard, O.1967
Madsen, W.
1964
older population." Aging, May-June:7-11.
The Realities of Aging. Boston, MA: Allyn and Bacon, Inc.
E.
The Older Rural Spanish-Speaking People of the Southwestin Older Rural Americans, E. C. Youmans (ed.), Universityof Kentucky Press, Lexington, Kentucky.
The Mexican Americans of South Texas. New York: Rinehartand Winston.
Maldonado, D., Jr.1975 The Chicano aged." Social Work 20:213-216.
1arkides, K. S.; H. H. martin and E. Gomez1983 Older Mexican Americans: A Study in an Urban Barrio.
Monorxa01 ,!(). 7, Center for Mexican American Studies,the "jvarsity of Texas at Austin.
Montiel, M.
1970 "Me social science myth of the Mexican-American family."El Grito 7:56-63.
Rubel, A.
1966 Across the Tracks: Mexican Americans in a Texas City.Austin: University of Texas Press.
Shanas, Ethel
1979 "Social myth as hypothesis: the case of the family relationsof old people." The Gerontologist 19:3-9
Sotomayor, M.
1971 "Mexican American interaction with social systems."Social Casework 52:316-322.
Streib, G.1976 Social Stratification and Aging. Pp. 160-185 in R. Binstock
and E. Shanas (en's.), Handbook of Aging and the Social Sciences.New York: Van Nostrand Reinhold Company.
Ward, '1ussel A.
1979 The Aging Experience: An Introduction to Social Gerontology.New York: J. B. Lippincott Company.
Wilson, H. S. and J. Heinert1977 "Los viejitos, the old ones." Journal of Gerontological
Nursing 3:19-25.

Table 1. Respondents' Age Categorization by Rural-Urban Residence and Ethnicity
AGE CATEGORIESHISPANIC NON-HISPANIC
URBAN
No. Pct.
RURALNo. Pct.
URBAN
No. Pct.
RURALNo. Pct.
Young Old 139 29.4 54 31.0 33 27.3 8 23.5(60-65)
Middle Old 203 43.0 84 48.3 46 38.0 19 55.9!66-75)
Old Old 130 27.5 36 20.7 42 34.7 7 20.6(76+)
N= 472 100% 174 100% 121 100% 34 100%
Table 2. Respondents' Age Characteristics by Rural-Urban Residence and Ethnicity
HISPANIC NON-HISPANICAGE RANGE URBAN RURAL URBAN RURAL
Low 60.0 60.0 60.0 62.0
High 97.0 91.0 ?1.0 86.0
Mean 71.0 69.9 71.9 70.5
Median 70.4 69.1 70.9 70.0
N = 472 174 121 34
18

Table 3. Respondents' Sex by Rural-Urban Residence and Ethnicity
SEX
HISPANIC NON-HISPANICURBAN RURAL URBAN RURAL
No. Pct. No. Pct. No. Pct. No. Pct.
MALE 184 39.0 75 43.1 50 41.3 10 29.4
FEMALE 288 61.0 99 56.9 71 58.7 24 70.6
N= 472 100% 174 100% 121 100% 34 100%
Table 4. Respondents' Marital Status by Rural-Urban Residence and Ethnicity
MARITAL STATUS
HISPANIC NON-HISPANICURBAN
No. Pct.
RURALNo. Pct.
URBAN
No. Pct.
RURALNo. Pct.
Married 221 47.5 87 50.9 58 47.9 16 48.5
Widowed 189 40.6 68 39.8 54 44.6 12 36.4
Divorced 16 3.4 4 2.3 8 6.6 0 0
Separated 8 1.7 4 2.3 0 0 0 0
Never Married 31 6.7 8 4.7 1 .8 5 15.2
N = 465 100% 171 100% 121 100% 33 100%
No data 7 3 0 1
19

Table 5. Respondents' Education by Rural-Urban Residence and Ethnicity
EDUCATION ATTAINEDHISPANIC NON-HISPANIC
URBANNo. Pct.
RURAL
No. Pct.
URBANNo. Pct.
RURAL
No. Pct.
Less than 340 91.9 114 93.4 36 31.0 12 37.5High School
High School or 21 5.7 7 5.7 59 50.9 14 43.8Technical School
College Graduate 9 2.4 1 .8 21 18.1 6 18.8
N = 370 100% 122 100Z 116 100% 32 100%
No data 102 52 5 2
Table 6. Respondents' Present Income by Rural-Urban Residence and Ethnicity
INCOME CATEGORIESHISPANIC NON-HISPANIC
URBANNo. Pct.
RURAL
No. Pct.
URBANNo. Pct.
RURAL
No. Pct.
Low 335 73.8 134 77.9 24 22.0 11 32.4
Middle 98 21.6 34 19.8 45 41.3 12 35.3
High 21 4.6 4 2.3 40 36.7 11 32.4
N = 454 100'; 172 100°' 109 100% 34 100%
No data 18 2 12 0
20

Table 7. Elderly's Source of Income by Rural-Urban Residence and Ethnicii:y
SOURCE
HISPANIC NON-HISPANIC
URBAN RURAL URBAN RURAL
(N=461) (N=169) (N=119) (N= 341
Social Security 355 115 100 31
SSI 214 68 9 8
Salary 36 14 14 3
Retirement Pension 40 10 37 15
VA Pension 27 7 10 2
AFDC 3 4 1 0
Disability 14 5 6 3
Unemployment 5 2 0 1
Family Support 34 27 9 1
Food Stamps 148 63 11 4
Private source 13 12 27 6
Other, unspecified 6 1 8 2
No data 11 5 2 0
Table 8. Quality of Life Compared to Five Years Earlier by Rural-Urban Residence
and Ethnicity
HISPANIC NON-HISPANIC
QUALITY of LIFE URBAN RURAL URBAN RURAL
No. Pct. No. Pct. No. Pct. No. Pct.
Much Worse 52 11.2 19 10.8 2 1.7 1 2.9
Worse 142 30.7 66 37.9 21 17.4 10 29.4
About the Same 177 38.2 39 22.4 70 57.9 11 32.4
Better 78 16.8 49 28.2 24 19.8 12 35,3
Much Better 14 3.0 1 .6 4 3.3 0 0
N= 463 100% 174 100% 121 100% 34 100%
No data 9 0 0 0
9.1

Table 9. Respondents' Occupational Status by Rural-Urban Residence and Ethnicity
OCCUPATIONAL STATUSHISPANIC NON-HISPANIC
URBANNo. Pct.
RURALNo. Pct.
URBANNo. Pct.
RURALNo. Pct.
White Collar 62 13.2 26 15.3 56 47.1 17 51.5
Blue Collar 211 44.9 59 34.7 34 28.6 7 21.2
Housewife 197 41.9 85 50.0 29 24.4 9 27.3
N = 470 100'1 170 100% 119 100% 33 100%
No data 2 4 2 1
Table 10. Respondents' Present Employment Status by Rural-Urban Residence andEthnicity
EMPLOYMENT STATUSHISPANIC NON-HISPANIC
URBANNo. Pct.
RURALNo. Pct.
URBANNo. Pct.
RURALNo. Pct.
Employed 50 10.7 23 13.2 19 15.8 4 12.1
Not Employed 418 89.3 151 86.8 101 84.2 29 87.9
N = 468 100r 174 100% 120 100% 33 100%
No data 4 0 1 1
22
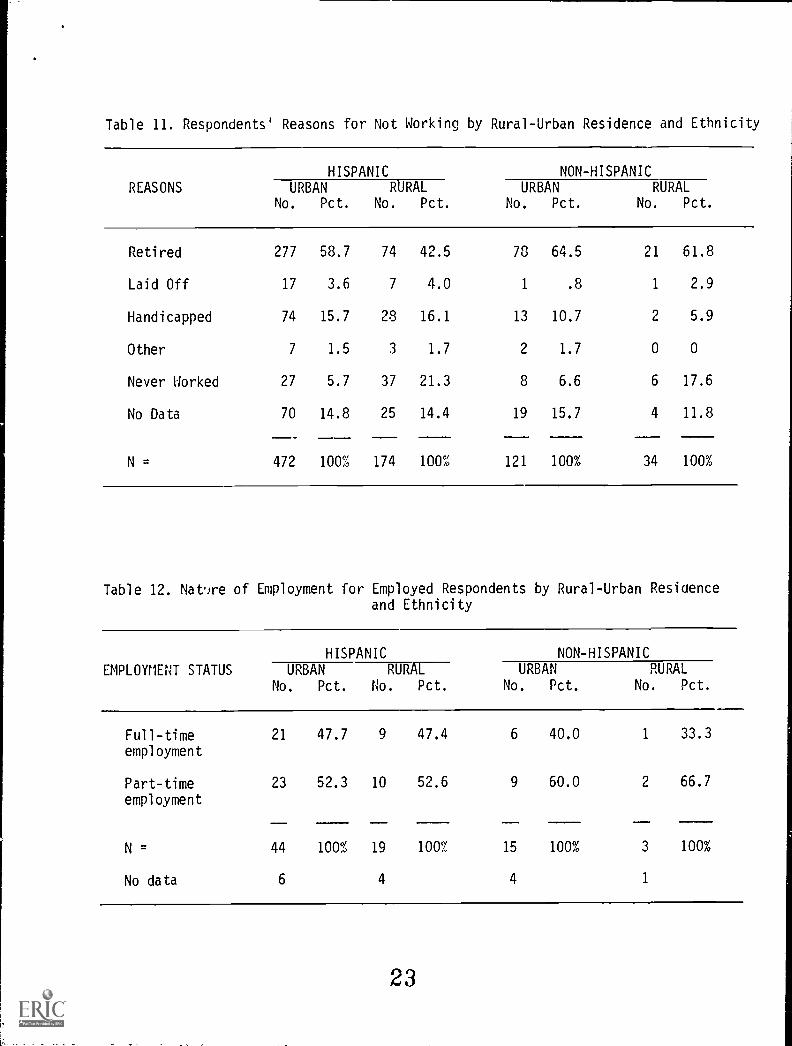
Table 11. Respondents' Reasons for Not Working by Rural-Urban Residence and Ethnicity
REASONSHISPANIC NON-HISPANIC
URBANNo. Pct.
RURALNo. Pct.
URBANNo. Pct.
RURALNo. Pct.
Retired 277 58.7 74 42.5 78 64.5 21 61.8
Laid Off 17 3.6 7 4.0 1 .8 1 2.9
Handicapped 74 15.7 28 16.1 13 10.7 2 5.9
Other 7 1.5 3 1.7 2 1.7 0 0
Never Worked 27 5.7 37 21.3 8 6.6 6 17.6
No Data 70 14.8 25 14.4 19 15.7 4 11.8
N = 472 100% 174 100% 121 100% 34 100%
Table 12. Nat.Jre of Employment for Employed Respondents by Rural-Urban Residenceand Ethnicity
EMPLOYMENT STATUS
HISPANIC NON-HISPANICURBAN
No. Pct.
RURAL
No. Pct.
URBANNo. Pct. No.
RURAL
Pct.
Full-timeemployment
21 47.7 9 47.4 6 40.0 1 33.3
Part-timeemployment
23 52.3 10 52.6 9 60.0 2 66.7
N = 44 100% 19 100% 15 100% 3 100%
No data 6 4 4 1
23

Table 13. Type of Residential Accomodation by Rural-Urban Residence and Ethnicity
RESIDENTIALACCOMODATION
HISPANIC NON-HISPANICURBAN
No. Pct.
RURAL
No. Pct.
URBANNo. Pct.
RURAL
No. Pct.
Live alone 136 28.8 47 27.0 52 43.0 14 41.2
Live w/ spouse 139 29.4 57 32.8 52 43.0 17 50.0
Live w/ spouseand children
75 15.9 31 17.8 7 5.8 0 0
Live w/ children 80 16.9 28 16.1 4 3.3 1 2.9
Live w/ other kin 36 7.6 9 5.2 5 4.1 0 0
Live w/ unrelatedindividual(s)
6 1.3 2 1.1 1 .8 2 5.9
N = 472 100% 174 100% 121 100% 34 100%
Table 14. Residence Location of Elderly's Relatives' by Rural-Urban Residenceand Ethnicity
LOCATIONHISPANIC NON-HISPANIC
URBAN(N=432)
RURAL(m=160)
URBAN(N=106)
RURAL(N= 30)
Same House 359 115 22 4
Valley Region 1,219 522 123 47
State 253 87 94 22
Out-of-State 317 112 131 33
No data ( 40) ( 14) ( 15) ( 4)
1 Tabular presentation is limited to those respondents (N= 728) answeringaffirmatively to a question on living relatives. Spouses are not includedin the above data.
24

Table 15. Relatives' Frequency of Visits to Elderlyl by Rural-Urban Residenceand Ethnicity
FREQUENCYHISPANIC NON-HISPANIC
URBAN(N=432)
RURAL(N=160)
URBAN(N=106)
RURAL(N= 30)
Daily 715 227 36 26
Weekly 591 199 58 13
Every other week 135 79 21 9
Monthly 174 119 64 7
Twice a year 172 91 72 10
Once a year 263 85 78 25
Other 95 27 42 14
No data ( 40) ( 14) ( 15) ( 4)
1 Tabular presentation is based only on those respondents (N= 728) answeringaffirmatively to a question on living relatives. Spouses are not includedamong relatives in the above data.
Table 16. Relatives' Assistance to Elderly1by Rural-Urban Residence and Ethnicity
TYPE OF ASSISTANCEHISPANIC NON-NISPANIC
URBAN(N=432)
RURAL(N=160)
URBAN(N=106)
RURAL(N= 30)
Monetary 100 52 18 14
Services 1,085 405 108 22
Both Monetaryand Services
50 6 2 0
No Assistance 913 373 242 70
No data ( 40) ( 14) ( 15) ( 4)
1 Tabular presentation is based only on those respondents (N= 728) answeringaffirmatively to a question on living relatives. Spouses are not includedamong relatives in the above data.
25
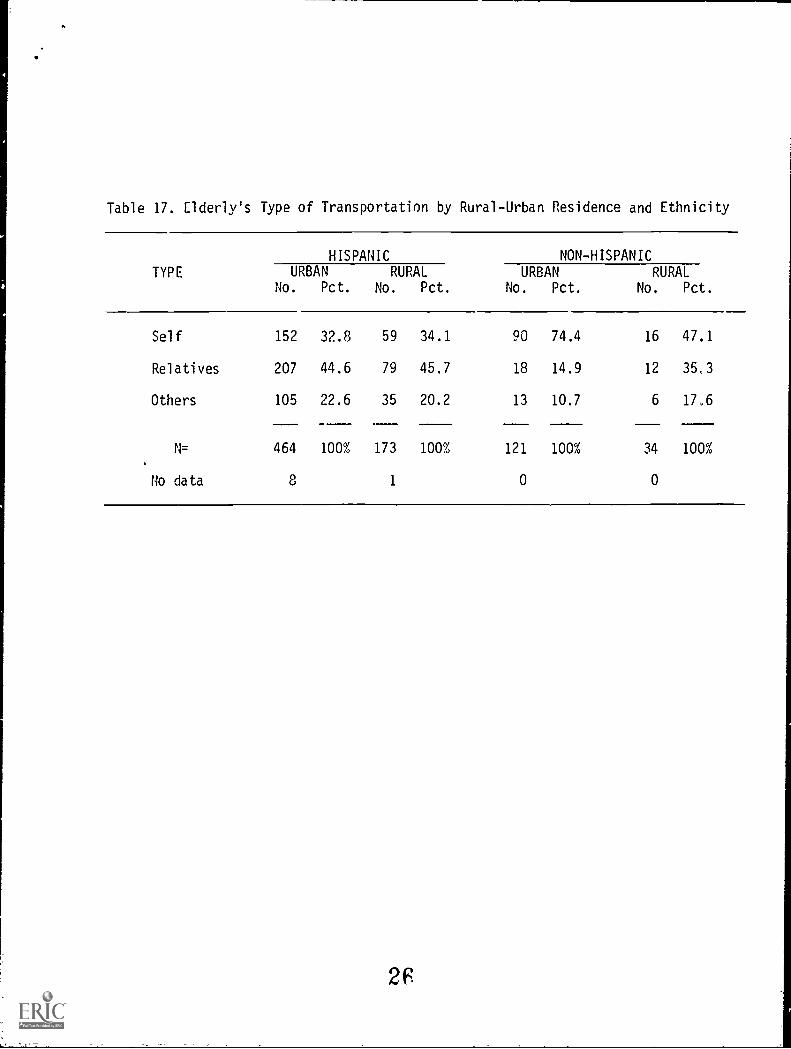
Table 17. Elderly's Type of Transportation by Rural-Urban Residence and Ethnicity
TYPE
HISPANIC NON-HISPANICURBAN
No. Pct.
RURALNo. Pct.
URBANNo. Pct.
RURALNo. Pct.
Self 152 32.8 59 34.1 90 74.4 16 47.1
Relatives 207 44.6 79 45.7 18 14.9 12 35,3
Others 105 22.6 35 20.2 13 10.7 6 17,6
N= 464 100% 173 100% 121 100% 34 100%
No data 8 1 0 0
2F

Table 18. Relatives' Assistance to Homebound Elderly by Rural-Urban Residence and Ethnicity
TYPE of ASSISTANCEREASONS for HOMEBOUND MONEY SERVICES BOTH NONE TOTAL
No. Pct. No. Pct. No. Pct. No. Pct. N
Physical Condition
Urban Residence
Hispanic
Non-Hispanic
Rural Residence
Hispanic
Non - Hispanic
Bed-Ridden
Urban Residence
Hispanic
Non-Hispanic
Rural Residence
Hispanic
Non-Hispanic
9 90.0 63 91.3 9 100 19 79.2 100
1 10.0 6 8.7 0 0 5 20.8 12
4 80.0 18 100 1 100 39 78.0 62
1 20.0 0 0 0 0 11 22.0 12
2 100 22 91.7 4 100 2 66.7 30
0 0 2 8.3 0 0 1 33.3 3
2 100 6 100 0 0 3 50.0 11
0 0 0 0 0 0 3 50.0 3
2 7