document resume ed 130 049 ce 008 272 mai-dalton, … · document resume ed 130 049 ce 008 272 ......
TRANSCRIPT
DOCUMENT RESUME
ED 130 049 CE 008 272
AUTHOR Mai-Dalton, RenateTITLE The Influence of Training and Position Power on
Leader Behavior. Organizational Research. TechnicalReport 75-72.
INSTITUTION Washington Univ., Seattle. Dept. of Psychology.SPONS AGENCY Advanced Research Projects Agency (DOD), Washington,
D.C.; Department of the Army, Washington, D.C.;Office of Naval Research, Washington, D.C.Organizational Effectiveness Research Program.
PUB DATE Nov 75CONTRACT DAHC-19-73-6-0005; N00014-67-A-0103-0012;
NR-170-761NOTE 44p.
EDRS PRICE MF-$0.83 EC-$2.06 Plus Postage.DESCRIPTORS Acaderlic Achievement; Behavioral Science Research;
Behavior Change; Behavior Patterns; *ContingencyManagement; Environment; *Individual Power;laboratory Experiments; *Ltadership Styles;*leadership Training; Management; Modtls;*Motivation; Performance; Psychological Patterns;Social Behavior; Training
IDENTIFIERS Contingency Model of Leadership Effectiveness;Fiedler (F E)
ABSTRACTUsing Fiedler's Contingency Model of Leadership
Effectiveness, which postulates that the behavior of a leader dependson the interaction between leadership style and the degree to whichthe environment gives the leader control and influence, a studyinvestigAed the effects of training and changes in position power onthe behavior of three types of leaders with different motivationalsystems. The leader style of female college students was measured bymeans of the Least Preferred Coworker (LPC) Scale, which identifiesrelationship-motivatedr task-motivated, and independence-orientedleaders. To test if subject behaviors vary with the favorableness ofthe situation and the person's I.PC score, an In-basket simulation wasconstructed. A 2 x 2 x 3 factorial design manipulated high and lowposition power (2) and training (2), and used subjects With high,middle, and low LPC scores (3). Dependent measures were sevenbehavior categories based on the subjects' displayed behaviors,scores on an uncertainty scale, and scores on the Wonderlic PersonnelTest of educational achievement. Statistical analyses were performedto test three hypotheses. Conclusions from the findings includethese: (1) Directing and pleading are situationally determinedbehaviors while searching for information as uell as threatening andcriticizing are the result of interaction between the situation andthe personality of the subject, and (2) a relatively short andnon-intense training program resulted in a search for informationunder different conditions. Data analysis and suggestions for furtherresearch are included in the report. A 20-ftem bibliography and fourevaluation scales are appended: Manipulation check questions, groupatmosphere scale; LPC scale, and uncertainty scale. (JT)
Documents acquired by ERIC include many informal unpublished materials ncit available from other sources. ERIC makes every
effort to obtain the best copy available. Nevertheless, items of marginal reproducibility are often encountered and this affects the
quality of the microfiche and hardcopy reproductions ERIC makes available via the ERIC Document Reproduction Service (EDRS).
EDRS is not responsible for the quality of the original document. Reproductions supplied by EDRS are the best that can be made from
the original.

CINORGANIZATIONAL RESEARCH
C.)c: DEPARTMENT OF PSYCHOLOGY
prUNIVERSITY OF WASHINGTON
r-4
C=2 SEATTLE, WASHINGTON
THE INFLUENCE OF TRAINING
AND POSITION POWER
ON LEADER BEHAVIOR
Renate Mai-Dalton
University of WashingtonSeattle, Washington
Technical Report 75-72
November 1975
.S, DEPARTMENTOF HEALTH,
EDUCAVON&WELFAREU
NAVONALtNSTrf UTE OF
EDUCAVON
II. NS
EO FROMDOCUMENT
HAS BEENREPRO
OUCEOE&ACTLY
AS RECEN
THEPERSON OR
ORGANIZAVON01:0GtN
ATING VC,POMIS OF
\NEW OR OPINtONS
ST ATEODO NOT NECESSARtLY
REPREI
SENT OFFICIALNATIONAL
INSIITUTEOF '
EOUCATtONPOSMON
OR POLICY
Contract N00014-67-A-0103 NR 170-761
Organizational Effectiveness Research Programs
Office of Naval Research
REPRODUCTION IN WHOLE OR IN PART IS PERMITTED FOR
ANY PURPOSE OF THE UNITED STATES GOVERNMENT.
DISTRIBUTION OF THIS DOCUMENT IS UNLIMITED

Footnote
This research was supported by Contract N00014-67-A-0103-0012 with the
Office of Naval Research and the Advanced Research Projects Agency (Fred E.
Fiedler, Principal Investigator), and by the Department of the Army contract
No. DAHC 19-73-6-0005 (Fred E. Fiedler, Principal Investigator).
The author wishes to thank Fred E. Fiedler and John P. Keating for their
helpful suggestions during the time this study was conducted and Stephen Green
for his help in setting up the experiment. Further thanks are expressed
to Richard H. Earhart and Richard J. Stanek for the interest they have
takin in my career and the continued support and encouragement they gave
me during the early years of my studies.
3

Introduction
This study investigates the effects of training and changes in position
power on the behavior of three types of leaders with different motivational
systems.
Fiedler's Contingency Model of Leadership Effectiveness (967) postulates
that the behavior of a leader depends on the interaction.between leadership style
and the degree to which the environment gives the leader control and influence.
The leader's style is measured by means of the Least Preferred Coworker (LPC)
Scale, a 25-item bipolar adjective scale which asks an individual to rate
coworker with shom he or she had the most difficulty in working on a common task.
The ratings are summed over the 25-item scale. A relationship-motivated (high LPC)
person differentiates between relationship-oriented and task-oriented items and
describes the least preferred coworker in relatively positive terms. A task-
motivated (low LPC) person describes the poor coworker in very negative, rejecting
terms, indicating that he neither likes him on a personal basis nor could he work
with him effectively.
The favorableness of a situation is measured on the basis of leader-member
relations, the structure of the task that must be performed, and the leader's
position power. Each of these variables is usually dichotomized at the median
into high and low groups. These are then combined to form a situation favorableness
dimension, as illustrated in Figure 1.
Insert Figure 1 about here
The relatively objective assessment of these three enVironmental:variables,_ _
Which allow us to arrive at a measure of situational favorableneS's-fothe leader,
Is unique to Fiedler's model. Social scientists haVe long:tearchedj0 an aCcurate
yrepresentation of the environment in experimentalAesigns- (BrunsWicIG 1953), and:
.4

Figure 1
Situational Favorableness Dimension
----------
Leader-member
relations
Good
Good
Good
Good
Poor
Poor
Poor
Unstructured
Poor
,.Tast structure
Structured
Unstructured
Structured
Leader
Position power
Strong
,Weak
Strong
Weak
Strong
Weak
Strong
Weak
Octant
II
III
IV
VVI
VII
VIII
Situation
described as
_Very favorable
Moderately favorable
Very unfavorable
Mai-Dalton 2
the Contingency Model appears to have captured three highly relevant variables for
assessing the leadership situation, as far as can be judged from empirical results of
this theory.
While variations in leader-member relations have been shown to have great impact
on an individual's behavior (Michaelsen, 1973), the influence of task structure and
position power has not been evaluated sufficiently in an experimental setting. The
present study compares the effects of high and low position power and the effects of
training on the behavior of relationship-, and task-motivated.individuals in a labor-
atory experiment. Training was chosen as an independent variable because studies by '
Csoka and Fiedler.(1972), Fiedler.(1972b), and Chemers, Rice, Sundstrom, and Butler
(1974) have-shown that tdsk-training can be conceptualized as improving task-struc-
ture and, therefore, conditions with and without training should bring about similar
behavior changes as conditions with high and low task-structure. In addition, the
manipulation of training made it possible to investigate what behaViors were influ-
enced by the administratton of training -- a vital issue in management research, whir:.
attempts to assess the effects of task-training on.employee behavior and performance.
Earlier laboratory studies have shown that high LPC. individuals generally emit
humanrelations oriented behaviors in relatively unfavorable situations and task-
oriented behaviors in.favorabTe situations. Low LPC individuals, on the other hand,
stress human relations in favOrable situations but tas.14,oriented'behaViors in unfav-
orable situations (Fiedler, 1972a; dreen, Nebeker, and Boni, 1973; Larson and Rowland
1973). A possible explanation for these results is provided when ale examines the
primary motives of high and low LPC scorers. While a low.LPC score is interpreted as
reflecting a motivation to accomplish the task, a high LPC score seems indicative of
a motive to relate to people. We assume that individuals fall'backlin their primary,
more "primitive" behaviors in unfavorable, anxiety arousing situatiOhs. This would
explain why in an unfavorable situation low LPC subjects behaVe in a mariner that
accomplishes the task and high LPC'Subjects concentrate.on improving relations with
others (Fiedler, 1971).

3 Mai-Dalton
Aside from these two behavior.dimensions, which are conceptually Very
similar to the Initiation of Structure and Considerathn behaviors of the Ohio
State Leadership Studies (Stogdill and Coons, 1957), situation-specific behaviors
have not been examined in laboratory experiments. The present study was designed
to let the data suggest the behavior categories to.be conSidered rather than
having defined them a'priori.
We hypothesize that if the leader7member relationsas measured by the
Group Atmosphere Scale (Appendix, p.II), are poor and all 'conditions fall into the
lower half of the situational favorableness continuum (octants 5 to 8), low LPC
subjects.will engage in More task-oriented.behaviors:than.'high LPC subjects, while
high LPC subjects will strive to improve human relations tua greater extent than
low LPC subjects.
For exploratoll purposes, this study included subjects that scored in the
middle range of the LPC scale. They are .labelled independence-oriented leaders.
Earlier research(Bass, Fiedler, and Krueger, )964) suggested that these individual
behave differently from.high. and low LPC leaders. They appear to be more indepen-
dent by neither requiring pleasant interpersonal relations nor Striving consistentl
to accomplish their task. They are also seen as less pubitiVe'and more open to
suggestions and moreJlexible in their.judgment and opinions.
Another aspect of thiS study concerns the relationship between perceived
uncertainty.and situationaljavorableness. Uncertaintphas been used as an
environmental variable by Lawrence and Lorsch (1969) in an attempt to match an
organization's external environment with its internal state's dnd processes in
order to maximize performance. Nebeker (1975).showed that'Fiedler's situational
favorableness dimension and Lawrence and Lorsch's environmental'uncertainty
dimension are closely related. Subjects should therefore, perceive favorable
situations as.more certain than unfavorable situat,ions. F we also assume that
some behaviors result from an interact4on between situatio6s and personality,
7
Mai-Dalton 4
we would expect differences in how individuals with different LPC scares
cope with uncertainty.
The second hypothesis of this study predicts a perceptual difference
between high.and low LPC subjects. Low scorers. on the LPC scale might
perceive unfavorable situations as more certain than high LPC subjects
because low LPC scorers should focus more on the execution of the task,
and this behavior of "doing something about the problem" should give them
a feeling of certainty. In contrast, high LPC scorers should be more certain
in favorable conditions, for it is then that they emit task-oriented behaviors.
The final hypothesis of this study concerns-mental ability, as measured
by the Wonderlic Personnel Test, and its connections with particular behaviors.
We hypothesize that individuals with higher soores on .the test should have a
better understanding of the experimental task and will engage in more behaviors
that help to further the execution of the task.
Method
In order to test itsubject behaviors 'vary with the favorableness of the
situation and a person's LPC score, the task had to consist of an activity that
the subjects,could relate to and that elicited some actual behavior. For this
reason, an In-Basket test was constructed. It simulates an administrator's.
paper work and consists of letters,'notes, and memos an executive might.
receive and to which he must respond in written form 1Frederiksen.ei al, 1972 ,
A 2 X 2 X 3 factorial design manipulated high and low position power (2),
and training (2), and used subjects with high, middle, and low LPC scores (3).
This resulted in an experiment with 12 cells and 122 subjects, as illustrated
below:

5 Mai -Dal ton
_...... .... ..
i Low LPC Middle LPC High LPC t
4igh5
. Low High Low High Low1Pos.Power Pos.PowerPos.Power Pos.Power Pos.Power Pos.Power ',
i
No ! No No i NoTrng Trng_ Trngl Trng Trng: Trng! Trngi Trng
!
1
N=8 N=9 , N=9 : N=8 N=12;: 14=101 N=10 N=ll
!No ! NoTrngliTrng! Trng Trng
N=9 , N=11 14=13 , N=12
Each of the cells contained a minimum of eight and a maximum of thirteen female
subjects who had been-recruited from introductory psychology classes and completed
an LPC scale beforehand. They were then randomly assigned to one of the fotir
experimental conditions.
In the high position power conditions the subject imagined herself to be
Kim Stratford, a successful graduate student in psychology., who conducts an experimenl
assisted by four High School students, who are eager to get into the university. In
order to evaluate their potential, they are assigned to help her. After Kim Stratton
has completed the experiment, she will evaluate the students' performance and make
a report to her professor, recommending or discouraging each student's nceptance
to the university.
In the low position power conditions, Kim Stratford is an introductory psycholog
student who had just failed her mid-term. In order to pass the course, she is given
the additional assignment of conducting an experiment. Four equally marginal student
are supposed to assist, also to get a better grade; but since they do not care
particularly whether they pass or fail, Kim Stratford has little influence on them
and cannot count on their help. However, if they do not help her, she will not be
able to complete the experiment on time.
The subject was told that she had given her coworkers various tasks to get the:
experiment under way, however, she had to leave town for one week because of a family

Mai-Dalton 6
emerOncy. When she return ed,. she found the four :letters, one froM each student
helOer, in her In-Basket, informing her of what the students had done SO far end
what problems they had encountered. The subject, playing the.role of Kim StraMrd,
had to answer these letters in written formLand react .to them as she Would hz.:e in'the
actual situation.
the training in this study was minimal.andconsisted,of one pageof instructiOns
that clarified the approach to be used for dealing with the In-Basket problems,. e.g.,
"When you deal with a particular student's note, keep the whole sit-up in mind." In
addition, subjects in the training conditions were given.-an-example of how to work
on the In.-Basket task. The time needed to go through.the.training material did.not
exceed ten minutes. Subjects in the no training,.conditionTeceived noinstructions
in how to deal with the task.
Experimental Procedures. Twelve to twenty-fou, mibjects each session At least
one or two for each cell) participated in,eaoh experimeAtal sessions . As the students
entered the room, they identified themselves,.received an identification miter for
the experiment and, depending on their LPC scores were, assigned to one of the
conditions and handed their work packet.,.
After the experimenter introduced herself.and explained .the.purpose of.the
study, the subjects opened their paper stacks and completed the 12-minute Wonderlic
Personnel Test. 'After a short rest period, each subject read.the followingpages of
the packet and proceeded with the In-Basket:test. Eadh person was given as much
time as she required. The average. time for each session. was fifty minutes.
When the task was completed, all subjects.answered the.manipUlation -check. ,
questions, a group atmosphere scale, an LPC scale, and an uncertainty.scale.(see
Appendix, pp, I-IV).
Dependent Measures. The primary dependent :measures were based on.the.subject's
written responses in the different exPerimental conditioni'and consisted of the
10

7 Mai-Dalton
displayed behaviors. In order to generate the most relevant categories, a random
sample of all the answers to the In-Basket items was selected. These responses
were distributed, without identification as to the type of subjects or conditions
from which they came, to several professors and graduate students who classified
the behaviors. The categories consistently named by all raters were included as
dependent measures. Seven beior categories evolved. The first five.are similar
to behavior categories used f..)t- an In-Basket test for school administrations by
Hemphill et al. (1972) and for an In-Baskei test of organizational climates in the
California "Department of Commerce" by Frederiksen et al. .(1972). The definitions
for these five categories in the In-Basket Scoring Manual (Carlton and Brault, 1971;
were adapted for this experiment. The last two categories-seem to be specific to
this particular study and have not been used in the above mentioned In-Baskets.
In contrast to the Carlton and Brault scoring.procedures, who- rated each category
as either absent or present, this study differentiated between'five levels of
intensity fOr each behavior on a scale from 1 to 5. These differentiations are
described in the Appendix en pages V-VII. All behavior categories werP independent
ly rated by three judges. The rater-reliability was r=.95 (SpearMan-Brown formula,
adjusted for three raters). The following categories were represented in this
study:
1.Conceptual AnalysiSDefinition: The S's recognition of implications of the problem and/or actionand/or solution. The S makes it clear that she has seen more than theimmediate implications of the problem(s) presented by the item.Example: "Lee and Pat-have their questions Prepared and are testing them.Everything is going along as planned. See if you could possibly get a roombefore finals week, right after the committee meeting.'
2.CoUrtesy to CoworkersDefinition: Any expressiqn or act of courtesy directed by the S to coworkers.The courtesy may be formal, such as "please" and "thank you," or it may bemore expansive, surh as an offer to help, encouragement, appreciation, orcommendation..Exampfe: "Thanks for your helI aM planning a meeting of all my.helpers,so we can talk about any.problems you may have.. You have been of greathelp so far."

Mai-Dalton 8
3.Asks for Information, Opinion, or Advice from CoworkersDefinition: Any communication, actual or planned, in which the S asks fortask relevant information, opinion, or advice that will be utilized for completing'the task.Example: "How long did it take your subjects to solve the math questions?"
4.Gives Directionsto CoworkersDefinition: Any response in which the S plans to, or actually gives, directions.to coworkers.Example: "Be sure yov give me the problems soon, and test them out on somesubjects before you leave."
5:Sets up Checks oft.Coworkers. .
Definition: The S explicitly checks or plans to check_on the work she assigns-:or has.assigned tothe coworker,,' -
Example: "Let us meet on Wednesday at 4:30 in my office, so you can tell meh9w far You .have:come wtth yourLanguage Artsproblems2
6.Threatens Retaliation for NonrCompliance _ : .
Definition: Any response in which the S reminds the coworker of her responsi-_bilities and threatens mith. punishment-in .ease0f- non....compTiance. -Severecriticism is also scored here.Example:' " I hope you have cinsidered, the:consequence of leaving this experi-ment at this stage. My evaluation of your behavior will greatly influence
. your possibilities"for entry. into -the psychology program. If 'you do not
change your mind, I shall be forced to write an unfavorable letter to yourprofessor. .
7.Pleads for cooperation . .
Definition: Any response in which the S pleads with the coworkers for cooper-ation and attempts to coax and cajole he:. into, helping with the task.Example: "Yeah, I know it is difficult to secure stibjects, bilt we've got toget.itdone. We have come so far, I'll work with you. If we can get somemore people, it would be a lot more accurate."
The second dependent measure is an uncertainty scale (Appendix, p. III). It
consisted of a six-item questionnaire that was modeled after a short scale by
Sathe.(1974). The scale asks questions about three aspects of uncertainty: (1) N
knowing how to respond, (2) lack of information, and (3) not knowing the outcome:
These components are similar to those described by Lawrence and Lorsch (1969) and
Duncan (1972).
The third and.final dependent measure is the Wonderlic Personnel Test. It
.%
:measures educational achievementand is frequeqtly used brindustrY for' persOnna
selection purposes. Although the test is not considered to be an adequateprediCtol-. .
of success on a particular job (Droege ano: Foley,, 1972), itdoescorrelate highly-
:. .
with-years of education. -for research purposes', it is a convenient instrument:.
1 2

9 Mai-Dalton
that adequately measures levels of achievement, of college-age students.
Results
Manipulation Checks
The manipulations, were verified with thre,' Eipoint scales regarding position
power and two scales.regarding improved task-structUre after training (see Appendix,
p. I, questions 2 to 6). Table 1 shows the means,.standard deviations, and t-value,.,
for the .manipulation checks. Overall, the differences'betweemthe means were
significant in the expected direction; however, when the manipulations were analyze(
.for the three LPC groups separately, it was found that low LPC.subjects did not
differentiate as clearly between the training conditions as:did middle LPC subjects,
however, the'difference between the means for the training and mo training conditiof.
were still marginally significant (t=1.63, df.32, p..11). and:all low LPC subjects
remained in the, data analyses.
Insert Table 1 aboUt here
Group Atmosphere Scores
The obtained man group atmosphere score was 57.4. This value places well
below the mean of 67.0 for normative group atmosphere scores in laboratory exper-
iments (Posthuma, 1970), and the group atmosphere for all conditions was termed.
"poor". Thus, all concrftions of this study fell into the lower half of the situati
al favorableness continuum, where the situations are described as "moderately
favorable" and "unfavorable" (octants 5 to 8, see Figure 1).
Uncertainty Scale
A factor analysis of the uncertainty scale produced one factor. Since all
questions on the scale concern aspects of Uncertainty, it can be assumed that the
produced factor, indeed, measures uncertainty. A 2.X 2 X 3'analysis of variance
showed a marginal main effect.for the positioh power manipulation (F = 3.704,
13

Table 1
Manipulation Checks
High LowPosition Power Position Power
= 16.4
sd = 3.9
N = 59
t = 3.50 df = 120 p = .001
Training
7= 13.9
sd = 4.0
N = 63
No Training
= 10.5
sd = 2.9
N = 61
t = 3.54 df = 120 p = .001
1 4
7= 8.5
sd = 3.3
N = 61

Mai-Dalton 10
p=,057), indicating less uncertainty in the high than in the low position power
cells.
In two different studies, Nebeker (1975) has shown that situational favorablenc
and uncertainty are related dimensions. To assess if these results could be
replicated in this experiment, the scores on the uncertainty scale were correlated
with scores on Fiedler's three situational variables. The results are all signifi-
cant (a high score indicates uncertainty).
Uncertainty and group atmosphere r = -.32, p = .0001
Uncertainty and task structure r = -.35, p = .0001
Uncertainty and position power r = -.41, p = .0001.
The multiple regression of R = .54 is almost identical to the R = .58 reported by
Nebeker for one of his studies. Consequently, the results of this experiment
support Nebeker's assertion that situational favorableness is related to uncertaint
Figure 2 shows that high LPC subjects felt more certain in the moderately
favorable situation and uncertain in the unfavorable ccndition. The trend is revem
for low LPC subjects, but is not as pronounced. However, the differences for high
and low LPC leaders in perceiving uncertainty are not statistically significant,
and we must conclude that hypothesis two, which predicted a perceptual difference
between high and low LPC leaders, was not supported.
Insert Figure 2 about here
In order to investigate if leaders with different underlying motivations
displayed different behaviors in coping with uncertainty, the uncertainty scores
were correlated with the behavior ratihgs. Table 2 shows the results. (Means and
standard deviations for uncertainty and the different behaviors are presented in
Table 3.) In general, low LPC subjects seemed to be uncertain when they did not
clearly understand the overall task (Uncertainty - Conceptual Analysis r
1 5

Figure 2
Means of Uncertainty Scale
certain22
23a00
24
.25
26
27
28
29
30
31
32
*hi LPC
mid LPC
- ---0 low LPC
uncer-tain
octants 5 6 7 8
Training Training No Trng. No Trng..Hi Lo Hi Lo-
Pos. Pow. Pos. Pow. Pos. Pow. Pos. Pow.
16

11 Mai-Dalton
p < .01, while this was not the case for either middle or high LPC subjects (r = .01
and r = .10, respectively). While low LPC individuals efrained from asking for
information in uncertain situations (Uncertainty - Asking for Information r =
p < .10), high LPC persons tended to do so (r = .19, p < .10), perhaps as a means
of relating with co-workers. Low LPC subjects used threats and criticisms to cope
with uncerta4nty (uncertainty - Threatens Retaliation r = .41, p < ,01), while high
LPC subjects did not (r =-.26, p < .05). Middle LPC subjects did not employ any
of the particular behaviors that are represented in this study, in coping with
uncertainty.
Insert Tables 2 & 3 about here
Use of Behavior Categories
Analyses of variance for three behaviors (Conceptual Analysis, Courtesy to
Coworkers, and Sets up Checks) showed no significant differences between cells.
The effects for the remaining behaviors are shown in Table 4. As can be seen, some
of the categories were used by all subjects as a reaction to situational demands,
while other behaviors differed with LPC level and the situation. Thus, the
tendency to give directions was greatly influenced by changes in position power,
and training, While pleading for cooperation was the result of changes inVosition
power only. Asking for information and threatening, on the other hand, varied with
the personality of the subject and the situation. Figures 3 and 4 illustrate these
obtained interactions.
Insert Table 4 and Figures 3 and 4 about here
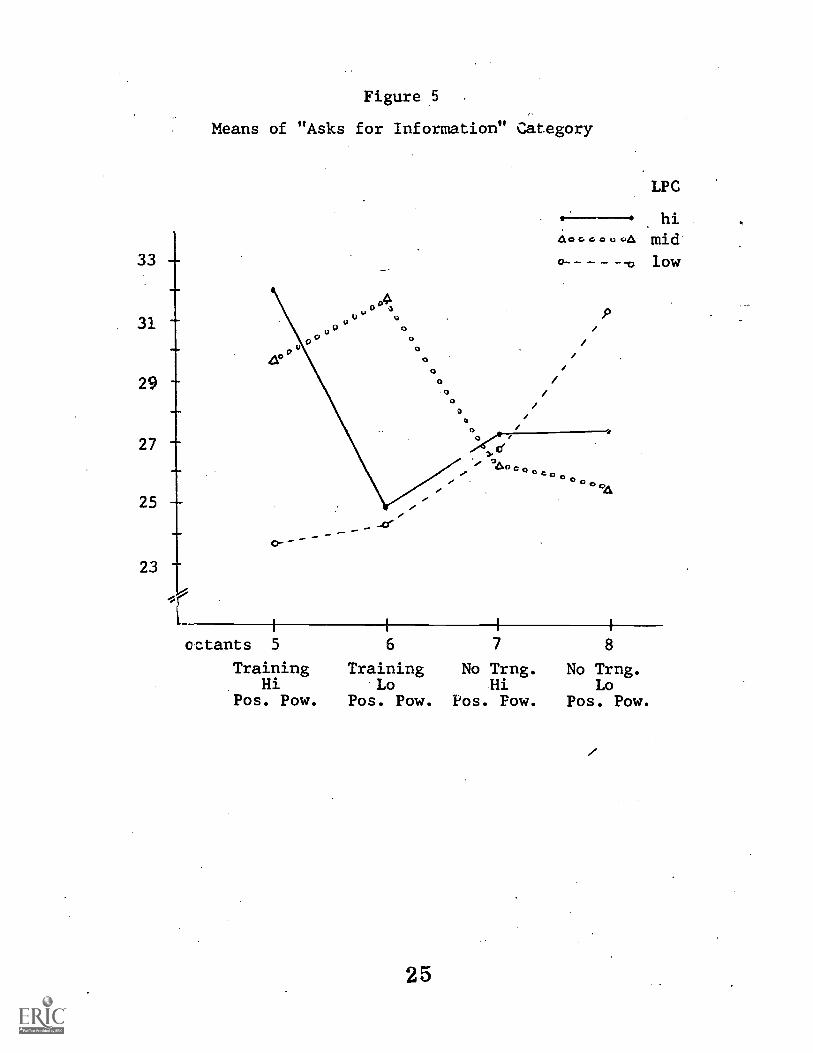
Figure 5 illustrates how these findinos relate to the Contingency Model:
Thus, relationship-motivated subjects requested most information in the more complex,
moderately favorable situation (octant 5), but less
17

Table 2
Correlations Between Uncertainty and Behaviors
Uncertainty Correlated With LPC ,
Low Middle High
N=34 N = 43 N = 45
Conceptual Analysis 43** .01 .10
Courtesy to Coworkers .26 .04 - .17
Asks for Information .25 .08 .190
Gives Directions .17 - .17 - .01
Sets up Checks - .13 - .13 - .20
Threatens Retaliation .41** - .03 - .26*
Pleads for Cooperation .05 .17 - .190
18

Table 3
Means*and Standard Deviations for all Behavior Categories
and Uncertainty Scores
Behaviors
Octant 5
Octant 6
Octant 7
Octant 8
High
LPC
Mid
Low
High
LPC
Mid
Low
High
LPC
Mid
Low
High
LPC
Mid
Low
Conceptual Analysis
331
33.8
30.4
30.3
33.3
32.6
32.5
31.6
35.0
30.7
32.3
31.0
7.2
4.4
4.1
8.1
5.6
7.6
3.9
4.9
3.4
8.3
4.9
7.4
Courtesy to Coworkers
25.4
26.7
22.5
24.8
27.4
29.2
28.5
25.2
24.4
27,7
28.8
25.8
8.9
8.1
6.7
7.6
6.1
7.4
6.8
7.7
6.3
7.3
4.5
6.7
Asking for Information
32.2
29.9
23.8
24.8
31.8
24.3
27.2
26.3
26.8
27.3
25.6
31.1
9.0
8.0
6.7
8.1
9.9
6.8
8.7
8.9
6.8
8.3
6.6
10.1
Giving Directions
48.3
47.4
49.5
44.5
44.7
44.4
40.9
43.8
48.7
37.8
41.6
44.4
7.6
7.4
6.9
8.3
8.0
6.9
8.4
8.8
7.1
12.6
9.4
9.3.
Sets up Checks
29.3
23.4
23.0
22.8
23.6
22.7
24.3
23.0
26.2
22.8
21.1
27.9
11.7
6.9
13.7
8.0
7.7
8.5
11.6
9.1
6.8
8.1
5.9
9.6
Threatens Retaliation
19.8
15.8
24.9
14.9
15.5
17.0
17.9
20.0
25.9
14.3
16.4
14.8
7.1
5.0
7.5
.4.7
5.1
4.5
5.1
6.9
11.6
3.4
5.4
5.1

b.,
4.
Table 3 (Continued)
Octant 5
Octant 6
Octant 7
Octant 8
LPC
LPC
LPC
LPC
High
Mid
Low
High
Mid
Low
High
Mid
Low
High
Mid
Low
,Pleads for Cooper-
15.3
15.3
14.8
17.2
17.7
22.0
15.6
14.1
14.2
18.2
20.5
17.6
ation
2.9
2.9
2.4
:4.7
5.3
5.6
2.6
2.4
2.3
8.6
8.3
7.2
Uncertainty Scores
24.1
22.8
26.3
27.5
30.0
26.9
27.1
27.5
24.7
30.5
25.8
25.0
6.5
8.0
4.8
8.5
4.5
7.3
6.5
4.8
9.9
7.7
5.6
5.0
*Means were obtained by summing the three rater-scores to
the four In-Basket iteths for each subject
and finding
the mean score for all subjects within the particular octant.
The means for the "Threatens Retaliation"
and
"Pleads for Cooperation" categories are relatively low because two
of the four In-Basket items werewritten in
such a way that the coworker replied positively to the request
for help.
Consequently, no threatening or
pleading was required for obtaining cooperation.

Table 4
Results of Analyses of Variance for Behaviors
N = 122
Behavior
Asks for Information
Interaction: Training X LPC 3.29 .05
.4. Gives Directions to Coworkers
Main-Effects: Position Power 4.87 .05
Training 6.13 .05
6. Threatens Retaliation
Interaction: Position Power X LPC 3.74 .05
Main-Effects: Position Power 19.08 .001
LPC 4.95 .01
7. Pleads for Cooperation
Main-Effect: Position Power 16.61 .001
21

65
60
55
50
45
Figure 3
"Asks for Information" Category
Interaction between Training and LPC
0
'0 0
0
0--- High LPCAo 0 004 Mid LPC
Low LPC
Training No Training
22

50
45
40
35
30
25
Figure 4
"Threatens Retaliation" Category
Interaction between Position Power and LPC
40000
p411PeocoollX--
High Low
Position Power
2 3
High LPCMid LPCLow LPL

Mai-Dalton 12
as the situation grew unfavoFable and stressful (octant 8). In contrast, task-
motivated subjects asked for little information in the moderately favorable situatio
but requested a relatively great amount in the unfavorable situation. Independence-
motivated subjects showed a strong reaction to trainini. They asked for information
when they had received special instructions, but requested far less whPn training
was absent.
Insert Figure 5 about here
Figure 6 illustrates how the "Threatens Retaliation" category was used differ-
entially by leaders with different LPC levels. While task-motivated subjects used .
high position power to threaten and criticize their coworkers, relationship-
motivated individuals with high positiOn power used this behavior category consider-
ably less. This suggests that task-motivated iubjects are likely to feel that the
completion of a talsk is of sufficient importance to justify threatening and criticiz
ing. Relationship-motivated subjects, on the other hind, might yefrain from using
threats and criticisms to avoid a further deterioration of their interpersonal
relationships. Independence-motivated subjects seemed to have been primarily
influenced by training, as was the case with the "Asks for Information" category.
As long as the task was relatively structured,.they threatened little; but when
they had not received training, and the task structure remained low, they threatene(
somewhat more.
Insert Figure 6 about here
General Behavior Profiles
When all behavior categories were intercorrelated, separately by LPC level,
several significant correlations were obtained, suggesting that different LPC
'2 4
33 -
31
29
27
25 -
23
Figure 5
Means of "Asks for Information" Category
0-^
o0
i1oc000p
LPC
hi
mid
0- - - - -0 1OW
....oz
'4600,o
.ei
octants 5 6 7 8
Training Training No Trng. No Trng.Hi Lo Hi Lo
Pos. Pow. Pos. Pow. Pos. Pow. Pos. Pow.
25

Figure 6
Means of "Threatens Retaliation" Category'
LPC
hi.
Aeocco. mid
0 Z. low
0 e0
0 0
OGUe eococ
octants 5 6 7 8
Training Training No.Trng. No Trng.Hi Lo Hi Lo
Pos. Pow. Pos. Pow. Pos. Pow. Pos. Pow.
26

13 Mai-Dalton
subjects displayed different behavior patterns (see Table 5).
Insert Table 5 about here
Task-motivated individuals tended to be courteous primarily when they felt
that the situation required pleading with subordinates (Pleading-Courtesy r = .55,
p < .001). In those situations they refrained from structuring (Pleading-Gives
Directions r < -.50, p = .001); Pleading-Sets up Checks r = -.45, p .01).
Relationship-motivated individuals were also friendly in situations that requil
pleading (Pleading-Courtesy r = .47, p < .001) but did not become significantly
less friendly in situations in which they initiated structure and felt in control
(Pleading-Gives Directions r < -.21, n.s.; Pleading-Sets up Checks r < .16, n.s.).
Independence-motivated subjects were considerably less courteous than either
relationship- or task-motivated subjects in situations that elicited pleading
(Pleading-Courtesy r < .19, n,s.). The main consideration for this group seemed
to be whether not they had understood the experimental task. When they did,
they asked for information, gave directions, checked performance and even threatene.
(correlations between Conceptual Analysis and these behaviors are .30, p < .05;
.66, p < .001; .26, p < .05; and .38, p < .01, respectively).
Most experiment participants, who had asked for information, also set deadline
for when to receive it (Set up Checks) and gave further directions at the same
time. Indicating that all LPC groups engage in structuring behaviors, although the
do this under different circumstances (as illustrated with Figure 5).
Our first hypothesis stated that if all conditions in this study fall into the
lower half of the situational favorableness continuum, low LPC subjects would engag
in more task-oriented behaviors than high LPC subjects, while high LPC subjects
would strive to improve their relations with coworkers to a greater extent than low
27

Table 5
Correlations Between Behavior
Categories
separated by LPC score)'
Behavior
LPC
Conc.
Anal.
Courtesy
Asking
for Info.
Gives
Directions
Sets up
Checks
Courtesy
Lo
144d
High
.26
-.13
Asking
for Info.
Lo
Mid
High
34*
.30*
.51***
-.15
-.02
.16
Gives
Directions
Lo
Mid
..
High
.24
.66***.
.34**
-.32*
-.22
-.15
.35*
.30*
Sets up
Checks
Lo
Mid
High
.09
.26*
.24
-.30*
.00
.21
73***
.72***
.71***
.43**
34*
Threatens
LoMid
High
-.16
.38**
.25*
-.27
-.13
.06
-.35*
-.15
-.15
-.04
.12
-.07
-.23
-.09
-.07
Threltens
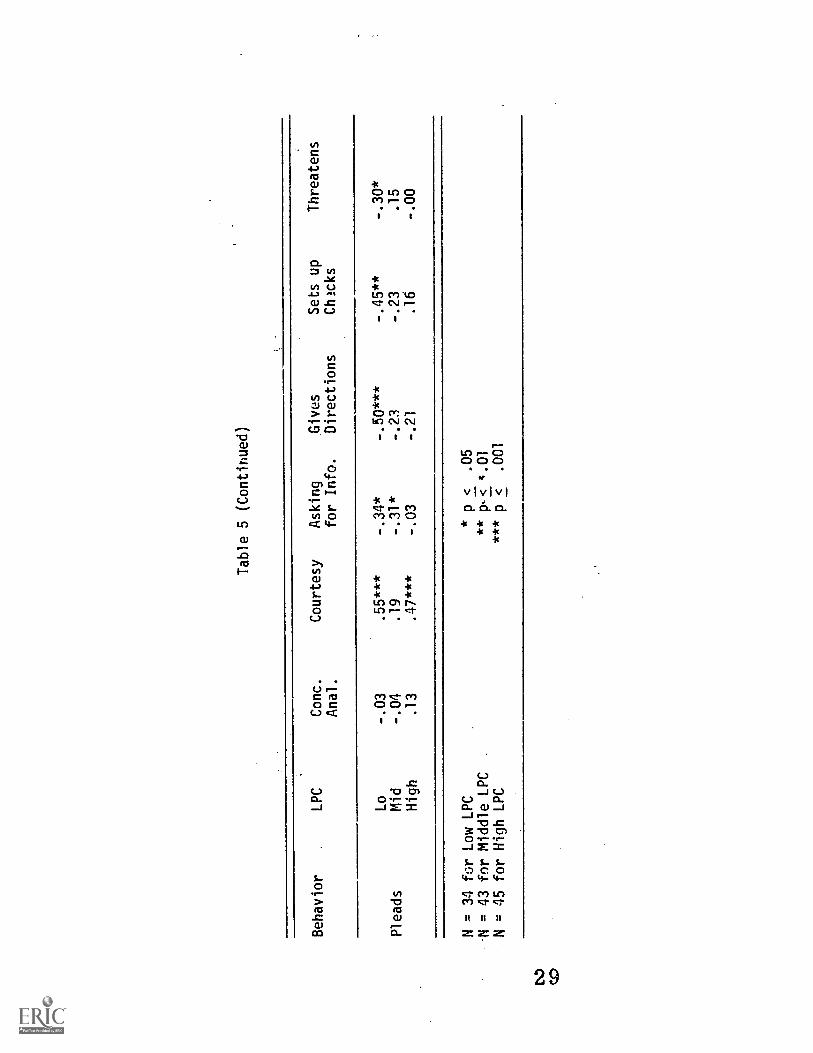
Table 5 (Continued)
Behavior
LPC
Conc.
Courtesy
Asking
Gives
Sets up
Threatens
Anal.
for Info.
Directions
Chicks
Pleads
Lo
-.03
.55***
-.34*
-.50***
-.45**
Mid
-.04
.19
-.31*
-.23
-.23
.15
High
.13
.47***
-.03
-.21
.16
-.00
N34 for Low LPC
N43 for Middle LPC
N . 45 for High LPC
*p
.05
** p.0l
***
p.001

Mai-Dalton 14
LPC subjects. When we aisume that threatening and criticizing are used as a means
to induce coworkers to get on with the job and when we interpret a low level of
threatening and criticizing as an attempt to improve human relations, the hypothesir_
was supported for this behavior category. Additional support for this hypothesis
came from the category "Dives directions to Coworkers." Low LPC subjects gave signii
icantly more directions in this experiment than high LPC subjects (t = 2.08, df = 7.
p = .04), indicating that they were mainly occupied with getting the job done.
Effects of Mental Ability
Table 6 shows the correlations between Wonderlic Personnel Test scores and all
behavior categories. As hypothesized, the correlations indicate that high scoring
individuals had a better understanding of the In-Basket task than those with lower
scores; they also asked for more information and gave significantly more directions
and suggestions than low scoring individuals. High scores on the Wonderlic Personni
Test correlated negatively with pleas for cooperation. Thus, better educated subjet
might also be more autonomous and felt less need for ingratiation.
Insert Table 6 about here
Since this study employed college students only, it must be pointed out that
the Wonderlic'Personnel Test scores did not have the same range as they might have
in the general population. The correlations between the particular behaviors
and mental ability could be generally higher than was the case in this experiment.
In order to examine whether mental ability had a moderating effect on the
behavior categories in this study, analyses of covariance were performed (Table 7). ,
Although scores on the Wonderlic Test were highly correlated with several behaviors
this did not significantly change the analyses of variance results reported in
Table 4. The only significant change occurred in the "Asks for Information"
30

Table 6
Correlations Between Wonderlic Personnel Test And
Behavior Categories
Test Score correlated with
Conceptual Analysis .32***
Courtesy to Coworkers -.03
Asks for Information .34***
Gives Directions
Sets up Checks .17*
Threatens Retaliation -.08
Pleads for Cooperation
N=122 *p <.05
**p <.01
***p <.001
31

15 Mai-Dalton
category, where the interaction between training and the LPC Score changed from
F = 3.287, p = .04 to F = 2.912, p = .059. The analyses of covariance did show
that two of the previously non-discriminating behaviors, "Conceptual Analysis"
and "Sets up Checks", were differentially used by individuals with higher and
lower levels of achievement.
Insert Table 7 about here
Summary of Results for Independence-Motivateo _eaders
As mentioned in the introduction, indepencence-motivated leaders (subjects
that score in the middle range of the LPC scale) were included in this study
for exploratory purposes. The foregoing results indicate that their behavior
was less influenced by the position power manipulation than that of either the
relationship- or the task-motivated subjects. Instead, they appeared most
influenced by whether or not they had understood the experimental task, which
was in part a function of training. When they had understood the In-Basket
problems, they engaged in structuring behaviors and were not concerned with
being courteous. When they were not as clearly informed about the task, as in
octants 7 and 8, they reacted by asking for less information and being more
threatening (Figures 5 and 6), perhaps as an expression of frustration.
It might be hypothesized that independence-motivated leaders would benefit
to a larger extent from training programs, which are geared at improving task
structure, than either task-motivated or relationship-motivated individuals.
Discussion
The results of this study suggest that directing and pleading are situation
ally determined behaviors while searching for information as well as threatening.
and criticizing are the result of an interaction between the situation and the
32

Table 7
Results of Analyses of Covariance, with the Wonderlic
Personnel Test Scores as Covariate
N = 122
Criterion Variable Regression
Conceptual Analysis 12.11 .001
Courtesy to Coworkers .00 n.s.
Asks for Information 15.64 .001
Gives Directions 6.80 .01
Sets up Checks 3.88 .05
Threatens Retaliation 1.49 n.s.
Pleads for Cooperation 3.56 n.s.
33

Mai-Dalton 16
personality of the subject. Thus, when subjects are given power and training, they
engage in directive behaviors, but when they lack power they respond with pleading.
The obtained person-situation interactions point to individual differences in leader-
ship styles, Task-motivated leaders do not hesitate to threaten and criticize to
accomplish the:task, while relationship-motivated leaders strive to remain in good
standing with their coworkers and tread more softly.
However, the most striking result of this study is the finding that a relatively
short and non-intense training program resulted in a search for information under
different conditions. 'Thus, relationship motivated leaders requested information in
- situations that appear to be 'comfortable and secure to them (conditions with training
and high position power), while task-motivated leaders did so when their work was un-
structured and they were only given minimal control (conditions without training and
low position power). This finding is highly relevant to the predictions of the
Contingency Model. Previous empirical studies have shown that relationship-motivated
leaders generally perform best under moderately favorable conditions (octant 5 in this
experiMent), but task-motivated leaders do so when the conditions are unfavorable
(octant 8). Therefore, different styles in searching for information may well be
decisive in determining a leader's success or failure.
However, a word of caution in interpreting these results is in order. The study
was conducted with female college students under laboratory conditions, and the gener-
alizability of the findings needs to be established for other populations and under
field conditions. Nevertheless, the results are consistent with earlier research.
It is also possible that significant differences for four out of seven behavior cate-
gories were found as a result of our method of behavior analysis. This procedure
enabled us to arrive at the most relevant categories for the In-Basket task. However,
since this was the first time that this group of behaviors had been utilized in a
laboratory experiment, all categories will have to be validated. A second study, now
in progress, will attempt to do so.
3 4

17 Mai-Dalton
For future field-studies it is recommended that the relationship between
the search for information and performance be explored further. Should it be
found that these are significantly correlated, then training, which was shown
to influence the search for information, could be administered selectively.
For example, a relationship-motivated leader in an unfavOrable work environment
could be expected to increase his or her searchfor information after receiving
training, while a task7motivated leader would refrain from doing so. Thus, on
the basis of the Contingency Model it could be deCided which leaders would benef
from training and which would not.
35

18
Bibliography
Bass, A. R., Fiedler, F. E. and Krueger, S. Personality Correlates of
Assumed Similarity (ASO and Related Scores. Urbana, 111. Group
Effectiveness Research Laboratory, Technical Report Nr. 19, University
of Illinois, 1964.
Brunswik, Egon. Perce tion and the Re resentative D si n of Ps cholo 'cal
Experiments, University of California Press, Berkeley, 1956.
Chemers, M. M., Rice, R. W., Sundstron, E. and Butler, W.M. Leader LPC,
Training and Effectiveness: An Experimental Examination. Technical
.
Report 73-42, University of Washington, July 1974.
Csoka, L. S. and Fiedler, F. E. The Effect of Leadership Experience and
Training in Structured Military Tasks: A Test of the Contingency Model.
Organi Itional Behavior and Human Performance. Vol. 8, pp. 395-i07, 1972.
Droege, R. C. and Foley, Jr., J. P. In: The Seventh Mental Measurements
Yearbook, Buros, Oscar K., editor.
Duncan, Robert B. Characteristics of Organizational Environments. and
Perceived Environmental Uncertainty. Administrative Science Quarterly,
17, 1972.
Fiedler, Fred E. A Theory of Leadership Effectiveness. New York: McGraw-Hill,
1967.
Fiedler, Fred E. Personality and Situational Determinants of Leader Behavior.
Technical Report 71-18. University of Washington, June 1971.. . '
Fiedler, Fred E. Personality, Motivational Systems, and Behavior of High and
Low LPC Persons. Human Relations, Vol. 25, No. 5, pp. 391-412, Dec. 1972a.
Fiedler, Frad E. Predicting the Effects of Leadership Training and Experience
. .
from the Contingency Model. Journal of Applied Psychology, 56, pp.114-119,
1972b.
Freueriksen, N., Jensen, O. and Beaton, A. E. Prediction of Organizational-
Behavior. Pergamon Preis 1972.

19
Green, S. G;; Nebeker, D. M. and Boni, M. A. Personality and Situational
Effects on Leader Behavior. Technical Report 74-55. University of
WashingtOn, May 1974.
Hemphill, J. Griffiths, D. E. and Frederiksen, N. Administrative
Performance and Personality: A Study of the Ptincipal in a SiMulated
Elementay School. . New York, Columbia Un6ersity, Teachers College
8ureau'of Publications, 1962:
Larson, L. L. and Rowland, K. M. Leadership .Style, Stress, and Behavior
in Task Performance. Organizational Behavior and Human Performance,
Vol. 9, pp. 407-420, 1973.
Lawrence, Paul R. and Lorsch, Jay W. Organization and Environment, Richard D.
Irwin, Inc., 1969.
Michaelsen, Larry K. Leader Orientation, Leader Behavior, Group Effectiveness
and Situational Favorability: An Empirical Extension of the Contingency
Model. Organizational Behavior and Human Performance, Vol. 9, pp. 226-245,
, 1973.
Nebeker, D. M. Situational Favorability and Perceived Environmental Uncertaint
An Integrative Approach. 'Administrative Science Quarterly, 20, pp. 281-294
June 1975.
Posthuma, Allan B. Normative Data on the Least-Preferred Co-Worker Scale (LPC)
and the Groirp Atmosphere Questionnaire (GA). Technical Report 70-8,
University of Washington, August 1970.
Sathe, Vijay. Structural Adaptation to Environment: Study of Insurance
Company Departments and Branch Banks. Unpublished Dissertation at Ohio
State University, 1974.
Stogdill, R. M., and Coons, A..E. 'Leader Behavior: Its Description and
Measurement. Ohio State University, Bureau of Business Research, Business
Research Monograph No. 88, 1957.
37

Appendix
Instructions: Your experiment ID number
Please answer the following questions by placing an "X" on the space abovethe line that best describes your reaction. The closer your "X" approacheseither end of the line, the more you agree with the statement at the end.
Example: How interesting was this experiment to you?
Very inter- : X : Not inter-esting 8 7 6 5 4 3 2 1 esting at
all
This answer would indicate that it was somewhat interesting, but thatyouwere not particularly overwhelmed.
1) How well did you understand the instructions?
Not at all :
8 7 6 5 4 3 2 1
: .Very well
2) How much influence did you, Kim Stratford, have on the students insetting up and conducting the In-Basket Experiment?
No influence .: . . . . . . : A lot of
8 7 6 5 4 3 2 1 Influence
3) Did you, as Kim Stratford, feel you had power to retaliate againstnon-cooperative students?
Power to : : . . : No power toretaliate 8 7 6 5 4. 3 2 I do anything_
4) With reference to the instructional pages, how interested do you thinkthe students would be in performing well in the experiment set-up?
Not inter- : : : : : : : : Very inter-ested 8 T T T T 2 TE ested
5) How well did the experimental instructions prepare you for thetypes of decisions you had to make as a participant in thisexperiment?
The approach : : : : : No hintsto use was 8 7 6 5 4 3 2 I werewell deFxribed provided
6) To what extent did you, as a participant in today's session, feelthat Kim Stratford's experiment was structured?
Structured7 6 4 3 2
38
Unstructured

II
Your experiment ID number
GROUP ATMOSPHERE SCALE
Please describe how you perceive the atmosphere in today's experimental
session by checking the followina items.
Pleasant8 7 6 5
Friendly
8 7
Bad
8 7 6 5
Wortnless
Distant8 7 6 5
Cold . :
8 6 5
Quarrelsome8 7 6 5
Self-assured
8 7 6 5
Efficient : :
8 7 6 5
Gloomy8 7
. . . : Unpleasant4 3 2 1
: ... . : Unfriendly
4 3 2 1
: Good4 3 2 1
: Valuable87654321: : Close
4 3 2 1
. : : Warm4 3 2 1
: Harmonious4 3 2 1
: Hesitant3 2 1
:
: Inefficient4 3 2 1
: Cheerful2 1
3 9
Your Experiment ID Number
Instruction:
The Task that you have just completed asked you to make several decisions. Thefollowing questions deal with this part of the experiment. Please answer themby placing an "X" on the place of the line that best describes your reaction.The closer your "X" approaches either end of the line, the more you agree withthe statement at that end.
Example: How certain were you that you wanted to take part in this experiment?
Very certain : : :_11L) : Not certain8 7 6 5 4 3 2 1 at all
This example-answer would indicate that you were quite uncertain about yourparticipation.
1) How certain were you that the method you used in dealing with the -BasketItems was the best one for the particular situation?
Not cer- : : Very Certaintain at 8 7 6 5 4 3 2 1
all
2) Did,you feel that you had all the information for making the In-Basket-Item
decisions?
The Anfo. :
was unsatis- 8 7
factory
All neCessary4 3 2 1 information
was given
When working with the students on, the experiment set-up, how certain wereyou about how they wanted the job done?
Very uncer-: . . . . . : Very certaintain 8 7 6---g---.4 3 2 1
4) Now'often were you in doubt about how to obtain the information you neededfor making decisions in the situation?
Never indoubt 8 7 6 T 4TTT doubt
Always in
5) How sure were you that you had met the expectations of those you dealtwith in setting up the experiment?
Not.surtat all 8 7 6 5 4 3 2 1
: Very sure
6) How sure were you about how to act in order to meet the expectations ofthe students?
Very sure
6 5 4
40
: Not sure atall

IV
Think of the person with whom you can work least well. He/she may be someone
you work with now, or someone you knew in the past.
He/she does not have to be the person you like least well, but should be theperson with whom you had the most difficulty in getting a job done. Describe
this person as he/she appears to you.
Pleasant :
8 7 6 5
Friendly :
8 7 6 5
Rejecting :
8 7 6 5
Helpful :
8 7 5
Unenthusiastic7 6
Tense8 7 6 5
Distant :
8 7 6 5
Cold : 876 5
Cooperative8 7 6 5
Supportive8 7 6 5
Boring :
8 7 6 5
Quarrelsome: :8 7 6 5
Self-assured8 7 6 5
Efficient8 7 6 5
Gloomy :
Open ..
8 7 6 5
.
4
4
4
:
5 4
4
4
4
4
4
4
4
n
4
.
4
4 1
: Unpleasant3 2 1
: Unfriendly3 2 1
: Accepting3 2 1
: Frustrating3 2 1
Enthusiastic3 2
Relaxed2 1
: Close3 2 1
V.
: Warm3 2 1
: Uncooperative2 1
Hostile3 2
Interesting3 2 1
: Harmonious
3 2
: Hesitant3 2 1
: Inefficient23. 1
: Cheerful3
. . Guarded3 2 -r-

Definitions of Scoring Categories
1. Conceptual Analysis
General definition: This category refers to the S's recognition of impli-cations of the problem and/or action and/or solution. Score here if the S
makes it clear in her response that she has seen more than the immediate impli-cations of the problem(s) presented by the item.
Score here
1 - lack of conceptual grasp.
2 - weak grasp of 1 item
3 - moderate grasp of I item; mentions more than 1 item
4 - excellent grasp of I item; good grasp of more than 1 item
5 - elaborates on total problem and mentions several items
Do not score here if the S merely asks for more information, states a need forguidance or help, notes another's abilities or qualities for handling a par-ticular item, or notes priority or urgency.
2. Courtpsy_to Coworkers
General definition: Score here any expression or act of courtesy directedby the S to coworkers. The courtesy may be formal, such as "please," "thankyou," "sorry," or it may be more expansive.
Score here
1 - no courtesy
2 - routine words of courtesy
3 - weak offer to be of help; formal appmciation
4 - strong offer to be of help; encouragement
5 - stronger types of courtesies, appreciation, commendation
Do not score here headings, formal greetings (e.g. Dear) salutations and
complimentary closings.
3. Asks for Information Opinion or Advice from Coworker
General definition: Score here any communication, actual or planned, inwhich the S asks for task-relevant information, opinion, or advice.
42

VI
Score here
1 - no request
2 - not sure if request for information is expressed
3 - request for general information
4 - request for specific information w/o giving reason for needing it
5 - request for specific information, giving explicit reason for needing it
Do not score here if the S is asking merely a rhetorical question.
4. Gives Directions to Coworkers
General definition: Score here any response in which the S plans to or
actually gives directions to coworker.
Score here
1 - no directions
2 - you might want to check...
3 - could you inquire about ...; keep me informed
4 - would you please...
5 - explicit (one or more directions)
5. Sets up Checks on Coworker
General definition: Score here if the S explicitly checks or plans to check
on the work she assigns or has assigned to the coworker.
Score here
1 - no checks
2 - let me know if convenient; keep me informed
3 - see me when you are done-
4 - higher, when a specific date is mentioned
5 - explicit request for specific date and feedback
6. Threatens Retaliation for Non-Compliance
General definition: Score here any response in which the S reminds thecoworker of her responsibilities and threatens with punishment in case f
4 3

VII
non-compliance.
Score here
1 - no threat or criticism
2 - implied criticism
3 - criticizes
4 - invokes consequences
5 - threatens
7. Pleads for Cooperation
General definition: Score here any response in which the S pleads with thecoworker for cooperation and attempts to coax and cajole her into helping.
Score here
1 - no pleading
2 - slight coaxing
3 - whining and coaxing
4 - encouragement to please cooperate
5 - strong request for cooperation
4 4