document resume ed 052 839 24 ps 004 894 31p. · analysis of visual perception of children in the...
TRANSCRIPT

ED 052 839
DOCUMENT RESUME
24 PS 004 894
AUTHOR Hines, Brainard W.TITLE Analysis of Visual Perception of Children in the
Early Childhood Education Program (Results of theMarianne Frostig Developmental Test of VisualPerception).
INSTITUTION Appalachia Educational Lab., Charleston, W. Va.SPONS AGENCY Office of Education (DHEW), Washington, D.C. Bureau
of Research.REPORT NO TR-5BUREAU NO BR 6-2909PUB DATE Feb 71CONTRACT OEC-3-7-062909-3070NOTE 31p.
EDRS PRICEDESCRIPTORS
IDENTIFIERS
ABSTRACT
EDRS Price MF-$0.65 HC-$3.29*Evaluation Methods, Mobile Classrooms, MotorDevelopment, Nonprofessional Personnel, PerceptualDevelopment, *Perceptual Motor Coordination,*Preschool Programs, Program Evaluation, SexDifferences, Tables (Data), Teacher Attitudes,Teacher Role, Television, *Ti.sual Measures, *VisualPerceptionFrostig Developmental Test of Visual Perception
This report includes a description of the Frostig asa total instrument and an overall analysis, as well as separateanalyses and descriptions of each subtest. A brief summary of theexperimental design and sampling plan also is included. A summLry ofthe AEL Early Childhood Program is available as PS 004 889.(Author/NH)

U.S. DEPARTMENT OF HEALTH,EDUCATION,& WELFAREOFFICE OF EDUCATION
THIS DOCUMENT HAS BEEN REPRO-DUCED EXACTLY AS RECEIVED FROMTHE PERSON OR ORGANIZATION ORIG-INATING IT. POINTS OF VIEW OR OPIN-IONS STATED DO NOT NECESSARILYREPRESENT OFFICIAL OFFICE OF EDU-CATION POSITION OR POLICY.
ANALYSIS OF VISUAL PERCEPTION OF CHILDREN
IN THE EARLY CHILDHOOD EDUCATION PROGRAM
(RESULTS OF THE MARIANNE FROSTIG DEVELOPMENTAL
TEST OF VISUAL PERCEPTION)
Technical Report No. 5
Division of Research and EvaluationAppalachia Educational Laboratory
Charleston, West Virginia
February, 1971
Fk-

TABLE OF CONTENTS
INTRODUCTION
METHOD
DESCRIPTION OF INSTRUMENT AND RESULTS OF ANALYSIS
LIST OF TABLES
PAGE
1
1
3
TABLE
5-1 FROSTIG SUBTEST 1 (EYE-MOTOR COORDINATION) MEAN
RAW SCORES, STANDARD DEVIATIONS, AND NUMBERS
OF SUBJECTS BY AGE AND SEX WITHIN TREATMENT
GROUPS 4
5-2 SUBTEST 1 MEAN RAW SCORES, STANDARD DEVIATIONS,
,AND SAMPLE SIZES FOR EACH TREATMENT GROUP 4
5-3 ANALYSIS OF VARIANCE TABLE FOR FROSTIG SUBTEST 1 5
5-4 FROSTIG SUBTEST 2 (FIGURE-GROUND) MEAN RAW SCORE,
STANDARD DEVIATIONS, AND NUMBERS OF SUBJECTS
BY AGE AND SEX WITHIN TREATMENT GROUPS
5-5 SUBTEST 2 MEAN RAW SCORES, STANDARD DEVIATIONS,
AND SAMPLE SIZES FOR EACH TREATMENT GROUP 10
5-6 ANALYSIS OF VARIANCE TABLE FOR FROSTIG SUBTEST 2 .11
5-7 FROSTIG SUBTEST 3 (CONSTANCY OF SHAPE) RAW SCORE
MEANS, STANDARD DEVIATIONS, AND NUMBERS OF SUBJECTS
BY AGE AND SEX WITHIN TREATMENT GROUPS 12
2

I
LIST OF TABLES
TABLEPAGE
5-8 SUBTEST 3 MEAN RAW SCORES, STANDARD DEVIATIONS
AND SAMPLE SIZES FOR EACH TREATMENT GROUP 13
5-9 ANALYSIS OF VARIANCE TABLE FOR FROSTIG SUBTEST 3 . . 14
5-10 FROSTIG SUBTEST 4 (POSITION IN SPACE) RAW SCORE
MEANS, STANDARD DEVIATIONS, AND NUMBERS OF
SUBJECTS BY AGE AND SEX WITHIN TREATMENT GROUPS . . . .15
5-11 SUBTEST 4 MEAN RAW SCORES, STANDARD DEVIATIONS,
AND SAMPLE SIZES FOR EACH TREATMENT GROUP 15
5-12 SUMMARY OF ANALYSIS OF VARIANCE FOR FROSTIG
SUBTEST 4 17
5 -13 FROSTIG SUBTEST 5 (SPATIAL RELATIONSHIPS) RAW SCORE
MEANS, STANDARD DEVIATIONS, AND NUMBERS OF
SUBJECTS BY AGE AND SEX WITHIN TREATMENT GROUPS . . . .19
5-14 SUBTEST 5 MEAN RAW SCORES, STANDARD DEVIATIONS,
AND SAMPLE SIZES FOR EACH TREATMENT GROUP 20
5-15 ANALYSIS OF VARIANCE SUMMARY FOR FROSTIG SUBTEST 5 . . . 21
5-16 FROSTIG TOTAL RAW SCORE MEANS, STANDARD DEVIATIONS,
AND NUMBERS OF SUBJECTS BY AGE AND SEX WITHIN
TREATMENT GROUPS 22
5-17 TOTAL SCORES COMBINED WITHIN TREATMENT GROUPS 22
5-18 ANALYSIS OF VARIANCE SUMMARY - FROSTIG TOTAL
RAW SCORE 24
3

LIST OF FIGURES
FIGURE PAGE
5-1 RAW SCORE MEANS AND NATIONAL NORMS FOR
FROSTIG SUBTEST 1 (EYE-MOTOR COORDINATION) 5
5-2 SIGNIFICANT TREATMENT-AGE-SEX INTERACTION ON
FROSTIG SUBTEST 1 (EYE-MOTOR COORDINATION) 6
5-3 SEX-TREATMENT INTERACTION WITHIN AGE GROUP
ON FROSTIG SUBTEST 1 7
5-4 RAW SCORE MEANS AND NATIONAL NORMS FOR FROSTIG
SUBTEST 2 (FIGURE-GROUND). 10
5-5 RAW SCORE MEANS AND NATIONAL NORMS FOR FROSTIG
SUBTEST 3 (CONSTANCY OF SHAPE) 13
5-6 RAW SCORE MEANS AND NATIONAL NORMS FOR FROSTIG
SUBTEST 4 (POSITION IN SPACE) 16
5-7 TREATMENT AGE INTERACTION ACROSS SEX (AVERAGED
FOR MALE AND FEMALE) ON FROSTIG SUBTEST 4 18
5-.8 RAW SCORE MEANS AND NATIONAL NORMS FOR FROSTIG
SUBTEST 5 (SPATIAL RELATIONSHIPS) 20
5-9 RAW SCORE MEANS AND NATIONAL NORMS FOR THE
FROSTIG TOTAL SCORES 23
5-10 SIGNIFICANT TREATMENT-AGE-SEX INTERACTION ON THE
OVERALL FROSTIG TEST 25
5-11 SEX-TREATMENT INTERACTION WITHIN AGE GROUP ON
THE OVERALL FROSTIG TEST 26
4

L_
I !
ANALYSIS OF VISUAL PERCEPTION OF CHILDRENIN THE EARLY CEILDHOOD EDUCATION PROGRAM*
Introduction
A large proportion of the initial ECE curriculum1
and the subsequent prucia:.
materials are devoted to teaching motor coordination and perceptual learning tas1;.:
Because of the difficulty of developing specific measures for each of these ob
jectives, and because of its previous use in evaluating preschool programs, the
Marianne Frostig Developmental Test of Visual Perception was used to measure
behavioral change in these areas.
The Frostig shares many of the same problems as a program evaluation
instrument with the ITPA. Neither was designed to be a specific measure of epi-
gram effects and both are individually administered, and thus are susceptible
examiner bias. In addition, both instruments were designed to be diagnostic uf
perceptual, expressive, and motor deficits rather than overall tre,cment
However, the instrument does provide a potentially valid and reliable
measure of perceptual development in the preschool-age child, and most important,
it provides national norms for comparison with a sample outside of the AEL
This report includes a description of the Frostig as a total instrument end
an overall analysis, as well as separate analyses and descriptions of each sub-
test. A brief summary of the experimental design and sampling plan also is
included.
Method
A pilot study done by Hooper and Marshall2 included administration of the
Frostig to a sample of children, aged three to six years, in northern West: Vir,ii
'Frank H. Hooper and William H. Marshall, The initial Phase of a Preschool.Curriculum Development Project - Final Report. Morgantown, West Virginia, 1968,pp. 116-122.
2Ibid., pp. 75-77.
*This report was prepared by Brainard W. Hines of the AEL Research and Evaluatju,Division.
2
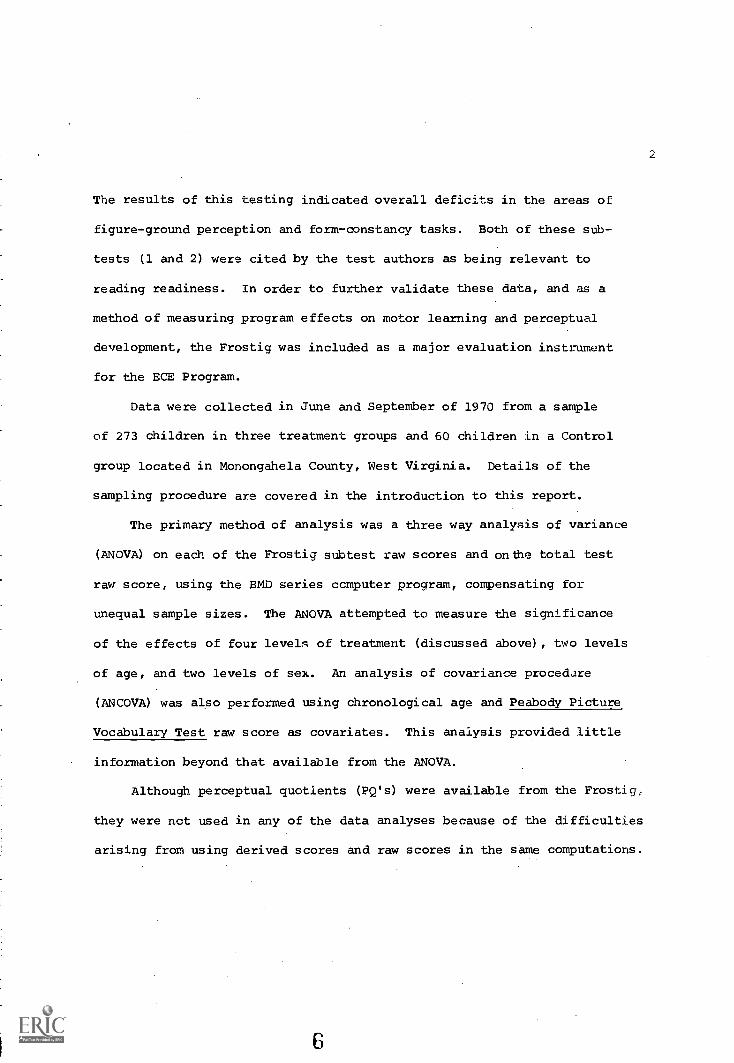
The results of this testing indicated overall deficits in the areas of
figure-ground perception and form-constancy tasks. Both of these sub-
tests (1 and 2) were cited by the test authors as being relevant to
reading readiness. In order to further validate these data, and as a
method of measuring program effects on motor learning and perceptual
development, the Frostig was included as a major evaluation instrument
for the ECE Program.
Data were collected in June and September of 1970 from a sample
of 273 children in three treatment groups and 60 children in a Control
group located in Monongahela County, West Virginia. Details of the
sampling procedure are covered in the introduction to this report.
The primary method of analysis was a three way analysis of variance
(ANOVA) on each of the Frostig subtest raw scores and on the total test
raw score, using the BMD series computer program, compensating for
unequal sample sizes. The ANOVA attempted to measure the significance
of the effects of four levels of treatment (discussed above), two levels
of age, and two levels of sex. An analysis of covariance procedure
(ANCOVA) was also performed using chronological age and Peabody Picture
Vocabulary Test raw score as covariates. This analysis provided little
information beyond that available from the ANOVA.
Although perceptual quotients (PQ's) were available from the Frostig,
they were not used in any of the data analyses because of the difficulties
arising from using derived scores and raw scores in the same computations.

3
Description of Instrument and Results of AnaLEA
The Frostig is designed primarily as a method of assessing perceptual
development in the visual area. However, hand-eye coordination and overall
motor skills are involved in the child's responses to the visual configura-
tions on the test. Unlike the ITPA, with the Frostig it is difficult to
separate the receptive processes (visual acuity) from the mediating activity
(figure recognition) and the expressive act ( drawing, outlining, etc.).
For this reason the instrument is considered to be an indicator of perceptual-
motor development in the ECE evaluation plan, and no effort is made to separate
the two different areas of functioning which may cause variance on the total
test scores. Each of the following suLtests have fairly high "face" validity
and it is assumed that each measures the general area which is attributed to
it.
Frostig Subtest 1 (Eye Motor Coordination)
The authors state that this subtest is:
A test of eye-hand coordination involving the drawing of continuousstraight, curved, or angled lines between boundaries of variouswidth, or from point to point without guidelines.3
Mean raw scores, standard deviations, and numbers of subjects according
to age, sex and treatment group for Subtest 1 are presented in Table 5-1,
and the same data combined to show treatment group means are given as
Table 5-2. Combining these scores produces the results which are also
graphically represented in Figure 5-1 along with the mean scores of the
Frostig normative sample.
3Marianne Frostig, Administration and Scoring Manual, Frostig Develop-mental Test of Visual Perception, Consulting Psychologists Press, 1966.

II
L
TABLE 5-1
FROSTIG SUBTEST t;EYE-MOTOR COORDINATION) MEAN PAW SCORES,STANDARD DEVIATIONS, AND NUMBERS OF SUBJECTS BV AGE AND SEX
WITHIN TREATMM4T GPOOPS
Age Sex Package TV-HV TV only Control.
= 9.67 = 10.22 = 8.15 R = 4.31
M sn 6.34 = 3.87 SD = 6.04 SD = 2.14
3 N = 9 N = 9 N = 13 N = 13
R = 8.78 R = 15.01) R = 9.60 R = 7.78
F SD = 7.92 SD = 4.35 SD = 8.15 SD = 4.09
N =9 N = 1C N =8 N =9R = 14.54 R = 19.75 R = 13.75 R = 7.78
SD = 8.11 SD = 4.37 SD = 8.15 SD --- 4.09
4 N = 13 N =8 N =8 N = 9
= 10.64 R = 10.40 = 13.54 R = 10.10
F SD = 5.32 SD = 2.95 SD = 7.48 SD = 3.78
N = 11 N = 10- N = 13 N rz 10
TABLE 5-2
SUBTEST 1 MEAN RAW SCORES, STANDARD DEVIATIONS,AND SAMPLE SIZES FOR EACH TREATMENT GROUP
Package TV only Control
R = 11.86 R = 13.62 R = 11.34 = 6.64SD = 6.99 SD = 5.34 SD = 7.18 SD = 3.70
N = 40 N = 31 N = 44 N = 45
8
-
4

5
Group FT:INationalMeans Norms
15
10MIN
5
777
0
11.86 6.00Package
13.62 5.00 11.34 5.00TV-HV TV only
FIGURE 5-1
6.64 4.00Control
RAW SCORE MEANS AND NATIONAL NORMSFOR FROSTIG SUBTEST 1 (EYE-MOTOR COORDINATION)
Several meaningful conclusions can be drawn from the previous graph.
First, the three treatment groups show significantly higher means than the
comparison group. Second, the TV-HV group scored slightly above the other
two treatments, and finally, all three treatments scored well above the
national norms for this age.
These findings are clarified by the results of the three-way analysis of
variance procedure which was performed on the raw scores of Subtest 1. A
summary of the ANOVA results is reproduced in Table 5-3.
TABLE 5-3
ANALYSIS OF VARIANCE TABLE FOR FROSTIG SUBTEST 1
Source eta2* D.F. Mean Square F P
I(trt) .142 3 332.0735567 10.49 R(.0005J(sex) .003 1 21.1397785 1 0.67
K(age) .078 1 546.2934877 17.26 P.0005IJ-INT .023 3 53.12835805 1.68IK-INT .004 3 9.118485656 0.29
JK-INT .024 1 169.8001502 5.36 P<.05
IJKINT .047 3 110.6800582 3.50 P<.(13
ERROR 150 31.64923608
*eta2 is a measure of the amount of variance accounted for by each source.
9

Raw
Score_
Mi,an
20
15-
10- 5-
0.
Age
H*/
Px
T c
.09
H T
xC
34
Raw
Score
Mean
15-
10-
5-
0
Age
P=Package
xx
H=TV-HV
u,
f=TV only
x
C=Control
....N
.X
Hx
TV.
_)c T
34
Male
Female
FIGURE 5-2
SIGNIFICANT TREATMENT-AGE-SEX INTERACTION
ON FROSTIG SUBTEST 1 (EYE-MOTOR COORDINATION)

20
15
10
Male 3 ye,..r olds
Male 4 year olds
Female 3 year olds
Female 4 year olds
Package TV-HV
FIGURE 5-3
TV only
SEX-TREATMENT INTERACTION WITHIN AGE GROUPON FROSTIG SUBTEST 1
ij
Control
7

1-
8
The highly significant effect of age is expected from a test which
measures factors which develop rapidly with time, but it is surprising that
no main sex effect was evident in this analysis. Most traditional develop-
mental theories hypothesize that girls mature at a slightly more rapid rate
than boys of this age, but no evidence was present for this contention in the
ECE data.
The significant main effect of treatment (P<.0005) may well be due
to the child's exposure to a variety of visual and expresslve stimuli in the
television program, through the home visitor, and in the mobile classroom.
A Scheffe post-hoc comparison indicated that the comparison group scored
significantly below all three treatment groups. A great many of the program's
Objectives involve activities with brush, c,rayon, or pencil which provide
motor learning experiences for the child, and many of these same activities
were concerned with visual discrimination tasks.
A significant treatment-sex-age interaction and a significant age-sex
interaction effect were evident on Subtest 1, which complicates the process
of drawing inferences about main effects. Figures 5-2 and 5-3 illustrate
these interactions graphically.
In Figure 5-2, the three treatment groups show clear superiority over
the Control group, especially for male subjects. In fact, four year old
females in the home visitor group showed decrements in mean score with
increases in age, reaching the performance level of the Control group.
Only the "TV" group produced similar gains for males and females. Figure
5-3 illustrates the relative superiority of the Package and home visitor
groups over the TVonly and Control groups for males. It is of interest
that the three year old males produced consistently low scores and the
four year old males produced considerably higher scores over all four
treatment conditions. It is possible that the home visitor reacts best
with older boys in each of the two groups with which she is in contact.
12

L
9
Frostig Subtest 2 (Figure-Ground)
Frostig Subtest 2, according to the authors, is a measure of ability to
perceive "...shifts in perception of figures against increasingly complex
grounds. Intersecting and 'hidden' geometric forms are used."4
Subtest 2 is thought to correlate highly with reading readiness, in
that it measures the ability to discriminate shapes and configurations from
their context. The same ability is necessary in recognition of letters and
numbers in written material.
Table 5-4 indicates mean raw scores, standard deviations, and numbers
of subjects for er,.ch age by sex cell within the four treatments. Table 5 -S
shows the same parameters collapsed across treatment groups.
TABLE 5-4
FROSTIG SUBTEST 2 (FIGURE-GROUND) MEAN RAW SCORES,STANDARD DEVIATIONS, AND NUMBERS OF SUBJECTS BY AGE AND
SEX WITHIN TREATMENT GROUPS
Age Sex Package TV-HV TV only Control
= 3.25 x = 2.89 R = 5.00 = 4.15M SD = 3.69 SD = 5.84 SD = 5.45 SD = 5.01
3 N= 8 N= 9 N= 13 N= 13R = 2.75 R = 5.10 R = 1.10 R = 4.62
F SD = 4.17 SD = 5.70 SD = 1.60 SD = 5.72N = 8 N = 10 N = 10 N = 13x = 7.92 R = 12.38 x = 4.50 R = 8.67
M SD = 6.30 SD = 4.75 SD = 5.37 SD = 6.144 N = 13 s = 8 N= 8 N= 9
R = 6.73 r = 9.10 R = 6.85 R = 11.00F SD = 6.42 SD = 6.19 SD = 5.60 SD = 6.18
N = 11 N = 10 N = 13 N = 10
4lbid., p. 5.
13

TABLE 5-5
SUBTEST 2 MEAN RAW SCORES, STANDARD DEVIATIONS,AND SAMPLE SIZES FOR EACH TREATMENT GROUP
Package TV-HV TV only Control
il = 8.51 R = 9.20 R = 7.17 51 = 7.55
SD = 5.34 SD = 5.97 SD = 5.01 SD = 6.09
N = 40 N = 37 N = 44 N = 45
Figure 5-4 is a graphic presentation of the treatment group means,
and means from the normative sample are also presented for comparable age
groups.
'10
5
0
=1.
8.51 6.00Package
9.20 6.00TV-HV
GroupMeans
NationaNorms
7.17 6.00 7.55 5.00
TV only Control
FIGURE 5-4
RAW SCORE MEANS AND NATIONAL NORMS FORFROSTIG SUBTEST 2 (FIGURE-GROUND)
14
10

r
t
11
As Figure 5-4 indicates, the two treatment groups which received visits
from the paraprofessional (TV-HV and Package) scored well above national
norms and above the TVcnly and comparison groups. This type of "embedded
figures" discrimination plays a part in several of the ECE program objectives,
and the paraprofessional very likely was able to facilitate learning in this
area.
The results of the analysis of variance procedure are summarized in
Table 5-6.
TABLE 5-6
ANALYSIS OF VARIANCE TABLE FOR FROSTIG SUBTEST 2
Source eta2 D.F. Mean Square
I(trt)
J(sex)K(age)IJ-INTIK-INTJK-INTIJKINTERROR
.039
.000
.167
.005
.015
.002
.028
3
1
1
3
3
1
3
150
75.465145200.14500485601015.48166010.0850295230.236401819.69637993056.9939645230.18686882
2.63
0.0033.640.331.000.321.89
13.05
P<.0005
A Scheffe post-hoc comparison did not reveal any single pair of means
with a difference that contributed significantly to the treatment effect.
The main effect of age which is apparent at a highly significant level
(P <.0005) validates the developmental nature of the factor which this
subtest measures, and is also evident in the increases from the three to
four year old groups shown in Table 5-4.
It seems evident that the home visitor played an important role in
reaching this particular area of functioning, perhaps providing practice
5Frank H. Hooper and William H. Marshall, The Initial Phase of a
Preschool Curriculum Development Project, Morgantown, West Virginia, p. 139.
15
5

12
in categorizing and recognition of geometric shapes, as well as differen-
tiating these shaves from a complex background.
Frostig Subtest 3 (Constancy of Shape)
This section is designed to measure:
Recognition of certain geometric figures presented in a varietyof sizes, shadings, textures, and positions in spaces, and theirdiscrimination from similar geometric figures. Circles, squares,rectangles, ellipses, and parallelograms are used.6
Since these figures are relatively common, it would be expected that
the child's familiarity with the shapes would correlate positively with his
performance on the test. Many of the ECE curriculum objectives do involve
recognition and labeling of these and similar geometric figures, and could
thus be expected to influence scores on the subtest.
Table 5-7 indical-.es means, standard deviations, and numbers of subjects
for each age by 3ex cell within the four treatment groups.
TABLE 5-7
FROSTIG SUBTEST 3 (CONSTANCY OF SHAPE) RAW SCOREMEANS, STANDARD DEVIATIONS, AND NUMBERS OF SUBJECTS
BY AGE AND SEX WITHIN TREATMENT GROUPS
Age Sex Package TV-HV TV only Control
51 = 3.50 51 = 3.78 51 = 3.23 ii = 3.15M SD = 3.21 SD = 4.00 SD = 3.40 SD = 2.48
3 N= 8 N= 9 N= 13 N= 13
51 = 4.50 51 = 4.00 51 = 1.40 R = 2.92F SD = 3.16 SD = 2.31 SD = 2.07 SD = 2.40
N = 8 N = 10 N = 10 N = 13
51 = 3.54 51 = 5.38 51 = 3.25 51 = 2.00M SD = 3.20 SD SD = 2.87 SD = 1.73
4 N= 13 N= 8 N = 8 N = 9
51 = 5.82 R = 6.20 51 = 3.69 51 = 4.80F SD = 4.07 SD = 4.54 SD = 4.44 SD = 4.40
N = 11 N = 10 N = 13 N = 10
6Frostig, 22. Cit., p. 5.

13
Combining these scores results in the means which are presented in
Table 5-8 and shown in Figure 5-5. Mean scores from the normative samnle
are also presented in Figure 5-5.
TABLE 5-8
SUBTEST 3 MEAN RAW SCORES, STANDARD DEVIATIONS,AND SAMPLE SIZES FOR EACH TREATMENT GROUP
Package TV-HV TV only Control
x = 3.80 x = 5.55 x = 5.00 x = 3.62
SD = 2.73 SD = 3.43 SD = 3.08 SD = 2.87
N = 40 N = 37 N = 44 N = 45
6.
4.
2
O.
GroupMeans
NationalNorms
3.80 3.50 5.55 3.00 5.00 3.00 3.62 2.50
Package TV-HV TV only Control
FIGURE 5-5
RAW SCORE MEANS AND NATIONAL NORMS FORFROSTIG SUBTEST 3 (CONSTANCY OF SHAPE)
The trends which were evident in the previous two subtests are also
present in this measure. Although all groups scored slightly above the
national norms, two of the three treatment groups scored at nearly twice the
raw score means of the children in the normative sample.
Table 5-9 presents a summary of the ANOVA results for Subtest 3, and
clarifies the findings presented above.

14
TABLE 5-9
ANALYSIS OF VARIANCE TABLE FOR FROSTIG SUBTEST 3
Source eta2 D.F. Mean Square
I(trt) .051 3 33.34296240 2.94 P.05J(sex) .010 1 18.98604364 1.67K(age) .022 1 41.96611427 3.70 P<.05IJ-INT .017 3 10.99674278 0.97IK-INT .001 3 4.373339517 0.38JK-INT .016 1 32.32273501 2.85IJKINT .005 3 2.878773868 0.25ERROR 150 11.35393331
A Scheffe post-hoc comparison revealed that the treatment effect
which is present (P<.05) favors the two treatment groups which received
visits from the paraprofessional in comparison to the TVonly and Control
group. That is, the paraprofessional made a contribution to the learning
that is measured by this subtest above that which is produced by the
television program.
The effect of age provides further evidence for the developmental
nature of the construct which Subtest 3 is measuring. This is not sur-
prising in light of the purpose of the instrument and the relatively high
intercorrelations of the sub casts which also showed a significant age effect.
(These varied from approximately r = .38 to r = .58).
Frostig Subtest 4 (Position in Space)
This particular measure involves:
The discrimination of reversals and rotating of figures presentedin series. Schematic drawing representing common objects are used.
The ability to follow explicit directions and to comprehend the meaning
of same and different is also involved in the responses to this subtest.
/Ibid., p. 5.
18
is
Q.
15
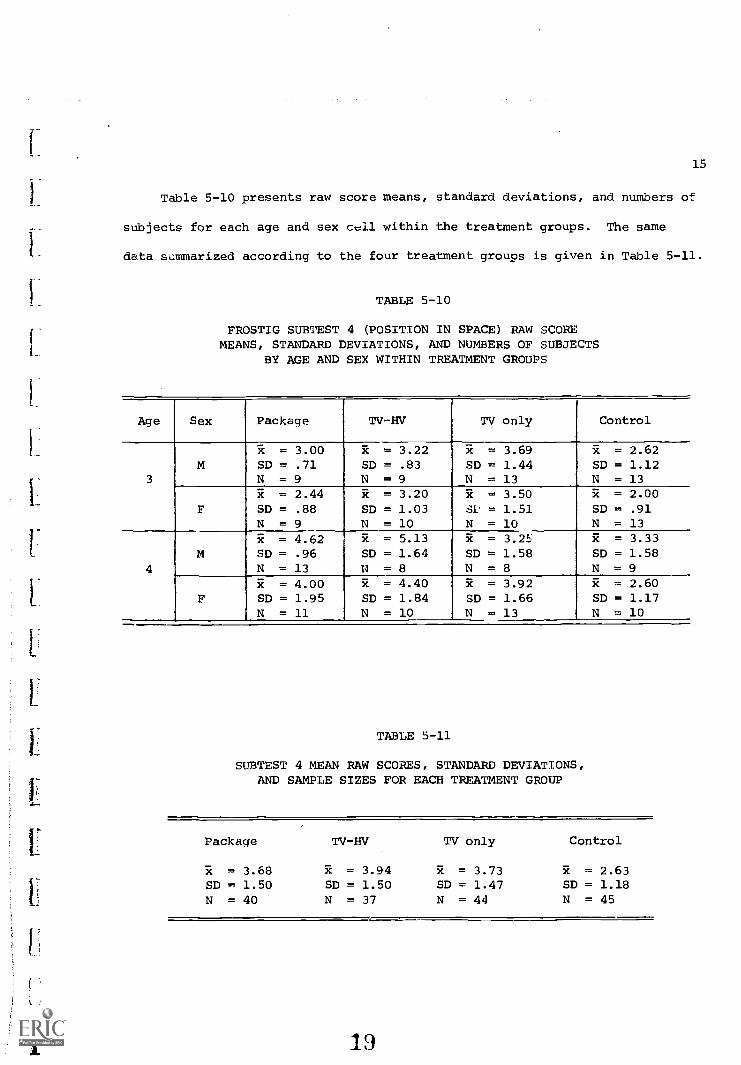
Table 5-10 presents raw score means, standard deviations, and numbers of
subjects for each age and sex cell within the treatment groups. The same
data summarized according to the four treatment groups is given in Table 5-11.
TABLE 5-10
FROSTIG SUBTEST 4 (POSITION IN SPACE) RAW SCOREMEANS, STANDARD DEVIATIONS, AND NUMBERS OF SUBJECTS
BY AGE AND SEX WITHIN TREATMENT GROUPS
Age Sex Package TV-HV TV only Control
= 3.00 R = 3.22 r R = 3.69 x = 2.62M SD = .71 SD = .83 SD = 1.44 SD = 1.12
3 N = 9 N = 9 N = 13 N = 13
x = 2.44 x = 3.20 R = 3.50 x = 2.00
F SD = .88 SD = 1.03 SL = 1.51 SD = .91
N = 9 N = 10 N = 10 N = 13
R = 4.62 R = 5.13 x = 3.2!..' x = 3.33
M SD = .96 SD = 1.64 SD = 1.58 SD = 1.58
4 N= 13 N= 8 N= 8 N= 9
x = 4.00 x = 4.40 x = 3.92 x = 2.60
F SD = 1.95 SD = 1.84 SD = 1.66 SD = 1.17N = 11 N = 10 N = 13 N = 10
TABLE 5-11
SUBTEST 4 MEAN RAW SCORES, STANDARD DEVIATIONS,AND SAMPLE SIZES FOR EACH TREATMENT GROUP
Package TV-HV TV only Control
R = 3.68 = 3.94 = 3.73 R = 2.63SD = 1.50 SD = 1.50 SD = 1.47 SD = 1.18
N = 40 N = 37 N = 44 N = 45
19

16
Figure 5-6 indicates these same scores, combined for each of the four
groups, and means scores from the age norms.
Group rirationalMeans Norms
3.68 2.50 3.94 2.50 3.73 2.50 2.63 2.60Package TV-HV TV only Control
FIGURE 5-6
RAW SCORE MEANS AND NATIONAL NORMS FORFROSTIG SUBTEST 4 (POSITION IN SPACE)
Each of the three treatment groups scored well above the national sample
of their age peers and significantly above the group which received none of
i!
the program components. Contrary to our expectations, the paraprofessional and
mobile facility did not add linear or constant amounts to the learning which
{: took place from viewing the television program.
The summary of the three-way analysis of variance procedure which was
performed on Subtest 4 is presented in Table 5-12.
20

I
17
TABLE 5-12
SUMMARY OF ANALYSIS OF VARIANCE FOR FROSTIG SUBTEST 4
Source eta` D.F. Mean Square
I(trt) .108 3 13.82877956 7.74 P<.0005J(sex) .010 1 4.062976402 2.27K(age) .105 1 39.55301889 22.14 P4!..0005IJ-INT .021 3 2.439771335 1.43IK-INT .039 3 5.133064246 2.87 P<(.05JK-INT .000 1 0.0820025159 0.04IJKINT .013 3 1.554584917 0.87ERROR 150 1.786242165
The main effect of treatment which was evident from Figure 5-4 is
emphasized again in the ANOVA results. A post-hoc comparison revealed that
all three treatment groups scored significantly above the Control group in
respect to Subtest 4. We can assume that the factor which caused the
elevation in scores was associated with the television program, since the
other components did not produce noticeable increments in mean scores. It
is likely that the combination of teaching manual skills - such as drawing
and outlining - and the recognition of geometric shapes, both contributed
to the effect of Around the Bend on this subtest.
The main effect of age is constant throughout practically the entire
test battery, and can be considered almost inevitable on any measure depen-
dent on motor development or new experiences during. this age range.
An interaction effect of treatment and age is also present, favoring the
older children in the TV-HV and Package groups. This interaction is repre-
sented graphically in Figure 5-7. The paraprofessional was most likely more
effective in teaching the skills measured by Subtest 4 to the older children
whom she visited. ThiS is indicated by the difference for the home visitor
and Package groups actual scores when compared to their expected scores due to
increases in age only.
21

5 _
4 -
3_
2..
18
P=Package x
H=TV-HV x-- - --A
T=TV only u-
C=Control x. g
P
C
'
3 4
FIGURE 5-7
TREATMENT AGE INTERACTION ACROSS SEX(AVERAGED FOR MALE AND FEMALE) ON FROSTIG SUBTEST 4
22

(.7
19Frostig Subtest 5 (Spatial Relationships)
This section of the Frostig measur,s the ability to make:
The analysis of simple forms and patterns. These consist oflines of various length:: and angles which the child is requiredto copy, using dots as guide points.
8
Essentially, this task involves transposing a specific configuration
of lines onto a set of dots, a task which involves both motor coordination
and short-term memory for visual designs.
Scores for each age by sex cell within the four treatments are reflected
in the means, standard deviations, and numbers of subjects presented in
Table 5-13.
TABLE 5-13
FROSTIG SUBTEST 5 (SPATIAL RELATIONSHIPS)RAW SCORE MEANS, STANDARD DEVIATIONS, AND NUMBERS OF SUBJECTS
BY AGE AND SEX WITHIN TREATMENT GROUPS
Age Sex Package TV-HV TV only Control
x = .89 R = .78 x = .92 R = .62
M SD = .93 SD = .97 SD = .86 SD = .96
3 N = 9 N -., 9 N = 13 N = 13
R = .75 R = 1.00 x = .50 R = 1.08
F SD = 1.04 SD = 1.41 SD = .71 SD = 1.61
N = 8 N = 10 N = 10 N = 13
x = 2.00 x = 2.00 x = .63 x = 1.67
M SD = 1.73 SD = 1.85 SD = .74 SD = 1.87
4 N= 13 N= 8 N= 8 N= 9
R = 2.09 R = 2.00 51 = 1.62 x = 1.10
F SD= 1.51 SD = 1.70 SD = 1.61 SD = 1.45
N = 11 N = 10 N = 13 N = 10
These results produce the combined means, which are presented in
Taa-,le 5-14 for each of the four treatment %;roups and these data along with
the ,ge-equivalent group of the normative sample are given in Figure 5-8
p. 6.
23

3
2
1
0
20
TABLE 5-14
SUBTEST 5 MEAN RAW SCORES, STANDARD DEVIATIONS,AND SAMPLE SIZES FOR EACH TREATMENT GROUP
Package TV-HV TV only Control
R = 2.10 X=2.04 R = 1.65 R = 1.82SD = 1.34 SD = 1.48 SD = 1.05 SD = 1.23N = 40 N = 37 N = 44 N = 45
GroupFT--1
NationalMeans P Norms
2.10 2.00 2.04 1.85 1.65 1.84
FIGURE 5-8
RAW SCORE MEANS AND NATIONAL NORMS FORFROSTIG SUBTEST 5 (SPATIAL RELATIONSHIPS)
1.82 1.50
As is apparent from the above and proven by the ANOVA results, no
significant differences appeared between the four group means. However,
the fact that the TV only group continued its trend to lower scores in
comparison with the other treatments, is evidence for the existence of
small deficits in the area measured by Subtest 5.
24

21
Table 5-15 indicates the results of the ANOVA which was performed on
Subtest 5.
TABLE 5-15
ANALYSIS OF VARIANCE SUMMARY FOR FROSTIG SUBTEST 5
Source eta2 D.F. Mean Square
I(txt) .032 3 3.312763498 1.92J(sex) .000 1 0.0025454042 0.00K(age) .096 1 29.93948280 17.3 P<.0005IJ-INT .006 3 0.6342173558 0.37IK-INT .012 3 1.246202147 0.72JK-INT .002 1 0.5834185059 0.34IJKINT .019 3 1.977176031 1.14ERROR 150 1.729289951
The only significant F-ratio which was evident from the ANOVA results
was that for age, which was expected for the aatire test battery. No other
main or interaction effects were revealed by the ANOVA.
Frostig Total Raw Score
As a total instrument, the Frcstig measures overall perceptual level as
well as the ability to recall and transform visual configurations. It also
gives an indication of the child's motor development as reflected by his
hand-eye coordination.
Total Frostig raw scores are presented in Table 5-16.
25

22
TABLE 5-16
FROSTIG TOTAL RAW SCORE MEANS,STANDARD DEVIATIONS, AND NUMBERS OF SUBJECTS
BY AGE AND SEX WITHIN TREATMENT GROUPS
Age Sex Package TV-HV TV only Control
R = 20.88 R = 19.78 R = 21.00 R = 14.85M SD = 9.25 SD = 11.66 SD = 14.14 SD = 9.41
3 N= 8 N= 9 N= 13 N= 13
R = 18.25 R = 28.30 R = 16.10 R = 15.38F SD = 13.59 SD = 9.94 SD = 8.94 SD = 9.60
N = 8 N = 10 N = 10 N = 13
R = 32.31 R = 44.63 R = 25.38 R = 23.44M SD = 11.18 SD = 11.75 SD = 14.14 SD = 12.87
4 N= 13 N= 8 N= 8 N = 9
R = 31.18 ii = 32.10 R = 29.92 R = 29.60F SD = 12.89 SD = 14.31 SD = 14.25 SD = 11.86
N = 11 N = 10 N = 13 N = 10
The extreme jump between age levels provides good evidence for the face
validity of this test, but such a consistent pattern is not evident for male-
female contrasts. Generally, males outscore females in the ECE Program groups,
but score slightly lower than the females in the Control group. The total
scores are combined within treatment groups in Table 5-17, and Figure 5-9
presents a graphical depiction of these combined scores for each treatment
group, along with mean scores from the normative age-group sample.
TABLE 5-17
TOTAL SCORES COMBINED WITHIN TREATMENT GROUPS
Package TV-HV TV only Control
R = 26.90 R = 31.05 R = 23.31 R = 20.08SD = 12.93 SD = 14.01 SD = 13.76 SD = 11.95N = 40 N = 37 N = 44 N = 40
2.1.

40
30
20
10
23
Group NationalMeans Nom
26 90 20 00 31.35 18.35 23.31 18.34 20.08 15.60Package TV-HV TV only Control
FIGURE 5-9
RAW SCORE MEANS AND NATIONAL NORMSFOR THE FROSTIG TOTAL SCORES
Figure 5-9 illustrates the fairly large differences between the three
program groups and the Control group, both in respect to inter-treatment
differences, and also in contrast with the national norms. Of particular
interest is the elevation of the total score of the TV-HV group and its
relation to the other scores, and the norms for this age.
The ANOVA summary presented in Table 5-18 provides statistical valida-
tion for the trends which are already apparent in the above data. A Scheffe
post-hoc comparison shows that the TV-HV group differed significantly from
the TVonly and Control groups. It seems possible that the paraprofessionals
in the TV-HV group expend more effort with "their" children than they do
with children who visit the van and have an advantage in learning experience.
27

1_ 24
TABLE 5-18
I..
1.._
1._
First, the total test score presumably reflects some developmental
factor (P.0005) since a main effect of age was very likely present.
i_.
This age effect was constant throughout the entire group of Frostig
6ubtests, indicating that the range of factors measured by the instrument
[ did indeed show a maturation effect.
Also, an age by sex by treatment interaction effect was present (PK.05),
L. which made interpretation of main effects more difficult than would ordinarily
ANALYSIS OF VARIANCE SUMMARY - FROSTIG TOTAL RAW SCORE
Source eta2 D.F. Mean Square F P
I(trt)J(sex)
K(age)IJ-INTIK-INTJK-INTIJKINTERROR
.080
.000
.175
.007
.004
.000
.040
3
1
1
3
3
1
3
150
815.72467723.0706505265367.32576975.8991724237.719366638.473664112409.6338903141.7155088
5.760.0237.870.54
0.270.062.89
P<.001
P<.0005
P<.05
be the case. It is interesting to note that the four year old males' mean
raw score total in the TV-HV group was 44.63, which placed them far ahead
of their age peers in visual-motor development. Figures 5-10 and 5-11
illustrates this interaction of treatment age and sex graphically. For
_) both males and females, the Control group scored below the three treatment
groups and well below those two groups who received visits from the pare-
professional. Figure 5-11 indicates that among three year old male subjects
the program had the equivalent effect of a year's maturation. The home
visitor seems to be interacting differentially with female subject and
does not seem to produce a pattern of gains for females which are as large
28

Total Raw
Score Mean
40 1
30,
20
10
/
/H
/
Age
34
Male
FIGURE 5-10
Total Raw
Score Mean
40
30 -1
20 -
10
H x----
Age
34
Female
SIGNIFICANT TREATMENT-AGE-SEX INTERACTION ON THE OVERALL FROSTIG TEST

Total RawScore Mean
40
30
20
10
11
M4
M3 e
F3*
M4
k
F4...Its".
F3
/
M3
F4
`M4-
M3
F3
k F4
F3
M3
Package TV-HV TV only Control
FIGURE 5-11
SEX-TREATMENT INTERACTION WITHINAGE GROUP ON THE OVERALL FROSTIG TEST
30
26

s
27
as those for males. The TV-HV group showed the largest sex differences in
overall Frostig raw scores and the Package group showed the smallest sex
differences.
The main effect of treatment is indicative of the emphasis which was
placed on artistic and graphic activities throughout the course of the year's
television programming. Children were constantly encouraged by the television
teacher to draw with brushes, crayons, and other art materials. The high
degree of child- teacher involvement which existed during the program made it
more likely that the child would respond overtly to suggestions to try these
activities. Thus, the activities of drawing, outlining, and copying figures,
along with the related visual memory tasks which were taught on Around the Bend
and reinforced by the paraprofessional, seems to have a positive effect on
the child's ability to perceive, remember, and reproduce visual configurations.
In several of the tasks, the paraprofessional added to the effect of the
television program on the areas measured by the Frostig. There was no sub-
stantial additive effect of the mobile facility in the area of psychomotor
functioning, which may well be due to the limited amount of time available
for individual treatment from the van.
Essentially, then, the television program and paraprofessional are
potentially very effective means for encouraging the child's visual-
perceptual level and motor coordination as it relates to his visual field.
31