document resume ce 044 537 - eric · 2014-03-18 · document resume ed 270 594 ce 044 537 title...
TRANSCRIPT

DOCUMENT RESUME
ED 270 594 CE 044 537
TITLE Project 2000. Job and Training Opportunities forMinorities and Women.
INSTITUTION Equal Employment Opportunity Commission, Washington,D.C.
PUB DATE (86]NOTE 350p.PUB TYPE Statistical Data (110) Reports
Research /Technical (143)
EDRS PRICE MF01/PC14 Plus Postage.DESCRIPTORS *Demand Occupations; Employment Opportunities;
*Employment Projections; *Females; *Labor Market;*Minority Groups; *Technological Advancement
IDENTIFIERS *Project 2000
ABSTRACTThis study provides legislators, educators, community
organizations, training program specialists, and civil rights groupswith data on the position of minorities and women in the work force.Part I considers where the jobs are in terms of designated highgrowth, high technology, and high loss occupations in tha nextdecade. Chapter One discusses factors influencing employmentopportunities in the 1980s. Chapter Two describes the scope ofresearch of Project 2000. Chapter Three highlights Project 2000 dataon areas of projected growth with focus on minorities and women.Chapter Four is a national overview of 1980 labor force participationby occupation. Chapter Five analyzes 1980 employment in the five mostpopulous states: California, New York, Texas, Illinois, andPennsylvania. Each state section includes analyses of minority andfemale participation in the state's civilian labor force; highgrowth, high technology, and high loss participation by minoritiesand women in 1980; and participation of women and minorities in thetop five high growth and top three high loss and high techoccupations in 1980. Part II focuses on meeting occupational demands.Chapter Six provides information on training, educational, and otherrequirements for entry into the Project 2000 high growth and hightechnology occupations. Descriptions of the 20 high growth and 10high technology occupations include job responsibilities, salarylevels, and sources for additional information. Chapter Sevenprovides descriptions and addresses of current job training andeducation programs for employment. Numerous data tables and figuresare provided. (YLB)
******+***************************************************************** Reproductions supplied by EDRS are the best that can be made *
* from the original document. *
***********************************************************************

U.S. DEPARTMENT OF EDUCATIONof Education s/ R11111=11 and Improvement
TIONAL RESOURCES INFORMATIONCENTER (ERIC)
This document has boon reproduced aswaved from the person or organizationoriginating it
13 Minor changes haw boon mad to improvereproduction quality
Pa its of vow or opinions stated on this domumint do not ammo* roprosnt officialOERI position or policy
Job and TrainingOpportunities for
Minoritiesand Women

Project 2000Job and Training Opportunities for Minorities and Women
.., .,,,.
x
U.S. Equal Employment Opportunity CommissionWashington, D.C. 20507
81 i0 to$A #
414/ 114T V 00
3

ii
The Commission
Clarence ThomasChairman
Tony E. GallegosCommissioner
William A. WebbCommissioner
Frec1W. AlvarezCommissioner
R. Gaull SilbermanCommissioner
4

iii
PREFACE
Twenty years ago, Congress accomplished what many thought was impossiblepassage of Title VII of the Civil Rights Act of 1964 and the establishment of the EqualEmployment Opportunity Commission. Those who forged the consensus which ledto this nation's enduring commitment to the principle of equal employment opportu-nity knew that they were making history. In more than 80 days of debate in the Senate,20 days of debate in the House Judiciary Committee, and six days of debate on thefloor of the House of Representatives, members of Congress carefully spelled out thereasons that prompted the passage of Title VII and the establishment of the Equal Em-ployment Opportunity Commission.
In the Senate, Senator Hubert H. Humphrey explained that the "crux of the problem[facing Congress] is to open employment opportunities for [black Americans] in occu-pations which have been traditionally closed to them." Other senators reminded Con-gress that before 1964, many black Americans had been relegated to "unskilled andsemi-skilled jobs" and that due to automation, the number of such jobs was decl in i ng.2
Finally, members of Congress were well aware that unless black Americans wereable to secure jobs "which have a future," the civil and political rights conferred bythe Declaration of Independence and the Constitution would be meaningless. In re-sponse to these concerns, Congress enacted Title VII, which is designed to "assureequality of opportunities and to eliminate those practices and devices which have fos-tered racially stratified job environments to the disadvantage of minority citizens."'
Eight years later, Congress amended Title VII and strengthened the powers of theEqual Employment Opportunity Commission because it found that black Americanswere still "concentrated in the lower-paying, less prestigious positions in industry andare largely precluded from advancement to the higher paid, more prestigious posi-tions."' Additionally, Congress found that the plight of black Americans was sharedby members of other minority groups as well as women. In the case of Hispanics, Con-gress found that "[b]oth male and female Spanish-speaking workers, as has alreadybeen shown to be the case with [black Americans], are also concentrated in the lower-paying oc:upations." Similarly, in the case of women, Congress found that "despiteth[e] large increase in the numbers of women in the work force, women continue tobe relegated to low paying positions and are precluded from higher paying executivepositions."6
Concern for the social and economic problems of black Americans, women, His-panics and other minority groups enabled this nation to take a new roada roadwhich leads to equal employment opportunity for all individuals in this nation. Thoseconcerns are as relevant today as they were twenty years ago.
Today, with the advent of the twentieth anniversary of Title VII and the Equal Em-ployment Opportunity Commission, and the approach of the Year 2000, it is fittingthat we peer into the future to determine if minorities and women will have jobs"which have a future." Accordingly, in exercise of our power "to make . . . technicalstudies [which] effectuate the purpose and policies of . . . [TJitle [VII]," the Commis-sion has prepared this study which renews our national commitment to equal employ-
5

iv
ment opportunity by examining how minorities and women participate in the laborforce. and where future job opportunities will occur.
Finally, I wish to acknowledge a few of the many individuals who contributed tothe development of this project: James R. Paul, Project Director; Doris Werwie,Ph.D., Deputy Director; Nancy E. Fitch, Ph.D., Historian; Pamela Toutant, SeniorResearch Analyst; Margorie Scilken-Friedman, Ph.D., Researcher; Chris Doherty,Consultant, U.S. Department of Labor; Jayne G. Benz and James D. Spellman, ProjectEditors; E. LaVerne Edwards, Project Secretary. Together, they provided the centraleffort behind this important study.
Clarence ThomasChairmanEqual Employment Opportunity Commission
6

v
Endnotes to the Preface
1. U.S. Congress, Senate. Senator Humphrey speaking for Title VII, describing the EEOC, 88thCong., 1st. sess., March 30, 1964. Congressional Record vol. 110, p.6548.
2. Ibid., p. 7204.
3. U.S., Supreme Court. McDonnell Douglas Corp. v. Green, 1973, vol. 411, p.792.
4. U.S., Congress, Senate. Equal Oppprtunity Act of 1971, S. Rept. 92-415, 92d Cong., 1st sess.,1971, p. 5.
5. Ibid., p. 7.
6. Ibid.
7. Title VII, section 705 [0[5), 42 U.S. Code: 2000(e)-4 (g) )5).
7

vi
Table of Contents
Preface iii
Table of Contents vi
List of Figures and Tables xi
Introduction and Purpose xv
Part IWhere the Jobs Are:
Designated High Growth, High Tech andHigh Loss Occupations in the Next Decade
Chapter One
Factors Influencing Employment Cpportunitiesin the 1980s 1
Demographic Characteristics 1
The Role of Women in the Labor Force 3Shift from a Manufacturing-Based to a Services-Based Economy 3
Post Industrial Society Theory 5
Dual Labor Market Theory 5
Influence of Technology 7
The Differential Effect of Unemployment on Minorities and Women 7
Education 9
Endnotes 10Selected Bibliography 11
Chapter Two
Scope of Research 13
Occupation Versus Industr Analysis 13
Research Methodolo, 13

VII
High Growth, High Tech and High Loss Selection Criteria 14
Utilization of BLS Projection Rates and 1980 Census Data 14
Limitations of BLS Projection Data 15
Occupations Included in the Study 16
Twenty Most Populous High Growth Occupations 16
Ten Most Populous High Tech Occupations 16
Nine Most Populous High Loss Occupations 17
Additional Occupations 17
End notes 18
Chapter Three
Project 2000 Major Findings 19
1980 Civilian Labor Force: High Growth, High Tech,and High Loss Occupations 19
High Growth Occupations 25
Civilian Labor Force 25
Overview: Minorities and Women 25
1. Minorities 262. Women 27
Geographic Distribution 28Educational and Skill Requirements 28
High Tech Occupations 30
Civilian Labor Force 30Overview: Minorities and Women 31
1. tv;inorizies 31
. 2. Women , _
Geographic Distribution 34Educational and Skill Requirements 34
High Loss Occupations 34
Civilian Labor Force 34Overview: Minorities and Women 35
1. Minorities 35
2. Women 36Geographic Distribution 37
9

via
Chapter FourNational Overview: 1980 Participation by Occupation 45
High Growth Occupations 45
High Tech Occupations 48
High Loss Occupations 50
Chapter FiveThe Five Most Populous States 73
Table Index 73
How to Calculate Projected 1990 Net Gains or Losses 74
High Growth 74
High Tech 75
High Loss 75
California (Each state section contains the following analyses) 76
Analysis of the Participation of Women and Minoritiesin State's Civilian Labor ForceAnalysis of the Participation of Women and Minoritiesin the High Growth, High Loss and High Tech Categories in 1980
An Occupation-by-Occupation Analysisof the Participation of Women and Minoritiesin the top five High Growth, and top three High Lossand High Tech Occupations in 1980
New York 107
Texas 138
Illinois 169
Pennsylvania 200
Part IIOutlook: Meeting Occupational Demands
In a Changing lob Market
Introduction 232
Chapter SixOccupational Requirements: An Overviewof CurrentSkills and Education Needed to Enter Project 2000High Growth and High Tech bbs 233
Ii)

ix
High Growth Occupations 234High Tech Occupations 257
Chapter Seven
Educating for the Future: An Overview of Educationaland Training Programs 267
Introduction
The Direction of Public Education 267Business and Industry Initiatives 268Public Education Initiatives 269Private Sector Initiatives 269The Programs 269
Training and Education for Employment:Selected Types of Programs 271
High Growth Programs 274
Action for Boston Community Development, Inc./Shawmut Bank of Boston and the Bank of New England 274Culinary Arts Training Programof the D.C. Public Schools 274Elliott Training Center 275The Private Industry Council of New York City 275
1. American Stock Exchange Program 2762. New York Telephone Company
Customer Service Training Program 2763. Securities Operations Clerk Training Program 276
United Planning OrganizationBank Teller Training Program 277University of Lowell/Wang Laboratories;J. D. MacDonald & Co.;Armand Donati Company International, Inc. 277Progressive Word Processing Training Center 278
Nurse's Aide Program 278Washington (D.C.) Urban Leag:ieWord Processing Training Center 278
High Tech Programs 279
Chinese-American Civic Association;the Honeywell Corporation 279
RETC Microelectronics Training Center 279
The San Diego County Technical Training Center, Inc. 280
Technical Exchange Center 280
Women's Technical Institute 28
11

x
State and Regional Programs for Economic Developmentand Employment Training 282
Arizona Industry Training Services Unit 282Bay State Skills Corporation 283Broward County School System;Industry Cooperative Nanning and Programming 284California Worksite Education and Training Act 285Minnesota Wellspring 285Proposed Texas Work Skills Education and Training Act 286"Quick Start" Program of the Georgia Department of Education,Office of Vocationa! Education 287
Additional State and Regional Programs 287
I. Center for Innovative Technology 2872. Council of Great Lakes Governors 2883. Industrial Technology Institute 2884. Microelectronics and Computer Technology Corporation 2885. The Molecular Biology Institute 2896. Northeast-Midwest Congressional Coalition 289
Programs for Minorities, Women, Youth and Older Workers 289
Career Opportunities Project of the Atlanta Urban League, Inc 289Downriver Community Conference Economic Readjustment Activity 290The Greater New York Council/Boy Scouts of AmericaTraining Program 291
Jobs for America's Graduates, Inc. 291
Jobs For Youth, Inc. 292The Midwest Women's Center 294Opportunities Industrialization Centers of America, Inc. 294Project Discovery 296SER-Jobs for Progress, Inc. 296Florida A & M School of Business and Industry 297Howard University Summer Actuarial Institute 297Inroads 298LEAD (Leadership, Education and Development)Program in Business, Inc 299The League of National Educational Service Centers, Inc.of the League of United Latin American Citizens 300
Mathematics, Engineering, Science Achievement 301
Multicultural Career Intern Program 302
The North Carolina School of Science and Mathematics 303
Technical Scholar Program 304
Other Programs of Interest 305
Career Merit Achievement Plan 305
I2

Xi
Community College of Allegheny County lob Task AnalysisApproach to Crosstraining Displaced Skilled Workers 305
The Corporation for Public/Private Ventures 306
Ventures in Community Improvements 307
Marie Reed Employment Support Network 307
Massachusetts High Technology Council 308
National Youth Employment Coalition 309
Opportunities Academy of Management Training, Inc. 309
List of Figures and Tables
Chapter One
Figure 1.1 Labor Force Composition, 1975 to 1990Percentage Distribution by Race, Sex and Age 2
Figure 1.2 Wages of Services vs. Manufacturing Employees,1965-1980 4
Figure 1.3 Economically Active Population by Occupation,1910-1960 6
Figure 1.4 Unemployment in Terms of Specific Occupationsin 1982 8
Chapter Two
Figure 2.1 Professional jobs: Number Employed in 1978and Projected Rates of Changebetween 1978 and 1990 17
Chapter Three
Figure 3.1 1980 Representation of Minoritiesby Occupation Group 21
Figure 3.2 1980 Representation of Womenby Occupation Group 22
13
xii
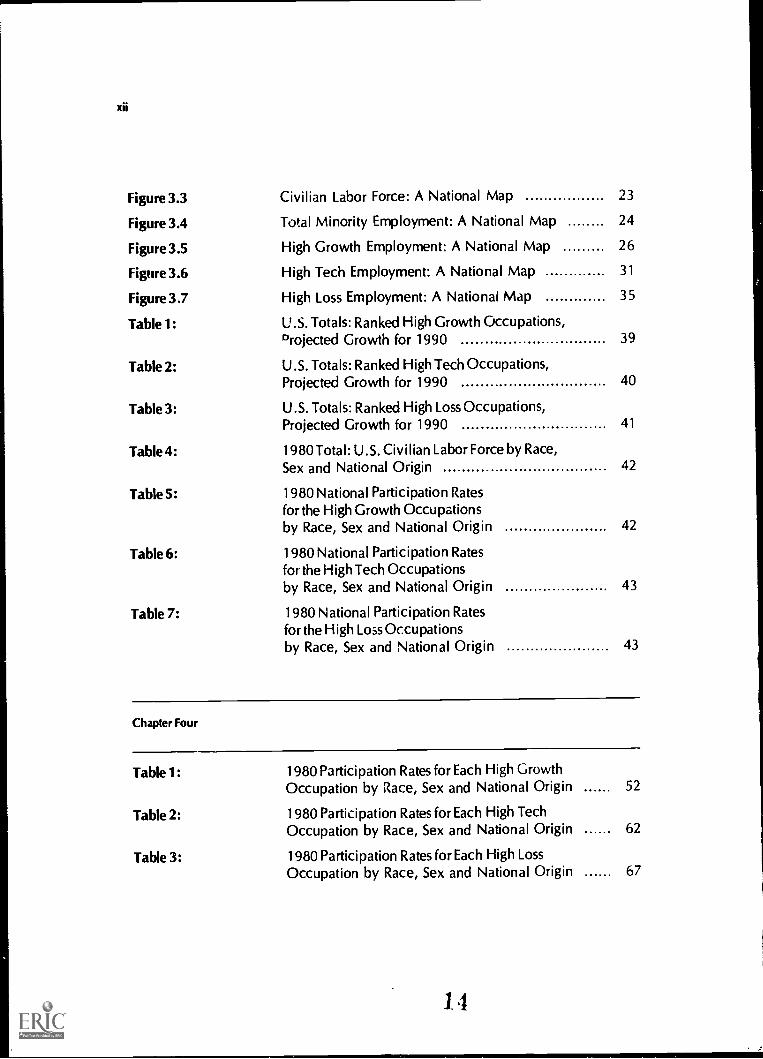
Figure 3.3 Civilian Labor Force: A National Map 23
Figure 3.4 Total Minority Employment: A National Map 24
Figure 3.5 High Growth Employment: A National Map 26
Figure 3.6 High Tech Employment: A National Map 31
Figure 3.7 High Loss Employment: A National Map 35
Table 1: U.S. Totals: Ranked High Growth Occupations,Drojected Growth for 1990 39
Table 2: U.S. Totals: Ranked High Tech Occupations,Projected Growth for 1990 40
Table 3: U.S. Totals: Ranked High Loss Occupations,Projected Growth for 1990 41
Table 4: 1980 Total: U.S. Civilian Labor Force by Race,Sex and National Origin 42
Table 5: 1980 National Participation Ratesfor the High Growth Occupationsby Race, Sex and National Origin
Table 6: 1980 National Participation Ratesfor the High Tech Occupationsby Race, Sex and National Origin
Table 7: 1980 National Participation Ratesfor the High Loss Occupationsby Race, Sex and National Origin
42
43
43
Chapter Four
Table 1: 1980 Participation Rates for Each High GrowthOccupation by Race, Sex and National Origin 52
Table 2: 1980 Participation Rates for Each High TechOccupation by Race, Sex and National Origin 62
Table 3: 1980 Participation Rates for Each High LossOccupation by Race, Sex and National Origin 67
1,1

XIII
Chapter Five
A set of the following tables is included for each state: California, New York, Texas,Illinois and Pennsylvania
Table 1: State Totals: High Growth Occupations
Table 2: State Totals: High Tech Occupations
Table 3: State Totals: High Loss Occupations
Table 4: Total Employed Civilian Labor Force in 1980 in that State
Table 4.5: Total Employed Civilian Labor Force in 1980 NationwideTable 5: State Aggregate for Minorities and Women: 1980 Participa-
tion Rates for the High Growth Occupations by Race, Sexand National Origin
Table 6: 1980 Participation Rates for Each High Growth Occupationby Race, Sex and National Origin
Table 7: State Aggregate for Minorities and Women: 1980 Participa-tion Rates for the High Tech Occupations by Race, Sex andNational Origin
Table 8: 1980 Participation Rates for Each High Tech Occupation byRace, Sex and National Origin
Table 9: State Aggregate for Minorities and Women: 1980 Participa-tion Rates for the High Loss Occupations by Race, Sex andNational Origin
Table 10: 1980 Participation Rates for Each High Loss Occupation byRace, Sex and National Origin
15

XV
INTRODUCTION AND PURPOSE
This country's current employment problems are not solely the result of the mostrecent recession. High unemployment and layoffs are a growing consequence oflong-term changes in our economy. Demographic changes within the civilian workforce, especially the greater participation of women, the shift from a manufacturingto a services-based economy, widespread technological advances, the export ofgoods production, and an increasing need for a highly skilled and well trained workforce have all influenced the present job market. These factors will continue to shapejob opportunities into the 1990s, presenting new dimensions to the problems of equalemployment opportunity in the workplace.
The current variety of change in the economy will substantially affect the composi-tion and requirements of the job market. Many workers will find their jobs to be obso-lete or lacking in stability as different skills become necessary to enter new jobs andperform old ones. Equal employment opportunity will depend on access to the train-ing and education needed to qualify for and-perform jobs, as well as the continuedlegal efforts to remove traditional discriminatory barriers to hiring.
The purpose of this study is to provide legiShtors, educators, community organiz-ers, training program specialists, civil rights groups ficl others with concrete data onthe position of minorities and women in the work foree,',$pthat employment, train ing/retraining and educational strategies can be established to meet the growing needsof workers and employers. .. ,, ..,The results of this research will be beneficial to the following groups:
Civil Rights Groups
,/ can utilize national and state projections for High Growth and High Tech occupa-tions to monitor and evaluate employment and training legislation .
,/ can use the information on training and qualifications to focus training projects andtarget job placement efforts.
Training Organizations (e.g. 0/c SER-Jobs for Progress,Midwest Women's Center)
,/ can use the information on successful training programs as models for establishingnew programs.
,/ can use the national and state data to target those occupations where growth hasbeen established and will occur.
Educators (national, state and community)
,/ can use the current data on national and state occupational trends to develop pol-icy strategies for ech ,cation.
,/ can use the projections, training programs and qualifications to assist students inaccurately assessing their career options.
16

xvi
State Departments of Labor/Departments ofEducation
,/ can utilize state -uy -state projections to do state and regional job projections for
1990 based upon the Census data provided.,/ can use data for regional economic development planning.
National, State and Local Government
I can use the current employment trends reported on a national and state-by-statebasis in developing policies and evaluating their possible impact, particularly on
minorities and women.
1'1

Where the Jobs Are:Designated High Growth, High Tech, and High Loss Occupations inthe Next Decade
I s

Demographic Characteristics
Population shifts throughout the 1980s will affect the composition of the 1990s'work force. Although Census Bureau estimates indicate a U.S. population growth rateincrease of only 0.89 percent in the 1980s, aging of the "babyboom" generation willcause an increase in the number of persons between the ages of 25 and 44, and adecrease in the 16 to 24 population.' These population shifts will mean greater com-petition among middle-aged persons for mid-career jobs, and a decline in the numberof persons who have traditionally filled most entry-level positions.
According to the Bureau of Labor Statistics, these population shifts are projectedto have the following impact on labor force growth: (see Figure 1.1)
The participation of white males between the ages of 16 and 24 is ex-pected to decline from 12 to 18 percent between 1975 and 1990, whilethe participation for those between 25 and 54 years of age is expected toincrease from 33 to 34 percent. White males 55 and over are projected toexperience a participation decrease of 3 percent, with most of this decreasebeing absorbed by minorities and women. The overall anticipated effectwill be a 6 percent decrease in the nonminority male work force between1975 and 1990.
The work force participation rate for nonminority women during thissame period is projected to increase 4 percent; with an increase of 1 percentin the 25 to 54 category, and a 2 percent decrease in the 16 to 24 group,and a 1 percent decline in the 55 and over group. Black males and othersare expected to experience a total increased participation of 1 percent, withall growth occurring in the 25 to 54 age group. Likewise, black women andothers are anticipated to experience their 2 percent participation increasein the middle-age category.
19
BEST COPY AVAILABLE

2 Project 2000
Figure 1,1Labor Force Composition, 1975 to 1990Percentage Distribution by Race, Sex and Age
Race, Sex and AgeActual Projected Low Growth1975 1990
Nonminority
Male
Female
(54%) (48%)
16-24 12% 8%
25-54 33% 34%
55+ 9% 6%
(35%) (39%)
16-24 10% 8%
25-54 20% 27%
55+ 5% 4%
Black and Other
Male
Female
( 6%) ( 7%)16-24 1% 1%
25-54 4% 5%
55+ 1% 1%
( 5%) ( 7%)16-24 1% 1%
25-54 3% 5%
55+ 1% 1%
Source: Howard N. Fullerton, The 1990 Labor Force: A First Look" in Economic Projections to 1990,ed. U.S. Department of Labor, Bureau of Labor Statistics (Washington, D.C.: GovernmentPrinting Office, 1982), Table 5.
20

Factors Influencing Employment Opportunities in the 1980s 3
The Role of Women in the Civilian Labor Force
According to labor economist Robert W. Bednarzik, women composed 42.6 per-cent of the civilian labor force in 1980 (44 million participants). These figures indi-cated an increase of participation despite the recent recession. Bednarzik noted thatmost women were employed in the services-producing sector, which tends to be lessresponsive to cyclical movements in the economy than the manufacturing industries.'
Although women have experienced increased participation in the civilian laborforce, research indicates that segregation by sex is still prevalent. Nancy Rytina, inthe April 1982 issue of the Monthly Labor Review, explored occupational segregationby sex using the Current Population Survey to analyze wage differentials between menand women. Rytina concluded that male employment was concentrated within thehigher-paying occupations such as management, administrative and technical work,and various craft occupations. Female employment, in constrast, was concentratedin the lower-paying areas such as clerical and service occupations. These statisticsalso indicated that full-time Working women earned a median weekly salary of $224in 1981; 64.5 percent of the men's median weekly salary of $347. A comparison ofthese ratios between 1967 and 1981 indicates an increase of only 2.5 percent.'
Shift From a Manufacturing-Based to aServices-Based Economy
The current economic situation of unemployment and layoffs has prompted a re-examination of shifts within the U.S. labor force ir an effort to develop effective poli-cies to remedy these problems. The civilian labor force, which is made up of all per-sons between 16 and 65 years of age who are currently employed or looking for ajob, is expected to increase by 17 percent (to about 122 million persons) by 1990.It is projected that the service industries will receive the greatest portion of this in-crease.' Between 1980 and 1990, service industrieswhich include such businessesas hotels, restaurants, hospitals, business services, and cleaning servicesare ex-pected to increase from 65.7 million to 78 million workers between 1980 and 1990.5
One of the main problems with the transition to a services-based economy is thatsalaries of service workers are traditionally lower than those of employees in the man-ufacturing industries. A comparison of the average annual salary of service workerswith that of those employed in manufacturing occupations, between 1965 and 1980,indicates that the gap in salaries has been increasing steadily (see Figure 1.2). The av-erage weekly salary in the manufacturing occupations in 1965 was $107.53, com-pared to $73.60 in the services occupations. By 1980, the average weekly manufac-turing salary was $288, compared to $190 in the services. The salary gap betweenthe two groups had increased from $34 to $98 over the 15 year period.
The need to examine and understand shifts within the labor force has prompted arenewed interest in such theories as post industrial society 6 and dual labor markettheory.' The theories are useful in analyzing the data presented in this study. Manyresearchers (such as Daniel Bell, Harry Braverman, Victor R. Fuchs, C. Wright Mills,and Valerie Oppenheimer)8 have anticipated the transition from a manufacturing-
21

4 Project 2000
WAGES OF SERVICE VS. MANUFACTURINGEMPLOYEES 1965-1980
(AVERAGE WEEKLY WAGE IN DOLLARS)WeEKWAf3E SI JM
FIGURE 1.2
lees 1970YEAR
LEGEND : TYPE
In SERVICE
I-1 MANUFACTURING
SOURCE : EMPLOYMENT AND EARNINGS, BLS/DOL
22
1975 1980

Factors Influencing Employment Opportunities in the 1980s 5
based to a services-based economy for many years. Their studies have indicated thatthe portion of the labor force composed of service occupations has grown steadilyfrom 1910 to 1960. Figure 1.3 contrasts the steady increase of service and clericalworkers, with the drastic decline in farm workers and the gradual decline in manufac-turing occupations since 1950 (see Figure 1.3).
Post-Industrial Society Theory
Daniel Bell defines a post-industrial society as one in which services rather thangoods are the primary products. The post-indt: -trial economy does not completelydisplace the industrial; the balance of production is merely shifted from one sectorto the other.
Bel: observed that future growth occupations were located in what he called theservices-producing sector, which includes the .. *ng four areas:
Business Services:Banking and finance; real estate; insurance carriers, agents and brokers; securitiesdealers; audit agencies.Personal Services:Retail trade (including general merchandise, food, apparel and accessories, andfurniture and appliances stores; eating and drinking establishments); laundry; ga-rages; beauty shops; advertising; motion pictures; hotels and lodging; other recre-ation.Transportation, Public Utilities and Communities;Railroad, air, motor freight and passenger transportation operators; radio, televis-ion and telephone workers; electrical, gas and oil companies; the technical supportstaff in each of these industries.Health, Education, Research and Government:Hospitals and related medical services; colleges and universities, research organi-zations; Federal, state and local government employees.All but three of the top 20 most populous high growth occupations identified by
the Bureau of Labor Statistics'° and used in this research study would be consideredpart of the services producing sector as defined by Bell.
Dual Labor Market Theory
Dual labor market theorists view the U.S. labor market as divided into two sectors:primary and secor 4ary." Primary sector jobs offer relatively higher wages, goodworking conditions, a,d employment stability. Secondary sector jobs tend to be lowerpaying, with poor working conditions, little chance for advancement, considerableinstability, and higher turnover rates.
The primary sector is further divided into two tiers. The upper tier is distinguishedfrom the lower tier by higher pay, greater status, and more opportunity for promotion.Upper tier jobs often have specific educational requirements, while lower tier occu-pations frequently require only on-the- job training, and emphasize basic skills.
23

EMPL.EVE1-1 I 000
10000
0000
0000
7000
0000
ROOS
4000
3000
2000
1000
0
ECONOMICALLY ACTIVE POPULATION BY OCCUPATION 1910-1960(IN THOUSANDS OF PERSONS)
1910
FIGURE 1.3
1020
LEGEND :
1030YEAR
CLERICAL
FARMERS
1040 1950
LABORERS/OPERATIVES
SERVICE/SALES
......mi1000
2 5

Factors IntIL.-ncing Employment Opportunities in the I 980s 7
Influence of Technology
There is widespread agreement that the new micro-technology, with its informationand communications potential, is causing changes in t'e work force, perhaps morepervasive than those caused by the industrial revolution. There is less agreement,however, about whether this new technology will create millions of new jobs or resultin plant shutdowns, the replacement of human workers with robots, and a decreasein the growth of traditional skilled jobs.
Great debate exists over which occupations should be classified as High Tech, andthe extent of growth these occupations will experience. Studies have indicated thatHigh Tech industries produce a relatively small portion of all new jobs. It is interestingto note, however, that they do provide a significant portion of new jobs in some states.Six out of ten High Tech jobs designated by Project 2000 are located in the ten mostpopulous states.'2
The Differential Effect of Unemploymenton Minorities and Women
The differential effect of unemployment on minorities and women indicates the in-creasing importance of refarch in areas of future high growth occupations. Un-employment is usually characterized by both layoffs and permanent separations. Pre-sent data shows that the greater proportion of the increase in unemployment duringthe -ecent recession can be attributed to permanent separation rather than to layoffs.The occupations experiencing the highest percentage rates of permanent separationin 1982 were: blue collar workers (54.8 percent), operatorsother than transporta-tion equipment(20.3 percent), and craft workers (16.7 percent).
Minorities and women composed a disproportionately large percentage of desig-nated high growth occupation permanent separations in 1982 (see Figure 1.4). Blackand other workers composed the significant portion of these separations, with trans-portation equipment operators, nonfarm laborers, and craft workers experiencing thehighest incidences of unemployment. Female workers experienced the greatest likeli-hood of separation in the craft, management and administrative occupations.
26

Figure 1.4Unemployment in Terms of Specific Occupations in 1982
Total PermanentSeparationOccupation Number
Permanent Separations% of Total Unemployed
%Women
% UnemployedBlack and Others
Combined
White-Collar Workers 1,181,000 28.5 38.2 43.1
Professional & Technical Workers 253,000 6.1 35.0 47.2
Managers and Administrators 214,000 5.2 46.4 52.0
Clerical Workers 548,000 13.2 38.4 42.5
Sales Workers 166,000 4.0 34.9 33.3
Blue-Collar Workers 2,269,000 54.8 35.2 53.1
Craftworkers 69.,, )00 16.7 42.0 56.4
Operators, Except Transportation 841,000 20.3 34.7 47.9
Transportation Equipment Operators 225,000 5.4 31.0 62.7
Nonfarm Laborers 510,000 12.3 35.2 56.9
Service Workers 615,000 14.9 31.5 42.7
Farm Workers 77,000 1.9 35.7 40.5
Source: Robert W. Bednarztk, "Layoffs and Permanent Job Losses. Workers' Traits and Cyclical Patterns," Monthly Labor Review 106 (September 1983), pp. 6-7
21 23

Factors Influencing Employment Opportunities in the 1980s 9
Education
According to C. Wright Mills, American educators during the 1930s adapted theircurricula to provide students with the vocational skills necessary to fill jobs in man-ufacturing industries." Today, however, students are increasingly ill-prepared tomeet the challenges of the work place.
Shifts in the labor force and economy pose several questions for the current direc-tion of American education:
,/ Has the quality of education diminished in terms of providing students with thebasic skills needed to compete?
,/ Is the key to the problem that children are no longer being prepared for new jobsand the changing requirements for old ones?
,/ Have the overall minimum educational requirements become insufficient for the1980s and 1990s technology that is transforming the industrial and service sectors?
Many training/educational programs have been developed by both the private andpublic sectors in the attempt to upgrade the educational skills of the U.S. labor force,and provide a solution to current economic and employment dilemmas. Chapterseven of this study provides examples of some successful joint ventures between theprivate and public sectors. However, additional research must be conducted to fullyaddress some of these concerns and aid in the development of further programs.
29

10 Project 2000
Endnotes to Chapter One
1. U.S., Department of Labor, Bureau of Labor Statistics, Occupational Outlook Handbook-1982-83 Edition (Washington, D.C.: Government Printing Office, 1982), p.13.
2. Robert W. Bednarzik, Mariiiyn A. Hewson and Michael A. Urquhart, "The Employment Situa-tion in 1981: New Recession Takes its Toll," Monthly Labor Review 105 (March 1982), p. 8.
3. Nancy F. Rytina, "Earnings of Men and Women: A Look at Specific Occupations," MonthlyLabor Review105 (April 1982), pp. 25-31.
4. U.S., Department of Labor, Occupational Outlook, p. 16; Robert W. Bednarzik, "Layoffs and
Perment Job Losses: Workers' Traits and Cyclical Patterns," Monthly Labor Review 106 (September
1983), p. 2.
5. U.S., Department of Labor, Occupational Outlook, p. 16.
6. Daniel Bell, The Coming of Post-Industrial Society(New York: Basic Books, Inc., 1976).
7. Peter B. Doeringer, and Michael J. Piore, Internal Labor Markets and Manpower Analysis(Lexington, Mass.: D.C. Heath and Co., 1971).
8. Victor R. Fuchs, "Differences in Hourly Earnings between Men and Women," Monthly LaborReview 94 (May 1971), pp. 9-15; Daniel Bell, The Coming of Post-IndustrialSociety; Harry Braverman,Labor and Monopoly Capital, the Degradation of Work in the Twentieth Century (New York: MonthlyReview Press, 1974); Valerie ON ?nheimer, The Female Labor Force in the United States (Berkeley,Calif.: Institute of International Studies, 1970); and C. Wright Mills, White Collar (New York: Oxford
University Press, 1951).
9. Paul D. Montagna, Occupations and Society; Toward a Sociology of the Labor Market (New
York: John Wiley and Sons, 1977), p. 49.
10. Max L. Carey, "Occupational Employment Growth through 1990," Monthly Labor Review
104 (August 1981), p. 48.
11. Doeringer, Interna/LaborMarkets, p. 179.
12. Richard Richie, Daniel Heckler and John Burgan, "High Technology Today and Tomorrow,
A Small Slice of the Employment Pie," Monthly Labor Review 106 (December 1983), pp. El -E9.
13. Bednarzik, "Unemployment and Permanent Job Losses," p. 6.
14. Mills, White Collar, p. 266.
30
Factors Influencing Employment Opportunities in the 1980s 11
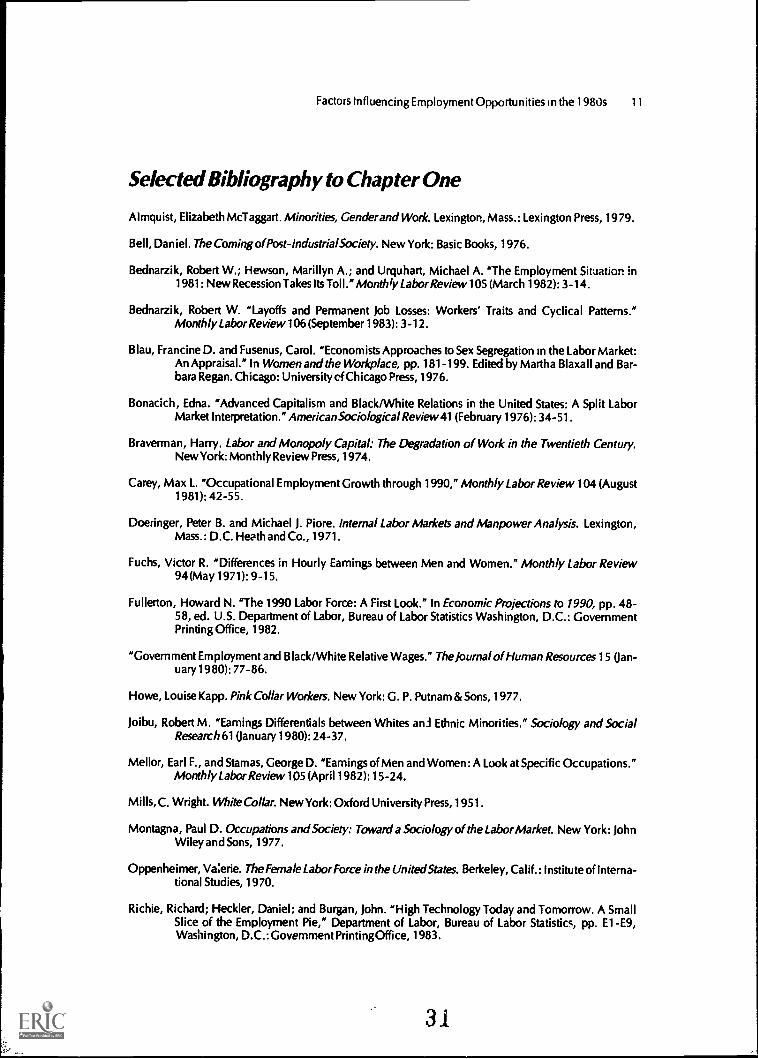
Selected Bibliography to Chapter One
Almquist, Elizabeth McTaggart. Minorities, Gender and Work. Lexington, Mass.: Lexington Press, 1979.
Bell, Daniel. The Coming of Post-Industrial Society. New York: Basic Books, 1976.
Bednarzik, Robert W.; Hewson, Marillyn A.; and Urquhart, Michael A. The Employment Situation in1981: New Recession Takes Its Toll ."Monthly Labor Review105 (March 1982): 3-14.
Bednarzik, Robert W. "Layoffs and Permanent Job Losses: Workers' Traits and Cyclical Patterns."Monthly Labor Review 106 (September 1983): 3-12.
Blau, Francine D. and Fusenus, Carol. "Economists Approaches to Sex Segregation In the Labor Market:An Appraisal." In Women and the Workplace, pp. 181-199. Edited by Martha Blaxall and Bar-bara Regan. Chicago: University cf Chicago Press, 1976.
Bonacich, Edna. "Advanced Capitalism and Black/White Relations in the United States: A Split LaborMarket Interpretation." American Sociological Review 41 (February 1976): 34-51.
Braverman, Harry. Labor and Monopoly Capital: The Degradation of Work in the Twentieth Century.New York: Monthly Review Press, 1974.
Carey, Max L. "Occupational Employment Growth through 1990," Monthly Labor Review 104 (August1981): 42-55.
Doeringer, Peter B. and Michael J. Piore. Internal Labor Markets and Manpower Analysis. Lexington,Mass.: D.C. Heath and Co., 1971.
Fuchs, Victor R. "Differences in Hourly Earnings between Men and Women." Monthly Labor Review94 (May 1971): 9-15.
Fullerton, Howard N. "The 1990 Labor Force: A First Look." In Economic Projections to 1990, pp. 48-58, ed. U.S. Department of Labor, Bureau of Labor Statistics Washington, D.C.: GovernmentPrinting Office, 1982.
"Government Employment and Black/White Relative Wages." The journal of Human Resources 15 (Jan-uary 1980): 77-86.
Howe, Louise Kapp. Pink Collar Workers. New York: G. P. Putnam & Sons, 1977.
Joibu, Robert M. "Earnings Differentials between Whites and Ethnic Minorities." Sociology and SocialResearch 61 (January 1980): 24-37.
Mellor, Earl F., and Stamas, George D. "Earnings of Men and Women: A Look at Specific Occupations."Monthly Labor Review 105 (April 1982): 15-24.
Mills, C. Wright. White Collar. New York: Oxford University Press, 1951.
Montagna, Paul D. Occupations and Society: Toward a Sociology of the Labor Market. New York: JohnWiley and Sons, 1977.
Oppenheimer, Va:erie. The Female Labor Force in the United States. Berkeley, Calif.: Institute of Interna-tional Studies, 1970.
Richie, Richard; Heckler, Daniel; and Burgan, John. "High Technology Today and Tomorrow. A SmallSlice of the Employment Pie," Department of Labor, Bureau of Labor Statistics, pp. El -E9,Washington, D.C.: Government Printing Office, 1983.
31

12 Project 2000
Rytina, Nancy F. "Earnings of Men and Women: A Look at SpecificOccupations." Monthly Labor Re-
view105 (April 1982): 25-31.
U.S. Department of Commerce, Bureau of the Census. Historical Statistics of the United StatesColonialTimes to 1970, pt. 1. Washington, D.C.: Government Printing Office, September 1975.
U.S. Department of Labor, Bureau of Labor Statistics. OccupationalOutlook Handbook-1982-83 Edi-tion. Washington, D.C.: Government Printing ffice, 1983.
32

Occupation Versus Industry Analysis
Growth in industries is clearly related to the growth of the individual occupationswhich make up that industry. Project 2000 focuses on occupations rather than indus-tries because occupational data provides a more detailed view of the placement ofminorities and women within the work force. In addition, strategies to modify the un-deremployment and unemployment of minorities and women are more easily linkedto specific occupations because training and educational programs are primarilygeared toward preparing individuals for specific occupations instead ofindustries.
Research Methodology
Project 2000 utilized the occupational growth projections developed by the Bureauof Labor Statistics to determine High Growth, High Tech, and High Loss occupations,and the, i assessed the 1980 participation rates for minorities and women within thesedesignated areas. These participation rates were then summarized on a national andstate-by-state basis.
Research began with a survey of the available literatureon areas of growth in thelabor force. The Bureau of Labor Statistics' study entitled "Occupational EmploymentGrowth through 1990" was used to formulate the operational definitions used for HighGrowth, High Tech, and High Loss occupations.' A tape of the data used to developthese projections was also obtained.
This study incorporates use of the low-trend alternative, which assumes a declinein the expansion of the labor force, continued high inflation, and a modest increasein both production and productivity.
33

14 Project 2000
High Growth, High Tech, andHigh Loss Selection Criteria
The following criteria were used in the selection of the 20 High Growth, 10 High
Tech, and 9 High Loss occupations included in this study.
High Growth Occupations
Occupations included in the High Growth category were selected for their largenumbers of employees and high projected growth rates (according to BLSdata). The
20 occupations selected by these criteria are expected to have the greatest employ-
ment potential.
High Tech Occupations
Since a definitive list of 1 Ilgh Tech occupations was not available, Project 2000's
list was derived from an extensive review of pertinent literature, and consultation withthe Department of Labor and the Bureau of the Census. In addition, occupationsneeded to meet the following criteria to be selected.Occupations must:
V be included in the Census and BLS,/ have a substantial number of employees,/ have a high projected growth rate,/ have functions which involve the development and production oftechnically ad-
vanced products and services
High Loss Occupations
The Project 2000 list of High Loss occupations was derived from Bureau of Labor
Statistics data, and included those occupations determined to have the largest number
of employees and the highest loss rates. This selection procedure resulted in the inclu-
sion of only nine occupations. The cut-off point was determined at nine occupationsbecause the employee population of the tenth-ranked occupation was significantlysmaller than that of the ninth. Also, the loss rate of the tenth-ranked occupation wasnot significant enough to overcompensate for its smaller employee population. These
two factors indicated a logical place for determining which occupations to include
in the High Loss category.
Utilization of 8LS Projection Ratesand 1980 Census Data
The BLS codes for each occupation selected for the High Growth, High Tech, and
High Loss categories were subsequently matched with the 1980 Censusoccupationalcoding system to obtain the number of employees and minority distribution withineach occupation. BLS 1990 projection rates were then utilized todevelop 1990 em-
34

Scope of Research 15
ployment figures for every group within each occupation. Because of the numerousdata sets, and the varied estimates used by the BLS to develop these projection rates,we chose to apply the BLS rates to the 1980 Census data to obtain an estimate of futuregrowth, rather than divide the projection rates by 12 (the number of years between1978-1990) and then adjust that rate. The 1980 Census figure for a specific occupa-tion was then multiplied by the BLS projection growth rate for the period between1978 and 1990. The result was added to the 1980 Census figure to determine the totalnumber expected to be employed in the occupation by 1990.For example: the 1980 Census figure for the occupation "Secretary" (3,999,222) wasmultiplied by the BLS projection rate (21.03 percent) to arrive at the increase in thenumber of secretaries by 1990 (841,036). This increase was z dded to the 1980 Censusfigure to arrive at the 1990 projection (4,840,258).
3,999,222 x 2103 = 841,036841,036 + 3,999,222 = 4,840,258
1980 Census data were used to generate both national and state data on minoritydistribution within occupations. It should be noted, though, that the Census data tapeused for the analysis of national trends was based upon a total civilian work force fig-ure of 104,449,817 employees. This figure includes the unemployed. The tape de-veloped by the Program Services Division for the state data did not include the un-employed and uses the total civilian labor force figure of 103,718,076. This exclu-sion, however, should not affect the number of minorities employed in specific HighGrowth, High Tech or High Loss occupations.
Limitations of BLS Projection Data
The BLS projections incorporated into this research are based upon the growth rateof each occupation from 1978 to 1980. These projections have factored in specificassumptions of which users should be aware, and therefore, "should consider pro-jections as likely outcomes in light of current expected trends, not as forecasts of thefuture."2
The data from the BLS study were generated from the Occupational EmploymentStatistics (OES) survey, which collects data on occupational staffing patterns of indus-tries.' All nonagricultural industries, except private households, are covered by thissurvey on a three year cycle: manufacturing industries during the first year, and halfof the non-manufacturing industries in each of the next two years. Wage and salaryemployment totals for agricultural and private household industries were obtainedfrom the Current Population Survey.
Projections of industry employment are translated into occupational employmentprojections through the use of an industry-occupational matrix.' BLS converted theNational Industry Occupational Employment Matrix from a Census data base to anOES survey base in 1981. Staffing patterns that are reflective of data from the OES sur-veys are first projected to 1990, then to total employment of an industry and, finally,summed across all industries. This process yields employment projections for all oc-
35

16 Project 2000
cupations in the matrix. The projected employment of an occupation is determinedby changes in the proportion of workers in each industry, and the growth rate of the
industries in whicn an occupation is concentrated. An estimate is then made of the
total number of job openings expected to occur in each occupation in addition to
usual replacement needs.'
Occupations Included in the Study
Twenty Most Populous High Growth Occupations:
Blue-Collar Worker SupervisorsSecretariesHelpers in the TradesTruck DriversAutomotive MechanicsJanitors and SextonsSales ClerksElementary School TeachersBookkeepers, HandCashiers
General Clerks, OfficeTypistsWaiters and WaitressesNurse's Aides and OrderliesNurses, ProfessionalKitchen HelpersAccountants and AuditorsGuards and DoorkeepersLicensed Practical NursesFood Preparation and Service Workers
A threshold question with regard to the selection of High Growth occupations waswhether or notthe EEOC wanted to be in the position of developing policy recommen-dations aimed at these occupations, some of which are not commonly classified asprofessional. Project 2000 staff decided that these occupations did deserve consider-
ation since they employed more than 39 percent of the total civilian labor force in1980, more than 41 million workers. Most importantly, according to projections de-veloped by BLS, over 11 million new jobs will be created in the..e. 20 occupations
by 1990.
Ten Most Populous High Tech Occup.:tiore5:
Electrical and Electronic AssemblersComputer ProgrammersComputer OperatorsElectrical EngineersElectrical and Electronic Technicians
Mechanical EngineersIndustrial EngineersComputer Systems AnalystsData Processing Machine MechanicsPeripheral EDP Equipment Operators
The study also acknowledges the importance of the expansion in High Tech areas.
High Tech industries and occupations have been a major focus of policymakers andthe media, and although there is much iebate on the degree of expansion High Techfields will experience, most researchers agree that the area will produce a consider-
able number of new jobs.
'3 6

Nine Most Populous High Loss Occupations:
Farm LaborersFarmers, Owners & TenantsSecondary School TeachersCompositors and TypesettersMaids and Servants, Private
Scope of Research 17
Teachers, CollegeTaxi DriversChild Care Workers, PrivateHousekeepers, Private
The Project 2000 staff selected the High Loss occupations from the occupationalbreakdown developed by BLS (see section on research methodology for a more de-tailed discussion). In reviewing the list of High Loss occupations, we had expectedto find that jobs related to industrial production would rank high on the chart. Mostof the occupations which met our High Loss selection criteria, however, are not af-fected by industrial shutdowns and layoffs.
Additional Growth Occupations
Although many professional occupations did not meet our criteria for High Growth,some will show slight but significant increases in employment by 1990. Figure 2.1includes occupations which we defined as professional, and employed more than100,000 persons in 1978. We did not choose to conduct an extensive analysis of theseprofessional occupations since they currently employ a relatively small proportion ofthe work force and are not expected to produce large numbers of new jobs. However,to assist states in developing their own projections, we have included the number em-ployed in 1978, and the BLS growth rate.
Figure 2.1Professional Jobs:Number Employed in 1978 and Projected Rates ofChange Between 1978 and 1990
Number Employed inProfessional Occupations 1978 National C'IS
DentistsPharmacistsPhysiciansTherapistsCommercial ArtistsMusiciansLawyersLibrariansWriters and Editors
149,000140,000447,000139,000100,000126,000380,000130,000109,000
Projected Percentage Change1978-1990
39.59%13.36%39.98%51.51%22.25%27.15%37.85%
6.. '8%30.33%
Source: Max L. Carey, "Occupational Empbyment Growth throuv% 1990," Monthly Labor Review104 (August 1981), pp. 49-53.
3'1

18 Project 2000
Endnotes to Chapter Two
1. Max L. Carey, "Occupational Employment Growth through 1990, ' Monthly Labor Review 104(August 1981), pp.42-54.
2. U.S. Department of Labor, Bureau of Labor Statistics, Handbook of Methods (December 1982),pp. 135-136
3. Ibid.
4. Ibid.
5. Ibid.
38
+.,.. 1...<

This chapter highlights some of the specific findings of Project 2000. It presents dataon areas of projected employment growth with a specific focus on minorities andwomen. Although much of this data is projected statistics which should be viewedas the likely outcome rather than prediction, it can be used to identify and preparefor the changing needs of the job market.
1980 Civilian Labor Force:High Growth, High Tech, High Loss
The 1980 civilian labor force totaled mcre than 104 million workers. Nearly 52.5million people were employed in the 39 High Growth, High Tech and High Loss oc-cupations chosen for this study: 48.7 percent of the CLF.
The individual totals and percents were as follows:
High GrowthHigh TechHigh Loss
1980 Total Employees % of 1980 CIF41,504,050 39.73,945,632 3.07,045,465 6.0
Minority participation in the 1980 CLF was 18 percent. Their rate of employmentin individual categories was as follows: (see Figure 3.1)
1980 Minority Employees % of CategoryHit Growth 7,986,964 19.2High Tech 768,698 19.5High Loss 1,684,660 23.9
39BEST COPY AVAILABLE

20 Project 2000
Female participation, nonminority and minority, in the 1980 CLF was 42.6 percent.Their rate of employment in individual categories was as follows: (see Figure 3.7)
1980 Female Employees % of Category
High Growth 22,864,007 55.1
High Tech 1,425,660 36.1
High Loss 2,944,593 41.8
The largest portion of the 1980 work force was employed in the most populous
states: California, Texas, Illinois, New York, Pennsylvania, Michigan, Ohio, NorthCarolina, Georgia, and Florida. The smallest portion was employed in the least popul-
ous states: Maine, New Hampshire, Vermont, Rhode Island, Delaware, West Vir-ginia, Wyoming, South Dakota, North Dakota, Montana, Idaho, Nevada, Alaska, and
Hawaii (see Figure 3.3) .The most populous states had the largest numbers of minority employees; the least
populous had the smallest numbers (see Figure 3.4) .High Growth and High Tech occupations were uniformly distributed across all
states, with the major variations in work force size attributed to the state'spopulation.High Loss occupations were concentrated in several states: California, New York, and
Texas (see Figures 3.5, 3.6 and 3.7) .
'i
.41...17

Project 2000 Major Findings 21
1980 REPRESENTATION OF MINORITIES
BY OCCUPATION GROUPS(IN THOUSANDS OF PERSONS)
eporLev sum45000 -I
LEGEND : TYPE
111111 MINORITY
r--1 TOTAL
SOURCE: EEOC-1980 CENSUS
FIGURE 3.1
HIGH GROWTH HIGH LOSSGROUP
41
HIGH TECH

22 Project 2000
1980 REPRESENTATION OF WOMEN
BY OCCUPATION GROUPS(IN THOUSANDS OF PERSONS)
EMP'LEVIEL SUM
48000
411101110
38000
11110411111
26000
LEGEND : TYPE
MI FEMALES
F-1 TOTAL
SOURCE: EEOC-1980 CENSUS
FIGURE 3.2
1-LIGIM 130014TH MIMI LOSSGROUP
4 4r)
LamHIGH TEL.1

CIVILIAN LABOR FORCE(IN THOUSANDS OF PERSONS)
LEGEND : CODE
n0 TO 5001:::] 500 TO 1,000
PP 1,000 TO 2,000
PM 2,000 TO 3,000
® 3,000 TO 12,000
SOURCE: EEOC-1980 CENSUS
FIGLAE 3.3
43
....,\...._
BEST COPY AVAILABLE
)
44

TOTAL MINORITY EMPLOYMENT(IN THOUSANDS OF PERSONS)
LEGEND : CODE
F-10 TO 50
50 TO 100
- 100 TO 3001111 300 TO 500
1111 500 TO 4,000
SOURCE: EEOC-1980 CENSUS
FIGURE 3.4
len
BEST COPY AVAILABLE

Project 2000 Major Findings 25
High Growth Occupations
Civilian Labor Force
The 20 High Growth occupations designated by Project 2000 composed almost 40percent of the U.S. civilian labor force in 1980: more than 41 million workers. Theseoccupations, as an aggregate, are expected to create more than 11 million new jobsby 1990. This increase will bring the total number working in High Growth occupa-tions to over 52 million.
The following five most populous High Growth occupations employed almost 19million workers in 1980, and are projected to employ more than 23 million by 1990:
% ChangeOccupation 1980* 1978-1990 1990*
I Blue-Collar WorkerSupervisors 4,825,000 17.36 5,663,000
V Secretaries 3,998,000 21.03 4,810,000V Heiper in the Trades 3,538,000 25.04 4,424,000,/ Truck Drivers 3,334,000 26.16 4,206,000V Automotive Mechanics 3,201,000 24.25 3,977,000
*Rounded to the nearest thousand
The following three High Growth occupations are expected to experience the great-est percentages of increase by 1990:
% Change
Occupation 1980 1978-1990 1990
,,/ Food Preparation andService Workers 211,965 68.84 357,882
I Nurse's Aides andOrderlies 1,378,118 54.56 2,130,019
V Nurses, Professional 1,304,850 50.28 1,960,929
Overview: Minorities and Women
Minority men and women, and nonminority women composed 64.1 percent of theHigh Growth work force in 1980 (19.2 percent minorities, and 44.9 percent non-minority women). The distribution of minority groups was as follows:
Number Percent
I Total minorities 7.9 million 19.2
V Black men and women 4.5 million 11.1
,/ Hispanic men and women 2.5 million 6.0V Asian men and women 645,000 i.eV American Indian men
and women 219,000 0.5I Nonminority women 18.6 million 44.9
47

26 Project 2000
Minorities
In 1980, the aggregate minority participation rate in the High Growth occupations(19.2 percent) exceeded the aggregate minority participation rate in the national CLF(18.0 percent). Minority women also represented 1 percent more of the High Growthwork force than minority men (10.1 percent compared to 9.1 percent). (see Chapter3-Tables 4, 5)
The three High Growth occupations which had the highest percentages of minorityemployment in 1980 were (see Chapter 4-Table 1):
,/ Janitors and Sextons 36.5% (1,022,462),/ Nurse's Aides and Orderlies 34.6% ( 476,912),/ Kitchen Helpers 27.5% ( 306,504)
The three High Growth occupations which had the lowest percentages of minorityemployment in 1980 were:
,/ Bookkeepers, Hand 10.0% ( 189,337),1 Secretaries 11.0% ( 439,717)V Blue-Collar Worker Supervisors 12.0% ( 577,161)
The three High Growth occupations which had the greatest numbers of minorityemployees in 1980 were:
,/ Janitors and Sextons 1,022,462 (36.5%),1 Helpers in the Trades 930,420 (26.3%),1 Truck Drivers 772,332 (23.2%)
The three High Growth occupations which had the lowest numbers of minority em-ployees in 1980 were:
,/ Food Preparation and Service Workers 37,768 (17.8%),/ Licensed Practical Nurses 102,044 (23.4%),1 Accountants and Auditors 124,168 (12.3%)
Blue-Collar Worker Supervisors and Secretaries were the two most populous HighGrowth occupations in 1980, and are expected to remain so in 1990. Both had lowpercentages of minority employment: 12 percent and 11 percent, respectively.
Helpers in the Trades had a relatively high percentage of minority employees in1980 (26.3 percent); the second highest number employed in a High Growth occupa-tion. This occupation is predicted to have the greatest net gain by 1990: 885,877workers.
Nurses Aides and Orderlies had the second highest percentage of minority employ-ees among High Growth occupations: 34.6 percent, or 476,912 workers. It has thesecond highest projected growth rate for 1990, 54.56 percent, and expects a net gainof 751,901 positions.
46

Project 2000 Major Findings 27
Women
In 1980, the aggregate nonminority female participation rate in High Growth occu-pations (44.9 percent) exceeded their participation rate in the national CLF (34.3 per-cent) by 10.6 percent. The participation rate of minority females in High Growth oc-cupations also exceeded their national CLF participation rate: 10.0 percent comparedto 8.3 percent (see Chapter 3-Tables 4, 5) .
Women, minority and nonminority combined, filled a greater percentage of HighGrowth jobs than minority and nonminority men combined: 55.1 percent comparedto 44.9 percent. Twelve of the 20 High Growth occupations employed more than 70percent women. Nonminority females constituted the majority of the High Growthwork force with 44.9 percent participation, outnumbering nonminority men (35.8percent) by more than 1 percent. Minority women also filled 1 percent more positionsthan minority men: 10.1 percent compared to 9.1 ercent.
The three High Growth occupations which had the highest percentages of femaleemployment in 1980 were (see Chapter 4-Table 1):
All Nonminority Minority,/ Secretaries 98.8% (3,949,973) 88.0% (3,518,594) 10.8% (431,379),/ Licensed Practical
Nurses 96.6% ( 420,412) 74.1% ( 322,480) 22.5% ( 97,932)I Nurses,
Professional 95.8% (1,249,499) 83.3% (1,086,868) 12.5% (162,631)
The three High Growth occupations which had the lowest percentages of femaleemployment in 1980 were:
All Nonminority Minority
,/ Truck Drivers 8.2% (274,003) 5.9% (196,542) 2.3% ( 77,461),/ Guards and
Doorkeepers 10.3% (102,690) 7.4% ( 73,702) 2.9% ( 28,988),/ Blue-Collar Worker
Supervisor 14.8% (713,723) 12.4% (598,603) 2.4% (115,120)
The three High Growth occupations which had the greatest numbers of female em-ployees in 1980 were:
All Nonminority Minority
,/ Secretaries 3,949,973 (98.8%) 3,518,594 ;88.0%) 431,379 (10.8%)
,/ Sales Clerks 1,766,116 (71.6%) 1,550,804 (62.8%) 215,312 ( 8.7%),/ Elementary School
Teachers 1,749,547 (75.5%) 1,471,072 (63.4%) 278,475 (12.0%)
49

28 Project 2000
The three High Growth occupations which had the lowest numbers of female em-ployees in 1980 were:
,/ Guards andAll Nonminority Minority
Doorkeepers 102,690 (10.3%) 73,702 ( 7.4%) 28,988 ( 2. 9%)
,/ Food Preparationand ServiceWorkers 171,867 (81.8%) 143,358 ( 7.6%) 28,509 (13.4%)
,/ Truck Drivers 274,003 ( 8.2%) 196,542 ( 5.9%) 77,461 ( 2.3%)
Blue-Collar Worker Supervisors and Truck Drivers had the lowest percentages offemale employees in 1980. These occupations are expected to have some of the high-est net gains by 1990.
Secretaries composed the second greatest portion of the High Growth category in1980, and are expected to do so in 1990. The projected growth rcie is 21.03 percent,or 841,036 jobs. In 1980, nearly 99 percent of all secretaries were women: 63.0 per-cent nonminority, and 10.8 percent minority.
Geographic Distribution
High Growth occupations were evenly distributed across all states in 1980, com-posing from 30 to 40 percent of their civilian work forces. The largest numbers of em-pInyees in High Growth fields were found in the most populous states: California,New York, Texas, Illinois, and Pennsylvania (see Figure 3.5). Alaska, Vermont, andWyoming had the smallest numbers of employees in High Growth occupations.
Educational and Skill Requirements
The ten High Growth occupations requiring a minimal level of skills for entry were:
Cashiers Kitchen HelpersClerks, Office Nurse's Aides and OrderliesFood Preparation and Service Workers Sales ClerksGuards and Doorkeepers Waiters and WaitressesHelpers in the Trades Janitors and Sextons
The High Growth occupations requiring specific training and/or education were:
Automotive MechanicsAccountants and AuditorsBookkeepers, Hand
Licensed Practical NursesRegistered or Professional NursesBlue - Collar Worker Supervisors
The High Growth occupations requiring a college degree were:
Accountants and AuditorsNurses, ProfessionalElementary School Teachers
50

HIGH GROWTH EMPLOYMENT(IN THOUSANDS OF PERSONS)
LEGEND : CODE
El 0 TO 500
Li 500 TO 1,000WI 1,000 TO 2,000
MN 2,000 TO 3,000
MN 3,000 TO 5,000
SOURCE : EEOC
FIGURE 3.5
51
52
NJko

30 Project 2000
High Growth occupations which had the greatest percentages and numbers ofminority employees in 1980 require minimal skills for job entry.
A large portion of women in High Growth areas, primarily nonminority, partici-pated in occupations which require specific skills and training, or a college degree.
High Tech Occupations
Civilian Labor Force
The ten High Tech occupations designated by Project 2000 employed over 3 per-cent of the U.S. CLF in 1960: almost 4 million workers. These occupations, as anaggregate, are expected to experience a 55 percent growth increase by 1990, creatingover 2 million new jobs. This will bring the total number of people employed in HighTech occupations to over 6 million.
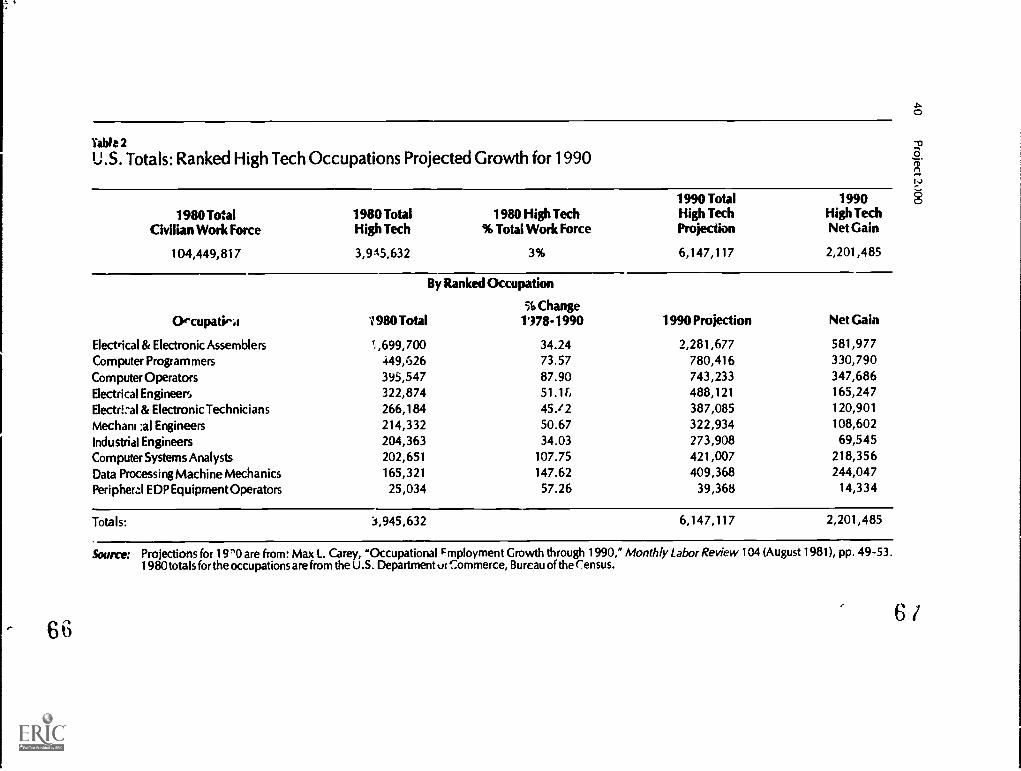
The following five most populous High Tech occupations employed slightly over3 million workers in 1980, and are projected to employ almost 4.5 million by 1990(see Chapter 3-Table 2):
% Change
Occupation 1980 1978-1990 1990,/ Electrical and Electronic
Assemblers 1,699,700 34.24 2,281,677,/ Computer Programmers 499,626 73.57 780,416,/ Computer Operaiors 395,547 87.90 743,233,/ Electric Engineers 322,874 51.18 488,121,/ Electrical and Electronic
Technicians 266,184 45.42 387,085
The following three High Tech occupations are expected to experience the greatestpercentages of increase by 1 9T3 (see Chapter 3-Table 2):
% ChangeOccupation 1980 1978-1990 1990
,/ Data Processing MachineMechanics 165,321 147.62 409,368
,/ Computer SystemsAnalysts 202,651 107.75 42; ,007
,/ Computer Operators 395,547 87.9 743,233
Although far fewer workers were employed in High Tech than High Growth areasin 1980, BLS low-trend growth rates indicate that the net increases in some High Techfields by 1990 will be comparable to those for some High Growth occupations. How-ever, despite the tremendous predicted increase of High Tech areas, nearly 150 percentin one instance, most new jobs are expected to be in the High Growth occupations.
53

Project 2000 Major Fincfings 31
Overview: Minorities and Women
Minority men and women, and nonminority women composed 46.9 percent of theHigh Tech work force in 1980 (19.5% minorities, and 27.4% nonminority women).The distribution of specific minority groups was as follows (see Chapter 3-Table 6):
Numlber Percent,/ Total minorities 768,698 19.5,/ Black men and women 395,010 10.0,/ Hispanic men and women 246,802 6.3,/ Asian men and women 106,120 2.7,/ American Indian men and women 16,213 0.4,/ Nonminority women 1 million 27.4
Minorities
In 1980, the aggregate minority participation rate in the designated High Tech oc-cupations (19.5%) exceeded the aggregate minority participation rate in the CLF(18.0%) by 1.5 percent. Hispanics and Asians both had greater participation rates inthe High Tech occupations than in the CLF (see Chapter 3-Table 4, 6).
The three High Tech occupations which had the highest percentages of minorityparticipation in 1980 were (see Chapter 4-Table 2):
,/ Electrical and Electronic Assemblers 27.6% (469,752),/ Peripheral EDP Equipment Operators 20.6% ( 5,145),/ Computer Operators 19.9% ( 78,570)
The three High Tech occupations whichticipation in 1980 were:
had the lowest percentages of minority par-
,/ Industrial Engineers 7.3% (14,879),/ Mechanical Engineers 8.3% (17,764),/ Electrical Engineers 10.2% (32,868)
The three High Tech occupations whichployees in 1980 were:
had the greatest numbers of minority em-
,/ Electrical and Electronic Assemblers 469,752 (27.6%),/ Computer Operators 78,570 (20.6%),/ Computer Programmers 66,784 (14.9%)
The three High Tech occupations which had the smallest numbers of minority em-ployees in 1980 were:
,/ Peripheral EDP Equipment Operators 5,145 (20.6%),/ Industrial Engineers 14,879 ( 7.3%),/ Mechanical Engineers 17,764 ( 8.3%)
54

32 Project 2000
In 1980, the greatest numbers of minority High Tech employees were located inthe most populous occupations: Electrical and Electronic Assemblers, ComputerOperators, and Computer Programmers. These are expected to remain among the
most populous High Tech fields in 1990.
Women
In 1980, the aggregate female participation rate in High Tech occupations (36.1
percent) was over 6 percent lower than their participation in the CLF. This is attributed
to a lower percentage of participation among nonminority women: 27.4 percent com-
pared to 34.3 percent in the CLF. Minority women, however, filled a greater percen-tage of High Tech jobs than in the CIF: 8.8 percent compared to 8.3 percent in theCLF (see Chapter 3-Tables 4, 6).
The three High Tech occupations which had the highest percentages of female em-ployment in 1980 were (see Chapter 4-Table 2):
,/ Peripheral EDPEquipment
All Nonminority Minority
Operators 61.7% ( 15,441) 49.9% ( 12,490) 11.8% ( 2,951)
1 ComputerOperators 59.1% (233,611) 47.7% (188,669) 11.4% ( 44,942)
,/ Electrical andElectronicAssemblers 49.5% (841,158) 35.3% (600,837) 14.1% (240,321)
The three High Tech occupations which had the lowest percentagesof female em-
ployment in 1980 were:
All Nonminority Minority
,/ MechanicalEngineers 2.0% ( 4,386) 1.7% ( 3,750) 0.3% ( 636)
,/ Electrical Engineers 5:0% (16,179) 4.1% (13,344) 0.9% ( 2,835)
,/ Data ProcessingMachineMechanics 5.1% ( 8,377) 4.0% ( 6,615) 1.1% ( 1,762)
The three High Tech occupations which had the greatest numbers of female em-
ployees in 1980 were:
,/ Electrical andElectronic
All Nonminority Minority
Assemblers 841,158 (49.5%) 600,837 (35.3%) 240,321 (14.1%)
,/ ComputerOperators 233,611 (59.1%) 188,669 (47.7%) 44,942 (11.4%)
,/ ComputerProgrammers 210,699 (46.9%) 173,901 (38.7%) 36,798 ( 8.2%)
55

HIGH TECH EMPLOYMENT(IN THOUSANDS OF PERSONS)
0,1nm1111milpif
JfJ
LEGEND : CODE
I-1 0 TO 49
50 TO 99
I. 100 TO 199El 200 TO 299
MI 300 TO 500
SOURCE : EEOC
FIGURE 3.6
56
5/

34 Project 2000
The three High Tech occupations which had the lowest numbers of female employ-ees in 1980 were:
J MechanicalEngineers 4,386 ( 2.0%) 3,750 ( 1.7%) 636 ( 0.3%)
J Data ProcessingMachineMechanics 8,377 ( 5.1%) 6,615 ( 4.0%) 1,762 ( 1.1%)
,/ Peripheral EDPEquipmentOperators 15,441 (61.7%) 12,490 (49.9%) 2,951 (11.8%)
Most women were employed in the most populous High Tech occupations in 1980.These occupations are expected to remain in that category in 1990.
Geographic Distribution
In 1980, the five most populous states had the largest numbers of workers employedin High Tech occupations. The states with the smallest numbers of employees in HighTech fields were: Alaska, Wyoming, and North and South Dakota (seefigure3.6).
Educational and Skill Requirements
The majority of High Tech occupations require some college education and fre-quently, a college degree. The following occupations fall within this category:
,/ Computer ProgrammersJ Computer Systems AnalystsJ Electrical and Electronic Technicians
i Industrial EngineersJ Electrical Engineers
The fact that some High Tech positions require little training and education is fre-quently overlooked. The following occupations are relatively easy to enter:
/ Computer OperatorsJ Peripheral EDP OperatorsJ Electrical and Electronic Assemblers
Most women and minorities employed in the High Tech category in 1980 held jobswhich required little training or education for entry.
High Loss Occupations
Civilian Labor Force
The nine High Loss occupations designated by Project 2000 employed more than6 percent of the 1980 U.S. CLF: more than 7 million workers. These occupations,as an aggregate, are expected to experience a net loss of one million jobs by 1990.
53

Project 2000 Major Findings 35
This decrease will bring the total number employed in High Loss occupations toslightly under 6 million.
The following three most populous High Loss occupations employed slightly over5 million workers in 1980, and are expected to experience a net loss of 1,072,585jobs by 1990:
% Change1980 1978-1990 1990
Farm Laborers 2,994,046 -25.42 2,232,960Farmers, Owners and Tenants 1,158,548 -16.96 962,058Secondary School Teachers 893,624 -12.87 778,615
The following three High Loss occupations have the highest projected loss rates.Two of these occupationsfarm laborers, and farmers (owners and tenants)werethe most populous of the High Loss occupations. They employed more than 4 millionin 1980, and it is projected that more than 900,000 jobs will be lost in these two occu-pations by 1990.
1980% Change1978-1990 1990
,/ Farm Laborers 2,994,046 -25.42 2,232,960%I Farmers, Owners and
Tenants 1,158,548 -16.96 962,058,/ Childcare Workers, Private 159,915 -15.32 135,416
Overview: Minorities and Women
Minority men and women, and nonminority women composed 54 percent of theHigh Loss workforce in 1980 (23.9 percent minorities, and 30.1 percent nonminoritywomen). The distribution of specific minority groups was as follows:
Number Percenti Total minorities 1,684,660 23.9,/ Black men and women 948,065 13.5
Hispanic men and women 596,339 8.5,/ Asian men and women 90,943 1.3,/ American Indian men and
women 42,211 0.6Nonminority women 2 million 30.1
Minorities
In 1980, aggregate mincrity participation in the designated High Loss occupationsexceeded their total participation in the CLF by almost 6 percent:, 23.9 percent com-pared to 18.0 percent (see Chapter 3-Tables 4,7) .
5J
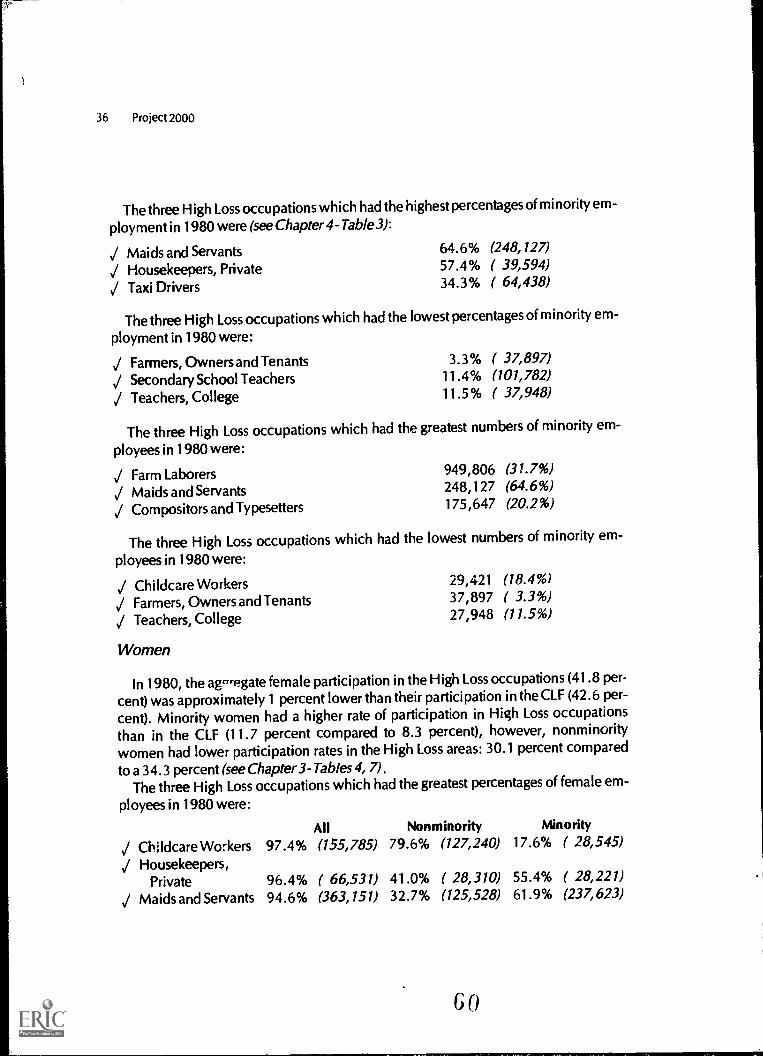
36 Project 2000
The three High Loss occupations which had thehighest percentages of minority em-
ployment in 1980 were (see Chapter 4-Table 3):
,/ Maids and Servants 64.6% (248,127)
,/ Housekeepers, Private 57.4% ( 39,594)
Taxi Drivers 34.3% ( 64,438)
The three High Loss occupations which had the lowest percentages of minority em-
ployment in 1980 were:
,/ Farmers, Owners and Tenants 3.3% ( 37,897)
,/ Secondary School Teachers 11.4% (101,782)
,/ Teachers, College 11.5% ( 37,948)
The three High Loss occupations which had the greatest numbers of minority em-
ployees in 1980 were:
,/ Farm Laborers 949,806 (31.7%)
,/ Maids and Servants 248,127 (64.6%)
,/ Compositors and Typesetters 175,647 (20.2%)
The three High Loss occupations which had the lowest numbers of minority em-
ployees in 1980 were:
,/ Childcare Workers 29,421 (18.4%)
,/ Farmers, Owners and Tenants 37,897 ( 3.3%)
,/ Teachers, College 27,948 (11.5%)
Women
In 1980, the arregate female participation in the High Loss occupations (41.8 per-
cent) was approximately 1 percent lower than their participation in the CLF (42.6 per-
cent). Minority women had a higher rate of participation in High Loss occupations
than in the CLF (11.7 percent compared to 8.3 percent), however, nonminority
women had lower participation rates in the High Loss areas: 30.1 percent compared
to a 34.3 percent (see Chapter 3-Tables 4, 7)The three High Loss occupations which had the greatest percentages of female em-
ployees in 1980 were:
All Nonminority Minority
,/ Childcare Workers 97.4% (155,785) 79.6% (127,240) 17.6% ( 28,545)
,/ Housekeepers,Private 96.4% ( 66,531) 41.0% ( 28,310) 55.4% ( 28,221)
,/ Maids and Servants 94.6% (363,151) 32.7% (125,528) 61.9% (237,623)
60

Project 2000 Major Findings 37
The three High Loss occupations which had the lowest percentages of female em-ployees in 1980 were:
,/ Farmers, Ownersand Tenants
,/ Taxi Drivers,/ Farm Laborers
All Nonminority Minority
9.9% (114,200) 9.5% (109,811) 0.4% ( 4,389)11.5% ( 21,603) 8.6% ( 16,178) 2.9% ( 5,425)30.6% (917,485) 21.0% (628,749) 9.6% (228,736)
The three High Loss occupations which had the greatest numbers of femaleemploy-ees in 1980 were:
All Nonminority Minority,/ Farm Laborers 917,485 (30.6%) 628,749 (21.0%) 228,736 (9.6%),I Compositors and
Typesetters 595,412 (68.6%) 462,891 (53.3%) 132,521 (2.9%),1 Secondary School
Teachers 509,283 (57.0%) 443,281 (49.6%) 66,002 (7.4%)
The three High Loss occupations which had the lowest numbers of femaleemploy-ees in 1980 were:
All Nonminority Minority,/ Taxi Drivers 21,603 (11.5%) 16,178 ( 8.6%) 5,425 ( 2.9%),I Housekeepers,
Private 66,531 (96.4%) 28,319 (41.0%) 38,221 (55.4%),/ Farmers, Owners
and Tenants 114,200 ( 9.9%) 109,811 ( 9.5%) 4,389 ( 0.4%)
Geographic Distribution
Employment in High Loss occupations was concentrated in several states: Califor-nia, New York and Texas (see Figure 3.7)
61

62
HIGH LOSS EMPLOYMENT(IN THOUSANDS OF PERSONS)
Wco
LEGEND : CODE
D 0 TO 100CI 100 10 200
200 TO 300
1111 300 TO 400
IIII 400 TO 500
SOURCE : EEOC
FIGURE 3.7

Table 1
U .S. Totals: Ranked High Growth Occupations Projected Growth for 1990
1980 Total 1980 Total 1980 1990 Total 1990Civilian Work Force High Growth High Growth High Growth High Growth
% Total Work Force Projection Net Gain
104,449,817 41,504,050 39.7% 52,796,577 11,292,527
By Ranked Occupation
% ChangeOccupation 1980 Total 1978-1990 1990 Projection Net Gain
Blue-Collar Worker SupervisorsSecretaries
Helpers in the TradesTruck DriversAutomotive MechanicsJanitors and Sextons
Sales Clerks
Elementary School TeachersBookkeepers, HandCashiersGeneral Clerks, OfficeTypistsWaiters and WaitressesNurse's Aides and OrderliesNurses, ProfessionalKitchen HelpersAccountants & AuditorsGuards & DoorkeepersLicensed Practical NursesFood Preparation & Service Workers
Totals:
4,825,429 17.36 5,663,1233,999,222 21.03 4,840,2583,537,848 25.04 4,423,7253,333,783 26.16 4,205,c:01
3,200,945 24.25 3,977,1742,803,715 25.96 3,531,5592,468,330 21.32 2,994,5782,319,370 21.37 2,815,0191,895,473 23.69 2,344,5111,875,840 36.35 2,557,7081,736,613 23.35 2,142,1121,550,760 26.40 1,960,161
1,506,093 34.56 2.026,5991,378,118 54.56 2,130,0191,304,850 50.28 1,960,9291,114,900 38.98 1,549,4881,012,857 32.72 1,344,264
992,763 35.52 1,345,392
435,176 43.89 626,175211,965 68.84 357,882
41,504,050 52,796,577
837,694841,036885,877872,118776,844727,844526,248495,649449,038681,868405,449409,401520,506751,901656,079434,588331,407352,629190,999145,917
11.292,527
Source: Projections for 1990 are from: Max L. Carey, "Occupational Employment Growth through 1990," Monthly Labor Review 104 (August 1981), pp. 49-53.
1980 totals for the occupations are from the U.S. Department of Commerce, Bureau of the Census.
65
g A
TabletU . S. Totals: Ranked High Tech Occupations Projected Growth for 1990
1980 Total 1980 TotalCivilian Work Force High Tech
104,449,817 3,945,632
1980 High Tech% Total Work Force
3%
.1,0
21,
1990 Total 1990 °o
High Tech High TechProjection Net Gain
6,147,117 2,201,485
By Ranked Occupation
% ChangeOccupatie:a 1980 Total 1978-1990 1990 Projection Net Gain
Electrical & Electronic Assemblers 'I ,699,700 34.24 2,281,677 581,977Computer Programmers .449,626 73.57 780,416 330,790Computer Operators 395,547 87.90 743,233 347,686Electrical Engineer, 322,874 51.1F, 488,121 165,247Electri;al& Electronic Technicians 266,184 45./2 387,085 120,901Mecham al Engineers 214,332 50.67 322,934 108,602Industrial Engineers 204,363 34.03 273,908 69,545Computer Systems Analysts 202,651 107.75 421,007 218,356Data Processing Machine Mechanics 165,321 147.62 409,368 244,047Peripherzl EDP Equipment Operators 25,034 57.26 39,368 14,334
Totals: 3,945,632 6,147,117 2,201,485
Source: Projections for 19'0 are from: Max L. Carey, "Occupational employment Growth through 1990," Monthly Labor Review 104 (August 1981), pp. 49-53.1980 totals for the occupations are from the U.S. Department ur Commerce, Bureau of the Census.
- 666/

Table 3
U.S. Totals: Ranked High Loss Occupations Projected Loss for 1990
1980 TotalCivilian Work Force
104,449,817
1980 Total 1980 High LossHigh Loss % Total Work Force
7,045,465 6%
Projection
5,806,514
Net Loss
-1,238,951
Occupation
Farm Laborers
Farmers, Owners & Tenants
Secondary School TeachersCompositors & Typesetters
Maids & Servants, PrivateTeachers, CollegeTaxi DriversChild Care Workers, PrivateHousekeepers, Private House
By Ranked Occupation
PercentageChange
1980 Total 1978-199r
2,994,046 -25.42
1,158,548 -16.96893,624 -12.87
868,076 - 1.92383,888 -15.20
329,755 -10.06
188,593 -12.59
159,915 -15.32
69,020 -14.39
1990 Projection
2,232,960962,058778,615851,409325,537296,582164,849135/11659,088
Net Loss
-761,086-196,490-115,009- 16.677- 58,351- 33,173- 23,744- 24,499- 9,932
Totals: 7,045,465 5,806,514 -1,238,95i
Source:
68
Projections for 1990 are from: Max L. Carey, "Occupational Employment Growth through 1990," Monthly Labor Review 104 (August 1981), pp. 49-53.
1980 totals for the occupation are from the U.S. Department of Commerce, Bureau of the Census.
69

Table 4-0
U . S. Total: U.S. Civilian Labor FOrce by Race, Sex and National Origin 3
2NJ
Total Nonminority Minority Black Hispanic Asian Am/Ind Other °o
Men Men Men Men Men Men Men Menc
Women Women Women Women Women Women Women Women
104,449,817 85,677,198 18,772,619Number 9,926,488 49,800,137 10,126,351
44,523,329 35,877,061 8,646,268
100.0 82.0 18.0Percent 57.4 47.7 9.7
42.6 34.3 8.3
10,437,225 5,992,723 1,696,420 546,457 38,5945,254,596 3,593,058 908,824 311,862 58,0135,182,629 2,399,665 787,596 234,595 41,783
10.0 5.7 1.6 0.5 0.15.0 3.4 0.9 0.3 0.15.0 2.3 0.8 0.2 0.0
Source: U.S. Department of Commerce, Bureau of the Census.
Table 5
1980 National Participation Rates for the High Growth Occupations by Race, Sex and National Origin
Total Nonminority Minority Black Hispanic Asian Am/Ind OtherMen Men Men Men Men Men Men Men
Women Women Women Women Women Women Women Women
Total
Percent
41,504,050 33,517,086 7,986,964 4,594,941 2,488,270 645,625 219,534 38,59418,640,043 14,864,966 3,775,077 2,050,197 1,343, 701 257,348 105,371 18,46022,864,007 18,652,120 4,211,887 2,544,744 1,144,569 388,277 114,163 20,134
100.0 80.0 19.2 11.1 6.0 1.6 0.5 0.144.9 35.8 9.1 4.9 3.2 0.6 0.3 0.055.1 44.9 10.1 6.1 2.8 0.9 0.3 0.0
Source: U.S. Department of Commerce, Bureau of the Census. 7 1

Table 6
1980 Participation Rates for the High Tech Occupations by Race, Sex and National Origin
Total NonminorityMen Men
Women Women
MinorityMen
Women
BlackMen
Women
HispanicMen
Women
AsianMen
Women
Am/IndMen
Women
OtherMen
Women
3,945,632 3,176,934 768,698 395,010 246,802 106,120 16,213 4,553
Total 2,519,972 2,097,634 422,338 204,417 138,168 67,889 9,015 2,849
1,425,660 1,079,300 346,360 190,593 108,634 38,231 7,198 1,704
100.0 80.5 19.5 10.0 6.3 2.7 0.4 0.1
Percent 63.9 53.2 10.7 5.2 3.5 1.7 0.2 0.1
36.1 27.4 8.8 4.8 2.8 1.0 0.2 0.0
Source: U.S. Department of Commerce, Bureau of the Census.
Table 7
1980 National Participation Rates for the High Loss Occupations by Race, Sex and National Origin
Total NonminorityMen Men
Women Women
MinorityMen
Women
BlackMen
Women
HispcnicMe.i
Women
AsianMen
Women
Am/IndMen
Women
OtherMen
Women
7,045,465 5,360,805 1,684,660 948,065 596,339 90,943 42,211 7,102
Total 4,100,872 3,239,508 861,364 427,241 360,323 43,208 26,898 3,694
2,944,593 2,121,297 823,296 520,824 236,016 47,735 15,313 3,408
100.0 76.1 23.9 13.5 8.5 1.3 0.6 0.1
Percent 58.2 46.0 12.2 6.1 5.1 0.6 0.4 0.1
41.8 30.1 11.7 7.4 3.3 0.7 0.2 0.0
Source: U.S. Department of Commerce, Bureau of the Census.
7273

High Growth
* See Chapter 3-Table 4 for Civilian Labor Force participation statistics and Chapter4-Table 1 for High Growth occupational statistics.
Blue-Collar Worker Supervisors,/ 88 percent of Blue-Collar Worker Supervisors were nonminority: 75.6 percent
male and 12.4 percent female.J The participation rate for minority males was roughly equal to their participation
rate in the CLF (9.6 percent compared to 9.7 percent).i Females had the greatest disparity between a group's participation rate in this occu-
pation and their participation rate in the CLF.
SecretariesJ Nearly 99 percent of all secretaries were women.J Nonminority women had a 2.5 times greater participation rate in this occupation
than in the CLF. This was the greatest proportional difference among all groups.J All female minority groups had higher participation rates in this occupation than
in the CLF.
Helpers in the Tradesi Males had a 1.5 times greater participation rate in this occupation than in the CLF.i All minorities, except Asians, had higher participation rates in this occupation than
in the CLF.
i The participation rates of both black and Hispanic male.; were 1.5 times greaterthan their participation rates in the CLF.
7,1 BEST COPY !NOBLE

46 Project 2000
Truck Drivers,I This was one of the most gender-segregated occupations in the High Growth cate-
gory: 91.8 percent male and 8.2 percent female.,/ All groups of minority males had higher participation rates in this occupation than
in the CLF.J Black, Hispanic, and American Indian males had at least twice the participation
rate; in this occupation as in the nation's CLF.,/ Very few women were employed in this occupation.
Automotive Mechanics,I Males had a higher participation rate (72.3 percent) in this occupation than in the
CLF (57.4 percent).,/ Minority males, except Asians, had higher participation rates in this occupation
(13.8 percent) than in the CLF (9.7 percent).,/ Minority women had nearly equal participation rates in this occupation and in the
CLF.,/ Nonminority females had a lower participation rate in this occupation (13.8 per-
cent) than in the CLF (9.7 percent).
Janitors and Sextons,I This occupation had a gender distribution similar to the CLF.,/ Nonminority females had a lower participation rate in this occupation (20.4 per-
cent) than in the CLF (34.3 percent).,/ All minority males and females, except Asians, had higher participation rates in
this occupation than in the CLF.
Elementary School Teachers,I This occupation was predominately female: 75.4 percent.,/ All minority female groups had at least the same participation rate in this occupa-
tion as in the CLF.,/ Hispanic males had a lower participation rate in this occupation (0.8 percent) than
in the CLF (3.4 percent).
Sales ClerksI Females, particular!? nonminority, had a higher participation rate in this occupa-
tion than in the CLF.,/ Black males had a lower participation rate in this occupation (1.8 percent) than
in the CLF '5.0 percent).
Bookkeepers, Hand,I This occupation was predominately female: almost 90 percent.,/ Blacks had a lower participation rate (4.3 percent) in this occupation than in the
CLF (10.0 percent).
75

National Overview: 1980 Participation by Occupation 47
Cashiers,I 83.5 percent of cashiers were female.,/ Minority females had a higher participation rate in this occupation (15.0 percent)
than in the CLF (8.3 percent).,/ Hispanic women had more than double the participation rate in this occupation
than in the CLF (4.8 percent compared to 2.3 percent).
General Clerks, Office,I Females composed 82.1 percent of this occupation.,/ Females had twice the participation rate in this occupation as in the CLF.,/ Nonminer!ty males had a lower participation rate in this occupation (13.7 percent)
than in the CLF (47.7 percent).
Typists,I Almost 88 percent of this occupation's employees were female.,/ Minority women had a higher participation rate in this occupation (20.8 percent)
than in the CLF (8.3 percent).,/ Black females had almost 3 times the participation rate in this occupation than in
the CIF (13.1 percent compared to 5.0 percent).,/ Nonminority males were the group with the lowest participation rate in this occu-
pation (9.7 percent) compared to their participation in the CLF (47.7 percent).
Waiters and Waitressesv Females composed 88 percent of all those working as waiters and waitresses.,/ Black females had a lower participation rate in this occupation (4.0 percent) than
in the CLF (5.0 percent).
Nurse's Aides and Orderlies,I Black women had an approximately tive times greater participation rate in this oc-
cupation (23.4 percent) than in the CLF (5.0 percent).,/ The nonminority male participation rate in this occupation was one-sixth (7.5 per-
cent) of that in the CLF (47.7 percent).
Nurses, Professional,/ 96 percent of professional nurses were female.i All female groups, except Hispanics, had higher participation rates in thisoccupa-
tion than in the CLF.
Kitchen Helpers,I This occupation was one of the more evenly distributed occupations by gender.,/ Female groups, individually and as an aggregate, had higher participation rates in
this occupation than in the CLF.
Accountants and Auditors,/ The gender breakdown of this occupation reflected that of the CLF.,/ Black and Hispanic males and females had lower participation rates in this occupa-
tion than in the CLF.
76

48 Project 2000
Guards and Doorkeepers,/ Almost 90 percent of guards and doorkeepers were male.,/ Minority males had higher participation rates in this occupation than in the CLF.,/ Black males had a two times greater participation rate in this occupation (11.6 per-
cent) than in the CLF (5.0 pecent).
Licensed Practical Nurses,/ This occupation was dominated by women: nearly 97 percent.,/ Minority women represented about 22 percent of al!' PNs.,/ Black women accounted for 17.2 percent of all 1-PNs. This was more than three
times their participation rate in the national CLF (5.0 percent).
Food Preparation and Service Workers,I 81.1 percent of all those working in this occupation were female.,/ All minority female groups, except blacks, had twice the participation rate in this
occupation as in the CLF.Nonminority males had the lowest participation rate (14.5 percent) of all groupscompared to that in the CLF (47.7 percent).
High Tech
* See Chapter 4-Table 2 for High Tech occupational statistics.
Electrical and Electronic Assemblers,/ Nearly equal numbers of men and women worked in this occupation.,/ Minorities, as an aggregate, had a higher participation rate in this occupation (27.6
percent) than in the CLF (18.0 percent).,/ Blacks and Hispanics had the greatest increases in participation when compared
to their participation in the CLF.
Computer Programmers
,/ Women had a 4.3 percent higher particip2tion rate in this occupation than in theCLF (46.9 percent compared to 42.6 percer it).
,/ Minorities, as an aggregate, had a 3 perccnt lower participation rate in this occupa-tion than in the CLF. However, Asians had a higher participation rate (3.8 percent)than in the CLF (1.6 percent). The difference, which resulted in an overall lowerparticipation rate, was found among Hispanics, and black males.
Computer Operators,I Women had a 16 percent higher participation rate in this occupation (59.1 percent)
than in the CLF (42.6 percent)./ Minorities had a slightly higher participation ,ate in this occupation (19.9 percent)
than in the CLF. The higher participation rate for Asians, in particular, and allminority women, accounted for this increase.
,/ Black and Hispanic males had slightly lower participation rates in this occupationthan in the CLF.
77
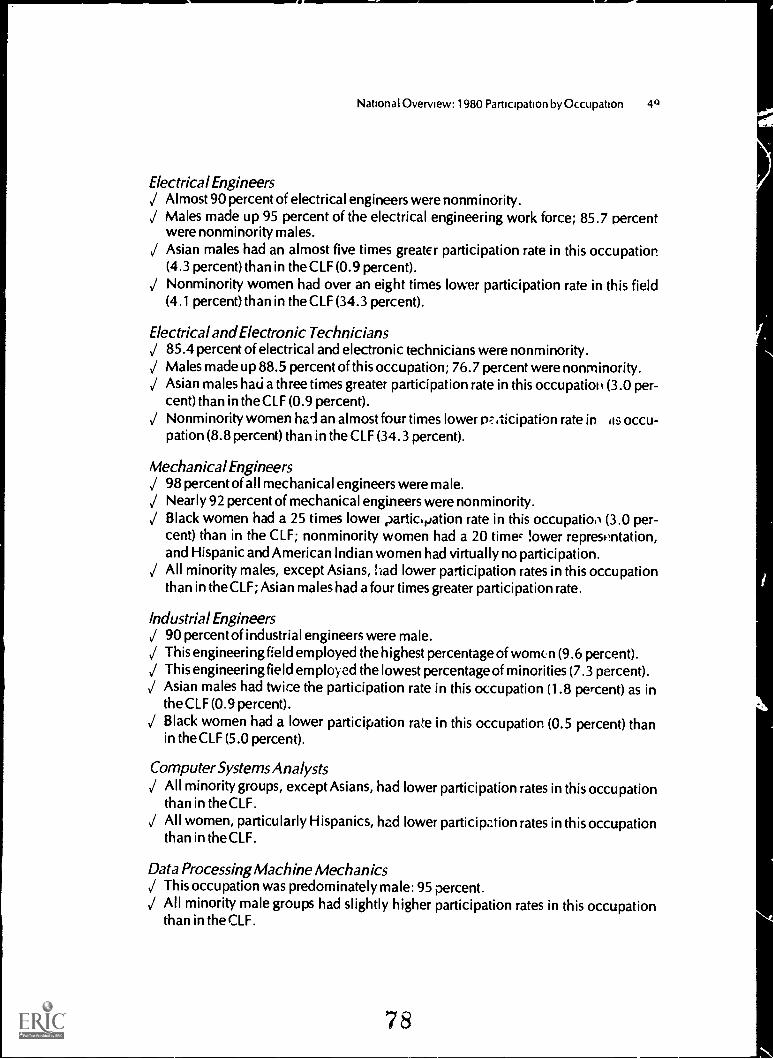
National Overview: 1980 Participation by Occupation 711IMINOMIP
Electrical Engineers,/ Almost 90 percent of electrical engineers were nonminority./ Males made up 95 percent of the electrical engineering work force; 85.7 percent
were nonminority males.,/ Asian males had an almost five times greater participation rate in this occupation
(4.3 percent) than in the CLF (0.9 percent).Nonminority women had over an eight times lower participation rate in this field(4.1 percent) than in the CLF (34.3 percent).
Electrical and Electronic Technicians,/ 85.4 percent of electrical and electronic technicians were nonminority.,/ Males made up 88.5 percent of this occupation; 76.7 percent were nonminority.,/ Asian males had a three times greater participation rate in this occupatioll(3.0 per-
cent) than in the CLF (0.9 percent).,/ Nonminority women had an almost four times lower p::,-ticipation rate in as occu-
pation (8.8 percent) than in the CLF (34.3 percent).
Mechanical Engineers98 percent of all mechanical engineers were male.
,/ Nearly 92 percent of mechanical engineers were nonminority.Black women had a 25 times lower darticyation rate in this occupatioo (3.0 per-cent) than in the CLF; nonminority women had a 20 timer lower representation,and Hispanic and American Indian women had virtually no participation.All minority males, except Asians, had lower participation rates in this occupationthan in the CLF; Asian males had a four times greater participation rate.
Industrial Engineers,/ 90 percent of industrial engineers were male./ This engineering field employed the highest percentage of woman (9.6 percent).,/ This engineering field employed the lowest percentage of minorities (7.3 percent).
Asian males had twice the participation rate in this occupation (1.8 percent) as inthe CLF (0.9 percent).Black women had a lower participation rate in this occupation (0.5 percent) thanin the CLF (5.0 percent).
Computer Systems Analysts,/ All minority groups, except Asians, had lower participation rates in this occupation
than in the CLF.
All women, particularly Hispanics, had lower participation rates in this occupationthan in the CLF.
Data Processing Machine Mechanics,/ This occupation was predominately male: 95 percent.
All minority male groups had slightly higher participation rates in this occupationthan in the CLF.
78

50 Project 2000
i All female gr vs had nc:Irly an eight times lower participation rate in this occupa-tion than in the CLF.
Peripheral EDP Equipment OperatorsJ This was one of the two High Tech occupations which had a higher percentage
of female' an . na le employees.i All women, except American Indians (whose rate remained the same), had higher
part'cipation rates in ths occupation than in the CLF.,/ Ail minority males, except Hispanics and American Indians, had nigher participa-
tion rates in :his occupation than in the CLF.J Nonminority males had a lower participation rate in this occupation than in the
CLF.
High Loss
* ;ee Chapter 4-Table 3 for High Loss occupational statistics.
Fa!, '..dborersI Females had a lower participation rate in this occupation (30.6 percent) than in
the national CLF (42.6 percent).i Minority males had -a higher participation rave in this occupation (22.1 percent)
than in the CLF (9.7 percent).I Hispanic males had an a,most three times higher participation rate in this occupa-
tion than in the CLF. Hispanic women had twice the participation rate.
Farmers, Owners and TenantsI 90 percent of those working in this occupation were ma!,/ All minority group7 had a lower participation rate in this occupation than in the
CLF.
Secondary School Teachers,/ Females had a higher partic'pation rate in this Pccupation (57.0 percent) than in
the CLF (42.6 percent).i Nearly 50 percent of all secondary school teachers were nonmirlority females.
Compositors and TypesettersThis occupation's employees were predominately female: almost 70 percent.
I All female groups had higher participation rates in this occupation than in the CLF.I Males of all groups had lower participatio,lrates in this occupation than in the CLF.
Maids and Seryalits,/ This occupation was almost exclusively female. nearly 95 percent.I Minority women represented nearly 62 percent of all those working in this occupa-
tion; a seven times greater participation rate than was found in the LI r./ Black women composed 51 percent of this occupation; a participation rate that
was ten times greater than that in the CLF.
7,9

National Overview: 1980 Participation by Occupation 51
Teachers, College,/ Nonminority females had a higher pat :icipation rate in this occupation (54.4 per-
cent) than in the CLF (34.3 percent).,/ Black and Hispanic males and fen-ales had lower participation rates in this; occupa-
tion than in the CLF.
Taxi Drivers,/ 88 percent of all taxi drivers were male.,/ Blacks had a four times greater participation rate in this occupation than in the CLF.
Child Care Workers, Private,/ This occupation was filled almost exclusively by women: more than 97 percent.,/ The participation rate for every female group was at least twice of that in the CLF.
Housekeepers, Private,/ This occupation was almost exclusively female: more than 96 percent.,/ Black and Hispanic women had a seven times higher participation rate in this occu-
pation than in the CLF.
5 ( )

Tai )1e 1-Page 1
National Overview1980 Participation Rates for Each High Growth Occupation by Race, Sex and National Origin
Total Nonminority Minority Black Hispanic Asian Am/Ind Other
Men Men Men Men Men Men Men Men
Women Women Women Women Women Women Women W . -
Blue - Collar Worker Supervisors
4,825,429 4,248,268 577,161 270,054 226,937 57,281 19,650 3,239
Number 4,111,706 3,649,665 462,041 210,272 185,404 47,163 16,528 2,674
713,723 598,603 115,120 59,782 41.533 10,118 3,122 565
100.0 88.0 12.0 5.6 4.7 1.2 0.4 0.1
Percent 85.2 75.6 9.6 4.4 3.8 1.0 0.3 0.1
14.8 12.4 2.4 1.2 0.9 0.2 0.1 0.0
Secretaries
3,999,222 3,559,505 439,717 229,175 151,766 39,595 16,390 2,791
Number 49,249 40,911 8,338 4,316 2,579 1,096 287 60
3,949,973 3,518,594 431,379 224,859 149,187 38,499 16,103 2,731
100.0 89.0 11.0 5.7 3.8 1.0 0.4 0.1
Percent 1.2 1.0 0.2 0.1 0.1 0.0 0.0 0.0
98.8 88.0 10.8 5.6
go A
3.7 1.0 0.4 0.1
____

Table 1 -Page 2
High Growth
Total Nonminority Minority Black Hispanic Asian Am/Ind OtherMen Men Men Men Men Men Men Men
Women Women Women Women Women Women Women Women
Helpers in the Trades
Number
Percent
Number
IIPercent
3,537,848 2,607,428 930,420 554,088 308,670 38,668 25,489 3,505
2,544,619 1,886,300 658,319 387,317 225,281 24,026 19,150 2,545
993,229 721,128 272,101 166,771 83,389 14,642 6,339 960
100.0 73.7 26.3 15.7 8.7 1.1 0.7 0.1
71.9 53.3 18.6 0.9 6.4 0.7 0.5 0.1
28.1 20.4 7.7 4.7 2.4 0.4 0.2 0.0
Truck Drivers
3,333,783 2,561,451 772,332 391,733 330,894 24,216 2,969 2,520
3,059,780 2,364,909 694,871 364,120 2e7,434 20,197 20,850 2,270
274,003 196,542 77,461 27,613 43,460 4,019 2,119 250
100.0 76.8 23.2 11.8 9.9 0.7 0.7 0.1
91.8 70.9 20.8 0.9 8.6 0.6 0.6 0.1
8.2 5.9 2.3 0.8 1.3 0.1 0.1 0.0

Table I -Page 3
High Growth
Total Nonminority Minority Black Hispanic Asian Am/Ind OtherMen Men Men Men Men Men Men Men
Women Women Women Women Women Women Women Women
Automotive Mechanics
3,200,945 2,507,754
Number 2,312.964 1,E70,614
887,981 637,140
Percent
100.0 78.3
72.3 58.4
27.7 19.9
693,191 358,761 263,502 50,692 16,943 3,293
442,350 222,890 176,818 28,499 11,987 2,156
2E0,841 135,871 86,684 22,193 4,956 1 137
21.7 11.2 8.2 1.6 0.5 0.1
13.8 7.0 5.5 0.9 0.4 0.1
7.8 4.2 2.7 0.7 0.2 0.0
Janitors and Sextons
2,803,715 1,781,253
Number 1,794,915 1,208,067
1,008,900 573,186
Percent
100.0 63.5
64.0 43.1
36.0 20.4
1,022 462 684,267 265,966 44,184 24,287 3,758
586,748 376,129 169,472 23,888 14,923 2,336
435,714 308,138 96,494 20,296 9,364 1,422
36.5 24.4 9.5 1.6 0.9 0.1
20.9 13.4 6.0 0.9 0.5 0.1
15.5 11.J 3.4 0.7 0.3 0.1
SZ

Table 1-Page 4
High Growth
Total Nonminority Minority Black Hispanic Asian Am/Ind OtherMen Men Men Men Men Men Men Men
Women Women Women Women Women Women Women Women
Elementary School Teachers
2,319,370 1,)69,007 350,363 248,977 66,429 24,078 9,397 1,482
Number 569,823 497,935 71,888 45,830 17,661 5,627 2,207 563
1,749,547 1,471,072 278,475 203,147 48,768 18,451 7,190 919
Percent
100.0 84.9 15.1
24.6 21.5 3.1
75.4 63.4 12.0
10.7
2.0
8.8
2.9
0.8
2.1
1.0
0.2
0.8
0.4
0.1
0.3
0.1
0.0
0.0
Sales Clerks
2,468,330 2,155,426 312,904 149,204 117,061 37,306 7,344 1,989
Number 702,214 604,622 97,592 44,929 38,264 11,738 1,863 748
1,766,116 1,550,804 215,312 104,275 78,797 25,518 5,481 1,241
Percent
100.0 87.3 12.7
28.4 24.5 4.0
71.6 62.8 8.7
6.0
1.8
4.2
83
4.7
1.6
3.2
1.5
0.5
1.0
0.3
0.1
0.2
0.1
0.0
0.1
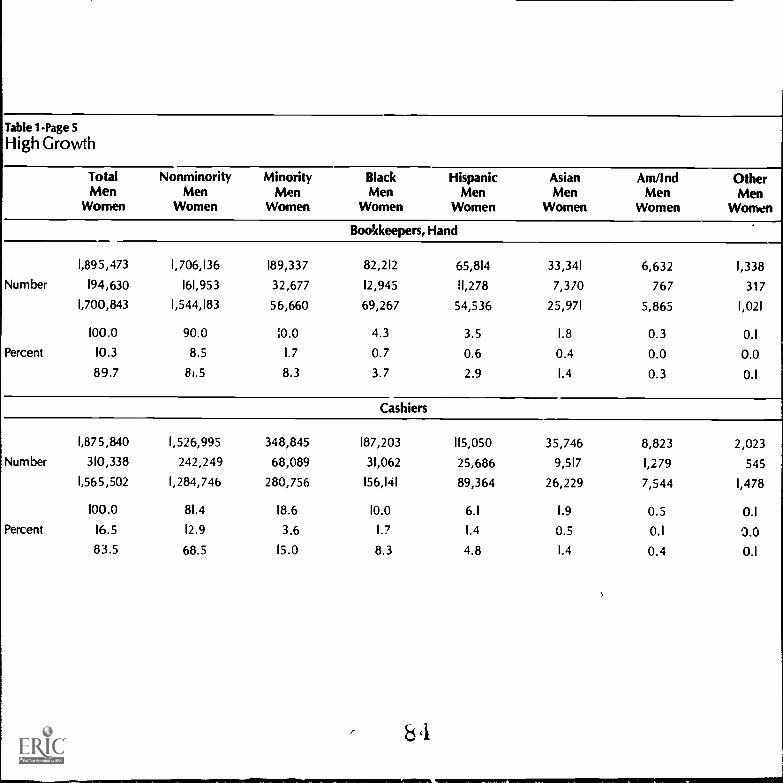
Table 1 -Page 5
High Growth
Total Nonminority Minority Black Hispanic Asian Am/Ind OtherMen Men Men Men Men Men Men Men
Women Women Women Women Women Women Women Women
Bookkeepers, Hand
1,895,473 1,706,136 189,337 82,212 65,814 33,341 6,632 1,338
Number 194,630 161,953 32,677 12,945 11,278 7,370 767 317
1,700,843 1,544,183 56,660 69,267 54,536 25,971 5,865 1,021
100.0 90.0 :0.0 4.3 3.5 1.8 0.3 0.1
Percent 10.3 8.5 1.7 0.7 0.6 0.4 0.0 0.0
89.7 81.5 8.3 3.7 2.9 1.4 0.3 0.1
Cashiers
1,875,840 1,526,995 348,845 187,203 115,050 35,746 8,823 2,023
Number 310,338 242,249 68,089 31,062 25,686 9,517 1,279 545
1,565,502 1,284,746 280,756 156,141 89,364 26,229 7,544 1,478
100.0 81.4 18.6 10.0 6.1 1.9 0.5 0.1
Percent 16.5 12.9 3.6 1.7 1.4 0.5 0.1 0.083.5 68.5 15.0 8.3 4.8 1.4 0.4 0.1
b ,1

Tablel-Page6High Growth
Total NonminoriMen Men Men Men Men Men Men
WomenWomen Women Women Women Women Women Women Wom
Nonminority Minority Black Hispanic Asian Am/Ind
1,736,613 1,369,751 366,862
Number 311 530 238,017 73,513
1,425,083 1,131,734 293,349
General Clerks, Office
220,631 101,255 34,993 8,145 1,838
41,365 21,763 8,356 1,425 604
179,266 79,492 26,637 6,220 1,234
Percent
100.0 78.9 21.1
17.9 13.7 '.2
82.1 65.2 16.9
1,550,760 1,188,288 362,472
Number 189,397 149,741 39,656
1,361,363 1,038,547 322,816
Percent
100.0 76.6 23.4
12.2 9.7 2.6
87.8 67.0 20.8
12.7
2.4
10.3
Typists
5.8
1.3
4.6
224,968 89,787
21,120 11,686
203,848 78,101
14.5 5.8
1.4 0.8
13.1 7 0
85
2.0
0.5
1.5
0.5
0.1
0.4
0.1
0.0
0.1
36,899 9,106 1,712
5,342 1,256 252
31,557 7,850 1,460
2.4
0.3
2.0
0.6
0.1
0.5
0.1
0.0
01

THable'l 1 -Page
High
Total Nonminority Minority Black Hispanic Asian Am/Ind OtherMen Men Men Men Men Men Men Men
We men Women Women Women Women Women Women WomenWaiters and Waitresses
1,506,093 1,307,169 193,924 77,662 72,160 39,484 7,829 1,789Number 180,165 125,048 55,117 17,530 22,937 13,524 572 554
1,325,928 1,182,121 143,807 60,132 49,223 25,960 7,257 1,235
Percent
100.0 86.8
12.0 8.3
88.0 78.5
13.2
3.7
9.5
5.2
1.2
4.0
4.8
1.5
3.3
2.6
0.9
1.7
0.5
0.0
0.5
0.1
0.0
0.1
Nurse's Aides and Orderlies
1,378,118 901,206 476,912 372,209 71,580 19,692 11,690 1,741Number 168,361 103,172 65,189 49,467 11,148 2,935 1,358 281
1,209,757 798,034 411,723 322,742 60,432 16,757 10,332 1,460
Percent
100.0 65.4
12.2 7.5
87.8 57.9
34.6
4.7
29.9
27.0
3.6
23.4
5.2
0.8
4.4
1.4
0.2
1.2
0.8
0.1
0.7
0.1
0.0
0.1

Table 1 -Page 8
High Growth
Total Nonminority Minority Black Hispanic Asian Am/Ind OtherMen Men Men Men Men Men Men Men
Women Women Women Women Women Wcauen Women Women
Nurses, Professional
1,304,850 1,131,833 173,017 96,604 27,907 43,300 3,929 1,277
Number 55,351 44,965 10,386 5,502 2,644 1,943 187 110
1,249,499 1,086,868 162,631 91,102 25,263 41,357 3,742 1,167
Percent
100.0 86.7
4.2 3.4
95.8 83.3
13.3
0.8
12.5
7.4
0.4
7.0
2.1
0.2
1.9
3.3
0.1
3.2
0.3
0.0
0.3
0.1
0.0
0.1
Kitchen Helpers
1,114,900 808,396 306,504 159,734 106,059 31,805 7,173 1,733
Number 513,608 353,891 159,717 69,300 68,699 17,617 3,089 1,012
601,292 454,505 146,787 90,434 37,360 14,188 4,084 721
Percent
100.0 72.5
46.1 31.7
53.9 40.8
27.5
14.3
13.2
87
14.3
6.2
8.1
9.5
6.2
3.4
2.9
1.6
1.3
0.6
0.3
0.4
0.2
0.1
0.1

Table 1 -Page 9
High Growth
Total Non minority Minority Black Hispanic Asian Am/Ind OtherMen Men Men Men Men Men Men Men
Women Women Women Women Women Women Women Women
Accountants and Auditors
1.012.857 888,689 124,168 53,714 31,802 34,820 2,825 1,007
Number 626,558 563,916 62,642 23,174 18,422 19,212 1,272 562
386,299 324,773 61,526 30,540 13,380 15,608 1,553 445
Percent
100.0 87.7
61.9 55.7
38.1 32.1
12.3
6.2
6.1
5.3
2.3
3.0
3.1
1.8
1.3
3.4
1.9
1.5
0.3
0.1
0.2
0.1
0.1
0.0
Guards and Doorkeepers
992,763 791,202 20,561 137,448 47,186 8,986 7,050 891
Number 890,073 717,500 172,573 115,631 42,289 7,821 6,066 765
102,690 73,702 28,988 21,817 4,897 1,165 984 125
Percent
100.0
89.7
10.3
79.7
72.3
7.4
20.3
17.4
2.9
13.8
11.6
2.2
4.8
4.3
0.5
0.9
0.8
0.1
0.7
0.6
0.1
0.1
0.1
0.0
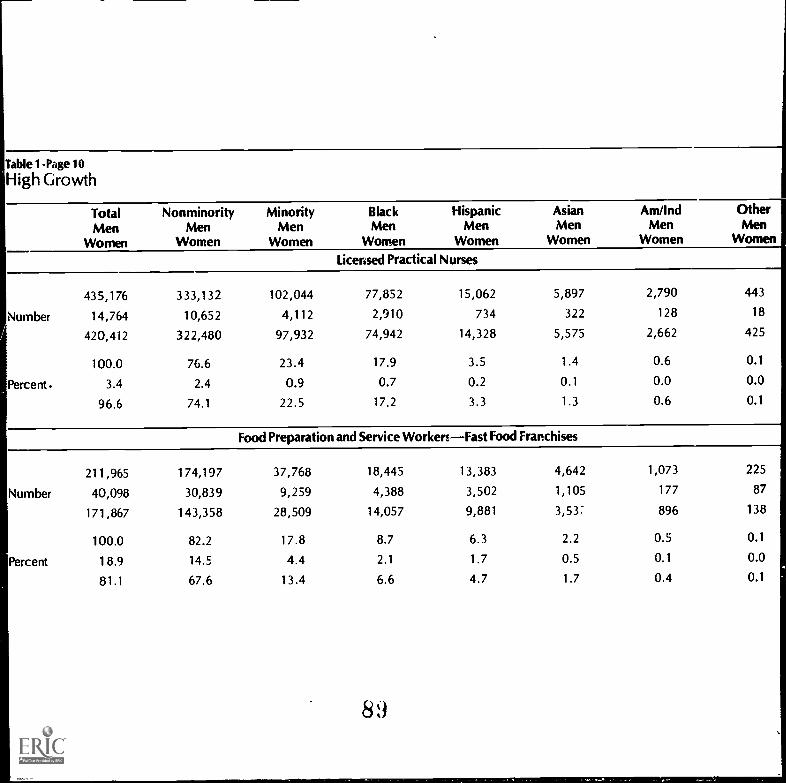
Table 1-Page10
High Growth
TotalMen
Women
NonminorityMen
Women
MinorityMen
Women
BlackMen
Women
HispanicMen
Women
AsianMen
Women
Am/IndMen
Women
OtherMen
Women
Licensed Practical Nurses
435,176 333,132 102,044 77,852 15,062 5,897 2,790 443
Number 14,764 10,652 4,112 2,910 734 322 128 18
420,412 322,480 97,932 74,942 14,328 5,575 2,662 425
100.0 76.6 23.4 17.9 3.5 1.4 0.6 0.1
Percent. 3.4 2.4 0.9 0.7 0.2 0.1 0.0 0.0
96.6 74.1 22.5 17.2 3.3 1.3 0.6 0.1
Food Preparation and Service Workers, -Fast Food Franchises
211,965 174,197 37,768 18,445 13,383 4,642 1,073 225
Number 40,098 30,839 9,259 4,388 3,502 1,105 177 87
171,867 143,358 28,509 14,057 9,881 3,537 896 138
100.0 82.2 17.8 8.7 6.3 2.2 0.5 0.1
Percent 18.9 14.5 4.4 2.1 1.7 0.5 0.1 0.0
81.1 67.6 13.4 6.6 4.7 1.7 0.4 0.1
89

able 2-Page1
ational Overview1980 Participation Rates for Each High Tech Occupation by Race, Sex and National Origin
TotalMen
Women
Nonminority Minority Black Hispanic Asian Am/Ind OtherMen Men Men Men Men Men Men
Women Women Women Women Women Women Women
Electrical and Electronic Assemblers
1,699,700Number 858,542
841,158
100.0Percent 50.5
49.5
1,229,948 469.752 258,470 167,640 32,815 8,789629,111 229,431 128,490 84,373 11,578 4,045600,837 240,321 129,980 83,267 21,237 4,744
72.4 27.6 15.2 9.9 1.9 0.537.0 3.5 7.6 5.0 0.7 0.235.3 14.1 7.6 4.9 1.2 0.3
Computer Programmers
2,038945
1,093
0.10.10.1
449,626 382,842 66,784 32,245Number 238,927 208,941 29,986 12,097
210,699 173,901 36,798 20,148
100.0 85.1 14.9 7.2Percent 53.1 46.5 6.7 2.7
46.9 38.7 8.2 4.5
1
15,663 16,942 1,4887,376 9,558 L308,287 7,384 808
3.5 3.8 0.31.6 2.1 0.21.8 1.6 0.2
446275171
0.10.10.0

Table 2-Page 2
High Tech
Total Nonminority Minority Black Hispanic
Men Men Men Men Men
Women Women Women Women Women
C --onputer Operators
395,547 316,977 78,570
Number 161,936 128,308 33,628
233,611 188,669 44,942
100.0 80.1 19.9
Percent 40.9 32.4 8.5
59.1 47.7 11.4
46,067 20,396
18,393 9,344
27,674 11,052
11.6
4.7
7.0
5.2
2.4
2.8
Electrical Engineers
Number
Percent
322,874 290,006 32,868
306,695 276,662 30,033
16,179 13,344 2,835
100.0 89.8 10.2
95.0 85.7 9.3
5.0 4.1 0.9
91
9,419 7,866
7,977 7,187
1,442 679
2.9 2.4
2.5 2.2
0.4 0.2
AsianMen
Women
Am AndMen
Women
OtherMen
Women
9,867 1,779 461
5,017 679 195
4,850 1,100 Z66
2.5 0.4 0.1
1.3 0.2 0.0
1.2 0.3 0.1
14,511 729 343
13,830 715 324
681 14 19
4.5 0.2 0.1
4.3 0.2 0.1
0.2 0.0 0.0

Table2-Page3High Tech
Total Nonminority Minority Black Hispanic Asian Am/lnd OtherMen Men Men Men Men Men Men Men
Women Women Women Women Women Women Women Women
Electrical and Electronic Technicians
266,184 227,441 38,743 16,105 11,975 9,239 03( 385Number 235,581 204,079 31,502 12,442 9,852 7,974 893 341
30,603 23,362 7,241 3,663 2,123 1,265 146 44
Percent
100.0
88.5
1!.5
85.4
76.7
8.8
14.6
11.8
2.7
6.1
4.7
1.4
4.5
3.7
0.8
3.5
3.0
0.5
0.4
0.3
0.1
0.1
0.1
0.0
Mechanical Engineers
214,332 196,568 17,764 5,020 4,006 8,041 435 262Number 209,946 t92,818 17,128 4,697 3,915 7,850 409 257
4,386 3,750 636 323 91 191 26 5
Percent
100.0
98.0
2.0
91.7
90.0
1.7
8.3
8.0
0.3
2..1
2.2
0.2
92
1.9
1.8
0.0
3.8
3.7
0.1
0.2
0.2
0.0
0.1
0.1
0.0

Table 2 -Page 4
High Tech
Total Nonminority Minority Black Hispanic Asian
Men /4,4-::. Men Men Men Men
Women Women Women Women Women Women
Industrial Engineers
Number
Percent
204,363 189,484 14,879 5,710 4,409 4,027
184,668 172,104 12,564 4,594 3,742 3,626
19,695 17,380 2,315 1,116 667 401
100.0 92.7 7.3 2.8 2.2 2.0
90.4 84.2 6.1 2.2 1.8 1.8
9.6 8.5 1.1 0.5 0.3 0.2
Computer Systems Analysts
202,651 180,473 22,178 9,404 4,803 7,207
Number 157,140 141,521 15,619 5,999 3,641 5,435
45,511 38,952 6,559 3,405 1,162 1,772
100.0 89.1 10.9 4.6 2.4 3.6
Percent 77.5 69.8 7.7 3.0 1.8 2.7
22.5 19.2 3.2 1.7 0.6 0.9
93
Am/IndMen
Women
OtherMen
Women
504 229
403 199
101 30
0.2 0.1
0.2 0.1
0.0 0.0
539 225
369 175
170 50
0.3 0.1
0.2 0.1
0.1 0.0

Table 2-Page 5
High Tech
Total Nonminority Minority Black Hispanic Asian Am/Ind °the]Men Men Men Men Men Men Men Men
Women Women Women Women Women Women Women Women
Data Processing Machine Mechanics
165,321 143,306 22,015 9,396 8,728 2,920 818 153Number 156,944 136,691 20,253 8,422 8,170 2,752 771 138
8,377 6,615 1,762 974 558 168 47 15
Percent
100.0
94.9
5.1
86.7
82.7
4.0
13.3
12.3
1.1
5.7
5.1
0.6
5.3
4.9
0.3
1.8
1.7
0.1
0.5
0.5
0.0
0.1
0.1
0.0
Peripheral EDP Equipment Operators
25,034 19,889 5,145 3,174 1,316 551 93 11
Number 9,593 7,399 2,194 1,306 568 269 51 05,441 12,490 2,951 1,86b 748 282 42 11
Percent
100.0
38.3
61.7
79.4
29.6
49.9
20.6
8.8
11.8
12.7
5.2
7.5
9,1
5.3
2.3
3.0
0.4
0.2
0.1.
0.0
0.0
0.0

Table 3-Page 1
National Overview1980 Participation Rates for Each High Loss Occupation by Race, Sex and National Origin
Total
WomenMen
Nonminority Minority Black Hispanic Asian Am/Ind Other
WomenMen
WomenMen
WomenMen
WomenMen
WomenMen
WomenMen Men
Women
Farm Laborers
2,994,046 2,044,240 949,806 453,129 428,501 39,136 25,526 3,514
Number 2,076,561 1,415,491 661,070 314,190 301,766 23,235 19,529 2,350
917,485 628,749 228,736 138,939 126,735 15,901 5,997 1,164
100.0 68.3 31.7 15.1 14.3 1.3 0.9 0.1
Percent 69.4 47.3 22.1 10.5 1C 1 0.8 0.7 0.1
30.6 21.0 9.6 4.6 4.2 0.5 0.2 0.0
Farmers, Owners and Tenants
1,158,548 1,120,651 37,897 16,576 12,133 5,733 3,189 266
Number 1,044,348 1,010,840 33,508 14,950 10,813 4,782 2,715 248
114,200 109,811 4,389 1,626 1,320 951 474 18
100.0 96.7 3.3 1.4 1.0 0.5 0.3 0.0
Percent 90.1 87.3 2.9 1.3 0.9 0.4 0.2 0.0 '+-
9.9 9.5 0.4 0.1 0.1 0.1 0.0 0.0

Table 3 -Page 2
High Loss
Total Nonminority Minority Black Hispanic Asian Am/Ind OtherMen Men Men Men Men Men Men Men
Women Women Women Women Women Women Women Women
Secondary School Teachers
893,624 791,842 101,782 68,060 22,186 7,466 3,461 609
Number 384,341 348,561 35,780 21,444 9,407 3,132 1,547 250
509,283 443,281 66,002 46,616 12,779 4,334 1,914 359
ercent
100.0
43.0
57.0
88.6
39.0
49.6
11.4
4.0
7.4
7.6
2.4
5.2
2.5
1.1
1.4
0.8
0.4
0.5
0.4
0.2
0.2
0.1
0.0
0.0
Compositors and Typesetters
868,076 692,429
Number 272,664 229,530
595,412 462,V1
Percent
100.0
31.4
68.6
79.8
26.4
53.3
175,647
43,126
132,521
20.2
5.0
15.3
101,216
21,639
79,577
11.7
2.5
9.2
910
48,299
14,709
33,590
5.6
1.7
3.9
21,609
5,460
16,149
2.5
0.6
1.9
3,622
1,079
2,543
0.4
0.1
0.3
901
239
662
0.1
0.0
0.1

Table 3-Page 3
High Loss
Total Nor Minority Black Hispanic Asian Am/Ind Other
Men Men Men Men Men Men Men Men
Women Women Women Women Women Women Women Women
Maids and Servants, Private
383,888 135,761 248,127 203,551 37,140 4,721 2,077 638
Number 20,737 10,233 10,504 7,689 2,062 540 162 51
363,151 125,528 237,623 195,862 35,078 4,181 1,915 587
Percent
100.0
5.4
94.6
35.4
2.7
32.7
64.6
2.7
61.9
53.0
2.0
51.0
9.7
0.5
9.1
1.2
0.1
1.1
0.5
0.0
0.5
0.2
0.0
0.2
Teachers, College
329,755 291,807 37,948 20,715 9,885 5,485 1,561 302
Number 128,612 112,498 16,114 7,993 4,655 2,558 671 137
201,143 179,309 21,834 12,722 5,230 2,827 890 165
Percent
100.0
39.0
61.0
88.5
34.1
54.4
11.5
4.9
6.6
91
6.3
2.4
3.9
3.0
1.4
1.6
1.7
0.8
0.9
0.5
0.2
0.3
0.1
0.0
0.1

Table 3-Page 4
High Loss
Total Nonminority Minority Black Hispanic Asian Am/Ind OtherMen Men Men Men Men Men Men Men
Women Women Women Women Women Women Women Women
Taxi Drivers
Number
Percent
188,593 124,155 64,438 41,846 17,355 3,368 1,460 409
166.990 107,977 59,013 37,910 16,351 3,210 1,147 395
21,603 16,178 5,425 3,936 1,004 158 313 14
100.0 65.8 34.2 22.2 9.2 1.8 0.8 0.2
88.5 57.3 31.3 20.1 8.7 1.7 0.6 0.2
11.5 8.6 2.9 2.1 0.5 0.1 0.2 0.0
Child Care Workers, Private
Number
Percent
159,915 130,494 29,421 17,386 9,018 1,797 920 300
4,130 3,254 876 557 208 74 28 9
155,785 127,240 28,545 16,829 8,810 1,723 892 291
100.0
2.6
97.4
81.6
2.0
79.6
18.4
0.5
17.6
10.9
0.3
10.5
5.6
0.1
5.5
0.6
0.0
0.6
0.2
0.0
0.2

Table 3 -Page 5
High Loss
Total Nonminority Minority Black Hispanic Asian Am/Ind Other
Men Men Men Men Men Men Men Men
Women Women Women Women Women Women Women Women
Housekeepers, Private House
69,020 29,426 39,594 25,586 11,822 1,628 395 163
Number 2,489 1,116 1,373 869 352 117 20 15
66,531 28,310 38,221 24,717 11,470 1,511 375 148
100.0 42.6 57.4 37.1 17.1 2.4 0.6 0.2
Percent 3.6 1.6 2.0 1.3 0.5 0.2 0.0 0.0
96.4 41.0 55.4 35.8 16.6 2.2 0.5 0.2
99

This chapter contains an analysis of 1980 employment in the five most populousstates: California, New York, Texas, Illinois, and Pennsylvania. Each state section in-cludes the following analyses:
J State Civilian Labor Forcev Minority and Female ParticipationJ High Growth, High Tech, and High Loss Participation .
J Most Populous Occupations: High Growth, High Tech, and High Loss
Table Index
A set of the following tables is included for each of the five states:
Tables 1-3 provide complete state information on the number of people employedin each of the twenty designated High Growth occupations, the ten designated HighTech occupations and the nine designated High Loss occupations.
Table 4 provides a bre'akdown of the total employed 1980 civilian labor force by race,sex and national origin for each state.
Table 4.5 provides the national breakdown of the total 1980 civilian labor force byrace, sex and national origin.
Tables 5, 7, 9 provide aggregate High Growth, High Tech and High Loss categoriesfor each state broken down by race, sex and national origin.
Tables 6, 8, 10 break down High Growth, High Tech and High Loss occupations foreach state by race, sex and national origin.
BEST COPY AVAILABLE
La

74 Project 2000
How to Calculate Predicted 1990 Net Gains and Losses
The following three tables are provided for calculating net gains and losses in eachstate's High Growth, High Tech, and High Loss occupations. These figures can beobtained by multiplying the 1980 in-state total employed in each occupation (see Ta-bles 1, 2, and 3 breach state) by the 1990 projected rate of change.
Forexample: California Blue-Collar Worker Supervisors
1980 Employment x 1990 Projected Rate of Change =521,559 x 17.36% =
High Growth
Occupation
1990 Net Gain90,243
Projected Rateof Change 1990
Blue-Collar Worker Supervisors 17.36%Secretaries 21.03%Helpers in the Trades 25.04%Truck Drivers 26.16%Automotive Mechanics 24.25%Janitors and Sextons 25.96%Sales Clerks 21.32%Elementary School Teachers 21.37%Bookkeepers, Hand 2.7.69%
Cashiers 36.35%General Clerks, Office 23.35%Typists 26.40%Waiters and Waitresses 34.56%Nurse's Aides and Orderlies 54.56%Nurses, Professional 50.28%Kitchen Helpers 38.98%Accountants and Auditors 32.72%Guards and Doorkeepers 35.52%Licensed Practical Nurses 43.89%Food Preparation and Service WorkersFast Food Franchises 68.84%
Source: Carey, Department of Labor, Bureau of Labor Statistics, Monthly Labor Review (August1981) pp. 42-55.

High Tech
Occupation
Overview he Five Most Populous States 75
Projected Rateof Change 1990
Electrical and Electronic Assemblers 34.24%Computer Programmers 73.57%Computer Operators 87.90%Electrical Engineers 51.18%Electrical and Electronic Technicians 45.42%Mechanical Engineers 50.67%Industrial Engineers 34.03%Computer Systems Analysts 107.75%Data Processing Machine Mechanics 147.62%Peripheral EDP Equipment Operators 57.26%
Source: Carey, Department of Labor, Bureau of Labor Statistics, Monthly Labor Review (August1981)pp.42-45.
High Loss
OccupationProjected Rate
of Change 1990
Farm Laborers 25.42%Farmers, Owners and Tenants -16.96%Secondary School Teachers -12.37%Compositors and Typesetters -1.92%Maids and Servants, Private -15.20%Teachers, College -10.06%Taxi Drivers -12.59%Child Care Workers, Private -15.32%Housekeepers, Private House -14.39%
Source: Carey, Department of Labor, Bureau of Labor Statistics, Monthly Labor Review (August1981) pp. 42-45.
102

76 Project 2000
California
Total Employed CivilianLabor Force In 1980
Refer to Tables 4 and 4.5.
I California's Civilian Labor Force* constituted 10.8 percent of the national CLF.,/ The minority participation rate in California's CIF (30.1 percent) was 1.5 times
greater than their national participation rate (17.8 percent).,/ Blacks' participation rate in California's CLF was lower (6.5 percent) than their na-
tional participation rate (9.9 percent).,/ Hispanics and Asiaas had a three times greater participation rate in California's CLF
than in the national CLF: Hispanics, 17.2 percent compared to 5.7 percent; Asians,5.5 percent compared to 1.6 percent.
*The civilian labor force is composed of all persons between 16 and 65 years of agewho are currently employed or looking for a job.
**It should again be noted that the data tape used for the analysis of national trendswas based upon a total civilian work force figure of 104,449,817 employees. Thisfigure includes the unemployed. The tape developed by the Program Services Divi-sion for the state data did not include the unemployed and uses the total civilian laborforce figure of 103,718,076.
California's High Growth Occupations:1980 Minority and Female Participation
Refer to Tables 1, 4 and 5.
,/ In 1980, 10 percent of the nation's High Growth work force was employed inCalifornia.
,/ 38.4 percent of the state's CLF worked in High Growth occupations. This wassomewhat lower than the national High Growth participation rate (39.7 percent).
,/ Over 500,000 persons were employed as blue-collar supervisors in California.J Minorities had a slightly higher participation rate in California's High Growth occu-
pations (32.9 percent) than in the state CLF (30.1 percent).,/ The female participation rate in California'a High Growth category was 11 percent
higher the, n in the state CLF.,/ Hispanics had a higher participation rate in California's High Growth occupations
(19.0 percent) that1 ;n the state CLF (17.2 percent).
1 03

Overview: The Five Most Populous States 77
California's High Tech Occupations:1980 Minority and Female Participation
Refer to Tables 2, 4 and 7.
,/ In 1980, the largest share of the nation's High Tech labor force was employed inCalifornia: 12 percent.
,/ 4.3 percent of the state's CLF was employed in High Tech occupations, a higherproportion than the national percentage (3.4 percent).
,/ The female participation rate in California's High Tech occupations (33.4 percent)was lower than that in the state CLF (42.7 percent).
,/ Nonminority females had a lower participation rate in California's High Tech occu-pations (18.2 percent) than in the state CLF (29.8 percent). This was the greatestdifference in participation of any group.
,/ Asians had a higher participation rate in the state's High Tech occupations (9.3 per-cent) than in the state CIF (5.5 percent).
California's High Loss Occupations:1980 Minority and Female Participation
Refer to Tables 3, 4 and 9.
110 percent of the nation's Hi3h Loss work force was employed in California.,/ 6.2 percent of the state CLF was employed in High Loss occupations. In contrast,
High Loss occupations represented 6.7 percent of the national CLF.,/ The female participation in California's High Loss occupations (44.1 percent) was
higher than in the state CLF (42.7 percent).,/ Nonminority males had a lower participation rate in California's High Loss occupa-
tions (29.0 percent) than in the state CLF (40.1 percent). This was the lowest partici-pation of any group compared to their portion of the state CLF.
,/ Hispanics had a higher participation rate in California's High Loss occupations(35.2 percent) than in the state CLF (17.2 percent). This was the highest rate of anygroup compared to their participation in the state CLF.
High Growth: Top Five OccupationsMinority and Female Participation in 1980
Refer to Tables 4 and 6.
Blue-Collar Worker Supervisors
83 percent of all those working in this occupation were male.,/ Both black and Hispanic women had a three times lower articipation rate in this
occupation that in the state CLF.,/ Minority males had a higher participation rate in this occupation (23.9 percent)
than in the state CLF (17.2 percent).
104

78 Project 2000
,/ Non minority males had a higher participation rate in this occupation (64.0 percent)than in the state CLF (40.1 percent).
Secretaries
,,/ 98.3 percent of all those working in this occupation were women./ Nearly 80 percent of all secretaries were nonminority females./ Non minority males constituted only 1.2 percent of all secretaries.
Truck Drivers
38 percent of all those working in this occupation were male.,/ All groups of females (except Hispanics) had lower participation rates in this occu-
pation than in the state CLF.,/ Nonminority women had a lower participation rate in this occupation than (3.8
percent) in the state CLF (29.8 percent). This differe ice in rates of participation wasthe greatest of all groups.
Automotive Mechanics
iIii
I
73 percent of all those working in this occupation were male.Nonminority females had a lower participation rate (10.8 percent) in this occupa-tion than in the state CLF (29.8 percent).Black females had a slightly lower participation rate (2.2 percent) than in the stateCLF (3.2 percent).Hispanic and Asian women had higher participation rates in this occupation thanin the state CIF: Hispanics, 10.4 percent versus 6.8 percent in the state CIF;Asians, 2.9 percent versus 2.6 percent in the state CLF.Minority males had a higher participation rate in this occupation (29.6 percent)than in the state CLF (17.2 percent). Nonminority males had a slightly higher par-ticipation rate in this occupation (43.3 percent) than in the state CLF (40.1 percent).
Helpers in the Trades
I Malescomposed 73 percent of all those working as helpers in the trades.Nonminority women had a lower participation rate (12.6 percent) than in the stateCLF (29.8 percent). Black (2.1 percent compared to 3.2 percent), Asian (1.9 com-pared to 2.6) and American Indian women (0.2 compared to 0.3) also had lowerparticipation rates.
I Hispanic women had a higher participation rate in this occupation (9.9 percent)than in the state CLF (6.8 percent).
J Minority males had a higher participation rate (35.4 percent) than in the state CLF(17.2 percent). This was especially true for Hispanic males (25.4 percent co. nparedto 10.4 percent).Nonminority males had a lower participation rate in this occupation (37.7 percent)than in the state CLF (40.1 percent).
1 o 0

Overview I he Five Most Populous States 79
High Tech: Top Three OccupationsMinority and Female Participation in 19&)
Refer to Tables 4 and 8.
Electrical and Electronic Assemblers
/ Women constituted a slightly larger percentage (48.4 percent) of all those employ-ed in this occupation than of the state CLF (42.7 percent).
,/ The Hispanic women's participation in this occupation (19.4 percent) was threetimes their participation in the state CLF (6.8 percent).Nonminority women had a lower participation rate in th;s occupation (18.9 per-cent) than in the state CLF (29.8 percent)
,/ All groups of minority males had higher participation rates in this occupation thanin the state CLF.Nonminority males had lower participation rates (21.8 percent) in this occupationthan in California's CLF (40.1 percent).
Computer Programmers
,/ The participation rates of males (54.9 percent) and females (45.1 percent) in thisoccupation was roughly equivalent to those in California's CLF (for males: 57.3percent; for females: 42.7).
,/ Minorities, males in particular, had lower participation rates in this occupationthan in the state CIF. Minorities held 24.5 percent of these jobs; a 5.6 percentlower participation rate than in California's CLF.
,/ Hispanics had the lowest participation rate of all groups in this occupation whencompared to their participation rate in the state CLF. Hispanic males, in particular,had a participation rate (3.2 percent) that was three times lower than that in thestate CLF (10.4 percent).
,/ Asians were 11.2 percent of the state's computer programmers. This participationrate was two times greater than their participation in the state CLF (5.5 percent).Nonminorities had a higher participation rate in this occupation (75.5 percent)than in the state CLF (69.9 percent).
Electrical Engineers
/ Nearly 94 percent of all those working in this occupation were male.,/ The particip,-..tion rate of Hispanics was (5.0 percent) smaller than their participa-
tion rate in the state CLF (17.2 percent).,/ Asian males had a 3.5 times greater participation rate in this occupation (10.4 per-
cent) than in the state CLF (2.9 percent).
0 6

80 Project 2000
Table 1
State Totals: By OcHigh Growth
cupationCalifornia
1980 StateCivilian Work
11,309,8
1980 NationalHigh Growth Work Force
41,504,050
Force
90
1980 State Total:High Growth
4,344,220
% State Total:High Growth
38.4%
State's Share of the NationalHigh Growth Work Force
10%
By Ranked Occupation
Occupation 1980 Total
1. Blue-Collar Worker Supervisors 521,5592. Secretaries 399,2143. Truck Drivers 374,915
4. Automotive Mechanics 332,451
5. Helpers in the Trades 297,069
5. Sales Clerks 288,263
7. Janitors and Sextons 259,425
8. Bookkeepers, Hand 226,385
9. Elementary School Teachers 215,035
10. General Clerks, Office 212,806
11. Cashiers 197,406
12. Typists 189,091
13. Waiters and Waitresses 165,343
14. Nurses, Professional 133,328
15. Accountants and Auditors 126,961
16. Kitchen Helpers 119,338
17. Nurse's Aides and Orderlies 116,741
18. Guards and Doorkeepers 102,653
19. Licensed Practical Nurses 38,304
20. Food Preparation and Service Workers 27,933
Total 4,344,220
107

Overview. The Five Most Populous States 81
Table 2
State Totals: By OccupationHigh Tech California
1980 StateCivilian Work Force
11,309,890
1980 State Total:High Tech
487,707
% State Total:High Tech
4%
1980 National State's Share of the NationalHigh Growth Work Force High Growth Work Force
3,945.632 12%
By Ranked Occupation
Occupation 1980 Tot21
1. Electrical and Electronic Assemblers 170,6092. Computer Programmers 60,8833. Electrical Engineers 58,2864. Computer Operators 48,8555. Electrical and Electronic Technicians 48,2886. Computer Systems Analyst 29,9077. Industrial Engineers 25,7408. Mechanical Engineers 23,3869. Data Processing Machine Mechanics 19,929
10. Peripheral EDP Equipment Operators 1,824
Total 487,707
108

82 Project 2000
Table 3
State Totals: By OccupationHigh Loss California
1980 StateCivilian Work Force
11,309,890
1980 State Total:High Loss
707,264
% State Total:High Loss
6.2%
1980 NationalHigh Growth Work Force
7,045,465
State's Share of the NationalHigh Growth Work Force
10%
By Ranked Occupation
Occupation 1980 Total
1. Farm Laborers 355,046
2. CompoOtors and Typesetters 109,103
3. Secondary School Teachers 75,378
4. Maids and Servants, Private 41,292
5. Farmers, Owners and Tenants 39,280
6. Teachers, College 39,279
7. Taxi Drivers 19,576
8. Child Care Workers, Private 16,856
9. Housekeepers, Private House 11,454
Total 707,264
109

Table 4Total Employed Civilian Labor Force in 1980 California
Number
Percent
TotalMen
Women
NonminorityMen
Women
MinorityMen
Women
BlackMen
Women
HispanicMen
Women
AsianMen
Women
Am/IndMen
Women
OtherMen
Women
11,309,890 7,906,152 3,403,738 736,754 1,941,045 616,966 J4,640 24,333
6,483,724 4,536,827 1,946,897 379,9'6 1,177,574 327,671 .17,462 14,214
4,826,166 3,369,325 1,456,841 356,778 763,471 289,295 37,178 10,119
100.0 69.9 30.1 6.5 17.2 5.5 0.7 0.2
57.3 40.1 17.2 3.4 10.4 2.9 0.4 0.1
42.7 29.8 12.9 3.2 6.8 2.6 0.3 0.1
Table 4.5
Total Employed Civilian Labor Force in 1980 National
TotalMen
Women
NonminorityMen
Women
MinorityMen
Women
BlackMen
Women
HispanicMen
Women
AsianMen
Women
Am/IndMen
Women
OtherMen
Women
103,718,076 85,258,303 18,459,773 10,219,477 5,918,947 1,682,924 539,811 98,614
Number 59,625,553 49,633,442 9,992,111 5,161,234 3,561,059 903,321 308,962 57,535
44,092,523 35,624,861 8,467,662 5,058,243 2,357,888 779,603 203,849 41,079
100.0 82.2 17.8 9.9 5.7 1.6 0.5 0.1
Percent 57.5 47.9 9.6 6.0 3.4 0.9 0.3 0.1
42.5 34.3 8.2 4.9 2.3 0.8 0.2 0.0

Table 5
State Aggregate for Minorities and Women1980 Participation Rates for the High Growth Occupations by Race, Sex and National Origin
California
TotalMen
Women
NonminorityMen
Women
MinorityMen
Women
BlackMen
Women
HispanicMen
Women
AsianMen
Women
Am/IndMen
Women
4,344,220 2,913,618 1,430,602 319,163 826,485 241,255 33,758Number 1,995,856 ,264,174 731,682 140,700 471,408 98,847 15,909
2,348,364 1,649,444 698,920 178,463 355,077 142,408 17,849
100.0 67.1 32.9 7.3 19.0 5.6 0.8Percent 45.9 29.1 16.8 3.2 10.9 2.3 0.4
54.1 38.0 16.1 4.1 8.2 3.3 0.4
OtherMen
Women
9,9414,8185,123
0.20.1
0.1

UMW 411
Table 6-Page 1Californi .
1980 Participation Rates for Each High Growth Occupation by Race, Sex and National Origin
Total Non minority Minority Black Hispanic Asian Am/Ind Other
Men Men Men Men Men Men Men Men
Women Women Women Women Women Women Women Women
Blue-Collar Worker Supervisors
521,559 397,013 124,546 23,881 74,691 21,231 3,824 919
Number 434,279 333,686 100,593 18,691 60,683 17,391 3,098 730
87,280 63,327 23,953 5,190 14,008 3,840 726 189
100.0 76.1 23.9 4.6 14.3 4.1 0.7 0.2
Percent 83.3 64.0 19.3 3.6 11.6 3.3 0.6 0.1
16.7 12.1 4.6 1.0 2.7 0.7 0.1 0.0
Secretaries
399,214 321,611 77,603 19,172 39,872 15,230 2,576 753
Number 6,169 4,687 1,482 440 633 345 57 7
393,045 316,924 76,121 18,732 39,239 14,885 2,519 746
100.0 80.6 19.4 4.8 10.0 3.8 0.6 0.2
Percent 1.5 1.2 0.4 0.1 0.2 0.1 0.0 0.0
98.5 79.4 19.1 4.7 9.8 3.7 0.6 0.2
1 1 2
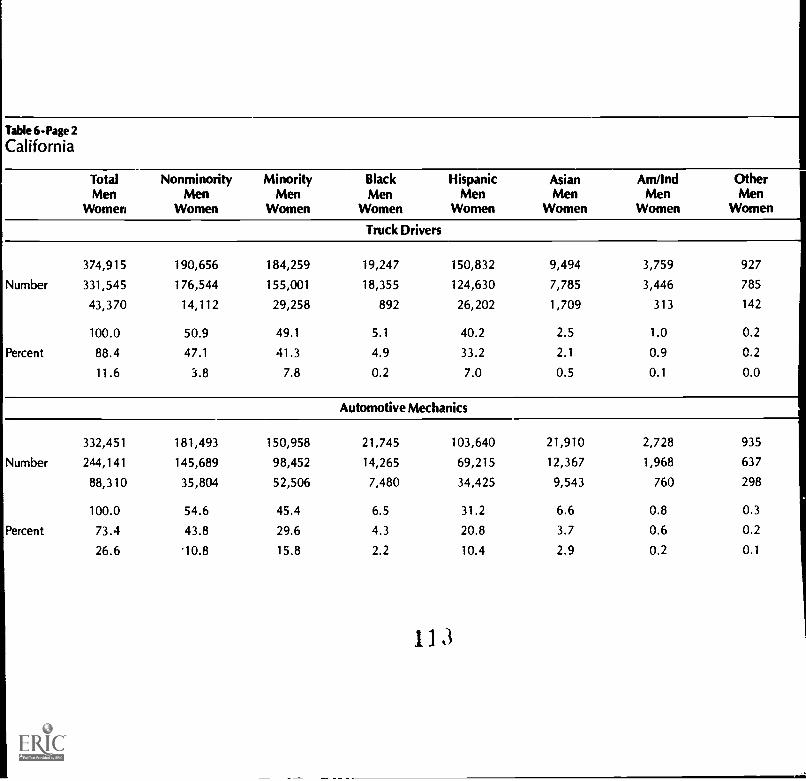
Table 6-Page 2
California
Total Nonminority Minority Black Hispanic Asian Am/Ind OtherMen Men Men Men Men Men Men Men
Women Women Women Women Women Women Women Women
Truck Drivers
374,915 190,656 184,259 19,247 150,832 9,494 3,759 927
Number 331,545 176,544 155,001 18,355 124,630 7,785 3,446 785
43,370 14,112 29,258 892 26,202 1,709 313 142
Percent
100.0
88.4
11.6
50.9
47.1
3.8
49.1
41.3
7.8
5.1
4.9
0.2
40.2
33.2
7.0
2.5
2.1
0.5
1.0
0.9
0.1
0.2
0.2
0.0
Automotive Mechanics
332,451 181,493 150,958 21,745 103,640 21,910 2,728 935
Number 244,141 145,689 98,452 14,265 69,215 12,367 1,968 637
88,310 35,804 52,506 7,480 34,425 9,543 760 298
Percent
100.0
73.4
26.6
54.6
43.8
'10.8
45.4
29.6
15.8
6.5
4.3
2.2
113
31.2
20.8
10.4
6.6
3.7
2.9
0.8
0.6
0.2
0.3
0.2
0.1
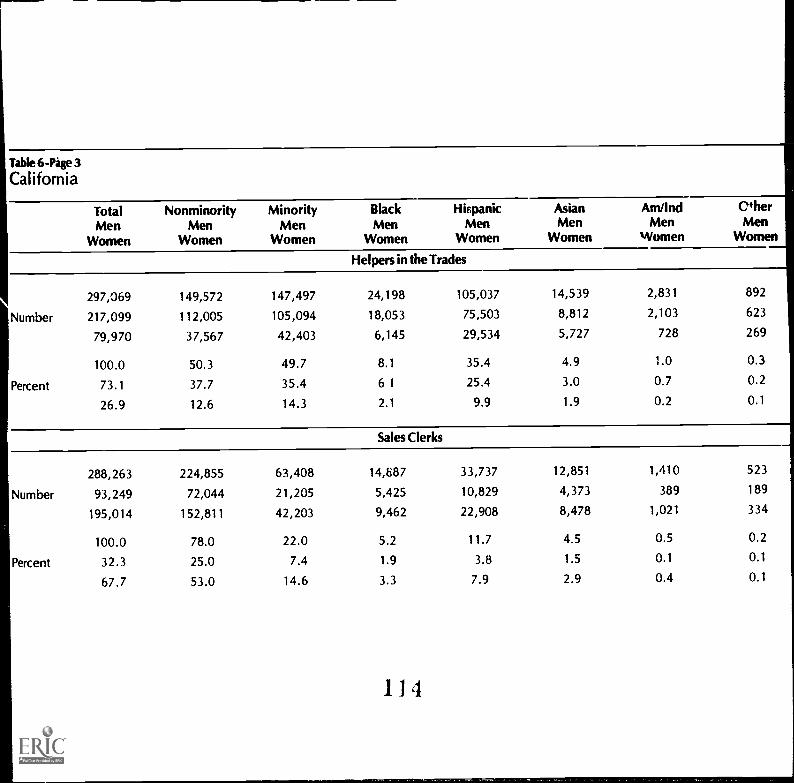
ITable 6-Page 3
California
TotalMen
Women
NonminorityMen
Women
MinorityMen
Women
BlackMen
Women
HispanicMen
Women
AsianMen
Women
Am/IndMen
Women
OtherMen
Women
Helpers in the Trades
297,069 149,572 147,497 24,198 105,037 14,539 2,831 892
Number 217,099 112,005 105,094 18,053 75,503 8,812 2,103 623
79,970 37,567 42,403 6,145 29,534 5,727 728 269
100.0 50.3 49.7 8.1 35.4 4.9 1.0 0.3
Percent 73.1 37.7 35.4 61 25.4 3.0 0.7 0.2
26.9 12.6 14.3 2.1 9.9 1.9 0.2 0.1
Sales Clerks
288,263 224,855 63,408 14,687 33,737 12,851 1,410 523
Number 93,249 72,044 21,205 5,425 10,829 4,373 389 189
195,014 152,811 42,203 9,462 22,908 8,478 1,021 334
100.0 78.0 22.0 5.2 11.7 4.5 0.5 0.2
Percent 32.3 25.0 7.4 1.9 3.8 1.5 0.1 0.1
67.7 53.0 14.6 3.3 7.9 2.9 0.4 0.1
1 l .4

Table 6-Page 4
California
Total Nonminority Minority Black Hispanic Asian Am/Ind OtherMen Men Men Men Men Men Men Men
Women Women Women Women Women Women Women Women
Janitors and Sextons
Number
Percent
Number
Percent
259,425 124,743 134,682 39,428 77,154 14,769 2,593 738
179,157 89,559 89,598 26,683 51,399 9,323 1,655 538
80,268 35,184 45,084 12,745 25,755 5,446 938 200
100.0 48.1 51.9 15.2 29.7 5.7 1.0 0.3
69.1 34.5 34.5 10.3 19.8 3.6 0.6 0.2
30.9 13.6 17.4 4.9 9.9 2.1 0.4 0.1
Bookkeepers, Hand
226,385 182,597 43,788 9,009 17,977 14,983 1,431 388
24,966 17,225 7,741 1,524 2,529 3,464 127 97
201,419 165,372 36,047 7,485 15,448 11,519 1,304 291
100.0 80.7 19.3 4.0 7.9 6.6 0.6 0.2
11.0 7.6 3.4 0.7 1.1 1.5 0.1 0.0
89.0 73.0 15.9 3.3 6.8 5.1 0.6 0.1

Table 6-Page 5
California
Total Nonminority Minority Black Hispanic Asian Am/Ind Other
Men Men Men Men Men Men Men Men
Women Women Women Women Women Women Women Women
Elementary School Teachers
215,035 173,506 41,529
Number 58,324 48,299 10,025
156,711 125,207 31,504
100.0 80.7 19.3
Percent 27.1 22.5 4.7
72.9 58.2 14.7
14,913 16,561
3,010 4,598
11,903 11,933
6.9
1.4
5.5
7.7
2.1
5.6
8,533 1,275
1,938 383
6,595 892
4.0 0.6
0.9 0.2
3.1 0.4
247
96
151
0.1
0.0
0.1
General Clerks, Office
212,806 139,643 73,163
Number 37,619 23,384 14,235
175,187 116,259 58,928
100.0 65.6 34.4
Percent 17.7 11.0 6.7
82.3 54.6 27.7
23,386
4,263
19,123
11.0
2.0
9.0
11 6
32,428 15,396 1,451
5,860 3,767 242
26,568 11,629 1,209
15.2 7.2 0.7
2.8 1.8 0.1
12.5 5.5 0.6
502
103
399
0.2
0.0
0.2

Table 6-Page 6
California
Women Women Women Women Women Women Women enWom
OtherMen Men Men Men Men Men Men MenTotal Nonminority Minority Black Hispanic Asian Am/Ind
Cask tiers
197,406 135,871 61,535 13,992 32,378 13,034 1,555 576
Number 49,261 32,149 17,112 4,069 8,164 4,366 300 213
148,145 103,722 44,423 9,923 24,214 8,668 1,255 363
Percent
100.0
25.0
75.0
68.8
16.3
52.5
31.2
8.7
22.5
7.1
2.1
5.0
16.4
4.1
12.3
6.6
2.2
4.4
0.8
0.2
0.6
0.3
0.1
0.2
Typists
189,091 117,761 71,330 23,059 )60 17,676 1,420 515
Number 25,589 16,993 8,596 2,541 3,319 2,480 214 42
163,502 100,768 62,734 20,518 25,341 15 196 1,206 473
Percent
100.0
13.5
86.5
62.3
9.0
53.3
37.7
4.5
33.2
12.2
1.3
10.9
1l1
15.2
1.8
13.4
9.3
1.3
8.0
0.8
0.1
0.6
0.3
0.0
0.3

Table 6-Page 7
California
Total Nonminority Minority Black Hispanic
Men Men Men Men Men
Women Women Women Women Women
Waiters and Waitresses
165,343 127,945 37,398
Number 29,236 17,541 11,695
136,107 110,404 25,703
100.0 77.4 22.6
Pei cent 17.7 10.6 7.1
82.3 66.8 15.5
4,264 20,894
1,037 6,689
3,177 14,205
2.6 12.6
0.7 4.0
1.9 8.6
Nurses, Professional
133,328 102,831 30,497
Number 7,131 5,210 1,921
126,197 97,621 28,576
100.0 77.1 22.9
Percent 5.3 3.9 1.4
94.7 73.2 21.4
9,051 7,344
593 683
8,458 6,661
680.4
6.3
118
5.5
0.5
5.0
AsianMen
Women
Am/IndMen
Women
OtherMen
Women
10,465 1,345 430
3,727 71 121
6,738 1,274 309
6.3 0.8 0.3
2.3 0.0 0.
4.1 0.8 0.2
12,922 878 302
564 60 21
12,358 818 281
9.7 0.7 0.2
0.4 0.0 0.0
9.3 0.6 0.2

Table 6-Page 8
California
TotalMen
Women
NonminorityMen
Women
MinorityMen
Women
BlackMen
Women
HispanicMen
Women
AsianMen
Women
Am/IndMen
Women
OtherMen
Women
Accountants and Auditors
126,961
69,936
57,025
100.0
55.1
44.9
96,231
54,819
41,412
75.8
43.2
32.6
30,730
15,117
15,6i 3
24.2
11.9
12.3
6,1%
2,379
3,817
4.9
1.9
3.0
8,812
4,688
4,124
6.9
3.7
3.2
14,873
7,718
7,155
11.7
6.1
5.6
579
188
391
0.5
0.1
0.3
270
144
126
0.2
0.1
0.1
Kitchen Helpers
119,338 63,102 56,236 8,443 36,743 9,666 1,016 368
71,614 32,919 38,695 3,968 27,578 6,360 546 243
47,724 30,183 17,541 4,475 9,165 3,306 470 125
100.0 52.9 47.1 7.1 30.8 8.1 0.9 0.3
60.0 27.6 32.4 3.3 23.1 5.3 0.5 0.240.0 25.3 14.7 3.7 2.7 2.8 0.4 0.1

Tabte 6-Page 9
California
Total Nonminority Minority Black Hispanic Asian Amilnd Other
Men Men Men Men Men Men Men Men
Women Women Women Women Women Women Women Women
Nurses' Aides and Orderlies
116,741 65,359 51,382 22,793 19,916 6,805 1,513 35S
17,367 9,885 7,482 3,203 3,051 999 165 64
99,374 55,474 43,900 19,590 16,865 5,806 1,348 291
100.0 56.0 44.0 19.5 17.1 5.8 1.3 0.3
14.9 8.5 6.4 2.7 2.6 0.9 0.1 0.1
85.1 47.5 37.6 16.8 14.4 5.0 1.2 0.2
Guards and Doorkeepers
102,653 73,831 28,822 13,209 11,446 3,012 984 171
90,498 65,729 24,769 11,219 9,986 2,623 808 133
12,155 8,102 4,053 1,990 1,460 389 176 38
100.0 71.9 28.1 12.9 11.2 2.9 1.0 0.2
88.2 64.0 24.1 10.9 9.7 2.6 0.8 0.2
11.8 7.9 3.9 19 1.4 0.4 0.2 0.0
1 U

Table 6-Page 10
California
Total Nonminority Minority Black Hispanic Asian Am/Ind OtherMen Men Men Men Men Men Men Men
Women Women Women Women Women Women Women Women
Licensed Practical Nurses
38,304 24,397 13,907 6,859 3,802 2,749 397 100
Number 2,561 1,685 876 419 246 146 49 16
35,743 22,712 13,031 6,440 3,556 2,603 348 84
Percent
100.0
6.7
93.3
63.7
4.4
59.3
36.3
2.3
34.0
17.9
1.1
16.8
9.9
0.6
9.3
7.2
0.4
6.8
1.0
0.1
0.9
0.3
0.0
0.2
Food Preparation and Service Workers-Fast Food Franchises
27,933 20,601 7,332 1,431 4,561 1,117 193 30
Number 6,115 4,122 1,993 513 1,125 299 40 16
21,818 16,479 5,339 918 3,436 818 153 14
100.0 73.8 26.2 5.1 16.3 4.0 0.7 0.1
Percent 21.9 14.8 7.1 1.8 4.0 1.1 0.1 0.1
78.1 59.0 19.1 3.3 12.3 2.9 0.5 0.1
121

[le7State Aggregate for Minorities and Women1980 Participation Rates for the High Tech Occupations by Race, Sex and National Origin
California
TotalMen
Women
NonminorityMen
Women
MinorityMen
Women
BlackMen
Women
HispanicMen
Women
AsianMen
Women
Am/IndMen
Women
OtherMen
Women
487,707 310,514 177,193 31,222 96,089 45,493 3,061 1,328
Number 324,974 221,955 103,019 17,397 54,592 28,418 1,756 856
162,733 88,559 74,174 13,825 41,497 17,075 1,305 472
100.0 63.7 36.3 6.4 19.7 9.3 0.6 0,3
Percent 66.6 45.5 21.1 3.6 11.2 5.8 0.4 0.2
33.4 18.2 15.2 2.8 8.5 3.5 0.3 0.1
122

Table 8-Page 1 California1983 Participation Rates for Each High Tech Occupation by Race, Sex and National Origin
Number
Percent
Number
Percent
TotalMen
Women
NonminorityMen
Women
MinorityMen
Women
BlackMen
Women
HispanicMen
Women
AsianMen
Women
Am/IndMen
Women
OtherMen
Women
Electrical and Electronic Assemblers
170,609 69,425 101,184 14,533 70,454 14,?.23 1,280 594
88,082 37,164 50,918 7,516 37,288 5,236 561 317
82,527 32,261 50,266 7,017 33,166 9,087 719 277
100.0 40.7 59.3 8.5 41.3 8.4 0.8 0.3
51.6 21.8 29.8 4.4 21.9 3.1 0.3 0.2
48.4 18.9 29.5 4.1 19.4 5.3 0.4 0.2
Computer Programmers
60,883 45,948 14,935 3,166 4,508 6,793 374 94
33,427 26,260 7,167 1,293 1,961 3,725 139 49
27,456 19,688 7,768 1,873 2,547 3,068 235 45
100.0 75.5 24.5 5.2 7.4 11.2 0.6 0.2
54.9 43.1 11.8 2.1 3.2 6.1 0.2 0.1
45.1 32.3 12.8 3.1 4.2 5.0 0.4 0.1
123

Table 8-Page 2
California
TotalMen
Women
Non minorityMen
Women
MinorityMen
Women
Black HispanicMen Men
Women Women
AsianMen
Women
Am/IndMen
Women
OtherMen
Women
Electrical Engineers
58,286 47,097 11,189 1,444 2,934 6,447 249 115
Number 54,722 44,570 10,152 1,140 2,612 6,048 243 109
3,564 2,527 1,037 304 322 399 6 6
100.0 80.8 19.2 2.5 5.0 11.1 0.4 0.2
Percent 93.9 76.5 17.4 2.0 4.5 10.4 0.4 0.2
6.1 4.3 1.8 0.5 0.6 0.7 0.0 0.0
Computer Operators
48,855 31,904 16,951 5,632 6,275 4,486 397 161
Number 19,949 12,521 7,428 2,160 2,810 2,204 186 68
28,906 19,383 9,523 3,472 3,465 2,282 211 93
100.0 65.3 34.7 11.5 12.8 9.2 0.8 0.3
Percent 40.8 25.6 15.2 4.4 5.8 4.5 0.4 0.1
59.2 39.7 19.5 7.1 7.1 4.7 0.4 0.2
124

Table 8-Page 3
California
Total Nonminority Minority Black Hispanic Asian Am/Ind OtherMen Men Men Men Men Men Men Men
Women Women Women Women Women Women Women Women
Electrical and Electronic Technicians
48,288 35,109 13,179 2,721 4,726 5,349 310 73
Number 41,900 30,992 10,908 2,293 3,762 4,526 260 67
6,388 4,117 2,271 428 964 823 50 6
Percent
100.0
86.8
13.2
72.7
64.2
8.5
27.3
22.6
4.7
5.6
4.7
0.9
9.8
7.8
2.0
11.1
9.4
1.7
0.6
0.5
0.1
0.2
0.1
0.0
Computer Systems Analysts
29,907 24,281 5,626 1,191 1,441 2,783 124 87
Number 22,413 1.5,486 3,927 778 1,087 1,917 78 67
7,494 5,795 1,699 413 354 866 46 20
Percent
100.0
74.9
25.1
81.2
61.8
19.4
18.8
13.1
5.7
4.0
2.6
1.4
4.8
3.6
1.2
125
9.3
6.4
2.9
0.4
0.3
0.2
0.3
0.2
0.1

obk 8-Page 4
aiifornia
Total Nonminority Minority Black Hispanic Asian Am/Ind OtherMen Men Men Men Men Men Men Men
Women Women Women Women Women Women Women Women
Industrial Engineers
25,740 21,562 4,178 750 1,705 1,517 129 77
Number 22,089 18,605 3,484 647 1,389 1,290 100 58
3,651 2,957 694 103 316 227 29 19
Percent
100.0
85.8
14.2
83.8
72.3
16.2
13.5
11.5 2.7
2.9 6.6 5.9
2.5 5.4 5.0
0.4 1.2 0.9
0.5
0.4
0.3
0.2
0.1 0.1
Mechanical Engineers
23,386 19,356 4,030 476 984 2,418 71 81
Number 22,835 18,950 3,885 445 945 2,352 62 81
551 406 145 31 39 66 9 0
Percent
100.0
97.6
2.4
82.8
81.0
1.7
17.2
16.6
0.6
2.0
1.9
0.1
4.2
4.0
0.2
10.3
10.1
0.3
0.3
0.3
0.0
0.3
0.3
0.0

Table 8-Page 5
Cal itorn la
Total Nonminority Minority Black Hispanic Asian Am/Ind OtherMen Men Men Men Men Men Men Men
Women Wor kin Women Women Women Women Women Women
Data Processing Machine Mechanics
19,929 14,682 5,247 1,197 2,752 1,136 122 40
Number 18,817 13,961 4,856 1,086 2,576 1,032 122 40
1,112 721 391 111 176 104 0 0
Percent
100.0
94.4
5.6
73.7
70.1
3.6
26.3
24.4
2.0
6.0
5.4
0.6
13.8
12.9
0.9
5.7
5.2
0.5
0.6
0.6
0.0
0.2
0.2
0.0
Peripheral EDP Equipment Operators
umber
ent
1,824 1,150 674 112 310 241 5 6
740 446 294 39 162 88 5 0
1,084 704 380 73 148 153 0 6
100.0
40.6
59.4
63.0
24.5
38.6
37.0
16.1
20.8
6.1
2.1
4.0
12/
17.0
8.9
8.1
13.2
4.8
8.4
0.3
0.3
0.0
0.3
0.0
0.3

Table 9
State Aggregate for Minorities and Women1980 Participation Rates for the High Loss Occupations by Race, Sex and National Origin
California
TotalMen
Women
NonminorityMen
Women
MinorityMen
Women
BlackMen
Women
HispanicMen
Women
AsianMen
Women
Am/IndMen
Women
OtherMen
Women
707,264 370,631 336,633 44,362 248,645 36,231 5,472 1,923
Number 395,612 205,374 190,238 21,128 148,137 17,005 3,042 926
311,652 165,257 146,395 23,234 100,508 19,226 2,430 997
100.0 52.4 47.6 6.3 35.2 5.1 0.8 0.3
Percent 55.9 29.0 26.9 3.0 20.9 2.4 0.4 0.1
44.1 23.4 20.7 3.3 14.2 2.7 0.3 0.1
128
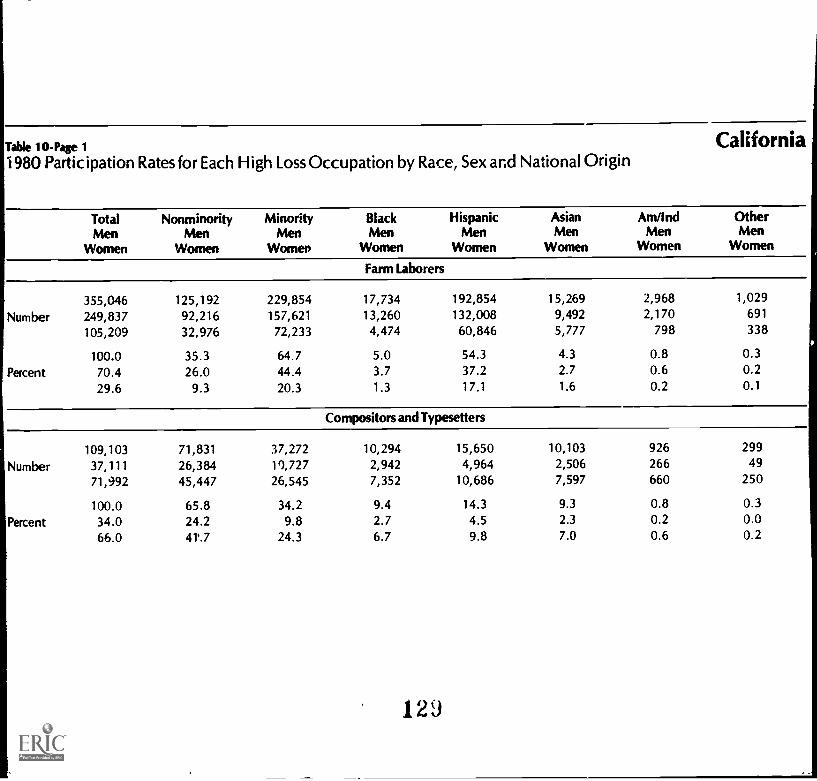
Table 10-Page 1
1980 Participation Rates for Each High Loss Occupation by Race, Sex and National Origin
Total Nonminority Minority Black Hispanic Asian Am/Ind OtherMen Men Men Men Men Men Men Men
Women Women Women Women Women Women Women Women
Farm Laborers
355,046 125,192 229,854Number 249,837 92,216 157,621
105,209 32,976 72,233
100.0 35.3 64.7Percent 70.4 26.0 44.4
29.6 9.3 20.3
17,734 192,854 15,269 2,968 1,029
13,260 132,008 9,492 2,170 691
4,474 60,846 5,777 798 338
5.03.71.3
54.337.217.1
4.32.71.6
0.80.60.2
0.30.20.1
Compositors and Typesetters
109,103 71,831 37,272
Number 37,111 26,384 10,72771,992 45,447 26,545
100.0 65.8 34.2
Percent 34.0 24.2 9.866.0 41'.7 24.3
10,294 15,650 10,103 926 299
2,942 4,964 2,506 266 49
7,352 10,686 7,597 660 250
9.42.76.7
14.34.59.8
9.32.3
7.0
0.80.20.6
0.30.00.2

Table 10-Page 2
California
Total Nonminority Minority Black Hispanic Asian Arrind Other
Men Men Men Men Men Men Men Men
Women Women Women Women Women Women Women Women
Secondary School Teachers
75,378 63,742 11,636 3,352 5,448 2,287 418 131
Number 36,952 31,939 5,013 1,224 2,541 980 212 56
38,426 31,803 0,623 2,128 2,90/ 1,307 206 75
Percent
100.0
49.0
51.0
84.6
42.4
42.2
15.4
6.7
8.8
4.4
1.6
2.8
7.2
3.4
3.9
3.0
1.3
1.7
0.6
0.3
0.3
0.2
0.1
0.1
Maids and Servants, Private
41,292 16,028 25,264 6,693 15,873 2,223 369 106
Number 3,396 1,697 1,699 461 946 239 38 15
37,896 14,331 23,565 6,232 14,927 1,984 331 91
Percent
100.0
8.2
91.8
38.8
4.1
34.7
61.2
4.1
57.1
130
38.4
2.3
36.1
5.4
0.6
4.8
0.9
0.1
0.8
0.3
0.0
0.2

Table 10-Page 3
California
TotalMen
Women
NonminorityMen
Women
Mine -ityMen
Women
Black HispanicMen Men
Women Women
AsianMen
Women
Am/IndMen
Women
OtherMeg
Women
Farmers, Owners and Tenants
39,280 32,890 6,390 229 3,186 2,776 143 56
Number 34,302 28,866 5,436 162 2,780 2,348 95 51
4,978 4,024 954 67 406 428 48 5
100.0 83.7 16.3 0.6 8.1 7.1 0.4 0.1
Percent 87.3 73.5 13.8 0.4 7.1 6.0 0.2 0.1
12.7 10.2 2.4 0.2 1.0 1.1 0.1 0.0
Teachers, College
39,279 32,866 6,413 1,579 2,713 1,785 261 75
Number 16,031 12,937 3,094 802 1,322 824 135 11
23,248 19,929 3,319 777 1,391 961 126 64
100.0 83.7 16.3 4.0 6.9 4.5 0.7 02
Percent 40.8 32.9 7.9 2.0 3.4 2.1 0.3 0.0
59.2 50.7 8.4 2.0 3.5 2.4 0.3 0.2
131

Table 10Page 4
California
Total Nonminority Minority Black Hispanic Asian Am/Ind OtherMen Men Men Men Men Men Men Men
Women Women Women Women Women Women Women Women
Taxi Drivers
19,576 12,827 6,749 2,409 3,561 560 173 46
Number 16,901 10,705 6,196 2,175 3,326 541 108 46
2,675 2,122 553 234 235 19 65 0
100.0 65.5 34.5 12.3 18.2 2.9 0.9 0.2
Percent 86.3 54.7 31.7 11.1 17.0 2.8 0.6 0.2
13.7 10.8 2.8 1.2 1.2 0.1 0.3 0.0
Child Care Workers, Private
Number
Percent
16,856 11,535 5,321 888 3,529 643 133 128
569 403 166 41 81 33 11 0
16,287 11,132 5,155 847 3,448 610 122 128
100.0
3.4
96.6
68.4
2.4
66.0
31.6
1.0
30.6
5.3
0.2
5.0
20.9
0.5
20.5
3.8
0.2
3.6
0.8
0.1
0.7
0.8
0.0
0.8

Table 10Page 5
California
Total Nonminority Minority Black Hispanic As:an Am/Ind OtherMen Men Men Men Men Men Men Men
Women Women Women Women Women Women Women Women
Housekeepers, Private House
11,454 3,720 7,734 1,184 5,831 585 81 53
Number 513 227 286 61 169 42 7 7
10,941 3,493 7,448 1,123 5,662 543 74 46
100.0 32.5 67.5 10.3 50.9 5.1 0.7 0.5
Percent 4.5 2.0 2.5 0.5 1.5 0.4 0.1 0.1
95.5 30.5 65.0 9.8 49.4 4.7 0.6 0.4
133

Overview: The Five Most Popo loos States 107
New York
Total Employed CivilianLabor Force in 1980
Refer to Tables 4 and 4.5.
%I 7.6 percent of the nation's CLF was employed in New York.,/ Minority participation in New York's CLF (21.6 percent) was somewhat greater
than their participation in the national CLF (17.8 percent).,/ All minority groups (except American Indians) had hther participation rates in
New York's CLF (21.6 percent) than in the national CIF (17.8 percent): Blacks:11.6 percent compared to 9.9 percent; Hispanics: 7.7 percent compared to 5.7percent; and Asians: 2.0 perce nt compared to 1.6 percent.
New York's High Growth Occupations:1980 Minority and Female Participation Rates
Refer to Tables 1, 4 and 5.
,/ Project 2000 High Growth occupations employed 39.5 percent of the state's CLF.This was roughly equivalent to the national percentage.
,/ Minorities had a slightly higher participation rate in the state's High Growth occu-pations (22.8 percent) than in the state CLF (21.6 percent).
,/ Blacks had a higher participation rate in High Growth occupations (13.1 percent)than in the state CLF (11.6 percent).
,/ Women had a higher participation rate in High Growth occupations (56.3 percent)than in the state CIF (43.4 percent).
New York's High Tech Occupations:1980 Minority and Female Participation Rates
Refer to Tables 2, 4 and 7.
%I 7.4 percent of the nation's High Tech work force was employed in New York.,/ High Tech occupations employed 3.6 percent of the state CLF; a slightly higher
rate than for the national CLF (3.0 percent).,/ Females had a lower participation rate in the High Tech category (34.8 percent)
than in the state CLF (43.4). The same was true of their participation on a nationallevel.
,/ MinoWy males and females had roughly the same participation rates in the HighTech category (21.8 percent) and the state CLF (21.6).
134

108 Project 2000
New York's High Loss Occupations:1980 Minority and Female Participation
Refer to Tables 3, 4 and 9.
,/ 6.4 percent of the nation's High Loss work force wasemployed in N,w York.5.6 percent of the state CLF worked in the nine High Lossoccupations. This percen-
tage was somewhat below the national level (6.0percent)./ Females had higher participation rates in the High Loss category (47.3 percent)
than in the state CIF (43.4 percent)./ Black females Lid a higher participation rate in the High Loss category (9.4 per-
cent) than in the state CLF (6.0 percent). This difference was the greatest of any
group.
High Growth:Top Five OccupationsMinority and Female Participation in 1980
Refer to Tables 4 and 6.
Secretaries
Females made up 98.5 percent of all those working in this occupation.Nonminority females had the highest participation rate in this occupation, (84.1percent) compared to their participation in New York's CLF (32.2 percent).All groups of males had lower participation rates in this occupation (1.5 percent)
than in the state CLF (56.6 percent).
Blue-Collar Worker Supervisors
,/ Males composed 84 percent of all blue-collar worker supervisors.Nonminority males had a higher participation rate in this occupation (72.6 percent)
than in the state CIF (45.2 percent).All female groups had lower participation rates in this occupation (15.7 percent)
than in the state CLF (43.4 percent): black women, 1.6 percent compared to 6.0
percent; Asian women, 0.2 percent compared to 0.9 percent.
Janitors and Sextons
Males had a higher participation rate in this occupation (70.4 percent) than in the
state CLF (56.6 percent).The only two groups which had lower participation rates in this occupation than
in the state CLF were nonminority females, and Asians.All minority males, except Asians and Other, had higher participation rates in this
occupation thin in the state CLF.

Overview: The Five Most Populous States 109
Automotive Mechanics
%I Males accounted for the majority of those working in this occupation: 71.2 per-cent.
,/ All groups of males, except Asians, had higher participation rates in this occupationthan in the state CLF.
,/ Asian women had a lower participation rate in this occupation (0.4 percent) thanin the state CLF (0.9 percent). This difference was the greatest of any group.
Sales Clerks
,/ Females had a higher participation rate in this occupation (65.4 percent) than inNew York's CLF (43.4 percent). Nonminority females accounted for nearly 58 per-cent of all those working as sales clerks.
/ In contrast, minority males and females had lower participation rates (15.7 percent)in this occupation than in the state CLF (21.6 percent).
High Tech:Top Three OccupationsMinority and Femaie Participation in 1980
Refer to Tables 4 and 5.
Electrical and Electronic Assemblers
,/ Women had a higher participation rate in this occupation (51.2 percent) than inthestateCLF (43.4 percent).
,/ All minority males, except Asians, had higher participation rates in this occupationthan in the state CLF.
Computer Programmers
,/ Women had a slightly lower participation rate in this occupation (41.9 percent)than in thestateCLF (43.4 percent).
,/ Minority women, except Asians, experienced most of this lower participation.,/ All groups of minority males had lower participation rates in this occupation than
in the state CLF. The exception to this was Asians, who had more than twice theparticipation rate in this occupation than in the state CLF.
Computer OperatGrs
,/ Nonminority males had a lower participation rate in this occupation (46.4 percent)than in the state CLF (56.6 percent).
,/ Women had a higher participation rate in this occupation (53.6 percent) than inthe state CLF (43.4 percent).
,/ Minority males had a slightly higher participation rate in this occupation (14.9 per-cent) than in the state CLF (11.4 percent).
136
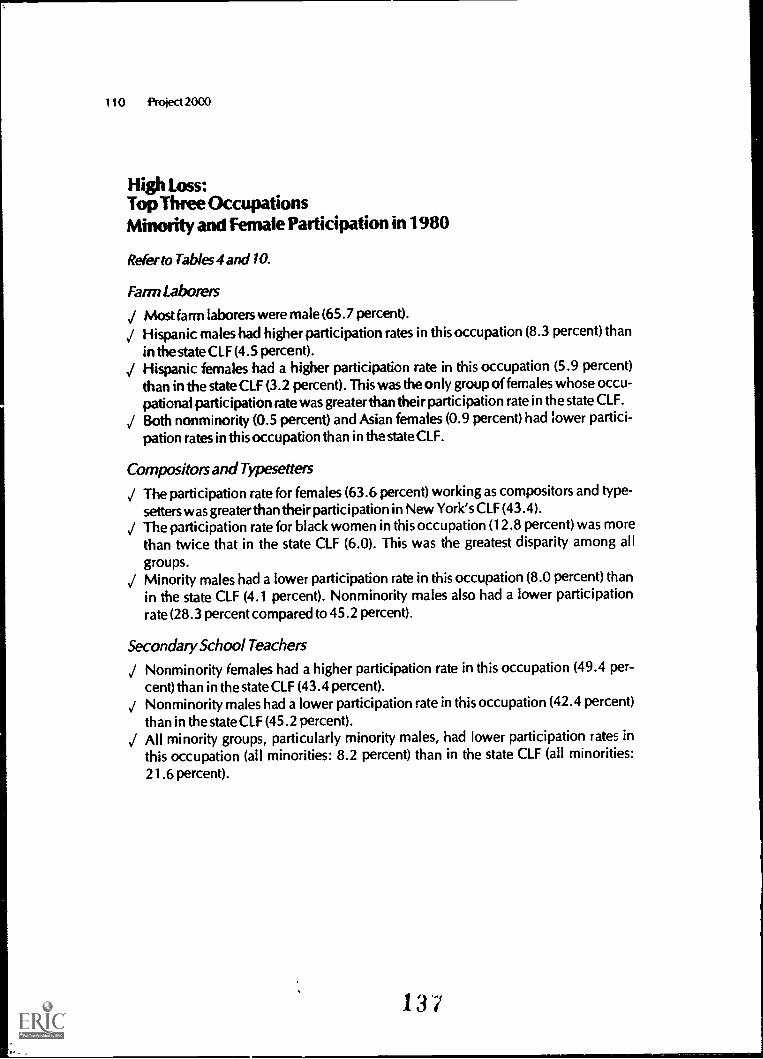
High Loss:Top Three OccupationsMinority and Female Participation in 1980
Farm Laborers
Most farm laborers were male (65.7 percent).,/ Hispanic males had higher participation rates in this occupation (8.3 percent) than
in the state CLF (4.5 percent).Hispanic females had a higher participation rate in this occupation (5.9 percent)than in the state CIF (3.2 percent). This was the only group of females whose occu-pational participation rate was greater than their participation rate in the state CLF.
,/ Both nonminority (0.5 percent) and Asian females (0.9 percent) had lower partici-pation rates in this occupation than in the state CLF.
Compositors and Typesetters
I The participation rate for females (63.6 percent) working as compositors and type-setters was greater than their participation in New York's CIF (43.4).
,/ The participation rate for black women in this occupation (12.8 percent) was morethan twice that in the state CIF (6.0). This was the greatest disparity among al Igroups.
,/ Minority males had a lower participation rate in this occupation (8.0 percent) thanin the state CLF (4.1 percent). Nonminority males also had a lower participationrate (28.3 percent compared to 45.2 percent).
Secondary School Teachers
I Nonminority females had a higher participation rate in this occupation (49.4 per-cent) than in the state CLF (43.4 percent).
,/ Nonminority males had a lower participation rate in this occupation (42.4 percent)
than in the state CLF (45.2 percent).,/ All minority groups, particularly minority males, had lower participation rates in
this occupation (all minorities: 8.2 percent) than in the state CLF (all minorities:21.6 percent).

Overview: The Five Most Populous Stati s 11 1
Table 1
State Tota;s: By OccupationHigh Growth New York
1980 State 1980 State Total: % State Total:Civilian Work Force High Growth High Growth
7,928,161 3,135,190 39.5%
1980 NationalHigh Growth Work Force
State's Share of the NationalHigh Growth Work Force
41,504,050 7.55%
By Ranked Occupation
Occupation 1980 Total
1. Secretaries 349,4542. Blue-Collar Worker Supervisors 334,3843. Janitors and Sextons 214,8204. Automotive Mechanics 202,4765. Sales Clerks 190,4236. Helpers in the Trades 182,8417. Elementary School Teachers 179,3158. Truck Drivers :62,6249. General Clerks, Office 162,324
10. Bookkeepers, Hand 161,17711. Typists 160,76512. Cashiers 140,43613. Nurse's Aides and Orderlies 128,28914. Nurses, Professionai 122,00515. Guards and Doorkeepers 112,11916. Waiters and Waitresses 106,22417. Accountants and Auditors 95,38818. Kitchen Helpers 84,19219. Licensed Practical Nurses 30,68420. Food Preparation and Service Workers 15,250
Total 3,135,190
1.3S

112 Project 2000
Table 2
State Totals: By OccupationHigh Tech New York
1980 StateCivilian Work Force
1980 State Total:High Tech
7,928,161 292,660
% State Total:High Tech
3.6%
1980 National State's Share of the NationalHigh Growth Work Force High Growth Work Force
3,945,632 7.4%
By Ranked Occupation
Occupation 1980 Total
1. Electrical and Electronic Assemblers 109,027
2. Computer Programmers 43,040
3. Computer Operators 33,265
4. Electrical Engineers 25,234
5. Computer Systems Analysts 19,858
6. Electrical and Electronic Technicians 18,995
7. Mechanical Engineers 15,430
8. Industrial Engineers 13,748
9. Data Processing Machine Mechanics 11,672
10. Peripheral EDP Equipment Operators 2,391
Total 292,660
133
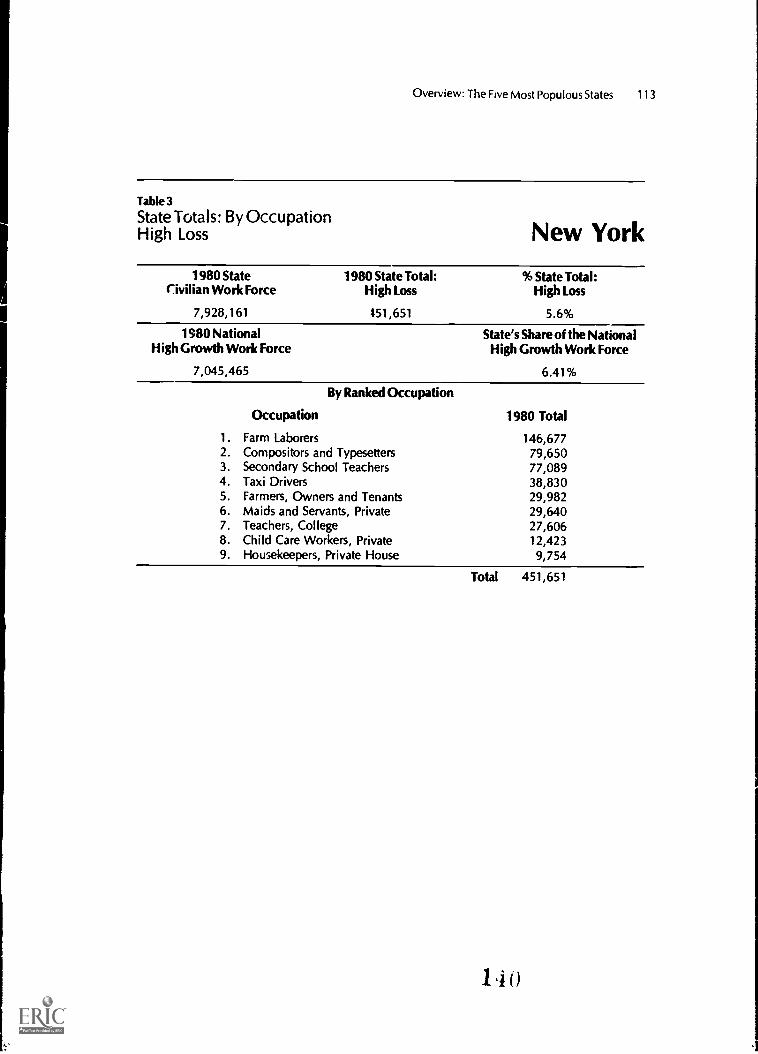
Overview: The Five Most Populous States 1 1 3
Table 3
State Totals: By OccupationHigh Loss New York
1980 StateCivilian Work Force
1980 State Total:High Loss
7,928,161 451,651
% State Total:High Loss
5.6%
1980 NationalHigh Growth Work Force
7,045,465
State's Share of the NationalHigh Growth Work Force
6.41%
By Ranked Occupation
Occupation
1. Farm Laborers2. Compositors and Typesetters3. Secondary School Teachers4. Taxi Drivers5. Farmers, Owners and Tenants6. Maids and Servants, Private7. Teachers, College8. Child Care Workers, Private9. Housekeepers, Private House
1980 Total
146,67779,65077,08938,83029,98229,64027,60612,4239,754
Total 451,651
14 0

Table 4
Total Employed Civilian Labor Force in 1980 New York
TotalMen
Women
NonminorityMen
Women
MinorityMen
Women
BlackMen
Women
HispanicMen
Women
AsianMen
Women
Am/IndMen
Women
OtherMen
Women
7,928,161Number 4,485,209
3,442, 952
100.0Percent 56.6
43.4
6,214,8673,582,4872,632,380
78.445.233.2
1,713,294902,722810,572
21.611.410.2
919,629444,931474,698
11.65.66.0
610,673354,55025b,123
7.74.53.2
157,43788,85768,580
2.01.1
0.9
16,4939,3417,152
0.20.1
0.1
9,0625,0434,019
0.10.1
0.1
Table 4.5
Total Employed Civilian Labor Force in 1980 Nationai
TotalMen
Women
NonminorityMen
Women
MinorityMen
Women
BlackMen
Women
HispanicMen
Women
AsianMen
Women
Am/IndMen
Women
OtherMen
Women
103,718,076Number 59,625,553
44,092,523
100.0Percent 57.5
42.5
85,258,30349,633,44235,624,561
82.247.934.3
18,459,7739,992,1118,467,662
17.89.68.2
10,219,4775,161,2345,058,243
9.95.04.9
5,918,9473,561,0592,357,888
5.73.42.3
141
1,682,924903,321779,603
1.60.90.8
539,811308,962203,849
0.50.30.2
98,61457,53541,079
0.1
0.1
0.0

Table 5
State Aggregate for Minorities and Women1980 Participation Rates for the High Growth Occupations by Race, Sex and National Origin
New York
TotalMen
Women
NonminorityMen
Women
MinorityMen
Women
BlackMen
Women
HispanicMen
Women
AsianMen
Women
Am/IndMen
Women
OtherMen
Women
3,135,190 2,420,501 714,689 410,849 241,427 51,939 6,997 3,477
Number 1,371,190 1,047,163 324,027 166,083 129,566 23,610 3,341 1,427
1,764,000 1,373,338 390,662 244,766 111,861 28,329 3,656 2,050
100.0 77.2 22.8 13.1 7.7 1.7 0.2 0.1
Perce .& 43.7 33.4 10.3 5.3 4.1 0.8 0.1 0.0
56.3 43.8 12.5 7.8 3.6 0.9 0.1 0.1
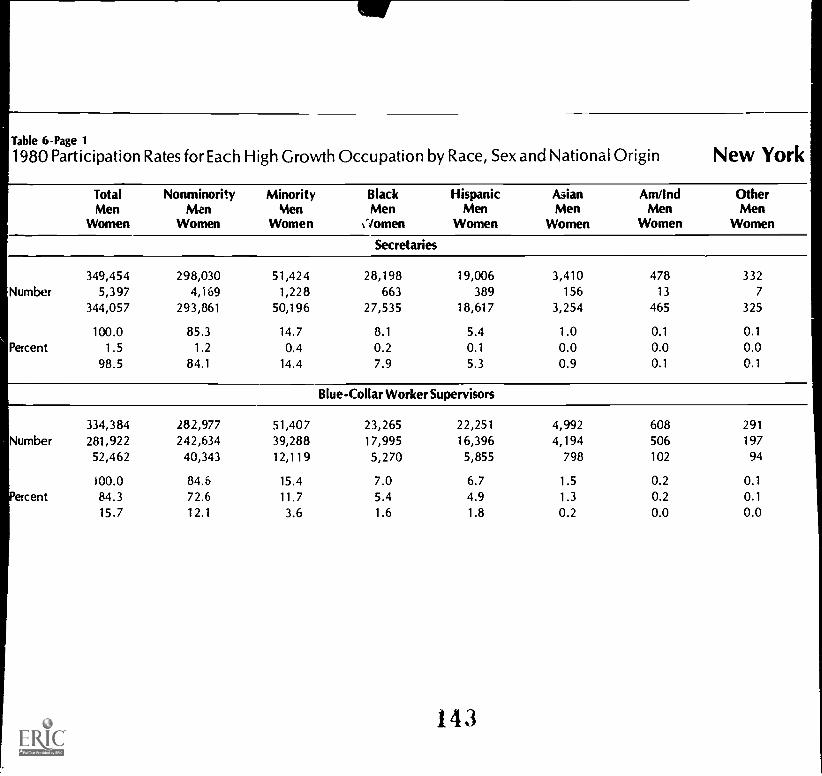
Mr
Table 6-Page 1
1980 Participation Rates for Each High Growth Occupation by Race, Sex and National Origin New York
Total Nonminority Minority Black Hispanic Asian Am/Ind OtherMen Men Men Men Men Men Men Men
Women Women Women 7omen Women Women Women Women
Secretaries
349,454 298,030 51,424Number 5,397 4,169 1,228
344,057 293,861 50,196
100.0 85.3 14.7Percent 1.5 1.2 0.4
98.5 84.1 14.4
28,198 19,006663 389
27,535 18,617
8.1 5.40.2 0.1
7.9 5.3
Blue-Collar Worker Supervisors
334,384 282,977 51,407Number 281,922 242,634 39,288
52,462 40,343 12,119
100.0 84.6 15.4ercent 84.3 72.6 11.7
15.7 12.1 3.6
23,265 22,251
17,995 16,3965,270 5,855
7.0 6.75.4 4.91.6 1.8
143
3,410 478 332156 13 7
3,254 465 325
1.0 0.1 0.1
0.0 0.0 0.00.9 0.1 0.1
4,992 608 291
4,194 506 197
798 102 94
1.5 0.2 0.1
1.3 0.2 0.1
0.2 0.0 0.0

Table 6-Page 2
New York
Total Nonminority Minority Black Hispanic Asian Am/Ind OtherMen Men Men Men Men Men Men Men
Women Women Women Women Women Women Women Women
janitors and Sextons
214,820 130,429 84,391 46,748 34,953 1,667 -.)5 368
Number 151,137 92,538 58,599 30,206 26,590 1,149 448 206
63,683 37,891 25,792 16,542 8,363 518 207 162
Percent
100.0 60.7 39.3 21.8 16.3 0.8 0.3 0.2
70.4 43.1 27.3 14." 12.4 0.5 0.2 0.1
29.6 17.6 12.0 7.7 3.9 0.2 0.; 0.1
Automotive Mechanics
202,476 152,657 49,819 25,955 21,212 1,869 586 197
Number 144,145 111,321 32,824 17,070 14,159 1,091 373 131
58,331 41,336 16,995 8,885 7,053 778 213 66
Percent
100.0
71.2
28.8
75.4
55.0
20.4
24.6
16.2
8.4
12.8
844.4
144
10.5
7.0
3.5
0.9
0.5
0.4
0.3
0.2
0.1
0.1
0.1
0.0

Table 6-Page 3
New York
TotalMen
Women
NonminorityMen
Women
MinorityMen
Women
BlackMen
Women
HispanicMen
Women
Asian Am/Ind OtherMen Men Men
Women Women Women
Sales Clerks
190,423 160,608 29,815 14,276 12,079 3,050 250 160
Number 65,835 52,662 13,173 5,877 5,508 1,650 94 44
124,588 107,946 16,642 8,399 6,571 1,400 156 116
Percent
100.0
34.6
65.4
84.3
27.7
56.7
15.7
6,9
8.7
7.5
3.1
4.4
6.3
2.9
3.5
1.6
0.9
0.7
0.1
0.0
0.1
0.1
0.0
0.1
Helpers in the Trades
182,841 133,819 49,022 23,936 22,296 1,966 701 123
Number 131,258 98,359 32,899 16,638 14,551 1,136 485 89
51,583 35,460 16,123 7,298 7,745 830 216 34
ercent
100.0
71.8
28.2
73.2
53.8
19.4
26.8
18.0
8.8
13.1
9.1
4.0
12.2
8.0
4.2
1.1
0.6
0.5
0.4
0.3
0.1
0.1
0.0
0.0

Table 6-Page 4
New York
Total Nonminority Minority Black Hispanic Asian Am/Ind Other
Men Men Men Men Men Men Men Men
Women Women Women Women Women Women Women Women
Elementary School Teachers
179,315 160,127 19,188 12,313 5,422 1,091 218 144
Number 52,624 48,268 4,356 2,497 1,410 312 76 61
126,691 111,859 14,832 9,816 4,012 779 142 83
Percent
100.0
29.3
70.7
89.3
26.9
62.4
10.7
2.4
8.3
6.9
1.4
5.5
3.0
0.8
2.2
0.6
0.2
0.4
0.1
0.0ll ...... g
0.1
0.0
0.0
Truck Drivers
162,624 133,023 29,601 17,892 10,455 497 656 101
Number 153,792 124,991 28,801 17,386 10,251 458 612 94
8,832 8,032 800 506 204 39 44 7
Percent
100.0
94.6
5.4
81.8
76.9
4.9
18.2
17.7
0.5
11.0
10.7
0.3
146
6.4
6.3
0.1
0.3
0.3
0.0
0.4
0.4
0.0
0.1
0.1
0.0

Tabie6-PageS
New York
Total Nonminority Minority Black Hispanic Asian Amilnd OtherMen Men Men Men Men Men Men Men
Women Women Women Women Women Women Women WomenGeneral Clerks, Office
162,324 114,307 48,017Number 38,713 25,261 13,452
123,611 89,046 34,565
Percent
100.0
23.8
76.2
70.4
15.6
54.9
29.6
8.3
21.3
31,644 12,586 3,164 338 285
7,781 3,996 1,419 109 147
23,863 8,590 1,745 229 138
19.5
4.8
14.7
7.8
2.5
5.3
1.9
0.9
1.1
Bookkeepers, Hand
0.2
0.1
0.1
0.2
0.1
0.1
161,177 135,295 25,882
Number 23,064 16,793 6,271
138,113 118,502 19,611
Percent
100.0
14.3
85.7
83.9
10.4
73.5
16.1
3.9
12.2
13,583 8,460 3,421 200 218
3,149 2,184 846 34 58
10,434 6,276 2,575 166 160
8.4
2.0
6.5
5.2
1.4
3.9
2.1
0.5
1.6
0.1
0.0
0.1
0.1
0.0
0.1

Table 6-Page 6
New York
Total Nonminority Minority Black Hispanic Asian Am/Ind Other
Men Men Men Men Men Men Men Men
Women Women Women Women Women Women Women Women
Typists
'60,765 114,111 46,654 30,026 13,220 2,798 407 203
Number 22,775 16,166 6,609 3,763 2,159 644 30 13
137,990 97,945 40,045 26,253 11,061 2,154 377 190
Percent
100.0
14.2
85.8
71.0
10.1
60.9
29.0
4.1
24.9
18.7
2.3
16.3
8.2
1.3
6.9
1.7
0.4
1.3
0.3
0.0
0.2
0.1
0.0
0.1
Cashiers
140,436 109,198 31,238 15,746 12,195 2,927 171 199
Number 28,658 20,399 8,259 3,626 3,810 763 3 57
111,778 88,799 22,979 12,120 8,385 2,164 168 142
Percent
100.0
20.4
79.6
77.8
14.5
63.2
22.2
5.9
16.4
11.2
2.6
8.6
148
8.7
2.7
6.0
2.1
0.5
1.5
0.1
0.0
0.1
0.1
0.0
0.1

Table 6-Page 7
New York
Total Nonminority Minority Black Hispanic Asian Am/Ind OtherMen Men Men Men Men Men Men Men
Women Women Women Women Women Women Women Women
Nurse's Aides and Orderlies
128,289 61,867 66,422 54,763 9,064 1,695 589 311Number 18,840 8,839 10,001 7,406 2,076 391 88 40
109,449 53,028 56,421 47,357 6,988 1,304 501 271
Percent
100.0
14.7
85.3
48.2
6.9
41.3
51.8
7.8
44.0
42.7
5.8
36.9
7.1
1.6
5.4
1.3
0.3
1.0
0.5
0.1
0.4
0.2
0.0
0.2
Nurses, Professional
122,005 91,225 30,780 20,397 3,670 6,407 181 125Number 5,698 3,831 1,867 1,259 235 359 6 8
116,307 87,394 28,913 19,138 3,435 6,048 175 117
Percent
100.0
4.7
95.3
74.8
3.1
71.6
25.2
1.5
23.7
16.7
1.0
15.7
14J
3.0
0.2
2.8
5.3
0.3
5.0
0.1
0.0
0.1
0.1
0.0
0.1

Table 6-Page 8
New York
Total Nonminority Minority Black Hispanic Asian Am/Ind Other
Men Men Men Men Men Men Men Men
Women Women Women Women Women Women Women Women
Guards and Doorkeepers
112,119 80,661 31,458
Number 103,674 75,257 28,417
8,445 5,404 3,041
100.0 71.9 28.1
Percent 92.5 67.1 25 3
7.5 4.8 2.7
21,799 8,778
19,496 8,136
2,303 642
19.4
17.4
2.1
7.8
7.3
0.6
Waiters and Waitresses
106,224 87,777 18,447
Number 26,006 15,757 10,249
80,218 72,020 8,198
100.0 82.6 17.4
Percent 24.5 14.8 9.6
75.5 67.8 7.7
5,115 7,294
1,528 4,291
3,587 3,003
4.8
1.4
3.4
150
6.9
4.0
2.8
570 215 96
516 179 90
54 36 6
0.5 0.2 0.1
0.5 0.2 0.1
0.0 0.0 0.0
5,706 229 103
4,340 30 60
1,366 199 43
5.4 0.2 0.1
4.1 0.0 0.1
1.3 0.2 0.0

Table 6-Page 9
New York
Total Nonminority Minority Black Hispanic Asian Am/Ind OtherMen Men Men Men Men Men Men Men
Women Women Women Women Women Women Women Women
Accountants and Auditors
95,388 80,107 15,281 7,085 4,018 3,964 113 101
Number 67,902 58,475 9,427 4,330 2,554 2,428 67 4827,486 21,632 5,854 2,755 1,464 1,536 46 53
Percent
100.0
71.2
28.8
84.0
61.3
22.7
16.0
9.9
6.1
7.4
4.5
2.9
4.2
2.7
1.5
4.2
2.5
1.6
0.1
0.1
0.0
0.1
0.1
0.1
Kitchen Helpers
84,192 60,949 23,243 9,115 11,917 1,838 294 79Number 43,224 27,012 16,212 4,501 9,928 1,542 175 66
40,968 33,937 7,031 4,614 1,989 296 119 13
Percent
100.0
51.3
48.7
72.4
32.1
40.3
27.6
19.3
8.4
10.8
5.3
5.5
14.2
11.8
2.4
151
2.2
1.8
0.4
0.3
0.2
0.1
0.1
0.1
0.0

Table 6-Page 10
New York
TotalMen
Women
NonminorityMen
Women
MinorityMen
Women
BlackMen
Women
HispanicMen
Women
AsianMen
Women
Am/IndMen
Women
OtherMen
Women
Licensed Practical Nurses
30,684 21,005 9,679 7,648 1,284 640 77 30
Number 1,167 735 432 369 37 26 0 0
29,517 20,270 9,247 7,279 1,247 614 77 30
100.0 68.5 31.5 24.9 4.2 2.1 0.3 0.1
Percent 3.8 2.4 1.4 1.2 0.1 0.1 0.0 0.0
96.2 66.1 30.1 23.7 4.1 2.0 0.3 C.1
Food Preparation and Service Workers
15,250 12,329 2,921 1,345 1,267 267 31 11
Number 5,359 3,696 1,663 543 906 190 13 11
9,891 8,633 1,258 802 361 77 18 0
100.0 80.8 19.2 8.8 8.3 1.8 0.2 0.1
Percent 35.1 24.2 10.9 3.6 5.9 1.2 0.1 0.1
64.9 56.6 8.2 5.3 2.4 0.5 0.1 0.0
152

Table 7
State Aggregate for Minorities and Women1980 Participation Rates for the High Tech Occupations by Race, Sex and National Origin
New York
TotalMen
Women
NonminorityMen
Women
MinorityMen
Women
BlackMen
Women
HispanicMen
Women
AsianMen
Women
Am/IndMen
Women
OtherMen
Women
292,660 228,791 63,869 32,921 22,557 7,346 681 364Number 190,817 154,179 36,638 17,524 13,207 5,285 363 259
101,843 74,612 27,231 15,397 9,350 2,061 318 105
100.0 78.2 21.8 11.2 7.7 2.5 0.2 0.1Percent 65.2 52.7 12.5 6.0 4.5 1.8 0.1 0.1
34.8 25.5 9.3 5.3 3.2 0.7 0.1 0.0
153

Table 8-Page 1
1980 Participation Rates for Each High Tech Occupation by Race, Sex and National OriginNew York
Number
Percent
Number
Percent
TotalMen
Women
NonminorityMen
Women
MinorityMen
Women
BlackMen
Women
HispanicMen
Women
AsianMen
Women
Am/IndMen
Women
OtherMen
Women
Electrical and Electronic Assemblers
109,027 77,229 31,798 16,574 13,464 1,246 373 141
53,232 37,743 15,489 8,039 6,731 478 166 75
55,795 39,486 16,309 8,535 6,733 768 207 66
100.0 70.8 29.2 15.2 12.3 1.1 0.3 0.1
48.8 34.6 14.2 7.4 6.2 0.4 0.2 0.1
51.2 36.2 15.0 7.8 6.2 0.7 0.2 0.1
Computer Programmers
43,040 34,765 8,275 4,168 2,225 1,770 53 59
24,989 20,505 4,484 2,047 1,271 1,094 18 54
18,051 14,260 3,791 2,121 954 676 35 5
100.0 80.8 19.2 9.7 5.2 4.1 0.1 0.1
58.1 47.6 10.4 4.8 3.0 2.5 0.0 0.1
41.9 33.1 8.8 4.9 2.2 1.6 0.1 0.0

Table 8-Page 2
New York
TotalMen
Women
Non minorityMen
Women
MinorityMen
Women
Black HispanicMen Men
Women Women
AsianMen
Women
Am/IndMen
Women
OtherMen
Women
Computer Operators
33,265 23,151 10,114 6,381 2,741 861 96 35
Number 15,420 10,452 4,968 2,817 1,599 507 32 13
17,845 12,699 5,146 3,564 1,142 354 64 22
100.0 69.6 30.4 19.2 8.2 2.6 0.3 0.1
Percent 46.4 31.4 14.9 8.5 4.8 1.5 0.1 0.0
53.6 38.2 15.5 10.7 3.4 1.1 0.2 0.1
Electrical Engineers
25,234 22,559 2,675 787 669 1,160 41 18
Number 24,470 21,915 2,555 731 622 1,149 41 12
764 644 120 56 47 11 0 6
100.0 89.4 10.6 3.1 2.7 4.6 0.2 0.1
Percent 97.0 86.8 10.1 2.9 2.5 4.6 0.2 0.0
3.0 2.6 0.5 0.2 0.2 0.0 0.0 0.0
156

Table 8-Page 3
New York
Total Nonminority Minority Black Hispanic Asian Am/Ind OtherMen Men Men Men Men Men Men Men
Women Women Women Women Women Women Women Women
Computer Systems Analysts
19,858 17,367 2,491 1,128 630 704 21 8
Number 15,543 13,716 1,827 775 479 544 21 8
4,315 3,651 664 353 151 160 0 0
Percent
100.0
78.3
21.7
87.5
69.1
18.4
12.5
9.2
3.3
5.7
3.9
1.8
3.2
2.4
0.8
3.5
2.7
0.8
0.1
0.1
0.0
0.0
0.0
0.0
Electrical and Electronic Technicians
18,995 15,992 3,003 1,582 905 451 30 35
Number 17,262 14,749 2,513 1,247 806 400 25 35
1,733 1,243 490 335 99 51 5 0
Percent
100.0
90.9
9.1
84.2
77.6
6.5
15.8
13.2
2.6
8.3
6.6
1.8
156
4.8
4.2
0.5
2.4
2.1
0.3
0.2
0.1
0.0
0.2
0.2
0.0

Table 8-Page 4
New York
Total Nonminority Minority Black Hispanic Asian Am/Ind OtherMen Mai Men Men Men Men Men Men
Women Women Women Women Women Women Women Women
Mechanical Engineers
15,430 13,828 1,602 484 418 654 20 26
Number 15,176 13,606 1,570 484 411 629 20 26
254 222 32 0 7 25 0 0
Percent
100.0
98.4
1.6
89.6
88.2
1.4
10.4
10.2
0.2
3.1
3.1
0.0
2.7
2.7
0.0
4.2
4.1
0.2
0.1
0.1
0.0
0.2
0.2
0.0
Peripheral EDP Equipment Operators
Number
Percent
2,391 1,661 730 453 245 32 0 0
962 687 275 143 106 26 0 0
1,429 974 455 310 139 6 0 0
100.0
40.2
59.8
69.5
28.7
40.7
30.5
11.5
19.0
18.9
6.0
13.0
171
10.2
4.4
5.8
1.3
1.1
0.3
0.0
0.0
0.0
0.0
0.0
0.0

Table C-Page 5
New York
Total Nonminority Minority Black Hispanic Asian Am/Ind OtherMen Men Men Men Men Men Men Men
Women Women Women Women Women Women Women Women
Industrial Engineers
13,748 12,823 925 431 234 238 0 22
Number 12,645 11,821 824 379 195 228 0 22
1,103 1,002 101 52 39 10 0 0
Percent
100.0
92.0
8.0
93.3
86.0
7.3
6.7
6.7
0.7
3.1
2.8
0.4
1.7
1.4
0.3
1.7
1.7
0.1
0.0
3.0
0.0
0.2
0.2
0.0
Data Processing Machine Mechanics
11,672 9,416 2,256 933 1,026 230 47 20
Number 11,118 8,985 2,133 862 987 230 40 14
554 431 123 71 39 0 7 6
Percent
100.0
95.3
4.7
80.7
77.0
3.7
19.3
18.3
1.1
158
8.0
7.4
0.6
8.6
8.5
0.3
2.0
2.0
0.0
0.4
0.3
0.1
0.2
0.1
0.1

Table 9
State Aggregate for Minorities and Women1980 Participation Rates for the High Loss Occupations by Race, Sex and National Origin
New York
TotalMen
Women
NonminorityMen
Women
MinorityMen
Women
BlackMen
Women
HispanicMen
Women
AsianMen
Women
Am/IndMen
Women
OtherMen
Women
451,651 332,127 119,524 69,368 42,161 6,164 1,200 631
Number 238,163 185,327 52,836 26,901 22,161 2,886 611 277
213,488 146,800 66,688 42,467 20,000 3,278 589 354
100.0 73.5 26.5 15.4 9.3 1.4 0.3 0.1
Percent 52.7 41.0 11.7 6.0 4.9 0.6 0.1 0.1
47.3 32.5 14.8 9.4 4.4 0.7 0.1 0.1
1 5

Table 10-Page 1
1980 Participation Rates for Each High Loss Occupation by Race, Sex and National Origin
Total Nonminority Minority Black Hispanic Asian Am/Ind OtherMen Men Men Men Men Men Men Men
Women Women Women Women Women Women Women Women
Farm Laborers
146,677 104,446 42,231 18,852 20,940 613Number 96,433 70,661 25,772 12,152 12,217 849
50,244 33,785 16,459 6,700 8,723 764
100.0 71.2 28.8 12.9 14.3 1.1
Percent 65.7 48.2 17.6 8.3 8.3 0.634.3 23.0 11.2 4.6 5.9 0.5
617 209465 89"62 120
0.40.30.1
0.1
0.1
0.1
Compositors and Typesetters
79,650 57,846 21,804 13,246 6,557 1,740Number 28,679 22,580 6,391 3,265 2,431 573
50,244 35,266 15,413 9,981 4,076 1,167
100.0 72.6 27.4 16.6 8.2 2.2Percent 36.4 28.3 8.0 4.1 3.1 0.7
63.6 44.3 19.4 12.5 5.1 1.5
174 8739 33
135 54
0.20.00.2
0.1
0.00.1

Table 10-Page 2
New York
Total Nonminority Minority Black Hispanic Asian Am/Ind OtherMen Men Men Men Men Men Men Men
Women Women Women Women Women Women Women Women
Secondary School Teachers
77,089 70,767 6,322 4,071 1,740 358 119 34
Number 34,786 32,659 2,127 1,262 678 128 37 22
42,303 38,108 4,195 2,809 1,062 230 82 12
Percent
100.0
45.1
54.9
91.8
42.4
49.4
8.2
2.8
5.4
5.3
1.6
3.6
2.3
0.9
1.4
0.5
0.2
0.3
0.2
0.0
0.1
0.0
0.0
0.0
Taxi Drivers
38,830 23,43' 15,396 8,505 5,748 982 51 110
Number 37,308 22,291 15,017 8,246 5,651 974 44 102
1,522 1,143 379 259 97 8 7 8
Percent
100.0
96.1
3.9
60.4
57.4
2.9
39.6
38.7
1.0
21.9
21.2
0.7
14.8
14.6
0.2
2.5
2.5
0.0
0.1
0.1
0.0
0.3
0.3
0.0

Table 10-Page 3
New York
Total Nonminority Minority Black Hispanic Asian Am And OtherMen Men Men Men Men Men Men Men
Women Women Women Women Women Women Women Women
Farmers, Owners and Tenants
29,982 29,655 327 112 132 55 20 8
Number 26,299 26,029 270 95 99 48 20 8
3,683 3,626 57 17 33 7 0 0
Percent
100.0
87.7
12.3
98.9
86.8
12.1
1.1
0.9
0.2
0.4
0.3
0.1
0.4
0.3
0.1
0.2
0.2
0.0
0.1
0.1
0.0
0.0
0.0
0.0
fvsaids and Servants, Private
29,640 9,998 19,642 15,572 3,411 422 115 122
Number 1,993 881 1,112 763 285 51 6 7
27,647 9,117 18,530 14,809 3,126 371 109 115
Percent
100.0
6.7
93.3
33.7
3.0
30.8
66.3
3.8
62.5
52.5
2.6
50.0
162
11.5
1.0
10.5
1.4
0.2
1.3
0.4
0.0
0.4
0.4
0.0
0.4

Table 10-Page 4
New York
Total Nonminority Minority Black Hispanic Asian Am/Ind OtherMen Men Men Men Men Men Men Men
Women Women Women Women Women Women Women Women
Teachers, College
27,606 23,629 3,977 2,199 1,189 521 52 16
Number 11,603 9,758 1,845 934 652 243 0 16
16,003 13,871 2,132 1,265 537 278 52 0
Percent
100.0
42.0
58.0
85.6
35.3
50.2
14.4
6.7
7.7
8.0
3.4
4.6
4.3
2.4
1.9
1.9
0.9
1.0
0.2
0.0
0.2
0.1
0.1
0.0
Child Care Workers, Private
Number
Percent
12,423 9,285 3,138 2,172 758 157 27 24
436 327 109 75 34 0 0 0
11,987 8,958 3,029 2,097 724 157 27 24
100.0
3.5
96.5
74.4
2.6
72.1
25.3
0.9
24.4
17.5
0.6
16.9
163
6.1
0.3
5.8
1.3
0.0
1.3
0.2
0.0
0.2
0.2
0.0
0.2

Table 10-Page 5
New York
Total Nonminority Minority Black Hispanic Asian Am/Ind Other
Men Men Men Men Men Men Men Men
Women Women Women Women Women Women Women Women
Housekeepers, Private House
9,754 3,067 6,687 4,639 1,686 316 25 21
Number 334 141 193 109 64 20 0 0
9,420 2,926 6,494 4,530 1,622 296 25 21
100.0 31.4 68.6 47.6 17.3 3.2 0.3 0.2
Porcent 3.4 1.4 2.0 1.1 0.7 0.2 0.0 0.0
96.6 30.0 66.6 46.4 16.6 3.0 0.3 0.2
164

138 Project 2000
Texas
Total Employed CivilianLabor Force in 1980
Refer to Tables 4 and 4.5.
,/ 6.3 percent of the nation's CLF worked in Texas.,/ Texas had a significantly higher proportion of minorities in its civilian labor force
(29.7 percent) than were in the national CLF (17.8 percent).,/ Nearly 30 percent of the state CLF was composed of minority workers.,/ Hispanics made up 17.6 percent of the state CLF.
Texas' High Growth Occupations:1980 Minority and Female Participation
Refer to Tables 1, 4 and 5.
,/ 6.3 percent of the nation's High Growth work force was employed in Texas.,/ 40.2 percent of the state CLF was employed in the designated High Growth occu-
pations. This proportion was slightly higher than the national level of participation(39.7 percent).
,/ Women had a higher participation rate in the High Growth category (54.0 percent)than in the state CLF (41.4 percent).
,/ Minorities also had a higher participation rate in the High Growth occupations(32.5 percent) than in the state CLF (29.7 percent).
Texas' High Tech Occupations:1980 Minority and Female Participation
Refer to Tables 2, 4 and 7.
,/ 5.6 percent of the nation's High Tech labor force was employed in Texas.,/ 3.2 percent of the state CLF was employed in the designated High Tech occupa-
tions.,/ Females had a lower participation rate in the High Tech category (34.5 percent)
than in the state CLF (41.4 percent).,/ Hispanics, in particular, had a lower participation rate in this category (14.3 per-
cent) than in the state CLF (17.6 percent).,/ Asians had a higher participation rate in this category (2.5 percent) than in the state
CLF (0.9 percent).
1 r0 t)

Overview: The Five Most Populous States 139
Texas' High Loss Occupations:1980 Minority and Female Participation
Refer to Tables 3, 4 and 9.
,/ 6.0 percent of the nation's High Loss work force was employed in Texas.,/ 6.4 percent of the state CLF was employed in the designated High Loss occupa-
tions; a slightly lower proportion than in the national CLF (6.7 percent).,/ 41 percent of those working in the High Loss category were employed as farm
laborers.,/ Minorities had a much higher participation rate in the High Loss category (41.5
percent) than in the state CLF (29.7 percent).,/ Minority women had a higher participation rate in the High Loss category (18.7
percent) than in the state CLF (12.6 percent). This was the greatest difference inparticipation of all groups.
High Growth: Top Five OccupationsMinority and Female Participation in 1980
Refer to Tables 4 and 6.
Blue-Collar Worker Supervisors
,/ Females, particularly minority women, had lower participation rates in this occu-pation (all females: 14.1 percent) than in the state CLF (all females: 41.4 percent).Nonminority males had a higher participation rate in this occupation (68.6 percent)than in the state CLF (58.6 percent).
,/ Minority males had a participation rate in this occupation (17.0 percent) similarto that in the state CLF (17.1 percent).
Secretaries
,/ Nearly all of those working in this occupation were female (99.1 percent).,/ Non minority women represented almost 84 percent of all secretaries.,/ Males constituted a mere 0.9 percent of all those employed as secretaries.
Truck Drivers
,/ Males made up 93 percent of all those working in this occupation.,/ Minority males had a much higher participation rate in this occupation (42.7 per-
cent) than in the state CLF (17.1 percent). This was particularly true for Black andHispanic males.
,/ Black females had a much lower participation rate in this occupation (0.6 percent)than in the state CLF (5.3 percent). This was also true for nonminority females, whohad a participation rate of 4.1 percent compared to their 28.8 percent portion ofthe state CLF.
166

140 Project 2000
Helpers in the Trades
Females had a lower participation rate in this occupation (22.0 percent) than inthe state CLF (41.4 percent).Nonminority females had a 2.5 times lower participation rate in this occupationthan in the state CLF.
,/ All groups of minority males had higher participation rates in this occupation thanin the state CLF. This difference in participation was greatest for black males (13.4percent compared to 5.5 percent).
Automotive Mechanics
%I Males accounted for 77.5 percent of all those working in this occupation.Nonminority females had a much lower participation rate in this occupation (10.8percent) than in the state CLF (28.8 percent).
,/ Asian women had double the participation rate (0.8 percent) in this occupation asin the state CLF (0.4 percent).
,/ All groups of minority males had higher participation rates in this occupation (27.9percent) than in the state CLF (17.1 percent).
High Tech: Top Three OccupationsMinority and Female Participation in 1980
Refer to Tables 4 and 8.
Electrical and Electronic Assemblers
%I Men and women were equally represented in this occupation.,/ Minority women made up 25 percent of all those working in this occupation.,/ Asian women had a four times higher rate of participation than in the state CLF.
Nonminorities had a lower participation rate in this occupation (51.6 percent) thanin the state CLF (70.3 percent).
Computer Programmers
The numbers of men and women employed as computer programmers were nearlyequal.Nonminorities had a higher participation rate in this occupation (79.7 percent)than in the state CLF (70.3 percent).
,/ Minority women had comparable participation rates (12.2 percent) in this occupa-tion and in the state CLF (12.6 percent). The exception was Asian women, whohad a 2.5 times higher participation rate than in the state CLF.Al! groups of minority males, except Asians, had lower participation rates in thisoccupation than in the state CLF.
Computer Operators
Females had a higher participation rate in this occupation (57.5 percent) than inthe state CLF (41.4 percent).
167

Overview: The Five Most Populous States 141
,/ All groups of males, except Asians, had lower participation rates in this occupation(42.5 percent) than in the state CLF (58.6 percent). This difference was the greatestfor Hispanic males.
High Loss: Top Three OccupationsMinority and Female Participation in 1980
Refer to Tables 4 and 10.
Farm Laborers
,/ 42 percent ot all farm laborers were Hispanic.,/ Most farm laborers (57.9 percent) were minorities.,/ Nonminority women hc,d a lower participation rate in this occupation (11.3 per-
cent) than in the state CLF (28.8 percent).
Farmers, Owners and Tenants,/ 91 percent of all those working in this occupation were male.,/ 93.6 percent of all those working as farmers, owners and tenants were nonminor-
ity.
Compositors and Typesetters
%I Females had a higher participation rate in this occupation (72.8 percent) than inthe state CLF (41.4 percent)
,/ Almost 50 percent of all those working in this occupation were nonminority.,,/ All groups of minority women had higher participation rates in this occupation than
in the state CLF.
1 6 S

142 Project 2000
Table 1
State Totals: By OccupationHigh Growth Texas
1980 StateCivilian Work Force
1980 State Total:High Growth
6,546,335 2,634,292
% State Total:High Growth
40.2%
1980 NationalHigh Growth Work Force
State's Share of the NationalHigh Growth Work Force
41,504,050 6.3%
By Ranked Occupation
Occupation 1980 Total
1. Blue-Collar Worker Supervisors 379,990
2. Secretaries 272,120
3. Truck Drivers 242,250
4. Helpers in the Trades 200,8395. Automotive Mechanics 175,892
6. Janitors and Sextons 164,788
7. Sales Clerks 159,486
8. Elementary School Teachers 153,712
9. Bookkeepers, Hand 134,440
10. Cashiers 129,654
11. Typists 91,10712. General Clerks, Office 85,710
13. Nurse's Aides and Orderlies 84,258
14. Waiters and Waitresses 74,865
15. Accountants and Auditors 70,894
16. Nurses, Professional 61,02017. Kitchen Helpers 54,622
18. Guards and Doorkeepers 53,129
19. Licensed Practical Nurses 33,93820. Food Preparation and Service Workers 11,578
Total 2,634,292
1 6 3

Overview: The Five Most Populous States 143
Table 2
State Totals: By OccupationHigh Tech Texas
1980 State 1980 State Total: % State Total:Civilian Work Force High Tech High Tech
6,546,335 221,125 3.2%
1980 National State's Share of the NationalHigh Tech Work Force High Tech Work Force
3,945,632 5.6%
By Ranked Occupation
Occupation 1980 Total
1. Electrical and Electronic Assemblers 76,2032. Computer Programmers 30,7853. Computer Operators 28,6184. Electrical Engineers 20,8625. Electrical and Electronic Technicians 20,0286. Data Processing Machine Mechanics 11,2697. Computer Systems Analysts 11,1348. Industrial Engineers 11,0709. Mechanical Engineers 10,330
10. Peripheral EDP Equipment Operators 826
Total 221,125

144 Project 2000
Table 3
State Totals: By OccupationHigh Loss Texas
1980 State 1980 State Total: % State Total:
Civilian Work Force High Loss High Loss
6,546,335 424,177 6.4%
1980 NationalHigh Loss Work Force
State's Share of the NationalHigh Loss Work Force
7,045,465 6.0%
By Ranked Occupation
Occupation 1980 Total
1. Farm Laborers 175,246
2. Farmers, Owners and Tenants 70,798
3. Compositors and Typesetters 50,965
4. Secondary School teachers 50,302
5. Maid:, and Set ,ants, Private 34,155
6. Teachers, College 18,745
7. Taxi Drivers 10,283
8. Childcare Workers, Private 8,519
9. Housekeepers, Private House 5,164
Total 424,177
171

able 4
otal Employed Civilian Labor Force in 1980 Texas
Total Nonminority Minority Black Hispanic Asian Am/Ind OtherMen Men Men Men Men Men Men Men
Women Women Women Women Women Women Women Women
6,546,335 4,599,300 1,947,035 709,774 1,150,190 58,841 21,718 6,512
umber 3,833,595 2,711,151 1,122,444 359,971 712,953 32,629 12,875 4,016
2,712,740 1,888,149 824,591 349,803 437,237 26,212 8,843 2,496
100.0 70.3 29.7 10.8 17.6 0.9 0.3 0.1
Percent 58.6 41.4 17.1 5.5 10.9 0.5 0.2 0.1
41.4 28.8 12.6 5.3 6.7 0.4 0.1 0.0
Table 4.5
Total Employed Civilian Labor Force in 1980 National
Total Nonminority Minority Black Hispanic Asian Am/Ind OtherMen Men Men Men Men Men Men Men
Women Women Women Women Women Women Women Women
103,718,076 85,258,303 18,459,773 10,219,477 5,918,947 1,682,924 539,811(128) 98,614
Number 59,625,553 49,633,442 9,992,111 5,161,234 3,561,059 903,321 308,962 57,535
44,092,523 35,624,861 8,467,662 5,058,243 2,357,888 779,603 230,849 41,079
100.0 82.2 17.8 9.9 5.7 1.6 0.5 0.1
Per:ent 57.5 47.9 9.6 5.0 3.4 0.9 0.3 0.1
42.5 34.3 8.2 4.9 2.3 0.8 0.2 0.0
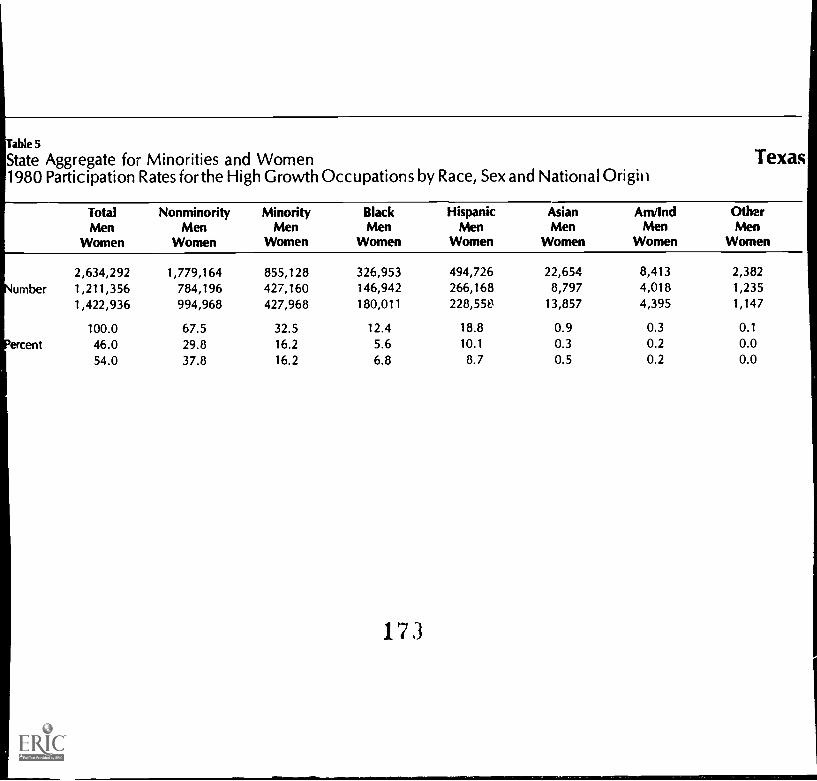
Table 5
State Aggregate for Minorities and Women1980 Participation Rates for the High Growth Occupations by Race, Sex and National Origin
Texas
Total Nonminority Minority Black Hispanic Asian Am/Ind OtherMen Men Men Men Men Men Men Men
Women Women Women Women Women Women Women Women
2,634,292 1,779,164 855,128 326,953 494,726 22,654 8,413 2,382
umber 1,211,356 784,196 427,160 146,942 266,168 8,797 4,018 1,235
1,422,936 994,968 427,968 180,011 228,5513 13,857 4,395 1,147
100.0 67.5 32.5 12.4 18.8 0.9 0.3 0.1
ercent 46.0 29.8 16.2 5.6 10.1 03 0.2 0.054.0 37.8 16.2 6.8 8.7 0.5 0.2 0.0
173

Table 6-Page 11980 Participation Rates for Each High Growth Occupation by Race, Sex and National Origin
Texas
TotalMen
Women
NonminorityMen
Women
MinorityMen
Women
BlackMen
Women
HispanicMen
Women
AsianMen
Women
Am/IndMen
Women
OtherMen
Women
Blue-Collar Worker Supervisors
379,990 301,709 78,281 23,835 50,450 2,484 1,308 204
Number 326,375 261,848 64,527 18,601 42,514 2,080 1,128 204
53,615 39,861 13,754 5,234 7,936 404 180 0
100.0 79.4 20.6 6.3 13.3 0.7 0.3 0.1
Percent 85.9 68.6 17.0 4.9 11.2 0.5 0.3 0.1
14,1 10.5 3.6 1.4 2.1 0.1 0.0 0.0
Secretaries
272,120 229,466 42,654 12,717 28,088 972 731 146
Number 2,522 1,935 587 147 412 28 0 0
269,598 227,531 42,067 12,570 27,676 944 731 146
100.0 84.3 15.7 4.7 10.3 0.4 0.3 0.1
Percent 0.9 0.7 0.2 0.1 0.2 0.0 0.0 0.0
99.1 83.6 15.5 4.6 10.2 0.3 0.3 0.1
174

Table 6-Page 2
Texas
Total Nonminority Minority Black Hispanic Asian Am/Ind OtherMen Men Men Men Men Men Men Men
Women Women Women Women Women Women Women Women
Truck Drivers
242,250 130,922 111,328 36,895 73,166 219 853 195
Number 224,372 120,933 103,439 35,448 66,796 203 799 193
17,878 9,989 7,889 1,447 6,370 16 54 2
Percent
100.0
92.6
7.4
54.0
49.9
4.1
46.0
42.7
3.3
15.2
14.6
0.6
30.2
27.6
2.6
0.1
0.1
0.0
0.4
0.3
0.0
0.1
0.1
0.0
Helpers in the Trade&
200,839
Number 156,584
44,255
Percent
100.0
78.0
22.0
105,318 95,521 35,627 57,179 1,751 703 261
81,868 74,716 26,825 45,952 1,204 519 216
23,450 20,805 8,802 11,227 547 184 45
52.4
40.8
11.7
47.6
37.2
10.4
17.7
13.4
4.4
17i
28.5
22.9
5.6
0.9
0.6
0.3
0.4
0.3
0.1
0.1
0.1
0.0

I
Table 6-Page 3
Texas
Total Nonminority Minority Black Hispanic Asian Am/kwl OtherMen Men Men Men Men Men Men Men
Women Women Women Women Women Women Women Women
Automotive Mechanics
175,892 106,425 69,467 24,898 40,843 2,773 737 216
Number 136,399 87,408 48,991 15,317 31,503 1,414 589 168
34,493 19,017 20,476 9,581 9,340 1,359 148 48
100.0 60.5 39.5 14.2 23.2 1.6 0.4 0.1
Percent 77.5 49.7 27.9 8.7 17.9 G.8 0.3 0.1
22.5 10.8 11.6 5.4 5.3 0.8 0.1 0.0
janitors and Sextons
164,788 57,795 106,993 50,036 55,122 1,088 528 219
Number 95,193 39,588 55,605 24,524 30,079 626 270 106
69,595 18,207 51,388 25,512 25,043 462 258 113
100.0 35.1 64.9 30.4 33.5 0.7 0.3 0.1
Percent 57.8 24.0 33.7 14.9 18.3 0.4 0.2 0.1
42.2 11.0 31.2 15.5 15.2 0.3 0.2 0.1
1 7 6
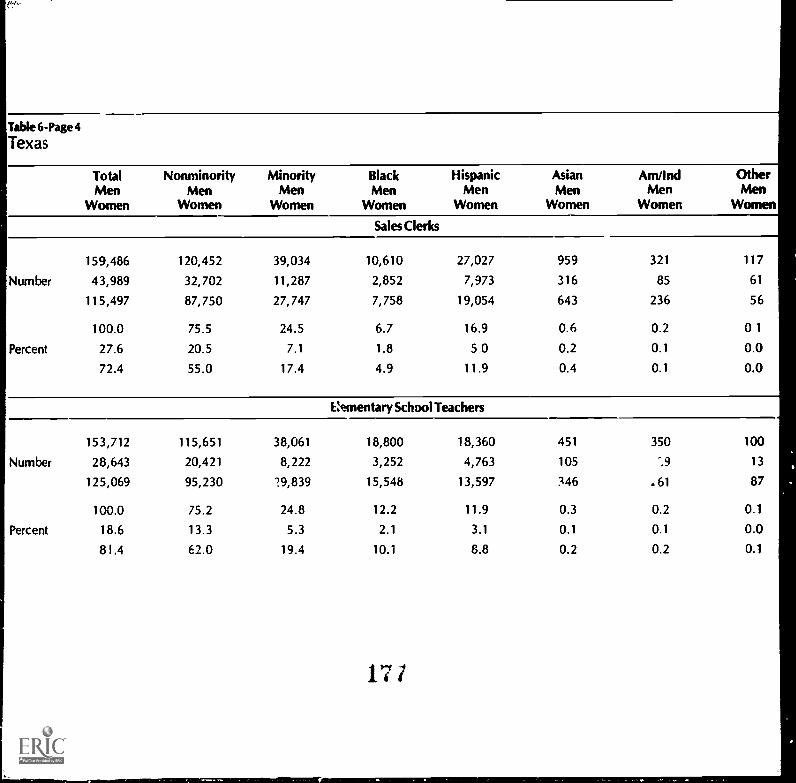
Table 6-Page 4
Texas
Total Nonminority Minority Black Hispanic Asian Am/Ind OtherMen Men Men Men Men Men Men Men
Women Women Women Women Women Women Women Women
Sales Clerks I159,486 120,452 39,034 10,610 27,027 959 321 117
Number 43,989 32,702 11,287 2,852 7,973 316 85 61
115,497 87,750 27,747 7,758 19,054 643 236 56
100.0 75.5 24.5 6.7 16.9 0.6 0.2 01
Percent 27.6 20.5 7.1 1.8 5.0 0.2 0.1 0.0
72.4 55.0 17.4 4.9 11.9 0.4 0.1 0.0
153,712 115,651 38,061 18,800 18,360 451 350 100
Number 28,643 20,421 8,222 3,252 4,763 105 -.9 13
125,069 95,230 29,839 15,548 13,597 :4,46 ,61 87
100.0 75.2 24.8 12.2 11.9 0.3 0.2 0.1
Percent 18.6 13.3 5.3 2.1 3.1 0.1 0.1 0.0
81.4 62.0 19.4 10.1 8.8 0.2 0.2 0.1
17/
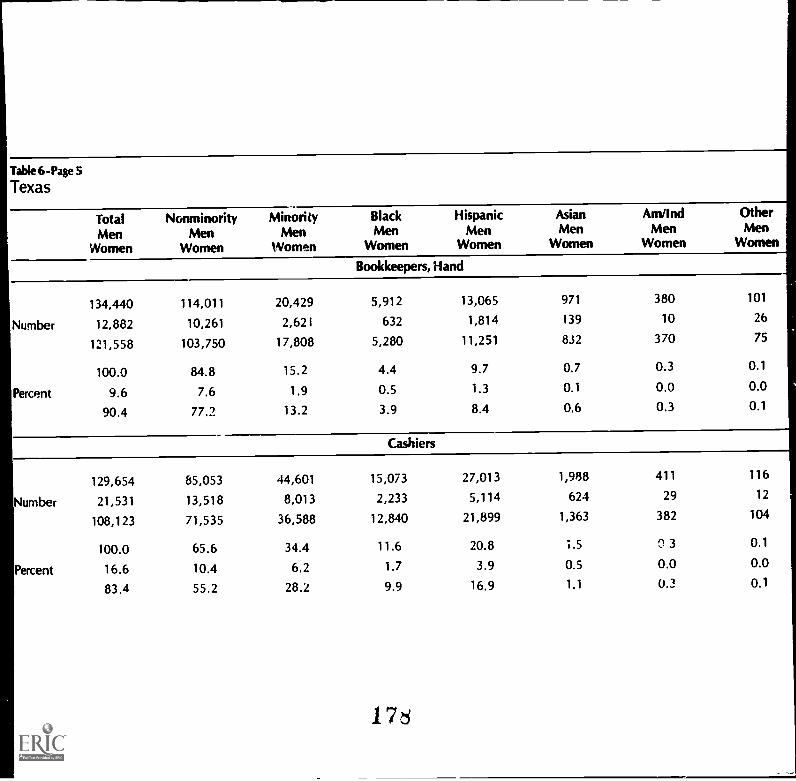
Table 6-Page 5
Texas
Total Nonminority Minority Black Hispanic Asian Am/Ind Other
Men Men Men Men Men Men Men Men
Women Women Women Women Women Women Women Women
Bookkeepers, Hand
134,440 114,011 20,429 5,912 13,065 971 380 101
Number 12,882 10,261 2,621 632 1,814 139 10 26
121,558 103,750 17,808 5,280 11,251 832 370 75
Percent
100.0
9.6
90.4
84.8
7.6
77.2
15.2
1.9
13.2
4.4
0.5
3.9
9.7
1.3
8.4
0.7
0.1
0.6
0.3
0.0
0.3
0.1
0.0
0.1
Cashiers
129,654 85,053 44,601 15,073 27,013 1,988 411 116
Number 21,531 13,518 8,013 2,233 5,114 624 29 12
108,123 71,535 36,588 12,840 21,899 1,363 382 104
Percent
100.0
16.6
83.4
65.6
10.4
55.2
34.4
6.2
28.2
11.6
1.7
9.9
176
20.8
3.9
16.9
1.5
0.5
1.1
030.0
0.3
0.1
0.0
0.1

Table 6-Page 6
Texas
Total Nonminority Minority Black Hispanic Asian Am/Ind OtherMen Men Men Men Men Men Men Men
Women Women Women Women Women Women Women Women
Typists
91,107 59,958 31,141 13,947 15,781 1,026 315 80
Number 10,690 7,503 3,187 1,085 1,954 105 29 14
80,417 52,455 27,962 12,862 13,827 921 286 66
Percent
100.0 65.8 34.2 15.3 17.3 1.1
11.7 8.2 3.5 1.2 2.1 0.1
88.3 57.6 30.7 14.1 15.2 1.0
0.3
0.0
0.3
0.1
0.0
0.1
General Clerks, Office
85,710 58,653 27,057 10,721 15,517 507 236 76
Number 13,829 8,873 4,956 1,647 3,139 122 28 20
71,881 49,780 22,101 9,074 12,378 385 208 56
Percent
100.0
16.1
83.9
68.4
10.4
58.1
31.6
5.8
25.8
12.5
1.9
10.6
17J
18.1
3.7
14.4
0.6
0.1
0.4
0.3
0.0
0.2
0.1
0.0
0.1

Table 6-Page 7
Texas
Tof.al Nonminority Minority Black Hispanic Asian Am/Ind Other
Men Men Men Men Men Men Men Men
Women Women Women Women Women Women Women Women
Nurse's Aides and Orderlies
84,258 38,096 46,162 28,416 16,710 621 334 81
Number 7,947 3,460 4,487 2,657 1,737 72 21 0
76,311 34,636 41,675 25,759 14,973 549 313 81
Percent
100.0
9.4
90.6
45.2
4.1
41.1
54.8
5.3
49.5
33.7
3.2
30.6
19.8
2.1
17.8
0.7
0.1
0.7
0.4
0.0
0.4
0.1
0.0
0.1
Waiters and Waitresses
74,865 53,683 21,182 5,671 13,619 1,489 274 129
Number 12,321 6,907 5,414 1,394 3,665 307 19 29
62,544 46,776 15,768 4,277 9,954 1,182 255 100
Percent
100.0
16.5
83.5
71.7
9.2
62.5
28.3
7.2
21.1
7.6
1.9
5.7
nu
18.2
4.9
13.3
2.0
0.4
1.6
0.4
0.0
0.3
0.2
0.0
0.1

Table 6-Page 8
Texas
Total
MenWomen
Non minority
MenWomen
Minority
MenWomen
Black
MenWomen
Hispanic
MenWomen
Asian
MenWomen
Am/Ind
MenWomen
Other
MenWomen
Accountants and Auditors
70,894 61,289 9,605 3,479 4,604 1,309 146 67
Number 42,176 37,111 5,065 1,341 2,889 682 100 5328,718 24,178 4,540 2,138 1,715 627 46 14
100.0 86.5 13.5 4.9 6.5 1.8 0.2 0.1Percent 59.5 52.3 7.1 1.9 4.1 1.0 0.1 0.1
40.5 34.1 6.4 3.0 2.4 0.9 0.1 0.0
Nurses, Professional
61,020 48,343 12,677 5,573 4,494 2,385 190 35
Number 3,615 2,693 922 300 467 145 10 057,405 46,650 11,755 5,273 4,027 2,240 180 35
100.0 79.2 20.8 9.1 7.4 3.9 0.3 0.1Percent 5.9 4.4 1 5 0.5 0.8 0.2 0.0 0.0
94.1 74.8 19.3 8.6 6.6 3.7 0.3 0.1
181

Table 6-Page 9
Texas
TotalMen
Women
NonminorityMen
Women
MinorityMen
Womer. :
BlackMen
Women
HispanicMen
Women
AsianMen
Women
Am/IndMen
Women
OtherMen
Women
Kitchen Helpers
54,622 24,816 29,806 10,675 17,764 1,126 127 114
Number 21,513 9,792 11,721 3,809 7,326 474 60 52
33,109 15,024 18,085 6,866 10,438 652 67 62 ,
100.0 45.4 54.6 19.5 32.5 2.1 0.2 0.2
Percent 39.4 17.9 21.5 7.0 13.4 0.9 0.1 0.1
60.6 27.5 33.1 12.6 19.1 1.2 0.1 0.1
Guards and Doorkeepers
53,129 39,215 13,914 5,388 7,999 150 298 79
Number 47,427 35,327 12,100 4,393 7,303 109 227 68
5,702 3,888 1,814 995 696 41 71 11
100.0 73.8 26.2 10.1 15 1 0.3 0.6 0.1
Percent 89.3 66.5 22.8 8.3 13.7 0.2 0.4 0.1
10.7 7.3 3.4 1.9 1.3 0.1 0.1 0.0
182

Table 6-Page 10
Texas
Total Nonminority Minority Black Hispanic Asian Am/Ind OtherMen Men Men Men Men Men Men Men
Women Women Women Women K amen Women Women Women
Licensed Practical Nurses
33,938 21,132 12,806 7,221 5,155 253 133 44
Number 1,191 665 526 234 273 13 6 0
32,747 20,467 12,280 6,987 4,832 240 127 44
Percent
100.0
3.5
96.5
62.3
2.0
60.3
37.7
1.5
36.2
21.3
0.7
20.6
15.2
0.8
14.4
0.7
0.0
0.7
0.4
0.0
0.4
0.1
0.0
0.1
Food Preparation and Service Workers
11,578 7,177 4,401 1,459 2,770 132 38 2
Number 2,157 1,383 774 251 495 28 0 0
9,421 5,794 3,627 1,208 2,275 104 38 2
Percent
100.0
18.6
81.4
62.0
11.9
50.0
38.0
6.7
31.3
12.6
2.2
10.4
23.9
4.3
19.6
1.1
0.2
0.9
0.3
0.0
0.3
0.0
0.0
0.0

Table 7
State Aggregate for Minorities and Women1980 Participation Rates for the High Tech Occupations by Race, Sex and National Origin
Texas
TotalMen
Women
NonminorityMen
Women
MinorityMen
Women
BlackMen
Women
HispanicMen
Women
AsianMen
Women
Am/IndMen
Women
OtherMen
Women
221,125 157,331 63,794 25,590 31,634 5,602 740 228
Number 144,833 110,408 34,425 11,680 18,505 3,616 450 174
76,292 46,923 29,369 13,910 13,129 1,986 290 54
100.0 71.2 28.8 11.6 14.3 2.5 0.3 0.1
Percent 65.5 49.9 15.6 5.3 8.4 1.6 0.2 0.1
34.5 21.2 13.3 6.3 5.9 0.9 0.1 0.0
184

Table 8-Page 1
1980 Participation Rates for Each High Tech Occupation by Race, Sex and National OriginTexas
Total Nonminority Minority Black Hispanic Asian Am/Ind OtherMen Men Men Men Men Men Men Men
Women Women Women Women Women Women Women Women
Electrical and Electronic Assemblers
76,203 39,049 37,154 15,684 19,066 2,032 244 128Number 39,351 21,597 17,754 6,563 10,237 751 118 85
36,852 17,452 19,400 9,121 8,829 1,281 126 43
100.0 51.6 48.8 20.6 25.0 2.7 0.3 0.2Percent 51.1 28.3 23.3 8.6 13.4 1.0 0.2 0.1
48.4 22.9 25.5 12.0 11.6 1.7 0.2 0.1
Computer Programmers
30,785 24,548 6,237 2,546 2,711 899 65 16Number 15,732 13,247 2,485 853 989 603 24 16
15,053 11,301 3,752 1,693 1,722 296 41 0
100.0 79.7 20.3 8.3 8.8 2.9 0.2 0.1Percent 51.1 43.0 8.1 2.8 3.2 2.0 0.1 0.1
48.9 36.7 12.2 5.5 5.6 1.0 0.1 0.0
183

Table 8-Page 2
Texas
TotalMen
Women
NonminorityMen
Women
MinorityMen
Women
Black HispanicMen Men
Women Women
AsianMen
Women
Am/IndMen
Women
OtherMen
Women
Computer Operators
28,618 20,830 7,788 3,428 3,669 568 100 23
Number 12,165 8,682 3,483 1,163 1,744 318 46 12
16,453 12,148 4,305 2,065 1,925 250 54 11
100.0 72.8 27.2 12.0 12.8 2.0 0.3 0.1
Percent 42.5 30.3 12.2 4.8 6.1 1.1 0.2 0.0
57.5 42.4 15.0 7.2 6.7 0.9 0.2 0.0
Electrical Engineers
20,862 18,554 2,308 578 961 688 60 21
Number 19,685 17,616 2,069 4i1 883 654 60 21
1,177 938 239 127 78 34 0 0
100.0 88.9 11.1 2.8 4.6 3.3 0.3 0.1
Percent 94.4 84.4 9.9 2.2 4.2 3.1 0.3 0.1
5.6 4.5 1.1 0.6 0.4 0.2 0.0 0.0
186

Table 8-Page 3
Texas
Total Nonminority Minority Black Hispanic Asian Am/Ind OtherMen Men Men Men Men Men Men Men
Women Women Women Women Women Women Women Women
Electrical and Electronic Technicians
20,028 16,587 3,441 1,421 1,618 306 90 6
Number 17,419 14,716 2,703 958 1,406 280 53 6
2,609 1,871 738 463 212 26 37 0
100.0 82.8 17.2 7.1 8.1 1.5 0.4 0.0
Percent 87.0 73.5 13.5 4.8 7.0 1.4 0.3 0.0
13.0 9.3 3.7 2.3 1.1 0.1 0.1 0.2
0.0
Data Processing Machine Mechanics
11,269 8,502 2,767 661 1,948 99 59 0
Number 10,815 8,182 2,633 633 1,856 85 59 0
454 320 134 28 92 14 0 0
Percent
100.0
96.0
4.0
75.4
72.6
2.8
24.6
23.4
1.2
5.9
5.6
0.2
187
17.3
16.5
0.8
0.9
0.8
0.1
0.5
0.5
0.0
0.0
0.0
0.0

Table 8-Page 4
Texas
TotalMen
Women
NonminorityMen
Women
MinorityMen
Women
Black HispanicMen Men
Women Women
AsianMen
Women
Am/IndMcn
Womb i
OtherMen
Women
Computer Systems Analysts
11,134 9,886 1,248 352 500 328 0
Number 8,999 8,093 906 182 416 266 42 0
2,135 1,793 342 170 84 62 26 0
100.0 88 8 11.2 3.2 4.5 2.9 0.6 0.0
Percent 80.8 72.7 8.1 1.6 3.7 2.4 0.4 0.0
19.2 16.1 3.1 1.5 0.8 0.6 0.2 0.0
Industrial Engineers
11,070 9,724 1,346 458 648 187 33 20
Number 10,169 9,047 1,122 322 583 170 27 20
901 677 224 136 65 17 6 0 I
100.0 87.8 12.2 4.1 5.9 1.7 0.3 0.2
Percent 91.9 81.7 10.1 2.9 5.3 1.5 0.2 0.2
8.1 6.1 2.0 1.2 0.6 0.2 0.1 0.0
188

Tabletl-Page5
Texas
Total Nonminority Minority Black Hispanic Asian Am/Ind OtherMen Men Men Men Men Men Men Men
Women Women Women Women Women Women Women Women
Mechanical Engineers
10,330 9,171 1,159 271 358 495 21 14
Number 10,162 9,020 1,142 260 358 489 21 14
168 151 17 11 0 6 0 0
Percent
100.0
98.4
1.6
88.8
87.3
1.5
11.2
11.1
0.2
2.6
2.5
0.1
3.5
3.5
0.0
4.8
4.7
0.1
0.2
0.2
0.0
0.1
0.1
0.0
Peripheral EDP Equipment Operators
826 480
Number 336 208
490 272
Percent
100.0
40.7
59.3
58.1
25.2
32.9
346 191 155 0 0 0
128 95 33 0 0 0
218 96 122 0 0 0
41.9
15.5
26.4
23.1
11.5
11.6
189
18.8
4.0
14.8
0.0
0.0
0.0
0.0
0.0
0.0
0.0
0.0
0.0
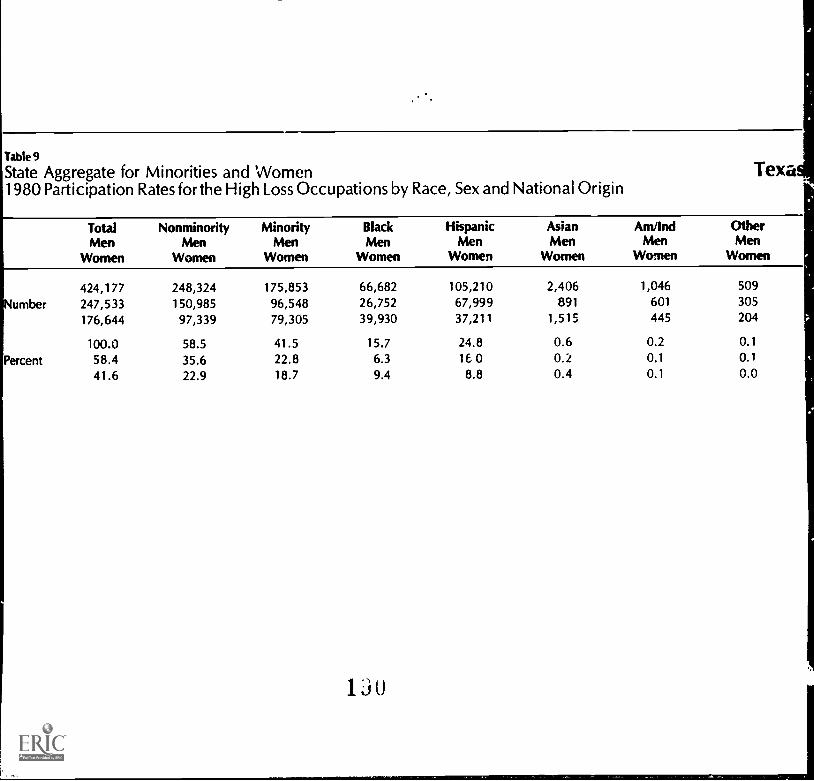
Table 9
State Aggregate for Minorities and Women1980 Participation Rates for the High Loss Occupations by Race, Sex and National Origin
Tex]
Total Nonminority Minority Black Hispanic Asian Am/Ind OtherMen Men Men Men Men Men Men Men
Women Women Women Women Women Women Women Women
424,177 248,324 175,853 66,682 105,210 2,406 1,046 509
Number 247,533 150,985 96,548 26,752 67,999 891 601 305
176,644 97,339 79,305 39,930 37,211 1,515 445 204
100.0 58.5 41.5 15.7 24.8 0.6 0.2 0.1
Percent 58.4 35.6 22.8 6.3 16 0 0.2 0.1 0.1
41.6 22.9 18.7 9.4 8.8 0.4 0.1 0.0
HO
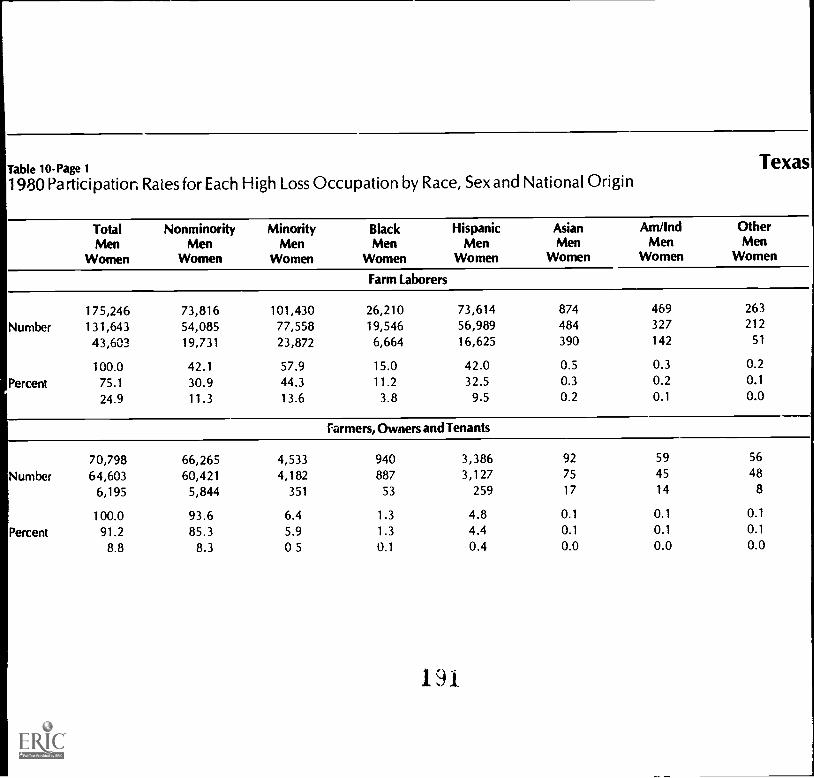
Table 10-Page 1
1980 Participation Rates for Each High Loss Occupation by Race, Sex and National Origin
Total Nonminority Minority Black Hispanic Asian Am/Ind OtherMen Men Men Men Men Men Men Men
Women Women Women Women Women Women Women Women
Farm Laborers
175,246 73,816 101,430Number 131,643 54,085 77,558
43,603 19,731 23,872
100.0 42.1 57.9
Percent 75.1 30.9 44.324.9 11.3 13.6
26,210 73,614 874 469
19,546 56,989 484 327
6,664 16,625 390 142
15.011.23.8
42.032.5
9.5
0.50.30.2
0.30.20.1
Farmers, Owners and Tenants
70,798 66,265 4,533
Number 64,603 60,421 4,1826,195 5,844 351
100.0 93.6 6.4
Percent 91.2 85.3 5.9
8.8 8.3 05
940 3,386 92 59 56
887 3,127 75 45 48
53 259 17 14 8
1.3
1.3
0.1
191
4.84.40.4
0.1
0.1
0.0
0.1
0.1
0.0

Table1O-Page 2
Texas
Total Nonminority Minority Black Hispanic Asian Am/Ind Other
Men Men Men Men Men Men Men Men
Women Women Women Women Women Women Women Women
Compositors and Typesetters
50,965 35,195 15,770 6,810 7,991 789 137 43
Number 13,883 10,185 3,698 1,134 2,333 157 59 15
37,082 25,010 12,072 5,676 5,658 632 78 28
Percent
100.0
27.2
72.8
69.1
20.0
49.1
30.9
7.3
23.7
13.4
2.2
11.1
15.7
4.6
11.1
1.5
0.3
1.2
0.3
0.1
0.2
0.1
0.0
0.1
Secondary School Teachers
50,302 40,460 9,842 4,807 4,605 213 173 44
Number 19,601 15,519 4,082 1,770 2,157 73 82 0
30,701 24,941 5,760 3,037 2,448 140 91 44
Percent
100.0
39.0
61.0
80.4
30.9
49.6
19.6
8.1
11.5
9.6
3.5
6.0
192
9.2
4.3
4.9
040.1
0.3
0.3
0.2
0.2
0.1
0.0
0.1

Table 10-Page 3
Texas
Total Nonminority Minority Black Hispanic Asian Am/Ind OtherMen Men Men Men Men Men Men Men
Women Women Women Women Women Women Women Women
Maids and Servants, Private
34,155 5,283 28,872 20,320 8,265 193 64 30
Number 1,394 431 963 643 307 6 7 0
37,761 4,852 27,909 19,677 7,958 187 57 30
Percent
100.0
4.1
95.9
15.5
1.3
14.2
84.5
2.8
81.7
59.5
1.9
57.6
24.2
0.9
23.3
0.6
0.0
0.5
0.2
0.0
0.2
0.1
0.0
0.1
Teachers, College
18,745 15,968 2,777 1,013 1,574 112 57 21
Number 7,571 6,383 1,188 332 744 65 34 13
11,174 9,585 1,589 681 830 47 23 8
Percent
100.0
40.4
59.6
85.2
34.1
51.1
14.6
6.3
8.5
5.4
1.8
3.6
193
8.4
4.0
4.4
0.6
0.3
0.3
0.3
0.2
0.1
0.1
0.1
0.0

Table 10-Page 4
Texas
Total Nonminority Minority Black Hispanic Asian Am/Ind Other
Men Mn . Men Men Men Men Men Men
Women Women Women Women Women Women Women Women
Taxi Drivers
10,283 4,865 5,418 2,759 2,535 39 62 23
Numbers 8,568 3,829 4,739 2,340 2,304 31 47 17
1,715 1,036 679 419 231 8 15 6
Percent
100.0
83.3
16.7
47.3
37.2
10.1
52.7
46.1
6.6
26.8
22.8
4.1
24.7
22.4
2.2
0.4
0.3
0.1
0.6
0.5
0.1
0.2
0.2
0.1
Child Care Workers, Private
Number
Percent
8.519 5,533 2,986 1,168 1,710 71 14 23
165 119 46 26 20 0 0 0
8,354 5,414 2,940 1,142 1,690 71 14 23
100.0
1.9
98.1
64.9
1.4
63.6
35.1
0.5
34.5
194
13.7
0.3
13.4
20.1
0.2
19.8
0.8
0.0
0.8
0.2
0.0
0.2
0.3
0.0
0.3

Table 10-Page 5
Texas
Total Nonminority Minority Black Hispanic Asian Am/Ind OtherMen Men Men Men Men Men Men Men
Women Women Women Women Women Women Women Women
Housekeepers, Private House
5,164 939 4,225 2,655 1,530 23 11 6
Number 105 13 92 74 18 0 0 0
5,059 926 4,133 2,581 1,512 23 11 6
100.0 18.2 81.8 51.4 29.6 0.4 0.2 0.1
Percent 2.0 0.3 1.8 1.4 0.3 0.0 0.0 0.0
98.0 17.9 80.0 50.0 29.3 0.4 0.2 0.1
196

Overview. The Five Most Populous States 169
Illinois
Total Employed CivilianLabor Force in 1980
Refer to Tables 4 and 4.5.
,/ 5.2 percent of the nation's CLF was employed in Illinois.,/ Minority participation in Illinois' CLF (18.3 percent) was slightly higher than in the
national CLF (17.8 percent).,/ Blacks' participation rate in the Illinois CLF was 11.5 percent; 2 percent greater
than in the national CLF (9.5 percent).
Illinois' High Growth Occupations:1980 Minority and Female Participation Rates
Refer to Tables!, 4 and 5.
,/ 5.3 percent of the nation's High Growth work force was employed in Illinois.,/ The High Growth occupations employed 40.7 percent of the state CLF. This was
higher than the national rate.,/ Females had a higher participation rate in this category (55.8 percent) than in the
state CLF (42.5 percent).,/ Minorities had a higher participation rate in the High Growth category (19.6 per-
cent) than in the state CLF (18.3 percent).
Illinois' High Tech Occupations:1980 Minority and Female Participation Rates
Refer to Tables 2, 4 and 7.
Almost 6 percent of the nation's High Tech labor force was employed in Illinois.High Tech occupations employed 4.3 percent of the state CLF. This was a higherproportion than in the national CLF (3.4 percent).Females had a lower participation rate in the High Tech category (40.1 percent)than in the state CLF (42.5 percent).Hispanic women had twice the participation rate in the High Tech category (4.5percent) as in the state CLF (1.8 percent).Minorities had a higher participation rate in the High Tech category (23.8 percent)than in the state CLF (18.3 percent).
High Loss Occupations:1980 Minority and Female Participat:on
Refer to Tables 3, 4 and 9,
196

170 Project 2000
,./ 5.2 percent of the nation's High Loss work force was employed in Illinois.,/ 6.7 percent of the state CLF was employed in High Loss occupations. This was
equal to the national proportion (6.7 percent).Males, in most groups, had higher participation rates in the High Loss category thanin the state CLF.Minorities had a higher participation rate in this category (21.1 percent) than inthe state CLF (18.3 percent).
Illinois' High Growth Occupations:1980 Minority and Female Participation
Refer to Tables 4 and 6.
Blue-Collar Worker Supervisors
The majority of blue-collar worker supervisors were nonminority males (73.6 per-cent).The minority male participation rate in this occupation (10.0 percent) was compar-able to that in the state CLF (10.1 percent).All females had lower participation rates in this occupation (16.4 percent) than inthe state CLF (42.5 percent).
Secretaries
Almost 99 percent of all those working in this occupation were women.All females had higher participation rates in this occupation than in the state CLF.
Helpers in the Trades
Females had a lower participation rate in this occupation (29.2 percent) than inthe state CLF (42.5 percent). This difference was proportionally greatest for nonminority females (19.5 percent compared to 34.2 percent).Hispanic women had a two times higher participation rate in this occupation (3.8percent) than in the state CLF (1.8 percent).Minority males, except Asians, had twice the participatiun rate in this occupation(21.5 percent) as in the state CLF (10.1 percent).
Automotive Mechanics
Females had a lower participation rate in this occupation (33.4 percent) than inthe state CLF (42.5 percent). This difference was proportionally the greatest for non -minority females.Both Hispanic (5.4 percent compared to 3.2 percent in the state CLF) and Asian(1.0 percent compared to 0.8 percent) women had higher participation rates in thisoccupation than in the state CLF.Both black (7.8 percent compared to 5.9 percent in the state CLF) and Hispanicmales (6.4 percent compared to 3.2 percent) had higher participation rates in thisoccupation than in the state CLF.
1 9

Overy ew: The Five Most Populous States 171
Janitors and Sextons
Females had a lower participation rate in this occupation (30.4 percent) than inthe state CLF (42.5 percent). This difference was the greatest for nonminority andAsian women.Black males had a 2.5 times greater participation rate in this occupation (14.2 per-cent) than in the state CIF (5.9 percent).
High Tech: Top Three OccupationsMinority and Female Participation in 1980
Refer to Tables 4 and 8.
Electrical and Electronic Assemblers
,./ Females had a higher participation rate in this occupation (52.5 percent) than inthe state CLF (42.5 percent). This difference was the greatest among minoritywomen, who composed 18.1 percent of those working in this occupation.The participation rate for Hispanic women working in this occupation (8.6 percent)was five times greater than that in the state CLF (1.8 percent).All groups of minority males, except Asians, had higher participation rates in thisoccupation than in the state CLF.Nonminority males had a lower participation rate in this occupation (31.8 percent)than in the state CLF (47.5 percent).
Computer Operators
Males had a lower participation rate in this occupation (41.8 percent) than in thestate CLF (57.5 percent). This difference was the greatest for nonminority and His-panic males.
All groups of women, except Hispanics, had higher participation rates in th is occu-pation than in the state CLF.
Computer Programmers
The number of men and women working in this occupation was approximatelyequal.Males had a lower participation rate in this occupation (52.0 percent) than in thestate CLF (57.5 percent).Hispanic and black males had lower participation rates in this occupation than inthe state CLF.Asian males had a higher participation rate in this occupation (2.8 percent) thanin the state CLF (0.8 percent).
.FM

17 2 Project 2000
High Loss: Top Three OccupationsMinority and Female Participation in 1980
Refer to Tables 4 and 10.
Farm Laborers
,/ Males had a higher participation rate in this occupation (66.7 percent) than in thestate CLF (57.5 percent). This difference was the greatest among minorities, par-ticularly Hispanics and American Indians.
,/ Minority women also had higher participation rates in this occupation (11.4 per-cent) than in the state CLF (8.3 percent). This difference was the greatest for His-panic womei).
,/ Nonminority women had a lower rate of participation in this occupation (21.9 per-cent) than in the state CLF (42.5 percent).
Farmers, Owners and Tenants
,/ Nonminority males composed an overwhelming majority of Illinois farmers, own-ers and tenants (92.2 percent).
,/ There was virtually no representation for minority males (0.4 percent) or females(0.3 percent) in this occupation.
Compositors and Typesetters
,/ Women had a higher participation rate in this occupation (68.7 percent) than inthe state CLF (42.5 percent). This difference was the greatest for minority women.
,/ All male groups had lower participation rates in this occupation than in the stateCI.F.
1 9,r)

Overview The Five Most Populous States 1 73
Table 1
State Totals: By OccupationHigh Growth Illinois
1980 StateCivilian Work Force
1980 State Total:High Growth
5,412,533 2.204,593
% State Total:High Growth
40.7%
1980 National State's Share of the NationalHigh Growth Work Force High Growth Work Force
41,504,050 5.3%
By Ranked Occupation
Occupation 1980 Total
1. Blue-Collar Worker Supervisors 247,9872. Secretaries 215,2163. Helpers in the Trades 210,0374. Automotive Mechanics 183,0985. Janitors and Sextons 153,5976. Truck Drivers 150,6387. Sales Clerks 128,9738. Elementary School Teachers 111,0389. General Clerks, Office 100,298
10. Bookkeepers, Hard 100,23511. Cashiers 94,52212. Typists 91,09013. Waiters and Waitresses 75,61914. Nurses, Professional 74,27815. Nurse's Aides and Orderlies 67,37716. Accountants and Auditors 58,26117. Guards and Doorkeepers 57,64718. Kitchen Hclpers 56,17719. Licensed Practical Nurses 18,414
20. Food Preparation and Service Workers 10,091
Total 2,204,593
0

174 Project 2000
Table 2
State Totals: By OccupationHigh Tech Illinois
1980 State 1980 State Total: % State Total:Civilian Work Force High Tech High Tech
5,412,533 234,412 4.3%
1980 National State's Share of the NationalHigh Tech Work Force High Tech Work Force
3,945,632 5.9%
By Ranked Occupation
Occupation 1980 Total
1. Electrical and Electronic Assembleis 111,2872 Computer Operators 25,8703. Computer Programmers 25,7024. Electrical Engineers 1A,1485. Mechanical Engineers 13,1736. Industrial Engineers 11,3017. Computer Systems Analysts 10,8858. Electrical and Electronic Technicians 10,8789. Data Processing Machine Mechanics 7,533
10. Peripheral EDP Equipment Operators 1,635
Total 234,412
2'' I.

Table 3
State Totals: By OccupationHigh Loss
Overview The Five Most Populous States 175
Illinois
1980 State 1980 State Total: % State Total:Civilian Work Force High Loss High Loss
5,412,533 165,6°8 6.7Y.
1980 National State's Share of the Nationa'High Loss Work Force High Loss Work Force
7,045,465 5 2%
By Ranked Occupation
Occupation 1980 Total
1 Farm Laborers 157,6632. Farmers, Owners and Tenants 62,0943. Compositors and Typesetters 53,4544. Secondary School Teachers 45,736E. Teachers, College 15,9036. Taxi Drivels 11,5487 Maids and Servants, Private 10,4218. Childcare Workers, Private 6,6769 Housekeepers, Private House 2,203
Total 365,698
2.o
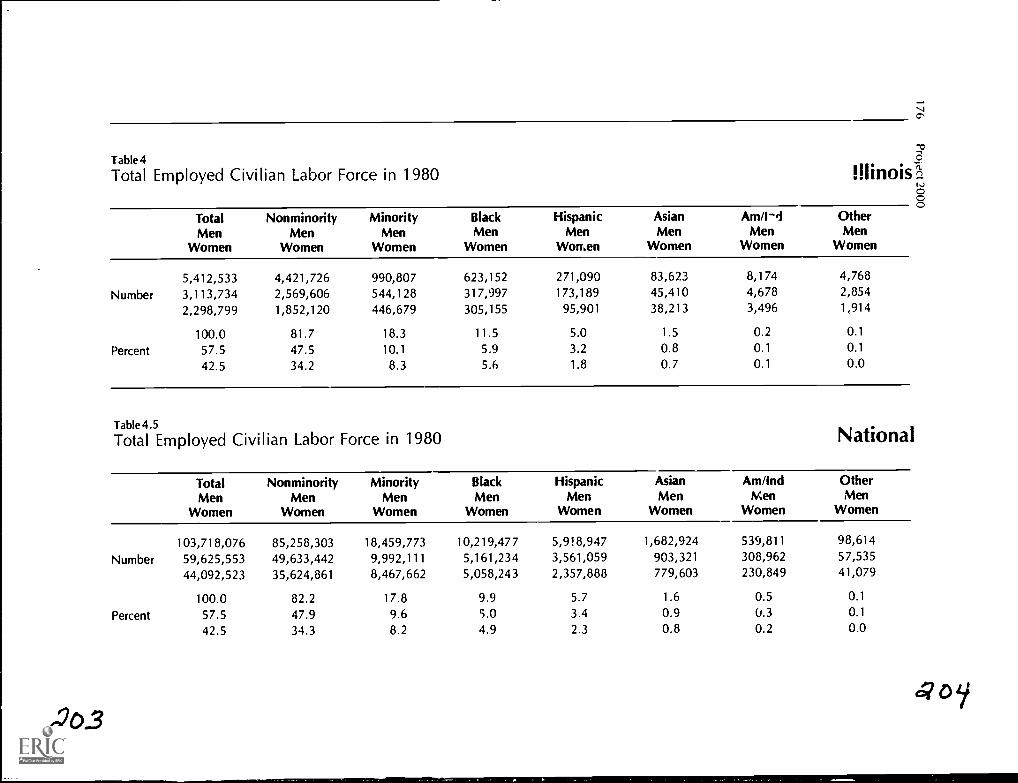
Table 4
Total Employed Civilian Labor Force in 1980
7
MinoisIC
TotalMen
Women
NonminorityMen
Women
MinorityMen
Women
BlackMen
Women
HispanicMen
Women
AsianMen
Women
Am/I-4Men
Women
OtherMen
Women
5,412,533 4,421,726 990,807 623,152 271,090 83,623 8,174 4,768
Number 3,113,734 2,569,606 544,128 317,997 173,189 45,410 4,678 2,854
2,298,799 1,852,120 446,679 305,155 95,901 38,213 3,496 1,914
100.0 81.7 18.3 11.5 5.0 1.5 0.2 0.1
Percent 57.5 47.5 10.1 5.9 3.2 0.8 0.1 0.1
42.5 34.2 8.3 5.6 1.8 0.7 0.1 0.0
Table 4.5
Total Employed Civilian Labor Force in 1980 National
TotalMen
Women
NonminorityMen
Women
MinorityMen
Women
BlackMen
Women
HispanicMen
Women
AsianMen
Women
Am/IndMen
Women
OtherMen
Women
103,718,076 85,258,303 18,459,773 10,219,477 5,918,947 1,682,924 539,811 98,614
Number 59,625,553 49,633,442 9,992,111 5,161,234 3,561,059 903,321 308,962 57,535
44,092,523 35,624,861 8,467,662 5,058,243 2,357,888 779,603 230,849 41,079
100.0 82.2 17.8 9.9 5.7 1.6 0.5 0.1
Percent 57.5 47.9 9.6 5.0 3.4 0.9 0.3 0.1
42.5 34.3 8.2 4.9 2.3 0.8 0.2 0.0
c?O3

Table 5
State Aggregate for Minorities and Women1980 Participation Rates for the High Growth Occupations by Race, Sex and National Origin
Illinois
TotalMen
Women
NonminorityMen
Women
MinorityMen
Women
BlackMen
Women
HispanicMen
Women
AsianMen
Women
Am/IndMen
Women
OtherMen
Women
2,204,593 1,773,535 431,058 276,476 115,958 33,258 3,463 1,903
Number 975,180 775,478 199,702 120,202 64,941 12,076 1,584 899
1,229,413 9'28,057 231,356 156,274 51,017 21,182 1,879 1,004
100.0 80.4 19.6 12.5 5.3 1.5 0.2 0.1
Percent 44.2 35.2 9.1 5.5 2.9 0.5 0.1 0.0
55.8 45.3 10.5 7.1 2.3 1.0 0.1 0.0
cPo 6,

7D
NOO0
4 I i it i II 1M i 1 I I I I I I I I MI Ili 1 M I li 1111
Table 6-Page 1
1980 Participation Rates for Each High Growth Occupation by Race, Sex and National OriginIllinois -"g
Total Nonminority Minority Black Hispanic Asian Am/Ind OtherMen Men Men Men Men Men Men Men
Women Women Women Women Women Women Women Women
Blue-Collar Worker Supervisors
247,987 216,826 31,161 18,723 8,788 3,153 324 173Number 207,383 182,550 24,838 14,315 7,365 2,742 279 137
40,599 34,276 6,323 4,408 1,423 411 45 36
100.0 87.4 12.6 7.5 3.5 1.3 0.1 0.1Percent 83.6 73.6 10.0 5.8 3.0 1.1 0.1 0.1
16.4 13.8 2.5 1.8 0.6 0.2 0.0 0.0
Secretaries
215,216 192,122 23,094 15,707 5,651 1,335 280 121
Number 2,640 2,233 407 256 79 72 0 0212,576 189,889 22,687 15,45: 5,572 1,263 280 121
100.0 89.3 10.7 7.3 2.6 0.6 0.1 0.1Percent 1.2 1.0 0.2 0.1 0.0 0.0 0.0 0.0
98.8 88.2 10.5 7.2 2.6 0.6 0.1 0.1
WIENNIiMiliiilir
2
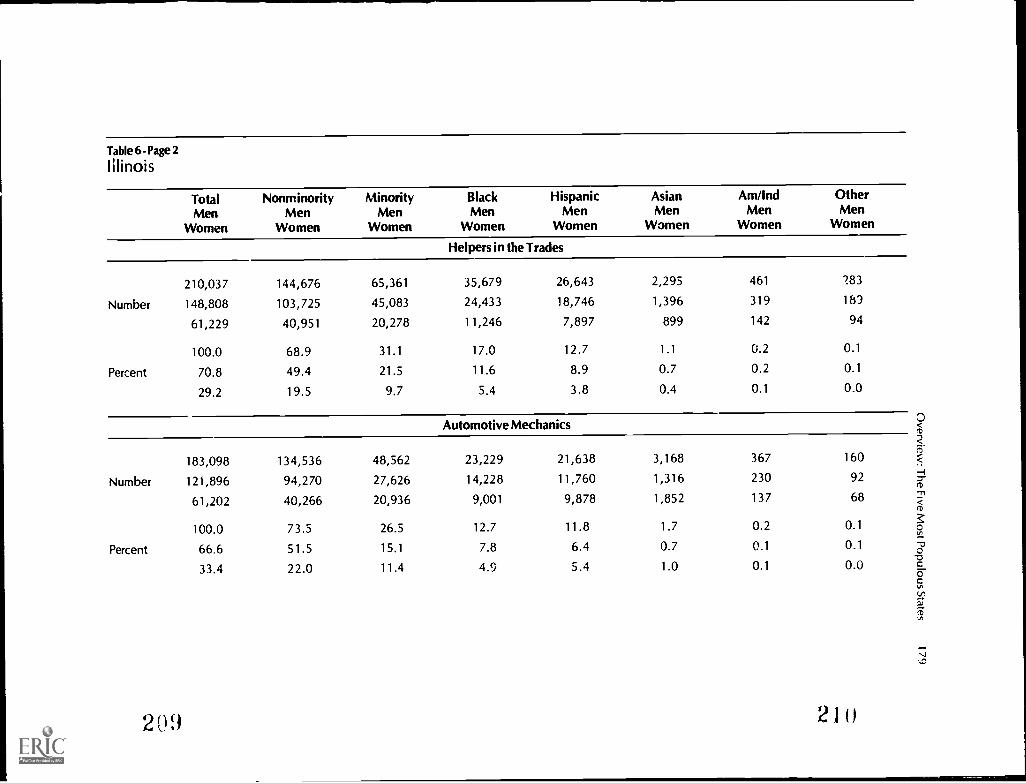
Table 6-Page 2
Illinois
Total Nonminority Minority Black Hispanic Asian Am/Ind OtherMen Men Men Men Men Men Men Men
Women Women Women Women Women Women Women Women
Number
Percent
Number
Percent
209
Helpers in the Trades
210,037 144,676 65,361 35,679 26,643 2,295 461
148,808 103,725 45,083 24,433 18,746 1,396 319
61,229 40,951 20,278 11,246 7,897 899 142
100.0 68.9 31.1 17.0 12.7 1.1 0.2
70.8 49.4 21.5 11.6 8.9 0.7 0.2
29.2 19.5 9.7 5.4 3.8 0.4 0.1
Automotive Mechanics
183,098 134,536 48,562 23,229 21,638 3,168 367
121,896 94,270 27,626 14,228 11,760 1,316 230
61,202 40,266 20,936 9,001 9,878 1,852 137
100.0 73.5 26.5 12.7 11.8 1.7 0.2
66.6 51.5 15.1 7.8 6.4 0.7 0.1
33.4 22.0 11.4 4.9 5.4 1.0 0.1
283
189
94
0.1
0.1
0.0
160
92
68
0.1
0.1
0.0
210

Table 6-Page 3
Illinois
TotalMen
Women
NonminorityMen
Women
MinorityMen
Women
BlackMen
Women
HispanicMen
Wumen
AsianMen
Women
Am/IndMen
Women
OtherMen
Women
Janitors and Sextons
153,597 107,411 46,186 32,900 11,423 1,369 384 110
Number 106,841 75,281 31,560 21,837 8,555 876 230 62
46,756 32,130 14,626 11,063 2,868 493 154 48
100.0 69.9 30.1 21.4 7.4 0.9 0.3 0.1
Percent 69.6 49.0 20.5 14.2 5.6 0.6 0.1 0.0
30.4 20.9 9.5 7.2 1 9 0.3 0.1 0.0
Truck Drivers
150,638 132,346 18,292 12,813 4,862 277 296 44
Number 142,463 124,916 17,547 12,353 4,632 234 284 44
8,175 7,430 745 460 230 43 12 0
100.0 87.9 12.1 8.5 3.2 0.2 0.2 0.0
Percent 94.6 82.9 11.6 8.2 3.1 0.2 0.2 0.0
5.4 4.9 0.5 0.3 0.2 0.0 0.0 0.0
2 1 1

Table 6-Page 4
Illinois
Black Am/IndTotal Nom inority Minority Hispanic Asian Other
Men Me.) Men Men Men Men Men Men
Women Women Women Women Women Women Women Women
Sales Clerics
128,973 112,835 16,138 10,764 3,962 1,229 94 89
Number 34,622 28,912 5,710 3,554 1,572 518 18 48
94,351 83,923 10,42d 7,210 2,390 711 76 41
Percent
100.0
26.8
73.2
87.5
22.4
65.1
12.5
4.4
8.1
8.3
2.8
5.6
3.1
1.2
1.S
1.0
0.4
0.6
0.1
0.0
0.1
0.1
0.0
0.0
Elementary School Tear.hers
111,038 91,925 19,113 16,243 1,920 830 63 57
Number 25,220 21,912 4,008 3,227 548 185 14 34
85,818 70,713 15,105 13,016 1,372 645 49 23
Percent
100.0
22.7
77.3
82.8
19.1
63.7
17.2
3.6
13.6
14.6
2.9
11.7
212
1.7
0.5
1.2
0.7
0.2
0.6
0.1
0.0
0.0
0.1
0.0
0.0

Table 6-Page 5
Illinois
Total Nonminority Minority BlackMen Men Men Men
Women Women Women Women
Hispanic Asian Am/Ind OtherMen Men Men Men
Women Women Women Women
General Clerks, Office
100,298 77,866 22,432
Number 17 772 13,431 4,341
82,526 64,435 18,091
100.0 77.6 22.4
Percent 17.7 13.4 4.3
82.3 64.2 18.0
16,349
3,000
13,349
16.3
3.0
13.3
Bookkeepers, Hand
100,235 89,881 10,354 6,273
Number 10,828 9,049 1,779 977
89,407 80,83- 8,575 5,296
100.0 89.7 10.3 6.3
Percent in, ft 9.0 1.8 1.0
89.2 80.6 8.6 5.3
21 3
4,356 1,533 134 60
945 353 26 17
3,411 1,180 108 43
4.3 1.5 0.1 0.1
0.9 0.4 0.0 0.0
3.4 1.2 0.1 0.0
2,361 1,538 114 68
339 418 20 25
2,022 1,120 94 43
2.4 1.5 0.1 0.1
0.3 0.4 0.0 0.0
2.0 1.1 0.1 0.0

Table6-Page6Illinois
Tole Nonminority Minority Black Hispanic Asian Am/Ind Other
Men Men Men Men Men Men Men Men
Women Women Women Women Women Women Women Women
Cashiers
94,522 76,215 18,307 12,980
Number 13,627 10,187 3,440 2,215
80,895 66,028 14,867 10,765
Percent
100.0
14.4
85.6
80.6
10.8
69.9
19.4
3.6
15.7
13.7
2.3
11.4
4,190 943 92 102
897 291 7 30
3,293 652 85 72
4.4
0.9
3.5
1.0
0.3
0.7
0.1
0.0
0.1
0.1
0.0
0.1
Typists
91,090 67,069 24,021 17,942
Number 10,180 7,747 2,433 1,640
80,910 59,322 21,588 16,302
Percent
100.0
11.2
88.8
73.6
8.5
65.1
26.4
2.7
23.7
19.7
1.8
17.9
214
4,085 1,770 148 76
456 299 8 30
3,629 1,471 140 46
4.5
0.5
4.0
1.9
0.3
1.6
0.2
0.0
0.2
0.1
0.0
0.1

Table 6-Page 7
Illinois
Total Nonminority Minority Black Hispanic Asian Am/Ind OtherMen Men Men Men Men Men Men Men
Women Women Women Women Women Women Women Women
Waiters and Waitresses
75,619 66,959 8,660 4,225 2,886 1,328 175 46
Number 7,479 4,617 2,862 890 1,360 593 7 12
68,140 62,342 5,798 3,335 1,526 735 168 34
Percent
100.0
9.9
90.1
88.5
6.1
82.4
11.5
3.8
7.7
5.6
1.2
4.4
3.8
1.8
2.0
1.8
0.8
1.0
0.2
0.0
0.2
0.1
0.0
0.0
Nurses, Professional
74,278 60,156 14,122 6,080 1,197 6,550 81 214
Number 2,721 2,123 598 266 47 264 5 16
71,557 58,033 13,524 5,814 1,150 6,286 76 198
Percent
100.0
3.7
96.3
81.0
2.9
78.1
19.0
0.8
18.2
8.2
0.4
7.8
21:i
1.6
0.1
1.5
5.8
0.4
8.5
0.1
0.0
0.1
0.3
0.0
0.3

Table 6-Page 8
Illinois
Number
Percent
Number
Percent
TotalMen
Women
NonminorityMen
Women
MinorityMen
Women
BlackMen
Women
HispanicMen
Women
AsianMen
Women
Am/IndMen
Women
OtherMen
Women
Nurse's Aides and Orderlies
67,377 45,805 21,572 17,218 2,163 1,951 170 70
6,636 4,119 2,517 1,811 424 262 13 7
60,741 41,686 19,G55 15,407 1,739 1,689 157 63
100.0 68.0 32.0 25.6 3.2 2.9 0.3 0.1
9.8 6.1 3.7 2.7 0.6 0.4 0.0 0.0
90.2 61.9 28.3 22.9 2.6 2.5 0.2 0.1
Accountants and Auditors
58,261 50,774 7,487 3,990 914 2,484 33 66
36,342 32,697 3,645 1,618 425 1,545 15 42
21,919 18,077 3,842 2,372 489 939 18 24
100.0 87.1 12.9 68 1.6 4.3 0.1 0.1
62.4 56.1 6.3 2.8 0.7 2.7 0.0 0.1
37.6 31.0 6.6 4.1 0.8 1.6 0.0 0.0
216

Table 6-Page 9
Illinois
Total Nonminority Minority Black Hispanic Asian Amilnd OtherMen Men Men Men Men Men Men Men
Women Women Women Women Women Women Women Women
Guards and Doorkeepers
57,647 43,582 14,065 11,644 2,043 237 87 57
Number 51,292 39,350 11,942 9,788 1,815 215 67 57
6,355 4,232 2,123 1,856 228 22 17 0
100.0 75.6 24.4 2C ") 3.5 0.4 0.1 0.1
Percent 89.0 68.3 20.7 17.0 3.1 0.4 0.1 0.1
11.0 7.3 3.7 3.2 0.4 0.0 0.0 0.0
Kitchen Helpers
56,177 40,661 15,516 3,241 6,183 892 101 99
Number 25,646 16,811 8,835 3,429 4,875 440 42 49
30,531 23,850 6,681 4,812 1,308 452 59 50
100.0 72.4 27.6 14.7 11.0 1.6 0.2 0.2Percent 45.7 29.9 15.7 6.1 8.7 0.8 0.1 0.1
54.3 42.5 11.9 3.6 2.3 0.8 0.1 0.1
21';
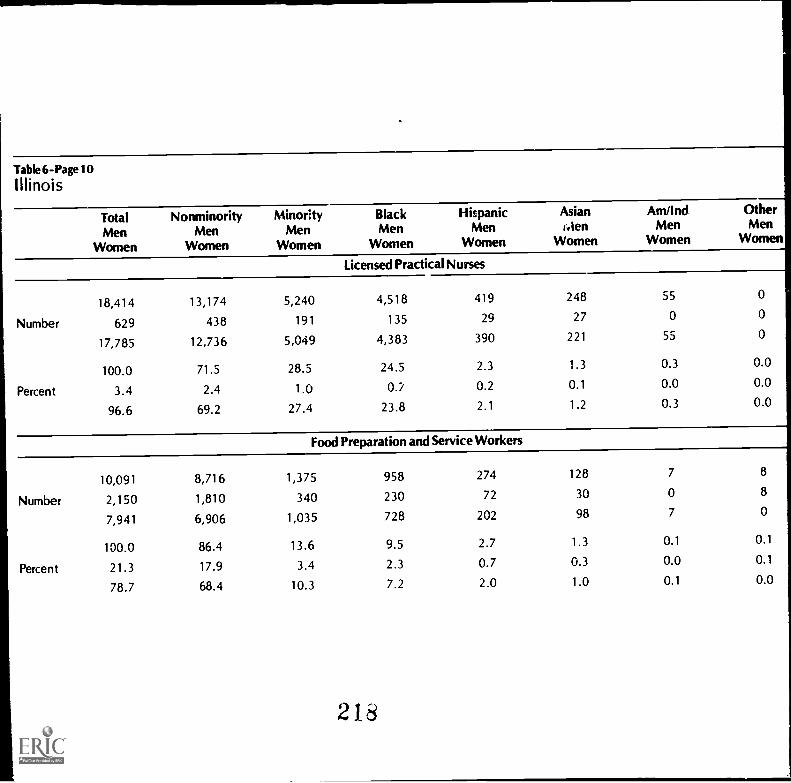
I
Table 6-Page 10
Illinois
Total Nonminority Minority Black Hispanic Asian Am/Ind Other
Men Men Men Men Men ',len Men Men
Women Women Women Women Women Women Women Women
Licensed Practical Nurses
18,414 13,174 5,240 4,518 419 248 55 0
Number 629 438 191 135 29 27 0 0
17,785 12,736 5,049 4,383 390 221 55 0
100.0 71.5 28.5 24.5 2.3 1.3 0.3 0.0
Percent 3.4 2.4 1.0 O.% 0.2 0.1 0.0 0.0
96.6 69.2 27.4 23.8 2.1 1.2 0.3 0.0
Food Preparation and Service Workers
10,091 8,716 1,375 958 274 128 7 8
Number 2,150 1,810 340 230 72 30 0 8
7,941 6,906 1,035 728 202 98 7 0
100.0 86.4 13.6 9.5 2.7 1.3 0.1 0.1
Percent 21.3 17.9 3.4 2.3 0.7 0.3 0.0 0.1
78.7 68.4 10.3 7.2 2.0 1.0 0.1 0.0
21

Table 7
State Aggregate for Minorities and Women1980 Participation Rates for the High Tech Occupations by Race, Sex and National Origin
co
IllinoisIllinois 32
OCD0TotalMen
Women
NortminorityMen
Women
MinorityMen
Women
BlackMen
Women
HispanicMen
Women
AsianMen
Women
Am/IndMen
Women
OtherMen
Women
234,421 178,577 55,835 27,192 21,007 6,972 436 228Number 140,404 111,578 28,826 13,789 10,425 4,244 234 134
94,008 66,999 27,009 13,403 10,582 2,728 202 94
100.0 76.2 23.8 11.6 9.0 3.0 0.2 0.1
Percent 59.9 47.6 12.3 5.9 4.4 1.8 0.1 0.140.1 28.6 11.5 5.7 4.5 1.2 0.1 0.0
ti.19cF..7o

Table 8-Page 1
1980 Participation Rates for Each High Tech Occupation by Race, Sex and National OriginIllinois
Total Nonminority Minority Black Hispanic Asian Am/Ind Other
Men Men Men Men Men Men Men Men
Women Women Women Women Women Women Wo: nen Women
Electrical and Electronic Assemblers
111,287 73,624 37,663 17,041 17,781 2,508 228 105
Number 52,904 35,390 17,514 8,524 8,177 678 98 37
58,383 38,234 20,149 8,517 9,604 1,830 130 68
100.0 66.2 33.8 15.3 16.0 2.3 0.2 0.1
Percent 47.5 31.8 15.7 7.7 7.3 0.6 0.1 0.0
52.5 34.4 18.1 7.7 8.6 1.6 0.1 0.1
Computer Operators
25,870 20,673 5,197 3,676 810 625 56 30
Number 10,822 8,698 2,124 1,417 387 294 15 11
15,048 11,975 3,073 2,259 423 331 41 19
100.0 79.9 20.1 14.2 3.1 2.4 0.2 0.1
Percent 41.8 33.6 8.2 5.5 1.5 1.1 0.1 0.0
58.2 46.3 11.9 8.7 1.6 1.3 0.2 0.1
222

Table8-Page2
Illinois
TotalMen
Women
NonminorityMen
Women
MinorityMen
Women
Black HispanicMen Men
Women Women
AsianMen
Women
Am/IndMen
Women
OtherMen
Women
Computer Prugammers
25,702 21,245 4,457 2,503 725 1,149 54 26Number 13,362 11,371 1,991 795 432 712 33 19
12,340 9,874 2,466 1,708 293 437 21 7
100.0 82.7 17.3 9.7 2.8 4.5 0.2 0.1
Percent 52.0 44.2 7.7 3.1 1.7 2.8 0.1 0.1
48.0 38.4 9.6 6.6 1.1 1.7 0.1 0.0
Electrical Engineers
16,148 14,269 1,879 716 184 957 17 5
Number 15,216 13,495 1,721 602 172 925 17 5
932 774 158 114 12 32 0 0
100.0 88.4 11.6 4.4 1.1 5.9 0.1 0.0Percent 94.2 83.6 10.7 3.7 1.1 5.7 0.1 0.0
5.8 4.8 1.0 0.7 0.1 0.2 0.0 0.0
223

Table 8-Page 3
Illinois
TotalMen
Women
NonminorityMen
Women
MinorityMen
Women
Black HispanicMen Men
Women Women
AsianMen
Women
Am/IndMen
Women
OtherMen
Women
Mechanical Engineers
13,173 12,084 1,089 222 231 597 11 28
Number 12,881 11,816 1,065 209 231 586 11 28
292 268 24 13 0 11 0 0
100.0 91.7 8.3 1.7 1.8 4.5 0.1 0.2
Percent 97.8 89.7 8.1 1.6 1.8 4.4 0.1 0.2
2.2 2.0 0.2 0.1 0.0 0.1 0.0 0.0
Industrial Engineers
11,301 10,420 881 326 143 386 26 0
Number 10,047 9,272 775 230 143 376 26 0
1 ,CA 1 1A0 10E ne ti ln r, n
Percent
,
100.0
88.9
11.1
92.2
82.0
10.2
7.8
6.9
0.9
2.9
2.0
0.8
224
131.3
0.0
3.4
3.3
0.1
0.2
0.2
0.0
0.0
0.0
0.0

Table 8-Page 4
Illinois
Total Nonminority Minority Black Hispanic Asian Am/Ind OtherMen Men Men Men Men Men Men Men
Women Women Women Women Women Women Women Women
Computer Systems Analysts
10,885 9,740 1,145 643 223 269 10 0
Number 8,179 7,396 783 432 132 219 0 0
2,706 2,344 362 211 91 50 10 0
Percent
100.0
75.1
24.9
89.5
67.9
21.5
10.5
7.2
3.3
5.9
4.0
1.9
2.0
1.2
0.8
2.5
2.0
0.5
0.1
0.0
0.1
0.0
0.0
0.0
Electrical and Electronic Technicians
10,878 8,947 1,931 1,032 471 370 24 34
Number 9,539 7,879 1,660 841 418 343 24 34
1,339 1,068 271 191 53 27 0 0
Percent
100.0
87.7
12.3
82.2
72.4
9.8
17.8
15.3
2.5
9.5
7.7
1.8
4.3
3.8
0.5
3.4
3.2
0.2
0.2
0.2
0.0
0.3
0.3
0.0

Table 8-Page 5
Illinois
TotalMen
Women
NonminorityMen
Wumen
MinorityMen
Women
BlackMen
Women
HispanicMen
Women
AsianMen
Women
km/IndMen
Women
OtherMen
Women
Data Processing Machine Mechanics
7,533 6,373 1,160 701 364 90 5 0
Number 6,911 5,900 1,011 621 295 110 5 0
622 473 149 80 69 0 0 0
100.0 84.6 15.4 9.3 4.8 1.2 0.1 0.0
Percent 91.7 78.3 13.4 8.2 3.9 1.2 0.1 0.0
8.3 6.3 2.0 1.1 0.9 0.0 0.0 0.0
Peripheral EDP Equipment Operators
1,635 1,202 433 332 75 21 5 0
Number 543 361 182 118 38 21 5 0
1,092 841 251 214 37 0 0 0
100.0 73.5 26,5 20.3 4.6 1.3 0.3 0.0
Percent 33.2 22.1 11.1 7.2 2.3 1.3 0.3 0.0
66.8 51.4 15.4 13.1 2.3 0.0 0.0 0.0
226

Tabte9
State Aggregate for Minorities and Women1980 Participation Rags for the High Loss Occupations by Race, Sex and National Origin
Total Nonminority Minority Black Hispanic Asian Am/Ind OtherMen Men Men Men Men Men Men Men
Women Women Women Women Women Women Women Women
365,698 288,593 77,105 45,288 27,053 3,880 578 306Number 217,466 177,652 39,814 22,031 15,620 1,671 343 149
148,232 110,941 37,291 23,257 11,433 2,209 235 157
100.0 78.9 21.1 12.4 7.4 1.1 0.2 0.1Percent 59.5 48.6 10.9 6.0 4.3 0.5 0.1 0.0
40.5 30.3 10.2 6.4 3.1 0.6 0.1 0.0
223

Table 10-Page 1
1980 Participation Rates for Each High Loss Occupation by Race, Sex and National OriginIllinois
Total Nonminority Minority Black Hispanic Asian Am/Ind OtherMen Men Men Men Men Men Men Men
Women Women Women Women Women Women Women Women
Farm Laborers
Number
Percent
Number
Percent
157,663 109,716 47,947 L 4,785 21,215 1,380 356 211
105,154 75,230 29,924 15,682 13,180 694 250 118
52,509 34,486 18,023 9,103 8,035 686 106 93
100.0 69.6 30.4 15.7 13.5 0.9 0.2 0166.7 47.7 19.0 9.9 8.4 0.4 0.2 0.1
33.3 21.9 11.4 5.8 5.1 0.4 0.1 0.1
Farmers, Owners and Tenants
62,094 61,826 268 69 131 42 24 2
57,270 57,076 194 43 104 23 22 2
4,824 4,750 74 26 27 19 2 0
100.0 99.6 0.4 0.1 0.2 0.1 0.0 0.092.2 91.9 0.3 0.1 0.2 0.0 0.0 0.0
7.8 7.6 0.1 0.0 0.0 0.0 0.0 0.0
229 2J0

Table 10-Page 2
Illinois
Total Nonminority Minority Black Hispanic Asian Am/Ind OtherMen Men Men Men Men Men Men Men
Women Women Women Women Women Women Women Women
Compositors and Typesetters
53,454 41,370 12,084 7,893 2,613 L468 64 46
Number 16,731 14,008 2,723 1,543 744 434 2 0
36,723 27,362 9,361 6,350 1,869 1,034 62 46
Percent
100.0
31.3
68.7
77.4
26.2
51.2
22.6
5.1
17.5
14.8
2.9
11.9
4.9
1.4
3.5
2.7
0.8
1.9
0.1
0.0
0.1
0.1
0.0
0.1
Secondary School Teachers
45,736 41,480 4,256 3,301 636 272 33 14
Number 20,739 19,322 1,417 956 310 122 29 0
24,997 22,158 2,839 2,345 326 150 4 14
Percent
100.0
45.3
54.7
90.7
42.2
48.4
9.3
3.1
6.2
7.2
2.1
5.1
1.4
0.7
0.7
231
0.6
0.3
0.3
0.1
0.1
0.0
0.0
0.0
0.0

Table 10-Page 3
Illinois
Total Nonminority Minority Black Hispanic Asian Am/Ind OtherMen Men Men Men Men Men Men Men
Women Women Women Women Women Women Women Women
Teachers, College
15,903 14,123 1,780 1,102 398 249 27 4
Number 6,111 5,31: 792 457 196 119 16 4
9,792 8,804 988 645 202 130 11 0
Percent
100.0
38.4
61.6
88.8
33.4
55.4
11.2
5.0
6.2
6.9
2.9
4.1
2.5
1.2
1.3
1.6
0.7
0.8
0.2
0.1
0.1
0.0
0.0
0.0
Taxi Drivers
11,548 6,949 4,599 3,254 1,030 272 18 25
Number 10,496 6,147 4,349 3,048 987 272 17 25
1,052 802 250 206 43 0 1 0
Percent
100.0
90.9
9.1
60.2
53.2
6.9
39.8
37.7
2.2
28.2
26.4
1.8
232
8.9
8.5
0.4
2.4
2.4
0.0
0.2
0.1
0.0
0.2
0.2
0.0

Table 10-Page 4
Illinois
Total Nonminority Minority Black Hispanic Asian Am/Ind OtherMen Men Men Men Men Men Men Men
Women Women Women Women Women Women Women Women
Maids and Servants, Private
Number
Percent
10,421 6,067 4,354 3,587 644 82 37 4
683 345 338 237 87 7 7 0
9,738 5,722 4,016 3,350 557 75 30 4
100.0
6.6
93.4
58.2
3.3
54.9
41.8
3.2
38.5
34.4
2.3
32.1
6.2
0.8
5.3
0.8
0.1
0.7
0.4
0.1
0.3
0.0
0.0
0.0
Child Care Workers, Private
Number
Percent
6,676 5,798 878 537 246 81 14 0
201 165 36 36 0 0 0 0
6,475 5,633 842 501 246 81 14 0
100.0
3.0
97.0
86.8
2.5
84.4
13.2
0.5
12.6
8.0
0.5
7.5
2,3.3
3.7
0.0
3.7
1.2
0.0
1.2
0.2
0.0
0.2
0.0
0.0
0.0
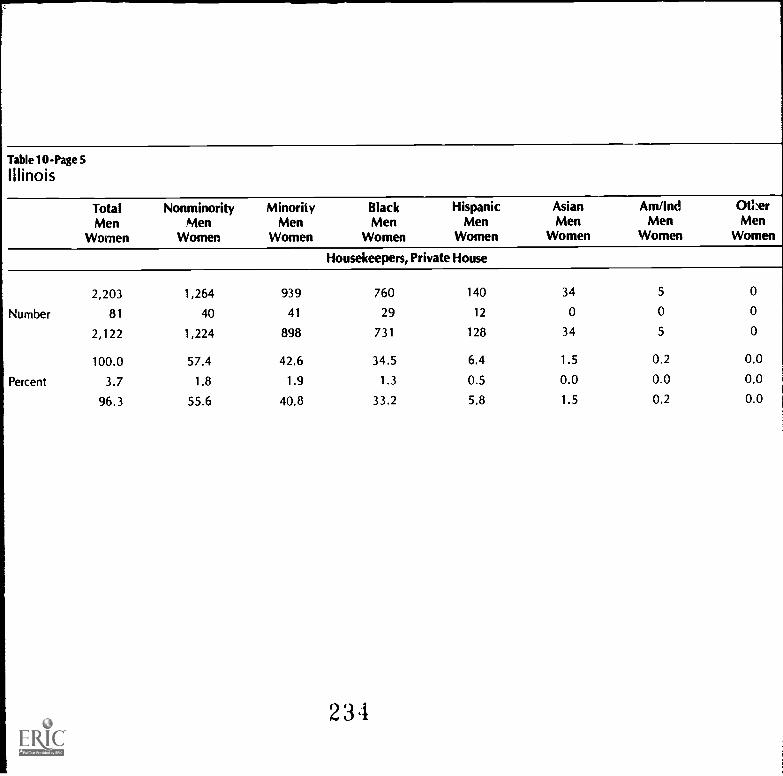
Table 10-Page 5
Illinois
Total Nonminority Minority Black Hispanic Asian Am/Ind OtlerMen Men Men Men Men Men Men Men
Women Women Women Women Women Women Women Women
Housekeepers, Private House
2,203 1,264 939 760 140 34 5 0
Number 81 40 41 29 12 0 0 0
2,122 1,224 898 731 128 34 5 0
100.0 57.4 42.6 34.5 6.4 1.5 0.2 0.0
Percent 3.7 1.8 1.9 1.3 0.5 0.0 0.0 0.0
96.3 55.6 40.8 33.2 5.8 1.5 0.2 0.0
234

200 Project 2000
Pennsylvania
Total Employed CivilianLabor Force in 1980
Refer to Tables 4 and 4.5.
,/ Minorities represented a smaller portion of Pennsylvania's CLF (8.9 percent) thanof the national CLF (17.8 percent).
,/ Hispanics had a lower participation rate in the state CLF (1.0 percent) than in thenational CLF (5.7 percent). This was the greatest difference among all groups.
High Growth Occupations:1980 Minority and Female Participation
Refer to Tables 1, 4 and 5.
,/ 40.8 percent of the state CLF was employed in High Growth occupations. This per-centage was higher than the national average.
,/ Minorities had a slightly higher participation rate in the High Growth occupations(9.3 percent) than in the state CLF (8.9 percent).
,/ Women had a higher participation rate in the High Growth occupations (53.5 per-cent) than in the state CLF (41.3 percent).
High Tech Occupations:1980 Minority and Female Participation
Refer to Tables 2, 4 and 7.
,/ Nearly 5 percent of the nation's High Tech labor force worked in Pennsylvania.,/ 3.6 percent of the state CLF was employed in the ten designated High Tech occupa-
tions. This was slightly higher than the portion of the national CLF (3.4 percent)employed in this category.
,/ Nonminority females had a lower participation rate in the High Tech category(28.6 percent) than in the state CLF (37.1 percent). This was the greatest differenceof all groups.
,/ Asians were the only minority group with a higher participation rate in this category(1.2 percent) than in the state CLF (0.5 percent).
,/ Nonminority males had a higher participation rate in this category (62.5 percent)than in the state CLF (54.1 percent).
High Loss Occupations:1980 Minority and Female Participation
Refer to Tables 3, 4 and 9.
23'5

Overview: The Five Most Populous States 201
,/ 6.5 percent of the state CLF was employed in High Loss occupations; a percentageroughly equal to the national rate (6.7 percent).
,/ Females had a slightly higher participation rate in the High Loss category (42.0 per-cent) than in the state CLF (41.3 percent). This difference was the greatest for minor-ity women.
High Growth: Top Five OccupationsMinority and Female Participation in 1980
Refer to Tables 4 and 6.
Blue-Collar Worker Supervisors
,/ 80 percent of all those working in this occupation were male.,/ Minorities had a lower participation rate in this occupation (5.4 percent) than in
the state CLF (8.9 percent). This difference was the greatest for minority women(1.0 percent compared to 4.2 percent).
,/ Nonminority women also had a lower participation rate in this occupation (12.6percent) than in the state CLF (37.1 percent).
Helpers in the Trades
,/ Females had a lower participation rate in this occupation (24.7 percent) than inthe state CLF (41.3 percent).
,/ All groups of males, except Asians, had higher participation rates in this occupationthan in the state CLF.
Secretaries
,/ 99 percent of all those working in this occupation were female.,/ 93 percent of all those working in this occupation were nonminority females.,/ Minority women had a slightly higher participation rate in this occupation (5.8 per-
cent) than in the state CLF (4.2 percent).
Automotive Mechanics
,/ Nearly 76 percent of all those working in this occupation were male.,/ Females had a lower participation rate in this occupation (24.1 percent) than in
the state CLF (41.3 percent).,/ Minority males had a slightly higher participation rate in this occupation (5.3 per-
cent) than in the state CLF (4.7 percent).
Truck Drivers
,/ Almost 95 percent of all truck drivers in Pennsylvania were male.,/ Males, both minority and non minority (except Asians), had higher participation
rates in this occupation than in the state CLF.
236

202 Project 2000
,/ Except for a small percentage of blacks (0.2 percent), tl- ere were virtually no minor-ity women working in this occupation.
High Tech: Top Three OccupationsMinority and Female Participation in 1980
Refer to Tables 4 and 8.
Electrical and Electronic A.-semblers
Females had a higher participation rate in this occupation (45.2 percent) than inthe state CLF (41.3 percent). This difference was the greatest for minority women.Black, Hispanic and Asian males all had higher participation rates in this occupa-tion than in the state CLF.
Computer Programmers
,/ Both men and women had participation rates comparable to those in the state CLF.Black, Hispanic and American Indian males had lower participation rates in thisoccupation than in the state CLF.Hispanic women had a lower participation rate in this occupation (0.2 percent)than in the state CLF (0.4 percent).Asian women had a higher participation rate in this occupation (0.8 percent) thanin the state CLF (0.2 percent).
Computer Operators
%I Females had a greater participation rate in this occupation (54.0 percent) than inthe state CLF (41.3 percent). This difference was the greatest for nonminoritywomen.Hispanic males had a lower participation rate in this occupation (0.2 percent) thanin the state CLF (0.6 percent).
High Loss: Top Three OccupationsMinority and Female Participation in 1980
Farm Laborers
,/ Almost 68 percent of all those working in this occupation were male. Both blackand Hispanic males had higher participation rates in this occupation than in thestate CLF.Hispanics were the only females with a higher participation rate in this occupation(0.5 percent) than in the state CLF (0.4 percent).
Compositors and Typesetters
%I Nearly 67 percent of th is occupation was female.Black females had a higher participation rate in this occupation (8.1 percent) than
231
Overview: The Five Most Populous States 203
in the state CLF (3.6 percent). Asian females also had a higher participation rate(0.4 percent) than in the state CLF (0.2 percent).
/ Minority males had a lower participaton rate in this occupation (2.0 percent) thanin the state CLF (4.7 percent).
Secondary School Teachers
I Women had a higher participation rate in this occupation (53 percent) than in thestate CLF (41.3 percent). This difference was the greatest fornon minority women.
,I All minority male groups, except American Indians, had lower participation ratesin this occupation than in the state CLF.
238

204 Project 2000
Table 1
State Totals: By OccupationHigh Growth Pennsylvania
1980 StateCivilian Work Force
1980 State Total:High Growth
5,306,698 2,167,497
% State Total:High Growth
40.8%
1980 NationalHigh Growth Work Force
41,504,050
State's Share of the NationalHigh Growth Work Force
5.2%
By Ranked Occupation
Occupation 1980 Total
1. Blue-Collar Worker Supervisors 244,0262. Helpers in the Trades 239,025
3. Secretaries 211,487
4. Automotive Mechanics 165,605
5. Truck Drivers 155,863
6. Janitors and Sextons 146,222
7. Sales Clerks 129,704
8. Elementary School Teachers 116,353
9. Cashiers 88,422
10. Typists 85,95011. Nurses, Professional 83,183
12. Waiters and Waitresses 79,547
13. Bookkeepers, Hand 76,514
14. General Clerks, Office 73,692
15. Nurse's Aides and Orderlies 69,694
16. Kitchen Helpers 67,032
17. Guards and Doorkeepers 55,484
18. Accountants and Auditors 45,56219. Licensed Practical Nurses 24,301
20. Food Preparation and Service Workers 9,831
Total 2,167,497
239

Overview: The Five Most Populous States 205
Table 2
State Totals: By OccupationHigh Tech Pennsylvania
1980 StateCivilian Work Force
1980 State Total:High Tech
5,306,698 191,934
% State Total:High Tech
3.6%
1980 National State's Share of the NationalHigh Tech Work Force High Tech Work Force
3,945,632 4.86%
By Ranked Occupation
Occupation 1980 Total
1. Electrical and Electronic Assemblers 83,3172. Computer Programmers 21,0653. Computer Operators 19,1084. Electrical Engineers 14,0825. Industrial Engineers 13,3936. Mechanical Engineers 11,4267. Electrical and Electronic Technicians 10,8638. Computer Systems Analysts 9,5859. Data Processing Machine Mechanics 8,422
10. Peripheral EDP Equipment Operators 673
Total 191,934
24O

206 Project 2000
Table 3
State Totals: By OccupationHigh Loss Pennsylvania
1980 State 1980 State Total: % State Total:Civilian Work Force High Loss High Loss
5,306,698 346,315 6.5%
1980 NationalHigh Loss Work Force
State's Share of the NationalHigh Loss Work Force
7,045,465 4.9%
By Ranked Occupation
Occupation 1980 Total
1. Farm Laborers 181,244
2. Compositors and Typesetters 46,961
3. Secondary School Teachers 42,935
4. Farmers, Owners and Tenants 32,718
5. Maids and Servants, Private 14,031
6. Teachers, College 13,494
7. Taxi Drivers 7,698
8. Childcare Workers, Private 5,105
9. Housekeepers, Private House 2,129
Total 346,3'5
241

Table 4
Total Employed Civilian Labor Force in 1980 Pennsylvania
Total Nonminority Minority Black Hispanic Asian Am/Ind OtherMen Men Men Men Men Men Men Men
Women Women Women Women Women Women Women Women
5,306,698 4,836,993 469,705 384,374
Number 3,115,490 2,868,692 246,798 195,5542,191,208 1,968,301 222,907 188,820
100.0 91.1 8.9 7.2
Percent 58.7 54.1 4.7 3.741 3 37.1 4.2 3.6
Table 4.5
50,770 28,261 4,495 1,805
31,425 16,051 2,768 1,00019,345 12,210 1,727 805
1 00 60.4
05 0.1 0.00 3 0.1 0.00.2 0 0 0.0
Total Employed Civilian Labor Force in 1980 National
Total Nonminority Minority BlackMen Men Men Men
Women Wome:i Women Women
Hispanic Asian Am/Ind OtherMen Men Men Men
Women Women Women Women
103,718,07f, 85,258,303 18,459,773 10,219,477 5,918,947 1,682,924 539,811 98,614
Number 59,625,553 49,633,442 9,992,111 5,161.234 3,561,059 903,321 308,962 57,535
44,092,523 35,624,861 8,467,662 5,058,243 2,357,888 779,603 203,849 41,079
100.0 82.2 17.8 9.9 5.7 1.6 0.5 0.1
Percent 57.5 47.9 9.6 5.0 3.4 0.9 0 3 0.1
42.5 34.3 8.2 4.9 2.3 0 8 0.2 0.0
243242
NJ01

Table5
State Aggregate for Minorities and Women Pennsylvania 1-.cp
1980 Participation Rates for the High Growth Occupations Combined by Race, Sex and National Origin
TotalMen
Women
NonminorityMen
Women
MinorityMen
Women
BlackMen
Women
HispanicMen
Women
AsianMen
Women
Am/IndMen
Women
OtherMen
Women
2,167,497 1,965,442 202,055 171,225 19,537 8,807 1,892 594Number 1,007970 915,774 92,196 76,258 10,923 3,654 1,082 279
1,159,527 1,049,668 109,859 94,967 8,614 5,153 810 315
100.0 90.7 9 3 7.9 0.9 0.4 0.1 0.0Percent 46.5 42.3 4 3 3.5 05 02 00 0.0
53.5 48.4 5.1 4 4 0.4 0.2 0.0 00
.._, 2442ti
N000

Table 6-Page 1
1980 Participation Rates for Each High Growth Occupationby Race, Sex and National Origin
Pennsylvania
Total Nonminority Minority Black Hispanic Asian Am/Ind OtherMen Men Men Men Men Men Men Men
Women Women Women Women Women Women Women Women
Blue-Collar Worker Supervisors
Number
Percent
244,026 230,738 13,288 10,648 1,432
210,842 200,079 10,763 8,527 1,198
33,184 30,659 2,525 2,121 234
100.0 94.6 5.4 4.4 0.686.4 82.0 4.4 3.5 0.513.6 12.6 1.0 0.9 0.1
Number
Helpers in the Trades
239,025 215,606 23,419 18,570 3,821
180,044 165,516 17,528 13,934 293958,981 53,090 5,891 4,636 882
100.0Percent 75.3
24.7
90 2 9.8 7.8 1.6
68.0 7.3 5.8 1.2
22.2 2.5 1.9 0.4
998 141 69
876 113 49122 28 20
0.4 0.1 0.00.4 0.0 0.00.0 0.0 0.0
715 271 42
425 202 28
290 69 14
0.3 0.1 0.00.2 0.1 0.00.1 0.0 0.0
246 24./

Table 6-Page 2
Pennsylvania
Total Nonminority Minority Black Hispanic Asian Am/Ind OtherMen Men Men Men Men Men Men Men
Women Women Women Women Women Women Women Women
Secretaries
Number
Percent
211,487 199,021 12,466 10,543 1,410 347 115 51
2,202 1,905 297 287 4 6 0 0
209,285 197,116 12,169 10,256 1,406 341 115 51
1 00.0
1.0
99.0
94.1
0.9
93.2
5.9
0.1
5.8
5.0
0.1
4.8
0.7
0.0
0.7
0.2
0.0
0.2
0.1
0.0
0.1
0.0
0.0
0.0
Automotive Mechanics
165,605 151,770 13,835 10,808 1,899 923 178 27
Number 1 25,705 117,002 8,703 6,551 1,390 592 148 22
39,900 34,768 5,132 4,257 509 331 30 5
Percent
100.0
75.9
24.1
96.6
70.7
21.0
8.4
5.3
3.1
6.5
4.0
2.6
1.1
0.8
0.3
248
0.6
0.4
0.2
0.1
0.1
0.0
0.0
0.0
0.0

Table 6-Page 3
Pennsylvania
Total Nonminority Minority Black Hispanic Asian Am/Ind OtherMen Men Men Men Men Men Men Men
Women Women Women Women Women Women Women Women
Truck Drivers
155,863 144,695 11,168 9,500 1,362 84 193 29
Number 147,385 136,597 10,788 9,182 1,316 78 183 29
8,478 8,098 380 318 46 6 10 0
Percent
100.0
94.6
5.4
92.8
87.6
5.2
7.2
6.9
0.2
6.1
5.9
0.2
0.9
0.8
0.0
0.1
0.1
0.0
0.1
0.1
0.0
0.0
0.0
0.0
Janitors and Sextons
146,222 117,458 28,764 25,720 2,203 604 195 42
Number 94,297 76,628 17,669 15,711 1,452 335 136 35
51,925 40,830 11,095 10,009 751 269 59 7
Percent
100.0
64.5
35.5
80.3
52.4
27.9
19.7
12.1
7.6
17.6
10.7
6.8
249
1.5
1.0
0.5
0.4
0.2
0.2
0.1
0.1
0.0
0.0
0.0
0.0

Table 6-Page 4
Pennsylvania
Total Nonminority Minority Black Hispanic Asian Am/Ind OtherMen Men Men Men Men Men Men Men
Women Women Women Women Women Women Women Women
Elementary School Teachers
116,353 106,620 9,733 8,555 722 333 57 66Number 36,120 33,831 2,289 1,935 223 104 4 23
80,233 72,789 7,444 6,620 499 229 53 43
Percent
100.0
31.0
69.0
91.6
29.1
62.6
8.4
2.0
6.4
7.4
1.7
5.7
0.6
0.2
0.4
0.3
0.1
0.2
0.0
0.0
0.0
0.1
0.0
0.0
Sales Clerks
129,704 121,794 7,910 6,497 816 497 68 32
Number 33,524 31,164 2,360 1,949 246 130 15 20
96,180 90,630 5,550 4,548 570 367 53 12
Percent
100.0
25.8
74.2
93.9
24.0
69.9
6.1
1.8
4.3
5.0
1.5
3.5
2,.) i
0.6
0.2
0.4
0.4
0.1
0.3
0.1
0.0
0.0
0.0
0.0
0.0

Table 6-Page 5
Pennsylvania
TotalMen
Women
NonminorityMen
Women
MinorityMen
Women
BlackMen
Women
HispanicMen
Women
AsianMen
Women
Am/IndMen
Women
OtherMen
Women
Waiters and Waitresses
79,547 75,089 4,458 3,122 553 702 49 32
Number 5,987 5,153 834 456 145 221 9 3
73,560 69,936 3,624 2,666 408 481 40 29
100.0 94.4 5 6 3.9 0.7 0 9 0.1 0.0
Percent 7.5 6.5 1.0 0.6 0.2 0.3 0.0 0.0
92.5 87.9 4.6 3.4 0.5 0.6 0.1 0.0
Cashiers
88,422 80,789 7,633 6,305 711 506 77 34
Number 12,706 11,195 1,511 1,116 242 129 16 8
75,716 69,594 6,122 5,189 469 377 61 26
100.0 91.4 8.6 7.1 0.8 0.6 0.1 0.0
Percent 14.4 12.7 1.7 1.3 0.3 0 1 0.0 0.0
85.6 78.7 6.9 5.9 0.5 0.4 0.1 0.0
251

Table 6-Page 6
Pennsylvania
TotalMen
Women
NonminorityMen
Women
MinorityMen
Women
Black HispanicMen Men
Women Women
AsianMen
Women
Am/IndMen
Women
OtherMen
Women
Typists
85,950 73,186 12,764 11,452 869 361 49 33
Number 9,619 8,488 1,131 939 128 57 0 7
76,331 64,698 11,633 10,513 741 304 49 26
100.0 85.1 14.9 13.3 10 0.4 0.1 0.0
Percent 11.2 9.9 1.3 1.1 0.1 0.1 0.0 0.0
88.8 75.3 135 12.2 0.9 0.4 0.1 0.0
Nurses, Professional
83,183 78,767 4,416 3,033 400 924 35 24
Number 2,440 2,290 150 83 29 30 8 0
80,743 76,477 4,266 2,950 371 894 27 24
100.0 94.7 5.3 3.6 0.5 1.1 o.o 0.0
Percent 2.9 2.8 0.2 0.1 0.0 0.0 0.0 0.0
97.1 91.9 5.1 3.5 04 1.1 0.0 0.0
252

Table 6-Page 7
Pennsylvania
TotalMen
Women
NonminorityMen
Women
MinorityMen
Women
Black HispanicMen Men
Women Women
AsianMen
Women
AmilndMen
Women
OtherMen
Women
Bookkeepers, Hand
76,514 72,722 3,792 3,051 409 286 46 0
Number 9,042 8,393 649 490, 85 68 6 0
67,472 64,329 3,143 2,561 324 218 40 0
100.0 95.0 5.0 4.0 0.5 0.4 0.1 0.0
Percent 11.8 11.0 0.8 0.6 0.1 0.1 0.0 0.0
8F.2 84.1 4.1 3.3 0.4 0.3 0.1 0.0
General Clerks, Office
73,692 64,832 8,860 7,946 555 259 80 20
Number 15,154 13,366 1,788 1,520 141 67 43 17
58,538 51,466 7,072 6,426 414 192 37 3
160.0 88.0 12.0 10.8 0.8 0.4 0.1 0.0
Percent 20.6 18.1 2.4 2.1 0.2 0.1 0.1 0.0
79.4 69.8 9.6 8.7 0.6 0.3 0.1 0.0
253

Table 6-Page 8
Pennsylvania
Total Nonminority Minority Black Hispanic Asian Am/Ind OtherMen Men Men Men Men Men Men Men
Women Women Women Women Women Women Women Women
Nurse's Aides and Orderlies
69,694 53,888 15,806 14,618 629 408 114 37Number 9,586 7,221 2,365 2,123 146 69 -47 0
60,108 46,667 13,441 12,495 483 339 87 37
Percent
100.0
13.8
86.2
77.3
10.4
67.0
22 7
3.4
19 3
21.0
3017.9
0.9
0207
0.6
0.1
0.5
020.0
0.1
0.1
0.0
0.1
Guards and Doorkeepers
55,484 47,066 8,418 7,640 533 115 123 7
Number 51,016 43,458 7,558 6,851 478 110 119 0
4,468 3,608 860 789 55 5 4 7
Percent
100 0
91.9
8.1
84.8
78 3
6.5
152
13.6
1.5
138
12.3
1.4
1.0
0.9
0.1
25 i
020.2
0.0
0.2
0.2
0.0
0.0
0.0
0.0

Table 6-Page 9
Pennsylvania
Total Nonminot :ty Minority Black Hispanic Asian Am/Ind Other
Men Men Men Men Men Men Men Men
Women Women Women Women Women Women Worner. Women
Accountants and Auditors
45,562 42,843 2,719 2,200 211 271 20 17
Number 32,527 31,171 1,355 1,048 112 164 15 17
13,035 11,672 1,363 1,152 99 107 5 0
Percent
100.0
71 4
28 6
94.0
68.4
25.6
6.0
3.0
3.0
4.8
2.3
25
0.5
0.2
0.2
0.6
0.4
0.2
0.0
0.0
0.0
0.0
0.0
0.0
Licensed Practical Nurses
Number
Percent
24,301 20,284 4,017 3,793 140 58 19 7
644 465 179 155 22 0 2 0
23,657 19,819 3,838 3,638 118 58 17 7
100.0
2.7
97.3
83.5
1.9
81.6
16.5
0.7
15.8
15.6
0.6
15.0
255
0.6
01
0.5
0.2
00( 2
0.1
0.0
0.1
0.0
0.0
0.0

Table 6-Page 10
Pennsylvania
Total Nonminority Minority Black Hispanic Asian Am/lud OtherMen Men Men Men Men Men Men Men
Women Women Women Women Women Women Women Women
Kitchen Helpers
67,032 59,234 7,798 6,557 796 358 62 25Number 27,547 23,446 4,101 3,263 604 177 36 21
39,485 35,788 3,697 3,294 192 181 26 4
Percent
100.0
41.1
58.9
88.4
35.0
53.4
11.6
6.1
5.5
9.8
4.9
4.9
'..2
0.9
03
0.5
0.3
0.3
0.1
0.1
0.0
0.0
0.0
0.0
Food Preparation Service Workers
9,831 9,040 791 667 66 58 e 0Number 1,583 1,406 177 138 23 16 0 0
8,248 7,634 614 529 43 42 0 0
Percent
100.0
16.1
83.9
92.0
14.3
77.7
8.0
1.8
5.2
6.8
1.4
5.4
256
0.7
0.2
0.4
0.6
0.2
0.4
0.0
0.0
0.0
0.0
0.0
0.0
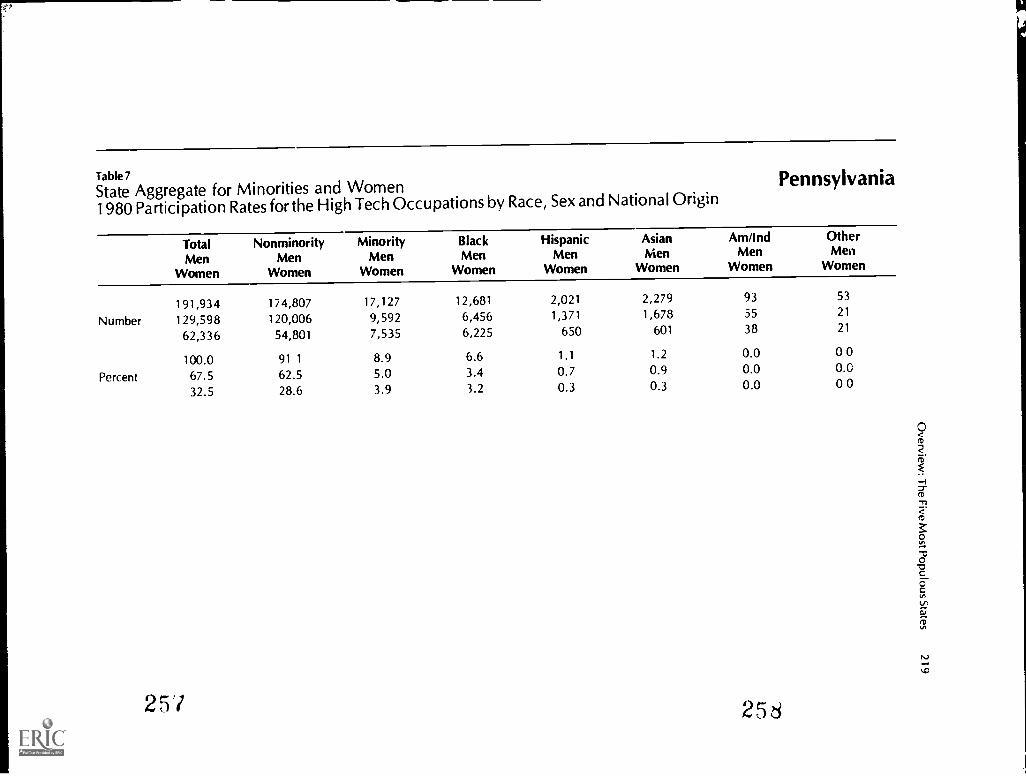
Table 7
State Aggregate for Minorities and Women1980 Participation Rates for the High Tech Occupations by Race, Sex and National Origin
Pennsylvania
TotalMen
Women
NonminorityMen
Women
MinorityMen
Women
BlackMen
Women
HispanicMen
Women
AsianMen
Women
Am/IndMen
Women
OtherMen
Women
191,934 174,807 17,127 12,681 2,021 2,279 93 53
Number 129,598 120,006 9,592 6,456 1,371 1,678 55 21
62,336 54,801 7,535 6,225 650 601 38 21
100.0 91 1 8.9 6.6 1.1 1.2 0.0 00
Percent 67.5 62.5 5.0 3.4 0.7 0.9 0.0 0.0
32.5 28.6 3.9 3.2 0.3 0.3 0.0 00
2 5 ./ 258

Table 8-Page 1
1980 Participation Rates for Each High Tech Occupation Pennsylvania ;3°
by Race, Sex and National Origin rt,
ts.)0°O
Number
Percent
Number
Percent
25a
TotalMen
Women
NonminorityMen
Women
MinorityMen
Women
BlackMen
Women
HispanicMen
Women
AsianMen
Women
Am/IndMen
Women
OtherMen
WomenElectrical and Electronic Technicians
83,317 73,621 9,696 7,553 1,407 670 51 1545,626 40907 4,719 3,417 920 351 21 1037,691 32,714 4,977 4,136 487 319 30 5
100.0 88.4 11.6 9.1 1.7 0.8 0.1 0.054 8 49.1 5.7 4.1 1.1 0.4 0.0 0.045.2 39.3 6.0 5.0 0.6 0.4 0.0 00
Computer Programmers
21,065 19,363 1,702 1.227 107 357 6 511,924 11,255 669 416 70 183 0 09,141 8,108 1,033 811 37 174 6 5
100.0 91.9 8.1 5.8 0.5 17 0.0 0.056.6 53.4 3.2 2.0 0.3 0.9 00 0.043.4 38.5 4.9 3.8 0.2 0.8 0.0 0.0
200

I
Table 8-Page 2
Pennsylvania
Total Nonminority Minority Black Hispanic Asian Am/Ind Other
Men Men Men Men Men Men Men Men
Women Women Women Women Women Women Women Women
Computer Operators
19,108 17,227 1,881 1,607 127 125 17 5
Number 8,796 7,911 885 756 39 70 15 5
10,312 9,316 996 851 88 55 2 0
100.0 90.2 9.8 8.4 0.7 0.7 0.1 0.0
Percent 46.0 41.4 4.6 4.0 0.2 0.4 0.1 0.0
54.0 48.8 5.2 4.5 0.5 0.3 0.0 0.0
Electrical Engineers
14,082 13,347 735 324 74 331 0 6
Number 13,648 12,954 694 299 69 320 0 6
434 393 41 25 5 11 0 0
100.0 94.8 5.2 2.3 0.5 2.4 0.0 0.0
Percent 96.9 92.0 4.9 2.1 0.5 2.3 0.0 0.0
1 1 '1 0 /A 1 \ - n el n IN IN A A
26i

Table 8-Page 3
Pennsylvania
TotalMen
Women
NonminorityMen
Women
MinorityMen
Women
Black HispanicMen Men
Women Women
AsianMen
Women
Am/IndMen
Women
OtherMen
Women
Industrial Engineers
13,393 12,911 482 267 47 162 0 6Number 12,51G 12,055 455 254 47 154 0 0
883 856 27 13 0 8 0 6
100.0 96.4 3.6 2.0 0.4 1.2 0.0 0.0Percent 93.4 90.0 3.4 1.9 0.4 1.1 0.0 0.0
6.6 6.4 0.2 0.1 0.0 0.1 0.0 0.0
Mechanical Engineers
11,426 10,767 659 193 55 409 0 2
Number 11,254 10,607 647 181 55 409 0 2
172 160 12 12 0 0 0 0
100.0 94.2 5.8 1.7 0.5 3.6 0.0 0.0Percent 98.5 92.8 5.7 1.6 0.5 3.6 0.0 0.0
1.5 1.4 0.1 0.1 0.0 0.0 0.0 0.0
262

Table 8-Page 4
Pennsylvania
Total Nonminority Minority Black Hispanic Asian Am/Ind OtherMen Men Men Men Men Men Men Men
Women Women Women Women Women Women Women Women
Electrical and Electronic Technicians
10,863 10,067 796 638 79 71 6 2
Number 9,921 9,267 654 510 65 71 6 2
942 800 142 128 14 0 0 0
Percent
100.0
91.3
8.7
92.7
85.3
7.4
7.3
6.0
1.3
5.9
4.7
1.2
0.7
0.6
0.1
0.7
0.7
0.0
0.1
0.1
0.0
0.0
0.0
0.0
Computer Systems Analysts
9,585 8,945 640 455 28 137 13 7
Number 7,519 7,073 446 300 23 103 13 7
2,066 1,872 194 155 5 34 0 0
Percent
100.0
78.4
21.6
93.3
73.8
19.5
6.7
4.7
2.0
4.7
3.1
1.6
263
0.3
0.2
0.1
1.4
1.1
0.4
0.1
0.1
0.0
0.1
0.1
0.0

able 8 -Page 5
Pennsylvania
Total Nonminority Minority Black Hispanic Asian Am/Ind OtherMen Men Men Men Men Men Men Men
Women Women Women Women Women Women Women Women
Data Processing Machine Mechanics
8,422 8,000 422 333 72 17 0 0
Number 8,170 7,790 380 297 66 17 0 0
252 210 42 36 6 0 0 0
Percent
100.0
97.0
3.0
95.0
92.5
2.5
5.0
4.5
0.5
4.0
3.5
0.4
0.9
0.8
0.1
0.2
0.2
0.0
0.0
0.0
0.0
0.0
0.0
0.0
Peripheral EDP Equipment Operators
673 559 114 84 25 0 0 5
Number 230 187 43 26 17 0 0 0
443 372 71 58 8 0 0 5
Percent
100.0
34.2
65.8
83.1
27.8
55.3
16.9
6.4
10.5
12.5
3.9
8.6
3.7
2.5
12
0.0
0.0
0.0
000.0
0.0
0.7
0.0
0.7

Table 9
State Aggregate for Minorities and Women1980 Participation Rates for the High Loss Occupations by Race, Sex and National Origin
Pennsylvania
Total Nonminority Minority Black Hispanic Asian
Men Men Men Men Men Men
Women Women Women Women Women Women
346,315 309,564 36,751 29,429 5,767 1,183
Number 200,941 1 82 ,803 18,138 13,302 4,114 495
145,374 126,761 18,613 16,127 1,653 688
100.0Percent 58.0
42.0
265
89.4 10.6 8.5 1.7 0.3
52.8 5.2 3.8 1.2 0.1
36.6 5.4 4.7 0.5 0.2
Am/IndMen
Women
OtherMen
Women
277 95
185 42
92 53
0.1 0.00.1 0 00.0 0.0
266

Table 10 -Page 1 :,,1980 Participation Rates for Each High Loss Occupation Pennsylvania .g.
by Race, Sex and National Origin
Total Nonminority Minority Black Hispanic Asian Am/Ind OtherMen Men Men Men Men Men Men Men
Women Women Women Women Women Women Women Women
181,244Number 123,000
58,244
100.0Percent 67.9
32.1
46,961Number 15,668
31,293
100.0Percent 33.4
66.6
Farm Laborers
161,089 20,155 14,86 4,452 604 172 41
108,888 14,112 10,075 3,584 292 143 1852,201 6,043 4,811 868 312 29 23
88.9 11.1 8.2 2.5 0.3 0.1 0.060 1 7.8 5.6 2.0 0.2 0.1 0.028.8 3.3 2.7 0.5 0.2 0.0 0.0
Compositors and Typesetters
41,745 5,216 4,614 345 232 20 5
14,721 947 799 95 53 0 027,024 4,269 3,815 250 179 20 5
88.9 V 1 9.8 0.7 0.5 0.0 0031.3 2.0 1.7 0.2 0.1 0.0 0.057.5 9.1 8.1 0.5 0.4 0.0 0.0
0180

Table 10-Page 2
Pennsylvania
Total Nonminority Minority Black Hispanic Asian Am/1nd OtherMen Men Men Men Men Men Men Men
Women Women Women Women Women Women Women Women
Secondary School Teachers
42,935 40,639 2,296 1,826 321 106 37 6
Number 20,194 19,426 768 558 144 34 26 6
22,741 21,213 1,528 1,268 177 72 11 0
Percent
100.0
47.0
53.0
94.7
45.2
49.4
5.3
1.8
3.6
4.3
1.3
3.0
0.7
0.3
0.4
0.2
0.1
0.2
0.1
0.1
0.0
0.0
0.0
0.0
Farmers, Owners and Tenants
32,718 32,503 215 42 125 33 5 10
Number 28,893 28,705 188 39 117 17 5 10
3,825 3,798 27 3 8 16 0 0
Percent
100.0
88.3
11.7
99.3
87.7
11.6
0.7
0.6
0.1
0.1
0.1
0.0
269
0.4
0.4
0.0
0.1
0.1
0.0
0.0
0.0
0.0
0.0
0.0
0.0

Tale 10-Page 3
Pennsylvania
TotalMen
Women
NonminorityMen
Women
MinorityMen
Women
Black HispanicMen Men
Women Women
AsianMen
Women
Am/IndMen
Women
OtherMen
Women
Maids and Servants, Private
14,031 9,036 4,995 4,737 168 60 23 7
Number 660 481 179 179 0 0 0 0
13,371 8,555 4,816 4,558 168 60 23 7
100.0 64.4 35.6 33.8 1.2 0.4 0.2 0.0
Percent 4.7 3.4 1.3 1.3 0.0 0.0 0.0 0.0
95.3 61.0 34.3 32.5 1.2 0.4 0.2 0.0
Teachers, College
13,494 12,470 1.024 792 109 113 2 8
Number 5,642 5,190 452 315 45 84 0 8
7,852 7,280 572 477 64 29 2 0
100.0 92.4 7.6 5.9 0.8 0.8 0.0 0.1
Percent 41.8 38.5 3.3 2.3 0.3 0.6 0.0 0.1
58.2 53.9 4.2 3.5 0.5 0.2 0.0 0.0
2*i 0
.1

Table 10-Page 4
Pennsylvania
Total Nonminority Minority Black Hispanic Asian Am/Ind OtherMen Men Men Men Men Men Men Men
Women Women Women Women Women Women Women Women
Taxi Drivers
7,698 6,146 1,552 1,390 129 15 18 0
Number 6,716 5,250 1,466 1,311 129 15 11 0
982 896 86 79 0 0 7 0
Percent
100.0
87.2
12.8
79.8
68 2
11.6
20.2
19.0
1.1
18.1
17.0
1.0
1.7
1.7
0.0
0.2
0.2
0.0
0.2
0.1
0.i
0.0
0.0
0.0
Child Care Workers, Private
Number
Percent
5,105 4,557 548 449 70 18 0 11
99 93 6 6 0 0 o 0
5,006 4,464 542 443 70 18 0 ,1
100.0
1.9
98.1
89.3
1.8
87.4
10.7
0.1
10.6
8.8
0.1
8.7
271
1.4
0014
0.4
0.0
0.4
0.0
0.0
0.0
0.2
0.0
0.2
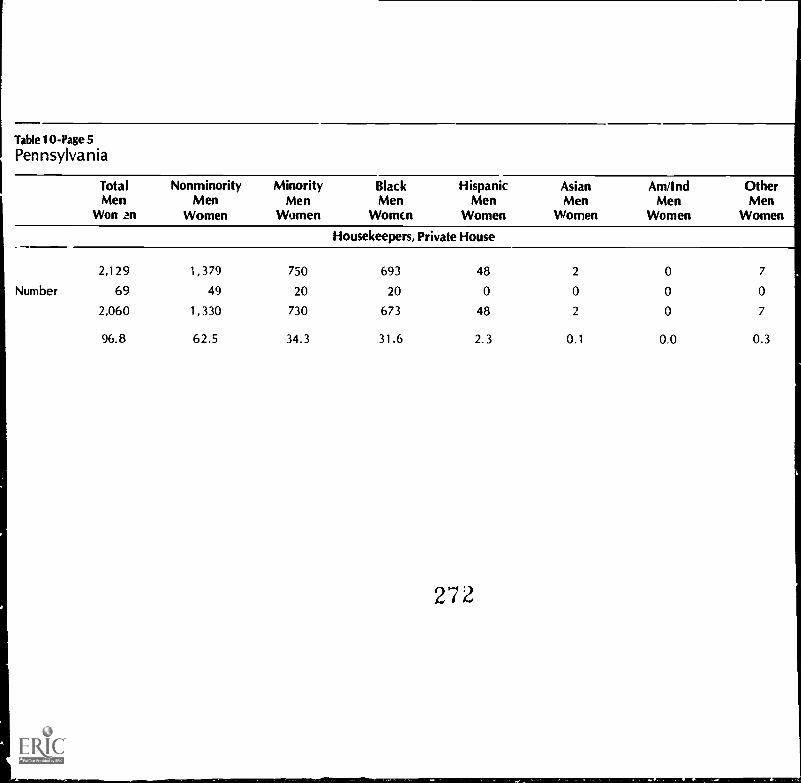
Table 10-Page 5
Pennsylvania
Total Nonminority Minority Black Hispanic Asian Am/Ind OtherMen Men Men Men Men Men Men Men
Won zn Women Women Womc.n Women Women Women Women
Number
Housekeepers, Private House
2,129 1,379 750 693 48 2 0 7
69 49 20 20 0 0 0 0
2,060 1,330 730 673 48 2 0 7
96.8 62.5 34.3 31.6
272
2.3 0.1 0.0 0.3

Outlook:Meeting Occupational Demands in a Changing Job Market
2i3

232 Project 2000
INTRODUCTION
Concern about this country's productivity, technical creativity and development,employment problems, and ability to compete in the world market, has promptedwidespread examination of the present educational system. Deficiencies in thescholastic aptitude of America's youth, and skepticism about their sufficiency of prep-aration for job entry has generated curricular reform in the public schools. In addition,growing recognition that present employees lack the skills to remain competitive ina job market transformed by technology has led to the creation of programs aimedat upgrading the skills of the work force. Equal employment opportunity into the nextcentury will depend on these combined efforts by educators, policy makers, and busi-ness leaders to design programs that prepare students and workers to meet new jobrnarket demands, and the availability of this knowledge and training to all ind:viduals.
2'74

BEST COPY AVAILABLE
Occupational Requirements An Overview 233
This chapter provides information on training, educational, and other requirementsfor entry into the Project 2000 High Growth and High Tech occupations. It is interest-ing to note that many High Growth occupations require some knowledge of computeror word processing skills, evidence that use of the newest technology has transcendedthe boundaries of recognized High Tech fields into the traditional work place.
The 20 High Growth and 10 High Tech occupations are reviewed in alphabeticalorder within each category. The descriptions Include brief summaries of job responsi-bilities, salary levels, and sources for additional inform:don. Qualifications and re-sponsibilities information was obtained from several sources which included the Oc-cupational Outlook Handbook, 1982-1983 Edition, and interviews with associationrepresentatives from each occupation. Salary information* was obtained from twosources: the 1983 Current Population Survey (CPS) of 60,000 households throughoutthe U.S., and BLS statistics from the November 1983 issue of Employment and Earn-ings.
Each section concludes with a list of suggestions on where to find additional jobinformation. This list is not exhaustive, and we suggest that you contact the FederalJob Information Center, your state job information center, and state occupational of-fice. Most of these offices also I ist current local openings.
In some cases, salary information was not available from either source, or con-flicted with our expectations. A third source was used in these instances, and is notedbefore the salary figures.
The average Federal salary from the Office of Personnel Management is providedfor some occupations.
Salary information is Cased upon CPS and BLS figures. The first figure stated is the occupation's average annual1982 gross salary from the 1983 CPA. The second figure is the BLS average weekly gross earnings for productionor nal-supervisory workers during September 1983. The BLS figure is the cross-occupational average for a particularindustry rather than the average for the specific occupation. This explains the discrepancies between some BLS andCPS salary figures.
275

234 Project 2000
High Growth
Accountants and Auditors
Job Description
Accountants gather and analyze information on financial transactions. They maybe involved in a particular plan or the entire process of designing, developing, inst,..1-I ing, operating and evaluating an organization's accounting procedures. The primaryareas of speciaNzation within the occupation are:
,/ TaxThese accountants compute Federal, state and local government taxes, pre-pare returns and advise clients on the tax advantages and disadvantages of existingand proposed business transactions.
,/ CostThese accountants analyze factors which affect production and service de-livery costs to advise clients on the tax advantages and disadvantages of existingproposed business transactions.
I BudgetThese accountants plan, monitor and assess client's revenues and expen-ditures.
,/ Management ConsultantsThese accountants review a client's production, per-sonnel selection, and decision making processes to suggest strategies to strengthenits organizational capabilities.Auditors review individual's, governments', and business' financial statements to
determine the accuracy of information. The majority of auditors are.
,/ InternalThese auditors work within an organization to ensure the thorough andaccurate accounting of its transactions.
/ TaxThese auditors work in government or pr:vate industry and evaluate !axliabilities.
QualificationsA career in accounting or auditing demands a strong aptitude for computing and
interpreting figures. The ability to communicate orally and in writing is also requiredsince accountants and auditors meet with clients to solicit information about their fi-nancial circumstances, and provide advice. Most employers require a minimum ofa bachelor's degree, and an increasing number prefer a mister's degree. Computerprogramming skills (for example, HP3000 systems, IMAGE Database, EDP, COBOL,CICS, and TSO) are also helpful since many accountants and auditors are util; eingcomputers to decrease their workload, or advise clients on the use of computers formonitoring business transactions.
276

Occupational Requireme, its: An Overview 235
Beginning (paying $17,138 to $22,277) positions it accounting and auditing withthe Federal government require: four years of college (including 24 semester hoursin accounting or auditing) and a year's specialized experience; or two years of generaland two years of specialized experience for high school graduates. Those holding amaster's degree in accounting automatically qualify for entry-level positions withoutany experience.
A standard college curriculum which will prepare one for entry into either occupa-tion includes courses in: the theory and practice of accounting/auditing; business law;economics; computer applications; taxation; management; mathematics; marketing;and written and oral communication.
To be certified as a public accountant (CPA), applicants must pass a test adminis-tered by their state's board of accountants. Most states require candidates to haveeither a bachelor's degree and two years experience, or a master's degree and oneyear's experience before taking the test. To renew the license, some states requirecompletion of additional college credits to ensure that certified practitioners are keep-ing abreast of changes in accounting and auditing procedures.
Salary
CPS average annual 1982 gross salary for "Accountants and Auditors": $21,989.BLS average weekly gross earnings in September 1983 for nonsupervisory workers in"Accounting, Auditing and Bookkeeping": $347.85.Accountants and auditors (series 510) in the Federal government earned on average$32,800 (gross) as of March 31, 1983.
Some Information Sources
American Institute of Certified Public Accountants1121 Avenue of the AmericasNew York, New York 10036
National Association of Accountants919 Third AvenueNew York, New York 10022
National Society of Public Accountants andthe Accreditation Council for Accountancy1C1 North Fairfax StreetAlexandria, Virginia 22314
:nstitute of Internal Auditors249 Maitland AvenueAltamonte Springs, Florida 32701
American Assembly of Collegiate Schools of Business11500 Olive Bot!levardSuite 142St. Louis, Missouri 63141(for information about educational programs)
277

236 Project 2000
Tax Executives Institute1 61 6 North Ft. Myer DriveFourteenth FloorArlington, Virginia 22209
Association of Tax Consultants2433 Northeast Clarkamas StreetPortland, Oregon 97232
Institute for Certification of Tax Professionals1 832 Stratford StreetPomona, California 91768
The American Association of Hispanic Certified Public Accountants401 C Street, N.E.Washington, D.C. 20002
National Association of Black Accountants1 642 K Street, N.W.Washington, D.C. 20009
National Association of Minority CPA Firms1025 Vermont Avenue, N.W.Suite 355Washington, D.C. 20005
Automotive Mechanics
Job Description
Mechanics repair the electrical and mechanical functions of cars and trucks.Whereas mechanics handle complex jobs such as rebuilding an engine, mechanic'saides are usually assigned the routine maintenance tasks and simple repairs. Somemechanics specialize in a particular type of repair (such as transmissions, tune-ups,exhaust systems, and the restoration of damage due to a collision) or type of motorvehicle (European, Japanese or American). While the majority work in private gds sta-tions, department stores and automobile dealer's repair shops (all of which usuallyemploy at most five mechanics), a portion do work for the government to repair gov-ernment-owned vehicles.
Qualifications
A mechanical aptitude is what employers generally seek from applicants. Mostmechanics learn their craft on the job. They begin as apprentices doing simple repairs,
276

Occupational Requirements: An Overview 237
gradually gaining expertise which enables them to tackle major repairs. A typical ap-prenticeship lasts three to four years. Some acquire experience in vocational schoolprograms or the military. Training is an on-going process during a mechanic's career,and employers frequently send their Staff to training centers for the purpose of learninghow new automobile models function. Mechanics can participate in a voluntary cer-tification program administered by the National Institute for Automotive Service Ex-cellence. Most (87 percent) entering the field in 1980 had a high school diploma orless. A third had been in school one year prior to their employment as mechanics.
Salary
CPS average annual 1982 gross earnings for "Automotive Mechanics": $13,601.BLS average weekly gross earnings in September 1983 for nonsupervisory workers in"Auto Repair, Services and Garages": was $264.22; more specifically, $295.f10 in"Automotive Repair Shops"
Some Information Sources
Automotive Service Industry Association444 North Michigan AvenueChicago, Illinois 60611
Automotive Service Councils, Inc.188 Industrial DriveSuite 112Elmhurst, Illinois 60126
National Automobile Dealers Association8400 Westpark DriveMcLean, Virginia 22102
Motor Vehicle Mechanics Training ProjectSouthern Association of Colleges and Schools195 Peachtree Street, N . E.
Atlanta, Georgia 30308
Blue-Collar Worker Supervisors
Job Description
These supervisors allocate job assignments to workers on production lines and inconstruction trades. They also make certain that the work performed is done properlyand within the time schedule that management has allocated. Blue-collar workersupervisors often serve as a liaison between the rank-and-file and upper-level man-agement. Their responsibilities may also include analyzing the costs of production,and maintaining documents on supplies and workers' time schedules. More than half
279

238 Project 2000
work in manufacturing industries. Another 21 percent work in nondurable goods andmanufactures, while the remaining 11 percent are employed in the transportation,communications and utilities industries.
Qualifications
Employers look for proven leadership qualities in applicants. For those positionsrequiring the supervision of union workers, employers choose those candidates fami l-iar with union regulations governing the settlement of worker-management disputesand contract negotiations. A high school diploma or General Education Degree (GED)is considered essential by most employers. The more technical the good producedor complex the production process, the more likely that the employer will seek per-sons with a college education. The training programs established by the High Techcompanies for supervisors prefer those who have completed some course work at atechnical school or college, particularly in industrial relations, science, business ad-ministration, management and engineering. Many supervisors begin as assembly-lineworkers and are promoted to supervisory positions after proving their capabilities.Prior experience in the company may be an additional qualification.
Salary
CPS average annual 1982 gross earnings for "Supervisors in Production Occupa-tions": $23,096.BLS statistics were not available.
Some Information Sources
American Management Association135 West 50th StreetNew York, New York 10020(Contact for a bibliography of career literature on management occupations.)
National Association of Minority Contractors1705 DeSales Street, N.W.Suite 404Washington, D.C. 20036
Bookkeepers, Hand
Job Description
Bookkeepers monitor financial transactions by maintaining a journal and filing theaccompanying documentation such as cancelled checks, receipts, time cards and in-voices. In firms employing 100 or fewer persons, the bookkeeper usually handles theentire day-to-day accounting of the firm's expenditures and receipts as well as payroll
2 6 0

Occupational Requirements: An Overview 239
processing, supply purchases and customer billing. Larger companies often divide theresponsibilities so that each bookkeeper's tasks are highly specialized. The computeris now being used extensively to record, store and analyze an organization's finances.
Qualifications
An aptitude for math, an attentiveness to detail and systematic work habits are con-sidered to be the main attributes of a person suited for a career in bookkeeping. Em-ployers' needs are becoming more extensive, requiring the completion of advancedcourses in business administration and principles of accounting and auditing offeredat community and junior colleges. Knowledge of office procedures, and proven skillsin using both 10-key adding machines and manual ledger systems (such as the cashdisbursement one-write system) are some typical requirements. Expertise in using anautomated data processing system (for example, the software manufactured Ey IBMand Digital) is particularly helpful since even small firms are following the lead of thelarge corporations by substituting computers for manual ledger systems.
Two years of general experience is required for entry-level positions within the Fed-eral government (paying between $12,367 and $16,075). For higher-paying open-ings ($13,837 to $17,986), an additional year of specialized experience is required.The applicant must be knowledgeable about accoui .ing policies, terminology, datecodes necessary for processing transactions using an automated system, and reconcil-ing computer-generated records with source documents.
Salary
CPS data were not available.Bic average weekly gross earnings in September 1983 for nonsupervisory workers in" Accounting, Auditing and Bookkeeping": $347.85.Bookkeepers and accounting clerks (series 525) employed in the Federal governmentearned on average $16,660 (gross) as of March 31, 1983.
Some Information Sources
See Accountants and Auditors.
Cashiers
Job Description
Cashiers are employed to record and package purchases, and receive payment.Restaurants, movie theaters, college bursar's offices, supermarkets, departmentstores, hotels and hospitals are a few of the many organizations which hire cashiers.More cashiers work in supermarkets and grocery stores than in any other business.About half of cashiers work part-time.
281

240 Project 2000
Qualifications
Educational and skill requirements are minimal, however, good math and interper-
sonal skills and a high school diploma or GED are helpful. Employers tend to prefer
those applicants who are able to work a flexible schedule. The large department stores,
restaurant franchises and supermarket chains usually provide formal,. on-the-job train-
ing to teach new employees how to operate their computerized checkout systems.
Salary
CPS average annual 1982 gross salary for "Cashiers": $5,077.BLS average weekly gross earnings in September 1983 for nonsupervisory personnel
in "Department Stores" was $172.87; and $243.18 in "Grocery Stores"
Some Informatiai Sources
National Association of Retail Grocers of the U.S.P. 0. Box 17208Washington, D.C. 20041
United Food and Commercial Workers International UnionSuffridge Building1775 K Street, N.W.Washington, D.C. 20006
Clerks
Job Description
Th it; category encompasses a broad range ofadministrative support positions which
are responsible for limited typing, filing, paperwork processing, authorizing payment,performing computations with a calculator or computer, and operating office equip-
ment. Positions can be highly specialized in certain industries, depending on the size
of the company. In banking, for example, clerks are assigned specific duties in divi-
sions such as trust securities, check sorting and processing, and financial data entry.
Some businesses, like hotels, require clerks to work directly with clients. Word pro-
cessors (for example, Lexitron, IBM, Wang and Olivetti) are being incorporated into
office systems to assist clerks in preparing typed copies of handwritten drafts and to
store business records.
Qualifications
Many employers hire high school grauuates with clerical training for permanentpositions. Qualifications vary greatly, but basicskills such as typing, shorthand, filing,
arithmetic, the operation of office machines, and a basic mastery of English are typical
282

Occupational Requirements: An Overview 241
requirements. Applicants must be familiar with general office procedures and, forsome jobs, adept at composing letters.
In the Federal government, entry-level clerical jobs (paying $12,367 to $16,075)usually require applicants to have had two years of experience (one general, the otherspecialized), while higher-paying ($13,837 to $17,986) positions require candidatesto have had an additional year of specialized experience.
Salary
CPS average annual 1982 gross salary:
"Supervisors": $19,826,/ "Financial Records Processing Occupations": $10,596,/ "Mail and Message Distributing Occupations": $14,958
"Material Recording, Scheduling, a. id Distributing Occupations": $12,940,/ "Other Administrative Support Occupations, including Clerical": $9,642
BLS statistics were not available.Mail and file clerks (series 305) employed by the Federal government earned an aver-age $12,992 (gross) as of March 31, 1983.
Some Information Sources
(also see Secretaries)The American Institute of BankingAmerican Bankers Association1120 Connecticut Avenue, N.W.Washington, D.C. 20036(Conducts educational and training programs for bank clerks.)
Federal Court Clerks AssociationU.S. Court HouseNew Orleans, Louisiana 70130
National Association for Court Administration
National Center for State Courts300 Newport AvenueWilliamsburg, Virginia 23185
International Institute of Municipal Clerks160 North Altadena DrivePasadena, California 91107
283

242 Project 2000
Elementary School Teachers
lob Description
Elementary School Teachers are responsible for teaching students basic skills in En-glish, math, social studies and the arts. The teacher usually develops the curriculumfor the class, disciplines students, administers tests, assigns homework, and monitorsand grades the student's performance. In open classrooms, a group of teachers mayshare these responsibilities. Most teachers work ten months a year and are employedin public school systems. After a trial period, tenurewhich gives the individual per-manent status and guarantees an appeals procedure before he or she can be dismis-
sedis extended to teachers.
Qualifications
Every state mandates that public elementary school teachers be certified by thestate's department of education. Similar certification for teachers in nonpublic schoolsis less frequently required. The specific requirements for certification in each state aredescribed in Requirements for Certification for Elementary Schools, SecondarySchools, Junior Colleges, 48th edition, by Elizabeth H. Woellner (Chicago: Universityof Chicago Press, 1983). A bachelor's degree is the minimum requirement to be con-sidered for teaching positions in elementary schools. Many school districts require thecomp!etion of graduate courses after individuals are hired to keep the teaching staffabreast of new classroom teaching methods and subject matter. The educational qual-ifications for advancement to positions in curriculum development or supervisors ofteachers depend on the school system's size. The larger systems usually require a cer-tificate in school administration, or a master's degree, and a minimum of five to sevenyears teaching experience.
Salary
CPS average annual 1982 gross salary for "Teachers, except Postsecondary":$14,263.BLS statistics were not available.
Some Information Sources
The American Federation of Teachers11 Dupont Circle, N.W.Washington, D.C. 20036
National Education Association1201 16th Street, N.W.Washington, D.C. 20036
284

Occupational Requirements: An Overview 243
Food Preparation and Service WorkersFast Food Franchises
Job Description
The greatest number of food preparation and service jobs is currently found in thefast food franchises. Many of these jobs are specializedtending the cash register orcooking and packaging a particular food item. The majority of workers are hired ona part-time shift basis to serve breakfast, lunch and dinner customers. A small percen-tage participates in management training programs. One fast food company's adver-tisement recently sought applicants with either two years of college or experience insales, hotel management, retail or teaching.
Qualifications
In positions requiring contact with customers, an outgoing personality and a neatappearance are essential. Employers seek those who are flexible in the times andnumber of hours they can work. Many states require restaurant employees to havea certification of good health. Skills are usually acquired through on-the-job training,so educational or training qualifications are minimal. However, a GED or completionof a high school or technical training program is preferred by some employers.
Salary
CPS average annual gross salary in 1982 for "Food Preparation and Service Workers:"$4,585.BLS average weekly gross earnings in September 1983 for "Eating and DrinkingPlaces": $113.26.According to Restaurants and Institutions (November 15, 1983, page 28), the averageweekly pay for commercial cooks was $209; for dishwashers, $142; and for servers,$130.
Some Information Sources
The National Institute for the Foodservice Industry20 North Wacker DriveSuite 2620Chicago, Illinois 60606
National Food Service AssociationP.O. Box 1932Columbus, Ohio 43216
255

244 Project 2000
Guards and Doorkeepers
Job Description
Guards protect buildings, property and persons. In office buildings,some monitor
entrances and exits to prevent trespassing, theft, accidents or vandalism. Some are
stationed at gates surrounding construction sites to guard against vandalism and theft.
Department stores hire security personnel to minimize shoplifting. One-half of allguards work in industrial security firms and guard agencies. The remaining number
are employed by banks, building management companies, hotels, retail stores,utilities, schools and government.
Doorkeepers work in hotels, apartment buildings and office buildings to assist cus-
tomers, residents and employees as they enter or exit the building.
Qualifications
Employers prefer candidates for both positions who have earned a high school dip-
loma. For security guard openings, firms seek those who are physically fit, experi-
enced with lirearms, knowledgeable about first aid, and without a police record.The qualifications the Federal government has established for security guards are:
"alertness; tact; integrity; ability to learn and to apply regulations and guidelines relat-
ing to protection-security systems; ability to be firm in applying protective proce-dures, methods and techniques; skill in the use of firearms; emotional stability; land]
physical fitness." Candidates for entry- level positions (paying $10,097 to $12,708)
are not required to have any experience while those applying for higher-paying posi-tions are required to have one (for jobs paying $12,367 to $16,075), two (paying$13,369 to $17,383), three (paying $13,837 to $17,986), and four years of experi-
ence (paying $15,423 to $20,049).
Salary
CPS average annual 1982 gross salary for "Protective Service Occupations": $13,698.
BLS statistics were not available for the position of guard.
CPS and BLS statistics were not available for the position of doorkeeper.
Guards employed by the Federal government earn on average $13,270 (gross) as of
March 31, 1983.
Some Information Sources
American Federation of Guards4157 West Fifth StreetNorth 220Los Angeles, California 90020
2 8 6

Occupational Requirements: An Overview 245
International Union of Security Officers2404 Merced StreetSan Leandro, California 94577
International Guards Union of America1444 Gardiner LaneLouisville, Kentucky 40213
Helpers in the Trades
job Description
This category includes assistants to bricklayers, carpenters, electrician, paintersand others employed in the construction industry. Helpers usually are assigned to do
the le lst skilled tasks such as unloading and delivering materials or operating cementmixers. They often assist the journeyman in performing more exacting kinds of jobs.Some positions are tied to an apprenticeship program in which the worker advancesto higher-paying, more difficult positions as he or she acquires the necessary skills.
Qualifications
The strenuous work requires candidates to be in good physical condition. Appli-cants must usually be 18 years old. The skilled positions in the trades require somemastery of mechanical or carpentry skills, which have been acquired through partici-pation in vocational education programs.
Salary
CPS average annual 1982 gross salary for "Construction Laborers" was $7,178, and$7,521 for "Helpers and Miscellaneous Manual Occupations",BLS average weekly gross salary in September 1983 for nonsupervisory workers in
,/ "Construction": $454.80.,/ "General Building Contractors": $399.53.,/ "Heavy Construction Contractors": $499.34.I "Special Trade Contractors": $463.98.
Some Information Sources
Laborers' International Union of North America90516th Street, N.W.Washington, D.C. 20006
Laborers' Associated General Contractors' Education and Training Fund1730 Rhode Island Avenue, N.W.Suite 909Washington, D.C. 20036
28;

246 Project 2000
National Association of Minority Contractors1 705 DeSales Street, N.W.Suite 404Washington, D.C. 20036
AFL-CIO/Construction Trades Department815 16th Strcet, N.W.Washington, D.C. 20006
Janitors and Sextons
job Description
Janitors work in public and private office buildings, hotels, theaters, trains and else-where to insure that these buildings are dean, comfortable and safe for employeesand residents. Their custodial responsibilities may include painting, polishing furni-ture ana performing elementary electrical, plumbing and carpentry jobs.
Sextons maintain a church's premises. In both jobs, workers may be required touse lightweight, electric-powered equipment to perform their responsibilities.
Qualifications
No specific skills or educational qualifications are usually specified. Some basiccarpentry, electrical and plumbing skills are often preferred, as is the applicant's abil-ity to work a flexible schedule involving night and weekend shifts.
Salary
CPS average annual 1982 gross salary for "Cleaning and Building Service Occupa-tions, except Household": $7,123.BLS statistics were not available.Janitors employed by the Federal government earned o:-. average $1 2,810 (gross), asof March 31, 1983.
Some Information Sources
Contact the state occupational research office.
Kitchen Hdpers
job Description
This category includes dishwashers, kitchen janitors, food preparation staff, busboysand assistants to bartenders. Kitchen helpers are employed in schools, hospitals, com-pany-staff restaurants and commercial establishments. The workday is sometimes splitbetween two shifts, which coincide with the breakfast, lunch or dinner trade.
2 Ss

Occupational Requirements: An Overview 247
Qualifications
Several states require kitchen helpers to be certified to show they are in good health.Employers look for a neat appearance and flexibility in terms of the hours that the ap-plicant is available for work. Some employers hire kitchen helpers as apprentices tobecome chefs, waiters/waitresses or bartenders.
Salary
CPS annual average 1982 gross salary for "Food Preparation and Service Occupa-tions": $4,585.BLS average weekly gross earnings in September 1983 for nonsupervisory workers in"Eating and Drinking Places": $113.26.According to Restaurants and Institutions (November 5, 1983, page 28) the averageweekly salaries are
,/ "Commercial Cook": $209,/ "Commercial Dishwasher": $142,/ "Commercial Server": $130I "Noncommercial Cook": $206I "Noncommercial Dishwasher": $177I "Noncommercial Server": $176
Some Information Sources
National Institute for the Foodservice Industry20 North Wacker DriveSuite 2620Chicago, Illinois 60606
American Society for Hospital Food Service AdministratorsAmerican Hospital Association840 North Lake Shore DriveChicago, Illinois 60611
American School Food Service Association4101 East Iliff AvenueDenver, Colorado 80222
National Food Services AssociationP.O. Box 1932Columbus, Ohio 43216
259

248 Project 2000
Licensed Practical Nurses
Job Description
Licensed Practical Nurses (LPNs) are assigned to monitor and use medical equip-
ment, to take and record a patient's blood pressure, administer certain prescribedmedications, and to assist doctors in examining patients. LPNs may also feed and
bathe patients. They usually work under the direction of a registered nurse (RN).
About three-fifths work in hospitals; the remaining number are employed in long-
term care facilities and private practitioners' offices.
Qualifications
LPNs must hold a license to practice. Candidates must have passed an examination
administered by the state department of health to qualify for this license. Admission
to the exam is granted only after the candidate successfully completes an accredited
program in nursing, which usually lasts two years. Schools, in selecting applicantsfor admission, prefer those with a high school diploma, successful performance on
aptitude tests and good health The training program includes courses in human biol-
ogy, patient care, pharmacology, and diagnostic procedures. According to the Na-
tional League for Nursing, the program is less comprehensive than that for RNs.
Salary
CPS average annual 1982 gross salary for "Licensed Practical Nurses": $10,579.
BLS average weekly gross earnings in September 1983 for nonsupervisory workers
in,/ "Health Services": $242.63,/ "Offices of Physicians": $226.50,/ "Nursing and Personal Care Facilities": $162.69,/ "Hospitals": $281.47
Note: The BLS statistics are the average salaries for all persons who work in the par-
ticular industry. There is no distinction made in salary statistics for specific occupa-
tions within an industry. These same statistics are restated for the occupations of regis-
tered nurses and nurse's aides/orderlies. This does not mean that all three occupations
earn the same salary.
Some Information Sources
Career Information ServiceNational League for Nursing10 Columbus CircleNew York, New York 10009
2. Y 0

Occupational Requirements: An Overview 249
National Association for Practical Nurse Education and Service, Inc.254 West 31st StreetNew York, New York 10001
National Federation of Licensed Practical Nurses, Inc.250 West 57th StreetNew York, New York 10106
National Black Nurses AssociationP.O. Box 13358Boston, Massachusetts 02118
National Licensed Practical Nurses Educational FoundationP.O. Box 11038Durham, North Carolina 27703
National Association of Hispanic Nurses30B Briarwood LaneBranford, Connecticut 06405
National Male Nurse Association2309 State StreetSaginaw, Michigan 48602
Nurse's Aides and Orderlies
job Description
The functions of nurse's aides and orderlies include taking blood pressure, assistingpatients in performing their physical therapy exercises, feeding and bathing patientsand taking patients' temperatures. Some may plan and coordinate patients' recrea-tional activities. The level of complexity of the occupation's responsibilities dependson the employer's size and the degree to which the employer segments staff responsi-
bilities to develop highly specialized positions.
Qualifications
Employers seek applicants who are in good health and flexible in their ability towork different shifts. Although employers prefer those who have some basic knowl-edge of health sciences and emergency health care practices, most training is doneon the job. Unlike the LPNs and RNs, who must be licensed, the requirements fornurse's aides and orderlies are set by the employer. Hospitals and health care centerstend to prefer those with a high school diploma or GED.
Salary
CPS statistics were not available.
291

250 Project 2000
BLS average weekly gross salary for September 1983 for nonsupervisory workers in
,/ "Health Services": $242.63.,/ "Office of Physicians": $226.50.,/ "Nursing and Personal Care Facilities": $162.69.,/ "Hospitals": $281.47.
Some Information Sources
See Licensed Practical Nurses.
Registered Nurses
Job Description
Registered Nurses (RN's) perform some of the physician's tasks in his or her ab-sence, such as monitoring and recording the patient's symptoms and progress, ad-ministering medications according to the doctor's instructions, and explaining to pa-tients the use of medications and instruments. Two-thirds of all RNs are employedin hospitals, and the remaining number are squally divided between private long-term health care facilities, community clinics, and health practitioners' offices. RNssometimes perform supervisory functions.
Qualifications
There are three principal kinds of training for RNs diploma (two to three years);associate's degree (two years); and bachelor's degree (four to five years). All states andthe District of Columbia mandate that prospective RNs graduate from an accreditedschool before they can take the state-administered examination for their license.Selection for admission to accredited nursing schools is based on academic recordsand performance on aptitude tests. A physical examination is also required prior toadmission to the school.
The RN education program is considered to be broader and more intensive thanthat for LPNs. The standard curriculum includes studies in human biology and psy-chology, pharmacology, patient care, health care management, medical laws, anddiagnostic procedures. Some programs enable students to specialize ;n a particularaspect of patient care, such as terminally or mentally ;II patients, physical therapy andhospital administration.
Salary
CPS statistics were not avai l-,ble.BLS average weekly gross ea, ,ngs in September 1983 for nonsupervisory personnel in
,/ "Health Services": $242.63.
1 292

Occupational Requirements: An Overview 251
,/ "Offices of Physicians": $226.50.,/ "Nursing and Personal Care Facilities": $162.69.,/ "Hospitals": $281.47.
Some Information Sources
See Licensed Practical Nurses.
Sales Clerks
Job Description
Sales Clerks explain the advantages of certain merchandise to potential customers.If necessary, they demonstrate how the merchandise operates. Sales clerks also usea cash register to record purchases, receive payment, and package the customer'sitems. In some stores, sales clerks take inventory, order new merchandise and stockshelves.
Qualifications
Entry into the occupation is relatively easy since education and experience require-ments are minimal. Employers prefer high school graduates who are personable andadept at math. Most sales persons learn the relevant skills on the job. Stores may seekcandidates with some expertise in selling appliances, furniture, rugs, and hardware.Vocational courses in merchandising, or retail sales experience gained through par-ticipation in a distributive education program clearly enhance one's job application.Advancement to retail management positions is mostly limited to those holding a col-lege degree.
Salary
CPS average annual 1982 gross salary for "Sales Workers, Retail and Personal Ser-vices": $6,090.BLS average weekly gross earnings in September 1983 for "Retail Trade" clerks was$171.95, and $166,99 for "General Merchandise Store" clerks.
Some Information Sources
Retail, Wholesale and Department Store Union (AFL-CIO)30 East 29th StreetNew York, New York 100016
United Food and Commercial Workers International Union (AFL-CIO)Suffridge Building1775 K Street, N.W.Washington, D.C. 20006
2 9 3

252 Project 2000
Secretaries
job Description
Secretaries are administrative support personnel, whose responsibilities includeclerical duties, appointment scheduling, filing, stenography, drafting correspon-dence, and typing. In some positions, such as legal and medical secretaries, the workcan be highly specialized. Most secretaries work full- time. The scope of secretarialresponsibilities extends beyond that of clerk- typists to include supervisory duties. Thetypical secretarial position requires a general knowledge of the substantive work ofthe persons assisted. Secretaries serve as the principal office assistants, and organizethe flow of paperwork, the filing system, travel, conferences, meetings, reports, andbriefings.
Secretaries are increasingly iequired to use automated office systems to carry outtheir assignments. The importance of computers in the work place is shown by thestatistic that 7 to 10 million U.S. workersapproximately 7 percent of the total work-forceuse video display terminals.
Qualifications
A typing speed of 45 to 55 words per minute, shorthand skills (about 90 words pe-minute), and the mastery of a broad range of clerical skills are typical requirements.High school graduates of secretarial courses qualify for most positions. More special-ized skills are required for the positions of court reporter, and legal, medical and statis-tical secretaries. Employers are showing increased preference for applicants withsome college education. This trend is suggested by the fact that college-educated per-sons filled two of every five secretarial job openings in 1980.
The Federal government requires that applicants have experience in administrativeor clerical work for entry-level (paying $13,837 to $17,986), and higher level posi-tions.
Salary
CPS average annual 1982 gross salary for "Secretaries, Typists and Stenographers"was $10,227.BLS statistics were not available.Secretaries (series 318) employed in the Federal government earned, on average,$16,380 (gross) as of March 31, 1983.
Some Information Sources
Professional Secretaries International2440 Pershing RoadSuite G10Kansas City, Missouri 64108
29,1

Occupational Requirements An Overview 253
International Association of Word Processing Specialists1669 South VossSuite 100Houston, Texas 77057
National Association of Educational Office Personnel1902 Association DriveReston, Virginia 20911
National Association of Government Secretaries5143 Summit DriveFairfax, Virginia 22030
Truck Drivers
Job Description
There are essentially two types of truck driverslong-distance and short-haul/local. Some are assigned to regular delivery routes, while others are placed in a poolof available (irivers and assigned responsibilities depending on the flow of goods tobe delivered and the number of drivers available that day. Truck drivers may workwith a dispatcher to plan their delivery routes and estimate the approximate drivingtimes. Drivers also keep records on maintenance and mileage. Some trucking firmsrequire their drivers to load and unload the truck.
Qualifications
A chauffeur's ILense for local truck drivers is required by most states. Long-distancedrivers are required by the U.S. Department of Transporion (DOT), (which sets theminimum qualifications for drivers engaged in interstate commerce) to be at least 21years of age, physically fit, have normal blood pressure, and have a minimum of 20/40vision when aided or unaided by glasses. Applicants must be adept at driving thetrucks the company uses. Long-distance drivers must pass a test on the Federal MotorCarrier Safety Regulations. A copy of these regulations is available from the Govern-ment Printing Office (price: $6.00; GPO Frock No. 050-001-000-2442). Mechanicalaptitude and some experience in driving a forklift are additional qualifications thatare attractive to employers.
Salary
CPS average annual 1982 gross salary for "Motor Vehicle Operators" was $13,345;for "Transporation Occupations except Motor Vehicles": $22,671.BLS average weekly gross earnings in September 1983 for nonsupervisory workers in"Trucking and Trucking Terminals" was $414.96.Under the National Motor Freight Agreement, short-haul drivers earned on average$13.26 per hour in 1983 and long-haul drivers earned on average 32.5 cents per mile.
295

254 Project 2000
As of January 15, 1984, medium drivers (hauling more than one ton but less than four)employed by the Federal government in the Washington, D.C. metropolitan areaearned $8.64 per hour. Heavy drivers (hauling more than four tons) earned $9.24 perhour.
Some information Sources
American Trucking Association, inc.or National Tank Truck Carriers Association
1616 P Street, N.W.Washington, D.C. 20036
International Brotherhood of Teamsters, Chauffeurs, Warehousemen and Helpersof America25 Louisiana Avenue, N.W.Washington, D.C. 20001
National Association of Specialized CarriersP.G. Box 331Marietta, Georgia 30061
National Council of Independent TruckersBox 71
Lemont, Illinois 60439
Typists
Job Description
These employees make typed copies of handwritten drafts and transcribe tape-re-corded dictation. Typing is often part of the job's more general clerical duties, whichinclude filing, photocopying, and serving as a receptionist. The standard electric type-write, is steadily being replaced by word processing machines that memorize andproofread text for basic spelling and grammatical errors. The majority of typists workin l'ederal, state and local government offices.
Qualifications
Employers usually require a minimum speed of 45 to 55 words per minute and ex-cellent English skills. A growing number of employers prefer typists with word pro-cessing machine skills. A high school diploma or a GED is considered the minimumeducational requirement. Applicants should have some knowledge of general officeprocedures such as filing and correspondence formats, and use of office equipment.
Far entry-level positions in the Federal government (paying $10,097 to $12,708),applicants must have a demonstrated ability to type and a knowledge of English. Forpositions paying $1 1,017 to $14,320, candidates must have had six months of rele-
296

Occupational Requirements: An Overview 255
vant experience or have completed one year of full-time study at a business, secreta-rial or commercial school, or at a college or junior college. Applicants for jobs paying$12,367 to $16,075 must have had one year of appropriate experience in additionto these requirements.
Salary
CPS annual average 1982 gross salary for "Secretaries, Stenographers, and Typists"was $10,227.BLS statistics were not available.Clerk-typists (series 322) employed by the Federal government earned on average$12,100 as of March 31, 1983.
Some Information Sources
See Secretaries.
Waiters and Waitresses
Job Description
Waiters and waitresses explain the menu to and take the orders from their custom-ers. In some restaurants, the responsibilities are divided between several attendantswine, entrees and desserts. In other establishments, one waiter or waitress serves thecustomers throughout the meal. Hospitals, companies, and long-term health care fa-cilities also employ servers of food in addition to the franchises and other commercialrestaurants.
Qualifications
Restaurants prefer those with high ,chool diplomas, good interpersonal skills anda neat appearance. Many states require that those working in this occupation havea certification of good health. Some of the larger restaurants provide formal classroomtraining, but most waiters and waitresses learn their skills on the job. Employersgener-ally prefer those applicants who have completed at least two years of high schoo: orits equivalent.
Salary
CPS statistics were not available.BLS average weekly gross earnings in September 1983 for non supervisory workers in"Eating and Drinking Places": $113.26.According to Restaurants and Institutions (November 15, 1983, page 23), the averageweekly salary for "Commercial Servers" was $130 and $176 for "Noncommercial Ser-vers."
29 7

256 Project 2000
Some Information Sources
See Food Preparation andService WorkersFast Food Restaurants.
See also Kitchen Helpers.
29

Occupational Requirements: An Overview 257
High Tech
Computer Operators
Job Description
Computer operators initiate and monitor computer processing. Some operatorsenter data and instructions into the computer and control its functions using a console.Problems which arise during the computer's operations are usually solved by pro-grammers and systems analysts assisted by operators. Additional responsibiiities mayinclude maintaining supplies and performing occasional routine tests to ensure thatthe system is working properly.
Qualifications
Employers prefer those with some knowledge of the specific system used in the busi-ness, and some relevant experience in business or government. Six out of every tenjob openings in 1980 were filled by experienced workers. The fact that four out often persons hired hac.; not worked in the field during the previous year, however,suggests that employers are willing to hire applicants with little or no computer train -i ng to fill entry-level positions. Computer operators must be adept at reading, interpre-ting, and responding correctly to the information that the computer transmits. A profi-ciency in computer programming and a limited mechanical aptitude are also soughtby employers. Job counselors advise those seeking positions as computer operatorsto acquire some expertise in several of the most widely used computer systems. A highschool diploma or a GED is usually required for most positions, but a certificate incomputer operations is also an advantage.
Salary
CPS average annual 1982 gross salary for "Computer Equipment Operators" was$12,776.BLS average weekly gross earnings in September 1983 for nonsupervisory workers in"Computer and Data Processing Services" was $355.13.Computer Operators (series 332) employed in the Federal government earned onaverage $19,400 (gross), as of March 31, 1983.
Some Information Sources
American Federation of Information Processing Societies1815 North Lynn StreetArlington, Virginia 22209
National Computer Association (Information Processing)1845 East Fremont Circle, SouthLittleton, Colorado 80122
299

258 Project 2000
Institute for Certification of Computer Professionals35 East Wacker DriveChicago, Illinois 60601
Women in Data ProcessingP.O Box 8117San Diego, California 92101
Computer Programmers
Job Description
Programmers write the instructions that computers follow to organize, store, re-
trieve and analyze data. For example, the programmer may write a program to calcu-
late interest rates and type these instructions into the system. Programmers sometimes
work with systems analysts to ensure that the computer's capabilities can adequately
meet the program's requirements.
Qualifications
Employers require mastery of a computer language; COBALT, ICL, FORTRAN,
BASIC, PASCAL, and PL-1 are some of the most frequently requested. Requirements
are becoming more specialized, with a college degree in computer programmming
or similar fields such as information science, mathematics and the physical sciences
being increasingly sought by employers. A certificate in computer programming,
awarded by the Institute for Certification of Computer Professionals, to those who
have successfully passed an examination the institute administers, is considered by
some in the industry to be a useful qualification.In the Federal government, for positions paying $13,837 to $17,986, completion
of a four-year course (preferably in computer science) at an accredited college is re-
quired. The more advanced positions require one year (for jobs paying $17,138 to
$22,277), two years (for jobs paying $20,965 to $27,256) or three years (for jobs pay-
ing $25,366 to $32,980) of specialized experience or, as a substitute, the equivalent
amount of time invested in graduate studies in computer and information sciences.
Salary
CPS statistics were not available.BLS average weekly gross earnings in September 1983 for nonsupervisory workers in
"Computer and Data Processing Services": $355.13.
Computer programmers/analysts/specialists (series 334) employed by the Federal gov-
ernment earned on average $32,225 (gross).
Some Information Sources
See Computer Operators.
3

Occupational Requirements: An Overview 259
Women in Information Processing1000 Connecticut Avenue, N.W.Washington, D.C. 20036
Association of Computer Programers and Analysts11800 Sunrise Valley DriveSuite 808Reston, Virginia 22091
Computer Systems Analysts
Job Description
Systems analysts examine whether a firm's computer equipment is sufficient to han-dle their actual and projected data processing workload (for example, payroll process-ing). Analysts often prepare assessments which show their employers the trade-offsbetween the costs of using a particular computer system, and the computercapabilities the firm will gain or lose. Computer analysts may be responsible for diag-nosing existing problems in a computer system and preparing recommendations tocorrect these problems.
Qualifications
The rapid pace of technological advancements in computers has resulted in an in-creasing number of employers demanding applicants have at least a bachelor's de-gree, and preferably a master's degree, in computer science, information systems, en-gineering, mathematics, accounting or business management. Computer and busi-ness experience are clear advantages. Nearly half of all those working in this occupa-tion had transferred from other related jobs. Knowledge of several programming lan-guages is also an advantage. Employers seek those who are knowledgeable aboutmethods of computer software and hardware analysis, and adept at developingspecifications for computer equipment needs to match particular job assignments.
For entry-level positions in the Federal government paying $13,837 to $17,986,completion of a four-year course (preferably in computer science) at an accredited col-lege is required. The positions paying $17,138 to $22,277 require one year of special-ized experience, or the equivalent amount of time invested in graduate studies in com-puter and information sciences. Jobs paying 4,20,965 to $27,256 require two years, andthose paying $25,366 to $32,980 require three years of relevant experience.
Salary
CPS stetistics were not available.BLS average weekly gross earnings in September 1983 for nonsupervisory workers in"Computer and Data Processing Services" was $255.13.Computer programmers/systems analysts employed by the Federal government
3n1

260 Project 2000
earned, on average, $32,225 (gross) as of March 31, 1983.
Some Information Sources
See Computer Operators and ComputerProgrammers.
Data Processing MachineMechanics
Job Description
Data processing machine mechanics diagnose the operating problems of com-
puters and make the necessary repairs. They sometimes work with systems analysts
to modify a computer to handle the firm's data processing requirements. Their respon-
sibilities may also include periodic inspection and testing of the computer's compo-
nents to ensure that the equipment is functioning properly. After repairing the equip-
ment, mechanics usually write a report explaining the work performed and specifying
the costs of parts and labor.
Qualifications
Entry-level applicants usually must have completed one to two years of post-high
school training in micro-electronics and computers. Almost all employers offer on-
the-job training to enable employees to acquire specific knowledge about the particu-
lar system that the company sells, leases or uses. Computer systems change rapidly,
which means that mechanics usually participate each year in a training session spon-
sored by the manufacturer of the computer to learn the electrical and mechanical
workings of new systems. Employers prefer a mechanical aptitude and good verbal
and written communications skills.
Salary
CPS statistics were not available.BLS average weekly gross earrings in September 1983 for nonsupervisory workers in
"Computer and Data Processing Services" was $355.13.
Some Information Sources
See Computer Operators and Computer Programmers.
Computer and Business EquipmentManufacturer's Association
1828 L Street, N.W.Washington, D.C. 20036
3 "' 2

Occupational Requirements: An Overview 261
Electrical and Electronic Assemblers
Job Description
This occupation entails working on a production line to manufacture silicon chipsand micro-electronics equipment. Assemblers solder components, perform tests todetermine whether the products meet the manufacturer's quality control standards,and package the goods for shipment. They are often assisted in their routine tasks byrobots. Some assemblers may be assigned to monitor the equipment and make simpleadjustments in the way that assembly machines are functioning.
Qualifications
Most assemblers are trained on the job by the employer. Since most productionlines opee around-the-clock, employers seek those who are able to work a flexiblework schedule. Dexterity, and a high school diploma or GED are additional attributesthat employers look for in their applicants.
Salary
Not available.
Some Information Sources
See Computer Operators and Computer Programmers.
Electrical and Electronic Engineers
Job Description
Electrical and electronic engineers design and supervise the installation of electricalpower systems and their controls, as well as computer and communications systems.An increasing number are using computers to assist in the design, analysis and testingof electrical equipment. They are responsible for ensuring that their design specifica-tions comply with Federal, state and local building codes.
Some engineers also provide cost estimates for the construction, operation andmaintenance of the electrical, computer and communications systems, and are inv)I-ved in reviewing the bids of potential contractors. More engineers work in the electri-cal and electronics field than in any other branch of the profession.
Qualifications
Most entry-level positions in engineering require a bachelor's degree. Advanceddegrees are considered more essential for those pursuing a career in education thanfor those seeking work in commercial firms. The length of time spent in college varies
303

262 Project 2000
from four to five years, depending on whether the curriculum alternates field experi-ence with formal classroom instruction (a cooperative education program). In 1980,44 percent of all those who entered engineering were recent engineering graduates.The remaining proportion had transferred from other related occupations.
Engineers whose work may affect life, health or property, or who offer their servicesto the public must be licensed in all 50 states and the District of Columbia. To belicensed, applicants must have earned a bachelor's degree from an accredited col-lege, completed four years of work in the field, and passed a state-administeredexamination.
Salary
CPS data were not available.The BLS average weekly gross earnings in September 1983 for nonsupervisory work-ers in "Engineering and Architectual Services" was $456.98.In the Federal government, electrical engineers (series 850) earned $34,854 (gross),and electronics engineers (series 855) earned $37,600 (gross), as of March 31, 1983.
Some Information Sources
Engineering Manpower Commission of the American Association of EngineeringSocieties345 East 47th StreetNew York, New York 10017
National Society of Professional Engineers2029 K Street, N.W.Washington, D.C. 20006
National Action Council for Minorities in Engineering, Inc.3 West 35th StreetNew York, New York 10017
Society of Women Engineers345 East 47th StreetNew York, New York 10017
Electrical and Electronic Technicians
Job Description
These technicians operate, maintain and repair electrical systems and electronicequipment. Some must use testing equipment such as oscilloscopes, voltmeters andsignal generators to determine what components are in need of repair or replicement.Additional responsibilities may include maintaining an inventory of parts used tomake repairs and keeping records on the components that have been repaired. Most
324

Occupational Requirements: An Overview 263
electrical and electronic technicians are employed by the broadcast industry, man-ufacturers of micro-electronic equipment, and computer companies.
Qualifications
Employers prefer applicants with some post-high school or post-GED programbackground in electrical engineering or electronics. Technicians must be able to readelectrical diagrams and perform repairs using sophisticated tools. Many companieshave formal programs that supplement the employee's knowledge of electrical sys-tems and components with more advanced training. Technicians must also be awareof building codes to determine whether the installation of electrical equipment maybe a potential hazard.
Salary
Not available.
Some Information Sources
See Computer Operators; Electrical Engineers;and Data Processing Machine Mechanics.
Industrial Engineers
Job Description
Industrial engineers are concerned primarily with the relationship between humansand machines involved in the production process. They plan, design, analyze, im-prove and install systems that coordinate employees, materials, and equipment tomanufacture goods and deliver services. They also design, maintain, and supervisequality control systems, plan finances, and analyze production costs. Computers areoften used in this profession. According to the Bureau of Labor Statistics, more thantwo-thirds of industrial engineers work in the manufacturing industries.
Qualifications
Industrial engineers apply their knowledge and skills in math, science and en-gineering to specify, predict and evaluate the results from production. A bachelor'sdegree is the minimum requirement for most entry-level positions. Advanced degreesare considered to be more essential for college level teaching positions than for ca-reers in private industry. Engineering majors are to take courses in the social sciences,economics, accounting, and management, in addition to the core engineeringcourses such as calculus, chemistry, physics, thermodynamics and fluid mechanics.Advanced training beyond college in this and other engineering fields may be spon-sored by the employer in a range of programs which may include apprenticeships and
305
264 Project 2000
formal classroom instruction. Licensing requirements .ire similar to those for electrical
and electronic engineers.
Salary
See Electrical Engineers.Federal government industrial engineers (series 896) earned on average $33,700, as
of March 31,1983.
Some Information Sources
See Electrical and Electronic Engineers.
Mechanical Engineers
Job Description
Mechanical engineers perform similar duties to electrical and electronic engineers,
but focus on the assembly, steam-power generating, and other types of machines uti-
lized in a plant or office building. Their responsibilities include designing and super-
vising the construction of the mechanical components of production lines and electri-
cal-power plants. Some use computers in theirdrafting of mechanical components.
Qualifications
Employers specify the successful completion of a college program in mechanical
engineering as the minimum qualification for applicants. Those applicants who have
had some experience in the field before their graduation are at a definite advantage.
Students can gain such experience through cooperative education and internship pro-
grams sponsored by some colleges. Licensing requirements are the same as for other
types of enginee, ,. Preference is given to those with computer skills.
Salary
See Electrical and Electronic Engineers.
Some Information Sources
See Electrical and Electronic Engineers.
Peripheral EDP Equipment Operators
lob Description
Persons in this occupation operate peripheral computer equipment such as card -:o-

Occupational Requirements: A,10verview 265
tape and tape-to-card converters, high speed printers, and data display units whichoperate off -line from (meaning independent from) the central computer equipment.Operators prepare, monitor and control the equipment's functioos using a consoleand machine controls. Additional responsibilities include maintaining supplies andrecording the computer's tasks.
Qualifications
Most employees receive on-the-job training. Employers prefer applicants withskills in computer programming or some knowledge of the basic functions of com-puters. A high school diploma or GED is considered an essential qualification. Forthose firms whose computers operate around-the-clock, employers seek operatorswho can adjust to flexible schedule which includes evenings and weekends.
Salary
CPS statistics were not available.BLS average weekly gros_ earnings in September 1983 for nonsupervisory workers:$355.12.
Some Information Sources
See Computer Operators and Computer Programmers.
307

The crisis in American public education has recently provided a focal point for dis-cussion among educators, business leaders, policy makers, and human resource de-velopment personnel. A widely publicized connection has been drawn between thetraining that young people receive in elementary and secondary school, and their fu-ture employability. Business, industry and government have been concerned aboutthe quality of education future employees are receiving because the standards set forthe civilian labor force will be reflected in the quality of American products and life.Education, economic growth, marketplace competition, and national security havebecome irrevocably linked to one another, and together provide a rallying issue forall sectors of the country.
The future of equal employment opportunity is dependent upon the ability ofeducators, business leaders and policy makers to assess the employment needs of thechanging job market, and design curricula which provide all students with the basicskills needed to meet these demands. In addition to educating the nation's young foremployment in the next decade, greater attention must be given to developing educa-tional and training programs which enable present employees to gain the new skillsnecessary to remain competitive in the changing work place. This will be an increas-ing need, since the aging of the baby boom generation will cause a population shiftwhich will greatly affect the composition of the civilian labor force; the number ofpersons between the ages of 25 and 44 will increase, while the number between 16and 24 will decrease. The result: the bulk of the work force will be trained for andsituated in jobs that will become obsolete or require the acquisition of additionalskills.
The Direction of Public Education
Reports on education', prepared in the last two years, have advocated the philoso-phy that public education in a democracy should provide students with more thanjust a means to earn a livelihood. They contend that public education should, first,
308 BEST COPY MAILABLE

268 Project 2000
provide students with an adequate preparation in English, mathematics, science and
languages. Second, it should aim to help students develop an attitude toward learning
that will enable and ercourage them to seek further training and education to upgrade
skills as job demands change and personal interests become more focused.The first step toward developing this attitude is to ensure that students become com-
petent in basic academic skills. While most recent concern about academic compe-tency has focused on training in mathematics, science, foreign languages and com-
puter literacy, there is a growing awareness of deficiencies in basic skills such as read-
ing and writing. Although the 1982 Scholastic Aptitude Test (SAT) scores for admis-
sion to college showed a slight reversal of a 19-year decline, the 1983 average roseonly one point in mathematics and declined one point in verbal skills.
According to a recent report by the Center for Public Resources (CPR) entitled Basic
Skills in the U.S. Work Force, educators and business leaders hold differing viewsabout students' adequacy of preparation to enter the work force. The survey revealed
that they frequently disagree about the nature and level of basic deficiencies amonghigh school graduates. Business leaders believe that secondary school graduates are
not "adequately prepared," even in basic skills such as reading, writing, speaking/lis-tening, reasoning, and simple computation. They also identify entry-level employees
as having especially low mathematical and scientific skill levels. Many school offi-cials, in contrast, find high school graduates to be adequately prepared in these areas.
In addition to indications that the basic competency level of students is inadequate,
there is a problem attracting and retaining enough qualified teachers in subjects such
as mathematics and science; areas in which the future economy will require moretrained personnel. There is also the perception that there should be greater and more
efficient use of technology in the classroom. At the collegiate level, engineeringschools are also finding it difficult to recruit and retain high-level scientific faculty to
train students.
Business and Industry Initiatives
Business and industry are concerned about the impact academic deficiencies amonghigh school graduates will have on employability, and the ability to retain and promotewithin the corporate structure! They have both become interested in ways to developjob-related skills such as an understanding of work values, and a proper work attitudeamong young employees. There is also a desire to find ways to ease the transition fromschool to work, and to place young trainees into unsubsidized and meaningful jobswithin the private sector. According to an estimate from the American Society for Train-ing and Development, employers spend at least $30-40 billion per year on educationand training programs for their employees. This is nearly half of the $80 billion usually
spent on programs at traditional institutions of higher education.
3}'9

Educating for the Future: An Overview 269
Public Education' Initiatives
Education officials are also doing something about the state of education and training in this country. According to a 1980 state-by-state survey of high school gradua-tion requirements conducted by the National Commission on Excellence, only eightstates required schools to offer foreign language instruction ai:d none required stu-dents to take the courses. Thirty-five states required just one year of mathematics, andthirty-six required just one year of science for high school graduation.
Since that survey, however, the National Science Board has contacted the fifty statesfor its 1983 report. Educating Americans for the 21st Century. This report found thatmore than half the states had either taken initiatives to raise high school graduation re-quirements in mathematics and/or science, or were awaiting increases pending legisla-tive approval. It also found that almost all the states were in the process of increasingtheir employment of science and mathematics teachers. Many states had, in addition,established or were establishing commissions and state-supported technology researchcenters to directly address the connections between education--especially universityresearch and developmentnew products for marketing, and the establishment of newindustries to employ state residents and generate economic growth.
Public Sector Initiatives
Training and educating for empiuy.nent is a national priority, and private setter in-volvement is especially encouraged. As employers are making their skills require-ments oetter known to human resource development personnel, needs assessmentsof communities, industries, regions, and states are being conducted all over the coun-try to target and match skilled persons with jobs. All sectors are joining forces in theeffort to prepare a work force qualified for the future job market.
This type of joint involvement is authorized by Title VII of the Comprehensive Em-ployment and Training Act (CETA) under its Private Sector Initiative Program. The Pri-vate Industry Council (PIC), which was started under CETA to provide training andjobs, is composed of representatives from industry, business, organized labor, grass-roots organizations, and educational institutions working with CETA prime sponsors.CETA was replaced in the Fall of 1983 by the Job Training Partnership Act. This newprogram not only emphasizes private sector involvement, but shifts responsibility forestablishing local job training agencies from the U.S. Department of Labor to the stategovernors. The PICs share policy and oversight responsibility for community pro-grams with locally elected officials.
The Programs
The rest of this chapter includes a comprehensive list of current job training and educa-tion programs which were established to provide instruction in occupational areas with
a future, and to assist state and regional economic development through the cultivationof growth and high technology industries. Project 2000 found the most successful educa-tion and training for employment programs to have had the followingqualities:
3 I

270 Project 2000
,/ They have been of short duration.,/ The private sector employers have been involved in all stages of program develop-
ment, including curriculum design, selection of instructors and participants, and
when possible, job placement after program completion.,/ Program participants have been carefully screened and the enrollment process has
included skills and aptitude testing to assure successful participation in training.,/ A needs assessment has been done to evaluate the skill level of current jobs, and
the availability of positions requiring the proposed training.,/ The availability of sufficiently qualified program providers to implement the curri
culum has been assessed.,/ The training sites have been accessibl:Ito trainees; either they were in the trainees'
neighborhoods or near public transportation.
The chapter is divided into the following six sections:1. High Growth Programs2. High Tech Programs3. State and Regional Programs for Ecunomic Development and Training4. Programs for Minorities, Women, Youth and Older Workers
5. Secondary and Post-Secondary School Programs6. Other Programs of Interest
The programs are targeted at specific constituencies:
,/ economically disadvantaged and minority youths,/ pregnant teenagers,/ teenage parents who need child support and other social service assistance to con-
tinue their education and/or earn a livelihood,/ first-generation immigrants,/ women who are entering or re-entering the workforce, or who are seeking training
in nontraditional career areas,/ programs for talented youth, especially minorities, in pre-collegiate institutions to
develop skills in business, mathematics, science, engineering, computers andother technical areas aimed at increasingtheir future options
,/ displaced industrial workers needing to upgrade their skills to work with changingproduction technology or be retrained for other occupations
Project 2000 obtained information about the following programs from organiza-tions' annual reports, and responses to specific questions asked. The initiatives in-cluded in this chapter represent only a few of the programs available. Most are specif-ically geared to the community or constituency being served, and are the result of aformal or informal needs-assessment involving: skills required by employers; theskills applicants and employees currently possess; the need and means for upgrading
31i

Educating for the Future: An Overview 271
skills and/or retre.ining; the projected employment picture for a specific locality.The following list of brief program descriptions is provided as an overview of the
type of training and education available. A listing of foundations, gran,lakers andassociations concerned with training- and education-for-employment programs andfunding is included in the appendices of this volume.
Training and Education for Employment:Selected Types of Programs
Adopt-a-School ProgramThis is a new form of outreach assistance which developsties among businesses, civic or religious organizations, government agencies, andschools. A firm will typically offer curriculum and program recommendations, loansand donations of equipment, and personnel for tutoring. Representatives from thebusiness community may also participate on school advisory committees.Adult Basic EducationThese educational programs are offered to adults who havenot finished secondary school. Courses include preparation for the General EducationDiploma (GED), and remedial education in mathematics, reading and writing.Career EducationThese initiatives at elementary and secondary schools are de-signed to emphasize work values and the career relevance of academic learning.Some model programs linking schools and work are: Experience Based Career Educa-tion (EBCE) and Community Based Career Education (CBCE), which are programs forstudents who desire an alternative learning experience to full-time classroom work(generally for other than economic reasons); and Career Intern Programs (CIP) whichare targeted at the dropout or potential dropout. CIP emphasizes counseling and ca-reer planning.Community Based Organizations (CBO) CBOs are generally located in low-in-come neighborhoods. They are private, nonprofit organizations frequently adminis-tered by minority groups and women, and are targeted at communities with high un-employment.
Community Development CorporationsCDCs are nonprofit organizations whichpromote economic and community development in low-income neighborhoods.Contracting for On-the-Job Instruction - -This form of cooperative education in-vo:ves an educational institution paying a local business to provide on-the-job train-ing for its students (see entry for Cooperative Education).Contract TrainingBusinesses contract with community-based training organiza-tions and community colleges to provide their employees with basic skills, skills-up-grading and technical training.Cooperative EducationThese school-sponsored and supervised programs combinein -school and on-the-job learning experiences (see In-School Work Experience). Stu-dents are required to take academic courses that are related to their vocational pro-gram, and receive release-time for on-the-job experience and training.
31.2

272 Project 2000
Corporate Outreach ProgramsThese corporate programs for local communities in-clude internships, Summer jobs, the lending of corporate personnel to community or-
ganizations for instructional and training purposes, and loans and/or donations of of-
fice and high technology equipment.Education-Work Experience (Also School-Work Transition Programs)These are in-school youth employment training programs which are owned and financed by the
private sector (see In-School Work Experience).Information Clearinghouse/Job Resource CentersResource centers provide specif-
ic information on employment training and job opportunities aswell as general library
resources on jobs and careers.In-School Work ExperienceThese programs encourage at risk students, who might
otherwise drop out, to remain in school and graduate by providing them with part-
time minimum wage jobs during the school year.Job Creation ProgramsJobs are created to provide clients with short-term employ-
ment in order to improve their long-termemployability opportunities.Neighborhood Based Organization (NBO) These are organizations located primar-
ily in low-income neighborhoods.Out-of-School Work ExperienceThis type of work experience program provides
youth over 16 years of age with out-of-school employment training and opportunities
aimed at increasing their potential for long-term employment..Pre-Employment ServicesPre-employment programs are designed to develop par-
ticipant's job readiness, their attitudes toward work, and provide educational training
and job placement assistance.Recurrent EducationRecurrent education alternates periods of education and train-
ing with work, in order to meet personal and employment related needs and interests
throughout an individual's life. These programs include apprenticeships, extension
and correspondence courses, on-the-job training, and study at colleges and technical
schools.Retraining ProgramsThese programs provide workers in distressed industries with
new skills needed for jobs in expanding areas of employment.Technical Assistance ProgramsThese initiatives provide assistance in planning, co-
ordinating, implementing, and evaluating training foremployment programs. Techni-
cal assistance often includes training for community organizers, workshops and
courses in fund-raising, and leadership development tailored to an organization's
specific needs.Vocational EducationThis segment of public education is responsible for preparing
young students with job skills that they can use when entering the work force after
graduation.Vocational Skills TrainingClassroom, on-the-job and apprenticeship training inspecific occupational or vocational areas is provided for youths and adults.
31.3
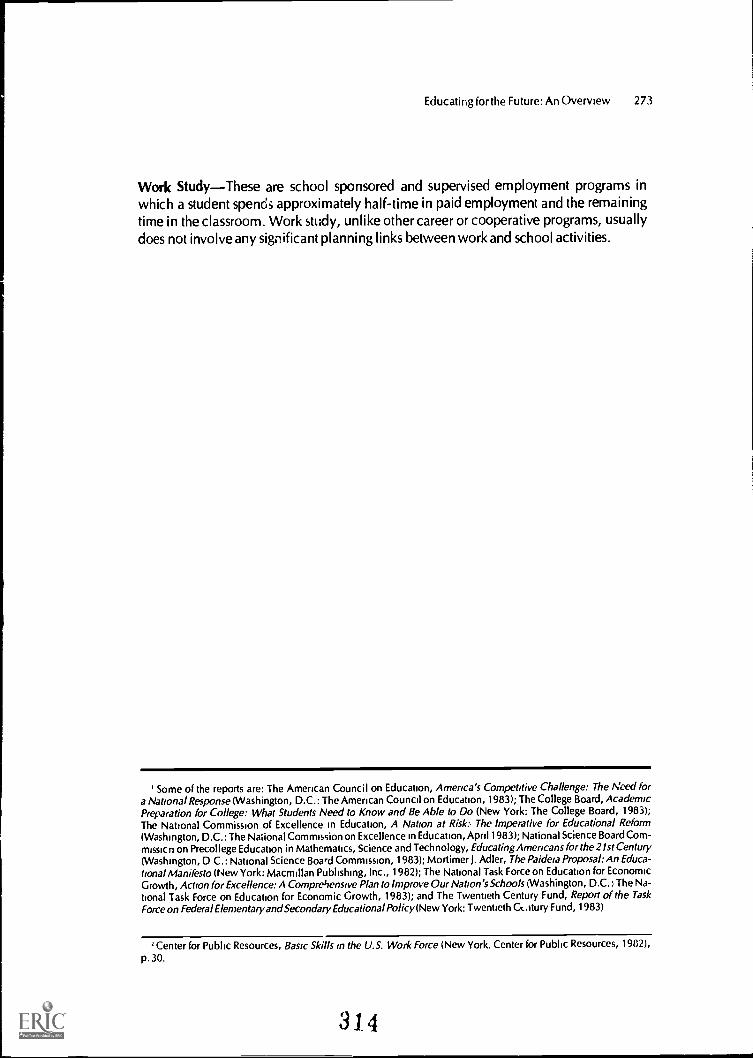
Educating for the Future: An Overview 273
Work StudyThese are school sponsored and supervised employment programs inwhich a student spends approximately half-time in paid employment and the remainingtime in the classroom. Work study, unlike other career or cooperative programs, usuallydoes not involve any significant planning links between work and school activities.
' Some of the reports are: The American Council on Education, America's Competitive Challenge: The Need fora National Response (Washington, D.C.: The American Council on Education, 1983); The College Board, AcademicPreparation for College: What Students Need to Know and Be Able to Do (New York: The College Board, 1983);The National Commission of Excellence in Education, A Nation at Risk:, The Imperative for Educational Reform(Washington, D.C.: The National Commission on Excellence in Education, April 1983); National Science Board Com-missicn on Precollege Education in Mathematics, Science and Technology, Educating Americans for the 21st Century(Washington, D C.: National Science Board Commission, 1983); Mortimer J. Adler, The Paideia Proposal: An Educa-tional Manifesto (New York: Macmillan Publishing, Inc., 1982); The National Task Force on Education for EconomicGrowth, Action for Excellence: A Comprehensive Plan to Improve Our Nation's Schools (Washington, D.C. :, The Na-tional Task Force on Education for Economic Growth, 1983); and The Twentieth Century Fund, Report of the TaskForce on Federal Elementary and Secondary Educational Policy (New York: Twentieth Ct..stury Fund, 1983)
' Center for Public Resources, Basic Skills in the U.S. Work Force (New York. Center for Public Resources, 1982),p. 30.
314

274 Project 2000
High Growth Programs
Action for Boston Community Development, Inc.Shawmut Bank of BostonAnd Bank of New EnglandBay State Skills Corporation101 Summer Street, Second FloorBoston, Massachusetts 02110
Shawmut Bank of Boston and the Bank of New England joined with Action for Bos-
ton Community Development (ABCD) in sponsoring a program to train 200 persons,inclueing economically disadvantaged and minority individuals, in clerical and basic
accounting skills. The program, which ran from February 1982 to May 1983, ad-
dressed the growing needs of Boston's insurance and financial institutions for qual-ified entry-level clerical and accounting position applicants. Graduates are to be
hired by the banks which sponsored the program and assisted in the screening and
selecting of trainees.Four training cycles, each 26 weeks in duration, were organized. New training cy-
cles were started every 13 weeks.
Culinary Arts Training ProgramOf The District Of Columbia Public SchoolsExecutive DirectorD.C. Private Industry Council1129 20th Street N.W.Washington, D.C. 20036
The Culinary Arts Training Program is jointly sponsored by the Washington, D.C.Private Industry Council (PIC), D.C. Public Schools and the D.C. metropolitan-areahotel and restaurant industry. The program accepts eligible adults, 18 years of age
and older, who have either a high school diploma or General Education Diploma and
meet income eligibility requirements. Funds come from PIC monies, private organiza-
tions and the public school system.The program trains adults to become cooks and chefs in local food establishments.
Training includes one week of job-shadowing at a commercial kitchen, 12 weeks of
basic and advanced culinary skills training provided by Hyde Park's (New York)
famed Culinary Institute of America, two weeks of motivational training, and 10weeks of on-the-job training experience which is provided by 16 local food establish-
ments. Graduates are expected to be retained as permanent employees upon success-
ful completion of on-the-job training.At the first graduation in 1983, six of ten graduates were already employed, three
were awaiting interviews, and one was enrolled at the Culinary Institute of America
on a two-year scholarship.

Educating for the Future: An Overview 275
Elliott Training CenterMel Walter, Director2141 Hunter RoadGreensburg, Pennsylvania 15601
The Elliott Training Center was established by the Elliott Company, a division ofthe Power Sector Group of the United Technologies Corporation. This state-of-theart training facility, opened in 1973 with federal funds, was designed to fill the short-age of skilled welders and machinists within the company. The Elliott Company, withthe assistance cf the National Alliance of Business, received funding from the Job Op-portunities in the Business Sector (JOBS) program and CETA.
The initial group of trainees was selected from a pool of economically disadvan-taged applicants. CETA, PICs, the Veterans Administration and physical rehabilitationprograms initially paid for the trainees' tuition, however, some students now pay theirown fee. Some companies send their employees for two main courses: welding andmachining. These courses last 26 and 30 weeks, respectively, and include 220 hoursof classroom theory and equipment experience. The programs are particularly impor-tant in Pennsylvania which ranks fourth in the country in metal working industries.
Prospective trainees have regular employment interviews prior to entering the pro-gram and are tested for motivation, work attitudes, and educational ski I Is. The trainingfacility is an industrial miniplant where trainees work eight-hour shifts, and use full -size equipment and up-to-date technology. The facility is designed to expose traineesto a disciplined work environment; training is provided by full-time El lion Companyforemen.
More than 1,500 men and women have graduated from the program, and graduatesare in high demand for jobs in Pennsylvania and throughout the country.
The Elliott Training Center is also used as a teaching resource center by local highschools and colleges, and operates training programs for other companies wantingto train new employees or upgrade employee skills.
The Private Industry Council Of New York CityDirector19 Rector StreetNew York, New York 10006
The Private Industry Council (PIC) of New York City was initiated in 1979 by a groupof business executives and city officials. It has served approximately 10,000 traineesfrom 1979 through June 1982, using a combination of public, corporate and founda-tion funds. In 1982 alone, the PIC served 4,000 trainees and was composed of morethan 65 different classroom training contracts and 50 individually tailored, on-the-jobtraining programs.
The following three programs are part of the New York City PIC. =urther informationcan be obtained by writing to the individual program directors at the above address.
316

276 Project 2000
The Private Industry Council of New York CityAmerican Stock Exchange Program
The New York City PIC and the American Stock Exchange (AMEX) jointly sponsor
a program to train participants as data clerks for the American Stock Exchange trading
floor.The first class of 10 trainees was selected by the PIC and hired by the American
Stock Exchange for a five week training program. Eight of the ten individuals who wentthrough the training program remained as entry-level clerks after its completion. Aprivate consultant teaches trainees about investing and how to read the stock pages
as oat of the program.Amex's successful program has prompted the creation of several new training pro-
grams at the New York Institute of Finance under the auspices of the PIC.
The Private Industry Council of New York CityNew York Telephone Company Customer Service Training Program
This New York City PIC program, which began in 1982 to assist the New York Tele-phone Company, recruits employees for customer service positions.
The PIC, with the help of the telephone company and New York City TechnicalCollege screened and trained candidates to take and pass the company's entry testwhich, at the time, had a 20 percent pass rate. During the PIC program's first trainingcycle, the pass rate for its trainees was 73 percent; during the second cycle, it was100 percent. The training program lasts six weeks and includes four weeks of test prep-
aration and two weeks of job-effectiveness training.The New York Telephone Company is using the PIC as a major recruitment source.
A third training cycle began in May of 1983.
The Private Industry Council of New York CitySecurities Operations Clerk Training Program
This four-week securities operations clerk training program, targeted at economi-cally disadvantaged youth, provides intensive classroom instruction on the securitiesindustry. The program includes course work on the structure of the financial workplace, principal investment instruments, introduction to pricing and assessing invest-ments, and job effectiveness skills development. The training is provided by the New
York Institute of Finance.Trainees who successfully complete the program qualify for entry positions in the
operations departments of brokerage firms where securities are received, delivered
and transferred.The program is funded by the Federal government, corporations and foundations.
3 1 7

iEducating for the Future: An Overview 277
United Planning OrganizationBank Teller Training ProgramMr. Ernest WardExecutive Director1021 14th Street, N.W.Washington, D.C. 20005
The United Planning Organization in Washington, D.C., in cooperation with localbanking institution: has designed a program which trains the un-and underemployedbetween the ages of 18 and 24 to qualify for entry-level employment as bank tellers.The curriculum was developed with input from the banking community, and the in-structor was appointed after being recommended by participating institutions.
Training cycles are 12 weeks long and include on-the-job experience. The class-room instruction consists of general skills and remedial courses, as well as specificskills development for employment in a financial institution. There is a job referraland placement component, and participating banking institutions expect to hire pro-gram graduates when they have position openings.
Training equipment has been supplied by a local bank. The program was fundedby CETA through the D.C. Department of Employment Services, however, presentfunding expired in the Fall of 1983.
University of Lowell/Wang LaboratoriesJ.D. MacDonald and CompanyArmand Donati Company International, Inc.Bay State Skills Corporation101 Summer Street, Second FloorBoston, Massathusetts 02110
Wang, J.D. MacDonald, and ADO (Armand Donati Company International, Inc.),and the University of Lowell joined efforts in 1982 to train 20 individuals as foreigntrade documentation specialists. The program ran from November 1982 to June 1983,and trainees were instructed in basic and advanced clerical skills, and elements ofthe foreign trade field. It was designed to upgrade the skills of individuals with clericalbackgrounds, and to supply several Eastern Massachusetts exporting firms in the pro-cess of expanding their trade abroad with personnel trained in export documentation,foreign trade and business office skills.
Program trainees learned general business practices and specialized procedures forexport trade documentation. The academic portion was held at the University of Low-ell School of Management and internships were conducted at Wang Laboratories andseveral freight forwarding companies involved in international trade. The School ofManagement supplied most of the faculty; industry consultants provided instructionin the more specialized areas of export trade documentation.
318

278 Project 2000
Progressive Word Processing Training ProgramExecutive DirectorWashington, D.C. Private Industry Council1129 20th Street, N.W.Washington, D.C. 20036
The Word Processing Training Program is a new venture sponsored by theWashington, D.C. PIC and the Progressive Word Processing Training Center, a profit-making, privately-owned facility. The six month program trains participants to work
as transcribers, word processors, secretaries, and records clerks in medical offices.It includes hands-on experience and classroom instruction in word processing, medi-cal terminology, transcription and applied anatomy. There is also an on-the-job train-
ing component. The center attempts to place its program graduates.
Washington, D.C. Private Industry CouncilNurse's Aide ProgramExecutive Director1129 20th Street, N.W.Washington, D.C. 20036
The Nurse's Aide Program is a new cooperative effort between the Washington,D.C. PIC, the National Centers for Long Term Care and the Marshall Heights Commu-
nity Development Organization, Inc.The six week intensive program consists of three weeks of classroom theory and three
weeks of clinical pract'ce at several local health facilities. The 90 trainees who success-fully complete the curre program will be placed in jobs at a near-finished neighbor-hood healti. care center. lie new facility will need local residents to fill 150-200 posi-tions as ccuks, dieticians, janitors, administrative employees and nurse's aides.
This program is an example of training coinciding with a community development
project that will provide jobs for local residents.
Washington (D.C.) Urban LeagueWord Processing Training CenterAlonzo Evans1375 Missouri Avenue, N.W.Washington, D.C. 20011
The Word Processing Training Center is a program offered by the Washington(D.C.) Ur. in League in cooperation with the IBM Corporation to train low-income,minimally skilled persons i. word processing. In 1982, 62 of the 87 enrollees had
graduated, and 39 had been , faced in jobs. The program is funded by the Private In-
dustry Council of Washington, D.C. The IBM Corporation provides an instructor, a
skills training manager, and equipment-on-loan. In 1983, the curriculum was ex-panded to include secretarial training, and the entire program was shortened from 22
31.

Educating for the Future. An Overview 279
to 6 weeks. The curriculum includes instruction in word processing, office-relatedskills, business English, personal development and employment preparation.
High Tech Programs
Chinese American Civic Association/Honeywell CorporationBay State Skills Corporation101 Summer Street, 2nd FloorBoston, Massachusetts WI I 10
Honeywell Office Automation Systems, Inc., in cooperation with the ChineseAmerican Civic Association (CACA), trained 30 Asian and Asian-American immig-rants in data entry and word processing operations from October 1982 to June 1983.The program evolved because traditional industries in Boston's Chinatown werebeing displaced by businesses requiring a technically-trained work force. Programparticipants were trained for entry-level data Processing positions.
The CACA conducted two four-month training cycles for participants having atleast a sixth-grade level of proficiency in the English language. Trainees studied En-glish and basic business correspondence three dais per week at CACA and acquiredtyping skills at the Action for Boston Community Development Center. They spentan additional two days at Honeywell Office Automation Systems where they were in-structed in document creation, editing, storage, page la} out, document formatting,list processing, system maintenance, and the electronic mail capabilities of word pro-cessors.
The Honeywell Corporation contributed funds and instructors, and bilingual volun-teers served as tutors and counselors for program trainees.
The program is scheduled to run again.
RETC Microelectronics Training Center7606 Miramar RoadSuite 7400San Diego, California 92126
The RETC Microelectronics Training Center is comprised of five companies thatmanufacture semi-conductors for computers, and trains income-eligible persons invarious aspects of semi-conductor manufacturing. The three and one-half week pro-gram includes instruction in wafer processing, die attaching and wire bonding. Thereare also 20 hours of world-of-work orientation.
Member companies projected a need in 1982 for 300 new entry-level employees.Each company made a commitment to hire at least 50 percent of its new employeesfor positions as silicon wafer fabricators from the training facility.
The Training Center's facility specifications and equipment requirements were developed by Burr-Brown Research Corporation, a Tucson, Arizona manufacturer of micro-electronic components and computer systems. The overall program was developed jointlyby Burr-Brown and the Center for Employment Training of San Diego County.
320

280 Project 2000
Since December 1982, the center has been funded by the San Diego PIC, the San
Diego Regional Employment and Training Consortium, and by public funds.
The San Diego County Technical Training Center, Inc.245 Bent StreetSan Marcos, California 92069
The San Diego County Technical Training Center, Inc. is a private, nonprofit,machine-tool operator/machinist training facility founded in 1980 and located in San
Marcos. It is sponsored by the Regional Employmentand Training Consortium (RETC);
a 13 company cooperative effort in San Diego county.
Participating companies contribute 15 percent of the center's operating costs, and
donate or lend state-of-the-art equipment. Public funds pay for the leasing of the
building, trainee stipends and counseling services.The 12-to-16-week program offers courses in mathematics, English, blueprint
reading, and training in the use of measuring instruments. After successfully complet-
ing this phase of training, participants work in an industrial shop with more than 60
different machines worth approximately $1 million.Program graduates enter the work force as entry-level machine-tool operators and
move up to become tool and cutter grinders, jig and fixtures builders, and assemblers.
Technical Exchange CenterDirector13162 Newhope StreetGarden Grove, California 92643
The Technical Exchange Center (TEC) is a collaborative program between educa-
tion and industry in Orange County which has a density of High Tech companies.The center functions as an information broker on a countywide basis between eight
community colleges, four regional occupational training programs, and technologi-
cally-oriented employers.TEC evolved as a result of the inability of companies with job openings to find
skilled technical workers (in some cases, engineers were performing tasks usually
done by skilled technicians). In early 1982, 250 corporate executives attended a sym-
posium on job skills shortages. A group of these executives eventually created the cen-
ter, which opened in October 1982. The primary purpose of the Technical Exchange
Center is to address the county's employment and training requirements.
Initial funding for TEC came from state and local governments, and private founda-
tions. A building was donated by a county community college. TEC will eventually
become a nonprofit corporation supported by membership and user fees.
The four main goals of TEC are:1. To serve as a clearinghouse for those in industry, education, government, and
labor who are seeking to establish training programs to meet the weds of advanc-
ing technology and business expansion.
321

Educating for the Future An Overview 281
2. To promote and coordinate training resources throughout the county for new in-dustries and existing industries in need of staff upgrading and retraining.
3. To disseminate information from center research studies to assist planners in mak-ing recommendations concerning the development, modification or deletion ofprograms as demands for skilled workers change. For example, the TEC staff willestablish a resource pool of expert industry representatives for consulting andclassroom instruction.
4. To coordinate the upgrading and retraining of groups of displaced workers forhigh-demand jobs.
The Board of Directorscomposed of representatives from business, education,government, human services agencies and labormeets regularly to define and setpolicy. The Board has already initiated a county-wide survey of corporate executivesto measure the need for skilled workers, and to identify those companies with im-mediate and long-term critical shortages of trained personnel. Staff members of thecenter will then develop training for those companies, and arrange for these speciallytailored programs by working with educators and plant supervisors. TEC will also as-sist county agencies in coordinating their services to ensure that programs are cost-ef-fective. The center will also monitor the programs to ensure that company needs arebeing met.
Women's Technical InstituteSharyn BahnExecutive DirectorBoylston StreetBoston, Massachusetts 02215
The Women's Technical Institute (WTI) is the country's first licensed and accreditednonprofit (industry-focused) school for women offering training in High Tech fields.The Institute actively recruits, trains and places women in high technology industries.New England is one of the country's major High Tech centers. According to the presi-dent of Analog Devices, Inc. in Westwood, Massachusetts, the center "serves as a na-tional model for designing and implementing programs which meet employer's needsfor skilled technicians and women's needs for concentrated low-cost training."
Institute training programs are short-term (six months full-time or 18 months part-time) and job-focused. They prepare women for careers as skilled technicians in elec-tronics and drafting. Applicants must be at least 17 years of age. A high school dip-loma or GED is preferred but not required. Courses are now available to the publicon a tuition basis, and WTI continues to contract with public agencies wishing to pur-chase an entire class or a block of seats for low-income adults.
WTI began in 1975 as a small, loyal, nonprofit organization dependent on CETAfunds. Many early trainees were publicly funded. Prior to CETA's replacement by theJob Training Partnership Act, the institute began implementing a plan to broaden itsfunding base. A new WTI facility, paid for by money raised through a capital cam-paign in 1981, has been licensed by the state and earned national accreditation asa private trade school. Tuition paying students are also supplying a greater portionof the school's annual income.
322

282 Project 2000
WTI has trained over 350 women with public funds, foundation monies and corpo-rate grants. Two hundred teenage students have participated in summeroccupationalexploration programs, and more than 12,000 under- and unemployed women haveutilized the Institute's comprehensive career information resources. The Instituteplaces 85 percent of its students.
In 1982, an Industrial Advisory Board was established with the assistance of How-ard Foley, president of the Massachusetts High Technology Council (see later entryin this chapter for the Massachusetts High Technology Council) to advise the Instituteon industrial trends, developments and labor needs. The Board also provides on-going guidance for developing and updating the curriculum.
State and Regional Programs forEconomic Development and Employment Training
Arizona Industry Training Service UnitRobert V. Conter, Ph.D.Director of Special ProjectsContinuing EducationThe University of ArizonaTucson, Arizona 85719
In November 1982, the Division of Vocational Education within the Arizona De-partment of Education initiated the Industry Training Services Unit (ITSU). ITSU wasdesigned to coordinate the training resources of the state and meet the existing andemerging needs of Arizona and those employers considering locating to the state. Itis a training consortium composed of representatives from business, labor, education,industry and the military who attempt to meet valid predetermined employer needs.
ITSU does the following:
,/ Establishes a channel of communication among all agencies involved in trainingand employment.
,/ Coordinates the statewide activities of its membership.i Develops specialized curricula and customizes short-term training pro? a ms as re-
quired or requested.,/ Documents the planning and implementation of its activities.
During the first year of its operation, ITSU accomplished the following:
,/ Employed four regional ITSU representatives to initiate contacts, develop trainingprograms, and act as liasons between training institutions.
,/ Sponsored a High Tech presentation for public and private sector agencies invol-ved in the recruitment and development of High Tech industries in Arizona.
,/ Initiated the development of a "Productivity Enhancement" program to researchand review existing resources and materials related to the state's productivity.
32

Educating for the Future: An Overview 283
,/ Funded seven projects for training programs and the expansion of businesses. Onehundred and forty-one individuals received training during this period. Ninety-sixwere placed in jobs at the end of training and others were placed thereafter.
Bay State Skills Corporation101 Summer StreetSecond FloorBoston, Massachusetts 02110
The Bay State Skills Corporation (BSSC) is a quasi-public corporation created in July1981 with an initial state grant of $3 mil!ion. The corporation is primarily a fundingorganization whose purpose is to unite industry and education in the training and re-training of the work force. BSSC programs range from entry-level skills developmentto advanced skills training, and from upgrading current employees to retraining ex-perienced workers.
The corporation awards grants to those educational institutions that cooperate withprivate companies to train people for jobs in High Growth and High Tech fields inMassachusetts. Training institutions arrange matching funds to augment their BSSCgrants. BSSC funds training programs in a variety of occupational areas includingmachine operations, precision machining, nuclear medicine technology, respiratorytherapy, word processing, microwave engineering, electronics and robotics. Trainingsites include community and four-year colleges, vocational schools, government-funded skills centers, universities, and community-based organizations.
BSSC is governed by a Board of Directors and chaired by the State Secretary ofEconomic Affairs. The Board is composed of representatives from business and indus-try, skills training organizations, government, education, and labor.
The corporation's mandate includes:
,/ Encouraging and facilitating the development of cooperative relations betweenbusiness and industry, labor, government, and education for the establishment andexpansion of skills training programs consistent with real employment needs.
,/ Providing grants-in-aid to educational/training institutions to be matched with pri-vate sector financial support for the funding of skills programs in growth areas.
/ Collecting and disseminating information on present and future employmentneeds, and assessing the availability of appropriate educational programs.
,/ Conducting conferences and research studies to increase communication and in-formation on the state's employment needs.In the past 18 months, BSSC has awarded over $6 million in grants-in-aid for 76
programs which trained over 5,000 persons. It worked with more than 75 educationand training institutions, and 300 businesses. In addition, it added several new train-ing areas including the Displaced Homemakers Program and programs for displacedworkers.
BSSC has added a Career and Learning line to its services for Massachusetts resi-dents with a telephone hotline referral information on specific education, training,and counseling programs throughout the state.
Its current two-year operating budget is approximately $8 million.
32,1

284 Project 2000
Broward County School System/Industry Cooperative Planning and Programming1320 Southwest Fourth StreetFt. Lauderdale, Florida 33312
The Broward County System of Florida is located in an industi .al area similar to"Silicon Valley" in California and "Route 128" in Massachusetts. In order to attractadditional High Tech firms to the area with the promise of skilled workers, the school
system has initiated a program to prepare individuals for positions in companies al-
ready in the area and those which would be relocating in the county.Broward County educators, using labor market data, developed a five-year pro-
gram to improve training in basic and advanced technological areas. The school sys-
tem developed a curriculum, identified equipment needs, and de fined new training
facilities.As a result of workshops and research, the school system's courses in electronics,
drafting, power mechanics, industrial materials and processes, at'id graphics were up-dated. A new vocational center, which is expected to be operational within the next
two years, will offer training in robotics technology, computer repair technology, in-strumentation, laser optics, and hybrid micro-electronics.
There will be 10 secondary school electronics technician programs given duringthe 1983-1984 academic yeardouble the number the previous year. In addition,
new programs in data processing for the microcomputer will be added to the curricula
of 22 high schools and two area vocational-technical centers. Equipment is also on
order for three schools to begin CAD/CAM (computer-assisted drafting and computer-assisted manufacturing) courses.
The 1982-1983 financing for the training facility's renovations and equipment pur-chases was acquired from a local, two-mil discretionary, ad valorem tax. Thirteenmillion dollars was earmarked for the first phase of the county's thirdvocational-tech-nical center and $11 million for renovations and equipment for 22 high schools. The
same level of financing is expected for the 1983-1984 school year.Through state and co.inty-level "Industry Services Training" programs, vocational
education teachers have been exposed to operations and programming techniques
of the new Computerized Numerical Control (CNC) milling machine. In another in-
service teacher training program, electronics instructors participated in a six-week
summer workshop at Rocal Miligro (manufacturersof electronic modems). This work-shop included two weeks of classroom instruction and four weeks of hands-on workexperience on the plant floor as technician "trouble shooters". Other companies of-
fered one-day workshops to demonstrate new technological equipmant and proces-
ses used in their plants. These in-service programs enable vocational and technicaleducation instructors to upgrade their skills.
325

Educating for the Future: An Overview 285
California Worksite Education and Training Act800 Capitol MallSacramento, California 95814
The 1979 California Worksite Education and Training Act (CWETA) is a state legisla-tive initiative to train people for skilled jobs that businesses have found difficult to fill.Since the program's beginning, training has been authorized for over 12,000 individu-als in electronic, computers, nursing, machine trades, and energy conservation.
A CWETA Center for High Technology was established at Los Angeles CommunityCollege in order to utilize the resources of the state's largest community college districtand provide training for electronic technician positions (in cooperation with the Com-munication Workers of America) with the Pacific Telephone Company. Training incomputer-assisted drafting and cable television technology will also be providedwithin the district to employees of Fairchild Control Systems. CWETA has also estab-1 ished the largest program for machinists in the Los Angeles area.
CWETA programs locate jobs before training starts, and then give the trainees class-room instruction and practical, on-the-job training. More than 2,500 employers wereinvolved in training programs as of 1982, and program graduates had a 90 percentplacement rate.
Trainees include those who are unemployed, in low-skilled jobs, or in entry-levelpositions with little or no advancement potential. Training is provided primarily byemployers and in classroom instruction at local community colleges and adultschools. Individuals usually attend classes on their own time after work.
During 1981-1982, employers agreed to contribute $2 million in cash and state-of-the-art equipment toward CWETA training. Business, workers, schools, and the Stateof California share the program costs.
Minnesota WellspringDonna J. KnightExecutive Director101 Capital Square Building550 CedarSt. Paul, Minnesota 55101
Minnesota Wellspring, founded in 1981, is a voluntary, collaborative, nonprofitcorporation of 27 labor, business, education, and government leaders who are con-cerned about expanding their state's technological leadership role and increasing jobopportunities in science and technical fields. The co-chairmen of the organizationcome from labor and business and the incumbent Governor serves as honorary chair-man.
Minnesota Wellspring sees as its particular challenge the developing of a "consen-sus-forming framework through which labor, business, education, and govern-mentwithout losing their separate identitiescan undertake initiatives tostrengthen the economy and thereby benefit the whole." It atempts to bring togetherleaders from various segments of society whose economic and political philosophies
326

286 Project 2000
have often been at odds. The founders saw the need and potential for developing newstyles of collaborative leadership within the growing recognition of an interdepen-dence between the economy, science, education, and information technologies.
Areas identified for action by the organization are:
,/ Technology and job creationCapital formation, investment and the use of tech-nological innovations to create new companies.
,/ Technology transferDeveloping linkages between technological research andinnovation specifically coming out of the University of Minnesota and the mar-ketplace.
,/ Technology and the workplaceTo achieve a better fit between supply of workersand the need of employers for trained technical employees.
,/ Technology and educationDeveloping increased educational responsiveness tothe skill and knowledge demands of the job market, and stimulating the use of tech-nological resources to develop human resources.
,/ Technology and public understandingAssisting the public in understanding thechanges and challenges that advanced technology can bring to their lives.
Funding is provided by both public and private sources.
Proposed Texas Work Skills Education and Training AdJohn E.S. LawrenceHuman Resources Development PsychologistResearch Triangle InstituteP.O. Box 12194Research Triangle Park, North Carolina 27709
The Texas Work Skills Education and Training Act was a legislative proposal in-itiated by the Texas legislature to coordinate statewide, postsecondary and sub-bac-calaureate education and training. The legislative effort evolved as a response to theproblems arising from swift population shifts within the state, and changing employ-ment requirements and employer needs, especially those of small companies. Labormarket information indicated that private sector skills needs in Texas required educa-tion and training below the baccalaureate level for 80 percent of the projected (to1995) job opportunities.
The model legislation developed by researchers at the Research Triangle Institutein North Carolina, involved searching for alternative methods of gathering labor mar-
ket information about the state by either starting from scratch, using existing Censusand EEO-1 data, or some combination of the aforementioned. During the drafting ofthe pioposed legislation, the private sector cooperated by identifying their occupational priorities, the level of job competencies required and the possible locations for
education and training delivery sites. The legislation was developed to be replicable
in other states.
3 2 7

Educating for the Future: An Ove view 287
Quick Start Programof the Georgia Department of EducationOffice of Vocational EducationRobert K. MabryDirectorPostsecondary Industrial ProgramsTwin Towers EastAtlanta, Georgia 30334
Quick Start customizes training for new and expanding companies and industrieswithin Georgia. Representatives of the Department of Education visit plant managers,analyze the job tasks for each occupation, develop training materials, and conducttraining for prospective and current employees selected by plant management. Localoffices of the state's Department of Labor assist in identifying potential trainees whoinclude employed individuals seeking to either upgrade their skills or qualify for newjob opportunities and advancement, and the unemployed.
The program has pre-employment and employed worker components. Pre-em-ployment training generally lasts from six to eight weeks. Trainees and sponsoringcompanies are free agents in terms of job offers and placement after training. Mostsuccessful trainees, however, do receive job offers.
Programs similar to Georgia's Quick Start began in the southern states during the1960s when the region was encouraging companies to relocate to the South as partof an effort to enhance regional economic development and growth. The concept be-hind the Quick Start program in Georgia, however, has since attracted national atten-tion and inspired the creation of programs outside the South.
Additional Programs atState And Regional Levels
Numerous states and groups of states have initiated task forces to study how to: (1)attract high technology industries to their respective state or region; (2) raise the levelof elementary and secondary school mathematics and science programs as well asgraduation requirements in those areas; and (3) create new products, markets andjobs. Some examples fol low:
L CenterforInnovativeTechnology
Dr. John SalleyInterim Director209 Ninth Street Office BuildingRichmond, Virginia 23219
The Virginia Task Force on Science and Technology has recommended the creationof a Center for Innovative Technology (CIT) to the governor. The state-sponsored re-search center will serve as a bridge between Virginia's leading research universities,traditional and High Tech industries, and new industry attracted to the state.
328

288 Project 2000
CIT will provide support to research in areas like robotics, biotechnology and com-puter science in conjunction with private industry. The research will be conductedby rotating teams of scientists from the state universities.
Recommendations on staff, the structure of the center and its location are expectedearly in 1984.
II. Council of Great Lakes Governors
Pamela G. WileyExecutive Director122 West Washington AvenueSuite 801AMadison, Wisconsin 53703
The governors of Illinois, Indiana, Michigan, Minnesota, Ohio and Wisconsin re-cently formed a consortium to lobby for more Federal money and programs in orderto ease unemployment, target job training and retraining programs, and bring moreeconomic aid and development to their region.
III. Industrial Technology Institute
Jerome Smith, Ph.D.Post Office Box 1485Ann Arbor, Michigan 48106
The Industrial Technology Institute (ITI) is an independent, Nonprofit institute whichfocuses on the development of modern manufacturing technology for use in the fac-tory of the future. Emphasis is expected to be placed on the development of "flexible"computerized production systems that can be adapted to produce a variety of goods,and on the creation of new companies that will make Michigan the center for modernmanufacturing.
Rather than try to compete with "Silicon Valley" or Route 128 in Massachusetts(major High Tech centers), Institute planners want Michigan to excel in the areas ofits demonstrated strengths, namely, manufacturing and automation.
ITI will eventually generate its own funding from industry contracts and research.In the meantime, Michigan has allocated $17.5 million for the first decade of ITI'soperation and progress has been made toward raising $100 million from severalMichigan foundations.
IV. Microelectronics And Computer Technology Corporation
9430 Research BoulevardBuildingOneSuite 200Austin, Texas 78759
This corporation is a consortium of 12 U.S. firms that will collectively spend upto $150 million per year on advanced computer research and development. The firstcorporate consortium of its kind, MCC is the idea of William Norris, Chairman of Con-
32

I
Educating foi the Future: An Overview 289
trol Data Corporation. MCC will concentrate on four research areas:1. Advanced computer architecture design of new hardware2. Software technology3. Computer-aided design and manufacturing for electronics4. Component packaging
V. The Molecular Biology Institute
Patrick Oriel, Ph.DInterim DirectorMichigan State UniversityEast Lansing, Michigan 48823
The Molecular Biology Institute is a nonprofit independent organization funded bypublic and private organizations to pursue High Tech research. Researchers will spe-cialize in agricultural and forestry technology. Presently research is concentrated onfinding a method of transforming wood into chemicals to manufacture plastics.
VI. Northeast-Midwest Congressional Coa!;tion
The United States CongressWashington, D.C. 20515
Almost 200 members of Congress from 18 midwestern and northeastern states par-ticipate in the Northeast-Midwest Congressional Coalition, a bipartisan organizationestablished in 1976. The coalition's objectives are to keep its membership informedof the regional implications of national proposals which may affect the future of mem-ber states and to encourage regional cooperation. In 1977, the coalition created anindependent, nonprofit research center (the Northeast-Midwest Institute) to providepolicymakers with research and analysis on pressing regional economic issues. TheInstitute is funded through grants from state governments, private foundations and do-nations.
Programs For Minorities, Women,Youth And Older Workers
Career Opportunities ProjectThe Atlanta Urban League, Inc75 Piedmont Avenue, N.E.Suite 310Atlanta, Georgia 30303
The Career Opportunities Project (COP) specifically targets minority women whoare single-parent heads of households. A comprehensive series of programs provideparticipants with employment opportunities through encouragement and assistancein gaining education, training, and skills development important for obtaining jobsin the private sector.
COP prefers female applicants who are unemployed or under-employed single par-
330

290 Project 2000
ents, but the project is not limited to any socioeconomic background.COP has four components:
,/ Continuing/Basic Education ModuleRemediation and tutoring services for par-ticipants needing employability skills development and assistance in obtaining theGED.
,/ Career Training ModuleTraining in traditional and non-traditional career areasthrough short- or long-term on-the-job programs.
,/ Direct Placement ModuleJob readiness activities and assistance in job searches.,/ Child-Care and Supportive ServicesReferrals to public and private day-care cen-
ters. Participants are also assisted in developing their own child-care support net-works. Other support services include: world-of-work seminars; vocational,group and individual counseling; and referrals to community services.
Downriver Community ConferenceEconomic Readjustment Activity-ERaFreda RutherfordEmployment Programs DirectorSouthgate, Michigan 48195
The Downriver Community Conference is a public, nonprofit consortium of 15communities in the Detroit area. Founded in 1979, it is an example of multi-commu-nity/government cooperation in the area of economic development.
The ERa program is involved in retraining displaced industrial workers and develop-ing job search skills. It provides on-the-job and classroom training, and a hotline ser-vice for family and financial problems. It also maintains a job resource center witha placement service network. Six similiar programs have been initiated in Buffalo(New York), the Lehigh Valley in Pennsylvania, Milwaukee (Wisconsin), Yakima(Washington), the Willamette Valley in Oregon, and Alameda (California).
The Downriver ERa program includes the following:
,/ Building job search skills.,/ Training and retraining, including classroom instruction at colleges and other edu-
cational institutions. A two-year associate degree sequence in electronics, con-densed into an intensive ten-month course, is an example of the type of programoffered. The Downriver Community Conference staff arranges on-the-job trainingor basic education programs for participants with poorbasic skil Is.
,/ Generating employment by assisting small businesses that operate below capacityto expand into new markets and seek out new contracts.
The consortium also established a displaced worker program in 1980 with a CETARetraining Grant.
331

Educating for the Future: An Overview 291
The Greater New York Council/Boy Scouts of AmericaCareer Training Program345 Hudson StreetNew York, New York 10014
During its five years of operation, the Career Training Program has assisted econom-ically disadvantaged youth and high school dropouts in receiving training and place-ment for entry-level clerical positions within the expanding financial service industryin New York City. The program is open to men and women 17 to 21 years old.
High school graduates choose between a 12-week in-house program for trainingas financial services clerks, and a 20 -week data entry/word processing operationsprogram at a participating business school.
High school dropouts may enroll in a 25-week-long receptionist/typist program atan accredited business school where they can also qualify for high school equivalencydiplomas upon completion of 24 credit hours in the program. Course work includestyping, machine transacions, data processing, business communications, record-keeping, business math, filing and office practices.
All career program students enroll in personal development seminars and world -of-work sessions for exposure to the realities of the business environment. The coursesinclude interviewing techniques, completing job applications, budgeting, and inter-personal relations.
To qualify for any of these programs, students must meet certain income criteriaand be able to perform academically at the eighth grade level and above. Admissionrequirements for business schools may be slightly higher.
The Career Training Program maintained a low attrition rate through the end of1982. More than 71 percent of the graduates placed in jobs are still employed.
Jobs for America's Graduates, Inc.Karla S. MilanetteDirectorTechnical AssistanceSuite 3041750 Pennsylvania Avenue, N.W.Washington, D.C. 20006
Jobs for America's Graduates, Inc. (JAG) is a national, nonprofit, public service cor-poration designed to assist in t1-.e reduction of youth unemployment, and ease thetransition from high school to work by promoting a program of motivation, job readi-ness, placement and retention within the private sector.
The corporation started its program in Delaware during the 1979-1980 academicyear. It has subsequently been implemented in parts of Tennessee, Massachusetts,Arizona, Missouri, Michigan, Ohio and Virginia. JAG seeks to identify potentially un-employable youth who are in their senior year. Once in the program, participants are
332

292 Project 2000
assigned a staff counselor who assists them in the development of basic "employabil-ity skills" necessary for entry-level jobs. The program also identifies job opportunitiesfor participants, and assists in their placement in unsubsidized jobs with follow-upsupport lasting nine months after graduation.
Although the program is primarily concerned with those whose lack of skills mayprevent them from finding jobs, it is open to all high school students.
Jobs For Youth, Inc.Kenneth PageCoordinator, Public Relations/Community Education1831 Second AvenueNew York, New York 10028
Jobs for Youth (JFY) is a national, nonprofit, youth employment agency started 25years ago in New York City, which now includes locations in Boston and Chicago.This year-round program has four components:
,/ In-school programsFor example, the Winter Program of Excellence which offerspart-time, after-school work opportunities for 20 highly-motivated high schoolstudents.
,/ Assistance to special groupsThese programs address the unique needs ofeconomically disadvantaged youth seeking employment. For example, the AsianStudents Summer Work Experience Program offers initial exposure to the Americanworld of work with assistance from counselors fluent in English, Chinese and Viet-namese. Students are also er.rolled in English as a Second Language courses atwork sites. Another example is the Women's Project, which responds to the specialemployment needs of minority women, many of whom are single parents.
,/ Assistance for youth wh special skills needsFor example, Project Upgrade forJP/ graduates who are entry-level employees and ready to move into positions ofgreater responsibility through promotion or on-the-job training.
,/ 'Lcrvices to the fieldThe New York and Boston JFYs have a collaborative effortto offer technical assistance in youth program development to other organizationsand agencies.JFY targets its efforts toward the economically disadvantaged and minority youths
aged 16 to 21 who are school dropouts or "hard-to-employ". The agency places themin entry-level, unsubsidized private sector jobs ranging from stock clerks, messen-gers, and maintenance workers, to entry- level positions in clerical and other areas.
In the past five years, JFY programs in New York, Boston, and Chicago have made
over 7,000 placements in unsubsidized private sector jobs.JFY also targets medium and small-sized firms which it believes offer new employ-
ees more personal attention and better assistance in acquainting them with the manycomponents of business and work than the larger companies. Along with the NationalChild Labor Commitee of New York City, JFY devises training programs for employersso that they can work effectively with young employees.
JFY offers unique Summer Work Scholarship Programs. Corporations, foundationsand individuals contribute $893 for a scholarship to enable a student (who receives
333

Educating for the Future: An Overview 293
$703.50 as salary for the summer with the balance used for administrative costs) togain work experience. Participants receive individualized scholarships from specificdonors who are given background information on their recipient and a photograph.After the work experience ends, the scholarship donor gets a description and evalua-tion of the youth's work experience. Participants are all enrolled in school and mustbe planning to return at the conclusion of the summer experience.
In 1982, 253 scholarships were made available by 74 donors. Ninety-four commu-nity organizations provided worksite experiences which included: program assistantin the education department of a major New York City museum, law clerk at a com-munity legal office, assistant community organizer at a community developmentcommittee, journalist, and business analyst.
In 1981, JFY implemented an industry research project funded by the MorganGuaranty Trust Company of New York. The project was initiated to assist JFY in target-ing new areas for training development. The 11-month project looked at a range ofindustries in the New York City area which showed growth potential and increasednumbers of entry-level jobs. Eleven industries were identified for an in-depth study.They were: banking, building services, contract food, entertainment (movie theater),health, hospitality, legal (work in law firms), retail drugs (drugstores), retail sales (de-partment stores), security, and wholesale grocery. The project provided valuable in-formation on the following JFY areas of interest:
Job Development
,/ Existing entry level jobs,/ Seasonality,/ Salary range,/ Names and contacts from trade organizations and journalsI Documentation of union-related issues and contact with unions,/ Options for JFY marketing of proposed training programs,/ Hiring sourcesI Employment fluctuation rates within the industry
Educational Services
Math, reading, writing, and language skills needed to pass preliminary tests, com-plete applications, and perform responsibilities satisfactorily.
j Skills needed for advancement and promotion in the job area.
Counseling
Requirements for effective screening of applicants.I Identifying vertical and horizontal growth possibilities for each industry from a
counseling standpoint.I Ways to prepare c I ients for an initial interview.I Benefits and limitations within each position.
334

294 Project 2000
The Midwest Women's CenterPam AndersonExecutive Director53 West Jackson BoulevardChicago, Illinois 60604
The Midwest Women's Center was founded in 1976 to further the economic, politi-cal and cultural status of women in Illinois and other midwestern states. The Centerprovides employment services annually to more than 4,000 women, and assists itsclients in finding employment in nontraditional and technical occupations.
The Midwest Women's Center maintains a close referral relationship with corporatepersonnel and training departments in the areas that it serves. It provides, through itsjob development program, over 200 "job orders" each month for use by employmentcounselors in screening and referring clients. It also offers counseling, job readinessworkshops for women preparing for trade careers, and information forums on bluecollar careers for women. Center training programs include hands-on experience incarpentry and the machine trades.
The Center, in cooperation with the Chicago Urban League, started its "pre-appren-ticeship" program in 1979 to recruit, train and place women in applenticeship pro-grams, as well as in nontraditional and technical fields. This program received initialmajor funding from the State of Illinois. Subsequent major funding to promote andexpand apprenticeship programs has come from foundations.
Between 1982 and 1983, a new program was developed to place women in thehighway construction trades. Women in this program are being placed in full-time,unsubsidized jobs as truck drivers, carpenters, electricians and laborers. There were35 to 40 women in an active client pool waiting to be placed in highway conAruction-related occupations in the summer of 1983.
The Midwest Women's Center, with support from a U.S. Department of LaborWomen's Bureau grant, is offering a training program to over 500 women's organiza-tions, unions, employers, and government agencies in a six-state region. It is to assistthem in designing and implementing apprenticeship training programs that willfurther the entry of women into trade occupations in those states.
Opportunit;es Industrialization CentersOf America, Inc.Elton jolly, Ph.D.National Executive DirectorP.O. Box 4212Philadelphia, Pennsylvania 19144
Opportunities Industrialization Centers of America, Inc. (01C) is a network of nationalvocational training affiliates founded in 1964 by the Rev. Leon H. Sullivan in Philadel-phia. The organization offers a comprehensive range of services to identify and prepareindividuals, especially those having difficulty in finding meaningful employment.

Educating for the Future: An Overview 295
OIC of America, Inc. offers nonoccupational or life-coping skills and occupationalskills training through a program of 11 interrelated service modules:
Outreach/recruiting.,/ IntakeThe enrollment of program applicants and the determination and verifica-
tion of their eligibility for specific programs.Orientation/AssessmentFamiliarizing program trainees with the self-help phi-losophy of the OIC program and assessing their level of educational and occupa-tional aptitude.
I FeederProviding prevocational training including basic skills education, ethnichistory and culture, personal grooming, and work behavior.CounselingCounseling in career opportunities, and personal problems.
,/ Supportive ServicesPractical assistance to meet trainee housing, transportation,day-care, health, and/or legal assistance needs.Special ServicesAssisting individuals such as ex-offenders, the mentally or phys-ically handicapped, non-English speakers, and women and youth with uniquetraining and employment needs.
,/ Vocational Skills TrainingTraining in more than 100 "demand" occupations in-cluding computer operations/applications, word processing, data entry, elec-tronics, secretary (legal), construction, nursing, retail sales, lathe operating, phar-maceuticals, and vehicle maintenance.
I Job DevelopmentCollecting current labor market information and marketingOIC's producta well-trained and motivated jib applicant.Job PlacementMatching program participants with job openings.Follow-up assessmentTracking successful program trainees who have beenplaced in jobs, and gathering corporate information on how OIC can upgrade itstraining programs.
The IBM Corporation has funded the establishment of five High-Tech training centersfor OIC in St. Louis, Boston, Minneapolis, New York City and Philadelphia. All of thesecenters are utilizing state-of-the-art equipment. Trainees are introduced to word pro-cessing, data entry, computer operations and computer programming. Control DataCorporation and the Sperry Corporation have provided the equipment and corporate-paid instructors for High-Tech programs offered through the OIC affiliate network.
OIC of America, Inc. has a National Industry Advisory Council (MAC) composedof private sector executives who regularly consult with and advise the leadership ofOIC on training. There is also a National Technical Advisory Committee composedof corporat, staff managers who implement MAC decisions and policies.
336

296 Project 2000
Project DiscoveryThe Women's BureauThe Department of Labor200 Constitution Avenue NWWashington, D.C. 20210
Project Discovery is a new demonstration project of the U.S. Department of LaborWomen's Bureau to be offered in conjunction with Links Inc., a national blackwomen's service organization.
Project Discovery, which will be based in Baltimore, Maryland, will work to im-prove the job-finding skills of middle-income minority women between the ages of35 and 50, who are seeking to enter or re-enter the work force or trying to move intojobs in growth occupations. It will also assist these women in addressing the changesin their lives that have econom ic consequences, such as widowhood and divorce.
Workshops will focus on self-awareness, career exploration, job skills transfer andexposure to the job market. The program will provide follow-up sessions in whichparticipants will share their employment experiences.
The project will be a prototype for similar efforts across the country, and will servea segment of the population often overlooked by other programs.
SER-Jobs For Progress, Inc.1335 River Bend DriveDallas, Tex 3S 75247
SER-Jobs for Progress, Inc. is a national community-based corporation dedicatedto equal opportunity for all Americans. It is particularly concerned with increasingthe business and economic opportunities for minorities.
SERan acronym meaning to be in Spanishstands for service, employment andredevelopment. The SER organization was established in 1964 by the American G.I.Forum and the League of United Latin American Citizens (LULAC) as a volunteer em-ployment and training program. Since that time, its 81 local affiliates have maintainedhigh levels of client placement in unsubsidized private sector jobs.
Each local affiliate is structured to meet the specific needs of its paiticular communi-ty and to provide appropriate skills training. Employment-related services range fromoutreach, recruitment, assessment, certification, job counseling, on-the-job andskills training, to basic remedial education and English as a Second Language.
SER has a national business advisory council, the Amigos de SER, which currentlyhas 88 corporate members who assist in the development of training programs. Forexample, the Amigos de SER in Miami and HJuston and the IBM Corporation havejointly established computer skills training centers for economically disadvantagedpersons. The Amigos de SER, which was initiated in 1974, also has an Executive-on-loan program to provide executives who will act as resident consultants and liasonsbetween SER and the private sector at SER National Headquarters for one year periods.
One example of a SER intervention program is the Multicultural Career Intern Pro-gram in Washington, D.C., which is mentioned later in this chapter.
3-fl 7

Educating for the Future: An Overview 297
Florida A & MSchool of Business and IndustryDr. Sybil C. Mobley; DeanFlorida A & M UniversityTallahassee, Florida 32307
The Florida A & '4 School of Business and Industry (SBI) provides a unique programthat has received notice from corporations and businesses throughout Florida and thecountry. Florida A & M is an historically black public university with a business schoolenrollment that is 95 percent black. In addition to providing students with technicalinformation relating to business administratiol., the curriculum includes professionaldevelopment in business discipline and initiatives, communication, social and per-sonal skills, and leadership training important to the development of successful busi-ness careers. The academic curriculum is augmented by a comprehensive programon business culture. The professional development program includes writing book re-views, debates on the important issues relating to business, developing speakingskills, and holding forums where top American business executives speak with stu-dents and answer questions about business and their companies.
SBI successes have been the result of the dialogue and cooperation between theuniversity, the Florida State Legislature and corporate America. All let the SBI Deanknow the additional nonacademic qualities deemed important for a successful matchbetween the school's graduates and positions in American companies. Somegraduates have received as many as 15 job offers during their senior year.
Howard University Summer Actuarial InstituteMaurice Williams, Ph.D.DirectorHoward Center for insurance EducationHoward UniversityWashington, D.C. 20059
Howard University's School of Business and Public Administration offers a majorin insurance with a concentration in actuarial science; the College of Liberal Arts of-fers a major in mathematics with an actuarial science concentration. The actuarialprogram at the university is small, with only 12 students enrolled, mostly in the Schoolof Business. Howard University, in order to recruit more freshman students to thefield, conducted a Summer Actuarial Institute in 1983 which was attended by 50 highschool juniors with outstanding aptitudes in mathematics. Students were selected onthe basis of their SAT or PSAT test scores, high school transcripts, and recommenda-tions from their high school mathematics teachers.
The Institute is a three-week program which provides these students, mostly mem-bers of minority groups, with an opportunity to take college-level mathematics andcomputer courses. It also serves as a recruitment tool for the University's Center iorInsurance Education. The curriculum includes lectures on binomial distribution,measures of dispersion, means ant' extremes, descriptive and inferential statistics, and
338

298 Project 2000
computer programming. Students also participate in a business decision-makingcomputer game.
The program is funded by insurance companies and by the Society of Actuaries;both groups are interested in encouraging students to consider actuarial careers.
The Institute is expected to be repeated in 1984, in the hope that at least 10 out-standing freshmen students will become enrolled in one of the degree-granting actua-rial programs each year it is offered.
INROADSReginald D. DicksonExecutive Vice President and Chief Operating OfficerPost Office Box 8766St. Louis, Missouri 63102
INROADS is a career development program which combines work experience withcollege study to offer minority students a comprehensive package of tutoring, counsel-ing, and summer internships with major corporations over a period of four years. Theprogram recognizes the need of even the most talented minority students to come incontact with business-oriented role models in order to be encouraged to consider a
career in business.The original program sponsored students from inner-city high schools in Chicago.
Its support has expanded since 1970 to 10 additional cities: Cleveland; Milwaukee;Minneapolis /St. Paul; St. Louis; Kansas City, Missouri; Dallas; Houston; Pittsburgh;Charlotte, North Carolina. It is hoped that programs will soon be initiated in Denver,Newark, and Richmond, Virginia. INROADS has 598 corporate sponsors in its pre-college and college programs, and many of it graduates are now employed in thecountry's major corporations.
The pre-college program offers courses and workshops that are academicallyoriented, including the development of good study and time management skills,familiarity with exam-taking, and mechanisms for coping with testing. Participantsattend pre-college classes 30 Saturdays during the school year, and every day for 6weeks during the summer.
Prospective interns for the college level programs must graduate in the top ten per-cent of their high school class. INROADS views itself as a product development pro-gram, therefore, candidates must meet stiff requirements in order to assure a high levelof work performance for program sponsors. They must also attend a four-year collegeor university within an area served by the program, major in business or one of theapplied sciences, and meet regularly with their staff counselor. Following two suc-cessful interviews, prospective interns are placed in a talent pool of 200-300 studentsfor corporations to select from in any given year. Students are eligible for appoint-ments with corporations after receiving counseling on job interviewing, dress, and
communications skills.College level interns are matched with a staff counselor who monitors their progress
by making sure that grade point averages are up to standard, and summer internshipsare of increasing challenge in subsequent years of the program. Seminars in areas suchas decision-making and negotiation skills are offered beginning in the sophomore year.

Educating for the Future: An Oven iew 299
The INROADS program has a service component and interns are expected to workon projects beneficial to their home communities. This is viewed as a way to developcorporate and community leaders within minority communities. The National IN-ROADS Alumni Association, established in 1982, is an active group which promotesthe professional development of its members and establishes communication net-works among minority business officials. Graduates also serve as role models for thepre-college and college program participants. The Chicago alumni association, with100 members, tutors junior high students in English and mathematics, conducts com-pany tours for interns, publishes a newsletter, and helps recruit new interns. Alumnialso participate in Regional Training Institutes which bring 200 to 300 interns togetheron a college or university cam pus for three days of training and comraderie.
One of INROADS' self-identified concerns is that an increasing number of partici-pants are being selected with suburban, middle-class backgrounds because they arebetter prepared to survive the rigors of the program. Another concern is that studentskills and interests cannot always be matched with corporate employer needs and,therefore, students may not be offered jobs by cooperating companies at the end ofthe four year process.
INROADS is a nonprofit, tax-exempt organization funded by contributions from itscorporate sponsors, and receives no Federal or state monies. The program does notpay participants' tuition, however, interns do qualify for scholarships and grants, re-ceive wages from their sponsoring corporations, and an occasional educational loanto cover their expenses.
LEAD (Leadership, Education And Development)Program in Business, Inc.William j. ElliottExecutive Director37 Nishuane RoadMontclair, New jersey 07042
LEAD is a joint corporate/business school program founded in 1980 to encourageminority high school students to pursue business careers. Students --e recruited for andapply to the program through A Better Chance, Inc., a national no profit organizationwhich recruits academically-gifted minority students for educational opportunities andexperiences. The nonprofit, tax-exempt program operates for four weeks in July.
LEAD combines lectures and case-study analyses with field trips to corporate of-fices and plants, and classroom instruction. The program provides minority students,chosen because of their leadership abilities and potential, with a comprehensive in-troduction to the free-enterprise system.
LEAD addresses the issue of low minority representation in both business schoolprograms and corporate management. It targets high school students because they arestill considering career options.

300 Project 2000
Forty corporations and foundations contribute funds, business case-study mate-rials, speakers, and programming at participating companies. In 1982, the WhartonSchool of Business (University of Pennsylvania); the University of Michigan GraduateSchool of Business; the J.L. Kellogg Graduate School of Management at NorthwesternUniversity; and Columbia University School of Business provided room and board,classroom facilities and faculty support to the program. In 1983, the University ofMaryland, in cooperation with Howard University and the University of Virginia, be-came sponsors through a cooperative effort. By 1985, LEAD hopes to have ten cam-
puses involved in the program.
The League of National Educational Service Centers, Inc.of The League of United Latin American CitizensJose LongoriaExecutive Director400 First StreetSuite 716Washington, D.C. 20001
The League of National Educational Service Centers, Inc. (LNESC) was establishedin 1973 as the educational affiliate of LULAC, an organization involved since 1929in uniting with other civic groups to eliminate discriminatory practices againsteconomically disadvantaged Americans. The National Educational Service Centersprovide Hispanic youth with access to higher education. LNESC estimates that it hassupported, motivates and assisted approximately 10 percent of the 1.1 million His-panic students enrolled in college during its 10 years of existence. Its programs serveapproximately 20,000 students annually.
The 12 centers offer students counseling in future-oriented academic programs. Bydesigning precollegiate programs to provide early technical education and training,LNESC hopes that Hispanic representation in technical fields will increase. The cen-ters also focus on leadership development and basic academic preparation. ThePhiladelphia and Colorado Springs programs include the BEST Project (Business, En-gineering, and Science Technology), a precollege intervention program providingpersonal, educational and career counseling; hands-on training experiences; instruc-tional programs; and tutoring services. The BEST Project conducts weekly instructionin mathematics, general science, and communication skills. Field tips and work-shops provide an opportunity to learn about different technical careers and profes-sions from interactions with practicing professionals and visits to corporate offices.plant facilities, and science museums.
The first BEST Project was located in Philadelphia and the first graduating class(1981) had a 100 percent program retention rate: 85 percent of the participants en-tered institutions of higher education to study business, engineering, and science-based health fields. BEST Philadelphia started with a foundation leadership grant andthe program is currently supported by grants from the private sector. ri 1984, a newBEST program will be opened at the New Haven, Connecticut LNESC.
34i

Educat.ng for the Future: An Overview 301
LNESC also has professional preparation and development programs and conductsProject Follow-Up seminars that bring college students together with corporate lead-ers to discuss potential career paths and opportunities. The Follow-Up seminars aresupported by corporate participants.
In 1982, the Kellogg/LNESC intern program was started. It is a professional trainingprogram providing four receit college graduates with an opportunity to strengthentheir leadership and managerial skills. The internship lasts one year and concentrateson administration, finance, program development and operations, research, and re-source development functions. Interns are based at LNESC headquarters inWashington, D.C.
Mathematics, Engineering, Science AchievementExecutive DirectorLawrence Hall of ScienceUniversity of CaliforniaBerkeley, California 94720
Mathematics, Engineering, Science Achievement (MESA) is a state-wide enrich-ment program in California. It is designed to increase the number of minority studentscompleting high school with necessary preparation in mathematics, science and En-glish to pursue a math-based discipline at the college level .
MESA provides academic course work to strengthen the high school student'scapabilities in science and mathematics, offers incentives that recognize academicperformance, and builds cooperative networks among public schools, universities,industry, and professional societies that provide services and support to students inthe program. MESA creates a sense of community among its students, their parents,teachers, volunteers and others.
MESA provides six major services to supplement and enrich students' regular edu-cational programs:
II
II
IJi
Tutoring from advanced MESA program peers and volunteers from cooperating in-stitutions.Independent study groups, organized and supervised by MESA directors andteachers, that encourage students to work together in creating a supportive envi-ronment for effective learning.Academic and career counseling that assists students in choosing a high school orcollegiate program of study and provides information on career opportunities.Field trips to industrial plants and research centers enabling MESA students to havecontact with professionals in the engineering and technical fields, and their work-i ng environments.Summer enrichment and employment programs.Scholarship Incentive Awards for students who achieve high academic standardsand meet awards criteria.
342

302 Project 2000
MESA measures program results annually so that the program's sponsors can assessthe influence of their involvement. Many companies support MESA on an annual basis
because they view it as a model of industry-school cooperation that can foster further
economic growth.MESA is governed by the regents of the University of California and operates 15
centers throughout the state. Associated with universities strong in science and en-gineering, each center works with students from secondary schools within their geo-graphic areas. An Industry Advisory Board and a Center Advisory Board provide ad-
vice and counsel to the state MESA office located at the University of California, Ber-keley. Local advisory boards at the center are composed of teachers, parents and rep-
resentatives from local companies and organizations. Each center has a faculty spon-
sor, a director (the day-to-day manager of the center) and advisor-teachers, who areusually high school mathematics or science staff. These individuals act as MESA
liaisons at each participating high school. MESA also has a network of university levelprograms operating in 10 universities.
MESA was initiated in 1970 at the Oakland Tech High School. During the 1976-77academic year, a decision was made to replicate the program throughout the state.
Initial grants from foundations made program expansion possible. By 1981-1982,MESA served approximately 2,700 students. If additional funding is secured in the fu-
ture, MESA believes that its program could serve 4,500 students at 150 high schools
in California. In the first five years of statewide operation, financial support came fromprivate corporations, foundations and the state through its two university systems.
Multicultural Career Intern ProgramMaria TukevaProgram Directorc/o Abraham Lincoln Junior High SchoolSixteenth and Irving Streets, N.W.Washington, D.C. 20009
The Multicultural Career Intern Program (MOP) or the Bilingual HighSchool, is apilot alternative secondary school program operated by SER-Jobs for Progress (see
entry earlier in this chapter), a national Hispanic self-help organization under contractfrom the U.S. Department of Labor through the auspices of the District of ColumbiaPublic School System. It is an holistic educational program primarily for students who
are first generation immigrants.An initial CETA grant was awarded in 1979 for the development and operation of
a multi-cultural/multi-racial school to help students whose first language is not En-
glish to complete high school and get necessary career education and training. The
program targets students with problems of cultural isolation and/or linguistic barriers,
especially those from Asia, and Spanish-speaking countries. SER faculty is bilingual.
SER developed a curriculum, received program accreditation, established a re-
lationship with the local public school system, and moved into classroom space in
a local junior high school building with the first CETA grant. In 1980, it received
343
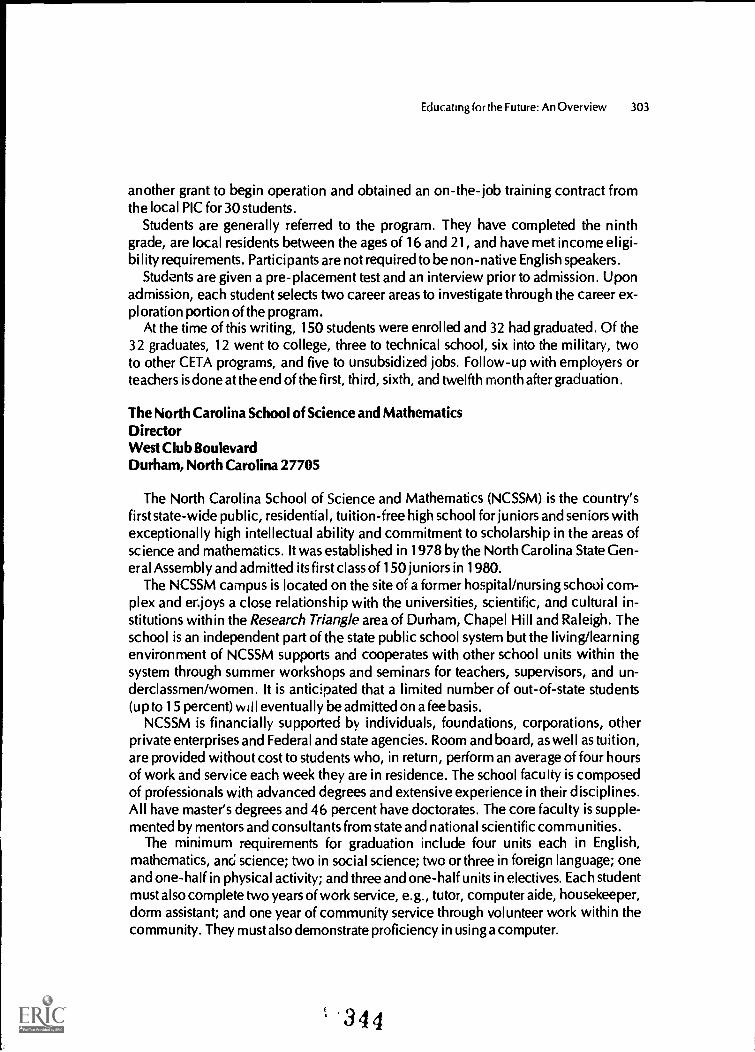
Educating for the Future: An Overview 303
another grant to begin operation and obtained an on-the-job training contract fromthe local PIC for 30 students.
Students are generally referred to the program. They have completed the ninthgrade, are local residents between the ages of 16 and 21, and have met income eligi-bility requirements. Participants are not required to be non-native English speakers.
Students are given a pre-placement test and an interview prior to admission. Uponadmission, each student selects two career areas to investigate through the career ex-ploration portion of the program.
At the time of this writing, 150 students were enrolled and 32 had graduated. Of the32 graduates, 12 went to college, three to technical school, six into the military, twoto other CETA programs, and five to unsubsidized jobs. Follow-up with employers orteachers is done at the end of the first, third, sixth, and twelfth month after graduation.
The North Carolina School of Science and MathematicsDirectorWest Club BoulevardDurham, North Carolina 27705
The North Carolina School of Science and Mathematics (NCSSM) is the country'sfirst state-wide public, residential, tuition-free high school for juniors and seniors withexceptionally high intellectual ability and commitment to scholarship in the areas ofscience and mathematics. It was established in 1978 by the North Carolina State Gen-eral Assembly and admitted its first class of 150 juniors in 1980.
The NCSSM campus is located on the site of a former hospital/nursing school com-plex and enjoys a close relationship with the universities, scientific, and cultural in-stitutions within the Research Triangle area of Durham, Chapel Hill and Raleigh. Theschool is an independent part of the state public school system but the living/learningenvironment of NCSSM supports and cooperates with other school units within thesystem through summer workshops and seminars for teachers, supervisors, and un-derclassmen/women. It is anticipated that a limited number of out-of-state students(up to 15 percent) will eventually be admitted on a fee basis.
NCSSM is financially supported by individuals, foundations, corporations, otherprivate enterprises and Federal and state agencies. Room and board, as well as tuition,are provided without cost to students who, in return, perform an average of four hoursof work and service each week they are in residence. The school faculty is composedof professionals with advanced degrees and extensive experience in their disciplines.All have master's degrees and 46 percent have doctorates. The core faculty is supple-mented by mentors and consultants from state and national scientific communities.
The minimum requirements for graduation include four units each in English,mathematics, anc; science; two in social science; two or three in foreign language; oneand one-half in physical activity; and three and one-half units in electives. Each studentmust also complete two years of work service, e.g., tutor, computer aide, housekeeper,dorm assistant; and one year of community service through volunteer work within thecommunity. They must also demonstrate proficiency in using a computer.
' 3 4 4

304 Project 2000
The Fine Arts curriculum offers students the opportunity to develop their artistic tal-ents. The Mentor Program for seniors allows them to spend three to five hours a weekassisting professional researchers in the laboratories of Research Triangle area univer-sities, institutes and industries.
Technical Scholar ProgramCoordinatorGreenville Technical CollegeGreenville, South Carolina 29606
The Technical Scholar Program (TSP) was conceived in 1978 by major area em-ployers concerned about recruiting high school graduates for technical careers inGreenville, South Carolina. The first class of Technical Scholars entered GreenvilleTechnical College in 1980 and graduated in 1982.
Students recruited for the program are those who would be successful in collegebut prefer a hands-on, technical, postsecondary education.
The Technical College, and Greenville businessmen and women prepared a pro-gram proposal which sought a financial commitment from the state to purchase newHigh Tech equipment for the college. The college's existing equipment was appropri-ate for basic manufacturing and machining industries, but inadequate for training per-sons for the technological occupations of the 1980's. After an evaluation of existingacademic programs at the college, a cooperative program which includes school inthe morning and work in the afternoon was initiated.
Sponsoring companies buy students' books, pay their tuition, and provide 24 hoursof paid work per week. In 1982, all graduates were hired full-time by their sponsoringcompany. Some of the graduate Technical Scholars continued on with four-year de-gree programs; most were sponsored by their respective companies.
In three years of operation, program-sponsor participation expanded from 12 to 22companies, and five cu rricu I urn options were offered to over 100 students. GreenvilleTechnical Coilege now screens over 500 candidates each year for the program. Appl i-cants are accepted on the basis of their school record. A Technical Scholar coordi-nator based at the College was appointed to counsel students on their academic pro-gram and to assure that their work experience is meaningful.
A Master Advisory Committee, which includes a representative from the businesscommunity, is responsible for the development of program policies that ate of mutualimportance to both students and sponsoring companies. The committee has assistedin the development of similar programs in two neighboring communities and is cur-rently involved in planning a new program which will coordinate training efforts be-tween vocational high schools, technical colleges and industry. One participatingcompany representative said of the latest initiative, "We are trying to create a newawareness of where we can help each other. For too long we have all gone off in our
own directions."
345

Educating for the Future: An Overview 305
Other Programs of Interest
Career Merit Achievement Plan (CAREER MAP)Talmadge L. Rushing, DirectorIndustrial EducationState of FloridaDepartment of EducationTallahassee, Florida 32301
Members of the Industrial Committee of Florida's State Advisory Council on Voca-tional and Technical Education, and the South Florida Manufacturers Association sawa need to standardize High Tech curricula throughout the state. They implementedthe Merit Achievement Plan (MAP), a format used in other industrial areas to itemizethe "industry-validated" state-of-the-art competencies and skills required of entry-level High Tech employees. The Career MAP tracks student progress and achievementin specific skill areas necessary for a High Tech career: classroom instruction, labora-tory training and cooperative work experiences. It is used for programs in Florida'scomprehensive High Schools, vocational-technical centers and community colleges.
Among other things, the Career MAP attempts to accomplish the following:
I Counsel and advise students considering a High Tech career.I Assist teachers and curriculum developers in planning curricula and establishing
resource requirements.I Serve as the foundation for a life-long record of training, which is updated by work-
ers as they master new skills through additional learning and training.I Identify the skills needed by job seekers.I Certify instructor competency.I Help assure that equipment and training facilities are adequate for the development
of student skills.
Career MAPs have been or are being developed in computer electronics, computerservicing, robotics, automation technology, manufacturing technology, elec-tromechanics, laser electro-optics, instrumentation, telecommunication, elec-tronics, avionics, telephone technology, computer-assisted design (CAD), and hybridmicro-electronics.
Community College of Allegheny CountyJob Task Analysis Approach to Crosstraining Displaced Skilled WorkersDr. Daniel C. PryzbylekDeanContinuing Education800 Ridge AvenuePittsburgh, Pennsylvania 15212
The job Task Analysis Approach is part of the Community College of Allegheny
346

306 Project 2000
County's (CCAC) response to displacement of the community's skil led millwrights dueto the declining steel industry. The )TA Approach tracks supply and demand withinthe labor market, particularly its effects on skilled workers moving from one job classi-fication to another. It is useful in locating qualified applicants with an interest in andthe skills needed for employment in occupations that require qualified workers. CCACthen develops and offers appropriate curricula in those areas. The components of thejob task analysis include:
V Labor market analysis to identify potential new jobs areas.V Review of local labor force statistics, looking especially at who is being laid off and
in what job categories./ Review of the characteristics of displaced workers including their educational
achievements; job experience; previous duties, tasks and responsibilities; and pre-vious levels of training and education.
V Identification of job classifications currently open in the labor market.I Cross-comparison of available jobs in order to determine the differences between
old and new job requirements.V Development of an appropriate curriculum.V Screening and referral of the most qualified candidates to CCAC training programs.V Additional screening of referred candidates through the administration of
academic and job proficiency examinations.V Interviewing of program candidates by the CCAC Industrial Advisory Board and
its recommendation of candidates for training.V CCAC training.V Upon completion of training, the College Industrial Advisory Board and the Em-
ployment Service develop jobs and place successful graduates.
The CCAC has had two programs in the Pittsbrugh area to train displaced skilledworkers. One program trained workers as stationary engineers for Pittsburgh construc-tion projects. These trainees qualified in Low Tech boiler operations and in High Tech
fundamentals of programmable controllers. A second program trained clients to workas robot repair technicians. Participants who were enrolled in this program were al-ready trained maintenance workers with backgrounds in electro-mechanical repair,hydraulics and instrument repair.
The Corporation for Public/Private Ventures1726 Cherry StreetPhiladelphia, Pennsylvania 19103
The Corporation for Public/Private Ventures is a nonprofit corporation that re-searches and designs cooperative programs between the public and private sectors.It seeks to resolve problems of an economic nature, such as job trainingand creation,
education for employment, and economic and community development.Public/Private Ventures operates with public and private contracts and grants, and
designs, manages and assesses new collaborative initiatives. It also evaluates pro-
347

Educating for the Future: An Overview 307
grams already in existence, conducts research and analysis of labor forces andeconomic issues, provides educational and technical assistance to business, industry,community organizations and both state and local governments, and disseminates in-formation about successful collaborative efforts.
In 1983, due to anticipated cutbacks in Federal government funding for programdevelopment and research activities, Public/Private Ventures changed its financialsupport from Federal grants and contracts to private foundations and corporations.
The Corporation for Public/Private VenturesVentures in Community Improvements1726 Cherry StreetPhiladelphia, Pennsylvania 19103
Ventures in Community Improvements (VICI) is an 18 month demonstration train-ing program in construction trades offered by the Corporation of Public/Private Ven-tures in 1982 to economically disadvantaged, out-of-school youth between 16 and19 years of age.
Trainees in the demonstration program worked on actual construction sites in eightcities, under the supervision of union journeymen. Trainees rehabilitated housing andpublic facilities in their own communities. In addition to working full-weeks a theconstruction sites, trainees ware also trained in such complementary constructionskills as construction-related math, blueprint reading and cost estimation. Trainingand counseling were met primarily by journeymen crew chiefs and took place in"crews" of six or seven persons.
Each community improvement project was responsible for meeting contracted pro-duction commitments with their respective work-providing organizations such as
community development agencies and housing authorities. Demonstration fundingcame from a combination of national and local public and private monies. When thedemonstration project ended, five of the eight demonstration site cities decided tocontinue the program with local funding.
Marie Reed Employment Support NetworkPamela Friedmando Adams Morgan Community Development Corporation1748 Columbia Road, N.104.Washington, D.C. 20009
The Marie Reed Employment Support Network is composed of businessmen andwomen (who first suggested the establishmentof such a support system), the local PIC,the local community development center, human resources and human services per-sonnel from government and community/neighborhood-based organizations, andthe public school system. These organizations and individuals seek greater interactionamong themselves by developing programs that assist people in training for and get-ting jobs. The Network was established to facilitate dialogue and to be a flexibleframework able to focus attention on the training/education needs of specific groups,
348

308 Project 2000
(e.g., Hispanics, and neighborhoods that might be overlooked within larger, morerigid frameworks).
The Network meets weekly and has also held a public forum for representatives ofthe larger D.C. community who are involved in employment programs. Discussionencompasses the implications of the new Job Training Partnership Act, the currentstatus of local training programs, the availability of skilled workers, current and antici-pated jobs for successful program trainees, and skills needs of local employers.
Massachusetts High Technology CouncilHoward P. FoleyPresident60 State StreetBoston, Massachusetts 02109
The Massachusetts High Technology Council is an association of 125 High Tech
companies operating in Massachusetts, and associate members that are service or-ganizations working directly for member companies. Founded in 1979, the Councilis the primary voice of the High Tech industry in Massachusetts. Its purpose is to nur-ture the industry's profitable growth by "actively facilitating cooperative relationshipswithin the industry itself, among member companies, the financial community, andeducational and governmental institutions within the Commonwealth." Areas ofCouncil concern include education and training for the High Tech careers.
The Council, in conjunction with the American Electronics Association, is sponsor-ing an initiative called the "two percent solution". The effort allocates two percentof the member companies' research and development (1982) budgets to assist univer-sities and some secondary schools in expanding technical education programs, espe-cially in engineering and computer science. The Council perceives development inthese areas as a key to the expansion of human resources and the future viability ofmember companies.
The Council thus far has conducted three human resource surveys; held two man-power planning conferences; instituted teacher - training programs; and publishedguides for (1) colleges, outlining the skills required by the industry, and (2) corpora.tions, advising on options for corporate support of technical education development.
In addition to conducting High Tech career awareness programs forsecondary school
students, the Council also offers a program to nine out-of-state engineering univer-
sities for the purpose of introducing students to High Tech careers.Some of the programs sponsored bv member companies include the establishment
of "Career Development Faculty Chairs" to attract young faculty to teach courses ofmutual interest to the High Tech industry and participating universities, technical as-sistance programs with master's degrees in technical writing for students with master'sdegrees in English, and course development for MBA programs in High Tech. Com-panies also donate equipment, provide summer employment programs for under-
graduate and graduate students, and loan key personnel as instructors.
34J

Educating for the Future An Overview 309
National Youth Employment Coalition(formerly National Youth Advocacy Coalition)Kenneth NochimsonExecutive Director1501 BroadwaySuite 1111New York, New York 10036
The National Youth Employment Coalition (NYEC), founded in 1977 and incorpo-rated in 1979, is concerned with employment training for young people. The Coali-tion meets regularly to discuss, evaluate and propose employment training policy andlegislation, to exchange information about members' programs, and to minimize theduplication of efforts in youth employment areas.
NYEC is comprised of voting members who represent nonprofit, community-basedorganizations, and nonvoting associates who include corporate and foundation repre-seniatives.
Membership fees are on a sliding-scale basis. Financial support comes from mem-bership dues and subscriptions, government contracts, and philanthropic grants.
Opportunities Academy of Management Training, Inc.Dr. Robert C. HutchinsExecutive Director1415 North Broad StreetPhiladelphia, Pennsylvania 19122
Opportunities Academy of Management Training, Inc. is a diversified, nontradi-tional, nonprofit, continuing education program. It is sponsored by the Opportunitiesof Industrialization Centers of America, Inc., a national, community-based organiza-tion that provides assistance and support through local affiliates to the disadvantagedin the areas of career counseling and employment training (see OIC description earlierin this chapter).
Founded in 1974, the Academy provides leadership and management training toOIC affiliates, staff, managers, executives, staff members of the business and industrycommunities, government agencies and their subcontractors, educational institu-tions, service organizations and interested individuals. Its focus is to provide thosewho work in the area of human ant social services with human resource developmentand management skills that will enable them to be successful when working with theeconomically disadvantaged.
The Academy also provides job development training programs for displaced pub-lic service employees and assists them in finding permanent employment within theprivate sector.
350