document resume author title pub date note 23p. · functioning was the denver developmental...
TRANSCRIPT

DOCUMENT RESUME
ED 053 183 TM 000 713
AUTHOR Sandier, Louise; And OthersTITLE Developmental Test Performance and Behavioral Styles
of Disadvantaged Nursery School Children.PUB DATE May 71NOTE 23p.
EDRS PRICE EDRS Price MF-$0.65 HC-$3.29DESCRIPTORS *Behavior, Developmental Programs, *Developmental
Tasiss, *Disadvantaged Youth, Family Background,Learning Difficulties, Negro Youth, *NurserySchools, *Screening Tests, Testing, Verbal Ability
IDENTIFIERS DDST, *Denver Developmental Screening Test, Get SetProgram
ABSTRACTDeviant functioning within preschoolers in a Get Set
program was assessed in order that an effective screening instrumentcould be utilized for early identification of learning disorders indisadvantaged children. (AG)
U.S. DEPARTMENT DF HEALTH, EDUCATIDNPr\ & WELFARE
OFFICE OF EDUCATIONCO THIS DOCUMENT HAS BEEN REPRODUCEDEXACTLY AS RECEIVED FROM THE PERSON ORI-4 ORGANIZATION ORIGINATING IT. POINTS OFVIEW OR OPINIONS STATED DO NOT NECESSARILY REPRESENT OFFICIAL OFFICE OF EDUN.\n CATION POSITION OR POLICY
L
C2)
DEVELOPMENTAL TEST PERFORMANCE AND BEHAVIORAL
STYLES OF DISADVANTAGED NURSERY SCHOOL CHILDREN
Authors: Louise Sandler, Ph.D, Hahnemann Medical Collegeand Hospital
Daniel Jamison A.M. University of PennsylvaniaOswald deLiser, M.A. Hahnemann Medical College
and HospitalLeonard Cohen, Junior Medical Student,
Hahnemann Medical College and HospitalKenneth Emkey, Junior Medical Student
Hahnemann Medical College and HospitalHelen Keith, Junior Medical Student
Hahnemann Medical College and Hospital

DEVELOPMENTAL TEST PERFORMANCE AND BEHAVIORAL
STYLES OF DISADVANTAGED NURSERY SCHOOL CHILDREN
(L. Sandler, D.Jamison, O. deLiser, L. Cohen, K. Emkey, H.Keith)
This investigation was concerned with the study of
the developmental functioning of young children attending
the Get Set preschool program of the Philadelphia Public
School System. Through the use of a previously standardized
screening test that yields a description of the child's
behavioral skills, the investigators assessed "typical"
responses of a large number of preschool children in order
to understand what may be considered deviant functioning
within the study population. Through this examination pro-
cedure, it was hoped that an effective screening instrument
could be utilized for the early identification of disadvan-
taged children requiring attention.
In recent years, there has been repeated documentation
of the influences of cultural and economic privations upon
the learning efficiency of the developing child.? As
studies accumulate, there has been a growing tendency to
generalize descriptions of the disadvantaged child as
showing inadequate achievement motivation, 8,11 as being
deficient in language skills, 1,3 and as having poor
perceptual abilities.10 The present authors question these
generalizations and point out that if such developmental
The authors wish to express their appreciation to theadministration and staff of the Get Set-Day Care Program ofthe Philadelphia Board of Education.

-2-
deficiencies are characteristic of disadvantaged preschool
children, then the interpretation of developmental delay
as an indicator of idiosyncratic aberrancy loses all
significance. On the other hand, if the data show that
disadvantaged children are functioning in line with develop-
mental and maturational expectations, then the individual
child showing deficient behavioral skills cannot be viewed
as representative of a group norm. Rather, he should be
recognized as a child needing remediation. There is a
great need in preschool nursery programs for early
identification of the individual child requiring special
attention.
PROCEDURE AND METHODS
During a ten week research fellowship, three medical
students administered developmental tests to Negro children
attending Federally funded preschool nursery programs in
Philadelphia. All testing and data gathering were carried
out within the facilities of the nursery programs. The
nursery centers were in churches, schools and community
centers and each contained an average of three classrooms.
A total of eleven centers were studied. The centers for
study were selected in order to represent a geographic
cross-section of this total preschool program.
Sample
Data were collected for a total of 373 children. As Table I
shows, the number of boys and girls was almost equal within
3.1111/111111111111111111iiimarlam

-3-
the study population. (Boys - 185; Girls - 188)
The largest number of children studied are in age
groups 55-60 months and 61-66 months.
TABLE I
Age Group and Sex Distribution of the Study Population
Age group in Months
36-42 43-48 49-54 55-60 61-66 Over 6G
By 4 29 45 59 47 1
Girl 8 24 34 58 62 2
Total(373) 12 53 79 117 109 3
Percent 3.2 14.2 21.2 31.4 29.2 .8
Family Backgrounds of the Study Population
To arrive at a description of the family structure
and background of the children, data were gathered from
teacher's records of the educational and occupational status
of the parents. Analysis of the data permits a general
description of the family structure. The data showed that
60% of the homes are without a father. In those families
with a father, he is an unskilled laborer. Formal education
of both the father and mother ranges from seven to eleven
years of schooling, usually with the mother retching a higher
grade level. Mothers who are employed generally hold full
time positions. It is interesting that the data show slightly
higher numbers of mothers than fathers working in clerical
and sales positions. This may reflect the mothers' higher
4

-4-
educational levels. These family characteristics are
representative of the total preschool Get Set population
as determined by comparison with demographic information
records of the Board of Education.
The Denver Developmental Screening Test
The instrument chosen for evaluation of developmental
functioning was the Denver Developmental Screening Test
(DDST)7, a technique used for the developmental assessment
of babies and young children. This test was originated
and standardized in Denver, Colorado. The standardization
population was primarily (82 %) from middle class and upper
class social groupings. Of the total population in the
Denver study, 7% were Negro children.
The test items are grouped within categories assess-
ing various abilities: Gross Motor, Fine Motor Adaptive,
Language Functioning and Personal Social Functioning. In-
cluded in the Gross Motor area are test items which permit
evaluation of coordination and balance, e.g., catching a
ball, balancing on one ,foot, and hopping. Test items within
the Fine Motor Adaptive section allow assessments of visual-
motor coordination and perception, e.g., building with blocks
and drawing of geometric shapes and human figures. The
test items within the Language category call upon the child's
understanding of the meaning and use of words. The test
items included within the Personal-Social area require an

-5-
adult's report concerning a child's ability. This area
of functioning was not explored in the present study.
The medical students were trained in the techniques
of examination and evaluation of the children.*
In order
to establish reliability among examiners, each examiner
tested twelve children in common with every other examiner.
The percent of agreement on items passed or failed ranged
from 85% to 92%.
Behavioral Inventory
A behavioral inventory was designed to describe
the child's behavior in the testing situeon. Judgments
were made in the following behavioral categories:
1) Reactions on initial contact, 2) Adaptability to the
situation. 3) Quality of affective behavior. 4) Attention
to tasks. 5) Frustration behavior. 6) Verbal behavior.
7) Competency behavior. Criteria were developed for rating
and reliability established. The agreement among four
raters was 87%.
In addition to establishing reliability of judgments
in the testing situation, the authors were interested in
assessing the congruence of behavior in the testing situation
with the child's behavior in the classroom. Therefore, three
*Training in the use of the DDST was supervised by the senior
author.
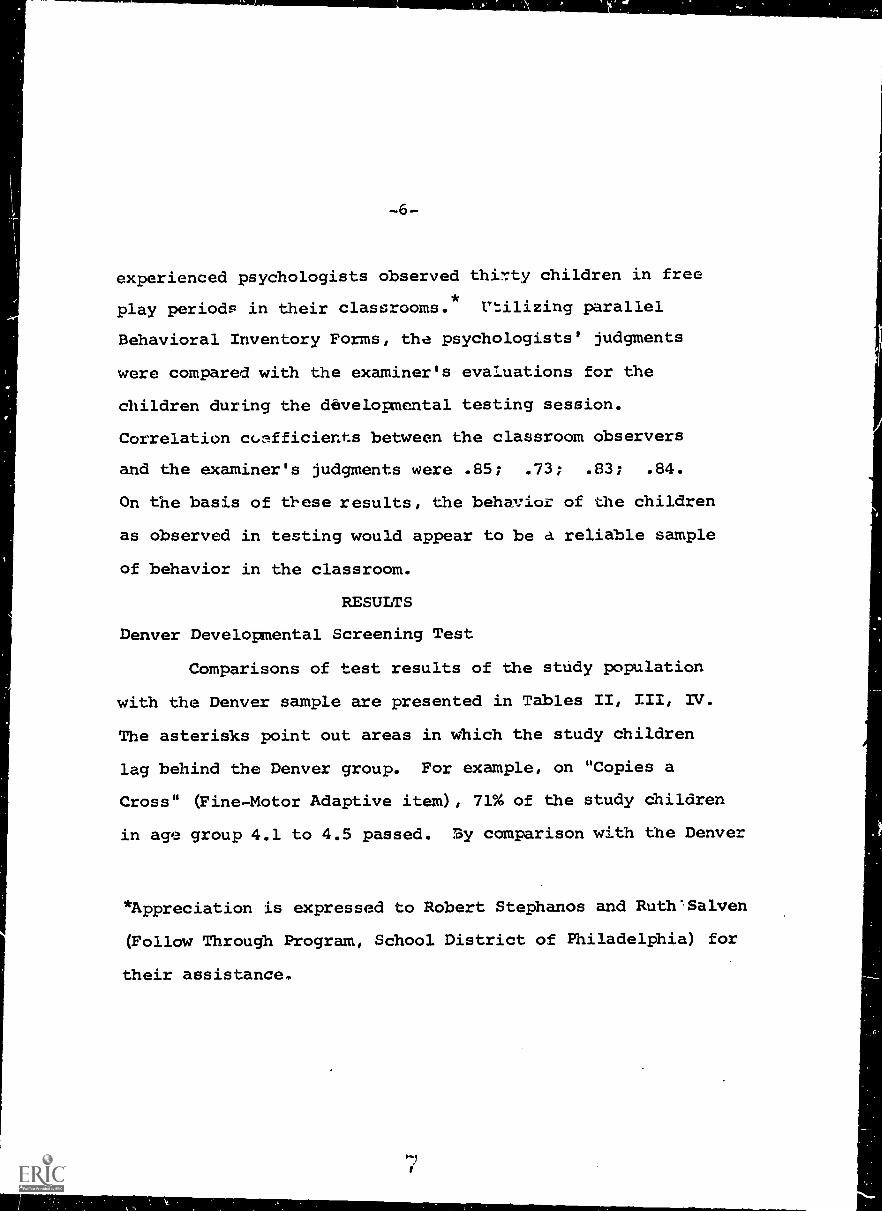
experienced psychologists observed thirty children in free
play periods in their classrooms.* Vtilizing parallel
Behavioral Inventory Forms, the psychologists' judgments
were compared with the examiner's evaluations for the
children during the dOvelopmental testing session.
Correlation cc,nfficients between the classroom observers
and the examiner's judgments were .85; .73; .83; .84.
On the basis of tl-ese results, the behavior of the children
as observed in testing would appear to be a reliable sample
of behavior in the classroom.
RESULTS
Denver Developmental Screening Test
Comparisons of test results of the study population
with the Denver sample are presented in Tables II, III, N.
The asterisks point out areas in which the study children
lag behind the Denver group. For example, on "Copies a
Cross" (Fine-Motor Adaptive item), 71% of the study children
in age group 4.1 to 4.5 passed. ?y comparison with the Denver
*Appreciation is expressed to Robert Stephanos and Ruth'Salven
(Follow Through Program, School District of Philadelphia) for
their assistance.
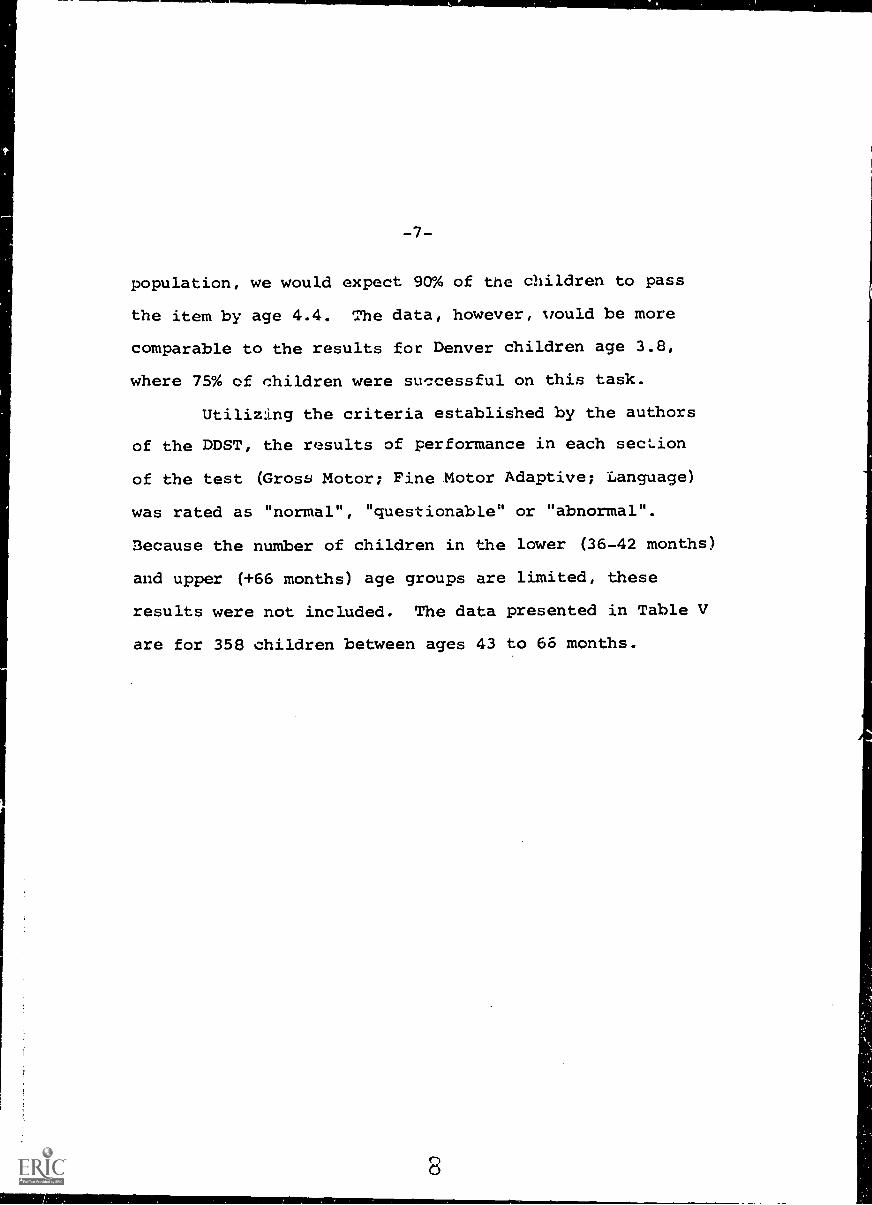
-7-
population, we would expect 90% of the children to pass
the item by age 4.4. The data, however, would be more
comparable to the results for Denver children age 3.8,
where 75% of children were successful on this task.
Utilizing the criteria established by the authors
of the DDST, the results of performance in each section
of the test (Gross Motor; Fine Motor Adaptive; Language)
was rated as "normal", "questionable" or "abnormal".
Because the number of children in the lower (36-42 months)
and upper (+66 months) age groups are limited, these
results were not included. The data presented in Table V
are for 358 children between ages 43 to 66 months.
8

TABLE II
GROSS MOTOR
STUDY NORMS COMPARED WITH DENVER NORMS
(4 Passing by Age)
Denver Norms
25%
50%
Balances on 1 ft., 1 sec.
Broad Jump
Balance on 1 ft., 5 sec.
Hops on 1 ft.
Heel to toe walk
Catches bounced ball
Backward heel-toe
Balance on 1 ft., 10 sec.
75%
90%
3.2
3.2
4.3
4.0
4.9
4.2
5.0
3.5
3.9
4.9
5.5
3.9
4.7
5.6
6.3
4.0
5.0
5.9
(% Passing by Age Groups)
Study Norms
3.5-4.0
4.1-4.5
4.6-5,0
5.1-5.5
90%
90%
90%
90
90
90
63*
78*
88*
67
90
90
*56*
67*
74
42
61
74
83
13*
21*
30*
**
40
41
52*
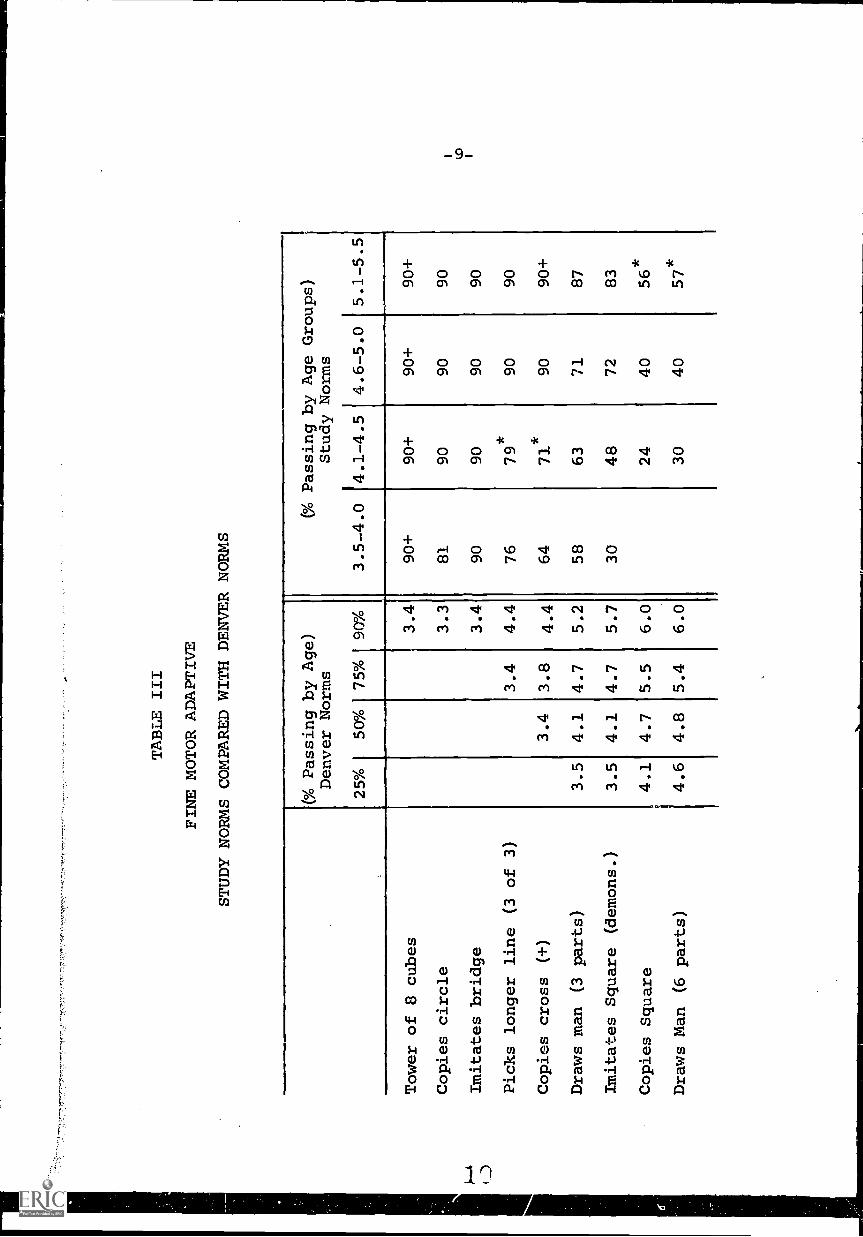
TABLE III
FINE MOTOR ADAPTIVE
STUDY NORMS COMPARED WITH DENVER NORMS
(% Passing by Age)
Denver Norms
25%
50%
75%
90%
(% Passing by Age Groups)
Study Norms
3.5-4.0
4.1-4.5
4.6-5.0
5.1-5.5
Tower of 8 cubes
Copies circle
Imitates bridge
Picks longer line (3 of 3)
Copies cross (+)
Draws man (3 parts)
Imitates Square (demons.)
Copies Square
Draws Man (6 parts)
3.4
90+
3.3
81
3.4
90
3.4
4.4
76
3.4
3.8
4.4
64
3.5
4.1
4.7
5.2
58
3.5
4.1
4.7
5.7
30
4.1
4.7
5.5
6.0
4.6
4.8
5.4
6.0
90+
90
90
79
71
63
48
24
30
90+
90
90
90
90
71
72
40
40
90+
90 90
90
90+
87
83
56*
57*
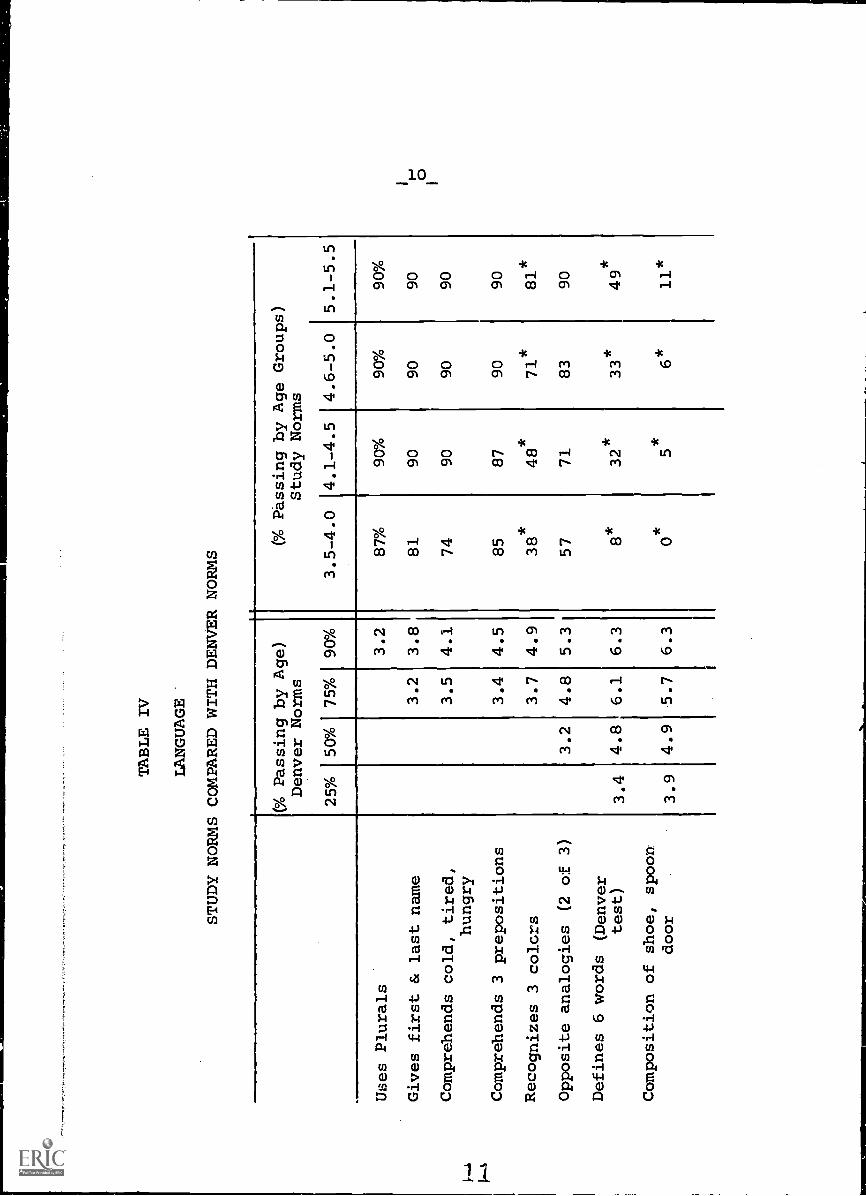
TABLE IV
LANGUAGE
STUDY NORMS COMPARED WITH DENVER NORMS
(% Passing by Age)
Denver Norms
25%
5 0%
75%
90%
(% Passing by Age Groups)
Study Norms
3.5-4.0
4.1-4.5
4.6-5.0
5.1-5.5
Uses Plurals
Gives first & last name
Comprehends cold, tired,
hungry
Comprehends 3 prepositions
Recognizes 3 colors
Opposite analogies (2 of 3)
Defines 6 words (Denver
test)
Composition of shoe, spoon
door
3.4
3.9
3.2
4 . 8
4 . 9
3.2
3.2
3.8
3.5
4.1
3.4
4.5
3.7
4.9
4.8
5.3
6.1
6.3
5.7
6.3
II
87%
81 74 85 38 57
8* 0
90%
90 90 87 48 71 32*
5
90%
90 90 90 71*
83 33*
6
90%
90 90 90 81*
90 49 11*

TABLE V
Distribution of Children's Overall Rating for DDST
Category by Age Group (N=358) TOTAL
43-48 49-54 55-60 0/0 61-66
GROSS MOTOR
Normal 38 72 68 86 95 81 75 69 276 77
Questionable 15 28 10 13 21 18 31 28 77 22
Abnormal 0 0l 1 1 1 1 3 3 5 1
FINE MOTOR
Normal 35 66 55 70 88 75 90 83 268 75
Questionable 16 30 20 25 27 23 18 16 81 23
Abnormal 2 4 4 5 2 2 1 1 9 3
LANGUAGE
Normal 39 74 66 84 86 74 77 78 268 75
Questionable 13 25 11 14 27 23 30 20 81 23
Abnormal 1 1 2 2 4 3 2 2 9 3
The results were rated as "normal" - 22% as "question-
able"; 1% as "abnormal". The results of testing in Fine-Motor
Adaptive functioning show 75% of the children rated as "normal "
23% as "questionable"; 3% as "abnormal". Ratings of the child-
ren in Language functioning show that 75% were judged as "normal"
23% as "questionable" , 3',X, as "abnormal ".

-12-
Individual items were studied in order to assess the
relationship between performance on an item (pass, fail,
no response) and the total performance on the test (normal,
questionable, abnormal). In the Gross Motor section,
difficulty with balancing skills was noted in the study
population. Analysis of the items indicate that certain
failures represent a lag for the whole group. That is,
they do not discriminate "normal" children from "abnormal"
or "questionable" children. Failure to balance on one
foot for five and ten seconds appears to represent this
kind of group deficit. However, other item failures appear
to be highly discriminatory.
In the upper age group (5.1 to 5.5 years) failure to
catch a bounced ball or to do a "heel to toe" walk point
to individual rather than group deficits.
Analysis of results in the Fine Motor Adaptive category
Show that failures to "pick the longer line", "copy a cross"
and "copy a square" represent group lags for this population.
These items do not discriminate "normal" from "questionable"
or "abnormal" children. However, in the upper age group,
(5.1 to 5.5 years) "draw a man of six parts" was failed
more often by those judged "questionable" or "abnormal".
Thus, it emerged as a discriminatory item within the study
population.
Within the Language test category, the three test
items ("recognizes three colors", "defines six words",

-13-
"composition of shoe, spoon, door") which show age lags in
successful responses do not discriminate "normal" from
"questionable" or "abnormal" children.
As noted in Table VI, the children had experienced
varied lengths of time in the pre-school program. To
assess the relationship between test performance and
amount of time in the pre-school program, the data was
analyzed for the two upper age groups (55-60 months; 61-
66 months) who had been in the pre-school program from 6-12
months and 12-24 months. These categories show the largest
groupings within the total study population.
TABLE VI
Length of Time in Pre-School for each Age Group
Age Group of
Children (Ito.)
Length of Time in
Program in Months
36-42
43-48
49-54
55-60
61-66
Over 66
Totals
Percent
(373)
0-6 6-12 12-24 +24
8
10
7
11
6
0
42
11
3
38
65
66
60
3
235
63
1
1
4
38
41
0
85
23
0
4
3
2
2
0
11
3

-14-
The results show no significant relationships
between test responses and length of time in a pre-school
program. In the Gross Motor category, only 11% of the
children who had been in the program over one year show
improved responses as compared with the same age groups
in the program for less than one year. Findings were
similar in the area of Fine Motor Adaptive functioning
(10-19% improvement) for both age groups. In Language
functioning the results follow the same pattern (1-11%
improvement).
Analysis of the findings from the Behavioral Inventory
show that the children generally demonstrated age-appropriate
behavior during testing. In all categories of the inventory,
over 85% of the children showed positive test-related
actions in the testing situation.
Discussion of Results:
In general, the study children performed similarly
to the normative expectancies of the screening test. The
specific test items on which the study children performed
poorly suggest group developmental lags in a variety of
tasks. (Analysis of the items failed by the "normal",
"questionable" and "abnormal" children do not show a
consistent pattern of item failures). Analysis of the
items failed by the "questionable" children shows a con-
sistent pattern of failures in response to those tasks on

-15-
which group lags are found. The ratings of "abnormal"
were almost completely based upon a consistent pattern of
"refusals" to respond to the test items. These children's
behavior ratings in the test period reflected atypical
reactions to the total test situation. In age group 5.1-
5.5 months, the "questionable" and "abnormal' children
failed "Draw a man of six parts", "Catch a Bounced Ball"
and "Heel to Toe Walk" (Forward and Backward) more often
than do their "normal" peers.
In order to approach a meaningful understanding of
these findings, an examination of those test items on which
the study population show developmental lags, suggests
that the deficits cannot be attributed solely to cultural
deprivation. The response failures of the preschool population
suggest that other causative factors may account for the
developmental "lags".
In the Gross Motor functioning items, the children
experience difficulty in carrying out actions requiring
voluntary inhibition of motor behavior (e.g., "balance on
one foot", "Heel-Toe Walk"). Observation of older children
with neurological impairment indicates that these children
are deficient in their ability to exert voluntary control,2
As 22% of the study population were rated "questionable"
in Gross Motor functioning, it would be important to question
whether these early failures may be related to neurologically

-16-
based disabilities in individual children among the group.
In the present study, it would be difficult to explain
failures on these items on the basis of poor motivation to
perform. The children were no less interested in respond-
ing to these tasks than they were to other task requests.
'11 The Fine-Motor Adaptive items in which noticeable developmental
lags occur are tasks where the child is expected to reproduce
an accurate response to a stimulus (..g.,"Copies a Square",
"Copies a Cross"). Further, the deficit is apparent in the
examination task which is relatively unstructured, (e.g.,
Copies a square without demonstration). Observation of
school-age children with neurological impairment reveals
that deficits in perceptual functioning are apparent when
task demands are less defined. However, when the method
of task presentation is more structured, the deficits are
not observed. It is possible that among the pre-school
children who failed these items, a considerable number may
present with primary neurological dysfunction. The addit-
ional failures of children to "Draw a Man of six parts"
lends support to the possibility cf learning disorders among
the study children. Research evidence in studies of the
human figure drawings of middle-class Kindergarten children
suggests that the drawings are primarily related to maturation
rather than to school learning.9 Analysis of the drawing
productions of the study children similarly yield no differences
related to the amount of time in preschool programs.

-17-
Preliminary studies of the drawings of children within the
study population who were either in the "questionable" or
"abnormal" group in Fine-Motor Adaptive functioning, reveal
prominant malfunctioning in integrative capacity and
confusion in organizing concepts. Since the drawing test
was failed more often by the "questionable" and "abnormal"
group, performance on this test item may be considered of
diagnostic value in the early detection of children with
learning disabilities.
Since 23% of the children were "questionable" or
"abnormal" in Fine Motor Adaptive functioning, those child-
ren whose test results show deficiency in this category
should be considered for further examination to determine
whether learning disabilities are contributing to deficient
functioning and the slower rate of development.
From the findings, the only area in which there might
be ready acceptance of a socio-cultural based explanation
for lags in performance is in Language functioning. The
study children are slower in becoming familiar with colors
("recognizes 3 colors"). However, these children have
attended the pre-school programs for six months to two years
*The children's drawings have been grouped into categories:
"organic ", "emotional disturbance", "slow development".
Follow-up studies of these children completing first grade
will help to provide the information basic to early detection
of young children with learning disabilities.

-18-
and it woule, be reasonable to expect the educational program
to have had some further impact on their fund of information.
The reasons for this lag are unclear and require further
study.
TurnAng to an examination of the marked deficits
in defining words ("Defines six words"), it is apparent that
a number of words in this test item are unfamiliar to the
disadvantaged urban child. The specific words failed most
often were: "lake", "pavement", "hedge". Failure on these
words grew to be expected by the examiners because of the
prevalence of "I don't know" responses to them. In addition,
since eight word definitions comprise the test (with six
required for success), the child's failures on three words
equalled total failure on this language test item. Research
evidence suggests that low frequency words (those heard less
often) are poorly utilized by the disadvantaged child as
compared to the suburban child.4
In the screening test,
it is suggested that the following words be substituted in
testing disadvantages city children: "river", "sidewalk",
"bush ".
The test item "Composition of Shoe, Spoon, Door" was
almost completely beyond the understanding of the children.
When asked "What is a shoe made of?", the children's responses
*It-has been subsequently observed-that these substitutions
are readily understood and successfully defined by pre-
schoolers in the nursery programs.
19

-19-
reflect either unfamiliarity with properties of objects
or with the structure of the question. Common responses
were, "Mommy bought shoes for me", "Shoes are on my feet",
etc. These experiential associative responses suggest that
the child's subculture has not provided the auditory
experiences necessary for recognition of these concepts.*
*Subsequent use of this section of the DDST has shown that
restructuring of the question to "What is a show made out of?"
yields more frequent correct responses. This suggests that
the item is not appropriately structured. The interested reader
is referred to the works of Noam Chomsky, Laura Lee and others
in psycholinguistics.
2()

-20-
Conclusions
The present study points to the necessity for
developing preschool classes in which the educational
program is determined by the needs of the children it
serves. Through the use of a developmental screening test,
the possibility exists for early detection and remediation
of learning disorders among preschool children. The
impact of preschool urban programs could be increased
if the approach to curriculum were based on a re-evaluation
of the a priori hypothesis which assumes that Oeficient
functioning is only caused by cultural deprivation.
71
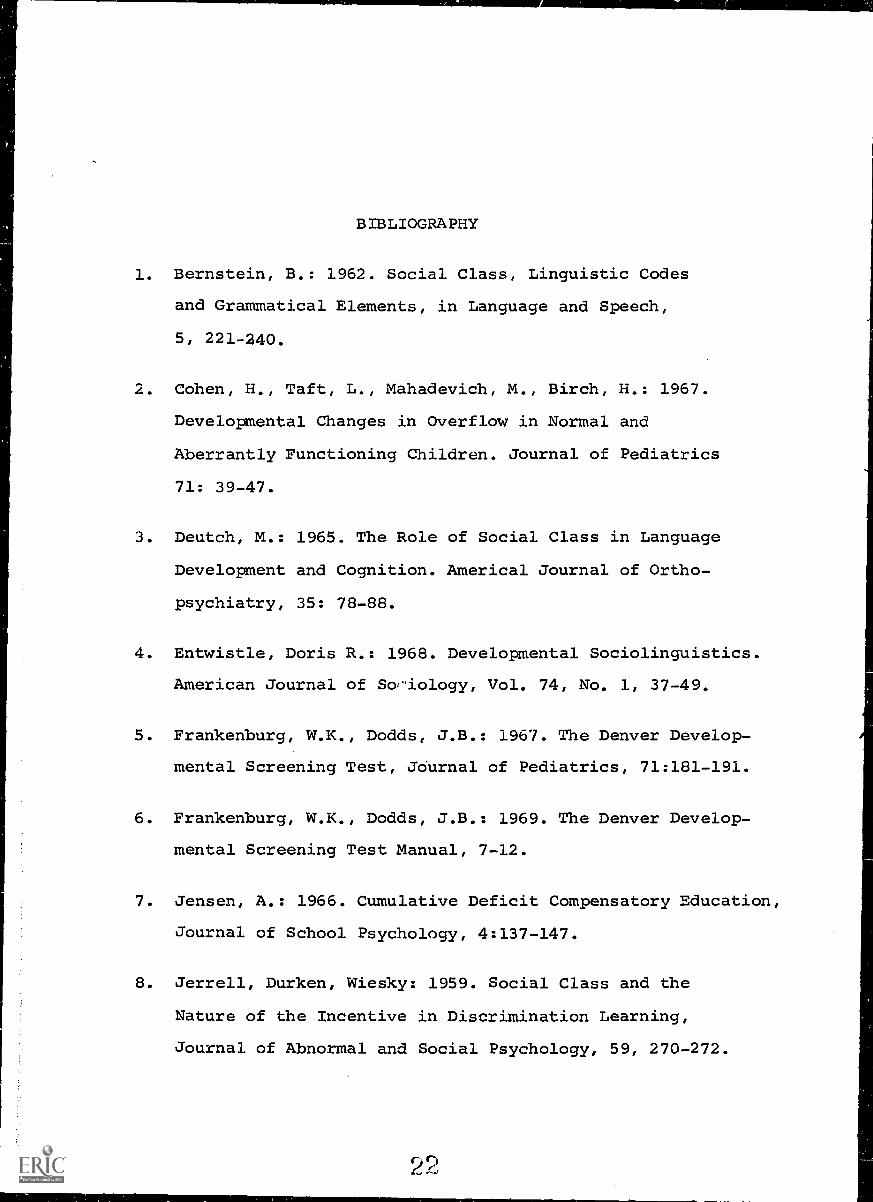
BIBLIOGRAPHY
1. Bernstein, B.: 1962. Social Class, Linguistic Codes
and Grammatical Elements, in Language and Speech,
5, 221-240.
2. Cohen, H., Taft, L., Mahadevich, M., Birch, H.: 1967.
Developmental Changes in Overflow in Normal and
Aberrantly Functioning Children. Journal of Pediatrics
71: 39-47.
3. Deutch, M.: 1965. The Role of Social Class in Language
Development and Cognition. Americal Journal of Ortho-
psychiatry, 35: 78-88.
4. Entwistle, Doris R.: 1968. Developmental Sociolinguistics.
American Journal of So,"iology, Vol. 74, No. 1, 37-49.
5. Frankenburg, W.K., Dodds, J.B.: 1967. The Denver Develop-
mental Screening Test, JOurnal of Pediatrics, 71:181-191.
6. Frankenburg, W.K., Dodds, J.B.: 1969. The Denver Develop-
mental Screening Test Manual, 7-12.
7. Jensen, A.: 1966. Cumulative Deficit Compensatory Education,
Journal of School Psychology, 4:137-147.
8. Jerrell, Durken, Wiesky: 1959. Social Class and the
Nature of the Incentive in Discrimination Learning,
Journal of Abnormal and Social Psychology, 59, 270-272.

BIBLIOGRAPHY (continued)
9. Koppitz, E.M.: 1968. Psychological Evaluations of
Children's Human Figure Drawings, Grune and Stratton,
New York.
10. Resnick, Robert J.: 1969. A Developmental and Socio-
economic Evaluation of Perceptual integration, in
Developmental Psychology, Vol. 1, No. 6, 691-696.
11. Ziegler, Edward, Butterfield, Earl C.: 1969.
Motivational Aspects of Changes in I.Q. Test Perform-
ance of Culturally Deprived Nursery School Children.
In Annual Progress in Child Psychiatry and Child
Development, Eds. Chess and Thomas.