document resume author .title institution … · author bowles, d9rothy, ed. ... ,reproductions...
TRANSCRIPT

DOCUMENT RESUME
ED 172 943 PS 010,698
. AUTHOR Bowles, D9rothy, Ed..TITLE .
Nutrition, Education in Wisconsin. Public Schools.-INSTITUTION Wisconsin .State Dept. of Public Instruction,
Madison.SPONS AGENCY.0
,
Food and Nutrition Service (DOA) ,liashfbgton, D.C.REPORT NO WWDPI,Bull-9258
2
PUB DATE, (771 t
NOTE bap.; Not available in pl,p2r copy Ndue to printquality
t. .
,_MFO1 Plus postago. ..PC Not Availabl7! from EDRS.Administrator Attitudes; *Food .Service; *Nutrition;*Ndtrition Instruction*Public Schbols; Research;School SUrveys State Survys; Student Attitudes;reacher 0es
IDENTIFIERS. Wisconsin. ,/'A
-*
EDRS PRICEDESCRIPTORS
ABSTRACT'
4jectives of th-is state survey of school focd1service progra ,,fin '.Wisconsin public schools focused on '(1) nutritioneducation in the''Achools, (2) students' food selPction practices, (3)
improving nutrition ,DducAtion'and (t) 2hcreasing awareness.'Ot.nutritional considerations. FOur questionnaires were administered-.tbstratified, randiky selected, zepresntativc- samples of food se(rvicemanagers,.principals, tc..ach?rs, and public elementary and secondaryschoolstudentS.;Pa,rt'I'introduces tke background and objectives ofthe study. Part II provides an overview. Part III rvykys selectedliterature::Part IV describes th7, mPthodology of the study. Part cr
fgiveS survey results. Food service managers' and supervisors' viewsabout student involvem,Lnt in lunch programs, principals' attitutt4s.And knowledge about nutrition- ,Aucation And teachers' views on
oving nutrition education. Student food intake patterns for sixspecific nutrients, influence of snack roods, and compariSons'of
patterns with weight were also reported. Data are presented in22 tables and 10 figures. y u stionnaires are appenAd. (Authcr/RH)
i************************4.*******************************.i.***********,ReproductIons supplied tly EDRS are.the best that ca.M.tir;.made
frcm theoriginal locumemt.***************************,********************************************

. :it . , 1
THIS DOCUMENT HAS, BEEN REPRO-
U.S. DO PANTMONT Of NIALTN.OUCEO EXACTL*Iftlr RECEIVES) FROM
NATIONAL INSTI OrISOUCATION
ODUCATI 'ATING,IT POINTS OF VIEW OR OPINIONS,STATEO 00 VOT NECESSARILY REPRE.
THE PE RSCtN OR ORGANIZATION ORIGIN-
SENT OFFICIAL NATIONAL.INSTITUTE OFEOUCATI POSITION OR.POLICV, IINutrition
...
Wiscopsin Pil .Choolt...... to? k . , , ,A
.....c.Wisconsin Department of Public Instruction / Barbara Thompson, Ph.D. State Superintendent'
. ,
es......___"PERMISSION TO REPRODUCE THIS.a
MATERIAL HAS BEEN GRANTED BY.WtSebnSin 1jt.
ItNiivu'EkIcn
TO THE EDUCATIONAL RESOURCESINFORMATION CENTER (ERIC)."
4

.
160 Sr
NUTRITION EDUCATION.in
WISCONSIN PUBLIG,SCHO & LS
1
..Wisconsin Food and Nutrition Se ice
Edward-J. Post, State Director
Rachel N. Nutter, Project Director
-
Wisconsin Department of Public In,'126 Langdon St., r atison, WI 53702
Barbara Thompson, Ph. ., &ate Superintendent
Funded by U.S. Department of Agriculture.Food and.NutiftionWashington; D.C. 20250
.
I Bulletin No..'N9258

Acknowl dgemThe Department of public Instruction
Wisconsin public schools o cooperated and pastudy a success: ,
\Special recognition is given to:
expresses ;appreciation- to the individuals iniciPated scillingly ;rid capably to make this
individuals in the'State Department of .PubliclUtilion who helped prepare the...proposal and the -talistical. samples required as well as provide time and e fort in
helping t e projec irector complete the project: Fredrick E. Menz,. PhD KarenBecklin, R bert Gomoll, PhD.
the following individuals who helped design the four questionnaires;
Susan Cassens, Nutrition Section, Health & Social Services
Eleanore Irwin, Nutrition Section,.Healthqnd_,Serial Servicest Edward j. Post, Food'& Nutrition Serviced, Department of Public Instruction .
Vane Voichick, Ph.D,, Department of Ntitrit'on S fence, University of -Wisconsin,
Madis4nTerry Williams, Nutrition Section, Health & Social Serbices
the pedons who helped to tabula-te and inter ret the data;
Dian;11;27iavannini, Bureau of Health Statistics, Health '& Social Services
EleOnore Irwin, Nutrition SectioiHealth.& Social.Services
Jane Voichick, Ph.D., Department of Nutrition Science, University pf ,Wisconsin,
Madison ,
and the persons responsible for the graphs and artwork; v.
Vicki. Fredrick, Management & Planning Services; DepartMent of Public Instruction.
.*s Dianne Giavannfrii. ItrrtrarreHealth Statistics, Health & Social Services
The weer desig-n uas adopted hV Vicki Fredrick from a poster created b a River;iide
Primary School elementary studcnt,.School District of MenoMonee Palls, /97-f.
recognition is als1 given to Dorothy Bowles, University mt. Wisconsin, Madison, Depart-
ment of .Journalism for editing this document.

...Acknowledgemrts
.List of Tables.. iv
List of Flgiirei3 vi
Table 'Of Contents-At
Page
Part I - Introduction,
Part fl! - Review of Selected Literature
. ,
Background of the Study - 1
Objectives of the Study , 2A
Part II .- Overview of thIStudy , ' 1
...-Part IV. Methodology is 9
Study Time ScheduleInstrumentationData Collection and Analysis
/ Part V - SurVaill,Results
Food Sei4ice Ma.pagers and Sppervisorse
Length of SerNice; Preparation for Position
-._
The Sample
Menu Planning iViews About Student Involvement in Lunch ProgramViews Compared with Principal's Concerning Lunch Program Ifi
(\.1
ti(10
10
10,
12
.12
12
1.2
1.1
Princip s /,__
`1,ttitudesKnowledge abouts.Nutrition EillationViews on Improvidg° NutMivn Educatio'n. .1 \ \
17
1.7
18
Teachersso,
Background, AttitudesResponsibpies in Nutrition t ducation.
19
19OpiniOns about Improving NOtrition Education 9.1
Student Food Habit Survey "9:3. I
Food Intake Pattern 4 for Six Spbcific Nutrients, Sat' facteiy Daily--N,ting Patterns
Eati Patternslor Regular MealsTyp4l Breakfast°, Lunch and Eveniiig MealInflu ce of Snack Foods
V
VBibliography
Appendix
Significance of Fortified and Enriched FoodsHeight and Weight AverageJvr Wisconsin ChildrenEating Patterns Compare td Weight
5
c
V.
- 94.29.3032:33
33.33
)639
litas)
,e

List of Tables
Page
Number of Years School Food .Service Managers and SupervisorsHaviWorked'in the Lunch Program f 12
. .
TABLE, 2:---\ Number and Per Cent of Preparation Courses Taken by Food
Service Personnel`Compared With Num' ber of YearS Worked in
. School Food Service , ,--' 13
Numlir of Different Main Dish Foods,and Finds of VegetablesServed1During September 1973 14
TABLE 4: InvolvtrzeInt of Studenti in the School Lunch Program As Seen By
k.4.....- .' i . co
-,,alters and Vaincipals 1
14
o
TA B/C7\5.: Length Of Student Lunch reriods in Wisconsin Schools AsN
' Reported By Students, Cc )k Managers' and Principals 15
;..TABLE 6: School Dining Environme t as Reportetr.By Students, Food ServiCe
..:_. ,Matiagers and Principals '.: ..,, : 15
,fABLE 7! ' \Relative Importance of R Asons for Having a Scholl Food Service,By,Cook Managers and Superison; (S). and Principals (P) 16
A
.
TABLE-8: Ranking of 4easosis for Having a Food Service Program, By CookManagers and Principals (1 Most Important) 16
TABLE 9: Summary-of Principals' Opinions on Including Nutrition in aComprehensive Health Education garriculunt 18-
TABLE 10: ' Summary Pr cipals' Opinion? an W er Or Not theDepartment of P blic Instruction Should Provide a CurriculumGuide for Teacher Use 18
--.
t'TABLE. 3:
, .
TABLE'll: Numbers of Teachers Emphasizing Selected Biological orrSOcial
Topics in Nutrition- Unit .-Ijs
TABLE 12.: Teachers' Opinions About Quality of Nutrition Textbooks or. ReferencA, by Grade Level 21--
f,. .
TABLE f3: Teachers by 'CLrade Levels Indicating "Most Successful" LearningActivities * 22
. .
TABLE 14: Students Who Ate Foods From the Milk Group at'Regular Mealsi
4, and Snacks i.. , 25
TABLE 15: Students With a Satisfactory Daily PAtern From Regular MealsOnly and RegularNeals Plus Snacks for Three Food Groups 30
tw
TABLE 16: ,StudeptsNot Eating Lunch, by Grade Level and Sex '31.
TABLE 17: Underweight, Normal, aild Overweight' Children, by Grade Level
and Sex4 .
, 36
TABLE' T8: Per Cents and Numbers of Principlls(by School Locatign andSchot(Organization) Sampled inTrinci.Ssimple 41
TABLE 19: - Per Cents and Numbers of Teachers (by Grade aril LocationSampled in Teacher Sample f 41

TABLE 20:
TABLE 21:
TABLE 22:
V
Numbers ofd Schools (by type and grade) and Students (withinschool types and grades) Sampled.in Student Sample 42
Desciption of Large, Medium, and Small School Sizes for Non-.Milwaukee Schools 42
Description of Schools and Student Population Breakdowns forMilwaukee and Non-Milwaukee Schools
, 44543
I'
r
4

FIGURE 1:
FIGURE 9
FIGURE 3:
FIGURE 4:
FIGURE
FIGURE
FIGURE 7;.
5:
6
IGURE,
8:
3 List of 'Figures
Page
.
Stratified' Random Sampling of Number.of StUdents 40
Average of Three Days' Responses,-Foods in Bread and Cereld
Group
'Average of ThAe Days' Responses-.--Foods in Vitimin C group-,
Average of Three Days' ResponsesNods in Vitamin A Group
Average of Three Days' ResponsesFoods Containing Iron
St dents ting No.Breakiast and Omitting Foods With Specific.
Nutrients From the Day's Food Intake (Regular Meals Only) 31
Students With Satisfactory Daily Pattern
26
26
28
29
30
StudentS Eating No Lunch and 9mittingTooth.With SpecificNutrients (Regular Meals Only)
FIGURE 9: Corripgison of Wisconsin -Iowa VVight Curves-
FIGURE 10: Comparison orWisconsin-Iowa Height Curves
32
34
-35
I

IntroductionThe psythological impingement of how a person
eats and is fed "has a larger impact on the personali-ty than any other human experience," according toBruno Bettelheirn, distinguished child psychologist."Eating experiences condition our entire attitude tothe world, _and again not so muoh because of hownutritious is the food we are given, bud, with whatfeelings and attitudes it is given. Around eating, forexample, attitudes are learned, or not learned, whichare the preconditions for all academic achievement,such as the ability to control oneself, to wail., to worknow for future rewards," Bettelheim writes.' The,majority of teachers, district and school adminis-trators, and school food ser;;ICIF personnel must heconvinced that a food program is.an int gral part of achild's education program. Only afte this fact . isaccepted are major changes likely to be made in massfeeding concepts and methods currently the rule inmany of the nation's schools.
Children are well aware of adult attitudes towardsschool lubch programs, which are generally set up torequire their conformity to certain adult standards ofbehavior, eating habits and food preferences. Manychildren do not Participate because they are requiredto accept, -and in some instances eat, all foodsprovided in the menus. If the conceptual approach.tonutrition education is to have a meaningful impactupon the students' actions and food selection pat-terns, all educators and school, food service personnelneed to modify present attitudes and standards:
4 4. . . Anytime we requi e students to learn what is
not seen by them to be of value or anytime we requirea single standard of behavior, in other words-when- .
ever we require conformity, we must rely on the useof extrinsl or external motivation. . ."3 If childrenare to act differently through intrinsic motivation inthe selection of more nqtritious foods as the result ofnutrition education, the lunchroom needs to beregarded by educators and school food service per-sonnel as an effective learning center or classroom.Students are. learning in the lunchrooms.each andevery day, but often they are not learning theattitudes and idea4--educators would wish to convey.*Foods prepared and served without consideration ofthe students' self-respect can poison young people's 'relationships to learning and the school.
SChool food service personnel need to be re-educated. They are often in a position to winparental and community supportls improve theeating environment if they realize that they do notneed to accept the status quo. The "self" concept ofschool lunch personnel needs to be changed. Short
1
courses and workshops for school food service Per-sonnel should be planned to produce intrinsic mo-tivation and to teach conceP)s which will preparethem for an active, involved role in nutrition educa-tion.
Before an effective nutrition education programcan be instigated, an . assessment of currentprocedures and attitudes is essential. his is one
Dpurpose of the study which follows, Data obtainedfrom questionnaires submitted' to principal~, teach-ers, school food service maRagers, and studentsprovide an insight into the sta(us of nutrition educa-tion in Wisconsin. Survey results will be used todevelop a plan to increase interest in teaching nutri-tion, with the ultimyte goal of improving the healthof Wisconsin school children. Survey results will notonly help to Create statewide interest in nutritioneducation but may well be used by other statesthroughout the country in developing similar nutri-tion education programs.
Background of the StudyA continuing prevalence of school food service
programs which ignore basic nutritional knowledgeand the eating habits and food preferences of in-volved students has been noted during supervisoryassistance visits to schools throughout Wisconsin.Nutrition education was a vital component of each ofthree short courses' planned for school food servicepersonnel in 1968. It .has been apparent that .theshort courses have not reached enough food serviceworkers (approximately 76 per year) to make effec-tive progress and desired changes in menu choicesand the quality of foods served to students in schoolsthroughout the State. It has also been apparent thatthe 'information provided in short courses for schoolpersonnel did not reach the othec school orientedpOpulations. School. (students and Acuity) and com-munity residents should also be provided with soundnutritional information if changes in eating habitsare to be effected.
Decisions to discontinue some lunch 'Programsrather than expand to meet the nutritional needs ofall of the studedts in the district, and increased lunch-charges to the students, further indicated that someadministrators, principals and teachers had no clearconception of the role the Type. A -Lunch Prograincould have in the school curriculum. To be effective,nutrition education must be provided all of theseschool populations.
An issue paper Nutrition Education in the Class-was developed and presented to the members of

a Strategic Planning Task Force, a committee com-posed of members of_ the Department of PublicInstruction; on March 26, 1970. The short termobjective of the paper was ',to point up the lack ofawareness, for the need for proper nutrition asevidenced by the increasing number of inadequatediets, by the- attitudes of many school boards thatlunch programs he self-supporting and by the in.fluence advertising has on shaping tlice eating habitsof -.the students. The issue paper'requested theformation of a seven-member task force committee to
consider the implications of classroom teaching ofnutrition and to make recommendations concerningthe development of nutrition education currictila forstudents at ,every grade level as well as for teacherswho wotild be responsible for nutrition instruction."
The Strategic Planning Task Force recommeyedthat the issue paper be referred- to an advisorycommittee formed to implement Assembly Bill 1068.
They indicated flIngness to remnsider the issueupon receipt of reactions and. recommendations fromthe 'advisory committee.' State Superintendent Wil-liam C. Kahl concurred with the Task Force sugges-tion and requested' the Advisory Paitel on CniticalHealth Problems in Education undetpie supervisionof Miss Luida Sanders assume the responsibility forstudying this issue. . . His letter stated, "My under-standing of the legislative mandate to your panel isthat .nutrition education is one of sevetal areas thatcomes within the broad category of health educa-tion."
Dr. George H. Handy, Secretary of the StateAdvisory ComprehensiVe Health Planning Council,in a letter to Superiztendent Kahl (August 25, 1970)recommended that top priority be given to providing"new and innovative methods.. . and effective edu-cational mechanisms which may be used to reach all.groups in the community concerning the need foradequate nutrition." Dr. Handy .further stated thatthe provision of fynds alone would not solve theproblem and suggested that education in nutrition,among other factors must be provided.
Twenty-faur members of an Advisory 'Panel. onCritical Health Problems in Education suggested bySuperintendent Kahl were selected by an ad hoccommittee to serve for one and two years beginningin November, 1970. The panel decided that therevised health education curriculum which wasplanned would answer the needs for nutrition educa-tion. Since that time, Wisconsin has joined Wash-ington and Oregon in preparing and field testing anew Health' Education Curriculum Guide which has'anutrition education component.
Interest in nutrition education by elementaryteachers and administrators in the Green Bay Dis-trict had communicated to the Chief, Nutrition
9
Section, DivisiNn of Health in 1970. A one-dayworkshop was planned which was cosponsored by thellniVersity of Wisconsin-Green Hay, the Green BayPublic School District, Green Hay Parochial Schoolsand District # -1, Division of Health. The purpose .ofthe workshop was to he explorittory, motivationaland intended to sensitize participants to nee in thearea of nutrition education. A second 'halms was toobtain feedback from the participants o what''guidance the Department of Public Instruction mightprovide in integrating nutrition . education in thecurriculum. It was the consensus of the planners thatthe results of this workshop would provide a basis for
either expanding the workshop' geographicallythr(Aghout the State, or- providing longer--workshopsor credit courses in nutrition echication for elemen-tary teachers.
The workshop was d on the University ofWisconsin-Green Hay, Deckn r Campus, on May 12,1971 with more than 50 representatives of the publicand parochial elementary teachers in attendance.The time frame planned for the workshop did notprovide adequate time to obtain the desired feedbackfrom the participants as to their future needs andhelp desired. An evaluation of the Workshop led theinplanners to conclude that other eads should hesought which would more quit ly provide neededinformation concerning the current status of nutri-tion education in Wisconsin public schools.
The possibility of o?taihing federal funds frOrdUSDA unde(Section 6 of the National School LunchAct,. as amended, led t. the development. of aprokosal which was submitted and received finalapproval by US* in January, 1973.
Objectives of the StudySpecific objectives for the study were:1. To obtain basic data on the attitudes acid
practices related to .nutrition education inWisconsin public schools as seen by school (a)attendance center principals, (b) teachers and
(c) food service supervisors and cookmanagers.To obtain crrent information about the footselection practices" of' Wisconsin public schoqstudents, kindergarten through twelfth grades.To`improve the nutrition educati7m provide(students in Wisconsin elementary and secondary schools.
4. To positively influence the interest in nutritioleducathm among all school.populations.
These objectives were to he attained by administering,questionnaires.to stratified, randomly selecteC
,representatiVe samples of three public school populE
lions-and all' cook-managers and district supervisor:
r0

Attendance center principals would be questioconcerning current nutrition education units tauin their schools and their perception of _need foimprovement. The attitudes, preparation, practiand opinions of teachers concerning nutritimi.adoea-tion woulcUae-solicited. The training and attitudes offood service managers and supervisors regarding
et"
r
their role in nutrition education would' be obtained-.The foOdselection,practiceS of public elemeni.iiry andsecondary school 'students . would be liscgrtainedthrough a three-day 24-Wur food recall-qaestion-
. naire. Co,pies of the fpUr questionnaires may be found,In the appebdix.
"t.
o

Overview of the StudyDuring October, Noyernber and December 1973,,a
statistically . re.presbntative 'structured randomsampling of .attendance centet principals, teachers,school food ;service managers and 'superv'isors, andstudents were surveyed to determine the currentstatusof nutrition education and the eating patternsof students in Wisconsin Public Schools. Returns of9e .per cent, (Vrincipal5), 96.7 per cent (cook-managers). 93 per 'cent (teachers) and approximate-ly 80 per cent .(students) were obtained. All four'survey instruments used the .op al seamier for'tabulation. of, results. No major ol400sition to thesurveys or problems in administration of the surveyswere encountered.- .
Analysis of data indicated a strongly felt need fornutrition education K -12.. Principals thought theWisconsin Department of 'Public Instructima shOuld
provide a nutrition education curriculum guide.Since 61 per cent of the teachers in the state wereresponsible for initiatiN' their aWn currictiltim, theneed for a usableguide was considered.of paramouptimportance. The majority (approximately 2/31 of theteachers' indicated a willingness to imprOve theirknowledge and teaching skills,in nutrition educationthrough )n- service meetings-,. .workshops ,or college*
credit courses. Only bf3" of the food supervisors and
.1
managers perceived their role.ns resource persons.forthe teachers in nutrition education units,
The .24-hour, three-day 6.foori.. recall surveyreinforced previous surycys,made in' other states.Man-y .tudents' eating pattern's did not containenough, foods' considered good or fair .sources ofproteip, iron, calcium 'and Vitamins A and C toprovide a satisfactory daily eating pattern for each ofthese..food groups. -Secimdary level students *exhib-ited .poorer' eating Patterns than did elethentarychildren! Girls, grades 10-12 consistently had the
-poorest eating patterns of both sexes and all agegroups. Of the students who took daily vitamin'supplements, 98 per cent- had a satisfactory dailyeating pattein without the supplements. Studentswho went Without breakfast did not tend,to make upthe iron, calcium and Vitamin. C in the -other two+meals and snack periods.
Height-weight means and standard . deyiationcurves were developed for Wisconsin children ages 5-18.. All data on under, normal.and overweight stu-
'dents .were ,cross tabulated 'by nutrient foci "groups,snack Ici'ocit, food supplements, -Satisfactory daily .patterns, etc. None of these -cross tabulations' pro-vided significant differences in eating patterns be-.tween under, normal and Overweight children.

Review of Selecied-LiteratureOnly a sample of the selected' studies which were
instrumental in the planning of the Wisconsin surveyare discussed below. Previous three-day dietary in-take patterns for large groups of students ye beenreported by investigators concerned with th nutri-tional adequacy of food patterns for students ofvarious ages.
The nutritional status of 1700; school children inthree North Central states was assessed by Eppright,et' al, (1955) in an effort to determine the effect ofparticipation in the school lunch program. Three-daydietary records were kept by students with hqlp fromparents and teachers and instructOkand-ptrvisionprovided by trained dietitians. Serving sizes weredescribed as accurately as possible. Aierage dailyintakes of the various fooA were tabulated by age,sex, -population group and participation i the TypeA school lunch. Many individual intakes ( VitaminsA and C and one or more other nutr ents werereported as being somewhat low.
Children whose mean daily nutrient intake con-formed to the recommended dietary allowances(RDA) averages froni 3 1/2 to 4 cups of milk, 1
serving of a food rich in Vitamin A, and 1 serving of afood rich in Vitamin C, 2 servings of meat or otherprotein foods and 5 1/2 servings of cereal foods.
Participation in the school lunch program tendedto reduce the frequency of low intakes of mostnutrients for boys and several nutrients for girls.These changes were especially notable for Vitamins Aand C and calcium. However, the milk intake for thenon-lunch girls was higher than for the girls who ateschool lunch.'
Edwards et al., (1965) reported data from ten percent of 6200 teen-age students who had filled out 24-hour food recall forms. Consumption of foods withinfood groups during meals and-snacks were gatheredand evaluated. in terms of grade, school and sex.Comparison between the 1964 RDA and nutrientintake estimated from servings of the food groups;meat, milk, bread and cereals, fruits and vegetablesrich in Vitamins A and C was made, with the studyindicating a trend for young adults to substitutesnack foods for meals missed during the day.'
Adelson (1968) had the responsibility for planningthe 1965 USDA household food consumption survey.She reported that 20 per 'cent of American householdmembers had "poor" diets and only 50 per cent had"good" diets. Diets which provided less than 2/3 ofthe allowance for one or more of the nutrientsstudied were rated "poor". Diets were rated "good"which met the RDA for protein, calcium, iron aridVitamin A, thiamin, riboflavin and ascorbic acid. The
changes in dietary levels were due p marily todecreased, consumption of milk and r ck products,and fruits and vegetPes rich in Vitamins A and C.
In the 'North Central region, which inclUdes Wis-consin, more diets were:rated poor'. in 1965thaii in1955 due to lower consumption levels of calcuim andVitamins A and CA3ublication of survey resultsindicated that 25 per cent of the diets in this regionhad less than 2/3 of the recommendation for VitaminA value. ApproxiMately 30 per cent of the diets in theNorth Central region had less than 2/3 of the RDAfor Vitamin C. If the 1968 RDA were used in place ofthe 1963 revisions, ten per cent more families wouldhave met the VitaMin C RDA while ten per cent ormore would have failed to meet the recommendationsfor iron and thiamin."
Lund and Burke reported the same dietary'deficiencies. For., Vitamins A and C, particularly; awide variability of intake was noted indicating thesenutrients were problems to a relatively large portionof the fourth grade children surveyed. The loW.intakes of these vitamins were -associated with lowconsumption of vitamin rich fruits and vegetables.Vitamin A was associated primarily with the moth-er's attitudes towards particular' fruits and vegetablesconsidered excellent sources or this vitamin. Childrenmost likely to use vitamin supplements were childrenwho already had adequate nutritional diet's,"
A report of Oklahoma food habits survey was madeby Dobbins (1970).Members of the School Lunchand Home Economics Divisions of the State Depart-ment of Education and staff from six state teachers'colleges, s ry yed approximatelyten thousand schoolchildren in 1966-67,The survey was made for.five agegroups in grades 1-12: Because of incomplete answerson questionnaires, results were reported for only 62
. per cent of the students surveyed, or approximately6,200 students. No mention was made of what grades
; or age groups were most affected by the 38 per centnot accepted. The sampling was not selected to herepresentative of the state student population or ofparticular grade level student populations. Resultswere possibly biased by teachers who announced thesurvey prior to its actual presentation. In theOklahoma study, therefore, children may have beeninfluenced in their responses.. When the number of servings of foods rePOrtedwere compared with the 1964 RDA, 40 per cent of allstudents consumed inadequate amounts of VitaminsA, C and calcium. Approximately 8.0 per cent consumed less than 1/3 of the RDA for Vitamin C. Theyoungest children consumed smaller amounts of allnutrients than older children.'
13

In October 1969, khe Massachusetts Department ofEducation, Bureau of Nytrition Education andSchool Food Services, conducted a statewide one-day'food intake survey of public school-children in grades1 -12. The survey results were reported by Callahan in197.1. The sample included each tenth school selectedfrom a list of public schoOls. Additional schools wereselected' to meet the economic parameters if thesurvey-objectives.
Survey questionnaires were . to. 272 schoolswith a total enrollment of W0,000 students.'Approxi-mately .80,000 fotfris were received from 234 -schools.
Only 54:000 forms from students grades 4-12 wereincluded in the schohl lunch survey; 50 per cent ofeach boys and girls. Approximately 44,000 students,had the Type A lunch available in their schools. Noclaim was made that tbe final sample was statisticallyrepresentative of the state public school populatiod.
Two new survey forms Were developed whichspeeded labulatisLof answers by processing thesheets through an optic`al scanner. An abbretiatee..instrument with hand drawn pictures ofsome of the
foods listed was,used for children in grades 1--3. Thiswas the first recorded attempt to obtain fund intakedata on a scanning form from primary school chil-dren. A, more detailed form was developed, for sin-
dents friar grades 4 -12.Training sessions were held in 1:1 areas of the state"
for teachers. health educators, principals and otherschool personnel who would be responsible for -ad-ministering the questionnaires. School lunch person-nel were nut involved in order to prevent any changes
of lunch menus which might affect results. Wiitteninstructihn sheets for teachers and students wereinchked with t he questionnaires.
One of the objectivesof the .surveV was to deter-.mine the extent to which students consumed foodswhich meet ale basic four recommendations_ Only 4;5
per cent of the children reportedeating the recom-mendcid four or more servings of fruit and vegetablesthe day of the survey. Of the students eating a TypeA lunch, 55 per cent met the recommended numberof servings ofthese foods. At all grade levels childrenparticipating in the Type A lunch had bet ter recordsfur both Vitamins A and . (' than, children whobrought lunches from home or INIught their lunChes
elsewhere. _ IroOn the day of the survey, only 53. per cent of the
children in grades 4-12 at a satisfactory lunch. Thecrityria of a satisfactory or good lunch wasthe Type AlunCh requirement.); of at least 2; ounces ofcooked meat or other protein such as cheese, eggs,Beans; :1/4 cull of fruit and/or veget.able; l lice
enriched bread; 1 teaspoon butter ur Margarine: 1/2pint of milk. Approximately 58 'per clinsof the boys-at the 10-12 grade level were eating a satisfactory
fi
J
'lunch compared .with only 47 per cent' of theFifteen per cent. of the girls and nine pei'cent of theboys at those grade levels dict not eat any lunch.
Of the almost 80,000 children surveyed, 24..per centdid not .eat an adequate. breakfast of ft-titlit...juice,cereal or protein "food, bread or equivalent, milk ormilk drink. 'Thirteen per cent' ate no breakfast theday of the survey. Of the junior high age childrenonly four per 'cent consumed a good breakfast.Among high school age children the . figure haddecreased to only three per cent' 5
The peed for inforriihtion rai the status of healthinstruction inthe nation's public schools promhted a'significant, well planned survey in 1961-63 which waS
directed by Elena Sliepcevich..A multistage, stratilied cluster Tcedure was devised. by the Research
,Division of the -National Education Association andused in selecting the samples. Public school systemswere grouped in four strata (large; medium,. small,very small) tccording to eqollme,t.
A sample of systems from eachrst tutn ith300 ormore sttedents was selected )j random procedure..The total sa `(135 school districts) consisted .)f12 large, 23 m um .and 100 small systems,A clusterdesign samplit , of .chisses of students (6th, 9th and12th grade), comprised the second phmie of the study.Participating School systems were asked to select atrandom three c:isse`i from each grade level. Approxi-mately 94 per cent of the systems returned cof feted
responses for the first phase and 91 per cent anper cent respectively of systems with elementary andsecondary graaes Participating in the second phase of
t he study. :I,Twelfth .0tak students- greatest knowledge .
deficiencies were in health areas concerned withnutrition, community health and consumer. health.Nutrition ranked lowest in the percentage of correctresponses of 12 health content areas. Food andnatritiolewa:; one .4 only five health topics (Out ofsome.30 different topics) emphasized by a majorityof all district sizes in every grade from K-12. Weightcontrol Alas one of the additional topics- introducedby a majority of the districts in the 10th grade andcontinued' for emphasis through the two remaining
years of high school.The ninth grade Health Behavior InventOry was
subdivided into topics whichtere intended to mea-sure knowledge, attitudes and practices. While ap-proximately 75 per cent, of the nutrition questionswere answered.. correctly, the students scored almost
twice as high on questions related to nutrition, healthknowledge and attitudes as they did on those con-cerned with nutrition health practices..
From the Scl u1 Health Education Studies
(SHES), Sliepcevic nd .co-workers developed a
14.

conceptual approach'to health and nutrition educa-tion as the means of making the-subject matter moreeffective in the lives of the students. The modeldeveloped first a general conceptual definition ofhealth. Three key concepts (growing and developing,interaetin and decision-making) which exemplifythe processes of health and serve to unify the K-12health curriculum were the second level of the model.75te third level cons ted of ten concepts whichrepresented the major organizing curriculum ele-ments and reflected. the scope of.healfh education.RIOM these concepts the fourth level./ served tosupport the ideas of the ten concepts in threedimensionsphysical, mental and social. The con-cepts were indicators of what is to be learned.
Long range goals' which reflect what should beexpected of the student after experiencing ther con-
- ceptual approach to health education were alsodveloped for each supporting or subcozept. Thegoals Vaie.e stated for three domains: Cognitive orintellectual sVls and abilities, affective which stress'an emotional tone or feeling or a degree of acceptanceand rejection; and action or personal behavior."
This conceptual approach is reported because thesame model has been used in developing teach-inglearning guides for L -12 in nutrition educationfor USDA. In fact, the SHES was used as the basisfor the guides. Similar nutrition- education guideswere developed in the state of New York."
Investigators for the Wisc-Onsin study kre espe-cially interested in the SHES survey because:
1. The relatively small sampling of large popula-tions produced sighificatt results which wererepresentative of the total population.
2. The methods employed in the survey resultedan extremely good return of survey forms
(from 90 to 96 per cent).3. Several populations of the public school system
were tested, namely, superintendents, teachers. and students.
4. Survey results have been well written andreported_
5. New concepts and teaching approaches whichwill have far reaching effects op nutritional
*education were developed as a result of thesurvey.
Hampton and Huenemann et al., reported littlerelationship between the questionnaire responses oftheir subjects and their actual eating practices. Therewas also no correlation betw- een the students' gradepoint averages and the quality of their diets asmeasured- by the number of nutrients which fellbelow 2/3 of the RDA. The need for improved, moreeffeCtive 'nutrition education was stressed:2
Schubert reported on the effect of an effectivehealth and nutrition program developed by the
Superineendept of Schools in -San DiegT,, Teias.A \'erage daily attendance in school has increased tomore than 95 per cent;. school drop-out rates havedecreased to less than ten per year; discipline prob-lems are negligible, vandalisMi. doesn't exist and fewgrade failures due to lack of interest or ill health havebeen recorded."
The Texas comnunity was included in a ten-statecomprehenskve . health,. and nutrition survey. Noschool-aged child had low hemoglobin levels. Nonewere low'or deficient in serum Vitamin C and only sixper cent were low or deficient in. plasma,Vitamin A.Their teeth weilTdescribed as the best examined inthe survey of.phe entire state. The health andnutrition program was ,designed to carry over to the
.4adult population."O'Farrell in 1971 repOrted the results of a survey
project developed as a result of the analysis ofnutrition education data from a nationwide sampling(t opinions from state schoOl food service directors,nutritionists, food service supervisors- and homeeconomists. A structured questionnaire wag mailed to851 public school principals, teachers and school food'service superVisors: Some 561 (65.2`'i, ) complaktdquestionnaires were returned. The sample was ,sys-tematically, not randomly selected and was not,therefore; necessarily representative.of the total statepopulation of these.groups. No attempt was' made toascertain froM. the teachers; actual subject mattercontent, methods or resource material); and personsused in nutrition education. The questions asked foropinions and attitudes rather than facts.
The need for Improved instruction, materials,methods and concepts and teacher .preparation wasevident. from the respondents' comments ari'd ex-presSedopinions. A nutrition educationsupervisor tocoordinate nutrition education with other subjectswas deemed feasible only by the food seryice superVi-sors."
Food service programs were not considered as aninstructional resource for nutrition education.Garvue-et *al.; reasoned that because increasinglylarger numbers of community citizens participate inschool Oriented functions, the school is unequaled asthe institution through which every individual couldreceive the nutritional resources needed to achieveoptimum health to which he is entitled. In Florida,.less than 15 per cent of the principals and teachers;and only 34 per cent of the food service supervisorssurveyed considered the school lunch programlearning laboratory for nutrition education.
Lack of parental support for nutrition educati nwas considered more a result of unawareness () heneed for their concerned support 'rather than con-scious non-support. The rnajprity of the responthought parents Should be involved through 'special
15

;classes' and community activities. Survey resultsdicated- that nutrition educkirin should bein-
cluded at all grade levels and that if food servicesupervisors.;are to he considered as "resource per-
4
rit
4
4
sons" for nutrition education, they must be recog-nized as anintegral part tif the instructional programn.oltri-the inceation of any curriculum development.'°
8:
I
, 1.
f.

MethoocologyPuOic schoot c dren f mprisa a, large ...aeginertt
(approximately one million) of the total stare popu-lation obi Wisconsin. Intrrinsicalt, involved wall- thestudents are teachlts, school food, service .personnel
((and school administratpr's---logical, practical populd---) tion groups from vvhich,to obtairrdara concerning the
current status of. nutritiv-education in Wisconsin.Four survey insirujnen,&ere deVeloped, and ad-ministered. to the four population irckups; during- I I:October and November' .973.,Thelour instrument'swere designed td facilitate completion without train-'
sessions for the peisoris involved.- .
The student's 24-hpur food. recall. .farms Weredesigied to assess eating patterns. The investigatorspf this survey developed an instrument which didpotattempt to list 'allivfoods Which -might have. beenconsumed by the respondents. Rat*, foods werelisted which vre considelledrgoodzorfacir.sourcerofparticular nutrients; calcium- andVitamins A. and C. Proteins and snack foods wereincluded as essential in assessing eating patterns.Data was to be analyzed in terms of the four foodgroups and the number 'of students who ate whatcould be considered a "satisfactory daily pattertk" of`foods. Only data concerning the number of . timesfood was eaten was considered necessary, thuseliminating the r ording and analyzing of amountsof foods consumed ttempt was made to comparethe intake patterns o various foods with recom-mended daily dietary owances. These considera-tions made possible the development of an instru-ment easy to read and complete in approximately 20minutes.minutes. -Detailed written, instructions were sent toeach principal Of selected schools. Tkeprincipal teas asked 'to select a responsible adultinterested in nutrition to administer the sUrvey..Funds were budgeted tcrPay for this service. Theadult should have good rapport with and u erstandyoung children because he or she was requi d to fillout the survey instruments for the child re K -3.School food service personnel wee not inv4ved ornotified ns to the time and duration of the survey inorder to prevent changes or additions to the menus:
Survey fbrms were pre-coded to eliminate errors&which might prevent the forms from being 'used intabulating results. For ease in disseminating teacherand student instruments, the names of personsselected were written in pencil on each form. Theywere informed that the names could be erased beforereturning them because the optical scanner wouldpick up only,the coded number. Student forms werecolor coded for each of the three days by ordering theforms printed with different colors of inkblue for
\ .
.Tuesday, red for. Wednesday ati,d,browli.P6r, Thurs-)
,Ch il 4'day....411.,,,,survey instruments use...: the op, ea scanner/, .,for tabulating results on tapesandi,,the,,
, .. -__.... ,, ., Siter for--"a'nalys"ls of data. ,. , -..,
I'. Miter two 'teed pencils were pu i d anddistrittu a eihthe fitst twp-clays fa dnsed by .,
therespi,sid,ents. for a kink the survey. she,e1s; J __;)
'Ale use (#1'-a small. representatit'ie .sample of an-entire 'stfte public school population saved money:for printed caletlonnaires, for tabulation and analy----,sir of data and salarjts of persopnel 4o admire thIvey: It. also sisnplified the ladministiati4 of thsurvey and- provided trategies for',' conducting
,projettS which roula be diplicated in.other states.Several aspects. of the project Alere unique in .,
*so
Wisconsin. For the first time a statistical representa-tive random sample of the' stile's public school,children, grades K:12 was 'used for-a three-day, 24-hour food recall study: For the first time. representa-tive selected' popUlOrlins of teachers and Principals!)were quested concerning nutrition edtication ,intheir schools. All school food ervice.. supervisorspaiticipated in the study.
# .
The Sample t.
Fro,tri the Department of Public Instruction DataProcessing .Division- computer` printout lists of all2,340 public school buildings in Wisconsin wereobtained. The lists were organized in columns andranked according to the distribirpion of sizes of rinstitutions with students represented in four gradelevel categories (K-3, 4-6, 7-.9 and 10-12). Thecolumns were blocked off in terms of school size (e.g.,large,1medium and small) as determined try. studentenrollinent. Because of its site, Milwaukee was sam-
- pled separately.
rI N
Schools weresize and four graderandom numbers. S
r
ected of the three schoolate ory \cks by using a table ofho w re essentially reordered
. in likelihood of sa piing ac ording- to the set ornumbers selected. Numbers' in, the set were chosenwithout replacement as to hatie exhau'Sted setof numbers b een I and n, For example,' if n = .15and the ran y ordered set oft numbers were (9, 4,2, I, 12, 10, 3, 7, 14, 5, 6, II, , then the largestschool in block A, B, would be ;selected fourth,whereas the ninth largest would he the first to beselected; etc. The,procedure was followed for each,ofthe identified blocks in stddent selection..
The number of schools to be selected from a givenblock was based upon. the total number of schoolswithin the grade category. A., proportionate balance
17

Wasscho dusk.% was then a function of its order in
the random set, the proportion of schools alreadyincluded- and the relationship Between the. totalnumber of subjects in that block and the maximumof 275 for any block.
esio
FIGURE h STRATIFY Ep RANDOMSAMPLING OF NUMBER OFSTUDENTS.
A444,
retained from eachl school size block: Each grades. The name ere alphabetically listed andnumbered _from 1 Eta n,. A table of randonv-numbers
as used to select the teachers. If a school_ had lessthan the number of teachers teaching. the respectiv9grade level or courses, all teachers were surveyed. If
P'''the number ve tthx; was at least 2 x n, anadditional tiacher lected. In secondary schools,teachers were selected from among the faculty whotaught home economics, ,health and -phxsiCal educa-
Schcl Size K-3 14-6 4 719 10-12
Jake 25 .18 71 79
Medium. 11 8 25 29
Small 4 6 1 8 11
Milw, 20 14 44 . 44*
Once the total' number of schools had been selectedfor each block, the-numbers of studeqts to be testedwithin each school becamt a function of the ratio ofthe school's number of students within. the gradecategory to the total number of students in all
schools selected in that' grade icat4ocif, times themaximum sample size for that block. Rosters wererequested and received from each selected school andall students were arranged in an 'alphabetical order-ing across grades within-- the category. A simplerandom sample of the size already determined wasmade, again using the 'table of random numbers. Oneand one -half times as many students were selectectaswere actually needed 'as alternative for tit -fullsample. Thus, if studen4 were absent one of more or
the three days, replacements or extra test days wouldnot be necessa6/ -to prdvide needed data. Tables 18through 22 in the appendix present the sampling'data used for the study.
Three hundred and eight schools in 185 districtswere selected. Seventeen schools in- seven districts(5.4 per cent), of sampled students did not partici-pate in the National Schott' Lunch Program. Onlyone district refused to participate after the selectionprocess was completed. One unified high schoolselected district did not participate ecause classschedules made it impossible to do s within thefumble, parameters of the project. Eig 'districtsinvolving nine schools and 156 student. did notcomplete the survey' within the time fra e Of the
project and were not included in the results. Fourselected schools were closed the year of the project.They inclkided only 15 selected children.
TeachersThe' teachers' sample was selected from the same
school as were the students..,Principals were agked tosubmit teacher's names for the student selected
10
tion, science art social studies.
Principals ,Selection of principals was-compeer print-out of s
ccomplishebuildin
according' to students in grades K -6, middle school,..13.intdr high scjlool, six-year secondary, four-yearsecondary and-three-year secondary. Each of thesegroups were numbered from 1 to n,. A table ofraridom numbers Was' used to select mach buildingprincipal until the number in each category had been.selected.
Food -rvice SupervisOrsThe entire population of School Food Service
Managers andAtIopervisors was included.in the sur-vey.
i by using as arranged
Study Time ScheduleDistrict administrators were notified of the project
with a letter dated-September 5, 1973: A copy may be
found in the appendix. Principals of buildings fromwhich students and teachers were 'selected receivednotice at the same time.- Principal questionnaireswere mailed October 3, 1973. Student and 'teacherquestionnaires with code numbers and namesrecorded on each were mailed October 29 throughNovember 5, 1973. Food, supervisors' questionnaires
,were mailed November 5, 1973. The student ques-tionnaires were to he administered on a Tuesday,Wednesday and Thursday prior to ThanksgivingWeek. With very few exceptions this schedule wasaccomplished and the forms returned to the projectdirector the first week in Dec9raber.
All questionnaires were submitted for optical scan-ning and computer analysis prior to the Christmasholidays. computer print-outs of data analysis wereready for;tabolation and interpretation by March,1374.
In rumentationSurvey instruments t were pre-tested in various
schools throughout the state in,April and May 173.School districts which had"-several schools selectedwere visited personally by the projectAlirector prior.to mailing any infoimation or cover letters.- The
38

-purpose and requirements of the surveys were ex-plained to the district administratqr and his supportof the projecf was solicited and obtained._ Withoutexception, the districts thus *site cooperated fullyin the project. When pOssible isconsIn Daionof Heald' area'nutrition consultant made the visitswith tyre pt.oject director. In. ii., memo tei primiipals of ,serected schools the area nutritionist's _came and.phone 'number were itovided. as. the loaf contact
6 person. During tkielarly 'phasel'of the prbject thesearea nutpjonists werepiost cooperative in answeringquestion's. fn some instances,) they met with theindividuals hired to-Mtninister-the children's*
,-survey
to 4xplaig theinrole in the project. itInstructions. for administering and retur igg the
instrumentslor data processing, forinsjfof recordink , ,expenses to be billed to the project and cover letter5,:,*ere piepared prior`to the beginning of the 1973 -7(,school year. Schools and principials were selected asdescribed in the 'sampling procedure.
As soon as schools had completed their new "ocrosters, superintendents and pyinci s were In-rfbrmed of the proposed surt,e3Z (S e letrkrs, ap-pendix). Letter%were sent to district administratotsat least one month prior to the survey ii-) order toobtain school board approval if.necessary. A saletter for paontal approval was sent to the principalsof the schools selected. They were asked to submitclass roster/ of thLgrades from which studentrespondents would, be chosen. The rostersi werecombined across grade levels by listing children'ssurnames alphabetically. In large elementary school's:there were as many as 17 classes. of third gradepupils, etc. The alphabetized lists were numberedfrom 1 to n, and students selected by using a table ofrandom tumbers. The lists of students selected weretypefAind a-copy sent to the school witn'he studentquestionnaires. Teachers were selected from thesame schools in like manner.
Student and teacher numbers and names anddistrict and school numbers were recorded on eachinstrument before .mailine them tohe principals. Aform for recording expense's connected with ,the
"survey and stamped, addressed envelopes weremailed with the questionnaires. As each set of ques-tionnaires was mailed, the date was recorded on the
lV
master list. As returned instruments were prrocessed'and cheiiited- by theproject"director the date receivedwas recorded. .., .
Because of the sigh rate, of response on each survey.,.very.li(tle follow-up effort was Considered necessary,contact Ale made With ea few of the principals-which resulted in queitionnaires ine rdailed asecond time. V y .few problents were -noted during
period.period. Some secon y school,principalswere conce*ed because' even tl ough 'selected, stu-dent's %,/re-grahted elease time f m classes inirriedi- '
'4.- ately foll4Wing the r lunch pero
d,*som studentsrefuSed, to "complete .the questionnaires the secondand ithird days: ,..a,Data4collection and Analysis
4
As, thie completed instrliments were received, the'forins ;,,jerels,hecked and edited and if necessarPheld ..until infthmation whic"b was not completed coneerr;-' '-__ing the respondents age, hsjght, and welgilt and gradeWas obtained 'fropi the school. All instruments weresubrinyted,,to the university"based firm which hadcontricted to perform the collection and analysis ofdata: Student laboi was used in coding the forms. A A.graduate studept teacher in computer prog,rammingtabulated the data through the. university computerduring gkerally unused night-time hours. ,
e For-each questionnaire a list of information, statis-tical' tests and correlations was prepared fth >the"computer prograinmer pripr to starting the surveyS.Only for the student food habit survey were addi- ,tional,prreorganization of date required.
All forms ,vere processed through an oRt. icai scan-ner which recorded responses on tape. Beluse of thecare used by respondents in completing the instru-
,...ments very few were discarded because of incompleteinformation. The tapes were then programmedthrqugh the. computer and print-out data sheetsprovided to the project director. Analysis of data forthe- four surveys was accomplished with extensivehelp from a nutritionist fro Health and SocialServices, an assistant nutriti& professor from theUniversity of Wisconsin and several persons hired toanalyze-and tabulate the data.
1

.
A
-Survey ResultsFood Managers a d Superviisois
Questionnaireepe completed and Warned by969 cook-managers and supervisorS, represtntin_ g 96
per cent of the total population. FiloWthisiseimentof the .Su lit y, data was gathered concerning,,thelength of s vice and prepariation for employment,types.of menus offered in the schoolltnch programs,st dent, involvement inibe program, and. attitudes of
anagers concerning their role insommunity educa-, tioriAbout nutrition. '
Lenkth of Service and Preparation for PositionThe majority (67.7 per centr' of food service"
managers and supervisors have worked in tige schoollunch plogram for eight or more years (see Tahle-1) .
With f'M exceptions, thetse people live in the corn-.--ffiunities where they work.
TABLE I: NUMBED OF YEARS SCHOOL,FOOD SERVICE MANAGERS ANDSUPERVISORS HAVE WORKED INTIDE LUNCH PROGRAM..
Nears Number r Cent
0-2 years 6:1 6.5
.3-5 years 124 19.8
6-7 years 119 19.3
8 Or more 656 67.7
Other 0.7
NPotals 969 100
Until ,the last decade, very few districts had jobrequirements whiCh. involved special, education orwork skills for food service positi)ms. In 1968, underthe direction of Mr. Gordon. Crunderson, tVo staffrhernbers in the Food and Nutrition Services incooperation with .staff members of the University ofWisconsin Extension Division, produced three shortcourses for school food service personnel manage-ment 'development. These courses were taught inseveral' geographical areas of die state in .order tomake them as convenierit as possible for toattend. From 35-40 hours of instructions were pro-vided in eachiorfEie. a-levels-of managem,ent clevelpp-
ment.Overall objectives of the course's werethe deFel--
oprrient of food service managers who. should be
qualified to: 44110
serve nutritionally adequate attractive, ac-ceptable and moderately priced Type A meals.
2. recognize and prilmote.sChbol foid service as- .
19
an opportunity to_ pr4ide childien With learn-ing experiences in nutrition.'demon'strate respon'tbilitl for the manage-ment of the school food service prarani s.communicate effectively with students, faculty,
6 encl/a-rents coverning variousAspects oftheschool food 84p me.
5. demonstrate an understanding of trends and Cvrobiems in scnoollood services. .
6. 4understand and apply basic pipciples,procedures and prfcaotiont necessary toproduce qualitS, fodd in a safe and sanitarymanner.
When the short courses were started, .some 4,600
persons were employed in food service in publicelementary 1h. d secondary schools in Wisconsin. Thefirst level short course was Planned for albqktille§efood service.peiAonnel.
In 1969 the responsibility for teaching this 'coursewas presented to the state vocational school programstaff. Since 1970, it ha% been taught as requests anadeby personnel in the various vocational districts werereceived within the vocational districts. _
The other two shortcourses were planned for cook-managers and district supervisors. Originally known'as the "intermediate" and "advanciletl" short courses,they contained some course content which was simi-lar toopurse I because participants were norequir-ed to complete Course before registering for theother management development courses.
Th4se two courses were taught throughout. thestate until 1973: The ormatliwas changed sq that onecourse need noCbe aken before .the other. All foodrelated manageme t -functions were grouped in
Course "A" and the ther food services managementskills were provided for in Course "B". The .twq,courses have beerroffered each June on three Univer-sity of Wisconsin campuses: Stout, Stevens Point andMadison since 1973. Four hundred and forty cook-managers- .and supervisors have taken these, twocourses. the 1975-76 school year 437 non-public school lunch program schools were added tothe roster of public schools under the supervision ofthe Food and Nutrition Services._ If schools are toeffectively meet the challenges.presented in nutritioneducation, better participation in continuing educe.:
tivn courses for, food service personnel.seems naes-sary.",
Other courses of interest to food service personnel
are avadahle in Wisconsin. Each year the WisconsinSchool Mood Service Association condUcts a state;wide workshop or convention of from two to three

o
days, during which many classes and training ses-sions are offered, The Univefsity of Wisconsin sys-tem fills offered' courses of interest to food serviceworkers, Approximately 78 school food service-managers and superviSors have attended theseclasses.
'Since 1973, supervisory assistance visits of schoolfood service programs wibhin a given geographicalarea have been followed by a worlishop.conduCted bythe state supervisors for the section of Food andNutrition Servicei of the Department of PublicInstruction. However, these workshops had not beenoffered in nine areas of state, includingMilwaukee, at the time of this survey.
Table 2 shows the extent of participation in thevarious .Preparation courses for school focid servicepersonnel and the length of service of participants. Asingle respondent may have taken more than onecourse.
TABLE 2: NUMBER AND PER CENT OFPREPARATION COURSES TAKENBY FOOD SERVICE PERSONNELCOMPARED WITH NUMBER OF
ARS WORKED IN SCHOOLD SERVICE
P eparationurse.
On the jo training
Short Course)
Interm4disit'StiortCourse
AdvancedShortcourse
WSFSA Workshops
DPI Woricshops.
College Course orWorkshop
Nutrition Education NCourse
Other
N%
N%
N4
%
NAO
N%N
<;;)
N
Total Numbers
Number of Years in-School Food Services
0-2 3-5 6-7- 8 or Totalmore
46 95 93 468 702.6.6 13.5 13.2. 66.7 100
5 31 41 254 3311.5 .9A 12A 76.7 100,.21.0
115.
2211.3
..,16082.1
195100
9 9 96 114..7.9 7.9 84.2 100
4 .24. 38 311 3771.0 6.4 '10.1 82.5 100
3 16 .32 205 2561.2 6.2 80.1 100,
5 7 5 61 786.4 9.0 6.4 7'8.2 10016 31 40 20 33()
4.9 9.4 1.1 73.6. 1009 7 11 48 \ 75
12.0 9.3 14.7 64.0 \100
90 .231 291 1846 248
,41
No correlation was found between the number of,years worked in school food service and whether or \
not thp respondent was a cook-manager or districtfood supervisor. Approximately 75 per cent of thetraining and educational courses were taken bymanagers -who have Worked eight years or longer inthe food service,program. However, the length ofservice indicated total years of food service employ-ment and not the number of years in a supervisorycapacity. Districts have customarily promoted fromamong their own staff: No cook-manager who hadworked two years or less had taken the advancedshort course and only two had taken the intermediatecourse. Supervisorypersonnel have indicated in per-sonal contacts with the project director, that theyneeded time to become accustomed to their positionsbefore they-felt confident/enough to take the course.After analyzing- data, the investigator concluded thatthere is a need for more continuing education,enrichment programs, inservice meetings and othermeans of improving skills and knowledge of schoolfood service personnel, which would be availableimmediately upon their promotion to or being hiredin a supervisory capacity.
Of questionnaire respondents,- 34.1 per cent `rtb.ported-having taken short Course I; 20.1 per cent, theintermediate short course; 11.8 per cent, the advanced-short courses; 38.9 per cent had attendedWSFSA workshops and 26.6 per cent, DPI work-shops: Of the to21 respondents, 330 or 34 per centreported having %ken a course in nutrition. educa-tion. Of this number, 243 or 73.6 per-cent had workedeight years or more. Using the chi square test,investigators noted significant Correlation betweenthe courses taken in preparation for the managerialposition- and; the number of years worked in schoolfood service. Fourteen.home economics teachers wereused in various districts to either supervise, prepareor review lunch prograna '-menus. None of theseteachers had taken any of the training courses.
The director of this. study is convinced that inorder to make real progress in improving the educa-tion and skills of school food service personnel, theyshould be included in certain school inservice meet-ings with teachers as part of the total educationalteam. Additional separate inservice training pro-giams should be planned and provided for foodservice workers within the district or school as an aidto improving the knowledge, skills, image and educa-tional concepts of such personnel: If food serviceworkers hesitate to leave their geographic area toimprove their knowledge and \skills, an inserviceprogram seems the most feasible way of meeting theirneeds for continuing education. Informationgathered in this study augments other evidence thatnew and more effective training and education pro-grams are essential for school food serviceeMpli)yees.17 IS 23 27 31 32

Menu PlanningPertons res onsible fir.. planning school lunch
menus" inNkiiconsin public schools inekide cook-
manageis, 628 (64.8 pftecerit)7,-AsIde4 supervisors,4' 352 (36.3 per cent) ; ancrhotneeconofietp teachers, 14
(1.4 per cent) . This tA,ats'25 more ti-rtif.tre 969 total.respondents beeatAVsoine indiviaykyinade morethan one -responge since in-swe districts the menusare prepared jointly by the distrieCt supervisor andthe- cook7Manager (s) . In* some districts the homeeconomies teachers review The menus prepared bycOok-managers.
No significant 'correlation was found 'between the.person (s) responsible, for menu planning and thenumber of main dish' fbods or thenurriber of differentvegetables used-in menus.
The number of Main dish fOods and number ofdifferent vegetables served. during September is
shown in Table Sbme schools served lunch 19 daysduring the month, whereas others served 15 days,depending, on the starting date for the schoolcalendar that year.
TABLE 3: WUMBER OF DIFFERENT MAINDISH FOODS AND KINDS OFVEGETABLES SERVED DURINGSEPTEMBER 1973
Main dishfoods
Number ofrespondents
Kinds ofvegetables
0-5 5 3 . - 0-36-10 36 54 4.7
11-15 289. 263 8-11
16-20 511 354 12-15
20 or more 120 290 16 or more
Totals 961 96441
There was a highly significant correlation betweenthe !turn ber of main dish foods Included in the menusand the number of different vegetables used. SUPer-visors or managers who planned larger varieties . ofmain dish foods als6 planned a greater assortment ofvegetables. When this data was compared with thatconcerning the preparation courses, it was noted thata significant positive correlation existed betweenattendance at 'intermediate and advanced shortcourses and the number of main dish foods anddifferent vegetables.
No significant difference in menu planning was.noted among managers, district supervisors, or home .economics teachers. Twelve (86 per cent) of .theteachers provided 16-20 or more main dish foodsduring the month, while 64 per cent of the districtsupervisors and 68-per cent of the cook-managers did
so.
14
Since 1968, supervisins for the se n ofrFood andNutritio Services have encourag d. taught theuse of a ecnate choice menus, Approximately 12.4,per cent of the managers awl .supervisors allowed foralternate choice in their menu planning when twenty
. or more niain dish fods were used during the month.
Views About Student Involvement in the LunchProgram -
One indication of student acc tapce of the menu,'food preparation, and portion ze servings is theamount of food returned uneaten. Eighty six, andone-half per cent of the food Personnel respondentsindicated that they checked plate return each- day.
Significamt 'correlationS were optained betweenchecking plate return and attendance at the ad-vanced:Short Course and WSFiSA workshops.
According to cook manager and district supervisorrespondents, students are encouraged by the follow-ing persons to taste all foods served: teacherg, 48.7per cent; cooks and servers, 95.4i'per cent; principal,21.5 per cent; administrators, 6.5 pep- cent; foodservice. supervisor, 35.6 per cent. Respondents saidthat no one gives,this encouragement in .2.3 per centof the cases. There were no significant correlatimisbetween this question and any of the training coursesexcept between WSFSA workshops and cooks andservers. .
AccordfiI to food service managers and schoolprincipals, students are involved- in the lunch pro-gram in several ways. A comparisOn of responses formanagers and principals as to the form of studentinvolvement can be seen in Table 4.
TABLE 4: INVOLVEMENT OF STUDENTS INTHE SCHOOL LUNCH PROGRAMAS SEEN BY COOK MANAGERSAND PRINCIPALS
StudentInvolvement
Food ServiceManagers
N %
Principals
Suggesting menuitems 347 35.8 62 11.2
Making posters 191 19.7 86 15.5
Tasting panels 90 9,3 15 2.7
Suggesting policiesand procedures 111 11.5 71 12.8
Offering opinions offoods served' 484 49,9 126 22.7
Working in theprogram 470 48.5 194 35.0
Not involved in anyway 163 16.8 191 34.5
22

Food service' supervisors have encouraged studentparticipation in decision-making activities on thebasis that such involvement is beneficial to bothstudents and the lunch ptogram. Food service. per-smonel can become a more integral part of theeducational team through active contact with stu-dents during the planning processes.
Another concern of this study was the amount oftime. allowed for lunch during the school day._Stu-dents, cook-managers-, and principals were all ques-tioned about the length of the lunch period, andanswers are presented in Table 5. Since schoolprincipals generally designate the length of the lunchperiod, it may be expected that they respondedaccurately to this question. The data inetcated somestudents and cook-managers are unaware 9f the exactamount of time-altbwed for lunch.
#'
TABLE 5: LENGTH OF STUDENT LUNCHPERIODS IN WISGONSINSCHOOLS AS REPORTED BY
COOK MANAGERSAN PRINCFPALS.
Lunch Period Students Cook Principals(in minutes): Managers
less than 20twentytwenty-one to
thirtythirty-one to
fortymore than
forty .
N % N (77.; N %
74 4.9 29 3.0 1.1
197 13.0 129 32 5.8
351 23.2 349 36.0 147 26.5
117 7.7 256: 26.4 150 27.1
468 30.9. 173. 17.9 1/80 32.5iU
Extremes exist in: he amount of time allowed and inthe environment- in Which lunch is served. Whereschool allow only twenty minutes, students often donot have sufficientlime to select and enjoy-their food,
, and may chtose to s.kip!lunch rather than eat underrushed conditions. At the other extreme, students'may have,as much as an hour for lunch but are con-finedtto the dining area during the entire period, withno provision being m'ade for student activities orgames. This practice can also encourage students toavoid the school lunch program.
In some schools it has been observed that studentsare marched into the:Idnchroom and seated at tablesbn both ,sides of the room. The teacher supervisorblows a whistle to signal that students may line up to
15
_
recei$e their lunch trays. Then students return to thetables to eat and must remain se ted until a whistleblast signals that they,may get up nd return trays tothe soiled dish windows. Such re mentation is notconducive to a happy lunch period.
Still another example of a poor lunch environment1 i.s one in which students are forced to go through thecafeteria line ea eat in caps and warm winter coatsbecause they are not allowed to return to lockersafter lunch. In this situation students have beenobserved tote seated at tables so crowded that withtheir coats on they can scarcely move their arms toeat.
At other schools, principals and administratorshave demonstrated genuibe interest in the foodservice and lunch time activities for students. Inthese cases, many schools have hired aides to'supervise lunchrooms and playgrounds, and a fewschools have provided games and indoor recreationalprograms for students during the lunch period.Where 40 minutes or more is allowed for lunch, thiscan he an excellent opportunity for nutrition educa-tion games, activities, and weight control "buzz"sessions. However, food service supervisors andmanagers have not considered this time period imme-diately after lunch to be part of their responsibilitiesand concern.
Items were included on the questionnaire to deter-mine how students, cook-managers, and principalspreceived the physical environment of the diningarea: Responses concerning the cleanliness, attrac-tiveness, lighting, decoration, and amount of spaceare recorded in Table 6. Fewer students than adultsmight consider the area clean because tables are notalways washed between groups of diners,'especially iftime is very limited for the lunch period.
TABLE 6: SCHOOL DINING ENVIRONMENTAS REPORTED BY STUDENTS,FOOD SERVICE MANAGERS ANDPRINCIPALS
Dining AreaConditions
Students Cook PrincipalsManagers
N. % N % N %
Clean 1131 74.7 945 97.5 528 .95.3Attractive 1068 70.5 839 86.6 457 82.5Well lighted 1152 76.0 926 95.6 503 90.8Deorated
posters 713 47.1 617 63.7 288 52.0Too crowded 317 20.9 116 12.0 105 19.0 .

TABLE 7: RELATIVE IMPORTANCE OF REASONS FOR HAVING A SCHOOL FOOD SERVICE,BY COOK MANAGERS AND SUPERVISORS (S) AND PRINCIPALS (P)
ModeratelyReason for P rogram- Very Importaqt Important Slightly Important Not Important
S P S P S P 5
A convenience for parents
A means of meeting atleast 1/3 of student'sdaily dietary needs .
A learning laboratory fornutrition education
A means of providing ameal for children ofworking motheis
To provide free meals foreconomically deprivedchildren
To help children form\ good food habits
30.5 26.5 31.O.'I' Per Cent35.9 15.5 19.4 11.7 14.3
,47.1 79.6 '25.6 14.0 10.1 3.2 , 5.4 0.9
5.6 33.5 99.9 . 29.4 e 34.1 29.T., 25.6.. 10.6
Q7 30.0 35.0
70.3 27.4
21.8 68.1 35.0
Views. Compared with Principal's ConcerningLunch ProgKain
Cook-managers, district supervisors, and prinCipalswere asked to rate six reasons for having the foodservice program in their school. Table '7 presents therelative importance given each :reason . byrespondents. The differences in attitudes .een
the cook-Managers and supervisors and prirCipalsmight be attributable to the impact of workshops andshort courses.
One .third of the cook-managers and supervis.orsreported that they considered the lunch program, alearning laboratory fur nutrition education as veryimportant. Less than six per cent of the principalsgave. this responzse, Slightly more than 1/4 of theprincipals, rated this as a "not important" reason forhaving a school food service, but -only 11 per cent ofthe food service personnel gave this ranking.
As seen in Table 8, the six reasons for providing aschool food service program are ranked according tothe percentage of respondents which rated the reason"very important". When the data is approached from,this viewpoint, cook-managers and principals agree
r on the two most important. reasons: "A means ofmeeting at least 1/3 of the students' daily .dietaryneeds" (ranked No. 1) Mt "To provide free mealsfor economically deprived children" (ranked No. 2).However, while principals considered "A convenience,for parents". to be the third most important reasonfor the existence of the lunch program, cbok-
managers rated this at the bottom of the list.
31.8 i 22.6 22:4! 11.0 11.8
16
,17.4. 18A 8.4 4.0 1.8
20.4 22.0 i 6.9 9.7 2.0
TABLE 8: RANKING OF REASONS FORHAVING A FOOD SERVICEPROGRAM, BY COOK MANAGERSAND PRINCIPALS (1`= MOSTIMPORTANT)
Rank OrderCook
Managers Princirt sReason forProgramAconvenience forparents
A means of Meetingat least 1/3 ofstudents' dailydietary needs
A learninglaboratory fornutrition education
A means ofproviding a meal forchildren of workingmothers
To provide freemeals for ,economically
5
1
deprived-children, 2 2
To help childrenform-good foodhabits 3 4.
2

When food service personnel were questionedabout their role in providing nutrition education forstudents, 13.5 per cent indicated that they had nogRich' role. Nineteen per., cent reported acting as aresource person for teachers in nutrition educationand 83.1 per cent indicated that their .role consistedof encouraging students to try new foods.
Questioned about nition education programs forpare its, 1/5 of the managers indicated that studentnutrition problems wire discussed with parents atPTA meetings: Only four pet cent of the teacherrespondents reported this means of parent nutrition-communication. Approximately 1/3 of bothmanagers and teachers said that parent-teacher Con:f4ences were desirable tirnes., for such nutritiondiscussions. Only 10.5 per cent of the managers and14 per cent Of the teachers noted that materialsconcerning children's nutrition problems 4were genthome with the students. .,The School nurse wasconsidered helpful in discussing_ child nutrition:Prob--lems with parents by 20:per cent of the respondents,'both food:service personnel and teacbers.
Forty-one per cent orthe food service respondentsmarked "no comment" when asked whether adults inthe community were interested in learning moreabout nutrition, . More than :1/3 f37.5 pet cent)....agreed that an interest in -nutrition was evident irr
*their community, while 13 per cent disagreed withthat opiniOn. Five per cent "strongly agreed" and less,than -two per cerit, "strongly disagreed" with thepremise: d
Respondents were presented with a list of topicsand asked, to rate them as to importance for parentnutrition education .programS. Teacher& arid foOdpersonnel. were in strong agreement on only -one-item?:the subjeCt organiC foods. Both groups' ranked thisat the bottom in terms of importance.
Botll foOd service personnel and -teaelieFS,Tere ingeneral agreentent concerning...the =bet niethods forpresenting future parent nutrition echYtation in thecommunity, as both ranked ifewspaper..Air magazinearticles, at the ,top of the list[-Other means ofcommunication which rated high with-both groups'ofrespondents were educational teleVision and parent-teacher organizations. Neither group rated specialclasses for parents or special workshop's as.especiallygood means for a nutrition education program.
PrincipalsSince principals are in large part responsible for
the curricula within -their supervisory jurisdiction, itwas considered 'important to determine their atti-tudes and knowledge concerning nutrition education:A random sample of 600 building, pfincipals,
. -
was selected and a 'questionnaire was' mailed to each.T4 response rate for principals was 98 per cent.
Attitudes and Knowledge about- Nutrition'Education
While 88.6 upr cent of the responding principalssaid that nutrition was taught in their schools, thegrade levels and subject areas in which it wasincluded varied widely. More than half of the ele-mentary school principals said that nutrition educa-tion was offered in theirschools.' .
, -Nutrition was most often inclUded as part of.elementary science '(51.3 per cent). and generalhealth education (47.7 per cent), with homeeconomics listed in third place (34.3 per cent).According to the principals, teachers most ofteninitiated nutrition programs. In the principals' views,however, teachers made very limited use of resourcepeople other than nurses and other teacherS. Tradi-tional resource materialS, such as hooks, filmstrips,films and. magazines were generally available.
More nutrition education is offered at the K-6girade level than at higher grades.Nutrition educa-
is offered in 59,9 per cent of the schools at the K-3 level. In 55.4 per cerrt of the schools nutritiontraining is Offered' atgrades 4-6. At the junior high orMiddle ftbool leVel (7-9 or..5-6) ; the percentage dropsto -28.7;;In grades 10-12, nutrition education isavailable- to ;Sti4dents .in. only 21.3 per cent of theschools.
Only 2.2:,p_er cent, of the principals reported that,nut,r,ition is .offered..as' a seParate: course with anidentifylik'litle. The grade 'level Was7-not indicated.-Another per cent said .that nutrition was both inseparate nutrition courses, and integrated in othersubject areas; -while '58.28 per 'cent of the 54,')
respondents indicated that only integrated work wasoffered.in their schools. No answer to this questionwas giverron 207 of the questionnaires.--Of the 223 .principals who responded that nutritioneducation was integrated with dither course~, 69.96per cent indicated that elementary teachers were themost appropriate perSons to teach nutrition educa-tion. However, 83.56 per cent of these respondentsindicated that nutrition education should be offeredat every grade level.
Of 218 respondents who reported that principalswere responsible forainitiating.nutrition education intheir sc101., alinost 9.0 per cent-thought it should betaught aillid&r.y grade level.
In a recent. survey of, Florida principals and ad-ministrators, the authorruited _that nutrition educa-tion would be more acceptable to principals andother education oriented persons if offered to them inthe form of a curriculum guide," Since teachers in.

Wisconsin are largely .responsible bir initiating anynutrition.education in their own curriculum 182.1 percent of the cases), the most logical and effective wayto promote the teaching.of nutrition education, ouldhe the preparation of 4 curriculum guide 'tor thesubject. Teachers and principals (responsibleinitiating nutrition education in 42.6 'Per-cent of thecases) should'be involved in-,the preparation of theguicktr. A philosophy and vehicle fur imOement;itcon.of nutrition education. into existing teacher cur-2riculums without burdening the teacher with addi-tional subject matter must be found. In order to beeffective it should utilize the existing educationalstructure of all districts in the state.
-Forty7one per Cent of the principals desponding tothe questionnaire said eleinentary teachers were themost appropriate persons to teach nutrition educa-.Lion. Specialists such as home etoriOrnics or healthscience teachers were .named by 17.9 per...cent of theprincipals. Almost 3/41 of the principals- said thatthey would like inservice training about nutrition fortheir teachers in content, principles, use of teachingaides and methodology. In fact, there was generalagreement among the principals that regardless, ofthe nutrition education locus, inservice workshopsprovide the best means of providing training innutrition education 1.6r teachers.
Another section of the questionnaire. for principalsconcerned the school lunch program and includedboth factual information and the opinions of therespondents. Ahout 90 per cent of the schools particHpate in a school lunch Program. However, 3/4 of theprincipals responded that some children -in theirschools go home for lunch, and I /3.4_ the principals'said ,that some Children in their schOols do not 'eatlunch. Lunch periods vary from 20. minutes to morethan 40 minutes in length, they said, and most permitchildren to leave the lunch area: when they havefinished eating.
In the opinion of most principals., the dining area isclean, well-lighted and attractively painted.Principals said that except for eating, students arenot often involved in the tunch..prograrn in othercapacities. When principals rated reasons ..forhavinga school lunch program, the use Of the school foodservice as a learning laboratory 'was rated at thebottom of the list.. (See Table 11:);The fact that 25.6
- per cent of the principals said...that the school food
program was not important as a. learning laboratoryfor nutrition education (only S.6:per cent rated it as"important" in this respect). indicates that pLincipals'
need to be provided with philosophy Of nutritioneducation which will help tbernito see the advantagesof utilizing 'the lunchroom:as the school's largestclassroom.
'Opinions about I proving utrition EducationAlmost all pr cipals agree that a comprehensive
health education curriculum she uld -include nutritionand About nine out of ten .thoug the Department ofPublic Instinction should provide a nutrition guidefor teachers' use. Table 9 sumtnarizes, the opinions ofprincipals concerning the- inclusion of nutrition. in acomprehensive health education curriculum.
TABLE 9: SUMMARY OF PRINCIPALS'OPINIONS ON INCLUDINGNUTRITION IN ACOMPREHENSIVE HEATH .
EDUCATION CURRICULUM_
18
Strongly. AgreeAgree
Number309222
Per,Cent55.840.1
No optinion 13 9.:j"
Disagree 0.0
Strongly disagree 1 0.2
No answer,
2, 9 1.6.
A large majority. (96', ) of 'the principak were in .agreement that a K-12 comprehen.4iVe health educa-j.tion curriculum should include nutrition education?There are no means by which all elementary teachersor secondary health teachers can be required to teachnutrition. Until 1974, the academic program forhealth teachers did. not include a course in nutrition.It would require several years of extensive and .
intensive effort in workshops and inservice meetingswith health teachers to help them see the importanceof the nutrition education curriculum guide and to.implement it into their curricula before results withthe stuAents.could be noted in the ltinchrooms of thestate.
Table 10 presents tNe- opinions of principals con- (cerning whether a 'nutrition curriculum guide shouldcome from the State, Department of Public Instruc-
TABLE 10: SUMMARY 0.F PRINCIPALS'OPINIONS ON WHETHER ORNOT THE DEPARTMENT OFPUBLIC I1IkSTRUCTION SHOULDPROVIDE A CURRICULUMGUIDE FOR TEACHERS' USE
Number Per Cent
Strongly Agree 199 :35.9
Agree 272 45.1
No opinion 48.. 8.7
Disagree 18 3,2
Strongly disagree. 9 '1.6
No answer 8 1.4

tion. More disagreement about providing the guidethan about including nutrition education in thehealth education curriculum was evident. Some ad-ministrators and teachers are protective of districtrights to determine What is taught within the schoolsin.their jurisdiction.
Fifty per cent of the principals responding saidthat all prospective teachers should be required totake a course in nutrition. This is important becausethe support of principals will aid the implementationof a nutrition education curriculum guide. One-fourth of the principals said they "disagreed" that allprospective teachers should be required to take acourse in nutrition, and fOur per cent said they"strongly disagreed." Two per cent gave no answer tothis question and 18.6 per cent said they had noopinion.
TeachersA representative sample of Wisconsin teachers,
. grade levels K-12, were asked qUestions about nutri-tion education in their school and community andabout their backgrounds in nutrition. Questionnaireswere sent to 1,100 teachers and 1,025 were completedand returned (93.2 per cent).
Background, Attitudes, Responsibilities inNutrition Education
A majority of the teachers questioned (all but 65 ofa total of 1,025) said they had some educationaltraining in nutrition. About 1/3 reported that theyhad studied nutrition on their own, while 1/ 2 saidthey had learned about nutrition as-part of a generalcourse, and about 1/4 of the respondents had had atleast one college course in foods and nutrition. About2/3 of the teachers questioned indicated a willingnessto attend future nutrition education courses.
Since the attitudes and practices in teaching nutri-tion.might be influenced by teachers' responsibilityin supervising school lunch periods,'respondents werequestioned abOut the extent to which they had suchresponsibility. A total of 243 teachers said that theysupervised the school lunchroom every day, with 189of these repprtinucompensatory free time for thisduty. This supervision seemed to have an effect onthe teachers' beliefs about the adequacy of studentdiets because teachers. who stipervised the lunchroom
-every day made higher- estimates of the number ofstudents hay* well-balanced diets than did teach-ers who did not supervise the school lunchroom.
A higher percentage of teachers who supervised theschool lunchroom every day (90.9 per cent) indicatedthat they believed that lower grades, especially K-3,were the best grades for starting nutrition education.
19
''' ...---).4 00(...
Cer-E-q,k 1 A
PAVE 1-U ..)CV PUTV MAIO, 1.1ARRI500 ?
--lieprinted from The Wisconsin State Journal courtesyof King Features Syndicate (C)
Among teachers who never supervised the lunch-room, 77.9 per cent believed grades K-3 were the besttime for beginning such nutrition education.
Only 6.6 per cent of teachers who supeivise thelunchroom every day thought grades. 4-6 would be thebest time while 4.1 per cent of the teachers who never.supervise the lunchroom indicated grades 4-6. By .
grades 10-12 the response rate for both groups ofteachers was .4 per cent and 1.1 per cent respectively.
When teachers were asked to ,Select the mostneglected meal of the day, aboOt 95 per cent said I
breakfast. Teachers who supervised the school lun-chroom every day were more apt to judge breakfastas the most neglected meal than were teachers whohad no supervisory duty in the- lunchroom. Thissurvey's . results corresponded with a 1951 ElmoRoper study in which 85 per cent of 1,330 public .school teachers said breakfast was the.most neglectedmeal fo,r students."
A great majority of the teachers (893 or 87 percent). agreed°with.the statement, "Teaching children,nutrition concept* will lead to better eating habits."Forty-eight respondents (4.6 per cent) had no opin-ion and 62 '(6 per cent) said they disagreed with thestatement.
. 27

.. Teachers, were also questioned about their ideasconcerning preferred methods and specific subjectscovered in nutrition units currently being' taught in _-Wisconsin. About 53 per cent of the teachers saidthey taught nutrition units using curricula .delielopelargely by themselves.
A relatively small amount of time during the schoolyear was devoted to nutrition education in any of thegrades. For example, at the lower grades,. more than75 per cent of the teichers devoted less than 11 hoursa year to teaching nutrition. At the secondary I els(which .included home economics teachers), bn1about 1/3 of the respondents reported spending morethan 11 hours teaching nutrition.
There was a correlation between the nutritioneducation background of the teacher .and whether ornot the teacher taught a nutrition unit in his or her..classes. For example, of the teachers who had ,neverstudied nutrition, 17.8 per cent were teaching anutrition unit, while 82.2 per cent were not. Amongteachers who had attended a nutrition workshop, 80per cent were teaching nutrition. Such workshopattendance was to be the most Common nutrition,education backgrdtind, although 69.9 per cent whotaught nutrition had attended regular collegecourse in food or nutritiqn.
Teachers (61 per cent) said they had more respon-sibility for initiating nutriti ucation than anyother person at all grade' le s. For this reason,development of nutrition curriculum should involveteachers during all stages of preparation. Others whowere less apt to assume responsiblity for initiation ofnutrition education were school principals, board ofeducation members, and district administrators.Teachers reported that ,parents initiated nutritioneducation in schools very infrequently.
Nutrition was usually integrated with othercourses rather than being offered as a separidentifiable course. Only 36 (3.6 per cent) te ersreported nutrition being taught as a separa ourse.This is seen as a good trend because mor udentscan be reached in this manner. The choice of integra-tion with other subjects was made by local schoolpersQnnel since there was no state nutrition educa--tion guide in use at the time of the survey.
Teachers in the survey were presented with a list oftopic's which might be included in nutrition classesand were asked to indicate those which they em-phasized in their nutrition units. As presented in
. Table 11, many of the topics named are quite varied'and can be easily integrated -with other subjectmatter, such as biology or social studies. The factthat respolidents indicated that some, impOrtanttopics, such as "Results of Overeating," "Weight
-Reduction Diets," and "Problems of Hunger in the
World," receive little attention in ^nutrition unitspoints up the need to involve individuals who are up-to-date- in their nutrition expertise in formation of
..curricula. It is important that the prevalent nutri-tional problems in our society be addressed moreadequately than is presently the case.
TABLE 11: NUMBERS OF TEACHERSEMPHASIZING SELECTED.BIOLOGICAL OR SOCIALTOPICS IN NUTRITION UNIT
20
Number of TeachersEating Well Balanced Diet 539
Importance of Good Breakfast 468
Positive Results of Good Nutrition(Strong Bones, Good Complexion,
General Well Being) 449
Individual Food Habits 384
Which Foods are Sources of Nutrients(Protein, Minerals, etc.) 367
Source of Food 331
How Food is Digested 239
.Results of Deficiencies of Nutrients(such as.rickets) 209
Function of Nutrients 204
How Food Nourishes Cells 159
Problems of Hunger in the World 144
Results of Overeating (obesity) 134Weight Reduction Diets 121
Culture Food Patterns 115
Importance of Food in HistOry 62
Other 21
The greatest number of resource persons used byelementary teachers in teaching nutrition units wereschool nurses, followed closely by horde economicsteachers in the secondary schools. Other teachers inschool as Well as school lunch supervisors are beingcalled upon to act as resource persons in nutrition ed-ucation. Very-few teachers indicated that they look'tohospital dietitians, public health nutritionists, univer-sity nutritionists, or county extension 'home 'econo-mists as resource people. Of course, not all schools arelocated in 'areas-where these potential resource peopleare readily available.
Development of nutrition concepts will be muchmore successful if actual foods can be used inteaching. However, many teachers, particularly thosein elementary schools, reported that food was notavailable . for use in the actual classibom teachingabout nutrition. This is a deficiency which SchoolFood Service personnel shoulthbe /*re to remedy.The relative lack of availability of resource materials
28

at the lower grade levels is a major reason why'nutrition is not given much emphasis in elementaryschools.
TABLE 12: TEACHERS' OPINIONS ABOUTQUALITY OF NUTRITIONTEXTBOOKS OR REFERENCES,BY GRADE LEVEL
Grade LevelOpinions about
Textbooks liz3 4-6 7-9 10-12
Per CentNot Enough,
Material onNutritionI
Material TooAdvanced forGrade Level
43.1 51':6 42.5
20.8 11.3
Material Too Simplefor Grade Level 0.9 5.2
Material Out ofDate 41.
Material NotInteresting 12.9 39.2
No Problems 16.2 11.3
43.4
a-
12.5 its
2.5 2.7
30.9 20.0 34.2
40.0 40.8
17.5 10.7
As may be noted in Table 12, the majority of.teachers at all grade levels reported problems con-cerning the quality of nutrition textbooks or refer-ence materials. Most teachers said there was simplynot enough material on nutrition availalile at theirschools, and over twenty r cent of the 1....;3 teachersfelt that the material t had was too advanced forthe grade level. Less tha ne per cent of the teachersat K-3 believed the nutrition-related material to be,too simple for the grade level. At grades 7-12, acommon complaint (40 per cent of the teachers soresponded) was that the material was simply not
. interesting.1
..
Opinions about Improving Nutrition EducationTeachers were asked to indicate which of 23
specific teaching methods they had used and whichthey found to be most successful. Ironically, sorpe' ofthe more commonly used methods were rarely rated"most successful." For example, lectures and discus-sion of how much of various foods are needed forgrowth and health are commonly used, but--fewteachers rated them "most successful." On the otherhand, certain methods considered "most successful"are rarely Used. Into this category would go field tripsto show how foods are produced and/or marketed in
21
the community and tasting new and unfamiliar foods:The School Food Service worker is a ,potentialresource for both of these learning activities. Planshave been made by the staff of the Wisconsin Foodand Nutrition Service of the Department of PublicInstruction and the University of Wisconsin to in-volve school food supervisors in short courses d&signed to improve their knowledge of nutrition and toincrease their participation as resource persons fornutrition education in the schools. Table 13 presentsdata on methods chosen "most successful" by teach-ers of different grade levels. These results have manyimplications. fot development af nutritional learningmaterials.
In order to change childrens' food habits, parentsmust. be educated to help children eat nutritiousfoods at home. Teachers can be an important bridgebetween the child who needs nutritional help and theparent. HOwever, 434 (42 per cent) teachers saidthey did not discuss nutrition problems'With parents:Parent-teacher conferenceS provided 347'' (33 percent) teachers in the survey with a chance to talkabout students' nutritaial needs. The school nursewas enlisted to help in this,area in noo (21 per cent)cases; white seven teachers said they sent materialhome with students.. Only 41 (4 per cent) teachers
indicated that 'PTA meetings were' used for discus-,sions about nutrition education.
When teachers were asked their. opinions as tomethods of reaching and improving parents' marl-tiori knowledge and practices, more than half (5:30 or51 per cerit) indicated mass media, especially articlesin newspapers or magzines, as being an importanttool. Parent teacher, organizations were named iy403 (39 per cent) teachers, and 380 (37 per ce )
said educational television would be the best vehiclefor.accomplishing this goal. Special classes for par-ents were named by 370 (-36 per cent) teachers, while'267 (26 per cent) said the University or the Depart-ment of Public Instruction should present specialworkshops for parents. One third of the respondentteachers indicated that adults in the community wereinterested in learning more about nutrition.' Of 984teachers who responded to the statement, "Do youagree or disagree that adults in your community areinterested in learning more about nutrition?" Thirtythree per cent agreed or strongly agreed, 46 per centhad no Opinion, and 21, per cent disagreed or stronglydisagreed.
Teachers in the survey were asked which of a seriesof selected topics would be best to cover in parentnutrition education programs. Teachers could checkmore than one topic. Topics ranked in the followingorder: "Fool Needs at Different Ages," "How FoodAffects Physical Development;" "Advantages of Eat-
29

TABLE 13: TEACHERS BY GRADE LEVEL1 INDICATING "MOST
SUCCESSFUL" LEARNINGACTIVITIES
TEACHERS ACCORDINGTO GRADE LEVELS
TAUGHTLearning Activities
Tasting new andunfamiliar. foods
Learning to identifynew foods
Using fbod: modelsEncouraging
children to taste.all food served atschool lunch
Planning menus forschool lunch
Having childrencheck if they areeating enough of aparticular food
Having childrendevelop plan forimproving foodpractices
Keeping and/orrevising records offood eaten in oneday
Conducting smallanimal feedingdemonstrations
Classification offoods according tofour food groups
;Planting vegetableseeds andWatching themgrow . .
Discussing howmuch of varioftsfoods are neededfor groWth andhealth
Evaluation progressin improvingchildren's foodpractices
K-3 4-6 7-9 10-12
26.2
8.310.3
Per Cent
8.7. 17.4
5:2 8,73.5 0.0
95.3
11.64.2
29.4 7.8 5 . 5 2.1
9.4 5.9 8.7 4.2
18.7 204- 34.8 16.8
5.2 '10.4 15.2. 10.5
20.2 26.9 39.1 28.4
1.2 2.6 0.0 4.2
32.5 33:0 50.0 26.3
97..4 17.4 4.4 1.1
11.9 9.15.7 17.4 14.7
5.2 5.2 9,9 2.1
Making surveys offood wasted by
}grade groups at. school lunch 1.2
Surveying foodhabits of membersof class and theirfamilies 4.4
92
Compaiing costs ofdifferent kinds offoods 1.6
Going on field tripsto show how foodsare produced-and/or marketedin community 15.1
Studying food habitsof people fromother parIs of theU.S. and/orWorld 1:9
Using resourcepeople to comeand tell. aboutfood 1.6
Lectures 1.2,
Discussions 25.4Using films or
filmstrips 45.2DiScussion weight
and heightmeasurement of
1.7 0.0 2.1
5.2 8.7 5.3
8.7 13.0. 30.5
6.1 4.4 11.6
7.8 10.9 9.5'
3.5 0.0 1.1
1.7 2.2 9.518.3 36.9 .26.3
33.0 . :39.1 29.5
children in class 12.7 8.7 .17.4 14.7,
(Totals do not add up to 100q because someteachers rated more than one method "most success-fur).
ing a _Good Breakfast," "Selection of Snack Foods,""Food Choices of School Age Children," "SpecialDiets and Weight Control," "Advantages of Eating adood Lunch," "Bchool Food Service Contribution toNutrition," and "Organic FOods." The latter tvyosubject areas trailed far behind others in the list.
Of the responding teachers, 70 per cent ran,ked"Food Needs at Different Ages" above all °thesuggested topics to be presented in parent nutriOeducation programs. Less than 18 per cent of theteachers at all grade levels indicated that disc ionpresentations of how much various foods are dedfor growth and health was their "most suc essflearning activity: (See Table 13). Perhaps th *teacers felt the need for parental cooperation and belp inorder for student activities to be effectively andledby ()the; than lecture or discugsion. Possib , per-
,
I I
3,0!,t

tinent data and suggested student activities have notbeen provided teachers for this topic. Or, becausethey did not know 'how to succesAfully teach thetopic, it should, therefore, be delegated to parentalnutrition education.
Based on the results of the teachers' portion of thissurvey, as well as on ale other research in the area,the project director can make several recommenda-tions. Among these are that prominent identification,of materials and resource persons in the nutritionfield should be available to all teachers. Materialsmust be kept current. Since school programs met,'already crowded with Many subjects, rather than addanother one, it is important to integrate nutritioneducation with existing disciplines. Expert assistancein nutrition content is needed, but educators, too,must be involved in the process of curriculum forma-tion. Teaching nutrition in many disciplines will alsoinsure greater student contact.
Recognition of nutrition problems and evaluationof nutrition education as a means of solving themshould continually be monitored. This requirescooperation with outside agencies such as the Divi-dion of Health and Social Services and the universi-ties. Nutrition education programs involving thecommunity also require close cooperation amongeducators and community resource persons.
Teachers' preparation in basic nutrition principlesis frequently weak. But, it, is impractical to expectthat' substantial nutrition background in the form ofcollege courses can be provided to teachers already inthe field. Expansion of pre-service nutrition offeringsfor teachers should be explored and such is alreadybeing accomplished at some universities. To helpremedy the lack of background in basic nutritionamong teachers, it is proposed that video tapes andother portable materials be prepared for use ininservice offerings cthroughout the state. This effortshould be rnerchandized to different groups, includ-ing professional education unions, administrators,and school board members.
Student Food Habit SurveyA stratified random sample of 6,000 students was
selected to represent the Wisconsin public schoolpopulation of 'approximately one million children.The survey was conducted in November and Decem-ber 1973. A total of 4,636 students completed surveyforms for all three days. Rather than cut the sampleto only these students, the responses of each daywere totaled and divided by, three to obtain, dailyaverages noted throughout the report. For example,4,983 respondents completed the forMs on Tuesday,4,994 filed out the forms on Wednesday and 4,917
r
participated on Thursday. The average for the threedays was 4,965 rather than the 4,636 who completedall three days. The procedure was to tabulate thefood group data by sex and grade, level, then allgrades by sex and finally, all students: Percentageswere figured for each of the numbered responses byfood groups, not as percentage of total averagerespondents.
Only selected data is reported. None of the data isstatistically representative of any single grade, schoolor district with the exception of Milwaukee. Datafrom Milwaukee' students is included with all otherstudentsin this report.
The objectives for this particular survey were:1. To, sakterrnine if the instrument developed
could be administered to large populationgroups without expensive, time-consumingtrainin essions for persons responsible forsunerv.
#g participants.
g 2. To appraise the instrum'ent's reliability toadequately portray respondent's eating pat-terns.
' 3. To identify nutritionally vulnerable areasamong school children for which nutritioneducation activities should receive priority.
4. Identify the contribution of the following foodgroups to the total student food intake in a 24,48, and 72hour period: milk ' and milkproducts; cereals and bread; meat and meatalternates, and Vitamins A and C.
5. Identify the students' general pattern of eatingduring the 24, 48 and 72 hour periods asmeasured by these food groups.
6. Identify the kinds and number offood which contribute calcium,Vitamins A and C to the child'shealth.
7. Obtain an indication of the influence of highcarbohydrates, and/or empty calorie foods ontotal food intake.
8. Identify the number of children over andunder the Median and mean weight. rangecurve established by the median or mean ofeach total grade group sampled.
9. Identify the number .of children taking vitaminsupplements; determine the significance of for-tification and enrichment. of foods.
10. Identify the number of childrenbreakfast; what foods were eaten and reasons
, for not eating.Identify the number of children eating schK11pnch; foods eaten for lunch and reasons fdinot eating lunch.
12. Determine whether children who eat breakfastconsume more foods which are good sources of
servings ofiron, and
nutritional
eating
23
11.
31

calcium, iron and Vitamins A and C than thosechildren who do not eat breakfast.
The type "A" lunch pattern is often compared, withthe fair food groups in courses for scivool food servicepersonnel. Most student and community populations
are also, familiat\ with the four food groups. Becauseof general familiarity, thia,articular grouping of.foods was considered the log cal reference for report-ing survey data to communities and schools. Foodsnot eaten the recommended number of times in thefour- food groups can 'be identified. Other studieshave indicated that Vitamins A and C, and theminerals calcium and iron are 'the nutrients mostoften short in children's daily food intake.
Dr. Philip L. White of the American MedicalAssociation developed a practical nutrient determi-nation for personal dietaries, recorded for three days.The number of servings of food eaten in eachcategory was to be recorded. E;timate of portion sizeswas required. One serving of meat was considered tobe three ounces of cooked meat. A six ounce cookedsteak would be recorded a,s'two servings.' Children oradults not familiar with food weights and measureswould not be able to estimate the amounts of foodseaten with any degree of accuracy. Accurate evalua-tion of the nutrient content of food intake becomesdifficult if not impossible-. Trulson et al.," reportedthat investigators often had to assume portion size, aprocedure of questionable accuracy.
The questionnaire developed for this survey re-quired only a "yes" or "no" response for eatingspecific foods. No attempt was made to determinethe amount of each food consumed. Fooad lists in-cluded in the survey were designed to cover thefollowing six specific groups of foods: (1) milk foods,(2) meat and alternate foods, (3) foods consideredgood and fair sources of Vitamin A, (4) foodsconsidered good and fair sources of Vitamin C, (5)breads and cereals, and (6) all foods in the previousfive food groups plus additional specific foods contain-
ing iron. See the questionnaire (p. 63, 64, appendix)for the foods -considered good or fair sources of these
nutrients.The instrument devr1ed for the food habit
survey was, administered with minimum problemsand without training sessions for administeringadults. However, when .the data was tabulated, the
,investigators noted that some respondents failed torecord specific foods consumed with their meals. Forexample, if a hamburger.. was eaten for lunch, themeat was recorded more often than was the bun. Atbreakfast, jelly and jam was recorded more oftenthan was toast or breads. Even though the survey wascompleted immediately .after ,lunch, some studentsfailed to record the milk consumed with their lunch.
The problem of failing to record some foods eatenmight have been corrected if the investigators hadsuggested that the students write' down what theyactually ate each period on a separate form.' Theycould than complete the questionnaire by transfer-ring the foods to the appropriate columns. With thebread and cereal and milk groups, the investigatorscould have had the students record the number ofslices of bread, number of buns or. glasses or half-pints of milk. One reason for concern was thatfortified cereals and breads are an important .sourceof iron, one of the nutrients considered important tothe study.
Secondary level students did not recordas many"yes" responses in any of the food groups the second,day, and 'even fewer "yes" responses the third day ofthe survey than did students grade 4-6 .who alsocompleted their own questionnaires. The highernumber of "yes" responses from the younger children(K-3) may have been partially due to the influenceof the adult who administered and completed thequestionnaire on a one-to-one basis. Students (4-6)seemed to take the survey more seriously than theolder. students. Perhaps a one-day 24-hour food recall
survey would provide data as reliable as the three-day. The responses of the participating students weremore complete the first day. The shorter period
would greatly simplify tht obtaining and evaluationof data.
Food Intake Patterns for Six Specific NutrientsFoods included in the milk groups were cheeses,
milk drinks, custards, puddings and ice cream. Thestudy shows that students in Wisconsin reportedsimilar "yes" responses for drinking milk and eatingmilk foods as students in studies which have beenconducted in other states.
Trulson et al.,h reported 16 per cent of the tenthgrade boys and-23 per cent of 'the tenth grade girls.surveyed consumed less than 1/2'pint of milk a dayduring a three-day dietary survey. Edwards reportedno milk intake by foUrteen per cent of the students.Only 66 per cent cons-timed two or more cups of milk
or milk products.' Callahan" indicated that nearly300,000 children in Massachusetts did not consumerecommended amounts of milk and milk products.
The number and percentages of studeks who ate'foods from the milk group during the survey periodcan be seen in Table .14. The milk food intakedifference between boys and girls was not statistical-ly significant.
The number of students recording "yes" responsesto foods in the milk group decreased from elementaryto secondary grade level. For example, 29 per cent ofthe boys and 34 per cent of the girls in grades K-3
24 32

TABLE 14: STUDENTS WHO ATE FOODS FROM THE MILK GROUP AT REGULAR MEALS ANDSNAOKS
(a) By Grade Level and SexMilk . Custards, Puddings
Boys Girls Boys Girls'Per Cent
K-3 28.6 34.1 23.2 '99.64-6 24.6 26.0 30.5, 39.47-9 23.4 20.1 25.5 ' 94.910-12 23.4 19.8 21.1' 13.7Totals 100 100 -100' 100
(b) By All Grade Levers and SexMilk
Boys GirlsCustards, Puddings
Ice Cream CheeseBoys Girls Boys Girls
20.9 24.4 18.1 1'8.09.7,9 31.0 27.8 31.728.9 24.8 95,5 25.323.1 19.9 28.6 27.0
100 100
Ice CreamBoys Girls Boys Girls
47.2 46.0
(c) By All Grade LevelsMilk
Per Cent7.9 7.4
Custards, Puddings1
. 47.0
(d) By Sex
,7.7
Per Cent
Per. CentBoys80.9
recorded "yes" responses for milk beverages, but ingrades 10-12, only 23 per cent of the boys and 20 percent of the girls reported drinking milk.' When allmilk foods were grouped together, 77 per cent of theboys and 71' per cent of the girls recorded "yes"responses. Conversely, from 23 to 29 per' cent of allpublic school children in Wisconsin did not reportconsuming any milk foods during the three days ofthe survey.
Ranked in order according to the number of "yes"responses recorded, foods in the meat and meatalternate food group were as follows: nuts (27.33 percent); peanut butter (25.18) ; 'luncheon meats andwieners (13.43); stews (10.02); pork, beef, veal, liver,,lamb "(7.32); poultry (6.54); eggs (4.43); fish (3.10);dried peas and beans (2.65):
The relatively low, ranking for beef, pork, veal,liver, and_lamb was somewhat surprising to investi-gators since ground beef is prevalent on most-schoollunch menus. The fact that students may ,not haverelated hamburger with beef might account for thesmall percentage of "yes" response in this category.Friday was not one of the survey days, thus con-tributing to the low rankink of fish in this food group.
Boys reported "yes" responses for meats and meatalternates more often than did girls, at, all gradelevels. Boys in the 4-6 grade level reported eating
25
32.0 30.1
Ice Cream
3.1.1
Girls71.5
100' 100
CheeseBoys_ Girls
16.412.8
Cheese
14.5
meat and meat alternates the largest number oftimes. During the three-day ,survey period, an Over-age of only 68.85 per cent of the boys and 53.3 per,cent of the girls recorded eating meats and meatalternate foods. From 10 to 15 per cent of Wisconsinschool children reported "no" responses to eatingmeats and meat alternates at least twice a day.
In the breads and cereal category of food, only36.88 per cent of the boys and 25.96 per cent of allgirls recorded !'yes" responses. Within this foodgroup, boys recorded tnore "yes" responses than girls;howeVer, slightly more girls than boys recorded "yea"responses to eating bread (63 per cent:girls, 58 percent boys). .
tAs in the meat category, students in.:grades. 4-6
recorded more ;'yes" responses to cereals than did .
older students, but secondary school studentsrecorded more "yes" responses to breads than didelementary students.
Investigators are of the opinion that students didnot. recall accurately thejrequency with which theyate bread. For example, a daily average of 637students reported eating jam or jelly at breakfast, butan average of only 189 recorded eating any sort ofbread at this meal.,
The average daily "yes" .regponses for the breadand cereal category are tabulated in Figure 2.
33,
,

Figure 2: AVERAGE OF 3 DAYS RESPONSES FOODS IN BREAD AND CEREAL GROUP
s.
FOODS.
Rice and Pasta
Fortified Cereah
Other Cereals
Breads
jNUMBER
Figure 3:
FOODS.
Tomato, Cabbitge,
Regular Meals .Plus Snacks
All SchoolsAn Grades
=WSW//lr/
7 Fortified Cereali
Strawberries orCantaloup
Fortified Drinks,Tang, etc.
Citrus Fruitand Juices
NUMBER
100 200
EMI Boys and Girls
rza Boys
cn Girls
300 400 500 -600 700 800 900 1000
AVERAGE OF 3 DAYVESPONSES FOOI3S IN VITAMIN C GROUP
RegUlar Mea(Plus SnacksAll Schools ''-All Grades its
NE Boys and Girl&
rZZI Boys
En Girls
100 200 300 400 500 60b
- 34
700 800 900
Survey results concerning Vitamin C foods showthat diets of Wisconsin students are more adequatein this nutrient. than were diets reported by someinvestigators in other states. Edwards et al.,' re-ported data which indicated that 59 per cent of thestudents in their study ate no vegetables or fruits richin Vitaniin C on the day of the survey. Adelson'reported that approximately 30 per cent of the dietsin the North Central region had less. than 2/3 of they!R.D.A. for Vitamin C. Dobbins' noted that approxi-mately 8.13 per cent of the students consumed .lessthan 1/3 of the R.D.A. for agStbic acid. However,this data which indicates that more than 25 per cent(25.14 for boys and 27.34 for *Os) of WisconsinSchool children are not receiving adequate intakes ofVitamin C points to the need for more nutritioneducation and better eating patterns for all publicschool students. .
For students reporting consumption of Vitamin Cfoods, citrus fruits and juices were most commonsources (39.8 per cent). Tang and other fortified fruit ,drinks accounted for 29.6 pet cent, with strawberriesand cantaloups (12.6 per cent) . fortified cereals (9.6)apd tomatoes, cabbage, etc. (8.4) accounting for theremainder. .
Except fin. grades 7,9, girls recorded more "yes"responses to drinking and eating 'citrus fruits andjuices than did :boys (43.08 per cent for girls and
37.02 per cent for boys). Girls in grades K-6 also atemore fortified cereals than did boys. Result's inVitamin C fortified cereals were reversed on thesecondary level, however, as mor "yes responseswere recorded for boys than for gir . Again, grades 4-6 students reported more "yes" res onses to VitaminC foods than any other grade level. 1
The daily average in the Vitamin C fo«I group' isillustrated in Figure 3.
A total average of only 30.61 per cerht, of thestudents (33.28 for boys and 27.95 for girls) reportedeating any of the , fruits and vegetables n theVitamin A check list. When generalized to the entireschool population, survey figures indicate that al.y.proximately 320,000 Wisconsin K-12 students didnot eat foods considered fair to good sources ofVitamin A during the three survey' days.
As illustrated in Figure 4, dried fruit was the mostpopular food in this category, followed closely' bypeaches and melon. Carrots, a common item in schoollunch menus, was the third most commonly eatenfood in this category. ,
The comparison of boys and girls for the Vitamin Afood group is also shown in Figure 4. In everyinstance, boys reported eating Vitamin A foods moreoften than did girls.
27
\\.Again, students in grades 4-6 reported more "yes"
responses to the fruits and vegetables in this foodgroup (43.09 per cent) than any other grade level. Se-nior high students reported eating these foods lessoften than did any other group of respondents. Whencompared with a Massachusetts study,4.5 this surveyindicates that Wisconsin students in grades K -6 .re-ported eating more Vitamin A foOds, but Wisconsinstudents in grades 7-12 ate less from, this food groupthan did their Massachusetts counterparts.
In a-1965 nationwide survey of household food con-sumption, Adelson' reported that 25 per cent of thediets in the North Central region had less than 2/3 ofthe recommended daily amount of Vitamin A. Lundand Burk '-' noted that Vitamin A intake was associ-ated primarily with the mother's attitude towardsparticular fruits and vegetables considered hisources of Vitamin A.
Daily consumption of Vitamin A is not consideredas essential as daily ingestion of Vitamin C becausethe body can store significant quahtities of VitaminA in the liver. However, a constant supply of Vitamin-A is necessary for the formation of rhodopsin toprevent night blindness or permanept-visual impair-ment. Vitamin. A also contributes to pr e growthand 'development of.bones.2° The Food an utritionService of the USDA has recommended that VitaminA rich foods be included in Type .A lu'rich menusseveral times each week,
To encourage consumption of Vitamin A richfoods, in react years the USDA purchased purpleplums, apricots, yams, and other such foods for theschool lunch program. Results of the current studyindicated that nearly 70 per cent of the Wisconsinchildren are not eating these -foods. Because thesefruits and vegetables are not native to the state, theymay be unfamiliar to ,children and may not begenerally purchased for home-prepared meals. Thisis another area where survey results indicated a needfor nutrition education for both parents and studentsin the state of Wisconsin.
Iron has received more attention in the advertisingmedia than any other nutrient; yet, this study indi:cated that iron deficiency may still exist amongWisconsin' school children. While children absorbiron more efficiently than do adults, they need moreiron because of their active growth rate.'" To gaugethe iron intake of students, investigators in this studylisted sixteen different iron source foods on thequestionnaire. A satisfactory daily pattern for ironwas based on four "yes" responses for iron rich foodsfor boys and girls aged 5 to 11 and eight "yes!'responses for students 11 to 18.
During the 3-day test period, 42 children reported

Figure 4:
FOODS
Broccoli
Gnien Peas,& Asparagus
Greens
Apricpts
Fortified Cereal
Carrots
Peaches, Melon
Dried Fruit
NUMBER
AVERAGE OF.3 DAYS RESPONSES FOODS IN VITAMIN A GROUP
Regular Meals plus SnacksAll,SchoplsAll Grades
Boys and Girls
E22 Boys.
=I Girls
.;
0 50 100 150 200
no "yes" responses to the iron group fo(ids, and anadditional 1,773 (35.58 per cent) recorded eating lessthan four different foods within the sixteen. Only57.5 per cent of the students consumed sufficientnumbers of these foods to consider the eating patternof iron rich, foods to be satisfactory. -
Figure 5 shows the responses by number and sex ofstudents to the iron group fopds. Fortified breadstopped the' list, with nuts and peanut butter closebehind. Again, the low ranking for fish might bebecause Friday was not a survey day.
When iron intake was analyzed according to g/ade,level, data indicated that consumption of iron foodschwreased as grade level increased. While more than80 per 'cent of both boys and girls at the K-3 level
28
250 300 350 400
recorded "yes" responses in this category, grade level
10-12 boys recorded only' 43.9 per cent "yes"responses and girls reported 25.9 per cent. Girls injunior and senior high need more iron than doyounger girls, but tie older group of girls had thelowest response rate in this important nutrient.
Dr. Nancy E. Johnson, associate professor of nutri-tional science with the University of Wisconsin,Madison, developed a "Nutrient Adequacy ReportingSystem"' (NARS) which has some similarities withthe instrument used in this study. Amounts of foods
eaten are. obtained over' a 24-hour period.Respondents may take the forms home with them torecOrd meals and snacks eaten during the... period.Amounts of all foods consumed are estimated. Tabu-
36

Figure 5:
Broccoli
Peas. Asparagus
Greens
Dried Beans & Peas
Fish
Poultry
Fortified Cereals
Pork. Beef, etc..
Other Cereals
Stews
Dried Fruit
Wieners. etc.
Peanut Butter
Nuts
Bread
AVERAGE OF 3 DAYS RESPONSES FOODS CONTAINING IRON
11111111111111 11111111 11711 11111 11 111111 1111112111111111111111111111111111111111111.1111
lin1111111111111111111111111111111111111111111
7111111111111111M111111111111111111
7111111111111111111.111111111111111111111117;77211111111 1111111111111111mi=2"11.1111111111..1111111111="1"1.11.111111 111111111177;7211111111. 1111.111111111
="7752.11.1.1111111111111111111111.111111====7-"11.111111111111111111111111M111111
NI El MEM I I%/.=r,=406.0. rA U
sNF /7 4Y WAMI.M.11111...11111111111111. _wan mos we= lintre gam ems now moo
11111111111111101111111111111111111111MNUMBER 0 60 i00 150 200 250 300 350 400 450 500 550 600 650 700 e50 800 850 900 950
lations are Computer programmed for immediateanalysis. of results. Nutritive values for 11 specificnutrients are obtained and information provided tothe participants."
Approximately 900 children in Milwaukee weretested with NARS within a year of this survey. Acomparison with the survey of 539 Milwaukee stu-dents in this study indicated that the results ob-tained were very similar to the NARS for protein,calcium, iron, Vitamin A and Vitamin C.
Investigators believe that school food servicemanagers and supervisors should make special effortsto add iron-rich foods to their menus, prepare them
29
well and serve theni attractively. Probably moreemphasis should be made in newsletters and recipessent to schools to help alleviatejhe shortage of thisnutrient in diets of school children.
Satisfactory Daily Eating PatternsWhen' the questionnaire was developed, the follow-
ing satisfactory daily patterns for various food groupswas established. Generally, these follow the sug-gested number of servings for the Basic Four foodgroups:
1. Each day, if a student marked "yes" three ormore times or for three or more, foods in the
37

milk group, it would be considered a satisfacto-ry pattern:
2. If a student "orted eating a meat or meatalternate food twice or -two different meat ormeat alternate foods each day, the patternwould be considered satisfactory. .
3. If a student consumed bread or cereal foodsthree times or marked three foods once in thisfood group each day, it would indicate asatisfactory pattern.
,C If a student ate one food each day which wasconsidered a good source of Vitamin C or twofoo s-rwhich were judged to be fair sources ofV amin C, the eating pattern would be ratedsatisfactory.
5. One "yes" response for foods rated goodsources of Vitamin A would be sufficient eachday for, a satisfactory daily pattern.
6. Four "yes" responses each day for iron richfoods for boys and girls aged 5 to 11 and eight"Yes" responses for students 11 to 18 years old,
. would rate a satisfactory daily pattern for iron.Data for students with a satisfactory daily, pattern
for all food groups are shown in Figure 6.
Figure 6: PER CENT OF ALL STUDENTS WITH SATISFACTORY DAILY PATTERN
MI Regular Meals OnlyQ Regular Meek Only221 Regular Mesh and Snack. soy.
Regular Meals and Snack. ?irls
At all grade levels more boys than girls hadsatisfactory daily patterns for all 'food groups. Thesex differences for grades K-3 and 4-6 were slight,but at the two secondary grade levels, sex differenceswere statistically significant.
In assessing the eating patterns of students and the
30
impact of snack focs
on the nutritional quality of.
diets, investigators ncluded that where vendingmachine or a la carte programs are available inschools, special effort should be made to see thatsuch programs included foods high in nutrientsneeded for satisfactory daily eating patterns. Theimpact of snacks for three food groups and a com-parison of children who skipped breakfast and/orlunch with those who ate, both meals may be noted inTable 15.
.
TABLE 15: STUDENTS WITH ASATISFACTORY DAILYPATTERN FROMEGULARMEALS ONLY ANTI REGULARMEALS PLUS SNACKS FORTHREE FOOD GROUPS
FoodGroup
AteBreak-fastRM RM+S
NoBreak- Atefast LunchRM RM RM RM+S . +S
NoLunch.RM RM.+S
Milk 78 57
Vit. C 73 50Vit. A 67 54
Per Cent40 5 76 6046 6 74 '5242 8 67 58
313833
2
44
Footnote: RM regular meals (breakfast, lunch,dinner)
S snack periods
Data was gathered to determine which studentstook vitamin supplements. It was learned that stu-dents (K-3) with a satisfactory daily pattern werethose most likely to take vitamin supplements. Al-most 98 percent (97.98) who took vitamin supple-ments already had a satisfactory daily pattern with-out the supplements. Thus, older students who need'vitamin supplements the most are' not the ones who
receive such supplements.Of 620 students who had a satisfactory daily
pattern for all meals and for all food except iron, 27per cent took iron fortified vitamin supplements. Theimportance of providing nutritious snack %ods ispointed up by the fact that approximately 27 perpent of the students who reported taking iron forti-fied vitamin supplements obtained the other nu-trients to provide them with a satisfactory dailypattern from foods eaten at snack periods.
Eating Patterns for Regular MealsData in this survey revealed that some children
may go as long as 17 hours without food if they do noteat breakfast or any snacks between the evening mealand lunch.
38
1

Figure 7:
Iron
Calcium
Vitamin A
Vitamin C
STUDENTS EATING NO BREAKFAST AND OMITTING FOODS.WITH SPECIFIC 'NUTRIENTS FROM THE DAY'S FOOD INTAKE
(REGULAR MEALS ONLY)
4.3%
6.0%
11.1%
13.7%
et
A
51.0%
51.4%
Girls .
Boys
When queried as to why breakfast had beeneaten, students most commonly answered that they"did not have time." Others replied that they did notfeel hungry at breakfast time or that the school busride made them sick if they ate breakfast.
The study shows that an average of 15.58 per cent. of all respondents went to school without eating
breakfast, and as the age of the child 'increased, thelikelihood that he or she had no breakfast increased.Among students in grades 10-12, a three-day averageof 28.51 per cent reported that they had not eatenbreakfast: Nearly 1/3 (32.8 per cent) of'the girls ingrades 10-12 did not eat breakfast.
If .students who missed breakfast selected foodswhich supply the missed nutrients throughout theremainder of the day, the patterh of skipping mealswould not be serious. The effects of omittingbreakfast from the daily eating pattern of children at
- all grade levels is illustrated in Figure 7. The fournutrients depicted are those whiCh have beendeficient in the diets of many children. Fifty-two percent of the children who missed breakfast also failedto eat any of the Vitamin .0 source, foods as listeUn,the. questionnaire. The percentage for Vitamin:/A`foods was approximately the same, indicating, thatmore than half of thetudents who skipped breakfastdid not report selecting foods throughout, the
31
53.3%
51.3%
remainder Of the day which were considered good orfair sources 'of Vitamins A or C.
The advantages. of eating breakfast were clearlydemonstrated in a ten year study conducted at theUniversity of Ibwa.22 Personal testimonies of ad-ministrators anck teachers from ,schools which haveinitiated breakfast programs have verified the resultsof the Iowa study in that students are absent lessfrequently, present fewer discipline problems, and dobetter work in school when they have eatenbreakfast.
TABLE 16: STUDENTS NOT EATINGLUNCH-, BY GRADE LEVEL ANDSEX
Grade Day One, Day Two Day Three TotalAver -
Level Boys Girls Boys Girls Boys Girls agePer Cent
K-3 4.0 4.4 2.6 3.6 6.0 4.4 4.14-6 3.0 1.6 4.0 2.9 4.0 2.6 3.07-9 9.0 10.5 11.6 10.6 8.5 10.4 10.210-12 20.7 24.7 19.1 .23.1 20.0 25.5 92.9Ave.Totals 9.2 9.1 8.4 . 8.3 9.1 9:0 9.0
4

As ilhistrated in Table.16,,an average of 9.02 of thestudents surveyed repo ed that they ate no lunch.Among grades 10-12 th igure increased to 22.20 pertcent of students who Miss lunch.
Although investigators. ought to determine exactlywhy.some children did not eat breakfast, they ques-tioned students only about feaSonS for not eating theType A lunch served in sohoollunchrdims. Studentswho did not eat. the Type klunch gave the followingresponses as some ott hen. reasons:. Not available 32.50
*Didn't like what7Was served 31.09Costsloo .much ; 12.40
*Wait in line to long 8.02I'm on a diet 7.05
*Cooks are groitChy. 4.58. *Food is cold ' 2.97
L(lst my money 0.94Those reasons Marked with ,an. asterisk might becorrected by school food service personnel.
Since almost 1/3 Of the students who didn't. eatlunch said it was beet:rule they didri't like the tOydsserved, more.. student irtvolvement in the thanningand evaluation processes of the program might encourage some of these students to, eat. lunch. InPennsylvania the Chester Upland School DistrictFood. Service Director increased daily participation500 per cent from 1,200 lunches in !Ianuttry. 1970 to5,350 lunches in January 1975. After an intensive in-service program' for food service employeestihe con-
Figure
centrated on organizing a strident food service ad-visory committee to 'participate in bimonthlybreakfast meeKings. The 'director attributes part ofthill significant increase in participation to his workwith the student committee.i5 Student involvementin the, food- service program, providing food choiceswithin the Type A pattern and ,merchandising schoollunches were among a variety of "suggestions made byU.S.I).A. for increasing student participation."
Figure 8 preSents the effect of going without lunchupon the omission of fOods containing; spkifictrients from the other.two regulair meals during the
. 24-hour period.
Typical Breakfast, Lunch and Evening Meals .
Tolletermine a "typiCal" meal for respondents, theinvestigators tabulated "yes" responses. for Jill foodson the questionnaire. Any food which was eaten by at
,least 10 percent of the students at each grade leveland sex was considered, to be a typical item for theparticular meal. -
AfteTall calculations were made at each:gradeJeveland (or etch sex, it. was .determined that a typicalbreakfast Menu for, Wisconsin school students con-sisted of fruit juice (espejally citrus juices), day or
,.cooked cereals, eggs, jainfo4::.jelly. The fact that milk,.bread, buns',.,butter or.inargarine were not recordedby enough students to make the typical menu sug-gests- to investigiatiirs that students were inaccuratein their recall of these foods eaten possibly.due to the
STUDENTS EATING NO. LUNCH AND omirruk FOODS WITHSPECIFIC NUTRIENTS-FROMITHE DAY'S FOOD INTAKE
(REGULAR MEALS ONLY)"
Girls
Boys
32
f4
40.

instrument form used. It doesn't seem reasonablethat children-would eat jelly or jam without bread or.rolls of some kind or that they would eat cerealwithout milk.
Foods eaten by sufficient numbers of students tobe listed.as typical items on the lunch menu weremore varied than breakfast items. Thus, a typicallunch menu would be composed of luncheon meat or,wieners, peanut butter (except for girls grades 7-9and all students 10-12), bread 'or buns, cheese (ex-cept,for students in grades 7-9), casserole mixed dish(except for students in grades 7-9) , potato chips,cookies or cakes, candy (eicceptlor students K-3 andboys 4-6).
Again, milk was noticeably absent from the typicallunch .menu, as, were fruits and vegetables and icecream. Personal observation by investigators of thenumber of students who drink milk at lunch indica
/es that students simply failed to record this item.Contrary to the opinion expressed by some cook-
managers that lunch "is the only real meal childrenget during the day," this purvey revealed that stu-dents recorded more "yes" responses to a larger.number listed foods for the evening meal than forany othe meal or snack period. Although the surveyquestionn e was administered immediately afterlunch, and thus last evening's meal except for thesnack period prior to the meal, was farthest away 'in
oint of time, students seemed to have- less difficultyremembering what they ate for dinner than for theother two mrls. More students remembered toinclude buttepor margarine, bread, and milk with...this meal than for the other meals.
A much larger assortment of foods was included inthe typital evening meal: pork, beef or lamb, casser-ole dishes with meat, poultry, dried beans and peas,cheese, white potatoes, pasta, tomatoeS, carrots,green beans and asparagus, bread or rolls with butteror margarine, ice cream, cookies or cake, and pop.Only girls in grades 7-12 recorded "yes" responses tii_drinking milk in large enough numbers to have thisfood become part, of their "typical dinner pattern."This is the only meal in which any vegetables wererecorded as eaten by ten per cent or more of students.
Influence of Snack Foods...In evaluating the impact of sack foods upon thedailY nutritional eating pattern, investigators notedthat when the pattern included skipping regularmeals, the influe e of snack foods was greater whenlunch was missed than when breakfast, was elimi -.nated. (Refer to Table 15). Five per cent of those whoate no breakfas4 had a satisfactory daily pattern forthey milk group foods at the lunch and evening meals;for those who reported eating no lunch, only two per
cent achieved a satisfactory pattern for milk at thebreakfast and evening meals. However, an additional35 and 29 percent respectively, achieved a satisfactorydaily pattern when snack foods consumed during theday were considered. This finding should encourageadministrators and food service managers in schoolswhich offer additional food choices in Oa carte pro-grams to provide foods which will help students meettheir nutritional needs.
Significance of Fortified and Enriched FoodsThe jnvestigators were interested in the effect of
highly fortified cereals and fruit kinks upon thesatisfactory daily pattern for specific nutrient foodgroups. They found that fortified fruit drinks ac-counted for approximately 30 per cent of the VitaminC foods consumed by all students, and there were nosignificant differences by sex or grade level.
Only 4.3 percent of all students reported that theyate fortified cereals, whereas, 6,4 per cent reported;eating other cereals. Again, there were no significantagf or sex differences. Approximately 50.5 per cent ofall students said they ate enriched breati products.Five per cent of both boys and girls said they did nothknow if the bread products they ate were enriched. .
Height & Weight Averages for WisconsinChildten
The development of height-weight means andstandards deviations was considered one of the moreimportant aspects of the project. Each student par-ticipant was weighed and measured. thus generatingdata representative of Wisconsin children aged 5 to18.In 1952 Watson and Lowrey" indicated that "manystandards now in use cannot be applied to differentjaciftl- groups or to groups from widely divergentgeographic areas. Separate standards applicable tothe subjects undergoing examination should beused." 7
:.,;Even though other nutritionists have agreed withWatson and Lowrey, very) few have obtained datawhich would be representative of a geographic areasuch as a state. Hamill, Johnston and Lemeshow" aspart of a national health survey which was supportedby the U.S. Department of Health, Education andWelfare provided information which the investi-gators of this project would like to use for com-parison. The study presents a cross-sectional percen-tile distribution of weight, and height viilehrepresents an enormous but well-defined population.The study was done in two segments with two yearsbetween each segment. Children ages 6-11 and 12-17years were w ighed and measured, Some of the samestudents wer included in ;3oth segments. Beforeacomparison c ld be made with this Wisaonsin study,
41

Figure 9:
170 -
160.-
150 -
140 -
IX:1-120
.110 -- ci).z lop
0 90-. a
80
70 -60-50-40 -30
WISCONSIN-IOWA COMPARISONWEIGHT CURVE -GIRLS
Iowa
WEIGHT VALUESMean, Mean ± 1 Standard Deviation
170 -
160 -
150 -
14Q
130
120
. co 110
z 100.-..§o
80 -70 -
60-50
40
po-
5 9 110 11 12 13 . 14 ). '15 16 -17 YEARS
WISCONSIN-IOWA COMPARISONWEIGHT CURVE-BOYS
Wisconsin
Iowa
WEIGHT VALUESMean, Mean ± 1 Standard Deviation
5 6 10 11 12 13 114 115 16 17 YEARS
3442

Figure 10:
U)
75-
706560
55-
50
.45 .-
40
35
WISCONSIN -IOWA COMPARISONHEIGHTURVEGIRLS
.
- - - - - -""
aWisconsin
Iowa
HEIGHT VALUESMean, Mean ± 1 Standard Deviation
75-
70_.
cN
60c.)
5550f45-
40
9 1i) 1'1 1'2 13 14 15 16 17 YEARS
WISCONSIN -IOWA COMPARISONHEIGHT CURVEBOYS
35
Wisconsin
Iowa --
HEIGHT VALUES. Mean, Mean t 1 Standard Deviatiori
10 11 12 13 13 . 15 16 17 YEARS
:15
4,3

the data for students *o participated in bothportions of the national health survey would have tobe extracted.
Data from the. National 'Health Survey" indicatesthat both boys and girls tend to be taller and heavierin the midwest and northeast than in the south orwest. Our data shows Wisconsin children are tallerand heavier than students in the 1964 Iowa Study9(See Figures 9 and 10). The. Iowa height-weightcharts were used to compare with Wisconsin becauseall ages of students were included in both studies:Studies by Tanner and others" as well as' the Iowastudy were made on clinical populations rather thanzepresentative samples of a large population; where-as, Wisconsin data is representative of children agesfive to eighteen throughout the state. The 'HealthExamination Survey (HES)" is representative of theentire United States population, ages six toseventeen!
Most of the clinical height-weight studies andcharts used for reference by physicians and publichealth nurses were prepared from ten to thirty yearsago. Many factors have exerted strong influences onthe growth rates and weights of children since thattime.
Hopefully, this study will provide the basis forcontinued study and research by graduate students.The data and charts' presented may be used by publichealth practitioners and consultants, physicians,nurses, dietitians, school nurses andteacher's6
Construction , of the height=vieight curves wasbased on a mean curve and standard deviation.Points plotted on the curve correspond to age andheight and age and weight recorded in the presentstudy. The middle carve shows the average or meanheight or weight fOr a given age. The outside curvesrepresent one standard deviation above and belowthe mean. Sixty-eight per cent of all students fallwithin the range between the top and bottom curves.In the present study, 75 per cent of all boys and girlshad weights which were within the deviation parame-ters.
Eating Patterns Compared to WeightTable 17 shows the percentages of underweight,
normal and overweight children according to sex andgrade level. This data was analyzed-in an attempt todetermine variations in eating patterns among thethree groups; however, no significant differences ineating patterns were discovered.
When each meal and separate.-en4k period wasanalyzed, however, significant differences between Igrade levels for both sexes emerged. For example, ahigher percentage (42 per cent) of overweight chil-dren ate cookies, cakes, doughnuts, etc., with the
36
evening meal than did underweight 132 per cent) ornormal weight (31 per cent," children. On the otherhand, fewer overweight or normal weitht children(five per cent each group) ate these dessert foods at-snack time than did underweight children (10 percent). More overweight children reported: eating jamand jelly with breakfast than did normal or un-derweight children.
The percentage of underweight and overweightboys, grades 7-12, who consumed three or moreservings of bread . and cereal each day were verysimilar. Howeve,r, there was a 16 per cent differencebetween underweight and overweight girls in grades10-12 for the number of times bread and cereal wereconsumed each day. Thirty per cent of theoverweight 'and 46 per cent of the underweight girlsresponded "yes" to eating three or more servings ofbread and cereal each day.
TABLE 17: UNDERWEIGHT, NORMAL, ANDOVERWEIGHT CHILDREN, BYGRADE LEVEL AND SEX
GradeLevel
Under-weight Norm1
Boys Girls lip; Girls
Over-weight
Boys Girls
K-3 N 88 77 54 531 90 8612.3 11.1 75.2 76.5 12.5 12.4
4-6 N 58 69 464 449 72 84
to 9.8 11.4 78.1 74.6 12.1 14.0
7-9 N 63 65 367 342 75 "70/0 12.5 13.6 72.7 71.7 14.8 14.7
10-12 N 60 57 303 348 54 64
14.3 12.2 72.7 74.2 13.0 *13.6
All Grade Levels by SexUnder- Over-weight Normal weight
Boys Girls Boys Girls Boys GirlsN 269. 268 1674 1670 291 304
% 12.0 11.9 74.9 74.5 13.0 13.6
All StudentsUnder-weight
N 53712.0
Normal334474.7
Over-weight
59513.3
Note: The mean weight for each age group by sex'was determined. Underweight and overweightchildren were those whose weight fell morethan one standard deviation belov and abovethe mean. See Figures 9 and 10-for graphicpresentation of data.
44

Differences between underweight and overweightchildren were very small in the numbers of times thatcandy, chocolates, gum, potato or corn chips,pretzels, fruit pies or cream pies, pop,' soda, softdrinks, and crackers were consumed. Also there wasno significant difference between the number ofunder- or overweight boys or girls with a satisfactorydaily pattern for all meals.
Overweight children did not record eating any of
the foods during the snack periods (including highcalorie dessert type snacks) more often than did theirnormal or underweight peers. Survey data indicatethat it was not the eating patterns for overweight --
. school children which caused or sustained theirexcessive weight. Since the study made no attempt tqobtain quantities of foods, consumed, no accurate .
deduction could be made attributing the obesity ofthese children to amounts of foods eaten.
37

4
Bibliography
1. Adelson, Sadye F. "Changes An Diets of Households, 1955- 1965.'! Journal of HomeEconomics 60(6): 448-455 June 1968.
2. Bettelheim, Bruno. Food° to .Nurtiire the Mind. The Childreit's Foundation, Washington,D.C. 1970.
3. Bills, Robert E. "Motivation: A Problem of Choice." Wisconsin ,Journal of PublicInstruction. Spring 1972. 120-132.
4. Callahan, Dorothy L. "Focus On Nutrition: You Can't Teach a Hungry Child," School FoodService Journal. March 1971.
5. Callahan, Dorothy. L. "Focus. On Nutrition: You Can't Teach a Hungry Child." School Food,Service Journal. September 1971.
6. Dobbins, Frances W., Al Jennings and Scott Tuxhorn. A Report of Oklahoma Food HabitsSurvey. School Lunch Division, Oklahoma Department of Education, Oklahoma City, 1970.
7. Deutsch, Ronald M. The Family Guide Ao Better Food and Better Health. MeredithCorporation, Des,Moines, Iowa.1971.
8. Edwards, Cecile ,H., Gaynen Hagan and Sandra Spohr. "Nutrition. Survey of 6200 Teen-Age Youth." Journal of the American-Dietetic Association 45: 543-546. 1964.
9. Eppright, Ercel S., Emil Jehe, Virginia Sidwell. "Nutrition of 9, 10 and 11-Year Old PublicSchool-Children in Iowa, Kansas and Ohio." North Central Region Publication No. 59. IowaAg. Experiment Station. Amer, Iowa 1955.
10. Garvue, Robert J., Thelma G. Flanagan, William H. Castine. "School Food Service andNutrition Education" Special Study No. 8. National Education Finance Project, 1971.
11. Hamil, Peter V.V., Francis E. Johnston, Stanley Lemeshow. "Height and Weight of Youths,12-17 Years, United States" Vital and Health Statistics Series 11, No. 124, U.S. Departmentof HEW, 1973.
12. Hampton, Mary C., Ruth L. Huehemann, Ruth L., Leona R. Shapiro, Barbara W. Mitchell."Calorie and Nutrient Intakes of Teen-Agers" Journal of American Dietetics Association.50 (5) : 385-396, 1967.
13. Johnson, Nancy E., Nitzke and Vande Berg. "NARS Validation Studies" Home EconomicsResearch Jocirnal 2:210, June 1974.
14. Lund, Lois A. and Marguerite C. Burk. Multi-disciplinary ,Analysis of Children's FoodConsumption Behavior. Minnesota 1967.
15. National Center for Health Statistics: Plan and Initial Program of the Health ExaminationSurvey. Vital and Health Statistics PHS Publication. No. 1000 Series 1 No. 4 Public HealthService. Washington. U.S. Government Printing Office, July 1965.
16:! National Center for Heafth Statistics: Cycle 1 of the Health Examination Survey: Sampleand Response. -Vital and Walth Statistics PHS Publication No. 1000 Series 11 No. 1 PublicHealth Services. Washington, D.C. U.S. Government Printing Office.
17. "Nutrition Education Brings Schools Together" School Foo ervice Journal, October1975. Volume 29. No..9 P.P. 33-36.
18. "Nutrition Education: Tracing a Five-Year Plan" School )od Service Journal, May1976.volume 30. No. 5 pp. 56-60.

T
19. O'Farrell, Michael J. and Jean L. Kendreck., "Educators' Attitudes Towajd NutritionEducation in Florida." Journal. of Nutrition Education. Winter 1972. 4 (1): '15-16.
20. Post; Edward. J., Jack Ninemeiei, "Nutrition' Education in the Classroom." Unpublished
Issue Paper, Bureau Of School Food Services, Wisconsin Department of Public Instruction,
March 1970.
21. "Raising Participation the USDA Way." School Foikl Service Journal, June 1975. Volume
29. No. 6pp. 39-40.,
22. Roper, Elmo, A Study of the Teaching of Nutrition in.the.Public Schobls. Cereal Institute,
Inc. Chicago, Illinois 1951.
23. Schubert, Earl J. "Nutrition Education: 'How Much Can c)r Should Our Schools Do?"Journal of Nutrition Education, Sufnmer 1970, pp. 9 -13.
24. Sliepcevich, Elena M. "School Health EducatiOn',StUdy-LA Summary Report." School
Health Education Study. Washing, 1964.
25. Stare, Frederick J., Margaret McWilliams. Living Nutrition. John Wiley and Sons, Inc. New
York, 1973.
26. Tanner, J. M. "Growth at Adolescence." Second Edition, Oxford. Blackwell, 1962.
27. The"tatus of Nutrition Education: A Report °ma Survey of. USOE 51 SEA's and Selected
LEA's and Private Schools." Education CoMmission of the States,.Denver, Colorado, 1975.
28. Trulson, Martha D., Mark Hegsted, and Frederick J. Stare. "New York State. Nutrition
Survey I. A Nutrition Survey of Public School Children." Jotirnal of the American Dietetic
Association 25: 595-605, 1949. refl29. University of the State of New York. Health Curriculum Materials, Physical Health.
Nutrition Strands I, II, III and IV: Special fdition for evaluation and discussion. Albany,
New York, 1970.
30.. Watson, E.H., and G. H.h Publishers, Chicago, 1952.
LOwrey. Grotvtlt*nnd Development of Children.
e
31. "White House Conference on. Food, Nutrition and Health." Final Report. U.S. Government
Printing Office. Washington, D.C., 1971. .
32. "Working and Learning in School Foo4servic 4St:hool Food Service Journal: November-December 1975. Volume 29. NO. 10pp:66-71.
Year Book

APPENDIX
Principals and TeachersTable 18
Per Cents and Numbers of Principals '(by SchoolLocation and School Organizatioh) Sampled in Principal Sample.
Schoolorganization
Per Cent in PopulationMilivaukee Non-Milwaukee
Numbers in SampleMilwaukee Non-Milwaukee
TotalNumbers
(K-6 5.44 64.31 31 : 374 .405Middle 3.72 22 22Junior High .81. 7.46 5 43 486 yr. Secondad .13 .94 f 1 6 74 yr. Secondary .30 13.54 2 /79 813 yr. Secondary .26 3.09 2 18 20Totals 6.94 93.06. 542 583
Table 19Per Cents and Numbers of Teachem (by Grade and
Location) Sampled in Teacher SamplePupil Per Cent in Numbers in Total
School Teacher Population Sample Num-Location Ratib K-3 4-6 7-9 10-12 K-3 4-6 7-9 10-12 bersMilwaukee 21.52 4.06 2.84 2.93 2.91 41 29 30 29 129Non-Milwaukee 22.85 28.80 22.59 24.19 24.42 288. 225 241 244 998
Totals 329 254 271. 273 1127
SchoolLocation
MilwaukeeNon-Milwaukee
Number teachers from each school to berandomly chosen for Sample
4 3 8 73 2 6 .7
41
K-3 4-6
48
7-9 10-12

Table 20Numbers of Schools (by type and grade) and Students (Within school
types and grades) Sampled in Student Sample
A. Schools by Type and Grade: Minimum, Overage, and Total Numbers
School Types K-3 4-6 7-9 10-12 Totals Per-Min. Over. Total Min. Over. Total Min. Over. Total Min. Over. Total Min. Over. Total cents
Milwaukee 10 2 12 10 2 12 3'_ 1 4 3 1 4 26 6 32 9.00
Large 31 5 36 37 6 43 9 2 11 8 2 10 85 15 100 28.00
Non-Milwaukee Medium 32 6 38 33 6 39 13 2 15 11 2 13 89 16, 105 29.00
Small 41 7 48 41 7 48 13 2 15 9 2 11 104 18 122 33.00
Total's 114 20 134 121 21 142 38 7 45 31 7 38 304 55 359 100.00
B. Students within School Type and Grades: Minimum, Overage, Total Numbers
Milwaukee- 163 81 244 114 57 171 117 59 . 176 116 58 /174 510 255 765 13.00
Large 59Z 296 888 511 255 766 518' 259- 777 524 262 ..786 2145 1072 3217 53.00
Non-Milwaukee Medium 288 144 432 204 102 306 250 125 375 253 126 379 995 497 1492 25.00
Small 110 55 165 75 38 113 82, 41 123 83 442 125 350 176 526 9.00
Totals 1153 576 1729 904 452 1356 967 484 1451 976 488 1464 4000 2000 6000 100.00
C. Number Students within each School to. be-Randomly Chosen for. Sample
K-3 4-6 7-9 10-12
Milwaukee 20 14 44 44
Large 25 18 71 79
Non-Milwaukee Medium 11 8 25 29
Small 4 3 8 11
Table 21Description of Large, Medium,
and Small School Sizes for Non-Milwaukee Schools
A. K-3 and 4-6 Strata ,.
School Number Students Number Schools Per Cent,Schools Per Cent Students*Size in Schools K-3 4-6 K-3 4-6 K-3 1 4-6
7-'Large 400 - 1300 450 524 30.00 33.00 14.79 12.77
Medium 200 399 465 476 31.00 30.00 7.18 5.10
Small 1 = 199 586 588 39.00 37.00 2.77 1.88
Totals 1501 1588 100.00 100.00 24.74 1.9.75
IB. 7-9 and 10-12 Strata
School Number Students Number Schools.' Per Cent Schools Per Cent Students*Size in Schools 7-9 10-12 7-9 , 10-12 7-9 10-12
Large 700 -. 3500 . 144 123 28.00 30.00 . 12.96 13.11
Medium 300 - 699 184 156 36.00 38.00 6.25 6.32
Small 1 - 299 184 131 36.00 32.00 2.05 2.08
Totals 512 410 100.00 100.00 21.26 21.51
*Percentages are apiroximate and are of the total student population in State during the 1972-73 school year.87.26 per cent of students were enrolled in non-Milwaukee schools, the figure to which the four strata per cents
will add. ./
42
49

Table 22Description Of Schools and Student
Population Breakdowns for Milwaukee and Non-Milwaukee Schools
A. Description of Schools in Grade StrataSchool Number Schools* Per Cent SchoolsLocation K-3 4 -6 7-9 10-12 K-3 4-6 7-9 - 10-12 TotalMilwaukee 127 127 29 16 2.95 2.95 .67. .38 6.95Non-Milwaukee 1501 1588 512 410. 34.82 36.84 11.88 9.51 93.05Totals 1628 '1715 541 426 37.7'7 . 39.79 12.55 9.89 100.00
School.Location K-3Milwaukee 4.06Non-Milwaukee 24.74
Totals 28.80
B. DescriptionPer:Cent Studentg,
of Students in Grade Strata
7-9 N10-122.R4 2,93 2.91
19.75 21.26 21.5122.59 24.19 24.42
Totals12.7487.26
100,h0
*School, for purposes of sampling, are counted more than once if they had students in more than one gradecategory. They will therefore not total 2340, which was the number of school buildings.in 1972-73.
%
4:1
5 0

DO NOT WRITEIN THIS SOX
I1.1 1@CXD00000MOCXDO0000000000CXXX)(DOCDO00000@OSOC)(00000,
-
CO DISTRICT SCHOOL P
OMB 40 572011'APPROVAL EXPIRES 2-28- 74
. WISCONSIN NUTRITION EDUCATION SURVEY131 FOOD SERVICE MANAGERS
WISCONSIN UNITED STATESDEPARTMENT OF PUBLIC INSTRUCTION DEPARTMENT OF AGRICULTURE
Barbara Thompson, Ph.D., State Superintendent F ood and Nutrition ServiceThis survey consists of questions or. Statements vr.lirch 11,1v., 110 rrgirt or %NI 011g .171SWIJ.your personal opinion is Wanted. Read each statement 01 ruiestir .in carefully anddecide what you think about it USING A NUMBER ? PENCIL BLACKEN THECIRCLE NEXT TO THE ANSWER. YOU CHOOSE ERASE L:oroPLE TELY ANYTHING YOU WANT TO'CHANGE For this surveN,,, nun it,on I Ilu ailun Is rir:firledas "The knowledge of food,.hoW the body uses it And of this know-ledge to the formation of rjoud.eating halms"
1. Please mark the number of years you have worked inthe school lunch.program.0 0- 2 years0 3 5 yearsO6 7 years08 or more years
Please mark courses taken in preparationpttion.0 tithe job training-0 Short Courser I .(area' Vocational School)°Intermediate Short Course()Advanced Short CourseOVVFSA workshop(s)0Wocks,loos concluded by DPI0College course or. workshops00thue ('specify hriefl.y beltivy)
for your
00 NOTWRITE
OUTSIDEDOUBLE
LINES
1°13. Have you taken courses in nutrition education?0 Yes ONo
Who plans the Type A school lunch menus used inyour school?0 Cook managerts)0 District supervisor0Home economics teacher
Is a daily check made to determine.the amount ofplate return?0,y,s ONo
.
IM 6. Are all children required to take a small portion of.each menu item served?0 Yes OrNu
7. Please indicate the number of different main dishfoods served in your school during the month ofSepteMber, 1973.00 to 506 to 10'011 to 15016 to 20020 or more
8. Please indicate the number of different 'kinds ofvegetables that were served during the month ofSeptember. Include those used in salads and relishes.0 0. to 304 to 708 to 110 12 to 150.16 or rilore
9. Do some of the children in your school.(Mark one or more)0 Go home for lunch'0 Buy their lunch itO Eat no lund1).
10. l bw long are lunch periods in your0 less than 20 minute,. Ili II iirdli020 minutes or 4,111011020 to 30 11111Litr'S0 30 to 40 minutesQ Irimiur than 40 minutes
school 7'
11. Are students .permitted to leave the clinuig area whenthey have finished eating?
Yr:'s 0 NO
12. Is the dining area in your school.
Clean?.Attractively painted?Well.lighted?Decorated with posters, etc., forspecial occasions?TOO crowded for curt11oi1,1111r.
Yes NoO 0O 0
0O 0
0
13: Which individuals encourage students to taste allfoods served at lunch? (Mark one oi'morel
Te,ichers/0Cooks and sir
Allunriistr dro, k_0 Food Servio.ONe one
Ncs TrafIS 0771IL F 1864 54321 SIDE 1 JULY 1973
45

14. How are school childrentinvolved in thelunch program?(Mark one or mote),()Suggesting menu Items()Making posters0)11/ttrking on tasting panels()Suggesting lunchroom policies or procedures for service()Offering opinion of foods served
-..*()Working in the kitchen or dishroom0Students are not involved in any way
15. Please rate the folldwing reasons for the food service Program
OMB - 40 5)2085 APPROVAL EXPIRES 2 - 28 - 74
DO NOT WRITE
IN THIS SPACE
in your school. (Mark the appropriate response for each)VERY
IMPORT ANTmot,r.Alt SLIGHTLY'
IMPORTANT
A. A convenience for parents 0
B. A means of meeting at least 1/3 of students' daily dietary needs 0
C. A learning laboratory for nutrition education 0 a
D. A means of providing a meal for children of working, mothers 0
E. To provide free Meals for economically deprived children
F. To help children form good food habits
16. What resource materials generally are availableyour schoolTor nutrition education?(Mark one or more)0 Text books().Library reference books0 Foods()Food 'models()Magazines00verhead transparencies()Field trips.OFilms()Film strips0Posters0 Other (specify briefly below)
4t*
NOTIMPORTANT
Q
in 19. Do you -agree or not that adults in your communityare interested in learning more about nutrition?(Mark one) ,
0 StrOngly agree,0 Agree ,
0 No opinion0 Disagree0 Strongly disagree
20. Which of thelollowing wouldbe the best topics to 7cover in parent nutrition education programs?(Mark one or more)0 The advantages of eating a good breakfast0 The advantages of eating agood lunch0 Food needs :of different ages()Selection of snack .foods0 How food .affects physical development
Food. clioicel/ of school age children()School foodservice contribution to nutrition0 Organic foods()Special diets and weight control
21. Indicate the.rnetnod you think would be best forpresenting a parent 'nutrition education program.(Mark one or more)0 Parent:teacher orgaiyizations0 Educational television()Special classes fbr .parents of students0 Articles in newspapers or magazinesOSpecial workshops presented by University or
Department of Public Instruction personnel
00 NOT WRITE OUTSIDE DOUBLE LINES
17. What is your role in nutrai n education for the.students' in your school? (Mark one or more)0 To act. as a resource !rerson, for teachers
OTo encourage students to try newfoods01 have no role in nutrition education for strident'0 Other (specify briefly below) DO NOT
WRITE
OUTSIDEDOUBLE
LINES
18. How are nutrition problems of students discussed
with their parents? (Mark one Or more)0At PTA meetings0At parent-teacher conferences0.By sending materials home with studentso With the help of school nurse 70 Not discussed
WISCONSIN NUTRITION EDUCATION SURVEY.
FOOD SERVICE MANAGERS
SIDE 2 JULY, 1973
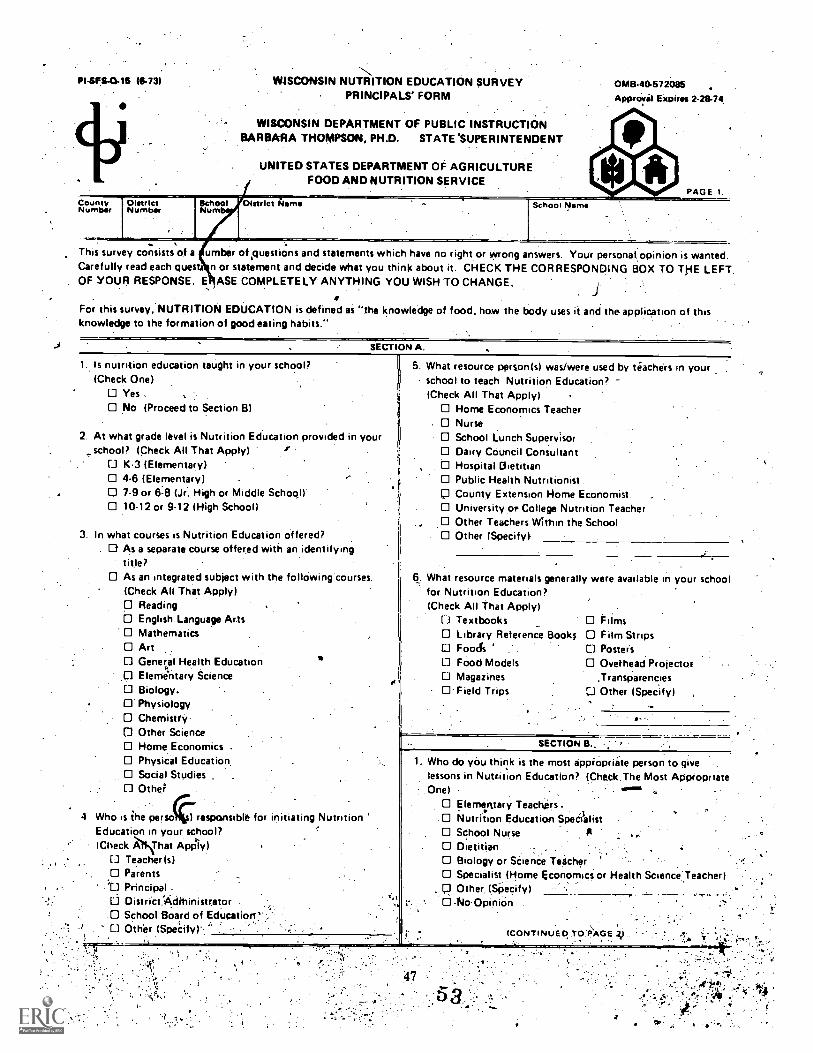
Pi-SFS-0-15 (673) WISCONSIN NUTRITION EDUCATION SURVEYPRINCIPALS' FORM
WISCONSIN DEPARTMENT OF PUBLIC INSTRUCTIONBARBARA THOMPSON, PH.D. STATE 'SUPERINTENDENT
UNITED STATES DEPARTMENT OF AGRICULTUREFOOD AND NUTRITION SERVICE
CountyNumber
DistrictNumber
SchoolNum
District ;isms
OMS.40.572085
Approrii Expires 2-213-74
School Name
PAGE 1.
This survey consists of a umber of questions and statements which have no right or wrong answers. Your personal opinion is wanted.Carefully read each quest n or statement and decide what you think about it. CHECK THE CORRESPONDING BOX TO THE LEFT.OF YOUR RESPONSE. E ASE COMPLETELY ANYTHING YOU WISH TO CHANGE.
For this survey, NUTRITION EDUCATION is defined as "the knowledge of food, how the body uses it and the-application of thisknowledge to the formation of good eating habits."
J
SECTION A.
1. Is nutrition education taught in your school?(Check One)
O Yes.O No (Proceed to Section B)
2. At what grade level is Nutrition Education provided in yourschool' (Check All That Apply)
U K3 (Elementary)O 4.6 (Elementary)
7-9 or 6-B (Jr.. High or Middle School)O 10-12 or 9-12 (High School)
3. In what courses is Nutrition Education offered?. (3 As a separate course offered with an identifying
title?O As an integrated subject with the follOwing'courses.
(Check All That Apply)a ReadingO English. Language ArtsO MathematicsO ArtO Gener,el Health Education.a Elementary Science
. 0 Biology,O PhysiologyO Chemistry"O Other ScienceO Home Economics .
O Physical Education....0 Social Studies ,
0 Other'
4 Who is the pert() 1 responsible for initiating Nutrition 'Education in your school?(Check AA ! That Apply)
U Teacher (S)O Parentstl Principal .
0 Distribt.Adthinistrator .
.0 School Board of Education'':... ' 0 Other (Specify)".
1 .
si
5. What resource person(s) was/were used by teachers in yourschool to teach Nutrition Education?(Check All That Apply)
O Home Economics TeacherO Nurse0 School Lunch SupervisorO Dairy Council ConsultantO Hospital DietitianO Public Health NutritionistO County Extension Home Economist .
O University or College Nutrition Teacher.,, O Other Teachers Within the School
O Other (Specify)
6. What resource materials generally were available in your schoolfor Nutrition Education?(Check All That Apply)
Textbooks 0 FilmsO Library Reterence Books 0 Film StripsO Foods 0 PostersO Food Models 0 Ovethead ProjectorLI Magazines ,Transparencies0- Field Trips U Other (Specify)
SECTION B..
1. Who do you think is the most apprOpriine person to givelessons in Nutrition Education? (Check. The Most AppropriateOne)
O Elemerttary Teachirs.
O Nutrition Education SpecialistO School NurseO DietitianO Biology or Selence TeacherO Specialist (Home Ecoriomici or Health Science; Teacher)
. p Other. (Specify)-NoOpiniOn
(CONTINUE 0 TO PAGE 2,1
1.4

WISCONSIN NUTRITION EDUCATION SURVEY PISFS-0.15 16.73)
SECTION B. (Continued)
Q14E140.572086
APproval Expires 2.213. 4
SECTION C. (Continued)
PAGE 2.
2. At what grade level do you think Nutrition Education. should be offered? (check. One)At Every Grade Level
K ThrOugh 6In Grades 7 Through 9In Grades 10 ThrOtigh 12Other (Specify)No Opinion
3. How mightaddltionattraining for,teachers responsiblefor Nutrition Education subjects best be provided?(Check One)
In-service Training Programs (Workshops)In SeminarsThrough University'ExtensiOn CourseIn Summer School Courses'.In,Regular University Undergraduate and GraduateCoursesOther (Specify)No Opinion
b4. What should additional training for teaChers in. Nutrition
Education foCus on(Check All That Apply)
Teaching MethodoldgyContent (Curriculum)Principles of Nutrition -
CI Use of Nutrition Teaching AidsNo Opinion
, SECTION C.
5. Does your school participate in a school lunch program?(Check Oner
Yes
No (Proceed to Section D)
6. How are school children involved in the lunch program?(Check All That otpply) 1
Suggesting Menu ItemsMaking Posters..Working on Tasting PanelsSuggesting Lunchroom Policies or Procedures forServiceOffering Opinion of Foods Served 4.1'
Working in'the Kitchen or DishroomStudents are not Involved in Any Way
7. Please rate the following reasons for having the food serviceprogram in your school: (Cheek One Rating For Each Reason)
;it 9iNIPORTANT.
Vsry Mot:loran. Sirt Nor
CI
L1
CI
L-1 [1
C] C) L1 C)
Cl . [1 [1 Ll
SECTION 0.
1 DP some of the children in your school(Check All That Apply)
I ) Go Home for Lunch?L) Buy their Lunch at Local Stores?Ll Eat No Lunch? .
. .
2 How long are lunch periods in your school?(Check One)
U Less Than 20 Minutes in LengthCl 20 Minutes in Length ".
20 to 30 Minutes1:1 30 to 40 MinutesO Longer Than 40 Minutes
a Are the students permitted to leave the dining area whenthey have finished eating?(Check,9ne)-
O YesNo
4. Is the dining area in'your school: (Check All That Apply)Yis 0 No Clean.?
Yes LI No Attractively Painted?Li Yes No Well Lighted?(.1 Yes No Decorated with Posters etc for
Special OccasionsYes No Too Crowded for Comfortable
Eating
A Convenience forParentsA Means of Meeting atLeast 1/3 of Student'sDaily Dietary NeedsA Learning Laboratoryfor Nutrition EducationA. Means of Providing aMeal for Children ofWorking MothersTo Provide FreeMeals.for Economically DeprivedChildrenTo Help Children Form
' Good Food Habits
I. Do you agree or disagree that a comprehensive healtheducation curricUiuni should include nutrition?(Check One)
Strongly Agree L7 Disagree
Agree [3 Strongly DisagreeNo Opinion
Do you agree or disagree that the Department of PublicInstruction should provide a Nutrition-Education curriculumguide for teacher's use in preParing lesson plans for NutritionEducation? (Check One)
p Strongly Agree Cl Disagree
"C) Agree 0 Strongly DisagreeNo Opinion
2
3. Do you-agree or disagree that all prospective teachers should berequirei to take a course in nutrition? (Check One)
Strongly Agree Disa§ree.
C1 Agree Strongly DisagreeNo Opinion
THANK YOU FOR YOUR CoOPERATtON IN .
COMPLETING THIS SURVEY
48

11111111.0111 IS II WISCONSINNUTRITION EDUCATION SURVEYTEACHER'S IORM
WISCONSIN DEPARTMENT OF PUBLIC INSTRUCTIONBARBARA THOMPSON. PH.D. STATE SUPERINTENDENT
UNITED STATES DEPARTMENT OF AGRICULTUREFOOD AND NUTRITION SERVICE
87= Olotc lot Nome
OMB 40 677086APOrOVI t holm, 22474
PAO
School Nemo .
This survey' consists of e number of questions and statements which have no right or ri ong answers Yotir personal opinialk is wantedCent ully reed each Question or ;moment and decide what you think about it. CHQCK THE CORRESPONDING 801( TO THE LEFTpo YOUR RESPONSE. ERASE COMPLETELY ANYTHING YOU WISH TO CHANGE.
For this survey; NUTRITION EDUCATION is defined as ''the knowledge of food, how the body uses it and, the applicatiohofthisknowledge to the formation of °pod eating habits."
. .
A1. Plain merk.the grade level you teeth this year;0 .K3 (Elementary) 44Check All That Apply)O 4.6 (Elementary)0 7-9.iir 7-8 (Jr. High or 1Nidfile School)
.0 10.12 or 9-12 (HighSchool)
A -2., Do you ever eat lunch at school? (Check Ohe)D Yes, I use the school food service program' Yes, but I do not use school lunch facilities
No
A3. Is A pan of your job responsitilities to Supervisechildren at lunchtime? (Check One)0 .Everyday
Len Than Everyday But at Least OnceLess Than Once Week
0 Never IGo to ou'estion 5)
a Week
.t, tA4. If you do have superviiery responsibility at lunchtime.
is other free time Scheduled for.you? (Check One)..0 Yes..O'No
A-5. Describe' your background in nutrition.(Check All That Apply)0 Took.. Regular College Course i4n
Food and/orNutriticin .
O Studied Nutrition in, Connection with other CollegeSubjects
0 Attended a Nutrition'Workshoosd/or InserviceTraining Course.'Learned About Nutrition onlibly Own
`.' a Never Studied Nutrition
A-6: Would you be willing to attend any of the followingNutrition Education couAllts?
Yes (If Yes. Check All That Apply)' Graduate Credit Course. Taught in Summer School
GradUate Credit CoUrse Taught in your AreaDuring the YearNon-Credit Workshop ornhort CourseCorrespondence Course
No
8. 1. Did you teach a nutrition unit In any Of your cow ses lastschool, year? (Check One)
Yes
No (Go utCluestion C.1)
8.2. Indicate the wade level you taught last year(Check Ail,That Apply)
K.3 (Elementary)4-6 (Elementary)7-9 or 6-8 (Jr. High or Middle SchoOl)10-12 or 9.12 (High School)
8.3. Wtio is/are the parsons) responsible for 'muslin !NutritionEducation in'your school? (Check All That Apply)
.Tzciff(s)d Parents
PrincipalDistrict Administrator
O School Board of Education.
tc0- Other (SPecityl
C
r.
.
t
8,4 Did you teacA,nutrition to? (Chita( One)'Girls Only
O Boys OnlyO Both
8-5. tApproximbtely how many hours of Nutrition EdUcation dideach student taught by you,receive during the lait year(Check Onel
0-2 Hours3-6 Hours6-10 HoursMore Than 10 Hours
8.6. Which guides did you use'in teaching Nutrition Educat(Check,All`That Apply).
Local School District CurriculumBuilding-CtfrriculursiCurriculum Developed by myself
. Curriculum Developed 13y Myself and Others (Spekly)
49
OtherNSpecify)
,s,
et
ra

ElittURSEALOLLISLI137.? In what courses did ygu teach Nutrition? B 10.
O M a *Mate Course Offering with ar; IdetitifOngTitle
0 As an Integrated Subject:with tlie Following Courses
- (Cheek All T) it App ly)0 ileadind
o 12-.*English Latsuage ArtsO MathematicstJ ArtU Goners, Hipelth Education
Elemeraiy ScienceBiplogyPhysigiogi
O Chemistry '0Other ScienceHOirEconomics4PhysicalldocrkrionSociai'Studies
o Dther
B-8.
O
.44What resource persortjle was/were used in yoUttfkitritionEdycation unit?' (Chea All.That Apply)
Home Economics TeacherNurseSchool Lunch SupervisorDairy Council ConsultantHospital Dietitian.Public.Health Nutritionist 4,
County:Extension HomeEconomistUniversity or College Nutritjon TeacherOther Teachers Within the SchoolOther (Specify)
B9. *hat resource materials generally Were available in your
school for:Nutrition Eductition?.'(Check All That Apply)
Textbooks '0 Films .Library ghterence, Books CI Film StripsFoods , 'TA Posters'
CI 'Food Models Overhead Projector
'0 Magazines Transpire/I-cies*
Field Trips Dther (Specify):
B.-10. Which of the followingliological or.Social topics didyou emphasize in your Nutrition unit?(Che'ck All That Apply)
Source of FoodCulture Food PatterniIndividual Food HabitsImportance of Food in HistoryProblems of.HUrider in the WoffelEating a Well Balanced*Diet
0Importance Of a GoodBreafast.41Weight RedotionDiets
Results of Overeating lebesity)Poiitive Results of Good Nutrition (Strong Bozies,Good Complexion, General Well Being) .Which Foods..art. Sources of Nutrients (Rrotein,Minerals%tc.)
1%
0M11.405720013A royal E reit 2 2824 PAGE 7._
(Continued)O Function 01 NutrientsO Results of Deficiencies of Nutrients 4SuCh as Rickets)O How Food,is Digested ft
O How Food Nourishes CellsO Other (Specify)
B11. In,the first column, please check the method you used inyOur Nutrition Education Unit In'the second column please
check the methods that were most successful
sf
MostMethod Successful
Used Method
0
0
Tasting New and dotal-m.1w Foods
Learning to Identify New Foods
Using Food ModelsS
0 Encouraging Children to Tif4
ste AllFood Served at School Lunch w.
Planning Menus for School Lunch
Having Children Check if They 'are
Eating Enough of a Particular Food,(For Example, MilksHaving Children Develop Plan forImproving Food PracticesKeeping and /of Revising Reco'rds oft,.Food Eaten in bne Day .
'Conducting Small Antrrral Feeding.DemonstrationsClassification of Foods According'toFour Food Group;Planting Vegetable Seeds and WatchingThem GrowDiscussing. How Much of Various Foodsare _Needetfor Growth and Health,
. 0 Evaluating Progress in ImprovingChildren's Food .Practices
sO Making Surveys of Food Wasted byGrade Groups at 'School LunchSurveying Food Habits of Members ofClassandTheir FamiliesComparing Costs' of'Different WincleWFood ,, 'Going on Field TUps to Show How Foodsare Produced anctfibr Marketea,in. it
'Community.Studyindtood Habits ft People FromOther Parts of the U.S. and/or World
cf Using Resource People to cgme andTell Abou?Food'Lectures.
Dircussions
0 Using Films'or Film Strips
,. Discussing Weight and HeigritlAeasure-mem of Children in Class
ri
0
0

NtrfRiTiO0ADUCA ION SURVEY 111110183-1 01-731
B-12. How do you rate nutrition textbooks or reference booksfor student use in your class?(Check One)O Completely Adequate (Go to Question 1314)0' Somewhat Adequate0 Somewhlt InadequateO Completely InadequateO No Textbooks Available
B-13. What, if arty, were the problem(s) with the textbooks orreferences you .Used for Nutrition Education?(Check All That Apply).O Not Enough Material on NutritionO Material Too Advinced for Grade LevelO Material too Simple for Grade Level0. Material Out of DateO Materiel not InterestingO No Problems
B14. Please list the primary student text or reference bookused in your Nutrition Education unit .
Title
Author
Publisher
Year.#
C.I. Please,check the school grade level in which you thinkit is best to start Nutrition Education:(Cheek One)O K.3 (Elementiry).D 4!6 (Elementary)1./ 7.9 or 6.8 (Jr. High or Middle School)O 10.12or 9.12 (High School)CI Not Approptiate for the Classroom
C2. How do you feel about the statement that teachingchildren nutrition concepts will lead to better eatinghabits? (Check One)0 Strongly'AgreeO AgreeO No OpinionO DisagreeO Strongly Disagree
C3. What proportion of studentsin your classes do youestimate.actually have three well balanced meals aday?.Q Less Than 1/4
ID 1/4 toel 1/2 to 3/4 .
O Over 3/4
0M8-40-672085Approval Eitplres 2.28.74
PAGE 3.
C4. When students do not have three well-balanced meals, whichone of the three meals do you think is most apt to beneglected? (Check Oise)O BreakfastO Noon Meal0 Night Meal
C5 How are nutrition problems of student% discussed with thenparents? Check All That Apply)O At PTA Meetings.0 At Parent-Teacher ConfeiencesO By Sending Materials Home with StudentsO With Help of School Nurse0 Not DoicUssed
C6. Do you agree or disagree that adults in your community areinterested in learning more about nutrition?(Check One)O Strongly Agree,O AgreeO No OpinionO DisagreeO Strongly Disagree
-7. Which of the following would be the best topics to coverMparent Nutrition Education programs?(Check All That Apply)O The Advantages of,Eating a Good Breakfast0 The Advantages of Eating a Good LunchO Food Needs at Different, AgesO Selection of Snack Foods
. 0 How Food Affects Physical DevelopmentO Food ChoiCes of School Age Children .
O School Food Service Contributions to Nutrition 7
0 Organic Foods- 0 Special Diets and Weight Control dilt* -
C-8. Indicate'the method you think would be best tot piesentill9a parent Nutrition Education.prOgram(Check All That Apply)O Through Parent Teacher OrganizationsO On Educational Television0 'In Special Classes for Parents of StudentsO By Articles in NeWspapers or MagazinesO In Special Workshops Presented by University of
Department of Public Instruction Personnel
THANK YOU FOR YOUR COOPERATION INCOMPLETING THIS SURVEY
51
5%
a
_7

State of 1%7 loconsio DEPARTMENT OF PUBLIC INSTRUCTIONBarbaia Thompson. Ph70.
September 5, 1973
Dear Mr.:
State.Superintendent
Dwight M. Stevens. Ph.D.Deputy State $uperintendent
CONTACT: Mrs. Rachel N. NutterProgramDirector1-608-266-1046
A four-phase survey to determine what is currently being taught in nutri-tion at all grade levels in Wisconsin public schools has been developedthrough the combined efforts of members of the'Wisconsin Department of
. Public Instruction, the Wisconsin Divisioh of Health, and the University.
of Wisconsin. The attitudes and knowledge of representative butrandomlyselected public school ppl-nti pals and,teach*rs about nutrition educationin their schools will be determined. All:Schoo.Urood Service Managersand supervisors will be surveyed. InforMation concernniNhe food habi
1., patterns of approximately 6,000 Wisconsin'public school children will
be obtained through the use of a newly developed easily adMinitteredfood consumption questionnaire.
It is the first time in Wisconsin thatea nutrition survey has been madeof a statistically reliable representative sample of our public schoolchildren, kindergarten through twelfth grade. The surveys will providebasic data essential for the planning and implementation improved nutri-
' tioneducation for school children. Evaluation of the surveys will result .
in: (1) the development of a nutrition resource book which will be, '
part .of the critical health problems education curriculum guide for useby teachers K-12; (2) the provision of data requisite to the improvement
throughseminars, workshop and university. continuing educationof nutrition education.for teachers, food service personnel and adminis-tratorscourses.
The schools in your-distriCt which will participate in the survey areattached. It is essential that we receive the informatiOn from theprincipals ofthese schools in order to randdmly select students andteachers for the survey;
1. School and district name, .
2. The full name of"eaCh student in the grades indicated,3. Each student.grade leverand/or year in school,4. The name of each teacher, grade level(Wand subject(d)taught,
Because the food habit survey will involve'the same student for threedays, it will be necessary to havip his name on.the three forgot. However,
the person administering. the questionnaire wilf,pe instructed to removethe names upon completion of the survey if the student so desires.
We solicit and.appred*e your cooperation and interest in this survey.
Sincerely,
Barbara Thompson, Ph.D.State Superintendent
53
ao
01

......."."
State of Wisconsin DEPARTMENT OF PUBLIC INSTRUCTIONThompson, Ph,D.
State Superintendent
Dwight M Stevens.,Ph.D.Deputy State Superintendent
Date: September 5, 1973 .
Nemo To: Selected Public School Principals
11.
Subject: Nutrition Education Survey
CONTACT: MrS. Rachel N. NutterProgram Director1-608-266-1046 '
A request has been made to youn district administrator to involve
some of the district's students in a federally funded study ofnutrition education in.mpisconsin.' This is the first time that a
nutrition survey has been made:Of a ttatistilally reliable re-
presentative sample of Wisconsin.public sChoOl children, kinder-
garten through twelfth grade. The survey will provide basic datanecessary for planning improved, value oriented nutrition education
for school children. Evaluation of the survey will result in the
development 'of a nutrition resource book which will be part of
the critical health problems education curriculum guide for use by
teachers K-12.
We will be selecting a random sample of students in grades in your
school. To make the selection process we need a list of all
graders in your building. The roster should contain the following
information:
. 1. The name of your school and district.2. The full name of each student in the grades listed above.
3. Each student's'grade level and/or year in school.
4. The name of each teacher, grade level(s)and subject(s) taught.
.
We will be alphabetizing students by grade level before making our
randoM selection; so rosters that approximate that order will be the
most convenient for us. Feel free to send us computer print-outs
or attendance roster lists or other rosters. generated for student
accounting purposes. Please be sure that the information we need
is contained on each roster. Send the rosters to the contact
person named in this memo.
We appreciate your cooperation and help in this undertaking.
Sincerely yours,
2'/a?c4 .i....,tom f _-
vBarbara Thompson, Ph.D.State Superintendent
... ,
126 Langdon Street, Madisor. Wisconsin 53702
54

. .
tate of Wisconsin DEPARTMENT OF PUBLIC INSTRUCTIONBarbara Mammon. Ph.D.
State Superintendent
. Dwight M. Stevens. Ph.D.Deputy State SuperintendentDate: September 25, 1973
Memo To: Selected Public School Principals
0tlbject: Selectiod of: (1) a person to administer the student food consumption survey.
Contact: Mrs. Rachel N. Nutter,Program Director1-608-266-1046
Information concerning the food habit patterns of public school children is needed asone part.of- a federally funded survey to determine the current status of nutritioneducation .1*Wihdolutin. The three-day survey will provide basic data necessary forthe planning aWimOlemelhtationiof improved, value oriented nutrition education forschoolchildren: 'Theiiui:vs,iia-a simple 24-hour food recall instrument. It is plannedto as7iiss tatingpaite*s'And point up possible defiaiencies, if any, of certain nutri-ents. Suilplemental, bj.qthedidal'and clinical measurements may be requested by the Wis-consin Nutrition%Council.if,fhe'dietary results warrant it.
From the currentWii4r01*ht,figures.m.statistically reliable, random sample ofapproximately 6000 studentSgiOmen;mel#ted. . You will have students in yourschool participating. BecaUse of %be 'amii.11,;inunber of students selected from eachschool, one adult should be able to administer the survey.
Will you please'select a responsible adult who is interested in nutrition or healthto administer the survey. Funds have been provided for remuneration. for this service.If teacher loads and tommittments preclude participation in this survey, the selectionof the school nurse or guidance counselor are suggested as possible alternatives. Ifyou have io one in your school who can be assigned this task, please callphone _number , who will recoMmend a hospital dietitian or county home econo-mist to perform the survey supervision.
The questionnaires have already been coded with the.county, district, school, anstudent numbers and names. , If a student is ill or absent the first day of the survey,'do not attempt to replace that student.
All Audents from.your school lay fill out the forms at the same time. During the pre-test of the survey instrument, approximately one -half hour each of the three days wasreqUired by the children to complete the forms. If any of the stUdents selected inyour ichool'are in,kindengarten through third grade, the adult will need to fill outthe form for the child en a One to one basis which will require a longer time.
It will :be necessary to obtain the height and weight of each student participating inthe survey. Will you please see that accurate scales are available during one day of.the survey. You are &ncouraged to read the instructions to the adult supervisor pro-,svided with the forms in order that you may become familiar with all survey requirements.
a
av
126 LJugd eet. Madison, Wisconsin 53702
55
60

Enclosed is a sample letter f r the parenta.Orthe-Studenta selected from your school.
You may change the vording long as, the infOtmatiOn_remaAna essentially the same.
The parental letter shoul e mailed immediatelauggeSt:,tnat no one should know
what days the survey will be made in order:to TTeyentchangeS'in,menus and individual
eating patterns. The survey should be perfOrMed;on':TUeSdayednesday and TburSday,
1973.
Because the forms must be run through the opt ,idea scanner, it s impLmative that a
No.2 lead pencil be used to fill out all form's._ 'Be,s4Are the- forms are not folded or
stapled. The completed forma should be mailed,itpthe'eneloixe 'envelope.
The enclosed services and materials requisitiOnjormA shguld'be completed with the
number of hourstithe adult assigned to adminilter the-Stir,* 'worked. Please note that
funds have seen included xo pay for the pencils'. Alsovthe'district purchase order
may be mailed with the qu tion forms.
Sincerely,,
11/1(1(4 ii? 6 .07
Barbara Thompson, Ph.State Superintendent

Instructions to Give the Students Who Will Fill. in the Food Intake Questionnaire
1.. Ex?lain" what the questionnaire isThis is not a tesir The questions and answers will tell us what kinds
of toodyou eat each day'and when you eat them. You have been randomlyselected by computer in Madison to participate in a unique survey: It is-the first time in Wisconsin, that a food intake survey had been made which isrepresentative of all public school age students! It is the first time thata food intake survey has been made in Wisconsin on optical scanning sheets.
2. Explain "optical scanning" to students if they are not familiar withoptical scanning test and answer sheets.
The questions are printed on special paper. The answers are made byfilling in a small circle with a soft pencil. The question and answer sheetsare run through a machine containing a photo electric light which rqcor4sthe blackened circles on a spetial computer tape. If the answers artOefully-,,-made, aboutj500.sheets an hour can be run through the machine. The-mine -
can:,recordi4ily. the blackened circles. Your name at thetop of each pagecannot be recorded. If you wish, I will erase it before rreturn yourquestionnaire to Madison.
3. You will be 45.ked':Lttii.lrdut the same questionnaire on three ditOrent-
day I cannot telf:.-you'IMen:fTh4 other two days will' be We do not want youtohange your. normal eating habits because of the questionnaire. The sheets
are printed in different colors to help us here at the school..s'Today yourquestions will be printed in brown ink.
4. I will now hand out today's questionnaire. Please dd not make anymarks on the sheetsuntil I Have explained how to mark tht lnswers.
'ead -instruction!: : slowly:with the students. Are,fhere any questions?.
....
6. Be sure to aniwWeach.nUmbern sequence from .the- top of the page.to the bottom. Any-smudges made by your hand or arm on a part of the pagemake errors in the scanning..
7. Please turn to page three. Read with the students7he instructions andexample at the top of the page. You may want-to-wr-i-t-e-the-lexample on theblackboard and go through it again.
8. "Snacks" include all foods eaten at other than regularly designated mealtime (between breakfast and lunch, before breakfast, after last evening'smeal, between the lunch and evening meal:,'
t.
Either a "Yeslor "not' circle should be filled'in for .eachIbod grouplisted and for eachal or snack period on the sheet . If this'is not done ,
the optical scanner will reject the que'stion.
10. Please turn to page 4. Refer to number 47 near the bottom of thepage. If you do not know what the words "enr }ched ", "iodized", or"iron Fortified" mean, mark the "I don't know" circle. Any questions?
11. You may turn back to page one and begin.
57
62

Completing" the Forms
These. forms have been designed for scoring using an optical scanner which recordsthe data at a rate of approximately 1500 per hour if the forms are correctly marked.The following directions for marking the survey forme should be carefully followed:
1. A #2 lead pencil (provided for the survey) should be used to record allansweri. Collect the pencil the first two days..-The student may keep.,,the pencil after the final day of thesurvey. DO NOT USE PEN.OR COLORED.- ,
PENCILS
2. The forms are identical but,te Color coded for ease in designatingthe daye.to be filled out to:k:followi: Tuesday - Blue; Wednesday - Redi.Thursday - Brown.
^ . Issue only one-queatignnaire each day to each student. Writethestudent's name ,yin pencil at the top of,eachof the three,queStionnairesin the space provided. The name is 'ftir your use only. It'will help youin recording height, weight, age, etc. and in .being sure each student,receives the form with his or her number on it. The name may be erased,.if desired, before the forms are returned to this Office.,
4. Completely blacken the response circle for each question ask.e4': Blackeneach response circle individually. Do not connect cirCeSitb,eontin-uous lines. Make no other marks on the forms as they may be read by the
_
'optical scanner. Caution, the students not to make lines or,marks otherthan in the response Circles. . .%
5. If necessary to erase circles, do so as thoroughly aspossible withoutdamaging the form.
6. Record height and weight' measurements in the appropriate apaces..Otof the three. forms. 'The school nurse or physical education teachertaY,.be able to assist you in taking these measurements..Identifidatioriwillbe made of children who are over and under weightgorMs fOr their heightand age, by comparison with other Wisconsin children bf:thesame age andschool grade. The child 'Should.be dressed in normil;iporelothing.onlywhen weighed. Sweaters., jackets and shoes shoult:.beremoved. Boys shouldempty their pockets. Thelwight:should also be measured Withoutshoes.
.
It..peccird. age, grade and sex of each in the designated spaces on each..,of the the forms' before issuing the orale-to the students the firstday.
8., Obtain from the principal of Your school the names of those students whoa
qualify (according to district income criteria) to receive free lunches.On the questionnaires issued to these students, blackenohly the circleadjacent to the letter A in the b6x.on the right at the top of page 1.
9. 0CNOT FOLD OR STAPLE ANY 0? THE SURVEY FORMS OR THEY WILL NOT RUN THROUGH. THE SCANNER PROPERLY..
-
59

Completing the Form - (Cont.)
,. 10. There is only one answer for each eating period (L, B, D, S) from
numbersji to .46. For exemp)le, No. 9:' If no pudding or custard was
eaten at a meal or snack period thed)circle would be-blacked out
for lunch breakfast, dinner and snack period. Man, answers will
be no. q). It is important to fill in all"NO"responses, otherwisethe scanner will interpret 'the number as incomplete.,
.11. Example for filling out the survey questions:
#14 Egg L B D S
Wrong ADO MID
Wrong dpe mom' !DC'
Wrong 61)111
Correct ) 11111
00to.
CD
How: The easiest and most accurate method of recall:is to start with ,
-the most recent meal and work backwards. The surve:Should be made
each day .after lunch. Have the child start with..lunchtodav; then
work back to recess this' morning, breakramt.abia,morning; after supperlast night.; supper last night; and end with after school or recess
yesterday afternoon. Include only those foods actually eaten, not thefoods offered or served the child but not consumed. Ynu'need not be
' c6ncerned about the size of the portion of food eaten. The child is
asked to record only when the food was eaten.
For example:. One-half slice bread with butter and a large orange eaten
after dinner would be recorded under "all snaoke between meals" as having
eaten bread, butter and citrus fruit.
12. When the student turns in the form each day, check it thoroughly beforeexcusing the student. Be sure all questions are answered and circlescorrectly blacked in; no extraneous marks have been made, etaf
Definition of Terms:
Enriched'- If the student questions sou about enriched bread products, he probably
does not know if these foOds used in'his home are enriched. He should mark "Don't'
know." 'Do not define enriched for hiM. Enriched bread, as all adults know,are products nutritionally improved by,replacing or restoring amounts of thiamine(riboflavin, niacin, and iron removed in the.rfining processes, and is usually notedon the product.Iodized - If the student questions you about iodized salt, he pro
\111bly does not4
know if the salt used in his home is iodized and should' ark his an war "Don't
know." Iodized salt contains iodine which everyone needs for normal body functioning.Without enough iodine the thyroid gland tends to enlarge and the enlargement is
known as a goiter.3
The students may question their parents and record a different answer on the second:
or,third day. This is permissible,
3
60
1

WISCONSIN NUTRITION , EDUCATION 41111111ElttCHILDREN'S FOOD INTAKE 4e.
WISCONSIN DEPARTMENT OF PUBLIC INSTRUMONBARBARA THOMPSON. Ph.D. - STATE. SUPERINTENDENT
UNITEDSTATES DEPARTMENT' OF AGRICULTUREFOOD AND NUTRITION SERVICE
06...-40-57201115APPOOVALEV.1119111 tl11174
SCHOOL NUMBER'
TI I 1.1 1 1 L00(3000000000000CAM®CAM®0000000000000000
@CD@000000000000000000000000_000_
0000000000.00000000::00'0000
00000000- 01)042)00000000000®r 0000
, 00.C) 0
_0000
STUDEN INFORM
GRADE
$000.:00.$0
'y
®
ACT
000000000
0
H."I00000000000000000
co wserrs14 'me sox
QOO 090000goo 000002 00 04000
(30040®®0 0(3000memo®comae®meemois000®move,
. . , INSTRUCTIONS.This is not a test. It is a survey to'find out what kinds of foods you and many others like you sat every day. Simsof the questions are e-multiple choice; some just ask for ;es" or no answers. Each choice has a circle besidewhich. you'are to fill in if it.is yoUr answer. The circle must be filled by a dark glossy mark Made by a number 2pencil. Do not-use a ball point or felt tip pen. Donot make any stray marks; mark only in the circles. There is anexample below to show .you how to mark your answers:
EXAMPLE I: DO YOU LIKE TO EAT SNACKS?
AYESNO
. r
1; Did you eat breakfast 'today?
ib Ye0 No
2. If yoU did eat breakfast, where? (Mark only one),
0 In school breakfast program0 At home
'0 Bought breakfast on way to school00ther (specify briefly below) 00 NOT WRITE OUTSIDE DOUBLE LINES
V
3.1f you did not eat breakfast, indicate why. (Mark one or more)
ODid not have time()Not hungryONobody to prepare it()Didn't feel good01'm on a dietO Food not available0 Didn't like what Was served
61 . t
NCB TisseOptls 111863443121

. -4. Did you eat lunch today?
0 YesONo
5. It you did not eats Type A scbool lunch today; indicate why. (Mark one or:rifore).
0 Not available0 Didn't like what was served0 Wait in line too long0 Food cold0 Cooks are grouchy0 Costs too much0 Lost money0 I'm on a diet
IL How long is your lunch period? (Mark one).
0 Less than 20 minutes in length10 20 minutes0 20 to 30 minutesO30 to 40 minutes
.`.0 More than 40 minutes
7. Is the dining area in your school:
A. Clean?
0 YesONo
B. Attractively painted?
0 YesONo
C. Well lighted?
0 YesONo
D.Decorated with posters, etc., for special Occasions?
OYes0 No
E. Too crowded for comfortable eating?
...0 Yes.ONo.
.;
WISCONSIN NUTRITION EDUCATION SURVEY A, CHILDREN'S ,FOOD INTAKE SIDE 2 (SERIES TI JULY, 1973
f'4.
11#411111111.1 1111111111111111111111111111/111111 /141. 62

011111114-1M0OS APPMVAL EXPIRE* Iti.:81774
r ANSWER 164111104#V1iNG akiiiiTION SY MARKING 1Y" OR "N" FOR EACH MEAL. VYES., N -NO
toids.;at vieminsi mentioned?
.EXAMPLE 2: ICE CREAMr
Milk, any kind - inekiding 'Foy*. 699 n09.
9. Pudding or custard;
10. Ice cream or milk. Shakes.
11. Cheese, any kind - including cottage cheese or yogurt.
: Pork, lamb, beef, veal or liver.
11. Chicken, turkey or other poultry.
14.,Fish, any kind..
15. Egg.
16. cooked dried peas or beans.
17. Peanut butter.
art:luncheon Meet, wieners, brats or sausages.
19. Nutt, any kind.,
20. Siewor meat pie, piiza, spaghetti; noodles; macaroni orrice dish with meat or fish (combinatiorl).
Citrus fruit juice (orange, grapefruit) or (1 orange or (1/2)grapefrui4.
22. Strawberries or cantaloupe, fresh ,or frozen.
23. Tornetoes, any kind, or Coleslaw, raw green pepper.
24. Any of the following fruit drinkg: Tang, Hi C., Awake,'Del Monte Fruit Drink.,
25. Other fruit drinks.
26. Apricots, any kind.
27. Carrots, ,any kind, sweet potato. or yams,pumpkin,. yellow squash.
-28. Greens - spinach, beet greens, turnip greens, mustard
greens, collards, dandelion greens.
29. Broccoli.
30. Peachei, watermelon, canned purple plums.
TODAY'SLUNCH
7 NO
, 0, 0.0 00 "(*),
.® 'ed®e
® p8 06 ®
0 -00 80 80 .0
0 00 00 0® 0
8 0
c!)
0 0 .
®®.
G O.,ci? 0 :,,it0 :0-
TODAY'SBREAKFAST
VO'. 41
¼® ®'0 4. 0
1-.0 40:
0 .0'
o °, 8:
0®6 O.0 ®0 00 .8'0 8
0 8
0 00 80 .0
. O®
.0 8
, 0 0.0' 0'0. ®H ,
o ®
EYFEAL"
V:NO
.0 ®0 ..0® .®.0.O
..6 6,O' 8..® 00 -866 .
o 0,,(-.) 80 80 00 0
, 8 ... 8
0; 'S
0 e
O. 8:,4;...
0 b .c) -0
',- ---.;
o ;f4',:.
SNICKS
v6I- Pi.if.
:0 . ®
a. 1p:0:e.0.
oe0;0
-00' 00 . 0.
0 .00 80 0'...;
0. 8
w. e. PO 8
0 8.:p o,.
8
''..). t,'"
: o .c.),
.4 0 144::
,0..,.*:.
o
CONTINUED ON NEXT PAGE
11,111111.1.1111,11111111.111.111-111163 '00

31. Green peas, asparagus.
Raisins, prunes, or dried MAL.
33. White potatoes, incltiding *inch fries.7
'W. Bread, buns, biscuits, any kind.
35. Only thefollbwihj dry cereals:' Total, Special K,
. Product 19, Kab6biti, Fortified Oal Flakes, Raisin Bran,'`.Concentratia, 40% ,Bran Flakes, Buc .Wheats
2111. Other cereal, dry or cooked..\\
37. Rice, noodles, spaghetti, macaroni Without meat;
poultry or fish. :
36. Pop, soda, soft drink'.
39., Potato 0i-corn chips) pretzels and other similarsnack items. 4%
64 A
40. Crackerk such as Saltines,,Graham, Soda,lrand similaritems.
41. Doughnuts, sweet rolls, cookies; cake
42.A. Fruit pies.
B. Custard dr cream pies.
43. Gum, sugar coated; candy, chocolates, mints, ice cream
toppings.
44. Jam, jelly, syrup', honey.
,45. Margarine or butter.,
46. Coffee or tea.
47. A. Are the bread products used in your home enriched?
B. Is the table salt used in your home' " lodizedr
-C. Do you take vitamins?'
ri? Are the vitamins yOu take iron fortified?
48.1f .you are a high school student, do you consume beer, wine or'bquora?
TODAY'SLUNCH
YES NO
TODAY'SBREAKFAST
YO NO
LAST
EVA=11
WI NO
SNACKS'
ye. No
0 8 0 0 O® 0 8 '
os..,
O® 0® eeP 0 o 0 0 ®. s
'O ® ®'6 ® 6 0 e'
O Q. o p o 0 '080- o p, 0 e o S-.
0 8.. 0 8 C) 8 0 0.0 0 6 0 6.0 p
o e.c9.4,
g 'lc) e p e,... i ..
o6,,c1,..0..0 o. e 6 0O 8 0 : IQ
,.._0 8 0 8 ;'0 e .!'o's ,0 0 o 0..o sp ,
0 0o 6
0 0
ait e,
'C) 8
o 0
Q. O..
0 8 .' 0 8 -0 0 0 00 0 0 CY 0 8 0 809 e Ito. o -O 0 0 0:;'
I DON'T KNOWi 0,
Off.),..
. o
. , YES
00
.. o 1
NO
0o
.oo' , ,
ONeyer°Occasionally'()Daily'
WISCONSIN, NUTRITION E6UCATION SURVEY CHILDREN'SFOOD INTAKE ' SIDE I JsEstits T) JULY: 197:0' v
1111! I I 1.1111111111 I I 1111111.1111111 I II I'l 1111.11..
- f t,
260p-3(8250-77