document resume author hackett, rachelle kisst; martin ... · document resume. ed 411 728 he 030...
TRANSCRIPT

DOCUMENT RESUME
ED 411 728 HE 030 447
AUTHOR Hackett, Rachelle Kisst; Martin, Gary R.TITLE Faculty Support for Minority Engineering Programs.PUB DATE 1997-03-20NOTE 19p.; Paper presented at the Annual Meeting of the American
Educational Research Association (Chicago, IL, March 24-28,1997).
PUB TYPE Reports Research (143) Speeches/Meeting Papers (150)Tests /Questionnaires (160)
EDRS PRICE MF01/PC01 Plus Postage.DESCRIPTORS *Affirmative Action; *College Faculty; *Educational
Attitudes; *Engineering Education; Faculty; GeographicLocation; Higher Education; *Minority Groups; PrivateColleges; Public Colleges; School Size; Teacher Attitudes
IDENTIFIERS Faculty Attitudes; *Minority Engineering Programs
ABSTRACTThis study examined faculty support for programs that aid
minority engineering students. A survey was designed and mailed to faculty at112 randomly-selected engineering schools. A total of 91 faculty from 30schools completed the survey. The study found that although there was generalsupport for minority engineering programs (MEPs), there was great variabilityamong the responses. Greatest support was found for financial and academictypes of assistance, with less support for clustering of activities. Thestudy also found that faculty from state schools, larger schools, and fromschools located in the Midwest tended to give greater support to MEPs thanfaculty from private schools, smaller schools, and schools located in theEast. A copy of the survey questionnaire is appended. (MDM)
********************************************************************************
Reproductions supplied by EDRS are the best that can be madefrom the original document.
********************************************************************************

Faculty Support for Minority Engineering Programs
Rachel le Kisst Hackett, Ph.D.University of the Pacific
Gary R. Martin, Ed. D.University of the Pacific
March 20, 1997
Abstract
A survey was developed and mailed out to a random sample of engineeringprofessors at schools across the country with ABET-accredited (Accreditation Board forEngineering and Technology) programs, asking them to assess the "value andappropriateness" of the existence of a formal, structured, general Minority EngineeringProgram in their School of Engineering, along with the following seven MEP-specificcomponents: MEP student associations, scholarships, study centers, summer bridgeprograms, special tutoring programs, career fairs, and awards banquets. On a scale of1-10 (1 = Very low, should not exist at all; 10 = Very high, critical), the engineeringprofessors tended to express general endorsement of MEP's considering the middle ofthe scale (5.5) represents a neutral position and the sample average was 6.51.However, there was considerable variability (SD=3.13). Greatest support was foundfor financial and academic types of assistance, with less support given to clustering-types of activities. In addition, attitudinal differences between types of institutions(public vs. private; research vs. non-research), size, and location of schools wereexplored. State schools yielded higher scores than private; regionally, the Midwestwas the highest and the East was the lowest; and in terms of size, we found that thelarger the school, the higher the score. Finally, open-ended comments were analyzedas a qualitative component to shed light on the numerical results.
Introduction BEST COPY AVAILABLE
Our country is suddenly making a political "about-face" with respect to the practice of"affirmative action." News media seem to be routinely reporting that there is discontentwith the idea. Political leaders are calling for its complete dissolution. CurrentPresident Clinton wants to move from "quotas" to "preferences." Glynn Custred andThomas Wood co-authored the California Civil Rights Initiative included on theNovember 1996 ballot. But if you listen to opponents of affirmative action carefully, the
PERMISSION TO REPRODUCE ANDDISSEMINATE THIS MATERIAL
HAS BEEN GRANTED BY
Rachelle Kisst Hackett
TO THE EDUCATIONAL RESOURCESINFORMATION CENTER (ERIC)
2
U.S. DEPARTMENT OF EDUCATIONOffice of Educational Research and Improvement
EDUCATIONAL RESOURCES INFORMATIONCENTER (ERIC)
DKrus document has been reproduced asreceived from the person or organizationoriginating d.
0 Minor changes have been made to improvereproduction Quality.
Pointsofvieworopinionsstatedinthisdocu-ment do not necessarily represent officialOERI position or policy

content of their message often appears to reflect more frustration with a few aspects ofthe practice, rather than the entire concept. Few people seem to deny that there isstill a problem in our country with respect to achieving educational andprofessional equity across all races. Fewer still deny the historical (unfair) basisfor these disparities. So it would seem then, that to completely abolish all relatedsupport to ethnically under-represented populations would subscribe to the cliché of"throwing out the baby with the bath water." The question that this study seeks toaddress is: How should affirmative action be defined today in the context of collegeengineering programs?" (Unfortunately, the phrase "affirmative action" may well be onits way out as the latest negative "catch phrase" in need of a euphemistic new namefor what many still consider to be a valuable practice.)
Literature Review
History Affirmative action was developed in two phases. The first phase was the CivilRights Act of 1964 which prohibited discrimination because of race, color, religion, ornational origin (Graham, 1992, p. 51). The second phase was a shift during the Nixonadministration toward minority preferences (Ibid, p. 50). Title VII galvanized thesepreferences by creating the Equal Employment Opportunity Commission to police jobdiscrimination in commerce and industry (Ibid, p. 52). [A related subsequentdevelopment was the formation in 1966 by feminist leaders of NOW -- NationalOrganization of Women (Ibid, p. 55).] Notwithstanding all these developments, manypeople continued to feel despair, perceiving a lack of effectiveness or progress. Thus,in 1970 the Labor Department began requiring all federal contractors to submit writtenaffirmative action plans including numerical goals and time tables for achievingapproximate proportional representation for minorities in the area work force (Ibid, p.59). This practice was perceived by many as successfully forcing the desiredchanges. So in 1972, Congress extended the EEOC's jurisdiction to state and localgovernments and educational institutions (Ibid, p. 60). This led to activities such asschool desegregation busing and selective college admissions by ethnicity. Forexample, in 1973 a federal court ordered 19 southern and border states includingOhio and Pennsylvania to enroll more Blacks in historically white schools (and morewhites into historically Black state colleges) (Orlans, 1992, p. 145).
Affirmative Action -- Yea or nay? Affirmative action has always been a controversialpolicy in its attempts to combat differences between groups in earnings andemployment (Coate & Loury, 1993, p. 1220). Many argued in its earliest days, forexample, that the Civil Rights Act and the Title VII "minority preferences" bill directlyconflicted with each other. President Johnson addressed the subject, speaking to thegraduates at Howard University's commencement one year after the Civil Rights Act of1964 was passed:
You do not wipe away the scars of centuries by saying: Now you are free
to go where you want, and do as you desire... You do not take a person
2
3

who, for years, has been hobbled by chains and liberate him, bring himto the starting line of a race and then say, "You are free to compete withall the others," and still justly believe that you have been completely fair...We seek... not just equality as a right and a theory but equality as a factand equality as a result (Public Papers, 1965, p. 636).
More recently, California voted in 1996 in favor of Proposition 209 which, if permittedby the courts, would virtually eliminate all forms of affirmative action. Just prior to this,the University of California Board of Regents voted 14-10 to drop race-basedadmissions at the nine-campus system, and 15-10 to halt affirmative action hiring.Keith Orlando Hilton called this "Politics, Not Pragmatism" in an article published inBlack Issues in Higher Education.. Hilton notes the University of California initiativeauthor argues that "preference programs have a racially polarizing effect..." (Hilton,1995, p. 7) He also quotes then-governor Pete Wilson, "Are we going to treat allCalifornians equally and fairly? Or are we going to continue to divide Californians byrace?" (Ibid) On the other side of the debate, Carolyn Murray, associate professor atUC Riverside pointed out that "UC is a land-grant institution, and land-grant institutionswere designed to meet the needs of the surrounding community. This is a clearviolation of the original mission." (lbid, p. 8)
So how well has affirmative action been working, and how well is it working today?Frank McCoy writes in the Black Enterprise that "during the past quarter century, themost important component in 'leveling the playing field' and providing equal access tothose opportunities has been affirmative action" (McCoy, 1994, p. 54). McCoy arguesthat affirmative action is critical for encouraging qualified African Americans to "takepositions in fields or areas from which they've been excluded or are under-represented" (Ibid, p. 54). Stephen Coate and Glenn C. Loury conducted economics-oriented research from which they concluded there are positive as well as negativeeffects of affirmative action today: "There are circumstances in which affirmative actionhelps minorities obtain opportunities to eliminate negative stereotypes; however, thereare other circumstances in which affirmative action propagates negative stereotypes,promulgating the perception that minorities are hired without proper qualifications, andare given less work because of this" (Coate & Loury, 1993, p. 1239). Harold Orlansreports a negative charge in the educational context that, "at elite colleges, mediocreminority students are patronized and suffer anxiety and self-doubt they would not feelat less selective colleges and that lowered standards stigmatize able minority studentswho do not require them." Members of both minority as well as majority populationshave argued at times that affirmative action was inherently flawed for reasons like this.(Orlans, 1992, p. 146)
More recently, the affirmative action debate took on a more positive spin as many in
industry embraced "workforce diversification," as an impetus behind affirmative actionpractices. Industry has been reporting that employees with different backgrounds(e.g., culturally), bring different strengths to the company for an overall composite
3
4

improvement. Further, the broader cultural representation is also believed to be "goodbusiness" by appealing to and attracting more culturally "like clients."
How Long? A part of Dr. Martin Luther King's famous "I Have a Dream" speech reads:
I have a dream that my four little children will one day live in a nationwhere they will not be judged by the color of their skin, but by the contentof their character."
Martin Luther King, Jr.(Washington, DC, August 1963)
The question has long been, "When will that 'one day' arrive and how will we know?"The more immediately-germane question is, "How long should affirmative actioncontinue to be employed toward this goal and in what forms?" Affirmative action wasoriginally conceived as being a ten-year fix (Graham, 1992, p. 50). Today, threedecades later, it is in fact being heavily challenged as more detrimental thanbeneficial. Coate and Loury question "whether the labor market gains (whichaffirmative action brings) can continue without (affirmative action) becoming apermanent fixture in the labor market" (Coate & Loury, 1993, p. 1220).
Minority Engineering Programs Acknowledging the need for an excellent and largeengineering workforce for the prosperity of our country, numerous reports have beenwritten expressing concern over predicted shortfalls of engineers. One such article,sponsored by the National Governors' Association, predicts that by the year 2010, theUnited States could suffer a shortfall of as many as 560,000 science and engineeringprofessionals. (McDonald, 1989, p. 8) With our changing demographics showingincreasing proportions of minority populations, the consensus in these reports by andlarge is that more should be done to assist and encourage minorities to pursue theengineering field. Likewise, women have always been poorly represented inengineering, and are consequently targeted as well by these recommendations. Thissame article reports that "Black students receive 2.9 percent of the undergraduateengineering degrees, while Hispanic students comprise 2.4 percent..." with femalestudents composing 16 percent. (Ibid)
NACME (National Action Council for Minorities in Engineering, Inc.) reviewedengineering student performance in 118 individual institutions. They found that 35.6percent of minority freshman engineering majors had obtained a bachelor of sciencewhile the rate for non-minorities was 68.4 percent. (Campbell, 1991, p. 1) Thedisparity is clear, beckoning many to seek improvement.
One specific Minority Engineering Program tool is increased financial aid. This waschallenged in 1990 as illegal under the Bakke court case, but subsequently left alone.The Office of Civil Rights reported that since the founding of the Department ofEducation in 1980, it had had less than a dozen complaints on minority scholarships.
4
5
"This indicates to me that there wasn't much of a problem with minority scholarships,"wrote Antonio Califa, director of legislation for the American Civil Liberties Union.(Ridge ly, 1992, 115)
Julia Ridge ly covered a debate over several of the most contested legal issuesaffecting minority participation in higher education. She wrote, "Debates over racialissues often come down to a question of balance. At what point does trying to remedyhistorical inequities for one group infringe on the rights of another?" (Ridge ly, 1992,13) In this paper, we seek to address this issue within a specific context: What arevaluable and appropriate affirmative action support features for engineering students?Our findings are based on the viewpoints/opinions of the people closest to thestudents' educational process -- their professors.
"Color blind" -- Good or Bad??Is it good or bad to be figuratively color blind? The originalCivil Rights Act of 1964 supported non-discrimination undera "race-blind constitution." "Color blind" was later noted byculturally sensitive groups to be a derogatory term. Instead,people were admonished to appreciate different value setsby people of different backgrounds or cultures. Supportingrelated analogies have comprised:
Salad Bowl: Opposes the "melting pot," encouragingindividual cultures to maintain their heritages andcompliment other cultures harmoniously, just as a tomatoco-exists and compliments carrots in a garden salad.Platinum Rule: Do unto others as they would have youdo unto them.
Now, all of a sudden, politicians are returning to the derogatoryuse of the phrase to argue that such decisions as hiring andcollege admissions should be based on merit alone.
Method
Instrumentation. A survey instrument was developed by listing components commonlyfound in Minority Engineering Programs across the country. The format allowsrespondents to rate each using a 10-point Liken scale indicating how much they valueand feel the component is appropriate at their institution (1 = Very low, should not exist
5

at all; 10 = Very high-, critical; see Appendix A).
The survey was then administered to the engineering faculty at the University of thePacific. The results and conclusions were subsequently reported back to the school.
That no disagreement was found provides some evidence of the instrument's validity.
Finally, the survey was mailed to 112 (out of 274) randomly-selected engineeringschools/programs across the country which offer at least one ABET-accredited(Accreditation Board for Engineering and Technology) engineering degree. We askedeach school's engineering dean to administer the survey to ten randomly selectedfaculty, and to then return them along with the completed questionnaire from the Deanwhich describes their school (i.e., size, type, location, and whether they had an MEP).
Descriptive statistics (including means and standard deviations) were calculated for
each item based on all respondents combined. In addition, these statistics werebroken down by funding type (public vs. private; research vs. non-research), size(<400, 400-1,400, >1,400 students), and location (west, mountain, midwest, east, and
south) of the school.
Sample. Out of the 112 schools contacted, 191 professors from 30 schools responded
to the survey. The characteristics of the schools being represented and the numberand percentages of professors from each are shown in Table 1.
Although we do not have background information about the three schools from which25 professors responded, the table shows that at least 17% are associated withengineering programs where the student body is smaller than 400. At least 23% are atengineering schools with more than 1400 students. Most of the professors whoresponded to the survey teach in engineering programs enrolling between 400 and1,400 students. The professors came from a minimum of eight small, eleven medium,
and eight large schools.
The majority of professors (at least 56%) who responded are at state schools, some ofwhich they consider to be "research" institutions. At least 30% are at privateinstitutions; again, some of these are private "research" institutions.
The geographical region in which a school of engineering is located was reported by
the deans. In a few instances, schools within the same state were not considered to
be in the same region. Nevertheless, all regions are represented (three schools in the
West, three from the Mountain States, three from the South, seven from the East, and
eleven from the Mid-West). Correspondingly, most responding professors were from
the Mid-West or Eastern regions.
The majority of the professors responding (64.4%) were from colleges which have
6
7

formal Minority Engineering Programs. About nineteen percent were not, and aboutseventeen percent did not report whether their college had a Minority EngineeringProgram. From this, we can estimate that 77% of the professors responding were from
schools with MEP's, implying increased familiarity with MEP programs.
While it is recognized that only 27% of the schools invited to participate actuallyresponded to the survey, it can be noted that the professors who did complete it areaffiliated with a variety of sizes, types, and locations of engineering programs.
Table 1.Description of Professors and their Schools Who Responded
Professors Schools
Size of Schools n %a n %b
Small (<400) 34 17.8 8 26.7
Medium (400-1,400) 87 45.5 11 36.7
Large (>1,400) 45 23.6 8 26.7
Type of InstitutiondPrivate 57 29.8 10 33.3
State 108 56.5 16 53.3
Research 29 15.2 5 16.7
Location of UniversityWest 19 9.9 3 10.0
Mountain 20 10.5 3 10.0
Mid-west 78 40.8 11 36.7
East 29 15.2 7 23.3
South 20 10.5 3 10.0
a The percentages are based on the total of 191 professors and within attributes(size, type, and location) do not sum to 100% because information was not
reported in 25 (or 13.1% of the) cases, representing three schools.b The percentages are based on 27 schools.
Based on engineering student body.d The categories are not mutually exclusive (e.g., there were professors from private
research schools who responded).
7
8
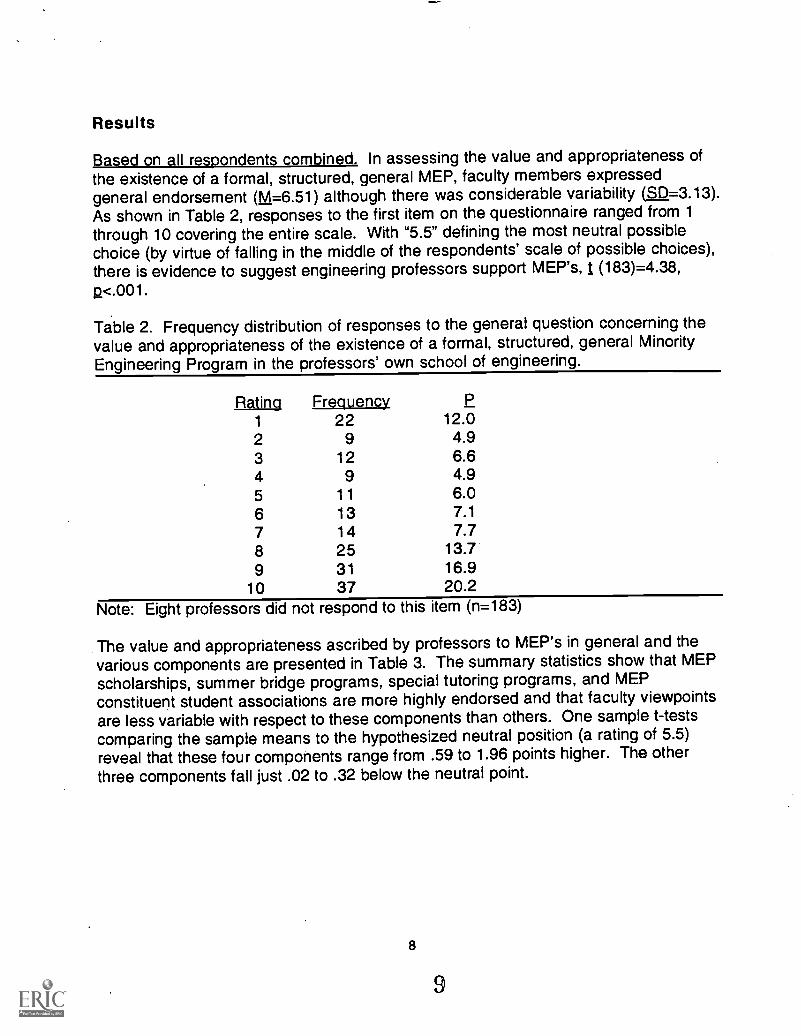
Results
Based on all respondents combined. In assessing the value and appropriateness ofthe existence of a formal, structured, general MEP, faculty members expressedgeneral endorsement (M=6.51) although there was considerable variability (5.1)_=3.13).
As shown in Table 2, responses to the first item on the questionnaire ranged from 1through 10 covering the entire scale. With "5.5" defining the most neutral possiblechoice (by virtue of falling in the middle of the respondents' scale of possible choices),there is evidence to suggest engineering professors support MEP's, / (183)=4.38,
2<.001.
Table 2. Frequency distribution of responses to the general question concerning thevalue and appropriateness of the existence of a formal, structured, general MinorityEngineering Program in the professors' own school of engineering.
Rating Frequency P
1 22 12.02 9 4.93 12 6.64 9 4.95 11 6.06 13 7.1
7 14 7.78 25 13.79 31 16.9
10 37 20.2Note: Eight professors did not respond to this item (n=183)
The value and appropriateness ascribed by professors to MEP's in general and thevarious components are presented in Table 3. The summary statistics show that MEPscholarships, summer bridge programs, special tutoring programs, and MEPconstituent student associations are more highly endorsed and that faculty viewpointsare less variable with respect to these components than others. One sample t-testscomparing the sample means to the hypothesized neutral position (a rating of 5.5)reveal that these four components range from .59 to 1.96 points higher. The otherthree components fall just .02 to .32 below the neutral point.
8
9

Table 3. Responses to the questions concerning specific MEP components.
Itema_o_ 1
3.13 4.38 **3.10 2.57 *2.64 9.98 **3.07 -1.072.63 9.51 **2.85 6.33 **3.12 -.093.22 -1.30
# Component n M
1 General (overall) 184 6.512 Student clubs 183 6.093 Scholarships 181 7.464 Study center 175 5.255 Summer bridge 178 7.386 Tutoring 180 6.847 Career fair 165 5.488 Awards banquet 165 5.18* Q <.05 **12<.01
Based on groups of respondents i on a I size and funding vary. Toinvestigate whether ratings varied systematically with size of the engineering studentbody and funding of the institution with which the professor is associated, two-wayAnalyses of Variance (ANOVA's) were performed. Table 4 presents descriptivestatistics for responses to the first question, "General Minority Engineering Program."Size was not a significant factor, but funding was, F(1,139)=5.33, g=.022. Theinteraction between the two factors approached significance, F(2,139)=3.01, a=.052.The pattern of the mean differences suggests that professors from state-fundedinstitutions tend to value MEP programs and find them more appropriate at theirinstitutions than do those at private ones (M=7.08 versus M=5.91, respectively).
Table 4. Ratings on "General Minority Engineering Program" for professors at state vs.privately-funded institutions by size of engineering school student body size.
Size State PrivateM 512 a M
Small (<400) 8.60 2.37 10 5.18 3.02 22Medium (400-1,400) 6.63 2.97 65 6.42 3.66 19
Large (>1,400) 7.55 2.77 31 6.42 3.06 12
The value and appropriateness of MEP constituent student associations (based ongender or ethnicity) did not systematically vary as a function of either size nor funding(see Table 5). However, the interaction between the two factors approachedsignificance, F(2,139)=2.94, g=.056. Differences between professors at state-versusprivately-funded institutions were more pronounced when engineering student body
size was smaller.
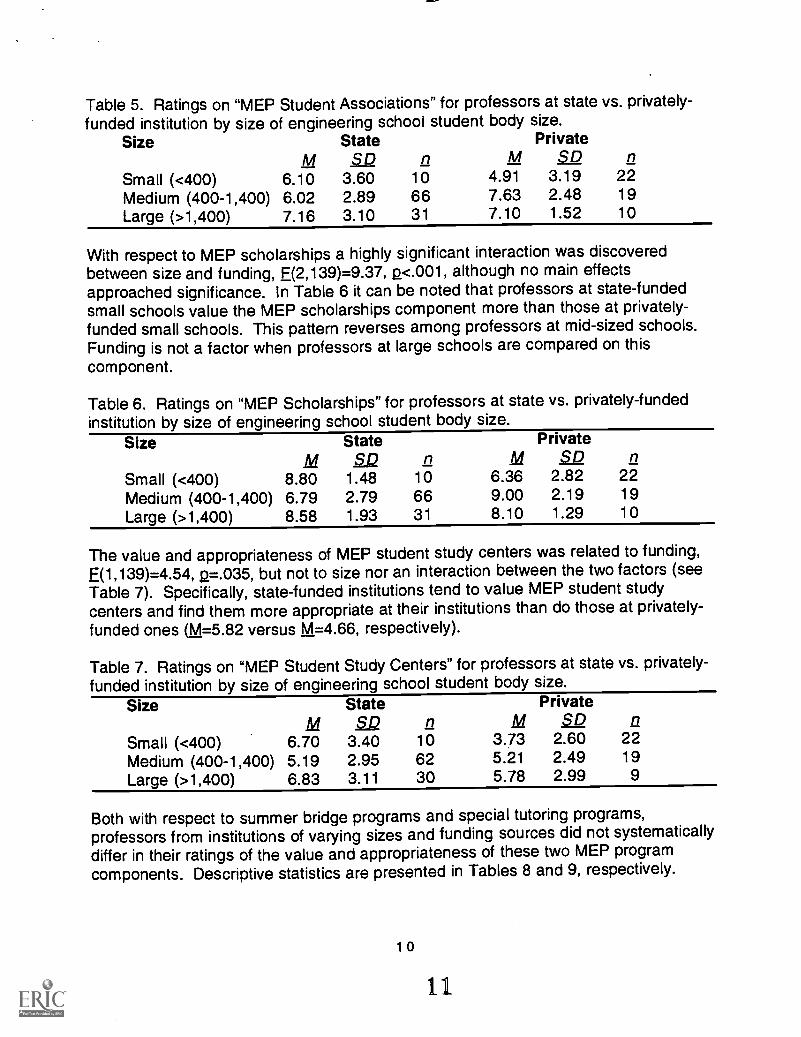
Table 5. Ratings on "MEP Student Associations" for professors at state vs. privately-funded institution by size of engineering school student body size.
Privatem
Size StateM 212 n
Small (<400) 6.10 3.60 10Medium (400-1,400) 6.02 2.89 66Large (>1,400) 7.16 3.10 31
4.91 3.19 227.63 2.48 197.10 1.52 10
With respect to MEP scholarships a highly significant interaction was discoveredbetween size and funding, F(2,139)=9.37, p<.001, although no main effectsapproached significance. In Table 6 it can be noted that professors at state-fundedsmall schools value the MEP scholarships component more than those at privately-funded small schools. This pattern reverses among professors at mid-sized schools.Funding is not a factor when professors at large schools are compared on thiscomponent.
Table 6. Ratings on "MEP Scholarships" for professors at state vs. privately-fundedinstitution by size of engineering school student body size.
Size State PrivateM n M 12D
Small (<400) 8.80 1.48 10 6.36 2.82 22Medium (400-1,400) 6.79 2.79 66 9.00 2.19 19
Large (>1,400) 8.58 1.93 31 8.10 1.29 10
The value and appropriateness of MEP student study centers was related to funding,E(1,139)=4.54, 12=.035, but not to size nor an interaction between the two factors (seeTable 7). Specifically, state-funded institutions tend to value MEP student studycenters and find them more appropriate at their institutions than do those at privately-funded ones (M=5.82 versus M=4.66, respectively).
Table 7. Ratings on "MEP Student Study Centers" for professors at state vs. privately-
funded institution by size of engineering school student body size.Size State Private
M aQ a M 2.0 nSmall (<400)Medium (400-1,400)Large (>1,400)
6.70 3.40 10 3.73 2.60 225.19 2.95 62 5.21 2.49 19
6.83 3.11 30 5.78 2.99 9
Both with respect to summer bridge programs and special tutoring programs,professors from institutions of varying sizes and funding sources did not systematicallydiffer in their ratings of the value and appropriateness of these two MEP programcomponents. Descriptive statistics are presented in Tables 8 and 9, respectively.
10
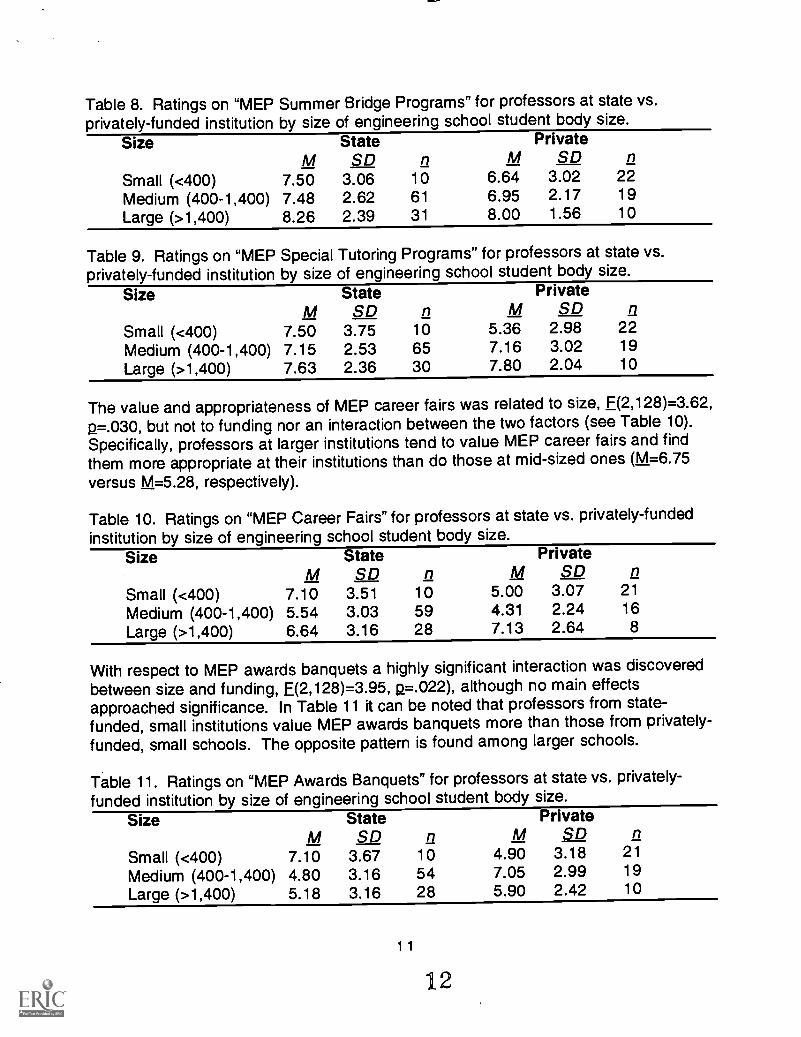
Table 8. Ratings on "MEP Summer Bridge Programs" for professors at state vs.privately-funded institution by size of engineering school student body size.
SizeM
StateSD n M
PrivateSD n
Small (<400) 7.50 3.06 10 6.64 3.02 22Medium (400-1,400) 7.48 2.62 61 6.95 2.17 19
Large (>1,400) 8.26 2.39 31 8.00 1.56 10
Table 9. Ratings on "MEP Special Tutoring Programs" for professors at state vs.privately-funded institution by size of engineering school student body size.
SizeM
StateSD n M
PrivateSD n
Small (<400) 7.50 3.75 10 5.36 2.98 22
Medium (400-1,400) 7.15 2.53 65 7.16 3.02 19
Large (>1,400) 7.63 2.36 30 7.80 2.04 10
The value and appropriateness of MEP career fairs was related to size, F(2,128)=3.62,g=.030, but not to funding nor an interaction between the two factors (see Table 10).Specifically, professors at larger institutions tend to value MEP career fairs and findthem more appropriate at their institutions than do those at mid-sized ones (M=6.75versus M=5.28, respectively).
Table 10. Ratings on "MEP Career Fairs" for professors at state vs. privately-fundedinstitution by size of engineering school student body size.
SizeM
StateSD n M
PrivateSD n
Small (<400) 7.10 3.51 10 5.00 3.07 21
Medium (400-1,400) 5.54 3.03 59 4.31 2.24 16
Large (>1,400) 6.64 3.16 28 7.13 2.64 8
With respect to MEP awards banquets a highly significant interaction was discoveredbetween size and funding, E(2,128)=3.95, 2..022), although no main effectsapproached significance. In Table 11 it can be noted that professors from state-funded, small institutions value MEP awards banquets more than those from privately-funded, small schools. The opposite pattern is found among larger schools.
Table 11. Ratings on "MEP Awards Banquets" for professors at state vs. privately-funded institution by size of engineering school student body size.
SizeM
StateSD n M
PrivateSD n
Small (<400) 7.10 3.67 10 4.90 3.18 21
Medium (400-1,400) 4.80 3.16 54 7.05 2.99 19
Large (>1,400) 5.18 3.16 28 5.90 2.42 10
11
12
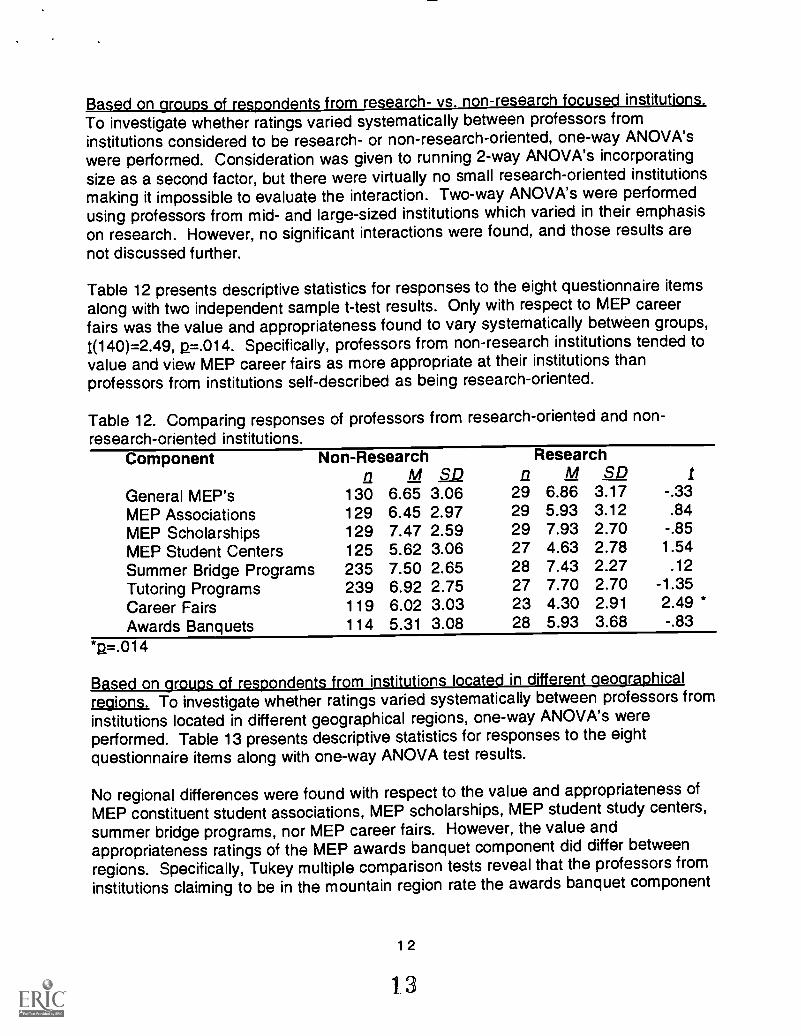
Based on groups of respondents from research- vs. non-research focused institutions.To investigate whether ratings varied systematically between professors frominstitutions considered to be research- or non-research-oriented, one-way ANOVA'swere performed. Consideration was given to running 2-way ANOVA's incorporatingsize as a second factor, but there were virtually no small research-oriented institutionsmaking it impossible to evaluate the interaction. Two-way ANOVA's were performedusing professors from mid- and large-sized institutions which varied in their emphasison research. However, no significant interactions were found, and those results arenot discussed further.
Table 12 presents descriptive statistics for responses to the eight questionnaire itemsalong with two independent sample t-test results. Only with respect to MEP careerfairs was the value and appropriateness found to vary systematically between groups,t(140)=2.49, 2..014. Specifically, professors from non-research institutions tended tovalue and view MEP career fairs as more appropriate at their institutions thanprofessors from institutions self-described as being research-oriented.
Table 12. Comparing responses of professors from research-oriented and non-research-oriented institutions.
Component Non-Researcha M SD II
ResearchM IQ I
General MEP's 130 6.65 3.06 29 6.86 3.17 -.33
MEP Associations 129 6.45 2.97 29 5.93 3.12 .84
MEP Scholarships 129 7.47 2.59 29 7.93 2.70 -.85
MEP Student Centers 125 5.62 3.06 27 4.63 2.78 1.54
Summer Bridge Programs 235 7.50 2.65 28 7.43 2.27 .12
Tutoring Programs 239 6.92 2.75 27 7.70 2.70 -1.35
Career Fairs 119 6.02 3.03 23 4.30 2.91 2.49 *Awards Banquets 114 5.31 3.08 28 5.93 3.68 -.83
*n=.014
B d on r f r nd n from ins ns lo d in differ -n hi alregions. To investigate whether ratings varied systematically between professors frominstitutions located in different geographical regions, one-way ANOVA's wereperformed. Table 13 presents descriptive statistics for responses to the eightquestionnaire items along with one-way ANOVA test results.
No regional differences were found with respect to the value and appropriateness ofMEP constituent student associations, MEP scholarships, MEP student study centers,summer bridge programs, nor MEP career fairs. However, the value andappropriateness ratings of the MEP awards banquet component did differ betweenregions. Specifically, Tukey multiple comparison tests reveal that the professors frominstitutions claiming to be in the mountain region rate the awards banquet component
12
1.3

significantly lower than professors from the midwest and southern regions.
Regional differences were also observed for the rating dealing with support of MEP'sin general. Specifically, the professors from the midwest institutions rated the first item
higher than those from the east.
Table 13. Comparing regional differences of professors.Component
WestMeans
Mountain Midwest East South E EGeneral MEP's 6.00 6.26 7.50 4.96 7.10 4.14 .0032
MEP Associations 5.11 5.89 6.81 6.14 6.65 1.45 NS
MEP Scholarships 7.26 7.16 7.85 6.82 8.20 1.26 NS
MEP Student Centers 4.16 5.70 5.52 5.31 6.39 1.37 NS
Summer Bridge Programs 6.68 8.05 7.61 7.04 7.89 1.08 NS
Tutoring Programs 5.79 6.95 7.51 6.36 7.79 2.38 NS
Career Fairs 5.22 5.00 5.45 6.12 7.25 1.87 NS
Awards Banquets 5.56 3.29 6.15 4.50 6.16 3.73 .0065
Discussion
Table #1: Evaluation By Engineering FacultyPerhaps the single most interesting finding is the very first datum in Table #3: Theaverage value ascribed to Minority Engineering Program's in general by faculty is6.51. With "5.5" defining the most neutral possible choice (by virtue of falling in themiddle of the respondents' possible choices), 6.51 demonstrates a clear level offavorable support for MEP's. It was somewhat predictable that this number would fallsomewhere between 3.0 and 7.0 (considering the variance in related politicalpositions currently reported across the country, which is in fact reflected in thesubstantial standard deviation of 3.13, as well as the high frequency reported in Table2 of respondents giving a rating of 1, 2, and 3). The fact that it was so close to 7.0 issomewhat surprising, and should be encouraging for proponents of the programs.
13
14
43
2
1
0CAcl.ECA
0=CI
CI)
) w0,e 7:g
CC/ CD
CA=-=0=
ca.)
0CI)
CA1=1
C.)
a>
"ciiLL-
ZS
c)RI
-c)=cr)
--cOI
c_.)
23...CV3cc
c3-=RIco
MEP Components
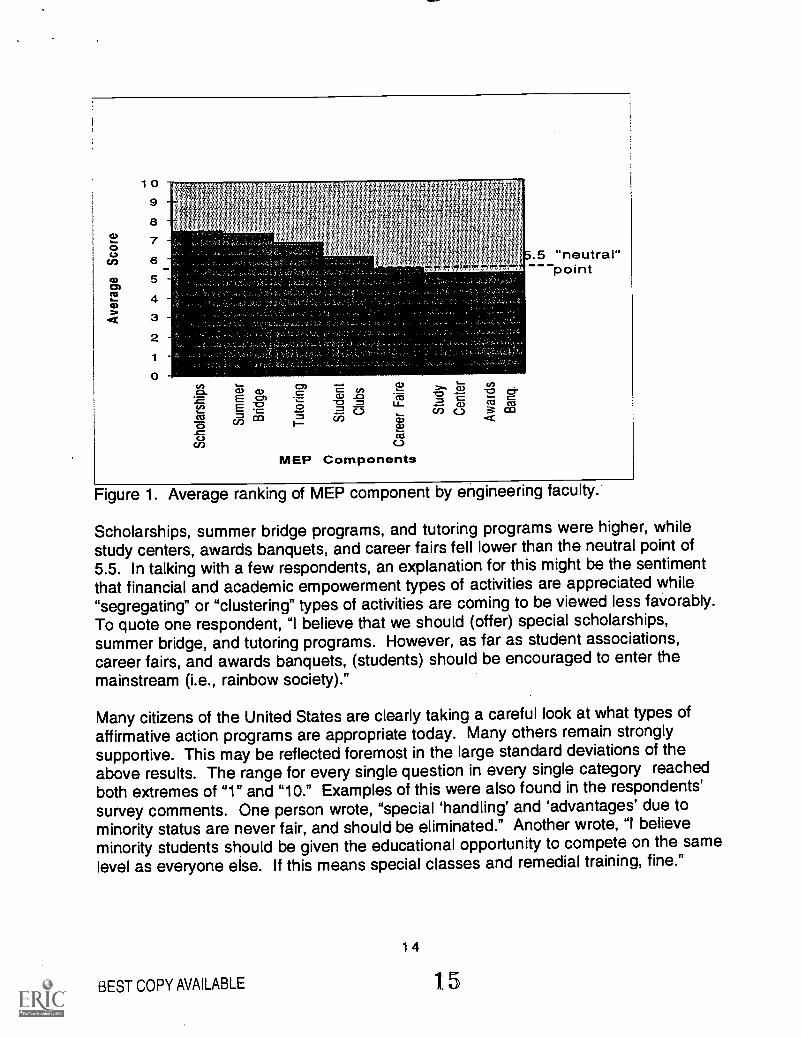
Figure 1. Average ranking of MEP component by engineering faculty.
Scholarships, summer bridge programs, and tutoring programs were higher, whilestudy centers, awards banquets, and career fairs fell lower than the neutral point of5.5. In talking with a few respondents, an explanation for this might be the sentimentthat financial and academic empowerment types of activities are appreciated while"segregating" or "clustering" types of activities are coming to be viewed less favorably.To quote one respondent, "I believe that we should (offer) special scholarships,summer bridge, and tutoring programs. However, as far as student associations,career fairs, and awards banquets, (students) should be encouraged to enter themainstream (i.e., rainbow society)."
Many citizens of the United States are clearly taking a careful look at what types ofaffirmative action programs are appropriate today. Many others remain stronglysupportive. This may be reflected foremost in the large standard deviations of theabove results. The range for every single question in every single category reachedboth extremes of "1" and "10." Examples of this were also found in the respondents'survey comments. One person wrote, "special 'handling' and 'advantages' due tominority status are never fair, and should be eliminated." Another wrote, "I believeminority students should be given the educational opportunity to compete on the same
level as everyone else. If this means special classes and remedial training, fine."
14
BEST COPY AVAILABLE 15
To the extent that influence from engineering professors is warranted in programguidance, college administrators could conclude that MEP's, in general, shoulddefinitely exist in American engineering schools. As these schools debate theevolution of their Minority Engineering Programs, they should perhaps give moreconsideration to providing financial assistance and academic support such as throughscholarships, summer bridge programs, and tutoring programs. And while clusteringprograms (e.g., MEP study centers, awards banquets, and career fairs) receivedweaker votes of confidence, it should be noted that they were still near the 5.5 centralpoint, far from a mandate by the engineering faculty to discontinue them.
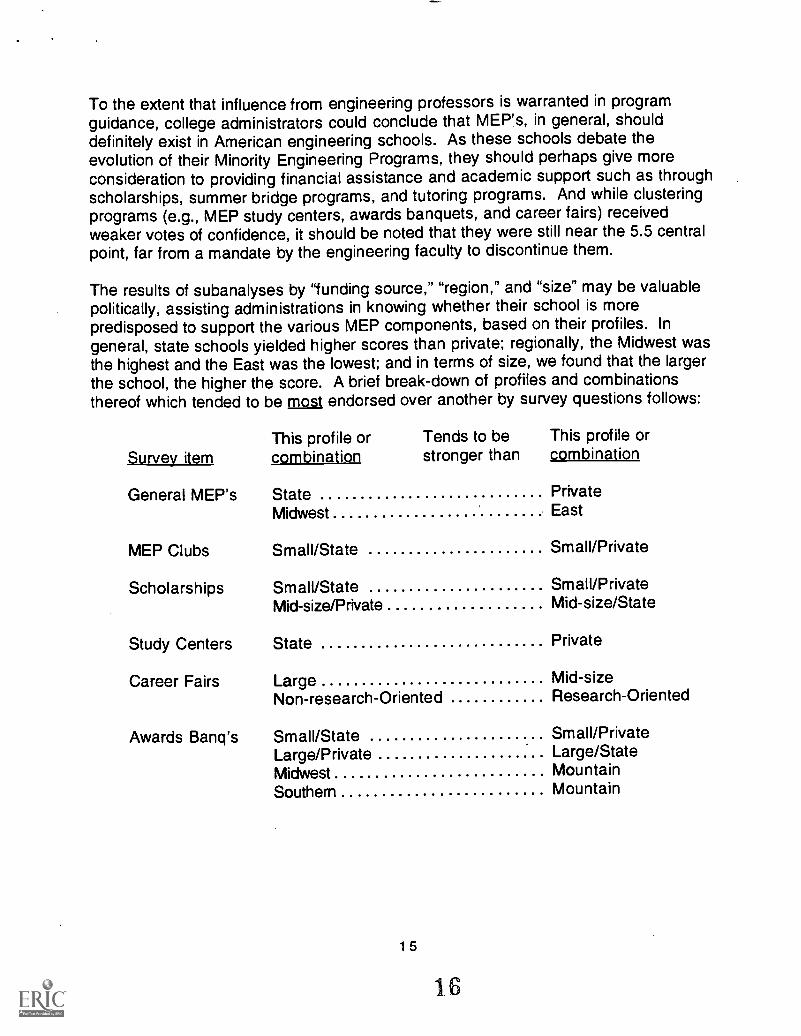
The results of subanalyses by "funding source," "region," and "size" may be valuablepolitically, assisting administrations in knowing whether their school is morepredisposed to support the various MEP components, based on their profiles. In
general, state schools yielded higher scores than private; regionally, the Midwest wasthe highest and the East was the lowest; and in terms of size, we found that the largerthe school, the higher the score. A brief break-down of profiles and combinationsthereof which tended to be most endorsed over another by survey questions follows:
This profile orSurvey item combination
General MEP's StateMidwest
MEP Clubs Small/State
Scholarships Small/StateMid-size/Private
Study Centers State
Career Fairs LargeNon-research-Oriented
Tends to be This profile orstronger than combination
PrivateEast
Small/Private
Small/PrivateMid-size/State
Awards Banq's Small/StateLarge/PrivateMidwestSouthern
15
16
Private
Mid-sizeResearch-Oriented
Small/PrivateLarge/StateMountainMountain

Further, note the following extremely high (M > 8.0) mean responses:
Survey Item Profile Mean
General MEP's Small/State 8.60
Scholarships Small/State 8.80Large/State 8.58Medium/Private 9.00Large/Private 8.10South 8.20
Summer Bridge Large/State 8.26Large/Private 8.00Mountain 8.05
Schools which are smaller and private appeared to provide lower evidence of supportoverall. This may reflect an increased concern for sensitivity, given their smallerclasses and increased focus on individual attention. As one respondent wrote, "Careshould be taken so other students don't feel they have less attention than MEPstudents."
Conclusion
Based on recent polls and current news media, it may appear that support ofaffirmative action measures are waning. In some circles expressions in support of
affirmative action are viewed as politically incorrect. Yet, the above results suggestcaution should be exercised before succumbing too quickly to this pressure inengineering programs. To the extent that faculty are viewed as the "heart of theacademic institution," this evidence of their support should encourage institutions ofhigher education to continue on the path of such educational equity vehicles asMinority Engineering Programs.
Limitations. Although a considerable wealth of information was obtained in thisinvestigation, the reader is cautioned to treat the findings tentatively. Based uponcritical examination of the survey instrument by the authors and some respondents, thefollowing assumptions and limitations should be noted. First, we did not control for theethnicity of the faculty or for the number and percentage of under-represented studentsthey had in their respective schools. Another factor may have been the wording of theresponse scale. By denoting "Value and Appropriateness at your Institution," weassumed respondents considered both components jointly, using similar weighting ofthe two factors when marking their response. We also assumed that professors wouldcircle "N/A" only when they wished to not answer the question. If a MinorityEngineering Program or specific components thereof were not appropriate for their
16
1..7
particular school of engineering (given the constituent student body, or its size, forexample), we expected the professor to circle a rating on the low end. A final limitationwas that we relied on many faculty responses at a few schools, rather than ensuringbroader school representation.
Recommendations for further research. As we make important educational and legaldecisions such as the reduction or expansion of affirmative action support programs in
higher education, there are many important questions which should be carefullyexamined. What are the opinions of other important participants such as collegestudents and current tax payers? Which components are working? How efficient arethey in serving their purpose? How do our findings generalize to other disciplines?This kind of information can assist the American people in the poles as they makelegal decisions. It can also assist educational administrators as they set policies anddirections within their programs.
Bibliography
Campbell, George, Jr., Minority Graduation Rates: Comparative Performance ofAmerican Engineering Schools, NACME-Research Letter, Dec 1991, v2, n2, p1.
Coate, Stephen and Glenn C. Loury, Will affirmative-action policies eliminate negativestereotypes?, American Economic Review, Dec., 1993, v83, n5-6, P1220.
Hilton, Keith Orlando., Politics, Not Pragmatism, Let to U. of Calif. Vote, Say Observers,Black Issues in Higher Education, August 10, 1995, v12, n12, p7.
Graham, Hugh Davis, The Origins of Affirmative Action: Civil Rights and theRegulatory State. (Affirmative Action Revisited), The Annals of the American Academyof Political and Social Science, Sept 1992 v523, p50.
McCoy, Frank, Rethinking the cost of discrimination: economists discuss how racialissues impact the corporate line, Black Enterprise, Jan 1994, v24, n6, p54.
McDonald, Jean; Marianne Clarke, and Eric Dobson; Increasing the Supply of Womenand Minority Engineers: An Agenda for State Action, National Governors AssociationReport, 1990, 2-15.
Orlans, Harold, Affirmative action in Higher Education, The Annals of the AmericanAcademy of Political and Social Science, Sept 1992 v523, p144.
Public Papers of the Presidents: Lyndon B. Johnson, 1965 (Washington, DC:
Government Printing Office, 1965), 2:636.
Ridgely, Julia, Toward Equal Access, Academe, September, 1992, 13.
17
Is

Appendix AFaculty Questionnaire on Minority Engineering Program
Please assess the value and appropriateness of the existence of a formal, structured, general MinorityEngineering Program (#1 below) in your School of Engineering, along with the subsequent specificcomponents (#2-8 below)
1 = Very low, should not exist at all10 = Very high, critical
Value and Appropriateness at your InstitutionLow High
1. General Minority Engineering Program: 1 2 3 4 5 6 7 8 9 10 N/A
2. MEP constituent student associationsbased on gender or ethnicity (e.g., National
1 2 3 4 5 6 7 8 9 10 N/A
Society of Black Engineers)
3. MEP Scholarships: 1 2 3 4 5 6 7 8 9 10 N/A
Financial aid
4. MEP Student Study Center: 1 2 3 4 5 6 7 8 9 10 N/A
Central location for MEP students to study together
5. Summer Bridge Program: 1 2 3 4 5 6 7 8 9 10 N/A
Summer school program for MEP students tobolster basic math and science skills
6. Special Tutoring Program: 1 2 3 4 5 6 7 8 9 10 N/A
7. MEP Career Fair. 1 2 3 4 5 6 7 8 9 10 N/A
8. MEP Awards Banquet: 1 2 3 4 5 6 7 8 9 10 N/A
Please list any other specific suggestions or comments of how you would guide your institution in thedevelopment of its Minority Engineering Program in seeking to deal with the problem of under-
representation of the targeted populations.
1819

U.S. Department of EducationOffice of Educational Research and Improvement (OERI)
Educational Resources Information Center (ERIC)
REPRODUCTION RELEASE(Specific Document)
I. DOCUMENT IDENTIFICATION:
0D
Title: rraca/ty Su030 st- -roe ft/tinor4y rny ).-,eer;r3 P r-ojr city.? -5'
Author(s): /2_ cic In e ( le I,.ssf -Hackett (i 6-arl. 12. mart.,CorporatR source- i
77 !--lattbliestlorrD'ale:
Afra:04,: Only, of -Hic PacAC 10 -kei Sc'i AE2A IV/
c_fr, ; (coo, _:LILII. REPRODUCTION RELEASE:
In order to disseminate as widely as possible timely and significant materials of interest to the educational community, documents announcedin the monthly abstract journal of the ERIC system, Resources in Education (RIE), are usually made available to users in microfiche, reproducedpaper copy, and electronic/optical media, and sold through the ERIC Document Reproduction Service (EDRS) or other ERIC vendors. Credit isgiven to the source of-each document, and, if reproduction release is granted, one of the following notices is affixed to the document.
If permission is granted to reproduce and disseminate the identified document, please CHECK ONE of the following two options and sign atthe bottom of the page.
Check hereFor Level 1 Release:Permitting reproduction inmicrofiche (4" x 6' film) orother ERIC archival media(e.g., electronic or optical)and paper copy.
Signhere)please
The sample sticker shown below will beaffixed to all Level 1 documents
PERMISSION TO REPRODUCE ANDDISSEMINATE THIS MATERIAL
HAS BEEN GRANTED BY
TO THE EDUCATIONAL RESOURCESINFORMATION CENTER (ERIC)
Level 1
The sample sticker shown below will beaffixed to all Level 2 documents
PERMISSION TO REPRODUCE ANDDISSEMINATE THIS
MATERIAL IN OTHER THAN PAPERCOPY HAS BEEN GRANTED BY
\e
TO THE EDUCATIONAL RESOURCESINFORMATION CENTER (ERIC)
Level 2
Documents will be processed as indicated provided reproduction quality permits. If permissionto reproduce is granted, but neither box is checked, documents will be processed at Level 1.
Check hereFor Level 2 Release:Permitting reproduction inmicrofiche (4' x 6" film) orother ERIC archival media(e.g., electronic or optical),but not in paper copy.
I hereby grant to the Educational Resources Information Center (ERIC) nonexclusive permission to reproduce and disseminatethis document as indicated above. Reproduction from the ERIC microfiche or electronicloptical media by persons other thanERIC employees and its system contractors requires permission from the copyright holder. Exception is made for non-profitreproduction by libraries and other service agencies to satisfy information needs of educators inresponse to discrete inquiries.'
Signature:
4,0i-uxtuexm,t,cro:31 of Edutech3vN
Univ. at- TaciCc,1001 Pa.efi'c. Ave.
Stac4<t-a CA 9 S3.11
Pitted Name/Poestionffitte: ,gachei/e Kiss./cv,+ PrAssor
"Nap ne M:goci 9Y(- a67 E( zit / qt/(,- 3/1 0
»E -Mail Address: Date:
R k eti u.op. edit. 6 fiv?7
C UA
THE CATHOLIC UNIVERSITY OF AMERICADepartment of Education, O'Boyle Hall
Washington, DC 20064
800 464-3742 (G04-ERIC)
April 25, 1997
Dear AERA Presenter,
Hopefully, the convention was a productive and rewarding event. We feel you have aresponsibility to make your paper readily available. If you haven't done so already, please submitcopies of your papers for consideration for inclusion in the ERIC database. If you have submittedyour paper, you can track its progress at http://ericae2.educ.cua.edu.
Abstracts of papers accepted by ERIC appear in Resources in Education (RIE) and are announcedto over 5,000 organizations. The inclusion of your work makes it readily available to otherresearchers, provides a permanent archive, and enhances the quality of RIE. Abstracts of yourcontribution will be accessible through the printed and electronic versions of RIE. The paper willbe available through the microfiche collections that are housed at libraries around the world andthrough the ERIC Document Reproduction Service.
We are soliciting all the AERA Conference papers and will route your paper to the appropriateclearinghouse. You will be notified if your paper meets ERIC's criteria for inclusion in RIE:contribution to education, timeliness, relevance, methodology, effectiveness of presentation, andreproduction quality.
Please sign the Reproduction Release Form on the back of this letter d stet two colis of yourpaper. The Release Form gives ERIC permission to make and distribute your paper. Itdoes not preclude you from publishing your work. You can mail your paper to our a r tion at theaddress below. Please feel free to copy the form for future or additional submissions.
Mail to:
Sincerel
AERA 1997/ERIC AcquisitionsThe Catholic University of AmericaO'Boyle Hall, Room 210Washington, DC 20064
Lawrence M. Rudner, Ph.D.Director, ERIC/E
ERIC Clearinghouse on Assessment and Evaluation
4.