document of the world bank habib bank limited ... financial inclusion in pakistan ... figure 1....
TRANSCRIPT
Document of The World Bank
FOR OFFICIAL USE ONLY
Report No. 96376-PK
INTERNATIONAL DEVELOPMENT ASSOCIATION
PROGRAM DOCUMENT FOR A PROPOSED
CREDIT
IN THE AMOUNT OF SDR 355.6 MILLION
(US$ 500 MILLION EQUIVALENT)
TO
ISLAMIC REPUBLIC OF PAKISTAN
FOR THE
SECOND FISCALLY SUSTAINABLE AND INCLUSIVE GROWTH
DEVELOPMENT POLICY CREDIT
May 21, 2015
Macroeconomic and Fiscal Management South Asia Region
This document has a restricted distribution and may be used by recipients only in the performance of their official duties. Its contents may not otherwise be disclosed without World Bank authorization.
Pub
lic D
iscl
osur
e A
utho
rized
Pub
lic D
iscl
osur
e A
utho
rized
Pub
lic D
iscl
osur
e A
utho
rized
Pub
lic D
iscl
osur
e A
utho
rized

GOVERNMENT OF PAKISTAN FISCAL YEAR July 1–June 30
CURRENCY EQUIVALENTS (Exchange Rate Effective as of April 30, 2015)
Currency Unit: Pakistani Rupees US$1.00 = PKRs 101.69 SDR 1.00 = US$1.40642
ABBREVIATIONS AND ACRONYMS ADB Asian Development Bank ABL AML
Allied Bank Limited Anti-Money Laundering
BISP Benazir Income Support Program BOI Board of Investment BOP Balance of Payments BTCA Better Than Cash Alliance CT Cash Transfer CCI Council of Common Interest CCOP Cabinet Committee on Privatization CCT Conditional Cash Transfer CEM Country Economic Memorandum CFT Counter-Terrorist Financing CIB Credit Information Bureau CNI Computerized National Identity CPS Country Partnership Strategy DB Doing Business DFID Department for International Development DPC Development Policy Credit EDB Engineering Development Board EFF Extended Financing Facility EOBI Employees’ Old-Age Benefits Institution EMBI+ Emerging Market Bonds Index Plus EOI Expression of Interest EU European Union FA Financial Advisor FATF Financial Actions Task Force FBR Federal Board of Revenue FDI Foreign Direct Investment FECR Fiscal Electronic Cash Register FESCO Faisalabad Electric Supply Co. FRDLA FSIG
Fiscal Responsibility and Debt Limitation Act Fiscally Sustainable and Inclusive Growth
GDP Gross Domestic Product GCC Gulf Cooperation Countries GIS Geographic Information System GOP Government of Pakistan GPS Global Positioning System GSP Generalized System of Preferences GST General Sales Tax HBL Habib Bank Limited HEC Heavy Electrical Complex HS Harmonized System IBRD International Bank for Reconstruction and Development ICT Information and Communication Technology IDA International Development Association IEG Independent Evaluation Group IESCO Islamabad Electric Supply Co. IFC International Finance Corporation IMF International Monetary Fund IPO Initial Public Offering ITAMS Integrated Tax Audit Mgment. System JICA Japan International Cooperation Agency
KESC LESCO
Karachi Electric Supply Co. Lahore Electric Supply Co.
LLCs Limited Liability Companies LLP Limited Liability Partnership LRO Local Registration Office LSM Large Scale Manufacturing MFN Most Favored Nation MOC Ministry of Commerce MoF Ministry of Finance MOU Memorandum of Understanding MTB Market Treasury Bill NDA New Domestic Asset NEPRA National Electric Power Regulatory Authority NFA Net Foreign Asset NFC National Finance Commission NFIS National Financial Inclusion Strategy NISP National Income Support Program NPCC Natl. Power Construction Corporation NPGCL Northern Power Generation Company Limited NPL Non-Performing Loan NSS National Savings Scheme NTN National Tax Number OGDCL Oil & Gas Development Co. Ltd. OSS One Stop Shop PC Privatization Commission PBM Pakistan Bait-ul-Mal PDF Pakistan Development Fund PEFA Public Expenditure and Financial Accountability PIA Pakistan International Airlines PIB Pakistan Investment Bond PFM Public Financial Management PML-N Pakistan Muslim League-Nawaz PPG Public & Private Guarantee PAR Pakistan Arab Refinery PIA Pakistan International Airlines PPL Pakistan Petroleum Limited PPRA Public Procurement Regulatory Authority PSE Public Sector Enterprise PSM Pakistan Steel Mills REER Real Effective Exchange Rate RFP Requests for Proposals RRG Regional Review Group SB Structural Benchmark SBP State Bank of Pakistan SECP Securities & Exchange Commission of Pakistan SEZ Special Economic Zone SME Small and Medium Enterprise SOE State Owned Enterprise SRO Statutory Regulatory Order SST Services Sales Tax TA Technical Assistance TAMS TDS
Tax Audit Management System Tariff Differential Subsidies
Vice President: Annette Dixon
Country Director: Rachid Benmessaoud
Practice Director: Satu K. Kahkonen
Practice Manager: Shubham Chaudhuri Task Team Leader: Jose López-Cálix

THE ISLAMIC REPUBLIC OF PAKISTAN
A PROGRAMMATIC DEVELOPMENT POLICY SERIES FOR A
SECOND FISCALLY SUSTAINABLE AND INCLUSIVE GROWTH DEVELOPMENT POLICY CREDIT
1.INTRODUCTION AND COUNTRY CONTEXT .................................................................................... 1 2.MACROECONOMIC POLICY FRAMEWORK ..................................................................................... 3
2.1. Recent Economic Developments ....................................................................................................... 3 2.2. Macroeconomic Outlook ................................................................................................................... 5 2.3. IMF Relations .................................................................................................................................... 9
3. GOVERNMENT’S PROGRAM ............................................................................................................ 10 4. THE PROPOSED OPERATION ............................................................................................................ 10
4.1. Link to Government Program and Operations Description ............................................................. 10 4.2. Prior Actions, Results and Analytical Underpinnings ..................................................................... 12 4.3. Link to Country Assistance Strategy and Other Bank Operations ................................................... 18 4.4. Consultations and Collaboration with Development Partners ......................................................... 18
5. OTHER DESIGN AND APPRAISAL ISSUES ..................................................................................... 20 5.1. Poverty and Social Impact ............................................................................................................... 20 5.2. Environmental Aspects .................................................................................................................... 22 5.3. Public Financial Management, Disbursement and Auditing Aspects .............................................. 23 5.4 Monitoring, Evaluation and Accountability ...................................................................................... 24
6. SUMMARY OF RISKS ......................................................................................................................... 25 Annex 1.a: Policy And Results Matrix ....................................................................................................... 27 Annex 1.b: DPC-II Comparing Original Indicative Triggers And Prior Actions ....................................... 28 Annex 2. Letter of Development Policy ..................................................................................................... 29 Annex 3. Fund Relations Annex ................................................................................................................. 39 Annex 4. Expanding the Scope Of the Safety Net Is Important For The Poor ........................................... 40 Annex 5. Privatization in Pakistan .............................................................................................................. 42 Annex 6. Tariff Simplification and SROs Trade Distortions ...................................................................... 44 Annex 7. Establishing a One-Stop Shop for business Registration in Pakistan .......................................... 49 Annex 8. Doing Business Indicators for Pakistan ....................................................................................... 51 Annex 9. Financial Inclusion in Pakistan .................................................................................................... 52 Annex 10. Creation of Fiscal Space Through Revenue Mobilization ........................................................ 54 Annex 11: Increasing Provincial Revenue for More Social Spending ....................................................... 58 Annex 12. Pakistan: Debt Sustainability Analysis ...................................................................................... 60 Annex 13. Public Financial Management and Procurement ....................................................................... 64 Annex 14. Analytical and Advisory Activities: Major Findings and Recommendations .......................... 66 Annex 15. Country at a Glance ................................................................................................................... 68 LIST OF TABLES: Table 1: Key Macroeconomic Indicators Pakistan FY10/11 to FY18/19 ..................................................... 6 Table 2: Key Fiscal Indicators Pakistan FY11/12 to FY18/19 ..................................................................... 7 Table 3:Pakistan BOP Financing Requirements and Sources FY11/12 to FY15/16 .................................... 9 Table 4: Overall Fiscal Impact under FSIGs and Power DPCs-Actions in years FY13/14 & FY14/15 ..... 17 Table 5: FSIG-II Prior Actions and Analytical Underpinnings .................................................................. 19 Table 6: SORT: Risk Categories ................................................................................................................. 26
ii

Table A4.1: BISP Financial Execution Performance .................................................................................. 40 Table A6. 1. Published Statutory Duty Rates, FY2002/03 to FY2014/15 .................................................. 47 Table A6. 2. Statistics of Statutory Duty Rates, FY2002/03 to FY2014/15 ............................................... 47 Table A6.3: Number of Tariff Lines by Type of Goods and Statutory (MFN) Rate, FY2012/13 .............. 48 Table A6.4. Major General and Sector Specific SROs, FY13/14 (Rs. Billion) .......................................... 48 Table A7. 1: Broad Timeline of Medium Term Implementation Plan........................................................ 50 Table A11.1: Key Features of Provincial Services Sales Tax .................................................................... 59 Table A11.2: Non-Salary Budget Allocations for Education and Health Sectors (Rs. Million), 2013/14 - 2014/15…………………………………………………………………………………………………….59 Table A12.1: DSA: Base case debt projections .......................................................................................... 61 Table A12.2: Key Economic Indicators: Low-Case Scenario .................................................................... 63 LIST OF FIGURES:
Figure 1. Pakistan Debt Sustainability Analysis FY09/10 to FY18/19 ........................................................ 9 Figure A4. 1. Targeting Performance of Federal Social Programs in Pakistan (percent) ........................... 40 Figure A8.1: South Asia DB Rankings 2015 .............................................................................................. 51 Figure A8.2: Pakistan DB Rankings 2015 .................................................................................................. 51 Figure A10. 1. Sequencing of Follow-up Actions in Registering Potential Taxpayers .............................. 55 Figure A11.1: Sectoral Shares in Total Services Sales Tax Collection (percent of total) .......................... 58 Figure A12. 1: Pakistan Evolution of Public Debt ………………………………………………………..60 Figure A12.2: Maturity Profile of Government Securities ……………………………………………….60 Figure A12.3: Bank and Non-Bank Holdings of Pakistan Investment Bonds…...……………………….61 Figure A12.4: Public Debt Sustainability Analysis……………………………………………………….62 LIST OF BOXES
Box 1. Key Economic Priorities of the Government’s Program ................................................................. 11
Box 2. The Impact of BISP Cash Transfers on Women’s Accountability and Education .......................... 21
The Credit is prepared by an International Development Association team consisting of Jose R. Lopez-Calix (Lead Country Economist and Task Team Leader, GMFDR); Gabi George Afram (Practice Leader, GTCDR); Shubham Chaudhuri and Vinaya Swaroop (Practice Managers, GMFDR), Anthony Cholst (Country Program Coordinator, SACAA); Daria Taglioni (Senior Trade Economist, (GTCDR); Paul Welton (Senior Financial Management Specialist GGODR); Qurat Hadi (Financial Management Specialist, GGODR) Hanid Mukhtar (Senior Economist, GMFDR);Yasuhiko Matsuda (Senior Public Sector Specialist, GSPDR); David L. Newhouse (Senior Economist, GPVDR);Muhammad Waheed (Economist, GMFDR); Guillermo Arenas (Consultant, GTCDR);Saadia Refaqat (Economist, GMFDR);Kiran Afzal (Private Sector Development Specialist, GTCDR), Rehan Hyder (Senior Procurement Specialist, GGODR);Amjad Zafar Khan, Social Protection Specialist, GSPDR), Iftikhar Malik (Senior Social Protection Specialist, (GSPDR), Quanita Ali Khan (Specialist, GSPDR), Aijaz Ahmad (Senior Public Private Partnership Specialist, (GCPDR), Irum Touqeer (Consultant, GGODR); Sarmad Ahmed Shaikh (Consultant, GTCDR); Mehwish Ashraf (Research Analyst, GMFDR); Helene Bertaud (Legal Counsel); Michael Goldberg, (Operations Adviser, GPSOS); Chau-Ching Shen (Finance Officer); Anwar Ali Bhatti (Financial Specialist), Shabnam Naz (Program Assistant, SACPK); Muhammad Shafiq (Program Assistant, GMFDR) and Ehtesham-ul Haq (Program Assistant, SACPK). The team is particularly grateful to Pablo Saavedra, Economic Adviser and Manuela Francisco, Economic Adviser (OPSPQ), Markus Kitzmuller, Economist, (SARCE), Manuela Ferro (Director, LCRVP), Peter Mousley (Program Leader, MNCO2), and Martin Melecky, Lead Economist (SARCE) who provided priceless comments and guidance.
iii
SUMMARY OF PROPOSED CREDIT AND PROGRAM
PAKISTAN SECOND FISCALLY SUSTAINABLE AND INCLUSIVE GROWTH
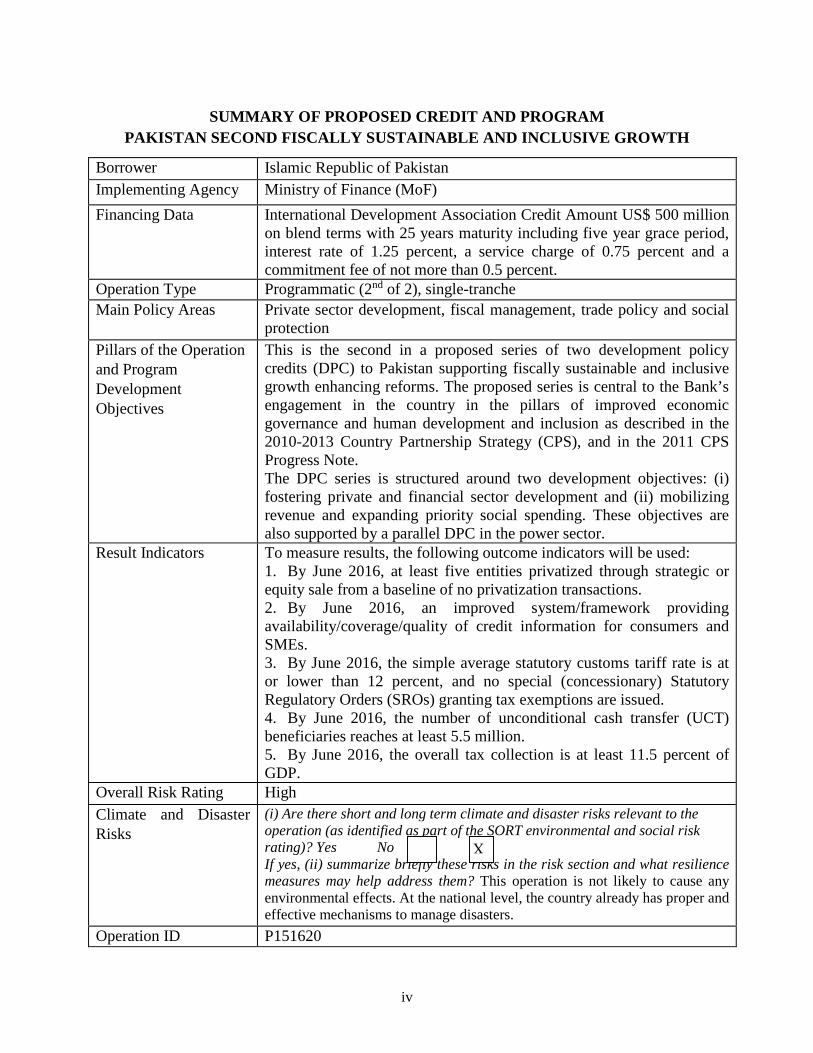
Borrower Islamic Republic of Pakistan Implementing Agency Ministry of Finance (MoF)
Financing Data International Development Association Credit Amount US$ 500 million on blend terms with 25 years maturity including five year grace period, interest rate of 1.25 percent, a service charge of 0.75 percent and a commitment fee of not more than 0.5 percent.
Operation Type Programmatic (2nd of 2), single-tranche Main Policy Areas
Private sector development, fiscal management, trade policy and social protection
Pillars of the Operation and Program Development Objectives
This is the second in a proposed series of two development policy credits (DPC) to Pakistan supporting fiscally sustainable and inclusive growth enhancing reforms. The proposed series is central to the Bank’s engagement in the country in the pillars of improved economic governance and human development and inclusion as described in the 2010-2013 Country Partnership Strategy (CPS), and in the 2011 CPS Progress Note. The DPC series is structured around two development objectives: (i) fostering private and financial sector development and (ii) mobilizing revenue and expanding priority social spending. These objectives are also supported by a parallel DPC in the power sector.
Result Indicators
To measure results, the following outcome indicators will be used: 1. By June 2016, at least five entities privatized through strategic or equity sale from a baseline of no privatization transactions. 2. By June 2016, an improved system/framework providing availability/coverage/quality of credit information for consumers and SMEs. 3. By June 2016, the simple average statutory customs tariff rate is at or lower than 12 percent, and no special (concessionary) Statutory Regulatory Orders (SROs) granting tax exemptions are issued. 4. By June 2016, the number of unconditional cash transfer (UCT) beneficiaries reaches at least 5.5 million. 5. By June 2016, the overall tax collection is at least 11.5 percent of GDP.
Overall Risk Rating High
Climate and Disaster Risks
(i) Are there short and long term climate and disaster risks relevant to the operation (as identified as part of the SORT environmental and social risk rating)? Yes No If yes, (ii) summarize briefly these risks in the risk section and what resilience measures may help address them? This operation is not likely to cause any environmental effects. At the national level, the country already has proper and effective mechanisms to manage disasters.
Operation ID P151620
X
iv


INTERNATIONAL DEVELOPMENT ASSOCIATION PROGRAM DOCUMENT FOR A PROPOSED CREDIT TO THE ISLAMIC REPUBLIC OF PAKISTAN
1. INTRODUCTION AND COUNTRY CONTEXT
1. This memorandum describes the second Fiscally Sustainable and Inclusive Growth (FSIG-II) single-tranche reform credit for US$500 million to the Islamic Republic of Pakistan. The proposed loan will be the second of a programmatic series of loans. The FSIG series has two broad objectives: fostering private and financial sector development to bolster economic growth, and mobilizing revenue while expanding fiscal space to priority social needs. The operation contributes to the government’s strategy for accelerating economic growth, ensuring fiscal consolidation, increasing investment, and enhancing the openness of the economy to domestic and external competition. A programmatic approach is proposed to customize actions and preserve reform momentum. Moreover, lessons from other similar operations in Pakistan favor a carefully sequenced and continuous reform approach.
2. Going into the May 2013 elections, Pakistan was in a near-crisis economic situation. Unprecedented floods in 2010 and 2011, coupled with continuing security issues, stalling economic reform, falling investment and external financial inflows, increased devolution of responsibilities to the provinces, and fiscal disarray preceding the elections posed critical challenges that severely affected two major macroeconomic imbalances: by the end of the 2012/13 international reserves were around 1.5 months of imports, and the fiscal deficit (excluding grants) reached 8.3 percent of gross domestic product (GDP), a very high level for the third year in a row. Weak fundamentals had the economy bordering on stagflation.
3. The first peaceful transition from one democratically elected government to another in Pakistani history gave the incoming administration a solid reform mandate. On May 11, 2013, 86.2 million registered Pakistanis cast their vote. The results favored the Pakistan Muslim League–Nawaz (PML-N) with a majority of seats. At the provincial level PML-N retained its mandate to govern Punjab. Two opposition parties won mandates as well: Pakistan Tehreek-e-Insaf emerged as the largest party in Khyber Pakhtunkhwa provincial assembly, while the Pakistan People’s Party managed to stay the largest political force in Sindh provincial assembly.
4. Within months of taking office, the new government framed a program of reforms and successfully negotiated an Extended Fund Facility (EFF) with the International Monetary Fund (IMF). Approved in September 2013, the Government’s program articulated an ambitious emergency response to prevent a balance-of-payments crisis, correct fiscal imbalances and put the economy on the road to stabilization and rapid growth recovery. It also contains a growth-oriented agenda focused on the major constraints to growth—energy supply, poor investment climate and low competitiveness.
5. After a year of successful program implementation, domestic shocks—political, natural disaster-related and security-related—hit the economy, affecting the pace of reforms in the second half of 2014. Political conditions started deteriorating in August 2014, due to street sit-ins followed by lengthy demonstrations nationwide until December. Concurrently, floods hit central Punjab in September and damaged some of the major agricultural crops (sugar, rice and cotton). And then in December 2014, security conditions deteriorated with the attack of the Pakistan Taliban on a school in Peshawar. The direct
1

economic impact of these shocks was, fortunately, small and of short-lived. Because of heightened political uncertainty, the rupee depreciated, forcing the State Bank of Pakistan (SBP) to intervene. A few investment decisions were postponed and growth was affected by the paralysis of government services for a few weeks. Government estimates of the floods damage and the cost of added security were also small (each about 0.2 percent of GDP). But, by preoccupying the government, the shocks did slow down the pace of reforms in three areas: power tariff adjustments, privatization and passing of laws. Hence, the measures supported by this operation and the Power Sector Reform DPC aim to reinvigorate reforms implementation.
6. One reason for the limited economic impact of the domestic shocks was the concurrent fall in global oil prices, which came as a windfall for a net oil-importer economy like Pakistan, and opened an opportunity to accelerate structural reforms. The price of crude oil plummeted from about $105 per barrel in June 2014 to around $50 per barrel by December 2014. Since about one-third of Pakistan’s import payments are for crude oil and petroleum products, a 50 percent average decline in prices reduces the annual import bill by about $3 billion, equivalent to about 1 percent of GDP. Besides the direct deflationary and growth effects on the economy of low oil prices, this windfall has provided an opportunity, which the Government has taken an advantage of, to adjust further electricity tariffs that will bring fiscal gains from lower energy subsidies, while also allowing for some fall in consumer tariffs, and saving foreign reserves.1 This has brought back momentum for growth and reforms.
7. The FSIG series fosters inclusion not only through its direct growth impact but also its indirect effects on poverty reduction and shared prosperity. The most recent poverty assessment on Pakistan finds economic growth as the main determinant of poverty reduction and improved shared prosperity. Despite falling and increasingly volatile but positive per capita growth, poverty declined over the last decade in Pakistan. The share of the population below the national poverty line fell from 34.7 percent in 2001/02 to an officially estimated 12.4 percent in 2010/2011 (the latest available poverty data). Real per capita consumption of the bottom 40 percent of the population—a measure of shared prosperity—also exceeded that of the top 60 percent in the same period. BISP cash transfers were an important contributor to the volatile and low but positive rise in income per capita during the period. Analysis also shows that growth has been broadly inclusive, with the national Gini coefficient falling from 0.34 to 0.29 between 1998/99 and 2010/11. This operation supports inclusive growth through several channels. First, by supporting measures to foster private investment, the operation aims to contribute to the creation of more and better jobs. Second, the measures to support financial inclusion among the most vulnerable, should, by raising their access to credit, increase household incomes and consumption. Third, the measures to create fiscal space and reallocate expenditures to priority education and health provincial outlays should contribute to the creation of human capital and increased access to opportunity for the poorest segments of the populations. Fourth, by eliminating tax-exemption privileges, the operation fosters tax equity. And fifth, the measures increase the volume of unconditional cash transfers efficiently targeted to the poor and vulnerable to protect them from volatile growth and frequent natural disasters; and conditional cash transfers to support access by poor children to primary school and, more broadly, build the human capital assets of the poor.
1 The Government implemented a surcharge of PRs0.30/kWh in October 2014 and an additional PRs0.60/kWh in January, and started applying a new FY14/15 uniform electricity tariff including additional production and distribution costs.
2

2. MACROECONOMIC POLICY FRAMEWORK
2.1. Recent Economic Developments
8. Economic conditions have improved over the past twenty one months. The risk of a balance of payments crisis has receded with a significant increase in international reserves resulting from strong remittances, foreign capital inflows and the windfall from lower oil prices. The current account deficit was a modest 0.7 percent of GDP in the first nine months of FY14/15. The foreign exchange market has been stable. Headline inflation reduced to 2.1 percent Y-o-Y up to March 2015. The fiscal deficit was contained at around 5.5 percent of GDP in FY13/14 due to improved tax collection, high non-tax revenues, and restricted expenditures. Private sector credit has also rebounded and supported growth. Non-performing loans continue to decline. The adverse political and security events and floods of the first semester of FY14/15 were offset by the positive effects of the decline in oil prices.
9. Growth has maintained its upward momentum, but remains below required levels needed to accelerate job creation and improve living standards. The industrial sector, accounting for 21 percent of GDP, grew by about 4 percent based on construction, electricity generation, gas distribution and large scale manufacturing (LSM). The services sector, comprising 53 percent of GDP performed well, particularly in wholesale and retail trade and in transport, storage and communication. Growth in FY14/15 has been broad-based, driven by agriculture and services and, to a lesser extent, by manufacturing.
10. There is less risk of a balance of payments crisis. Official foreign exchange reserves reached US$11.1 billion in February 2015, equivalent to 2.6 months of next year’s imports, and well above the low of US$3.0 billion in November 2013. The current account deficit remains small at around 1.2 percent of GDP due to growing workers’ remittances, steady receipts from the Coalition Support Fund and a reduced oil import bill. The chronically negative trade balance persists and was 6.7 percent of GDP in FY13/14. The capital and financial account benefitted from steady disbursements from general government loans and receipts in FY13/14 of: US$1.5 billion from Pakistan Development Fund (PDF); US$2 billion from Eurobond issues; US$0.5 billion from privatization proceeds. In another sign of restoring investors’ confidence, US$1 billion was received from Sukuk bond issues in the first half of FY14/15; and FDI flows more than doubled to US$1.8 billion during July-March 2015 with respect to US$0.8 billion in the same period of previous year. The country is now on track to build a reserve buffer well around 4 months of imports. However, this goal remains potentially vulnerable to a downturn in remittances from Gulf Cooperation Countries (GCC), reduced external demand for Pakistani exports, any decline in external support, and lower FDI inflows especially if proceeds from the privatization program do not materialize as expected.
11. Reserves build up caused the Rupee to appreciate in 2013/14 in real terms, but it has mildly depreciated since. A 7.8 percent appreciation of the Real Effective Exchange Rate (REER) in FY13/14 reduced export competitiveness, with exports growing at 1.4 percent compared with import growth of 3.9 percent. Exports were mainly driven by traditional textile products, petroleum products and rice. Imports were driven by domestic production inputs: machinery for power generation, textiles and construction grew by about 26 percent. During the first half of FY14/15, however, the Rupee depreciated by 3.3 percent in real terms, due to political uncertainty, slowing of economic reforms, and the failed placement of Oil and Gas
3

Development Company Limited (OGDCL) shares.
12. Strong fiscal consolidation has corrected the previously loose fiscal stance and improved sustainability, but important challenges remain. During FY13/14, the fiscal deficit (excluding grants) declined from 8.3 percent to 5.5 percent of GDP: revenue increased by 1.2 percent of GDP and expenditures decreased by 1.7 percent of GDP. Spending on subsidies fell slightly from 1.4 to 1.2 percent of GDP. The provinces contributed with a fiscal surplus of 0.6 percent of GDP. Based on the first half of FY14/15, the government is on track to achieve a target fiscal deficit of 4.9 percent of GDP, thanks to new tax measures equivalent to about 0.9 percent of GDP and reduced electricity subsidies. However, falling international oil prices and legal challenges to one important source of revenue, the Gas Infrastructure Development Cess, dampened tax efforts. In addition, the accumulation of circular debt in the power sector remained as a fiscal liability. In February 2015 the government took measures to raise an additional 0.4 percent of GDP, including raising the General Sales Tax (GST) rate on petroleum products from 17.5 percent to 27.5 percent and imposing regulatory duties on some luxury items.
13. Public debt sustainability is starting to improve. The public debt to GDP ratio decreased to 64.3 percent in FY13/14, but it remains above the 60 percent limit stipulated in the Fiscal Responsibility and Debt Limitation Act (FRDLA) 2005.2 Although more expensive domestic debt, at 67 percent of the total, skews the overall debt composition, the last year has seen a move to longer maturities. Recent Eurobond and Sukuk issues, lending from multilaterals and privatization proceeds have allowed the government to reduce its short term borrowing needs from the central and domestic banks and repay expensive domestic debt. As of end-December 2014, total public debt had declined by about 1 percent of GDP compared with the year before, mainly because of an equivalent reduction in its foreign currency component.
14. Private sector credit growth has rebounded despite monetary tightening. Lower demand by the government gave space to the private sector to increase its borrowing from the commercial banking system by 11.2 percent in FY13/14, the highest rate in the past six years.
15. Prices have stabilized due to fiscal consolidation, monetary tightening and low oil prices. For a third year in a row, headline CPI inflation is in single digits. In March 2015 it was 2.5 percent, although core inflation stood at 5.9 percent. Year-on-year, food inflation declined to 3.0 percent. Falling oil prices have not only contributed directly through reductions in petroleum product prices and electricity tariffs but also indirectly through reduced service and manufacturing costs.
16. Financial sector developments are also supporting recovery. To foster private sector credit, the State Bank of Pakistan (SBP) cut its key policy rate by 100 basis points (bps) to 8.5 percent in January 2015, and by a further 50 bps to 8 percent in March, 2015, owing to favorable trends in oil prices and falling inflation. To anchor inflation expectation and improve liquidity management, the central bank also announced a time-bound plan to set the policy rate between the floor and ceiling rates of the interest rate corridor in a forward looking fashion, thus maintaining real interest rates positive and in line with future reserves accumulation and a stable
2 The FRDLA allows a departure from the threshold provided the Finance Minister specifies the reasons and the measures government intends to take to return below the threshold over an estimated period of time [Section 3 (4) of the FRDLA 2005].
4

inflation path. The banking sector has maintained an improved performance and solvency. Year on year banking profitability improved, growing by 52 percent up to December 2014. Non-performing loans (NPLs) declined to 12.3 percent of the overall loan portfolio in December 2014 and by virtue of adequate provisioning, net NPLs were 2.7 percent. The provisions to NPLs coverage ratio increased to 80 percent. The improvement in credit quality is broad based, as NPLs across SMEs, agriculture and consumer sectors decreased from 32.3 percent, 14 percent and 13.6 percent in December 2013 to 30 percent, 12.4 percent, and 11.6 percent respectively in December 2014.
17. Country risk perception is improving. Pakistan’s Emerging Market Bonds Index Plus (EMBI+) risk spread has declined from its peak in March 2013 of 1,011 bps to 461 bps in April 2015. Also, Moody’s changed the outlook on its low Caa1 sovereign credit rating from stable to positive in March 2015. Market confidence allowed Pakistan to raise $2 billion in May 2014 through two dollar-denominated Eurobonds with bullet maturities and coupons of five years and 7.25 percent and ten years and 8.25 percent, implying a spread of about 460-560 basis points over US Treasuries. More recently, the government issued a US$1 billion five-year international Sukuk in November 2014 at 6.75 percent.
2.2. Macroeconomic Outlook
18. The outlook for FY14/15 to FY18/19 is for moderately higher economic growth. As the stabilization of the economy is preserved and the country builds a comfortable cushion in its external reserve position, this assumes steady progress in implementing the key pillars of the Government’s medium term program (Box 1), which preserves the growth momentum, but at moderate levels. Each of those pillars tackles the key constraints to growth: electricity load shedding, poor service delivery by inefficient and fiscal losses-prone State Owned-Enterprises (SOEs), a non-competitive trade regime, a cumbersome business environment, low access to finance, and poor revenue mobilization that constrains the fiscal space. The outlook also assumes that the windfall gains of low oil prices reduce gradually over the next 2-3 years and that political and security risks are well-managed.
19. Growth will be driven by a mix of consumption recovery on the demand side and by productivity gains in the services and large-scale manufacturing sectors on the supply side. Demand side drivers are expected to be low oil prices, strong but declining remittances, reinvigorated private investment, some export growth and, to a lesser extent, public investment. The supply side drivers are expected to be productivity gains in the services and large-scale manufacturing sectors, which should benefit from decreased power load-shedding and improvements in the business climate and public sector enterprises. Stable or declining international commodity prices are expected to help reduce inflationary pressures, lower interest rates and favor consumption. Aided by a gradually improving security situation, structural reforms are expected to spearhead productivity growth, reduce the country risk, promote foreign and domestic investment linked to the sale or restructuring of state-owned enterprises (SOE) and foster competition in the banking, telecom and commercial service sectors.
20. As inflation falls, monetary tightening should lessen and support growth. Fiscal consolidation is expected to reduce government’s borrowing needs and create some fiscal space for public investment while reducing public debt. Scheduled banks’ liquidity is in turn expected to increase. As a result, crowding out of private sector credit should decline, favoring private
5

investment. Successful fiscal consolidation, gradual rebuilding of the external position and lowering of the country risk, are expected to facilitate external financing and enable the business environment to stimulate private financial inflows. The baseline macro projections are shown in Table 1 and explained below.3
Table 1: Key Macroeconomic Indicators Pakistan FY10/11 to FY18/19
Source: Pakistani Authorities, IMF and World Bank staff estimates. 1/ National estimates. 2/ Includes medium and long term PPG debt as well as short-term external debt and IMF debt (budget and balance of payments support), foreign currency bonds (NHA/NC) as well as PSE’s non-guaranteed debt. 3/ SBP Gross Reserves exclude Cash Reserve Requirement, gold and foreign currency deposits of commercial banks held with SBP. 4/ In months of next year’s imports of goods and services. 5/ Total external debt is inclusive of medium and long term PPG debt as well as short-term external debt, IMF and private debt. 6/ Source: WDI (as of March 8, 2015).
• Growth and inflation: GDP growth is expected to reach 4.4 percent in FY14/15 and pick up to around 5 percent in FY17/18 and onwards. Services are projected to expand, especially telecom, fostered by new 3G/4G broadband services, electricity and transport. Manufacturing is expected to benefit from improved energy supply and better private sector credit conditions. Consumption will be supported by remittances, albeit with declining growth rates. Private investment is expected to benefit from better business conditions, public investment and from fiscal space opened through fiscal consolidation. Manufactured goods and services exports are expected to grow at an average of 4 percent. They will be supported by strengthened private investment and by the Generalized System of Preferences (GSP)4 plus for 75 new major export
3 All data, tables and figures contained in this document are based on information available until April 30, 2015. 4 The GSP is a preferential tariff system which provides for a formal system of exemption from the more general rules of the World Trade Organization (WTO) (formerly, the General Agreement on Tariffs and Trade or GATT).
FY10/11 FY11/12 FY12/13 FY13/14 FY14/15 FY15/16 FY16/17 FY17/18 FY18/19
Real economyNominal GDP at market prices (in bn. of rupees) 18,276 20,047 22,489 25,402 28,081 30,566 33,536 36,940 40,538 Real GDP growth (at factor cost) 3.6 3.8 3.7 4.1 4.4 4.6 4.8 5.0 5.1Contributions:
Agriculture 0.4 0.8 0.6 0.5Industry 0.9 0.5 0.3 1.2Services 2.2 2.5 2.8 2.5
Per Capita GDP (current US$) 6/ 1,212 1,252 1,275 ..Unemployment rate 1/ 6.0 6.0 6.2 ..Consumer prices (period average) 13.7 11.0 7.4 8.6 5.5 5.0 5.0 5.0 5.0Consumer prices (eop) 13.3 11.3 5.9 8.2
Fiscal sectorExpenditures 19.5 21.6 21.4 19.8 19.5 19.5 19.6 19.7 19.8Revenue 12.4 12.8 13.1 14.3 14.6 15.0 15.4 15.7 15.9Overall balance (excl. grants) -7.1 -8.8 -8.3 -5.5 -4.9 -4.5 -4.2 -4.0 -3.9Total public debt 60.0 64.5 64.8 64.3 63.0 62.4 61.3 59.8 58.7
Foreign currency public debt 2/ 26.7 26.0 22.0 20.9 19.9 20.1 19.9 19.8 20.0Domestic currency public debt 33.3 38.5 42.8 43.4 43.1 42.4 41.4 40.0 38.7
Monetary SectorBroad Money 15.9 14.1 15.9 12.5Credit to non-government 4.0 7.5 -0.6 11.4Interest (key policy interest rate) 14.0 12.0 9.0 10.0
Balance of paymentsCurrent account balance (incl. transfers) 0.1 -2.1 -1.1 -1.3 -1.2 -1.2 -1.6 -1.6 -1.9
Exports of goods & services 14.6 13.2 13.6 12.3 11.3 10.8 10.6 10.8 11.0Imports of goods & services 20.4 21.7 20.9 20.1 18.7 17.9 18.1 18.2 18.7
Capital and financial account 1.1 0.7 0.4 3.0 2.9 1.8 1.8 2.0 2.6Foreign direct investment, net 0.7 0.3 0.5 0.6 0.5 0.8 0.8 0.8 0.7
Gross official reserves (in US$ million, eop) 3/ 15,662 10,852 6,047 9,171 15,443 19,209 19,927 20,733 22,368 Gross official reserves (in months of imports of G&S) 4/ 3.9 2.7 1.5 2.1 3.6 4.2 4.1 4.0 4.0Total external debt 5/ 31.0 29.1 26.2 26.6 25.7 25.5 25.0 24.7 24.4Rupees per U.S. dollar (period average) 85.5 89.2 96.8 102.9
Memo:Nominal GDP at market prices (in US$ billion) 213.8 224.6 232.2 246.9GDP, PPP (current international $) 6/ 750.7 791.0 838.2 ..
Actual
(Percentage change; unless otherwise indicated)
(In percent of GDP; unless otherwise indicated)
(Percentage change; unless otherwise indicated)
(In percent of GDP; unless otherwise indicated)
Projections
6
products entering the European market, recovery in the United States, gradual trade normalization with India and opening of new markets in South and East Asia. Inflation is expected to settle at 5 percent from FY15/16 onwards owing to continued fiscal prudence and an improved global economic outlook. Relatively favorable terms of trade and a close to neutral exchange rate will support Pakistani exports’ external competitiveness and the trade balance.
Table 2: Key Fiscal Indicators Pakistan FY11/12 to FY18/19
Source: World Bank Staff estimates
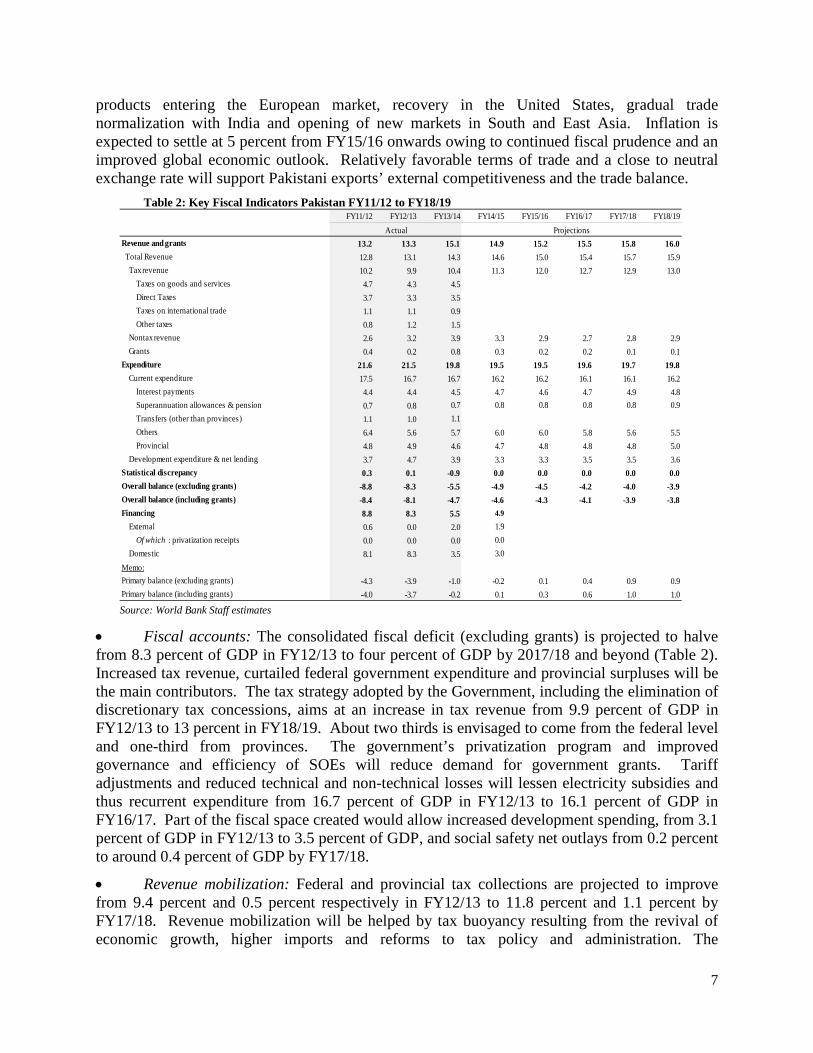
• Fiscal accounts: The consolidated fiscal deficit (excluding grants) is projected to halve from 8.3 percent of GDP in FY12/13 to four percent of GDP by 2017/18 and beyond (Table 2). Increased tax revenue, curtailed federal government expenditure and provincial surpluses will be the main contributors. The tax strategy adopted by the Government, including the elimination of discretionary tax concessions, aims at an increase in tax revenue from 9.9 percent of GDP in FY12/13 to 13 percent in FY18/19. About two thirds is envisaged to come from the federal level and one-third from provinces. The government’s privatization program and improved governance and efficiency of SOEs will reduce demand for government grants. Tariff adjustments and reduced technical and non-technical losses will lessen electricity subsidies and thus recurrent expenditure from 16.7 percent of GDP in FY12/13 to 16.1 percent of GDP in FY16/17. Part of the fiscal space created would allow increased development spending, from 3.1 percent of GDP in FY12/13 to 3.5 percent of GDP, and social safety net outlays from 0.2 percent to around 0.4 percent of GDP by FY17/18.
• Revenue mobilization: Federal and provincial tax collections are projected to improve from 9.4 percent and 0.5 percent respectively in FY12/13 to 11.8 percent and 1.1 percent by FY17/18. Revenue mobilization will be helped by tax buoyancy resulting from the revival of economic growth, higher imports and reforms to tax policy and administration. The
FY11/12 FY12/13 FY13/14 FY14/15 FY15/16 FY16/17 FY17/18 FY18/19
Revenue and grants 13.2 13.3 15.1 14.9 15.2 15.5 15.8 16.0
Total Revenue 12.8 13.1 14.3 14.6 15.0 15.4 15.7 15.9
Tax revenue 10.2 9.9 10.4 11.3 12.0 12.7 12.9 13.0
Taxes on goods and services 4.7 4.3 4.5
Direct Taxes 3.7 3.3 3.5
Taxes on international trade 1.1 1.1 0.9
Other taxes 0.8 1.2 1.5
Nontax revenue 2.6 3.2 3.9 3.3 2.9 2.7 2.8 2.9
Grants 0.4 0.2 0.8 0.3 0.2 0.2 0.1 0.1
Expenditure 21.6 21.5 19.8 19.5 19.5 19.6 19.7 19.8
Current expenditure 17.5 16.7 16.7 16.2 16.2 16.1 16.1 16.2
Interest payments 4.4 4.4 4.5 4.7 4.6 4.7 4.9 4.8
Superannuation allowances & pension 0.7 0.8 0.7 0.8 0.8 0.8 0.8 0.9
Transfers (other than provinces) 1.1 1.0 1.1
Others 6.4 5.6 5.7 6.0 6.0 5.8 5.6 5.5
Provincial 4.8 4.9 4.6 4.7 4.8 4.8 4.8 5.0
Development expenditure & net lending 3.7 4.7 3.9 3.3 3.3 3.5 3.5 3.6
Statistical discrepancy 0.3 0.1 -0.9 0.0 0.0 0.0 0.0 0.0
Overall balance (excluding grants) -8.8 -8.3 -5.5 -4.9 -4.5 -4.2 -4.0 -3.9
Overall balance (including grants) -8.4 -8.1 -4.7 -4.6 -4.3 -4.1 -3.9 -3.8
Financing 8.8 8.3 5.5 4.9
External 0.6 0.0 2.0 1.9
Of which : privatization receipts 0.0 0.0 0.0 0.0
Domestic 8.1 8.3 3.5 3.0
Memo:
Primary balance (excluding grants) -4.3 -3.9 -1.0 -0.2 0.1 0.4 0.9 0.9
Primary balance (including grants) -4.0 -3.7 -0.2 0.1 0.3 0.6 1.0 1.0
ProjectionsActual
7

government’s strategy to broaden the tax base and reduce the tax gap is focused on five areas: (i) minimization of tax expenditure under a three-year program phasing out SROs; (ii) upward revision of sales tax and general excise tax rates; (iii) upward revision of the capital gains tax on securities and immovable property; (iv) renewed procedures and thresholds for income and sales tax registration; and (v) identification of tax evaders in commercial and professional services sectors. While the first stage of removal of SRO-supported concessionary tax exemptions is estimated to increase revenues by around 0.35 percent of GDP, as part of existing measures accounting for 0.7 percent of GDP in FY14/15, the total estimated additional revenue expected from the three-year plan for phasing out SROs is about one percent of GDP (Annex 10). A gradual decrease of nontax revenues is assumed, which are projected to fall from 3.2 percent of GDP in FY12/13 to 2.8 percent of GDP in FY18/19, the result of reduced Coalition Support Funds provided by the United States. • External Sector. The current account deficit is expected to increase to 1.6 percent in FY16/17—slightly up from 1.3 percent of GDP in FY13/14. Faster growth will require higher imports of raw materials and fuels. Strong remittances will contribute to a modest but growing current account deficit in the medium term. Slightly higher foreign investment inflows attracted by a gradually lower country risk, initial privatizations, and declining multilateral financial net inflows will support the financial account. Official foreign exchange reserves are projected to be at 3.6 months of import coverage by end FY14/15 and reach a plateau of 4 months in 2015/16. • Financing Gap. Gross financing requirements from the balance of payments are expected to be about US$7.7 billion by end-FY16/17 and their mix is expected to change. IMF and official creditors’ amortization is projected to decline by almost US$3.2 billion between FY13/14 and FY16/17. In contrast, the current account deficit is projected to widen in absolute terms by about US$1.8 billion by 2016/17. Multilateral, bilateral and private debt-creating flows coupled with disbursements under the EFF and DPCs are expected to be early financing sources; later supported by modest increases in FDI. In FY14/15, the main sources of official financing are projected to be: the Coalition Support Fund (US$1.8 billion), IMF (US$2.7 billion), World Bank (US$1 billion), and the Asian Development Bank (US$0.74 million). Issuance of US$1.0 billion of Sukuks has also contributed to fill the financing gap. In FY16/17 the government plans to issue Eurobonds and Sukuks to the tune of $2.2 billion. Modest increases in FDI inflows originating from privatization are expected to close this financing gap. FDI and portfolio investment flows are projected to increase from US$2.8 billion in FY14/15 to US$3.6 billion by FY16/17. Balance of Payment financing requirements are shown in Table 3.
• Public Debt. Pakistan’s public debt to GDP ratio is projected to decline in FY14/15 to 63.0 percent and cross below the threshold of 60 percent by 2017/18. The sources of financing for the projected 2014/15 fiscal deficit of around 4.9 percent of GDP will be domestic (three percent of GDP, down from 3.5 percent of the previous year) and external (1.9 percent of GDP, slightly below the two percent of the previous year). A debt sustainability analysis shows that the debt path is highly sensitive to exchange rate depreciation shocks and, to a lesser extent, the materialization of contingent liabilities, either from power circular debt or SOE losses which might put the level of public debt much above the threshold of 60 percent of GDP. The debt sustainability analysis is shown in Figure 1 and discussed further in Annex 12.
8

Table 3: Pakistan BOP Financing Requirements and Sources FY11/12 to FY15/16
Actual Projections In million US Dollars FY12/13 FY13/14 FY14/15 FY15/16 FY16/17 Financing requirements 7,934 8,897 7,338 7,808 7,733 Current account deficit 2,496 3,057 3,240 3,470 4,782 Maturing short-term debt 391 5 409 1,436 373 Amortization of medium- and long-term debt 5,047 5,835 3,689 2,902 2,579
To IMF 2,538 2,230 1,182 200 20 To other official creditors 1,891 2,702 2,308 1,702 1,778 To private creditors 618 903 200 1,000 781
Financing sources 7,932 8,897 7,338 7,808 7,733 FDI and portfolio investments (net) 1,284 4,295 2,817 3,220 3,650 Capital grants 250 326 641 534 341 Other net capital and financial inflows -1,067 1,380 614 -97 780 Short term debt disbursements 256 732 1,849 803 803 Long term debt disbursements 2,683 5,447 7,852 7,164 2,928
From IMF 0 1,657 2,798 2,091 93 From other official creditors 2,274 3,525 2,904 4,573 2,554 From domestic private creditors 409 265 2,150 500 281
Change in reserves (decrease = +) 4,530 -3,283 -6,435 -3,816 -768 Source: World Bank Staff calculations and estimates
21. The macroeconomic framework is adequate for the proposed operation. Economic activity is picking up, inflation is significantly declining, and the fiscal deficit is narrowing down. Previous external imbalances are declining, the current account deficit remains modest and a minimum cushion in foreign exchange reserves has been successfully rebuilt.
2.3. IMF Relations
22. The IMF program is on track. Pakistan entered into a 36-month EFF with IMF in September 2013 for an amount of SDR 4,393 million. So far Pakistan has undergone six successful quarterly program reviews with IMF and has received an amount of $ 3.75 billion from IMF under EFF in six quarterly installments. Last May, Staff level agreement was reached on the Seventh review and Executive Board approval is expected in end-June 2015 with another tranche of SDR 360 million (about US$506 million) to be made available. Pakistan met all end of March 2015 performance criteria, including those on the budget deficit and accumulation of net international reserves. Program performance has been strong and no waiver has been required
Figure 1. Pakistan Debt Sustainability Analysis FY09/10 to FY18/19 External Debt Composition as of December 31, 2014
USD(mn)
Share of total debt % of GDP
Monetary authoriities 6,241 9.7% 2.3%
General Government 47,303 73.5% 17.2%
Banks 2,252 3.5% 0.8%
Other sectors 8,541 13.3% 3.1%
Of which intercompany lending 3,053 4.7% 1.1%
Total External debt 64,338 100.0% 23.4%
Long term 58,804 91.4% 21.4%
Short term 5,534 8.6% 2.0%Sources: Pakistan authorities
Figure 1. Pakistan Debt Sustainability Analysis FY09/10 to FY18/19
50
55
60
65
70
75
200
9/1
0
201
0/1
1
201
1/1
2
201
2/1
3
201
3/1
4
201
4/1
5
201
5/1
6
201
6/1
7
201
7/1
8
201
8/1
9
Actual Projections
In p
erc
en
t of
GD
P
Public Debt Sustainability Analysis
Contingentliabilities 1/
Inte rest ra te 2/
ER depreciation 3/
Baseline 4/
Source: World Bank staff estimatesNotes: 1/ One time 10 percent of GDP increase in other debt creating flows in 2015/162/ Real interest rate is at baseline plus one standard deviation3/ One time 30 percent real depreciation in 2015/164/ Country team projections
10
20
30
40
200
9/1
0
201
0/1
1
201
1/1
2
201
2/1
3
201
3/1
4
201
4/1
5
201
5/1
6
201
6/1
7
201
7/1
8
201
8/1
9
Actual Projections
In p
erc
en
t of
GD
P
External Debt Sustainability Analysis
Current account 1/
Combined 2/
ER depreciation 3/
Baseline 4/
Source: World Bank staff estimatesNotes: 1/ Non-interest current account is at baseline minus one-half 10-year historical standard deviations2/ Combination of three shocks: i. Non-interest current account is at baseline minus one-quarter standard deviation, ii. Real GDP growth is at baseline minus one-quarter standard deviation, iii. Nominal interest rate is at baseline plus one-quarter standard deviation3/ One time 30 percent real depreciation in 2015/164/ Country team projections
9

since the fifth review. The Authorities remain committed to achieving its program targets and address policy constraints with increasing its focus on building on the macroeconomic stability gains and to achieve higher, sustainable and inclusive growth.
3. GOVERNMENT’S PROGRAM
23. Upon taking office, the new administration introduced a comprehensive reform program. Under this program, the government committed to adopt stabilization measures to eliminate the country’s macroeconomic imbalances and initiate growth-oriented structural reforms needed for a more efficient economy (Box 1). In its first two years, the government has made promising inroads at implementing its reform agenda. On the one hand, it has issued holistic strategies and policies on its major reform areas: an energy policy on August 2013, a privatization strategy in October 2013, a tax reform strategy on February 2014, a 3-year plan for phasing out SROs-based tax exemptions policy on June 2014, a plan for improving the investment climate in October 2014, a national financial inclusion strategy in January 2015 and a Tariff Rationalization plan in March 2015. On the other hand, it has achieved some initial outcomes for reform implementation: it cleared pending powers arrears upon taking office; successfully completed the first equity and strategic sales of its privatization agenda; approved the first phase of the removal of the discriminatory SROs and Customs Rationalization Plan in the budget bill FY14/15; created the One Stop Shop for business registration; and prepared a set of draft bills on private credit bureaus, secured transactions and corporate restructuring that will change the landscape for financial inclusion in the country.
4. THE PROPOSED OPERATION
4.1. Link to Government Program and Operations Description
24. The proposed FSIG-II single-tranche credit has catalyzed the initial outcomes required for further consolidation and deepening of key inclusive growth-enhancing components of the government’s program described above. The first credit of the series addressed critical institutional and regulatory changes needed to jumpstart the reforms. The second credit brings continuity and sustainability to most actions of the first phase, while introducing new inclusion and governance actions. The policy program supported by FSIG-II is structured around two main pillars: (a) fostering private and financial sector development through privatization of SOEs, expanding access to finance, improving trade competitiveness, and enhancing the investment climate; and (b) mobilizing revenue and expanding priority social spending.
25. The pillars around which this FSIG series is organized are essential prerequisites and enablers for sustained poverty reduction and shared prosperity. As the growth elasticity of Pakistan’s poverty rate is among the highest in the world, by the expected impact on growth acceleration, the operation is also expected to contribute to poverty reduction and shared prosperity. And similarly, protecting the safety net and enhancing business-friendly conditions will contribute to inclusive growth and governance.
10

Box 1. Key Economic Priorities of the Government’s Program The government envisages stabilizing the economy, bringing inflation down to the 6–7 percent range, and achieving growth rate targets of 6–7 percent by 2017/18 or earlier. To do this, it has set the following goals and comprehensive policy agenda: Stabilization Moving to fiscal consolidation. Reducing the fiscal deficit from 8.3 percent of GDP in 2012/13 to 3.5-
4 percent in 2016/17 by increasing revenues by around 3 percent of GDP, eliminating tax exemptions; imposing austerity in other-than social expenditure outlays, cutting down power subsidies; raising the allocations to priority safety net (BISP); and carrying on active public debt management.
Rebuilding the external position to no less than 3 months of imports and tightening monetary policy. Scaling back monetary accommodation of fiscal deficits and setting up policy rates to keep positive real interest rates; strengthening the central bank’s independence; and protecting the external position by repurchasing reserves to cushion against major shocks.
Main growth-enhancing reforms Comprehensive power sector reform. Reducing power subsidies; restructuring boards of power distribution
and generation companies; making new investments; strengthening the power sector regulator; and expanding alternative sources of energy.
Reforming or privatizing SOEs. Privatizing by equity or strategic sales; or if restructuring, then requiring professional chief executives and board members and their compliance with Public Sector Companies (Corporate Governance) Rules 2013.
Improving trade competitiveness. Simplifying tariffs, with four slabs and 1–25 percent rates, and phasing out trade-distortive statutory regulatory orders (SROs) on some 4,000 products.
Normalizing trade relations with India. Extension of the most-favored nation status to it; shifting products to the “sensitive list” under the South Asian Free Trade Agreement to facilitate regional trade; and taking full advantage of trade preferences available from the European Union.
Enhancing the investment climate. Establishing a One Stop Shop for registering limited liability companies; and strengthening of the BOI in implementing a plan for improving the business environment and investment-friendly special economic zones.
Expanding access to finance. Developing the SBP’s Financial Inclusion Program to enhance access of SMEs to financial services through regulatory reforms, product innovation, financial literacy, and consumer protection.
26. The record of implementing reform-oriented operations in Pakistan has been mixed. Assessments of past operations therefore provide valuable country-specific lessons, and these have been borne in mind in designing and preparing this DPC series:
• The 2011 Country Partnership Strategy Progress Report notes that deep reform progress supported by development policy lending should be aware of the slow pace of structural reform, the permanent risk of an earlier than anticipated closing of the IMF program, and suggests that multi-sector operations tend to fail. As a result, this operation was deliberately split from the DPC on power and frontloaded on early achievements of the reform program. • The 2012 Tax Administration Reform Project Implementation Completion Report says that given the policy, legal, and institutional complexities involved in mobilizing revenue, an investment operation alone strictly focusing on improving tax administration is unlikely to increase the tax ratio on a sustained basis. It should be complemented by upfront tax-policy measures. As a result, this DPC complemented the following projects focused on tax administration at the federal level—the Project Preparation Facility on a Revenue Mobilization Disbursement-Linked Indicators Project (P128182) --and at the provincial level, the Sindh Public Sector Management Reform Project (P145617).
11

• The 2007 Poverty Reduction and Economic Support Operation underscores the importance of (a) aligning the program with the relevant levels of government, that is federal or provincial; (b) avoiding dispersion and being selective on the most critical areas of reform; (c) addressing capacity issues with timely technical assistance (TA); (d) undertaking robust and comprehensive prior analytical work; (e) being aware that institutional reforms take time and need multiyear support; and (f) having flexibility to respond to new developments. As a result, the design of this DPC matched the Government’s priorities, focused on just two areas, provided timely complementary TA, did prior relevant analytical efforts, and sequenced policy measures under flexible terms.
4.2. Prior Actions, Results and Analytical Underpinnings
27. The eleven FSIG-II prior actions and associated results indicators are set out in the Policy and Results Matrix (provided in Annex 1). The actions build on the achievements of FSIG-I. For most of the indicative triggers, the measures actually adopted by the government have been stronger than originally expected. The prior actions, while still supporting the original two pillars have been adjusted where necessary, following the principle of flexibility. Two new prior actions have been added to address inclusion and economic governance concerns and no trigger from FSIG-I was dropped. The policy matrix that appears in Annex A1.A in Annex 1 also includes an Annex A1.B showing the indicative triggers originally proposed for this second operation, the modified prior actions and the rationale for the change.
Fostering Private and Financial Sector Development
Advancing privatization. Action 2.1: As part of its privatization program, the GOP has completed one SOE strategic sale and three capital market SOE equity transactions.
28. The FSIG series supports a revival of Pakistan’s privatization program, which had been stalled for over eight years (Annex 5). FSIG-I recognized the steps taken by the Privatization Commission to launch the Privatization Program by issuing Requests for Proposals (RFP) and calling for Expressions of Interest (EOIs) in connection with the hiring of Financial Advisors (FA) to advise on the first SOE strategic sales, and the offering of equity in at least three SOEs in domestic and international markets. FSIG-II supports the completion of this first phase of the program.
29. The robust resumption of the privatization process in Pakistan is expected to provide both fiscal benefits and to further boost private sector job-creation. The aims of the privatization program are to both improve performance of SOEs that provide critical services to support private sector activity and to crowd in further private sector investment. In addition, privatization should facilitate the process of fiscal consolidation and create fiscal space for critical expenditures by reducing fiscal losses as well as providing one-time benefits from privatization proceeds.
Financial inclusion. Action 2.2: The National Assembly has approved the Credit Bureau Act; and the GOP has joined the Better than Cash Alliance Initiative.
30. The limited access to finance that Small and Medium Enterprises (SMEs), women and vulnerable groups in Pakistan have is a major constraint to inclusive growth in Pakistan. Less than 14 percent of the population has access to any financial service,
12

microfinance reaches less than 3 percent of the population, and less than 7 percent of SMEs use formal finance for working capital or investments. Though financial products and services are gradually becoming more widely available, access to credit continues to be particularly limited. Overall credit growth has been declining and rising NPL ratios have reinforced banks’ risk-aversion towards private sector lending.
31. To enhance access to finance, a National Financial Inclusion Strategy (NFIS) has been formulated, two critical components of which are supported by FSIG-II: improving credit information and the digitalization of financial payments (Annex 9). Well-functioning credit bureaus are an essential part of an economy’s financial infrastructure, which, with the proper legal framework, can reduce information asymmetries and potentially facilitate universal access to formal finance, particularly for small firms and households, improve borrower discipline, and support bank supervision and credit risk monitoring, thereby lowering interest rates. Public and private credit bureaus in Pakistan currently provide credit information on only 7 percent and 2 percent, respectively, of the population. Borrowers and third parties do not have access to their own credit information, and credit histories do not include information from nonfinancial institutions.5 The Credit Bureau Act, which was passed by the National Assembly (as recognized by FSIG-II) and is expected to be enacted after its review by the Senate by end-2015 will improve the regulatory framework (and cover private credit rating agencies); preserve consumer protection norms, increase the information available to consumers and SMEs, and expand the coverage and quality of credit information. In parallel, by joining the global Better than Cash Alliance Initiative (BTCA), GOP has signaled its commitment to the digitization of payment processes. Through membership in BTCA, GOP will become eligible for technical assistance support and access to toolkits and guidance on the best ways to digitize payments.
Improving trade competitiveness. Action 2.3: The Parliament has approved a budget law 2014/15 providing for the application of 6 statutory tariff slabs; and the MoF has approved a Plan to achieve 4 slabs in 3-years, within a range of 1 to 25 percent for all tariff lines, allowing very few exceptions and tariff peaks to address sensitive goods or special sectors only.
32. Pakistan’s trade competitiveness has been hurt by the increasing complexity of the tariff regime, further weakening an already poor investment climate. A decade ago Pakistan was among the most open economies worldwide, with four statutory tariff rates between 5 and 25 percent, and few exceptions. However, the number of standard statutory rates has doubled from only four (5, 10, 15, and 25 percent) in 2002/03 to eight (0, 5, 10, 15, 20, 25, 30 and 35 percent) in 2012/13 and the tariff regime has been further complicated with the introduction of new statutory duty rates, and the use of statutory regulatory orders (SROs) and additional duties. The increasing complexity of the tariff regime has made it more difficult for firms, including exporters, to import needed capital and intermediate goods, and that has contributed to the deterioration of Pakistan’s export growth performance since 2004. Tariff simplification and a reduction in the average duty rate, applied with priority to capital and intermediate goods, by reducing the administrative, menu and information costs associated with the current complex tariff structure should stimulate growth by boosting exports and increasing Pakistan’s ability to compete globally, while at the same time increasing consumer welfare.
5The State Bank of Pakistan has an electronic-Credit Information Bureau (e-CIB) system with mandatory membership for all banks and financial institutions but access to information from this database is restricted to members.
13

33. The actions under FSIG-II simplify the tariff regime and take the initial steps towards the reduction of average (and weighted) tariff rates and dispersion. Under the tariff-related provisions of the Finance Bill FY14/15, which were supported by FSIG-II, four main measures were adopted: (i) a reduction in the number of standard statutory (MFN) tariff slabs to 6 through the elimination of the 35 percent and 30 percent tariff slabs and the reduction in the customs duty for 341 tariff lines from 30 percent to 25 percent custom duty6; (ii) the interim designation, prior to a redesign of GOP policy towards the auto sector, of only the automobile sector as “special” with a 35 percent tariff slab for 267 tariff lines and a 30 percent tariff slab for 27 tariff lines; (iii) an increase, for fiscal reasons, in the “floor” customs paid for 440 products from zero to one percent, while about 70 “socially sensitive” items were left to be imported duty free as part of a newly created 5th Schedule of the Customs Tariff Act (see Annex 6); (iv) the elimination of the first set of SROs, which modified some Customs tariffs, under a 3-year phase out plan. These measures have initiated the simplification of the tariff regime but given the increase in the floor tariff rate have resulted in this initial round in only a slight reduction of the average tariff. The provisions of the Tariff Rationalization plan prepared and approved by Ministry of Finance (MoF) under FSIG-II are expected to be included in the next Finance Bills FY15/16 and FY16/17 and further reduce the simple average statutory tariff rate from its average of 14.4 percent in June 2013 to below 12 percent by June 2016. Enhancing the investment climate. Action 2.4: SECP, FBR and EOBI have established a virtual One-Stop-Shop (OSS) for business registration, and a physical OSS in Lahore.
34. The business environment in Pakistan is exceptionally weak, and that has dampened economic growth and hindered private-sector led creation of better jobs. Pakistan is ranked 128 out of 189 economies on the overall ease of doing business rankings for the year 2015, having slipped in the rankings in the last five years across all Doing Business indicators. Supported by the World Bank’s Indicator-based Reform Advisory team, the Board of Investment (BOI), in October 2014, finalized a plan for improvement of the business environment, covering five federal indicators and one provincial including: paying taxes, registering property, enforcing contracts, business registration, trading across borders, and getting credit.
35. The FSIG series supports a critical component of GOP’s plan for improving the business environment—streamlining business registration. The process of registering a business in Pakistan is, as in many countries, cumbersome and opaque, involving many different public agencies and a range of different often unclear reporting obligations. That has deterred both starting a business and registering businesses, resulting in a large informal sector, with negative consequences for business activity and tax collection. In November 2014, the Federal Board of Revenue (FBR), Employees Old Age Benefits Institute (EOBI) and Securities and Exchange Commission of Pakistan (SECP) finalized a Memorandum of Understanding establishing a virtual OSS for limited liability companies (LLCs).
36. The expected result of these actions is to simplify business procedures and improve the investment climate in Pakistan. The opening of the OSSs should reduce the number of steps and days to register a business from 10 and 21 to at least 8 and 18 respectively.
6 We consider a standard tariff slab a tariff that applies to more than 30 tariff lines (products).
14
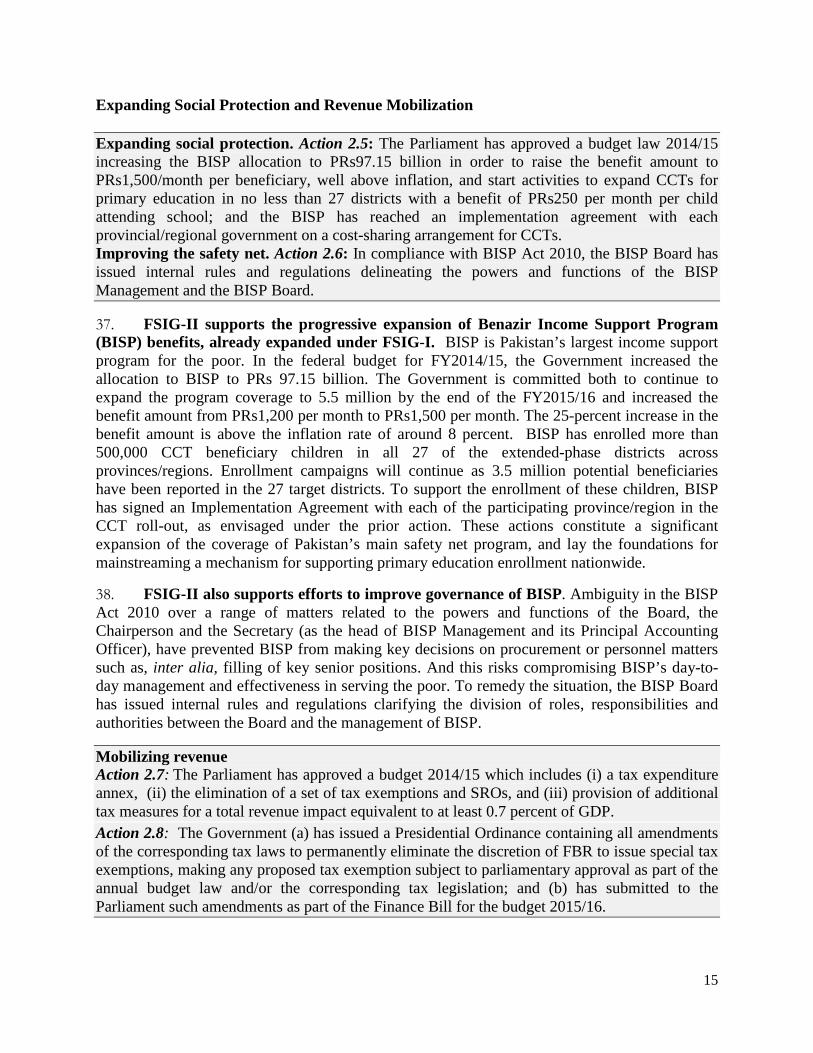
Expanding Social Protection and Revenue Mobilization Expanding social protection. Action 2.5: The Parliament has approved a budget law 2014/15 increasing the BISP allocation to PRs97.15 billion in order to raise the benefit amount to PRs1,500/month per beneficiary, well above inflation, and start activities to expand CCTs for primary education in no less than 27 districts with a benefit of PRs250 per month per child attending school; and the BISP has reached an implementation agreement with each provincial/regional government on a cost-sharing arrangement for CCTs. Improving the safety net. Action 2.6: In compliance with BISP Act 2010, the BISP Board has issued internal rules and regulations delineating the powers and functions of the BISP Management and the BISP Board.
37. FSIG-II supports the progressive expansion of Benazir Income Support Program (BISP) benefits, already expanded under FSIG-I. BISP is Pakistan’s largest income support program for the poor. In the federal budget for FY2014/15, the Government increased the allocation to BISP to PRs 97.15 billion. The Government is committed both to continue to expand the program coverage to 5.5 million by the end of the FY2015/16 and increased the benefit amount from PRs1,200 per month to PRs1,500 per month. The 25-percent increase in the benefit amount is above the inflation rate of around 8 percent. BISP has enrolled more than 500,000 CCT beneficiary children in all 27 of the extended-phase districts across provinces/regions. Enrollment campaigns will continue as 3.5 million potential beneficiaries have been reported in the 27 target districts. To support the enrollment of these children, BISP has signed an Implementation Agreement with each of the participating province/region in the CCT roll-out, as envisaged under the prior action. These actions constitute a significant expansion of the coverage of Pakistan’s main safety net program, and lay the foundations for mainstreaming a mechanism for supporting primary education enrollment nationwide.
38. FSIG-II also supports efforts to improve governance of BISP. Ambiguity in the BISP Act 2010 over a range of matters related to the powers and functions of the Board, the Chairperson and the Secretary (as the head of BISP Management and its Principal Accounting Officer), have prevented BISP from making key decisions on procurement or personnel matters such as, inter alia, filling of key senior positions. And this risks compromising BISP’s day-to-day management and effectiveness in serving the poor. To remedy the situation, the BISP Board has issued internal rules and regulations clarifying the division of roles, responsibilities and authorities between the Board and the management of BISP.
Mobilizing revenue Action 2.7: The Parliament has approved a budget 2014/15 which includes (i) a tax expenditure annex, (ii) the elimination of a set of tax exemptions and SROs, and (iii) provision of additional tax measures for a total revenue impact equivalent to at least 0.7 percent of GDP. Action 2.8: The Government (a) has issued a Presidential Ordinance containing all amendments of the corresponding tax laws to permanently eliminate the discretion of FBR to issue special tax exemptions, making any proposed tax exemption subject to parliamentary approval as part of the annual budget law and/or the corresponding tax legislation; and (b) has submitted to the Parliament such amendments as part of the Finance Bill for the budget 2015/16.
15

Action 2.9: FBR has (a) issued 171,000 notices to identified potential tax evaders to register and file tax payment, and taken administrative and/or legal actions on at least 25 percent of the potential taxpayers who received notices by 31 December 2014, but failed to respond to them; and (b) selected at least 7.5 percent of non-salary-including large taxpayers (filed for tax year 2013) through ballot- or risk-based audits, and completed audits for at least 10 percent of those selected cases. Action 2.10: (a) Two provinces have expanded the scope of their GST on services to increase their revenue; and (b) the Provinces have increased their 2014/15 budget allocations to non-salary education and health spending by no less than 26 percent.
39. The revenue mobilization actions under the FSIG series address well-known structural weaknesses in Pakistan’s tax system, thereby creating fiscal space for priority social and development expenditures without raising tax rates, and for lower domestic borrowing needs by the GOP, which helps reduce crowding out of private sector credit, two important prerequisite for inclusive growth. Weaknesses of the system include an inefficient tax administration; a narrow tax base (of 39.4 million employed persons, of whom fewer than 10 percent are registered), a skewed tax structure (68 percent of tax revenue is from indirect taxes); a complex and nontransparent tax system that favors numerous and generous ad hoc exemptions and concessions and corruption, and tax evasion; and low provincial revenue collection efforts (Annex 11). In response, the FSIG series focuses on broadening the tax base and on strengthening registration, enforcement, transparency and compliance. FSIG-II builds on the tax reform strategy formulated under the FSIG-I7, through direct measures to increase revenues (including those of the first stage of the three year plan for the elimination of tax exemptions supported by SROs), make tax expenditure transparent, reintroduce the tax audit function and large-scale registration of potential tax evaders, and eliminate FBR’s legal powers to issue special tax exemptions and concessions through SROs. The latest reform contributes to a major improvement in the fiscal position through two mechanisms: First, it eliminates the fundamental source of discriminatory, inequitable and corrupt-prone tax leakages and, coupled with the gradual phasing out of existing SROs, it brings additional resources into the tax net for a projected total revenue increase of no less than one percent of GDP (Annex 10).
40. The overall net fiscal space created by both DPCs series during FY13/14 and FY14/15 is projected to be 2.4 percent of GDP (Table 4). The revenue measures announced by the government in the 2014/15 budget have the potential of increasing tax revenue by about 0.9 percent of GDP.8 Tax measures contained in the tax strategy for the first two years of Government will raise federal revenue by about 1.4 percent of GDP. This does not include an increase of 0.2 percent of GDP from provinces essentially based in the expansion of the scope of GST taxed services and other tax adjustments. The startup of the tariff simplification process to six slabs inside 1-25 percent tariff bracket generated infra marginal losses due to the temporary compensatory regulatory duties adopted for fiscal reasons. There is also a modest gain projected from the tax administration measures adopted by FBR in Customs or in income or sales taxes, as
7Under FSIG-I, the government approved the medium-term reform strategy for FBR; estimated the fiscal cost of tax exemptions and concessions; issued over seventy thousand (70,000) notices to potential tax evaders to register and file tax payments; launched an information technology-based Taxpayers Audit Management System and selected five percent of total tax returns filed for tax year 2012 and enhanced the transparency of the tax system by publishing separate tax directories for the Parliamentarians and other taxpayers 8 These measures suffered legal challenges in approving a Gas cess and the fiscal effects of the drop in oil prices. To offset losses, the Government approved contingency tax measures for an equivalent gain of about 0.3 percent of GDP in February 2015.
16

tax administration reform outcomes materialize slowly. The power tariff reform (supported by a parallel DPC) has mainly contributed to create fiscal space--with lower budgeted Tariff Differential Subsidies (TDS) and savings-generation measures--by about 1 percent of GDP. The fiscal space freed up by these measures has been used to increase allocations to BISP individual beneficiaries (0.3 percent of GDP) and to increasing provincial non-salary education and health services expenditures by 27 percent (0.1 percent of GDP).
Table 4: Overall Fiscal Impact under FSIGs and Power DPCs-Actions in years FY13/14 & FY14/15 Estimate in % GDP I. POWER SUBSIDY REDUCTION 1.0 TDS savings from tariff adjustment and others (FY13/14) 0.3 TDS savings from tariff adjustment, surcharges and others (FY14/15 ) 0.7 II. TAX POLICY 1.6 Tax base broadening actions FY14/15 budget: removal of exemptions, SROs,
etc. 0.5
Other tax policy measures 0.3 Customs tariff simplification to 6 slabs 0.0 GST scope expansion by provinces 0.2 Others (FBR & IMF-supported tax policy measures in FY13/14) 0.6 III. TAX ADMINISTRATION 0.2 Customs administration 0.1 Expanding Income Tax base (150,000 notices to potential taxpayers’ Plan) 0.1 Expanding GST base (Businesses Retail registration to potential taxpayers’ Plan) 0.1 Ballot-based audit 0.0 Other (SEZ, One-time Investment Incentive Package) -0.1. IV. SOCIAL COMPENSATION MEASURES -0.4 Increase BISP allocation* -0.3 Increased non-wage education and health provincial budgets -0.1 ESTIMATED NET FISCAL SPACE FROM FISCAL REFORMS 2.4 Memo: Nominal GDP FY13/14 (Source: IMF, in bn.PKRs); Estimates: FBR, IMF,
WB. 25,402
Fiscal transparency. Action 2.11: (a) The MoF has issued a notification requiring each drawing and disbursing officer to provide commitments details to the Accountant General within 10 days of the month closure. The quarterly budget releases to all department and ministries will be contingent on full compliance with this provision; (b) the Recipient’s Controller General of Accounts has issued a notification to disclose on its website the annual audited financial statements for the last 5 years, and committing to disclose future financial statements within 15 days of the date they are laid before the Parliament; and (c) the MoF has issued a notification to disclose on its website monthly in-year revenue and expenditure reports of the federal government within 30 days after the month-end.
41. FSIG-II supports measures to promote greater fiscal transparency and improve financial planning. Greater fiscal transparency helps to ensure governments make informed economic decisions and allows legislatures and citizens to hold governments accountable for their use of public resources. Public disclosure and easy access to external audit reports and in-year budget execution report are a key element of fiscal transparency as per internationally recognized frameworks like the PEFA Performance Measurement Framework and the Open Budget Survey. The Federal Government provides easy access to comprehensive budget information to the general public by disclosing the budget documents on the MoF website. However, the GOP’s audited financial statements, audit reports and in-year budget execution
17

reports are not publicly disclosed online. In terms of financial planning, the current system of commitment accounting for Federal Government’s financial transactions suffers from the following drawbacks: (i) Commitment Recording is only formalized in Ministerial Department Agencies (MDAs) level and not on development project level; and (ii) Commitments are not recorded on timely basis. The actions under FSIG-II address these weaknesses and should result in improved PEFA ratings on these dimensions, as well as a higher rating on the Open Budget index, from “Moderate” to “Strong”.
42. The FSIG series rests on extensive analytical and advisory work undertaken by the Bank. Table 5 lists AAA activities and their link to the prior actions supported by FSIG-II.
4.3. Link to Country Assistance Strategy and Other Bank Operations
43. FSIG-II directly supports two pillars of the FY15-FY19 Country Partnership Strategy. The FY15-FY19 CPS (Report No.84645-PK) was presented to the Board on May 1st 2014. FSIG-II supports the CPS pillar of private sector development through its focus on enabling private-sector led growth through measures related to SOE privatization, improved business environment, access to finance and trade competitiveness, all well-identified constraints to Pakistan’s growth. In addition, through measures to create fiscal space and more accountable and competent tax administration; and enhanced transparency of tax exemptions, concessions, and SRO regimes, FSIG-II makes room for additional public investment; improved public sector efficiency as well as private sector activity. FSIG-II supports the inclusion pillar of the CPS through an expanded scope of the safety net through unconditional and conditional cash transfers, and increased social spending on education and health. 44. Other Bank operations complementing FSIG-II. Another budget support operation focusing on power and energy sector reforms has been prepared in parallel to this operation. Power shortages have been identified as another major constraint to growth, and there are several synergies between the two operations via common policy goals on the creation of fiscal space ensuing from the reduction of tariff subsidies, the restructuring or eventual privatization of power distribution companies and power generation companies, as well as via the use of fiscal space to strengthen the safety net so as to compensate the poorest against loss of purchasing power due to increased power tariffs. Similarly, the technical assistance provided under the Project Preparation Facility of the Revenue Mobilization Disbursement-Linked Indicators Project (P128182) deals with added efforts on tax policy and administration, and addresses the creation of fiscal space.
4.4. Consultations and Collaboration with Development Partners
45. Consultations with stakeholders have been extensive and taken place in stages. The first stage happened under FSIG-I preparation and was based on the dissemination of the Bank’s Policy Notes, the Country Economic Memorandum and the findings of a rich set of other analytical underpinnings. It was held in various parts of the country and allowed to identify the main areas of intervention (Annex 14). The second stage under FSIG-II included fora to discuss major government strategies (privatization, tax reform, NFIS, OSS, tariff rationalization plan, BISP-CCTs, Credit Bureau). The third stage was the quarterly review sessions dedicated to the program of structural reforms, held in Dubai or in Islamabad in parallel to the IMF-EFF reviews (see below). The fourth stage led by the Bank was the recently created panel of experts and officials whose work is directly or indirectly related to reforms supported on power, the business environment, taxation and the revenue mobilization under the DFID-TF (see below).
18

Table 5: FSIG-II Prior Actions and Analytical Underpinnings
Specific inputs provided to frame the prior actions Analytical underpinnings Pillar 1. Fostering private and financial sector development
Prior Action 2.1: As part of the implementation of its Privatization Program, the GOP has completed one SOE strategic sale and three capital market SOE equity transactions.
On the definition of the set of privatization of SOEs: GOP’s Strategy on Privatization; Time for Serious Corporate Governance—WB Policy Paper Series; Reforming SOEs—Pakistan Policy Notes.
Prior Action 2.2: The National Assembly has approved the Credit Bureau Act; and the GOP has joined the Better than Cash Alliance Initiative.
On the importance of access to credit for inclusion: GOP’s NFIS 2015; Doing Business 2014;Pakistan FSAP Update; SBP Microfinance Strategic Framework 2011–15; Finding the Path to Job Enhancing Growth—CEM Report
Prior Action 2.3: The Parliament has approved a budget law 2014/15 providing for the application of 6 statutory tariff slabs; and the MoF has approved a Plan to achieve 4 slabs in 3-years, within a range of 1 to 25% for all tariff lines, allowing very few exceptions and tariff peaks to address sensitive goods or special sectors only.
On the design of the trade simplification program: GOP’s Tariff Rationalization Plan 2015. Reinvigorating the Agenda for Open Trade—WB Pakistan Policy Notes; Finding the Path to Job Enhancing Growth—CEM Report;
Prior Action 2.4: As part of the implementation of its Plan for improving the business environment, SECP, FBR and EOBI have established a virtual One-Stop-Shop (OSS) for business registration, and a physical OSS in Lahore
On the design of the business environment strategy and OSS: GOP’s Plan for Improving Business Environment 2014; Enhancing the Business environment—Pakistan Policy Notes; A Blueprint for Business Registration: One-Stop Shop.
Pillar 2. Expanding social protection and mobilizing revenue Prior Action 2.5: The Parliament has approved a budget law 2014/15 increasing the BISP allocation to PKRs. 97.15 billion in order to raise the benefit amount to PKRs. 1,500/month per beneficiary, well above inflation, and start activities to expand CCTs for primary education in no less than 27 districts with a benefit of PKRs.250 per month per child attending school; and the MoF has reached an implementation agreement with each provincial/regional government on a cost-sharing arrangement for CCTs. Action 2.6: In compliance with BISP Act 2010, the BISP Board has issued internal rules and regulations delineating the powers and functions of the BISP Management and the BISP Board.
On the expansion of BISP—safety net and importance of CCTs: Consolidating Social Protection—Pakistan Policy Notes; BISP and World Bank reports on BISP loan; WB BISP Project Evaluation reports; Government’s program in letter of intention to the IMF. .
Prior Action 2.7: The Parliament has approved a budget 2014/15 which includes (i) a tax expenditure annex, (ii) the elimination of a set of tax exemptions and SROs, and (iii) provision of additional tax measures for a total revenue impact equivalent to at least 0.7 percent of GDP. Prior Action 2.8: The Government (a) has issued a Presidential Ordinance containing all amendments of the corresponding tax laws to permanently eliminate the discretion of FBR to issue special tax exemptions, making any proposed tax exemption subject to parliamentary approval as part of the annual budget law and/or the corresponding tax legislation; and (b) has submitted to the Parliament such amendments as part of the Finance Bill for the budget 2015/16.. Prior Action 2.9: FBR has (a) issued 171,000 notices to identified potential tax evaders to register and file tax payment, and taken administrative and/or legal actions on at least 25 percent of the potential taxpayers who received notices by 31 December 2014], but failed to respond to them; and (b) selected at least 7.5 percent of non-salary-including large taxpayers (filed for tax year 2013) through ballot- or risk-based audits, and completed audits for at least 10 percent of those selected cases. Prior Action 2.10: (a) Two provinces have expanded the scope of their GST on services to increase their revenue; and (b) the provinces have increased their 2014/15 budget allocations to non-salary education and health spending by no less than 26 percent. Prior Action 2.11: (a) The MoF has issued a notification requiring each drawing and disbursing officer to provide commitments details to the Accountant General within 10 days of the month closure. The quarterly budget releases to all department and ministries will be contingent on full compliance with this provision; (b) the Recipient’s Controller General of Accounts has issued a notification to disclose on its website the annual audited financial statements for the last 5 years, and committing to disclose future financial statements within 15 days of the date they are laid before the Parliament; and (c) the MoF has issued a notification to disclose on its website monthly in-year revenue and expenditure reports of the federal government within 30 days after the month-end.
On how to create fiscal space and the importance of investing in human capital: PML-N Manifesto; FBR Tax Reform Strategy 2014; Finding the Path to Job Enhancing Growth—CEM Report; Mobilizing Revenue—Pakistan Policy Notes; Promoting Efficient Service Delivery with Decentralization—Policy Note; Federal, Punjab and KPKs PERs; Federal and Provincial—Punjab, Sindh and KPKs PEFAs.
19

46. Coordination with the IMF. Bank and IMF staffs closely coordinate through joint review missions (Annex 3). The Bank’s DPCs bring depth and complementarity to the EFF structural agenda. Technical collaboration is ongoing on: (a) power sector reform through the Bank’s DPC on power; (b) the financial sector reform, including a joint a Financial Sector Assessment Program; (c) the debt management reform through joint preparation of annual debt sustainability analysis, a Medium-Term Debt Strategy, and the ensuing restructuring of the Public Debt Management Office; and (d) tax and trade policy and administration reforms.
47. Coordination with other development partners. The Department for International Development (DFID) is financing technical assistance (TA) through a Trust Fund especially designed to support “Accelerating Growth and Reforms. “ The TA supports the implementation of reforms in the following areas: i) power sector; ii) privatization and investment climate; iii) tax and trade; and iv) debt management. In addition, DFID supports the implementation of the FSIG-II supported reforms through another Trust Fund to IFC focusing on business registration, access to financial services and provincial taxation reform. ADB and the U.S. Agency for International Development also provide lending and technical assistance to the SOE reform and debt management. Finally, the Bank works closely with GTZ on the tax reform, and with ADB and JICA on the power sector reform, both complementing this FSIG series.
5. OTHER DESIGN AND APPRAISAL ISSUES
5.1. Poverty and Social Impact
48. The FSIG series supports sustained poverty reduction and shared prosperity. The proposed measures will contribute to a sustained medium-term recovery, which will help further reduce poverty and promote welfare gains for the bottom forty percent. Mobilizing revenue will create the fiscal space necessary to finance public expenditure to achieve this growth. The FSIG series will also support reforms that can be expected to enhance Pakistan’s investment climate, competitiveness and, through SOE reform, service delivery. This would in turn increase growth and facilitate education, quality employment creation, access to credit, as well as improved living standards, especially for women (see Box 2). Finally, given the combined impact of short-lasting rapid growth episodes with the increased volatility in GDP per capita, the FSIG series will strengthen policies that help households—many of them headed by a woman--cope with risk due not only to shocks and natural disasters, but to illness, poor crop yields and job losses, such as the cash transfer from BISP and micro insurance.
49. The poverty and social impacts (PSIAs) of policy measures supported by the FSIG series are expected to be mainly positive or, at worst, mildly negative. Most policy measures will either directly improve the standards of living directly by creating productive employment and enhancing consumption, or indirectly, through improved price stability and sustainability of public finances. However, tax increases may temporarily increase prices, and thus reduce income and consumption of the poor in real terms. In addition to facilitate access to credit to the Pakistani population, especially among women and SMEs (Annex 9), there are three other main areas where prior actions of FSIG-II would have a significant impact on poverty and social conditions: taxation, BISP, and customs tariff rationalization.
20

Box 2. The Impact of BISP Cash Transfers on Women’s Accountability and Education
:
• Taxation. As the tax reform is concentrated on broadening the tax base or at phasing out tax exemptions that benefit non-taxpayers in the mid-to-upper quintiles, the overall tax system progressivity should increase with FSIG supported actions. Taxes account for 6–7 percent of total expenditures. The four main sources of tax revenue are General Sales Tax (GST), the individual and corporate income taxes, and excise taxes, which combined account for nearly 80 percent of total federal tax receipts. Simulations suggest that the regressive poverty effect of raising taxes would be mild. A simulated one point increase in General sales tax raises revenues by 0.6 percent of GDP but leads only to a 0.2 percentage point increase in poverty. A simulated ten percent increase in the income tax rate, on the other hand, raises about the same amount of revenue in GDP terms but leads to a slightly larger 0.6 percentage point increase in poverty. This is in part because the corporate tax increase raises tax evasion, which diminishes its expected progressivity, and in part because higher corporate taxes may eventually affect employment by firms which effectively pay taxes. The poverty effects of a tariff increase lie somewhere in between. The distributional effects of custom tariffs and sales taxes become blurred, however, when considering tax exemptions enacted by laws or SROs. A long and extensive list of basic food and medicines exemptions makes the sales tax progressive because poor people spend a larger share of their budget on these items. However, many sales tax and customs tariff exemptions fall on goods mostly consumed by wealthier households, such as education and luxury expenditures. FSIG-II intends to register new (and wealthy) taxpayers and remove tax exemptions on selected food and nonfood items that are disproportionately consumed by wealthier households or used as inputs by large firms. Finally, a comparative study of eight countries assessed the unequal effects of taxation on women in 2010. The study found that taxation is often not neutral between genders, and gender considerations should be taken into
BISP cash transfers contribute to Pakistani women’s human capital development. A significant share of BISP cash transfers is given to women who are heads of households. Data from the Pakistan Social and Living Standards Measurement survey and recent evaluations and beneficiary assessments of BISP program confirm multiple channels through which this happens.
• Households headed by Pakistani women receiving transfers spend significantly more on human capital development-related outlays than those households headed by men. Their outlays preferred include nutrition (78 percent of total recipient households), reproductive health services (15 percent of total recipient households), and child education (particularly for girls).
• As BISP cash transfers require a Computerized National Identity (CNI) card, registration in the program gives women the right of a citizen (voting, opening a bank account and the like). From 2009 to 2012, more than 15 million female citizens obtained a CNI card, largely due to registration with BISP.
• BISP payments raise their role in the family and empowerment. About 58 percent of women BISP cash-recipients reported spending money as they wanted; 75 percent felt their importance in the family had increased; 62 percent took more decisions than before receiving the transfer; and 72 percent reported increasing their level of confidence.
• About 64 percent of female beneficiaries did retain control over the cash transfer. • Transfers appear producing a shift in community perceptions about women, with communities
now accepting that women can travel to collect the transfer themselves. • Transfers are also associated with higher women’s participation in civil life. BISP women’s
beneficiaries report being more likely to vote than those non-beneficiaries.
21

consideration while designing tax regimes and enforcement mechanisms. The effects can vary by urban and rural settings, or by sector – affecting women more than men in sectors dominated by women producers and traders. Given the importance of gender issues in Pakistan, government counterparts will be encouraged to explicitly consider the gender-varied effects of taxation changes as they introduce new tax mechanisms. Overall, FSIG-II actions should improve the progressivity of taxation.
• BISP is an efficient way to reach the poor and its National Socio-Economic Registry is helping improve the targeting performance of other programs. To provide income support to the poorest and vulnerable and compensate them against the electricity subsidy reforms (and GST tax rate hikes) under the IMF program, BISP has expanded its safety net cash transfers to the poor households, objectively identified by using a proxy means test with enhanced benefit amount of Rs.1500 per month per family, effective FY 14/15. About 40 percent of the transfers are received by the bottom quintile of households, and 64 percent by the bottom 40 percent. Supported by the actions of FSIG-I, the predictability of cash transfers to the poorest through timely release of funds by the Ministry of Finance has been ensured. Furthermore, under FSIG-II, BISP increased budgetary allocation has considerably expanded the coverage of eligible households, further improving its targeting performance. BISP is actively pursuing enrolment of new beneficiaries to expand the coverage of cash transfers from current 4.7 million to about 5.3 million families by end of FY 2014/15. In addition, the introduction of CCTs as a top-up cash transfer program to eligible households in 27 districts, will assist the poor children to attend schools, thus raising enrollment rates among the poorest and girls. Overall, safety net reforms through BISP are expected to have a positive social and poverty impact through improved pro-poor targeting and added girls’ enrollment using technology based delivery systems.
• Customs tariff simplification and elimination of discriminatory SROs should markedly improve the progressivity of taxation and favor trade and growth. Customs tariffs are, in statutory rates, progressive, and their proposed simplification will facilitate reduction in overall trade protection. But when adjusted by SROs, high and escalating tariffs—particularly in agriculture—harm the poor by affecting its productivity and creating an anti-export bias. High tariffs also reduce demand for imports, which distorts production decisions, and favor vested local industries. SROs are mainly targeted at specific firms rather than applied uniformly, and primarily at inputs exclusively for certain firms. Measures proposed by the DPC series should eliminate such perverse firm privileges, improve competitiveness and increase consumer welfare. Overall, customs tariff reforms are expected to have a positive impact on consumption and reduce poverty.
5.2. Environmental Aspects
50. Pakistan has adequate legislative cover, policy guidelines, and institutional mechanisms in place for managing the environment. The Pakistan Environmental Protection Council, headed by the prime minister, is responsible for overall guidance on national environmental programs and policies. After devolution in 2010, provinces have been empowered to legislate and formulate policies. At the federal level, the Climate Change Division of the Cabinet Secretariat is responsible for environmental protection. The institutional arrangements for environmental management are quite elaborate at the provincial level, though implementation remains the key challenge across most of the country. In any case, this operation is likely not to cause any significant effect on Pakistan’s environment, forests, and other natural resources, and
22

there are systems in place for reducing any eventual adverse effect as described in paragraph of OP 8.60.
51. The last Strategic Country Environmental Assessment was carried out in 2006. It estimated the cost of environmental degradation at 6 percent of GDP, with both indoor and outdoor air quality and lack of adequate water and sanitation facilities among the major contributors. Through another Bank work with the Ministry of Industries, an analytical underpinning for enhancing Pakistan’s industrial competitiveness is provided by taking into account the strong linkages among business competitiveness, harnessing the power of agglomerations and spatial transformation, environmental concerns, and the sustainable use of natural resources. The Bank and the counterpart unit for the DPC at the MoF, which has a co-opted a member that regularly interacts with the Climate Change Division that provides technical advice, reviewed the potentially negative environmental effects of the proposed reforms in this DPC; but found none of significance.
5.3. Public Financial Management, Disbursement and Auditing Aspects
52. Pakistan has a fairly well-developed infrastructure for public financial management (PFM). And according to the Pakistan Federal Government Public Expenditure and Financial Accountability (PEFA) Update (2012), the trajectory of change is positive with PEFA scores comparing favorably with other countries in the South Asia region. The overall fiduciary risk associated with the proposed operation is “substantial” (Annex 14). This assessment is made with due regard to the government’s commitment to overall PFM reform exemplified by actions already taken at the federal and provincial levels, as well as the weakness in the PFM cycle identified in PEFA and other analytical reports.
53. Borrower and credit agreement. The FSIG-II would be made to the Islamic Republic of Pakistan, represented by the Economic Affairs Division of the MoF. The Credit proceeds would be transferred to the government in accordance with the terms of the Financing Agreement.
54. Funds flow arrangement. The Government will identify a foreign exchange account with SBP, which forms part of the country’s official foreign exchange reserves, into which the proceeds of the Credit will be disbursed. The proceeds will be released in one tranche following approval and official communication by IDA of Credit effectiveness. The completion of the prior actions and the maintenance of a satisfactory macroeconomic framework are sufficient to release the funds. The Pakistan Rupee equivalent of the funds in the account will, within two working days, be transferred into the consolidated fund of the government Account No. 1-Non-Food, held with SBP, which is used to finance budgetary expenditures.
55. Disbursements. Disbursements from the Consolidated Fund by the Government will not be linked to any specific purchases, and no special procurement requirement shall be needed. The proceeds of the Credit shall, however, not be applied to finance expenditures in the excluded expenditures as defined in the Financing Agreement. If any portion of the Credit is used to finance excluded expenditures as defined in the Financing Agreement, IDA will require the Government promptly upon notice from IDA, to refund the amount equal to the amount of the said payment to the IDA. Amount refunded to IDA upon such request will be cancelled from the Credit.
23

56. The financial statements of SBP for the financial year ended 30 June 2013 were audited. The auditors gave an unqualified opinion on the statements concluding that the statements gave a true fair view of the financial position, financial performance and cash flows. An IMF Safeguards Assessment of the SBP was issued on March 27, 2009 and an update report was also produced on March 3, 2010. A further update report was produced by the IMF on December 16, 2013. All three of these Safeguards Assessment reports have been reviewed by the World Bank.
57. Accounting and assurance requirement for the credit. SBP, on behalf of the Government, will continue to maintain an appropriate accounting system in accordance with generally accepted accounting principles. The IMF Safeguard Assessment in 2013 confirmed that the majority of actions previously agreed with the SBP have been implemented, with further improvements of internal controls and foreign exchange reserve management still in progress. Within 45 days of disbursement of the IDA Credit, the Finance Secretary of MoF, will provide a written confirmation to IDA certifying the receipt of Pakistan rupee equivalent of the Credit into the consolidated funds account of the Government, the date of receipt, and exchange rate to translate the credit currency into Pakistan Rupees.
5.4 Monitoring, Evaluation and Accountability
58. The MoF is responsible for overall oversight and implementation of the FSIG series. A team designated at FBR/MoF has been the main technical counterparts. Both MoF and FBR, as the lead implementing agencies, have extensive experience and are fully versant with World Bank policies and procedures through investment-lending and policy operations.
59. A results framework has been developed for the operation (see Annex 1). This operation has benefitted from the Government’s own monitoring and evaluation mechanisms. Timely achievement of targets have been assessed and documents made promptly available, drawing on the regular supervision function of national accounting, fiscal, and household survey data and, if required, specialized surveys on access to finance.
60. The World Bank has played a supporting and monitoring role, reviewing progress and making needed adjustments. Reviews have been based largely on the monitoring indicators and goals of the program. At the same time, the overall status of the national government program of reforms will be monitored to determine whether country conditions and the expected outcomes have been met.
61. Grievance Redress. Communities and individuals who believe that they are adversely affected by specific country policies supported as prior actions or tranche release conditions under a World Bank Development Policy Operation may submit complaints to the responsible country authorities, appropriate local/national grievance redress mechanisms, or the WB’s Grievance Redress Service (GRS). The GRS ensures that complaints received are promptly reviewed in order to address pertinent concerns. Affected communities and individuals may submit their complaint to the WB’s independent Inspection Panel which determines whether harm occurred, or could occur, as a result of WB non-compliance with its policies and procedures. Complaints may be submitted at any time after concerns have been brought directly to the World Bank's attention, and Bank Management has been given an opportunity to respond. For information on how to submit complaints to the World Bank’s corporate Grievance Redress
24

Service (GRS), please visit http://www.worldbank.org/GRS. For information on how to submit complaints to the World Bank Inspection Panel, please visit www.inspectionpanel.org.
6. SUMMARY OF RISKS
62. The overall risk rating level of FSIG-II series is high (see Table 6 below). 63. Political risks to the operation are high, stemming from both the broader political and security situation in Pakistan which may distract policy makers, as well as from political resistance to the reform program itself. In principle, the government—with a majority in the lower house of Parliament, and more recently, a quasi-majority in the Senate—should have the support needed to implement legal, institutional, and regulatory reforms. However, in practice, political opposition could emerge again among those challenging the electoral process or from those who will be adversely affected by specific reforms, such as reductions in tax benefits or the phasing out of tax exemptions and SROs, or privatization. And that could undermine the political coalition in power, and slow or stall reforms. This risk is being mitigated through the development of consultative processes with different stakeholders on the design and implementation of reforms, often keeping in mind the identification of winners and losers up front. The reform process could also take longer than anticipated due to legal injunctions or civil objections, as decision makers enter the next political cycle, where the reforms themselves may become the target of the next political campaign. The FSIG-II mitigates this risk by supporting a minimum number of legislative actions and by setting the reform pace in line with perceived potential political-economy constraints. 64. Macroeconomic risks stem from the possibility of domestic and external shocks. Domestically, the country is exposed to frequent natural disasters. Slippages in the privatization program may lead FDI not to materialize as expected. Spillovers from the materialization of the unresolved circular debt arrears may affect fiscal consolidation. A persistent dollar appreciation with limited exchange rate flexibility may erode export competitiveness. Potential spillovers from three other risks (political, security and natural disasters) could result in major insolvencies of borrowers in a context of still large NPLs, thus causing macroeconomic instability. Delays in much-needed structural reforms may put the IMF program off-track, weaken growth prospects and discourage private investment. Externally, remittances might fall faster than expected if tougher migration policies in labor-recipient and oil-rich countries stop or reduce migration. Protracted global economic weakness could impair exports and also affect remittances. The end of quantitative easing in the United States may lead to rising foreign borrowing costs. Security risks related to the developments in Afghanistan may also disrupt economic activity, discourage investment and undermine fiscal consolidation. These risks will be mitigated if the Government maintains a solid macroeconomic record, a large reserve cushion, healthy fiscal accounts, a tight monetary policy and a strong safety net that protects the vulnerable from shocks. In addition, the Bank and the IMF will keep working in tandem and closely coordinating design and implementation of their respective operations to ensure the program is not derailed. 65. The catalytic role of the FSIG-series in a back-loaded reform process requires several mitigation measures in favor of sustainability of reforms to address high institutional capacity and social potential risks, and substantial fiduciary risks. Weak policy coordination, frequent staff turnover and counterpart capacity constraints may affect the
25

operation and its aftermath. Social discontent may also arise from fiscal measures adopted, given the sizable size of the overall fiscal adjustment projected well above 4 percent of GDP, or if actions related to privatization are not welcomed by unions in SOEs and the opposition, which generates legal challenges and/or delays in reforms. These risks are mitigated in three ways. First, potential coordination failures are prevented by using a permanent economic reform unit as the coordinating body at the MoF. Second, in parallel to the FSIG series preparation, the Bank and other development partners have continued to provide extensive and timely technical assistance (TA) required to advancing reforms. Every quarterly single review of the IMF-EFF will be followed by a meeting of the Government with development partners to identify new TA needs in each of six reform areas: energy, privatization, tax reform, debt management, investment climate, financial inclusion and BISP safety net. These reviews will be complemented by regular monitoring of the list of multiyear TA activities agreed with the official counterpart agencies in each area. All of these efforts should consolidate reforms beyond the conclusion of the IMF-EFF and the FSIG series. In addition, a potential follow-up DPC operation that would provide a further anchor to ongoing reforms is a possibility. Third, loss of social support to the reform agenda can be mitigated by the Government’s strong electoral mandate, ratified in recent March 2015 senate’s elections, its strong reform implementation record to date, more effective media dissemination of the reform benefits achieved so far and their trade-offs to the stakeholders and citizens, and extensive consultations.
66. There are no other significant risks to the operation. The sectoral, technical design and environmental risks are expected to be negligible.
Table 6: SORT: Risk Categories Rating
1. Political and governance: See para. 63. H 2. Macroeconomic: See para. 64. H 3. Sector strategies. Not significant as the Government has a clear vision and sectoral strategies approved and under implementation.
L
4. Technical design. Not significant as the Government has highly qualified policy makers and strong support from donors
L
5. Institutional capacity. The operation may face headwinds due to staff turnover, counterpart capacity constraints, and weak policy coordination, a set of frequent problems.
H
6. Fiduciary. There is good progress in most phases of budget management. Areas of concern refer to the internal control system, specifically the internal audit.
S
7. Environmental and Social. The operation is not expected to have negative environmental or climate change risks impacts would affect achievement of the PDO. The risk rating for this category is justified by the potential social impacts of the elimination of SROs and customs tariff exemptions where vested interests might prevail.
M
8. Stakeholders. The expansion of BISP benefits and CCTs that favors increased children’s school enrollment; financial and gender inclusion, and improvements to the business environments are expected to be received well. However, actions on privatization may not be welcome by unions in affected SOEs and the opposition. The FSIG-II mitigates this risk by sequencing the SOE sales, supporting PC doing consultations with affected parties and promoting media campaigns on the benefits of the process.
H
9. Other -- Overall H
26
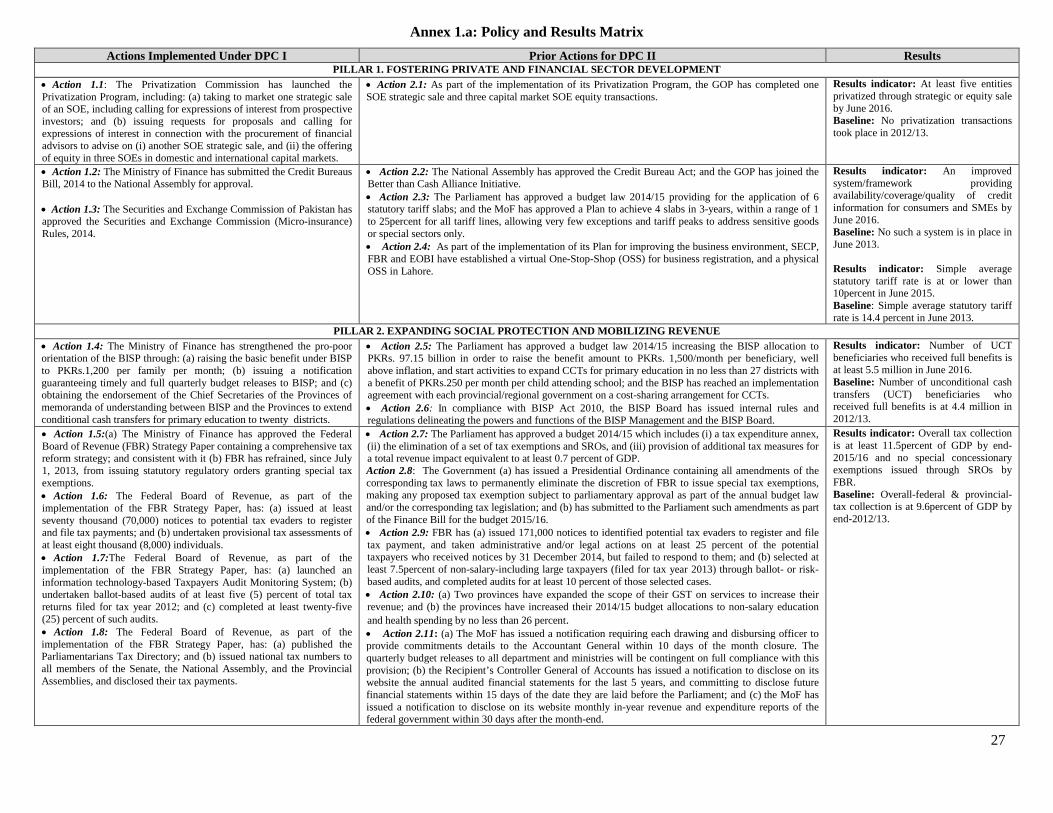
Annex 1.a: Policy and Results Matrix
Actions Implemented Under DPC I Prior Actions for DPC II Results PILLAR 1. FOSTERING PRIVATE AND FINANCIAL SECTOR DEVELOPMENT
• Action 1.1: The Privatization Commission has launched the Privatization Program, including: (a) taking to market one strategic sale of an SOE, including calling for expressions of interest from prospective investors; and (b) issuing requests for proposals and calling for expressions of interest in connection with the procurement of financial advisors to advise on (i) another SOE strategic sale, and (ii) the offering of equity in three SOEs in domestic and international capital markets.
• Action 2.1: As part of the implementation of its Privatization Program, the GOP has completed one SOE strategic sale and three capital market SOE equity transactions.
Results indicator: At least five entities privatized through strategic or equity sale by June 2016. Baseline: No privatization transactions took place in 2012/13.
• Action 1.2: The Ministry of Finance has submitted the Credit Bureaus Bill, 2014 to the National Assembly for approval. • Action 1.3: The Securities and Exchange Commission of Pakistan has approved the Securities and Exchange Commission (Micro-insurance) Rules, 2014.
• Action 2.2: The National Assembly has approved the Credit Bureau Act; and the GOP has joined the Better than Cash Alliance Initiative. • Action 2.3: The Parliament has approved a budget law 2014/15 providing for the application of 6 statutory tariff slabs; and the MoF has approved a Plan to achieve 4 slabs in 3-years, within a range of 1 to 25percent for all tariff lines, allowing very few exceptions and tariff peaks to address sensitive goods or special sectors only. • Action 2.4: As part of the implementation of its Plan for improving the business environment, SECP, FBR and EOBI have established a virtual One-Stop-Shop (OSS) for business registration, and a physical OSS in Lahore.
Results indicator: An improved system/framework providing availability/coverage/quality of credit information for consumers and SMEs by June 2016. Baseline: No such a system is in place in June 2013. Results indicator: Simple average statutory tariff rate is at or lower than 10percent in June 2015. Baseline: Simple average statutory tariff rate is 14.4 percent in June 2013.
PILLAR 2. EXPANDING SOCIAL PROTECTION AND MOBILIZING REVENUE
• Action 1.4: The Ministry of Finance has strengthened the pro-poor orientation of the BISP through: (a) raising the basic benefit under BISP to PKRs.1,200 per family per month; (b) issuing a notification guaranteeing timely and full quarterly budget releases to BISP; and (c) obtaining the endorsement of the Chief Secretaries of the Provinces of memoranda of understanding between BISP and the Provinces to extend conditional cash transfers for primary education to twenty districts.
• Action 2.5: The Parliament has approved a budget law 2014/15 increasing the BISP allocation to PKRs. 97.15 billion in order to raise the benefit amount to PKRs. 1,500/month per beneficiary, well above inflation, and start activities to expand CCTs for primary education in no less than 27 districts with a benefit of PKRs.250 per month per child attending school; and the BISP has reached an implementation agreement with each provincial/regional government on a cost-sharing arrangement for CCTs. • Action 2.6: In compliance with BISP Act 2010, the BISP Board has issued internal rules and regulations delineating the powers and functions of the BISP Management and the BISP Board.
Results indicator: Number of UCT beneficiaries who received full benefits is at least 5.5 million in June 2016. Baseline: Number of unconditional cash transfers (UCT) beneficiaries who received full benefits is at 4.4 million in 2012/13.
• Action 1.5:(a) The Ministry of Finance has approved the Federal Board of Revenue (FBR) Strategy Paper containing a comprehensive tax reform strategy; and consistent with it (b) FBR has refrained, since July 1, 2013, from issuing statutory regulatory orders granting special tax exemptions. • Action 1.6: The Federal Board of Revenue, as part of the implementation of the FBR Strategy Paper, has: (a) issued at least seventy thousand (70,000) notices to potential tax evaders to register and file tax payments; and (b) undertaken provisional tax assessments of at least eight thousand (8,000) individuals. • Action 1.7:The Federal Board of Revenue, as part of the implementation of the FBR Strategy Paper, has: (a) launched an information technology-based Taxpayers Audit Monitoring System; (b) undertaken ballot-based audits of at least five (5) percent of total tax returns filed for tax year 2012; and (c) completed at least twenty-five (25) percent of such audits. • Action 1.8: The Federal Board of Revenue, as part of the implementation of the FBR Strategy Paper, has: (a) published the Parliamentarians Tax Directory; and (b) issued national tax numbers to all members of the Senate, the National Assembly, and the Provincial Assemblies, and disclosed their tax payments.
• Action 2.7: The Parliament has approved a budget 2014/15 which includes (i) a tax expenditure annex, (ii) the elimination of a set of tax exemptions and SROs, and (iii) provision of additional tax measures for a total revenue impact equivalent to at least 0.7 percent of GDP. Action 2.8: The Government (a) has issued a Presidential Ordinance containing all amendments of the corresponding tax laws to permanently eliminate the discretion of FBR to issue special tax exemptions, making any proposed tax exemption subject to parliamentary approval as part of the annual budget law and/or the corresponding tax legislation; and (b) has submitted to the Parliament such amendments as part of the Finance Bill for the budget 2015/16. • Action 2.9: FBR has (a) issued 171,000 notices to identified potential tax evaders to register and file tax payment, and taken administrative and/or legal actions on at least 25 percent of the potential taxpayers who received notices by 31 December 2014, but failed to respond to them; and (b) selected at least 7.5percent of non-salary-including large taxpayers (filed for tax year 2013) through ballot- or risk-based audits, and completed audits for at least 10 percent of those selected cases. • Action 2.10: (a) Two provinces have expanded the scope of their GST on services to increase their revenue; and (b) the provinces have increased their 2014/15 budget allocations to non-salary education and health spending by no less than 26 percent. • Action 2.11: (a) The MoF has issued a notification requiring each drawing and disbursing officer to provide commitments details to the Accountant General within 10 days of the month closure. The quarterly budget releases to all department and ministries will be contingent on full compliance with this provision; (b) the Recipient’s Controller General of Accounts has issued a notification to disclose on its website the annual audited financial statements for the last 5 years, and committing to disclose future financial statements within 15 days of the date they are laid before the Parliament; and (c) the MoF has issued a notification to disclose on its website monthly in-year revenue and expenditure reports of the federal government within 30 days after the month-end.
Results indicator: Overall tax collection is at least 11.5percent of GDP by end-2015/16 and no special concessionary exemptions issued through SROs by FBR. Baseline: Overall-federal & provincial-tax collection is at 9.6percent of GDP by end-2012/13.
27

Annex 1.b: DPC-II Comparing Original Indicative Triggers and Prior Actions
Indicative Triggers (as stated in DPC I) Revised Prior Action in DPC II Change and Rationale Action 2.1: One SOE strategic sale and one capital market SOE privatization transaction have been completed.
Action 2.1: As part of the implementation of its Privatization Program, the GOP has completed one SOE strategic sale and three capital market SOE equity transactions.
A2.1 Reformulated. It includes one additional capital transaction.
Action 2.2: National Assembly has approved the Credit Bureau Act. Action 2.3. MoF has obtained approval by Parliament of a budget 2014/15 including the application of 6 statutory tariff slabs; and approved the Plan to achieve 4 slabs in 3-years, within a range of 0 to 25percent for all tariff lines, with very few exceptions and tariff peaks allowed just to address sensitive goods or special sectors has been finalized. Action 2.4: SECP, FBR and EOBI have established a virtual One-Stop-Shop (OSS) for business registration and a physical OSS in one province, and develop a plan for introduction of concept of limited liability partnerships (LLPs).
Action 2.2: The National Assembly has approved the Credit Bureau Act; and the GOP has joined the Better than Cash Alliance Initiative. Action 2.3. The Parliament has approved a budget law 2014/15 providing for the application of 6 statutory tariff slabs; and the MoF has approved a Plan to achieve 4 slabs in 3-years, within a range of 1 to 25percent for all tariff lines, allowing very few exceptions and tariff peaks to address sensitive goods or special sectors only. Action 2.4: As part of the implementation of its Plan for improving the business environment, SECP, FBR and EOBI have established a virtual One-Stop-Shop (OSS) for business registration, and a physical OSS in Lahore.
A2.2 Reformulated. It merges up another key action on financial inclusion. A2.3 Reformulated. It raises the floor tariff rate for revenue reasons. A2.4 Reformulated. It sets the action under a broader framework to improve business climate.
Action 2.5: MoF has obtained approval by Parliament of a budget 2014/15 increasing BISP allocation to at least PRs. 80 billion; increase the benefit amount in line with inflation; start activities to expand CCTs for primary education in no less than 25 districts with a benefit of Rs.250 per month per child attending school; and seek an agreement with provinces on a cost-sharing arrangement for CCTs included in budget 2014/15.
Action 2.5: The Parliament has approved a budget law 2014/15 increasing the BISP allocation to PKRs. 97.15 billion in order to raise the benefit amount to PKRs. 1,500/month per beneficiary, well above inflation, and start activities to expand CCTs for primary education in no less than 27 districts with a benefit of PKRs.250 per month per child attending school; and the BISP has reached an implementation agreement with each provincial/regional government on a cost-sharing arrangement for CCTs. Action 2.6: In compliance with BISP Act 2010, the BISP Board has issued internal rules and regulations delineating the powers and functions of the BISP Management and Board.
A2.5 No substantial change. Exceeded targeted results. A2.6 New. It prevents past governance problems at BISP.
Action 2.6: The MoF has obtained Parliamentary approval of (a) a budget 2014/15 including (i) a tax expenditure annex; (ii) a set of tax exemptions and SROs eliminated, and additional tax measures for a total revenue impact equivalent to at least 0.7percent of GDP; (ii) a policy statement prohibiting FBR from issuing any special exemptions, other than those approved by the Federal Government, and committing the Federal Government to place all its SROs issued or planned in any given financial year before the National Assembly for ratification or withdrawal; and of (b) amendments of the corresponding tax laws to permanently eliminate the discretion of the Federal Board of revenue to issue special tax exemptions, making any proposed tax exemption subject to overall parliamentary approval as part of the annual budget law or/and the corresponding tax legislation. Action 2.7: FBR has issued 120,000 notices to identified potential tax evaders to register and file tax payment, and takes administrative and/or legal actions on at least 25 percent of the potential taxpayers who received notices by 31 March 2014, but failed to respond to them. Action 2.8: FBR has selected at least 7.5 percent of large taxpayers (filed for tax year 2013) through ballot- or risk-based audits, and initiated [completed?] audits for at least one-quarter of those selected cases. Action 2.9:Federal Government will provide support to provinces’ initiative to increase revenue either by expanding the scope of services taxed by the General Sales Tax (GST) or modifying other provincial taxes so as to increase by at least 20percent the budget 2014/15 allocations to non-salary education and health spending.
Action 2.7: The Parliament has approved a budget 2014/15 which includes (i) a tax expenditure annex, (ii) the elimination of a set of tax exemptions and SROs, and (iii) provision of additional tax measures for a total revenue impact equivalent to at least 0.7 percent of GDP. Action 2.8: The Government (a) has issued a Presidential Ordinance containing all amendments of the corresponding tax laws to permanently eliminate the discretion of FBR to issue special tax exemptions, making any proposed tax exemption subject to parliamentary approval as part of the annual budget law and/or the corresponding tax legislation; and (b) has submitted to the Parliament such amendments as part of the Finance Bill for the budget 2015/16. Action 2.9: FBR has (a) issued 171,000 notices to identified potential tax evaders to register and file tax payment, and taken administrative and/or legal actions on at least 25 percent of the potential taxpayers who received notices by 31 December 2014, but failed to respond to them; and (b) selected at least 7.5 percent of non-salary-including large taxpayers (filed for tax year 2013) through ballot- or risk-based audits, and completed audits for at least 10percent of those selected cases. Action 2.10: (a) Two provinces have expanded the scope of their GST on services to increase their revenue; and (b) the provinces have increased their 2014/15 budget allocations to non-salary education and health spending by no less than 26 percent. Action 2.11: (a) The MoF has issued a notification requiring each drawing and disbursing officer to provide commitments details to the Accountant General within 10 days of the month closure. The quarterly budget releases to all department and ministries will be contingent on full compliance with this provision; (b) the Recipient’s Controller General of Accounts has issued a notification to disclose on its website the annual audited financial statements for the last 5 years, and committing to disclose future financial statements within 15 days of the date they are laid before the Parliament; and (c) the MoF has issued a notification to disclose on its website monthly in-year revenue and expenditure reports of the federal government within 30 days after the month-end.
A2.7 Split into two with A2.8. For clarity purposes, one action potentially confusing was deleted and remaining actions split into two. A2.8. Reformulated. Action modified to allow the Government pass the legal amendments as part of the Finance (budget) bill FY15/16. A2.9-2.10 Merged with no substantial change. Exceeded targeted results. A2.11 New. It strengthens budget accountability and transparency, two key governance dimensions.
28

Annex 2. Letter of Development Policy
29

30
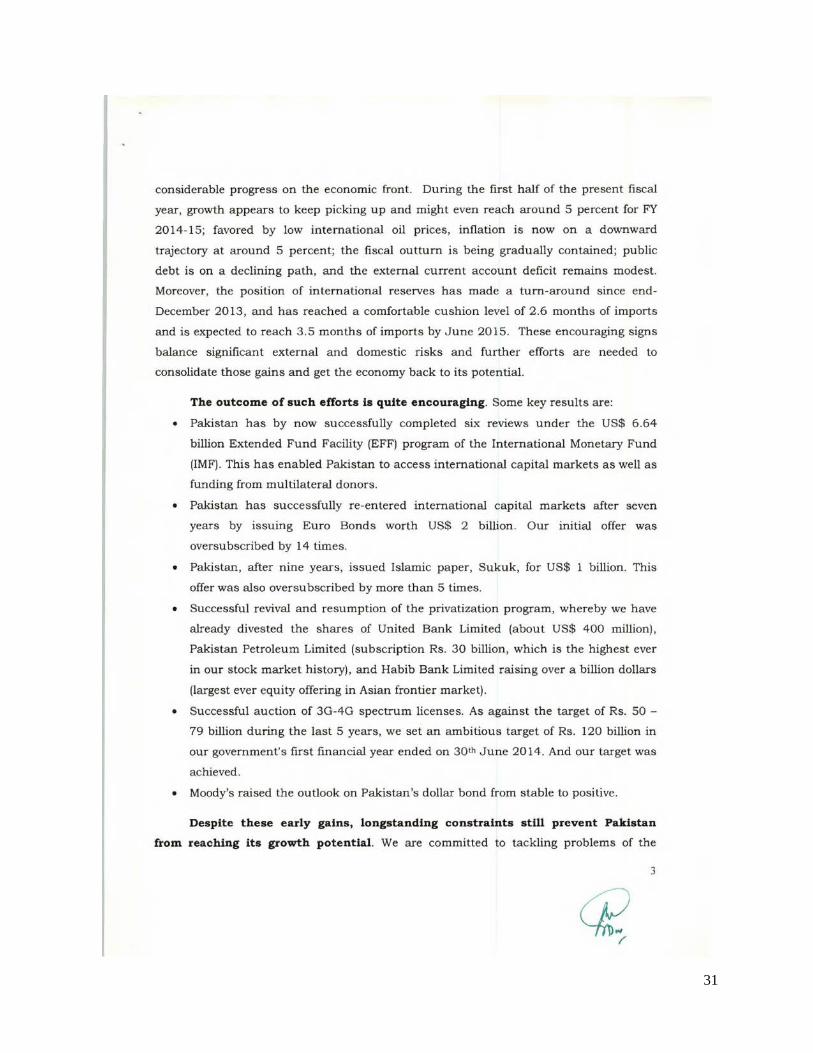
31

32

33

34

35

36

37

38

Annex 3. Fund Relations Annex
IMF Staff Concludes Seventh Review Mission under an EFF with Pakistan Press Release No. 15/206 May 11, 2015 An International Monetary Fund (IMF) staff mission, led by Harald Finger, visited Dubai and Islamabad from May 1-11, 2015 to conduct discussions on the seventh review under the SDR 4.393 billion (about US$6.6 billion) Extended Fund Facility (EFF) arrangement with Pakistan, approved by the IMF’s Executive Board on September 4, 2013 (see Press Release No. 13/322). The mission met with Finance Minister Ishaq Dar, State Bank of Pakistan (SBP) Governor Ashraf Wathra, and other senior officials. At the end of the mission, Mr. Finger issued the following statement: “The mission and the Pakistani authorities have reached staff-level agreement on a Memorandum of Economic and Financial Policies on the seventh review under the EFF arrangement, which, upon management approval, will be considered by the IMF Executive Board in June. After completion of this review, SDR 360 million (about US$506 million) will be made available to Pakistan. “Pakistan’s economy continues to gradually improve, helped by macroeconomic stability, lower oil prices, robust remittances, and higher supply of gas and electricity. Real GDP growth is expected to reach 4.1 percent this fiscal year and accelerate to 4.5 percent next year. Average headline inflation dropped to 2.1 percent in April, but is expected to increase in the coming months reflecting the stabilization in international petroleum prices following their recent decline. “Regarding the program, all end of March performance criteria have been met, including on the budget deficit and accumulation of net international reserves. The indicative target on social spending under the Benazir Income Support Program was also met. While the indicative target for federal tax revenue was missed by a small margin, due to legal challenges to some measures and the adverse impact of declining commodity prices, the authorities are taking measures to meet the end-June budget deficit target (4.9 percent of GDP). The mission welcomed the authorities’ plans to further reduce the fiscal deficit in 2015/16, while accommodating extraordinary expenditures related to flood rehabilitation, security enhancements to fight terrorism, and resettlement of internally displaced persons. “The authorities’ reform program has reached its mid-point, and already produced important economic achievements: near-term risks have receded, foreign exchange buffers have been rebuilt, and the budget deficit has narrowed substantially. To protect the most vulnerable, the authorities have significantly expanded the Benazir Income Support Program, enrolling over one million new recipients and increasing stipends by 50 percent. “In an environment of low international oil prices, these achievements present a unique opportunity to continue strengthening public finances and overcome obstacles for higher investment, jobs and growth. Key priorities for the second half of the program include improving the energy sector; widening the tax net to create space for infrastructure investment and social assistance; improving the business climate; and further strengthening external reserve buffers. Strong implementation of reforms in these areas, as envisaged in the program, will transform Pakistan into a dynamic emerging market economy. “The mission thanks the authorities and technical staff for their continued cooperation and reaffirms the IMF’s support to the government’s efforts to implement their economic reform program.”
39

Annex 4. Expanding the Scope of the Safety Net Is Important For the Poor
The government has maintained its commitment to minimize potential negative impact of fiscal adjustment on the poor and the vulnerable by continuing gradual expansion of the basic Cash Transfers (CT) administered by the Benazir Income Support Programme (BISP). Launched in 2008 with initial coverage of 1.76 million families, the BISP-CT expanded rapidly to reach 5.3 million beneficiary families enrolled and 4.4 million receiving benefits by June 2014. Correspondingly the budget allocated to the program nearly doubled from the initial PKR 34 billion in FY08-09 to the announced PKR 97.15 billion in FY14-15. Correspondingly, BISP has managed to increase its budget execution performance in recent years (Table A4.1).
Table A4.1: BISP Financial Execution Performance
Actual (2011-12) Actual (2012-13) Actual (2013-14) Actual (2014-15) Projected (2014-15)
Jul-Sep Oct-Dec
PKR
million percent
PKR million
percent PKR
million percent
PKR million
percent PKR
million percent
Core Program
UCT 39,364.23 79.5 41,651.34 83.1 66,342 96.4 21,393 98.1 22,357 98.1
CCT 0.0 0.0 12.73 0.0 93 0.1 - 0.0 21.6 0.1
Non-core Program
WH,WR,WS 4,279.81 8.6 3,167.79 6.3 433 0.6 - 0.0 0.0
Admin Costs 5,888.10 11.9 5,266.24 10.5 1,969 2.9 420 1.9 422 1.9
Total Expenditures
49,532.13 100.0 50,098.11 100.0 68,836.96 100.0 21,813 100.0 22,801 100.0
Source: BISP.
BISP targets the poor beneficiaries based on the proxy-means test method and as a result, around 75 percent of the cash benefits accrue to the bottom two quintiles. Leakage to the rich was reduced to a negligible level (Figure A4.1).
Figure A4. 1. Targeting Performance of Federal Social Programs in Pakistan (percent)
40

Establishment of predictability in budget release, as supported under DPC-I, has allowed BISP to make benefit payments on time and in full since the second quarter of FY13-14. The government has since continued this practice and dramatically improved BISP’s ability to expand its effective coverage (i.e., the number of beneficiary families that are not only enrolled but are actually paid). The predictability in budget release has been maintained up to the first quarter of FY14/15. The second quarter release is due by the middle of November, 2014.
Expanding BISP scope and the need to roll out the Conditional Cash Transfers (CCT). Although the basic Cash Transfer scheme has played an important role in alleviating effects of income poverty among the targeted poor, the Government is aware that it alone does not address structural causes of poverty or its inter-generational transmission. One such feature of poverty is the low level of schooling among the children of BISP beneficiaries. More than 70percent of the children of the targeted families are out of school (compared to the national average of about 34percent) and the Government wishes to play a stronger role in facilitating the poor’s exit from poverty by offering incentives for human capital accumulation through school attendance.
The strategy chosen to pursue this objective is a CCT scheme. A pilot CCT scheme by the Pakistan Bait-ul-Mal (PBM) – a federal welfare program established in 1992 to provide support to the destitute such as widows, orphans, the elderly and the disabled – demonstrated that despite imperfect design (e.g., weak targeting, very low benefit amount) and a number of implementation problems (e.g., limited coordination with education authorities, delays in payments) the pilot scheme produced significant impacts on improving school enrollments among the beneficiaries. Building on this positive experience under the PBM and following the international best practices, BISP in partnership with the provincial governments piloted a CCT program to encourage enrollment and attendance of primary school-aged children of existing beneficiaries of the base cash transfer program. The CCT program provides the family with a monthly top-up benefit of PRs. 200 per child to the three youngest children between the ages of 5-12. The children must maintain at least 70percent school attendance every quarter to qualify for the cash transfers.
After successful execution of this pilot in 5 districts in all provinces and regions during FY13-14, the BISP plans to extend the scheme’s coverage to at least 27 additional districts in FY14-15, as the CCT roll-out process accelerates. The evidence from other countries successfully implementing similar programs suggests that cooperation and effective partnership of the provincial governments is critical to achieve sustainability and outcomes of the CCT program. Active participation and commitment by the provincial governments is particularly critical in Pakistan where primary (and secondary) education has long been a devolved provincial responsibility. Most of the provinces have declared education emergency and signaled universal enrollment as an immediate priority. These declared policy objectives could benefit from the federal demand-side intervention targeted to the poor to achieve the education outcomes amongst the poorest. The provincial governments will play critical roles in timely completing and sharing information on verification of compliance (i.e., school attendance) by the beneficiaries; and increasing the supply of education services where these are lacking. All six provinces/regions have already signed a Memorandum of Understanding (MOU) with the federal government to collaborate in CCT implementation but their performance, especially in compliance verification, has left room for improvement. Therefore, renewing federal-provincial agreements and monitoring on their joint CCT implementation are high priority for the program’s success, especially given the planned expansion of its reach and coverage. Approval by BISP Board of the revised CCT Operational Manual is also a priority. With the expansion of a well-designed CCT scheme, BISP is expected to augment the provinces’ own efforts to increase schooling among the children of the poor and vulnerable. Progress has been slower than planned: Only 32,000 primary-age children have benefitted so far, against a planned target of 500,000 by end FY14/15. The ultimate target is to raise the enrollment rate from the current 30 percent among this segment of the population to at least 50 percent.
41

Annex 5. Privatization in Pakistan
“Denationalization” started in Pakistan during the 1980s. Legislative cover to the privatization program was provided through the Privatization Commission Ordinance promulgated in 2000. Around 167 transactions were completed until 2005. The proceeds from privatization totaled Rs. 476 bn. including Telecom privatization (Rs.187 bn.), capital market offerings (Rs.133 bn.), Energy privatizations (Rs.52 bn.), Banking privatizations (Rs.41 bn.) and Chemical/ Fertilizer privatization (Rs.42 bn.).
The Ordinance created a Privatization Commission (PC). It is a corporate body governed and administered currently by a Board with a professional from the private sector (with the status of Minister of State) as its Chairman. The Board is independent, autonomous and has majority of its members from the private sector as well. The privatization process varies depending on the nature of the asset being privatized such as the proportion of shares being offered for privatization or whether a transfer of management is involved. The Commission can carry out privatization, through a variety of modes including: (a) sale of assets and business; (b) sale of shares through public auction or tender; (c) public offering of shares through a stock exchange; (d) management or employee buyouts by management or employees of a state owned enterprise; (e) lease, management or concession contracts, etc. The privatization process had been dormant since 2006. This had been a result of a number of external constraints, including slower-than expected economic growth, the challenging security and law and order situation, as well as legal challenges to the privatization process. In response, the new Government as part of its policy for restructuring and reforming the economy committed to swiftly take action to restructure and reform fiscally burdensome SOEs9 . As part of the reform strategy, the Cabinet Committee on Privatization (CCOP) approved a priority list of 31 transactions on SOEs (out of the CCI approved list of 69 transactions on SOEs), to be taken up for processing10 on October 3, 2013. The list includes power generation companies, power distribution companies, energy (exploration and distribution) companies, banks etc. PC further shortlisted 8 SOEs as the first batch of transactions. Their Implementation Roadmap was approved by the Privatization Commission Board when it was reconstituted in December 2013. These projects will follow alternative modalities: 1. Strategic Partnership / Sale: Expected to be considered where it is vital to bring in an experienced and qualified private sector party to introduce good governance and use its expertise to introduce new and better technologies, and practices to make the firm more efficient, effective and competitive 2. Capital Market Offerings: Expected to be considered where the objective is to spread ownership, raise capital and/or develop/provide opportunities in capital markets. Private ownership and scrutiny usually leads to overall good governance. To be undertaken as: 1. Initial Public Offering (IPO), after converting to a public limited company, SOEs not being offered for strategic sale or that have never been offered in the capital markets before (with the help of underwriters/ book runners). 2. Secondary Offering for previously listed SOEs to private sector institutional investors and other subscribers – to be considered as quick and easy offerings to raise immediate Government revenues (their benchmark market prices are available and their financial information and records is available). A typical Privatization Transaction involves the following major steps: 1. Policy level approval of Council of Common Interest (CCI) for an entity/sector to be considered for
privatization- compulsory after the 18th Amendment. 2. Identification of an entity and approval of the PC Board and CCOP.
9 Accumulated loses of all SOEs average Rs. 500 Billion a year. 10 PC had a list of 30 SOEs among 65 earlier approved by CCI, but CCOP added Lakhra Power Plant later. Last month, Supreme Court of Pakistan nullified the Lakhra Power Plant's 20 year lease to Associated Group after finding faults in the lease agreement.
42

3. Hiring of a Financial Advisor (FA) or Valuator. 4. Due diligence by FA and Privatization Commission. 5. Finalization of transaction structure. 6. Restructuring and regulatory reforms, if needed. 7-9: Invitation of Expressions of Interest, submission of qualifications and prequalification of firms. 10-12: Due diligence by buyers, sharing of Documents w/pre-qualified bidders and Pre-bid conference. 13. Approval of valuation (reference price) by CCOP. 14–16: Bidding process (media invited to observe bidding), Approval of bidding results by PC Board and
CCOP, Issuance of Letter of Intent to successful bidder. 17-18: Finalization of sale agreement between PC and the Buyer, and Handing over of the entity. PC is confident that is on track to take at least five projects to market in FY15. Table A5.1 below summarize privatization efforts thus far. Prioritizing the sequencing has been based on: 1. Selecting the ‘low hanging fruits’ or SOEs that are most ‘ready’ SOEs for secondary public offering),
and most likely to be successful first, so as to rebuild market and stakeholder confidence. 2. Prioritizing SOEs for early privatization that can generate quick revenues needed to be ploughed back
into SOEs for some sort of restructuring with financial implications. 3. Prioritizing projects that if privatized would have the highest fiscal impact (reducing
subsidies/liabilities and potential at generating tax revenues) (e.g. utility or transport SOEs).
.
Table A5.1: Completed and Future Privatization Transactions--2015 Date Transaction (Type) Proceeds (US$M) Status
Completed Transactions in 2014
06/14 UBL – United Bank Limited (capital market) 388 Completed—first ever
to fetch a premium
06/14 PPL – Pakistan Petroleum Limited (capital market) 155 Completed
12/14 ABL – Allied Bank Limited (capital market) 144 Completed
Transactions 2015 (with Financial Advisors Appointed)
04/15 HEC – Heavy Electrical Complex (strategic sale) 10 Completed—first sale in
over 8 years
05/15 OGDC – Oil and Gas Development Corporation (capital market) 730 Second attempt may
happen before end-2015
06/15 NPCC - National Power Construction Corporation (strategic sale) 20 Planned
04/15 HBL - Habib Bank Limited (capital market) 1,005 Completed—largest
ever equity offering
TBD FESCO (Faisalabad Electric Supply Co.), IESCO (Islamabad Electric Supply Co,), LESCO (Lahore Electric Supply Co.),
NPGCL (Northern Power Generation Company Limited)
TBD Planned between end-2015 and June 2016
43

Annex 6. Tariff Simplification and SROs Trade Distortions
Pakistan was a global benchmark country in FY2002/03, and some improvements compared to that tariff structure have been achieved in the last decade. There has been an overall push to lower tariffs by moving some tariff lines to lower slabs and by the introduction of a zero tariff rate in FY 2007/08. As a result, the un-weighted average statutory tariff rate was reduced from 17.4percent to 14.4percent between FY 2002/03 and FY 2012/13 (Table A6.3). Additionally, in FY 2012/13, 40.2percent of tariff lines (2,799 products) paid 5percent duty rate or lower compared with only 16.3percent of tariff lines (977 products) in 2002/03.11
Nevertheless, the overall tariff structure of Pakistan’s imports became extremely complex after 2004, with the creation of new statutory duty rates, the use of additional regulatory duties, and the multiplication of statutory regulatory orders (SROs). Table A6.1 shows the number of tariff lines applying to a specific statutory duty rate in 2012/13 (baseline year). The number of standard statutory rates (so called Most Favored Nation-MFN) doubled from only 4 slabs (5percent, 10percent, 15percent and 25percent) in FY 2002/03 to 8 slabs (0, 5percent, 10percent, 15percent, 20percent, 25percent, 30percent and 35percent) in FY 2012/13 (Tables A6.2 and A6.4).12 The increasing complexity of the tariff structure can also be measured through a coefficient of variation, another measure of tariff dispersion: it increased from 67percent to 81percent over the last decade.
Set for fiscal reasons, additional regulatory duties are temporary, but reduce the transparency of the tariff schedule. Regulatory duties, levied in excess of the statutory duty and ranging from 5 to 50 percent, were initially set by two SROs: SRO 482(I)/2009 which covers 64 tariff lines in several sectors (including agricultural products, ceramic/tile products, autos, guns, among others); and SRO 693(I)/2006 which affects 140 tariff lines that are basically components and sub-components for auto makers/assemblers. Applied on top of the statutory duty, they temporarily increase the effectively paid customs duty for some products by non-negligible amounts in many cases: e.g. 45percent for most products under SRO 482(I)/2009, and 50percent and 60percent for most products under SRO 693(I)/2006. And as they are not part of the MFN tariff schedule, they make the system less transparent.
Three sets of actions are being applied in parallel to improve the competitiveness of Pakistan’s producers. First, a 3-year tariff simplification plan will reduce the number of tariff slabs, with priority given to reducing tariffs on capital and intermediate goods, needed as input for Pakistan’s productive sector. Second, an also 3-year phasing out of seven major customs related SROs which discriminate across importers and suffocate firm dynamism, in particular of small and medium business. And third, the elimination of temporary regulatory duties, which increase the duty levied on imports well above the MFN rate, constitute an element of opacity in the system and partly offset the competitive gains from a simplified MFN tariff structure. Hence, complementary reform direction scenarios are carried on.
a) Tariff simplification reform aims at lowering the number of standard duty slabs to four, thus reducing the level of protection and tariff dispersion. The ultimate goal is to reduce the simple average statutory duty rate from 14.4 percent in FY 2012/13 to at least 12 percent by FY 2016/17. In general, the simplification of the tariff regime to fewer and lower slabs enhances transparency and cuts the administrative and information costs associated with a complex tariff structure. More in particular, the reduction in the average duty rate will result in cheaper access to imported inputs and machinery. These may be unavailable in Pakistan. Or alternatively, when available they may either not have the quality and sophistication sufficient to allow downstream Pakistani products to have the world-class standards required to export on the global markets; or due to lack of domestic competition, they may be expensively
11 In the same vein, the statutory duty was zero for 6.3% of the tariff lines (440 products) in FY 2012/13. 12 Standard tariff slabs apply to 20 or more tariff lines; and tariff peaks to those tariff rates that apply to less than 20 tariff lines. Tariff lines are classified according to the Harmonized System (HS) 8 digit product code. No SRO rates are included.
44

produced in Pakistan. In all three cases, cheaper access to imported inputs and capital goods would likely contribute to enhance the competitiveness of domestic producers of manufactured goods. Thus, for enhancing the beneficial effect of reform on Pakistani producers, early attention should be placed on reducing the average tariff rate on capital and intermediate goods. Finally, tariff simplification is the initial move towards the desirable ultimate policy target of establishing low levels of tariff protection with low, few and uniform tariff rates.
The 3-year Tariff Simplification reform has started with the approval of the FY 2014/15 budget, which has brought the number of standard tariff slabs to 6, excluding special sectors. Three main measures were adopted. First, the GOP kept the automobile sector as a special sector with a 35 percent tariff slab, except for a small subset of 27 tariff lines also related to it with a 30 percent tariff unaffected. Such decision is part of the ongoing redesign of GOP’s policy toward the auto sector. Second, the customs duty for 341 tariff lines was reduced from a 30 percent to a 25 percent custom duty. Third, the “floor” customs paid for 440 products that were imported duty free in FY 2013/14 was set to one percent in FY 2014/15; which in practice meant that the zero tariff slab was replaced by a one percent tariff slab for fiscal reasons (see table A6.1 for details), except for about 70 socially sensitive items were left to be imported duty free as part of a newly created 5th Schedule of the Customs Tariff Act. Not surprisingly, the first step of the reform only resulted in a small reduction of the average tariff and its dispersion (measured by the standard deviation and coefficient of variation). The simple average tariff went down from 14.4 percent in FY 2013/14 to 14.3 percent in FY 2014/15; the standard deviation dropped from 11.7 percent to 11.6 percent in the same period, and the coefficient of variation from 82 percent to 81 percent. Thus, the elimination of the 30 percent tariff slab and the raise in the floor slab from zero to 1 percent had offsetting effects as the latter effectively raised the customs duty paid for a much larger number of products and imports than those of the former. Last but not least, the dominance of revenue concerns in GOP’s authorities was also reflected by the fact that the GOP introduced a temporary regulatory duty (RD) of 5 percent for 282 of those 341 products whose tariff was reduced to 25 percent. As in practice these 282 products will effectively pay a tariff of 30 percent, these RDs temporarily undermine the main goals of the reform and Authorities are planning for their prompt elimination.
b) A 3-year complementary phasing out of SROs should remove distortions and anti-competitive practices. SROs started to proliferate in 2006 when local content requirements had to be removed to align Pakistan’s trade policy with WTO commitments, and evolved into a scheme discriminating across importers. At such time, SROs aimed at maintaining a certain degree of temporal protection of the domestic market. Instead, SROs favored firms with higher lobbying power and discriminated across importers. As the grouping of a myriad of protected sectors made SROs more complex, gathering information on the exact incidence and pervasiveness of SROs became particularly challenging. Although published by notification in the official Gazette, they were not included in the tariff schedule and represented a major element of opacity in the trade regime. Most SROs reduce or exempt import duties on inputs, raw materials, components, and machinery to be used by firms as part of a manufacturing process. Duty exemptions cover a wide range of imported products, including industrial components, chemical and pharmaceutical products, auto parts and some agricultural commodities. These exemptions were only granted to selected industries or firms that fulfilled certain requirements, which resulted in anti-competitive effects for businesses in Pakistan and a highly discriminatory business environment. The seven major customs-related SROs were: SROs 565(I)2006, 567(I)2006, 678(I)2004, 575(I)2006, 655(I)2006, 656(I)2006, 450(I)2001, and 809(I)2009. They affected 25percent of imports and generated revenue losses of about Rs. 100 billion (42percent of collected customs duties) in FY 2012-13 (Table A6.2). Overall, almost 80percent of all Customs duty exemptions in Pakistan, i.e. the difference between the potential duty revenue based on statutory rates and actually collected revenue, is due to these seven SROs; the rest accounts for Preferential Trade Agreements (PTAs).
45
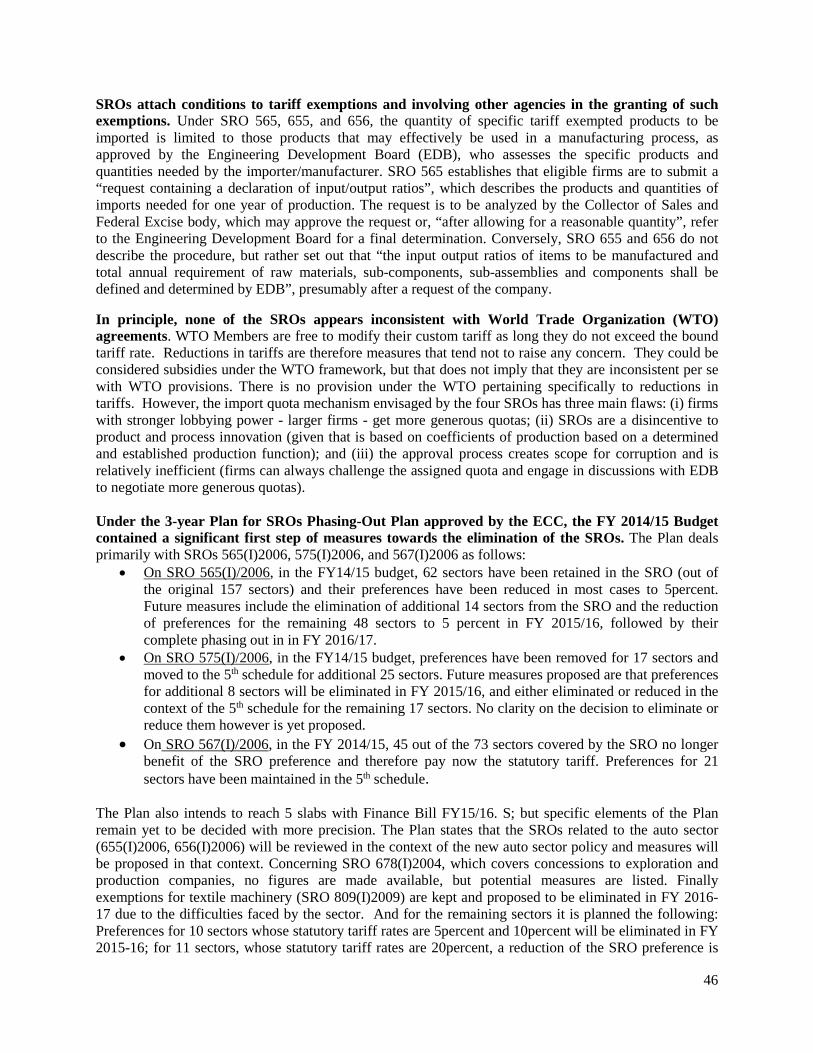
SROs attach conditions to tariff exemptions and involving other agencies in the granting of such exemptions. Under SRO 565, 655, and 656, the quantity of specific tariff exempted products to be imported is limited to those products that may effectively be used in a manufacturing process, as approved by the Engineering Development Board (EDB), who assesses the specific products and quantities needed by the importer/manufacturer. SRO 565 establishes that eligible firms are to submit a “request containing a declaration of input/output ratios”, which describes the products and quantities of imports needed for one year of production. The request is to be analyzed by the Collector of Sales and Federal Excise body, which may approve the request or, “after allowing for a reasonable quantity”, refer to the Engineering Development Board for a final determination. Conversely, SRO 655 and 656 do not describe the procedure, but rather set out that “the input output ratios of items to be manufactured and total annual requirement of raw materials, sub-components, sub-assemblies and components shall be defined and determined by EDB”, presumably after a request of the company.
In principle, none of the SROs appears inconsistent with World Trade Organization (WTO) agreements. WTO Members are free to modify their custom tariff as long they do not exceed the bound tariff rate. Reductions in tariffs are therefore measures that tend not to raise any concern. They could be considered subsidies under the WTO framework, but that does not imply that they are inconsistent per se with WTO provisions. There is no provision under the WTO pertaining specifically to reductions in tariffs. However, the import quota mechanism envisaged by the four SROs has three main flaws: (i) firms with stronger lobbying power - larger firms - get more generous quotas; (ii) SROs are a disincentive to product and process innovation (given that is based on coefficients of production based on a determined and established production function); and (iii) the approval process creates scope for corruption and is relatively inefficient (firms can always challenge the assigned quota and engage in discussions with EDB to negotiate more generous quotas). Under the 3-year Plan for SROs Phasing-Out Plan approved by the ECC, the FY 2014/15 Budget contained a significant first step of measures towards the elimination of the SROs. The Plan deals primarily with SROs 565(I)2006, 575(I)2006, and 567(I)2006 as follows:
• On SRO 565(I)/2006, in the FY14/15 budget, 62 sectors have been retained in the SRO (out of the original 157 sectors) and their preferences have been reduced in most cases to 5percent. Future measures include the elimination of additional 14 sectors from the SRO and the reduction of preferences for the remaining 48 sectors to 5 percent in FY 2015/16, followed by their complete phasing out in in FY 2016/17.
• On SRO 575(I)/2006, in the FY14/15 budget, preferences have been removed for 17 sectors and moved to the 5th schedule for additional 25 sectors. Future measures proposed are that preferences for additional 8 sectors will be eliminated in FY 2015/16, and either eliminated or reduced in the context of the 5th schedule for the remaining 17 sectors. No clarity on the decision to eliminate or reduce them however is yet proposed.
• On SRO 567(I)/2006, in the FY 2014/15, 45 out of the 73 sectors covered by the SRO no longer benefit of the SRO preference and therefore pay now the statutory tariff. Preferences for 21 sectors have been maintained in the 5th schedule.
The Plan also intends to reach 5 slabs with Finance Bill FY15/16. S; but specific elements of the Plan remain yet to be decided with more precision. The Plan states that the SROs related to the auto sector (655(I)2006, 656(I)2006) will be reviewed in the context of the new auto sector policy and measures will be proposed in that context. Concerning SRO 678(I)2004, which covers concessions to exploration and production companies, no figures are made available, but potential measures are listed. Finally exemptions for textile machinery (SRO 809(I)2009) are kept and proposed to be eliminated in FY 2016-17 due to the difficulties faced by the sector. And for the remaining sectors it is planned the following: Preferences for 10 sectors whose statutory tariff rates are 5percent and 10percent will be eliminated in FY 2015-16; for 11 sectors, whose statutory tariff rates are 20percent, a reduction of the SRO preference is
46

foreseen for FY 2015/16 and their elimination for FY 2016/17. For all these groups of products, the specific about their incoming reduction in FY 2015/16 is yet to be clarified, so to determine its revenue implications.
Table A6. 1. Published Statutory Duty Rates, FY2002/03 to FY2014/15 Rate 02/03 04/05 05/06 06/07 07/08 08/09 09/10 10/11 11/12 12/13 13/14 14/15
0 0 0 0 0 400 413 413 423 424 440 440 0 1 0 0 2 0 0 0 0 0 0 0 0 440 5 977 1,503 2,462 2,657 2,346 2,338 2,339 2,323 2,346 2,359 2359 2323 6.5 0 0 14 0 0 0 0 0 0 0 0 0 7 0 0 56 0 0 0 0 0 0 0 0 0 10 1,707 1,448 874 873 874 872 873 871 882 954 954 995 14 0 0 150 0 0 0 0 0 0 0 0 0 15 0 0 194 405 483 464 466 470 477 487 487 501 20 874 908 814 917 928 874 875 874 907 890 890 877 25 2,380 2,148 1,555 1,422 1,351 1,089 1,090 1,093 1,104 1,113 1113 1454 30 (special auto sector) 13 13 12 37 26 76 76 76 78 368 368 27 35 (special auto sector) 0 88 85 373 383 548 552 555 557 267 267 267 40 1 0 0 0 0 0 0 0 0 0 0 0 45 2 2 2 0 0 0 0 0 0 0 0 0 50 0 6 8 20 13 13 13 13 13 13 13 15 55 1 1 0 0 6 6 6 6 6 6 6 8 60 12 19 20 5 10 9 9 9 9 9 9 15 65 0 0 4 4 0 0 0 13 13 13 13 15 70 0 8 0 0 0 13 13 0 0 0 0 0 75 2 0 7 13 4 4 4 4 4 4 4 4 80 0 4 0 0 13 0 0 0 0 0 0 0 90 7 13 13 29 29 16 16 16 16 16 16 16 100 17 23 16 0 0 13 13 13 13 13 13 15 105 0 0 0 0 0 0 0 0 0 0 0 0 120 0 0 0 0 0 0 0 0 0 0 0 0 125 2 0 0 0 0 0 0 0 0 0 0 0 150 1 2 0 0 0 0 0 0 0 0 0 0 200 6 2 0 0 0 0 0 0 0 0 0 0 225 0 0 0 0 0 0 0 0 0 0 0 0 250 0 0 0 0 0 0 0 0 0 0 0 0 Total tariff lines 6,002 6,188 6,288 6,755 6,866 6,748 6,758 6,759 6,849 6,952 6952 6972 Tariff slabs 15 16 18 12 14 15 15 15 15 15 15 15 Standard tariff slabs/b 4 6 9 9 9 8 8 8 8 8 7 6/d Tariff peaks /c 11 10 9 3 5 7 7 7 7 7 7 8 Tariff dispersion 67.2per
cent 70.8percent
76.4percent
75.3percent
80.7percent
83.0percent
83.0percent
82.3percent
82.3percent
81.3percent
82.1percent
81.1percent
Source: WTO for FY 2002/03-FY 2011/12 and FBR for FY 2012/13, World Bank staff computations Note: a/ This refers to unweighted average customs duty. b/We define as standard tariff slabs, tariff rates which apply to 30 or more tariff lines, and exclude special sectors. c/ We define as tariff peaks, tariff rates that apply to less than 20 tariff lines. /d In FY2014/15, 267 tariff lines from the auto-sector were kept at the 35percent tariff rate; and 27 tariff lines also related to the auto-sector kept at the 30percent tariff rate, but GOP considers them as part of a special sector, so this tariff slab is not “standard”.
Table A6. 2. Statistics of Statutory Duty Rates, FY2002/03 to FY2014/15
mean sd minimum Maximum CV
FY 1999/00 25.2 17.3 0 250 0.69 FY 2000/01 24.9 18 0 250 0.72 FY 2001/02 20.4 16 5 250 0.78 FY 2002/03 17.4 11.7 5 200 0.67 FY 2004/05 16.8 11.9 5 200 0.71 FY 2005/06 14.4 11 3 100 0.76 FY 2006/07 15 11.3 5 90 0.75 FY 2007/08 14.5 11.7 0 90 0.81 FY 2008/09 14.7 12.2 0 100 0.83 FY 2009/10 14.7 12.2 0 100 0.83 FY 2010/11 14.7 12.1 0 100 0.82 FY 2011/12 14.7 12.1 0 100 0.82 FY 2012/13 14.4 11.7 0 100 0.81 FY 2013/14 14.5 11.9 0 100 0.82 FY 2014/15 14.3 11.6 1 100 0.81
Source: WTO for FY 2002/03-FY 2011/12 and FBR for FY 2012/13, Bank staff computations Mean refers to the un-weighted average tariff rate.
47

Table A6.3: Number of Tariff Lines by Type of Goods and Statutory (MFN) Rate, FY2012/13
MFN Tariff Rate
0 5 10 15 20 25 30 35 50 55 60 65 75 90 100 Grand Total
Capital goods 59 749 111 60 131 50 40 173 4
4 13
1,394
Consumer goods 47 261 231 94 387 731 267 64 8 6 5
4 14 13 2,132
Intermediate goods 169 1,077 416 302 336 231 3 21 1
2
2,558
Raw materials 160 244 192 31 23 53 58 2
763
#N/A 5 28 4
13 48
7
105
Grand Total 440 2,359 954 487 890 1,113 368 267 13 6 9 13 4 16 13 6,952
Table A6.4. Major General and Sector Specific SROs, FY13/14 (Rs. Billion)
Revenue yield
SRO Type Rs. Million percent 2014-15 2015-16 2016-17
567 General and conditional exemptions (non-survey) 28,067 28.5 5,000 5,500 400
565 Raw materials & components (survey-based) 10,524 10.7 7,545 3,700 1,500
575 Machinery and equipment 17,698 18.0 10,900 1,900 7,000
678 Petroleum and gas exploration and production 7,166 7.3
655 Vendors auto sector 11,853 12.0
656 Auto OEMs 21,592 21.9
809 Textile machinery 1,632 1.7
Total 98,532 100.0 23,445 11,100 8,900
Note: This table shows the estimated costs of each SRO in FY 2012-13 (last available data) and how the measures proposed in the plan affect the exemptions. Revenue yield is the extra customs duty revenue resulting from eliminating part of the SROs each year.
48
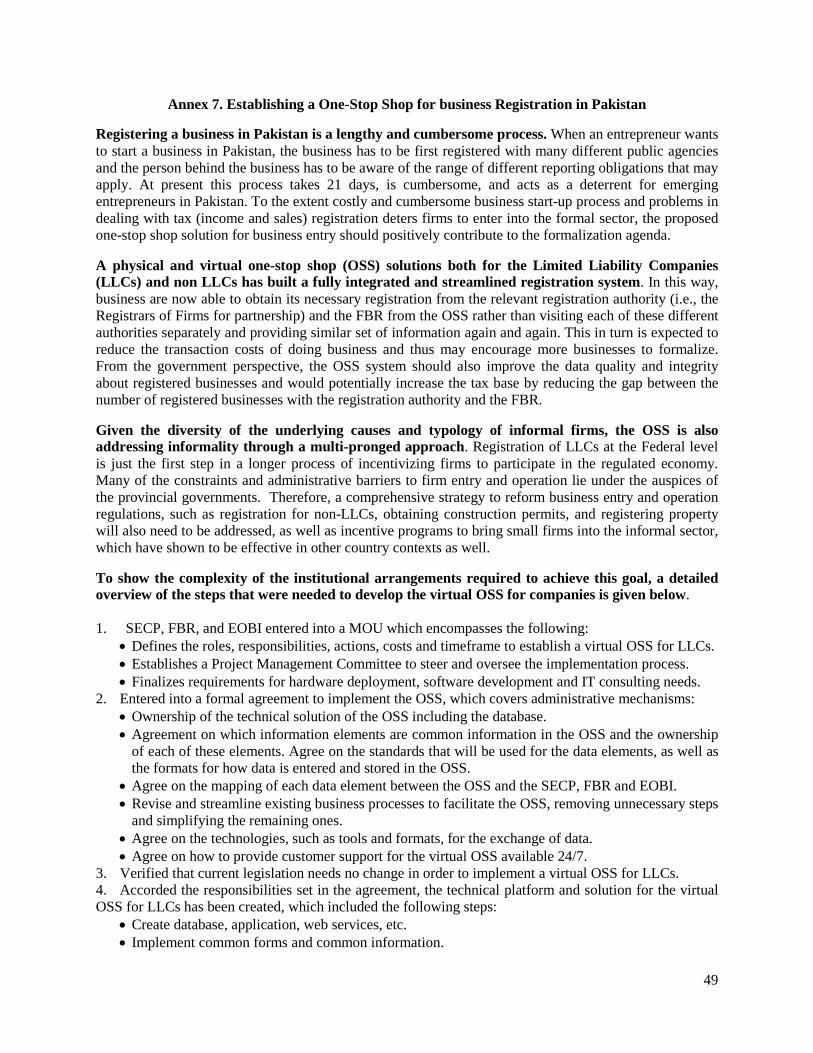
Annex 7. Establishing a One-Stop Shop for business Registration in Pakistan
Registering a business in Pakistan is a lengthy and cumbersome process. When an entrepreneur wants to start a business in Pakistan, the business has to be first registered with many different public agencies and the person behind the business has to be aware of the range of different reporting obligations that may apply. At present this process takes 21 days, is cumbersome, and acts as a deterrent for emerging entrepreneurs in Pakistan. To the extent costly and cumbersome business start-up process and problems in dealing with tax (income and sales) registration deters firms to enter into the formal sector, the proposed one-stop shop solution for business entry should positively contribute to the formalization agenda.
A physical and virtual one-stop shop (OSS) solutions both for the Limited Liability Companies (LLCs) and non LLCs has built a fully integrated and streamlined registration system. In this way, business are now able to obtain its necessary registration from the relevant registration authority (i.e., the Registrars of Firms for partnership) and the FBR from the OSS rather than visiting each of these different authorities separately and providing similar set of information again and again. This in turn is expected to reduce the transaction costs of doing business and thus may encourage more businesses to formalize. From the government perspective, the OSS system should also improve the data quality and integrity about registered businesses and would potentially increase the tax base by reducing the gap between the number of registered businesses with the registration authority and the FBR.
Given the diversity of the underlying causes and typology of informal firms, the OSS is also addressing informality through a multi-pronged approach. Registration of LLCs at the Federal level is just the first step in a longer process of incentivizing firms to participate in the regulated economy. Many of the constraints and administrative barriers to firm entry and operation lie under the auspices of the provincial governments. Therefore, a comprehensive strategy to reform business entry and operation regulations, such as registration for non-LLCs, obtaining construction permits, and registering property will also need to be addressed, as well as incentive programs to bring small firms into the informal sector, which have shown to be effective in other country contexts as well.
To show the complexity of the institutional arrangements required to achieve this goal, a detailed overview of the steps that were needed to develop the virtual OSS for companies is given below. 1. SECP, FBR, and EOBI entered into a MOU which encompasses the following:
• Defines the roles, responsibilities, actions, costs and timeframe to establish a virtual OSS for LLCs. • Establishes a Project Management Committee to steer and oversee the implementation process. • Finalizes requirements for hardware deployment, software development and IT consulting needs.
2. Entered into a formal agreement to implement the OSS, which covers administrative mechanisms: • Ownership of the technical solution of the OSS including the database. • Agreement on which information elements are common information in the OSS and the ownership
of each of these elements. Agree on the standards that will be used for the data elements, as well as the formats for how data is entered and stored in the OSS.
• Agree on the mapping of each data element between the OSS and the SECP, FBR and EOBI. • Revise and streamline existing business processes to facilitate the OSS, removing unnecessary steps
and simplifying the remaining ones. • Agree on the technologies, such as tools and formats, for the exchange of data. • Agree on how to provide customer support for the virtual OSS available 24/7.
3. Verified that current legislation needs no change in order to implement a virtual OSS for LLCs. 4. Accorded the responsibilities set in the agreement, the technical platform and solution for the virtual OSS for LLCs has been created, which included the following steps:
• Create database, application, web services, etc. • Implement common forms and common information.
49

• Include registration of new LLCs, changing of data on existing LLCs and deregistration of LLCs. • Analyze and adapt the systems of the SECP, FBR and EOBI in order to be able to use data made
available by the OSS. • Develop a solution regarding digital signature, authorization and authentication for the OSS.
The parties now are implementing a plan for continuous awareness building with both businesses and public authorities. The essence of the message is on the benefit from reforming business registration and introducing the OSS in Pakistan. Simultaneously, ERU, FBR and SECP have initiated a public awareness campaign through print media across Pakistan, which is to be supplemented by a detailed communications strategy and awareness building campaign. The VOSS is currently fully operationalized and is running in a pilot phase during which PRAL and SECP are conducting final testing of technical and interface related issues. SECP, FBR, and EOBI have also agreed in a high-level decision to support operation and maintenance of the Virtual OSS last January 2015, which will ensure its sustainability in the medium term. According to the responsibilities set in the agreement, the training of staff that shall provide customer support for the virtual OSS has been planned and carried through. The staff have been trained in the procedures of business registration, how to use the OSS and how the OSS provides information to several public authorities. So far, key results from the VOSS include reduction in two (2) procedures and documented time savings of two (2) days. In addition, there are undocumented time savings and reduced transaction costs as a result of reduced duplication of data to be provided either through the online platform, or through visits to facilitation centers of the institutions.
Table A7. 1: Broad Timeline of Medium Term Implementation Plan
Launch of Virtual OSS for LLCs
1.1 Develop and sign an MOU between SECP, FBR and EOBI to clarify ownership of OSS, develop funding mechanism, and identify long term software development commitment to ensure sustainability.
November 30th 2014
SECP, FBR, and EOBI had a high-level decision on operation and maintenance of the Virtual OSS in January 2015, which will ensure sustainability in the near term.
1.2 Initiate testing and complete the Integration of the data systems of the SECP, FBR and EOBI into a single OSS collaborative platform.
November 30th 2014
The pilot version was launched at http://oss.secp.gov.pk; however there were still some outstanding hardware and software related issues that needed to be fixed before its final launching in March 2015.
1.4 Conduct training of VOSS staff. December 31st 2014
The training of the internal staff at SECP (destined to handle VOSS) was completed.
1.5 Launch awareness campaign for the VOSS. December 31st 2014
Newspaper advertisements issued in Dawn, Jang and Business Recorder on 22nd Dec. 14.
1.6 Integrate the provincial Employees Social Security Institutions registration procedure into the VOSS.
December 31st 2015
Dialogue is underway to integrate this into the VOSS.
1.7 Allow payments of related taxes for company registration to be made online using the VOSS.
June 30th 2015 SECP is finalizing the MOUs with Muslim Commercial Bank for the payment of fees through online payment mechanism in the VOSS.
Launch Physical OSS for LLCs at Lahore and Karachi Chambers of Commerce
1.8 1.8 Equip Lahore Chamber of Commerce with infrastructure required to launch the physical OSS.
December 31st 2014
The LCC communicated ERU that the required infrastructure was available for the Physical OSS. Final issues were fixed and training provided to the desk staff for the VOSS.
1.9 Develop a thorough information security management system for Lahore OSS for registering LLCs.
This was carried out along with setup and training mentioned in 1.8 above.
1.10 Launch awareness campaign for Lahore OSS. This was agreed with LCC. Done.
50
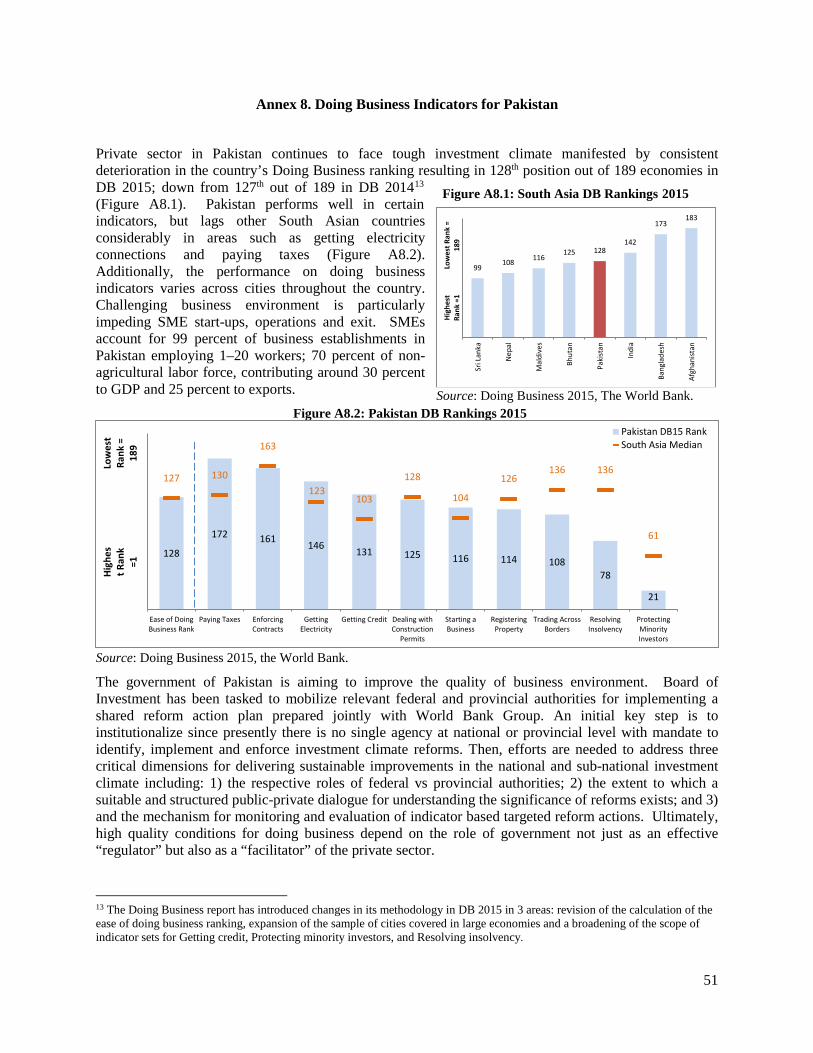
Annex 8. Doing Business Indicators for Pakistan
Private sector in Pakistan continues to face tough investment climate manifested by consistent deterioration in the country’s Doing Business ranking resulting in 128th position out of 189 economies in DB 2015; down from 127th out of 189 in DB 201413 (Figure A8.1). Pakistan performs well in certain indicators, but lags other South Asian countries considerably in areas such as getting electricity connections and paying taxes (Figure A8.2). Additionally, the performance on doing business indicators varies across cities throughout the country. Challenging business environment is particularly impeding SME start-ups, operations and exit. SMEs account for 99 percent of business establishments in Pakistan employing 1–20 workers; 70 percent of non-agricultural labor force, contributing around 30 percent to GDP and 25 percent to exports.
Figure A8.2: Pakistan DB Rankings 2015
Source: Doing Business 2015, the World Bank.
The government of Pakistan is aiming to improve the quality of business environment. Board of Investment has been tasked to mobilize relevant federal and provincial authorities for implementing a shared reform action plan prepared jointly with World Bank Group. An initial key step is to institutionalize since presently there is no single agency at national or provincial level with mandate to identify, implement and enforce investment climate reforms. Then, efforts are needed to address three critical dimensions for delivering sustainable improvements in the national and sub-national investment climate including: 1) the respective roles of federal vs provincial authorities; 2) the extent to which a suitable and structured public-private dialogue for understanding the significance of reforms exists; and 3) and the mechanism for monitoring and evaluation of indicator based targeted reform actions. Ultimately, high quality conditions for doing business depend on the role of government not just as an effective “regulator” but also as a “facilitator” of the private sector.
13 The Doing Business report has introduced changes in its methodology in DB 2015 in 3 areas: revision of the calculation of the ease of doing business ranking, expansion of the sample of cities covered in large economies and a broadening of the scope of indicator sets for Getting credit, Protecting minority investors, and Resolving insolvency.
128
172 161 146 131 125 116 114 10878
21
127 130
163
123103
128
104
126136 136
61
Ease of DoingBusiness Rank
Paying Taxes EnforcingContracts
GettingElectricity
Getting Credit Dealing withConstruction
Permits
Starting aBusiness
RegisteringProperty
Trading AcrossBorders
ResolvingInsolvency
ProtectingMinorityInvestors
Pakistan DB15 RankSouth Asia Median
Low
est
Rank
=
189
High
est R
ank
=1
99108 116
125 128142
173183
Sri L
anka
Nep
al
Mal
dive
s
Bhut
an
Paki
stan
Indi
a
Bang
lade
sh
Afgh
anist
an
Hig
hest
Ra
nk =
1Lo
wes
t Ran
k =
189
Figure A8.1: South Asia DB Rankings 2015
Source: Doing Business 2015, The World Bank.
51

Annex 9. Financial Inclusion in Pakistan
Pakistan’s banking sector continues to be relatively robust and stable, despite difficult macro-economic situation, devastating floods in 2010 and 2011, law and order and power shortage issues. In past years, the banking system has consistently remained profitable, with the most recent profit before tax increasing 22 percent year-on-year, while both return on assets and return on equity remained at satisfactory levels with 2.2 percent and 23.4 percent respectively. Banking system liquidity has been improving, and solvency has been strong with the overall capital adequacy ratio of 16percent, well above the regulatory requirement of 10percent. Banking supervision is relatively strong and independent, and is largely compliant with the Basle Core Principles. Overall, stress tests show that the banking sector remains reasonably resilient to extensive shocks and after-shock capital adequacy of the system remains above the minimum requirement. While overall the banking sector has been robust and resilient, there remain some vulnerabilities and gaps--notably in the areas of credit quality, deposit insurance, and oversight of financial conglomerates.
There is a need to address lack of access to financial services for most of the Pakistani population. Less than 14percent of the population has access to any financial service, microfinance reaches less than 3percent of the population, and less than 7 percent of SMEs use formal finance for working capital or investments. Although availability of financial products and services has become gradually more widespread, access to finance continues to be limited, especially on the credit front. Overall outreach to the poor and underserved remains static, with less than 3percent of the population having access to microfinance products or services. There are even more serious issues facing women borrowers, including discriminatory lending policies and practices.
The SBP has taken the lead to develop a NFIS for Pakistan. SBP has proven to have a leading role in facing Pakistan’s financial inclusion challenges and opportunities, in collaboration with other market regulators (particularly SECP), government ministries (particularly Ministry of Finance), other stakeholders (e.g. Pakistan Microfinance Network, Pakistan Banks’s Association, Insurance Association of Pakistan) and the private sector. The strategy aims to reflect the current status/issues of financial inclusion from three dimensions (a) enabling environment and foundations, (b) supply side drivers of financial access and (c) demand side drivers of usage, while proposing an action plan based on a gaps analysis among these three dimensions.
The NFIS has been structured as follows. The stated vision for financial inclusion in Pakistan is that: “individuals and firms can access and use a range of quality payments, savings, credit and insurance services which meet their needs with dignity and fairness”. A set of cross cutting actions – the key enablers – will be put in place as follows: (i) public and private sector commitment to the NFIS and coordination; (ii) legal and regulatory environment; (iii) adequate supervisory and judicial capacity; and (iv) financial payments and information and communications technology (ICT) infrastructure. Key drivers will support targeted actions aimed at increasing access and developing an ecosystem of financial services that will have the quality and features required by the Pakistani population and enterprises. These are: (i) Adoption of the Better than Cash Alliance; (ii) reaching scale through bulk payments; (iii) expanding and diversifying access points; (iv) improving capacity of financial service providers; and (v) increasing levels of financial capability. Finally, the NFIS proposes actions on the following areas: Banking and SME Finance, Housing Finance, Payments Systems, Microfinance, Rural & Agriculture Finance, Insurance and Pensions, Islamic Finance, and Consumer Protection and Financial Literacy. The NFIS will also promote adoption by the Government of the global Better than Cash Alliance Initiative, which fosters the use of electronic currency country wide. Dissemination of the NFIS started on May 2015.
A most productive action to enhance financial intermediation for the private sector is to focus on reducing underlying risks by strengthening creditors’ rights through regulatory reforms in Credit Information. Giving consumers access to their own credit information is one of the key input measures
52

of Doing Business Getting Credit indicators. And is a critical component in the legal and regulatory framework governing the collection, distribution, use, and contestability of consumer credit information. Currently, no consumer in Pakistan can review, dispute, verify their own credit report, which is a fundamental block to both access to financial services as well as basic consumer financial protections. Public and private credit bureaus in Pakistan provide credit information on only 7 and 2 percent of the population respectively. Changes in their governing regulations could have important effects on bringing more potential borrowers into the formal financial system. Credit bureaus and credit registries are essential parts of the financial infrastructure that facilitates access to formal finance, and when well designed with the proper legal framework, they reduce information asymmetries, increase access to credit for small firms, lower interest rates, improve borrower discipline and support bank supervision and credit risk monitoring.
SBP established the electronic-CIB (e-CIB) system with mandatory membership for all banks and financial institutions, but there are many gaps and restrictions in place calling for a credit bureau. Among these gaps, borrowers and third parties do not have access their own credit information, positive information is not included in public bureau credit reports, credit histories do not include information from non-financial institutions, and regulation of private bureaus is fragmented and limited. Furthermore, there is currently no legislation governing credit information. The SBP submitted a credit bureau act in February 2014. Based on a 2010 bill, by providing access to credit information, this action introduces transparency in credit approvals and aims to reduce discriminatory lending practices. At the same time, the law will provide clarity on the regulatory environment for private credit bureaus, consolidates and strengthens the role of the supervisory authority, and allow for the provision of both positive as well as negative information, and information collected from non-banks, such as utility companies. In the medium term, this law is expected to increase coverage and enhance the quality of credit information available, while in the short term it will contribute to improve the Doing Business rating for Getting Credit indicator in Pakistan. Finally, this action is supplemented by the government's efforts to compile a database of credit information of microfinance borrowers (mf-cib) and the State Bank of Pakistan's ongoing work on secured transactions.
The Better than Cash Alliance (BTCA) is a United-Nations housed coalition that provides support to governments, development agencies and companies to accelerate the shift to electronic payments. The Alliance is funded by The Bill & Melinda Gates Foundation, Citi, The Ford Foundation, MasterCard, Omidyar Network, The United States Agency for International Development, and Visa Inc. Benefits: The BTCA aims at digitizing government’s payments: decrease costs and leakages, while driving financial access and usage. The transition to electronic payments provides governments, development organizations and companies with the opportunity to make and collect payments in a more cost-efficient, faster, safer and more transparent manner. • Digitizing helps overcome the costs and physical barriers that have beset otherwise valuable financial
inclusion efforts. Digital platforms offer the opportunity to rapidly scale up access to financial services using mobile phones, retail point of sales.
• Digital payments can promote women’s economic empowerment by facilitating greater account ownership and asset accumulation and increasing women’s economic participation. Digital payments, particularly by governments and employers, enable the confidentiality and convenience women require in financial services.
• Evidence shows that digitalization and access to electronic payments tend to diversify household consumption, having a positive impact on their food consumption patterns and access to education and healthcare. Households with access to electronic payments also withstand better economic shocks than those without access.
53

Annex 10. Creation of Fiscal Space Through Revenue Mobilization
Since the early 1990s, successive governments have tried to reform Pakistan’s tax system. However, implementing these reforms had not been easy and the tax-to-GDP ratio has remained low at close to 10 percent of GDP, of which revenue collected by the Federal Board of Revenue (FBR) amounts to only 8.9 percent of GDP in FY1414. This relatively low tax ratio stems from a variety of structural issues including: (i) certain constitutional provisions which introduce inequity and dichotomy in taxation of certain incomes (e.g. agriculture); (ii) inefficient tax administration (poor management, weak human resources, lack of adequate IT supporting systems, excessive scope for discretion and rent seeking behavior); (iii) a narrow tax base (out of 39.4 million employed persons, less than 10 percent are registered, and very few are active taxpayers) further eroded by numerous and generous exemptions and concessions; (iv) skewed tax structure (66.4 percent of tax revenue is from indirect taxes); (v) a complex and non-transparent tax system; (vi) corruption and tax evasion (weak accountability and low incentives for tax officials, large informal sector); and (vii) a non-supportive political economy environment (strong vested interest groups). Learning from its own past experiences, the government has formulated a new tax reform strategy with the following key tax administration features. Broadening the tax base by reducing exemptions and concessions. Pakistan’s tax base is eroded by a large number of ad-hoc, and often distortionary, tax exemptions, issued mostly through SROs. In order to enhance transparency of the fiscal cost of these exemptions, the government first published a tax expenditure annex in the Economic Survey 2013-14, which was posted on the website of the Ministry of Finance. In addition, the government approved a 3-year plan to phase out exemptions approved by SROs either by making them part of tax laws or by eliminating them by levying statutory of reduced (less than statutory) rates. The phase out of SROs are expected to increase government revenue by 0.36, 0.2 and 0.4 percent of GDP in 2014/15, 2015/16 and 2016/17, respectively, for a total of about one percent of GDP (See Table A10.1). Moreover, the government has approved a Presidential Ordinance, followed by submission of legal amendments in the Finance Bill 2015/16 withdrawing the powers of FBR to grant tax exemptions and to give them back to the Parliament or, under extraordinary circumstances to its Economic Coordination Committee.15
Table A10.1 Cost of Exemption and Exemptions Eliminated Each Year
Year Cost of exemption at the beginning of the year (PKRs. Billion)
Exemptions eliminated*
2014/15 477 -- 2015/16 386 91 2016/17 312 74 2017/18 148 164
* Calculated based on difference of costs of exemption between years. Source: FBR. • Increasing the number of registered taxpayers. Among the estimated 52 million income earners, less than 3.4 million were registered income taxpayers in 2014. Reasons for this woefully small number of registered taxpayers are many; but lack of taxpayer information available to the tax authorities is the most important among these reasons. FBR is making efforts to increase the number of registered taxpayers through the use of external (third-party) information on: (i) acquisition of real estate; (ii) purchase of luxury cars; (iii) expenditure on children education; and (iv) expenses on foreign travel to identify potential taxpayers, i.e. individuals whose living standard does not justify
14 The tax/GDP ratio ranges between 30 to 50 percent for developed countries, and averages 18 percent for developing countries. 15 Unambiguous remarks to this effect were made by the Finance Minister in his speech closing the parliamentary debate of the 2014/15 and opening the 2015/16 budgets. These circumstances are: security reasons, natural disasters, basic food emergencies or protection of national interests referring to commodity shocks, bilateral or multilateral arrangements, correction of tax anomalies and development of backward areas.
54

them to be outside the tax net. FBR plans to issue at least 300,000 tax notices to such individuals over the three year period. Through these notices and a well-defined follow-up process (see Figure A10.1), FBR hopes to get most of these individuals registered as taxpayers. In 2013/14, FBR issued over 120,000 tax notices, which have increased to 171,000 by February 2015. Out of the non-responding recipients of first tax notices, over 70,000 were issued second notices. And out of the latest about 58,000 were issued preliminary tax assessment orders (see Table A10.2). This process has created an initial “tax demand” of over Rs 17 billion (0.06 percent of GDP); and the process is expected to gain pace in the next two years.
Figure A10. 1. Sequencing of Follow-up Actions in Registering Potential Taxpayers
Table A10.2: Progress on Tax Notices, September 2013 – December 2014 (cumulative numbers)
Source: Federal Board of Revenue and World Bank staff calculations • Launching of a new risk-based GST registration system: In order to expedite sales tax registration, while at the same time avoiding its misuse, in FY13/14, FBR launched a risk-based sales tax registration system. Under this system, the applicant will electronically file a registration application; and will attach scanned copies of the required documents with his application including Computerized National Identity Card number of all owners, members, partners or directors of the business enterprise. In addition, the applicant w i l l also submit GPS-tagged photograph of the business premises, machinery installed (if any), the electricity and gas; which could help with the authentication of the
First Notice Issued
No ResponseSecond Notice Issued
(after xx weeks)
No response (for 60+ days)Third notice issued or
preliminary assessment made on tax liability (after yy weeks)
No response (for 60+ days)
Preliminary assessment made on tax liability or legal notice
issued
No response (for 60+ days)Legal notice issued or legal
proceeding started
Potential Taxpayer responded
If legible taxpayer – Taxpayer registered, tax
assessed/collection received
Potential Taxpayer respondedIf legible taxpayer – taxpayer
registered, tax assessed/collection received
Potential Taxpayer respondedIf legible taxpayer – taxpayer
registered, tax assessed/collection received.
30-Sep 31-Oct 30-Nov 31-Dec 31-Jan 28-Feb 31-Mar 30-Apr 31-May 30-Jun 31-Jul 31-Aug 30-Sep 31-Oct 30-Nov 31-Dec 31-Jan 29-Feb1st NoticesIssued 30,355 36,674 39,396 61,246 67,875 70,901 81,545 84,056 90,000 120,350 120,350 120,350 125,470 127,086 146,937 154,922 168,570 171,442 60 Days due 1,579 4,845 7,772 11,373 13,884 17,625 21,349 30,113 38,029 40,156 45,068 61,159 64,920 64,920 69,005 69,007 92,713 94,293 2nd Notices IssuedIssued 1,503 1,863 4,117 8,218 10,649 12,707 20,195 22,798 31,786 38,413 40,350 42,740 49,083 50,500 51,756 52,506 72,316 70,720 60 Days due - - 1,503 2,863 4,117 8,218 10,649 11,678 20,195 22,798 31,786 38,413 40,350 42,740 49,083 50,500 54,237 59,250 Assessment Orders passedIssued - 1,189 2,600 3,889 5,317 8,470 11,328 12,253 22,595 28,690 29,100 29,872 35,557 36,500 37,424 39,164 48,365 58,516 Percentage of 60 Days due2nd Notices 95% 59% 53% 72% 77% 72% 95% 76% 84% 96% 90% 70% 76% 78% 75% 76% 78% 75%Assessment Orders NA NA 173% 136% 129% 103% 106% 105% 112% 126% 92% 78% 88% 85% 76% 78% 89% 99%
2013 2014 2015
55
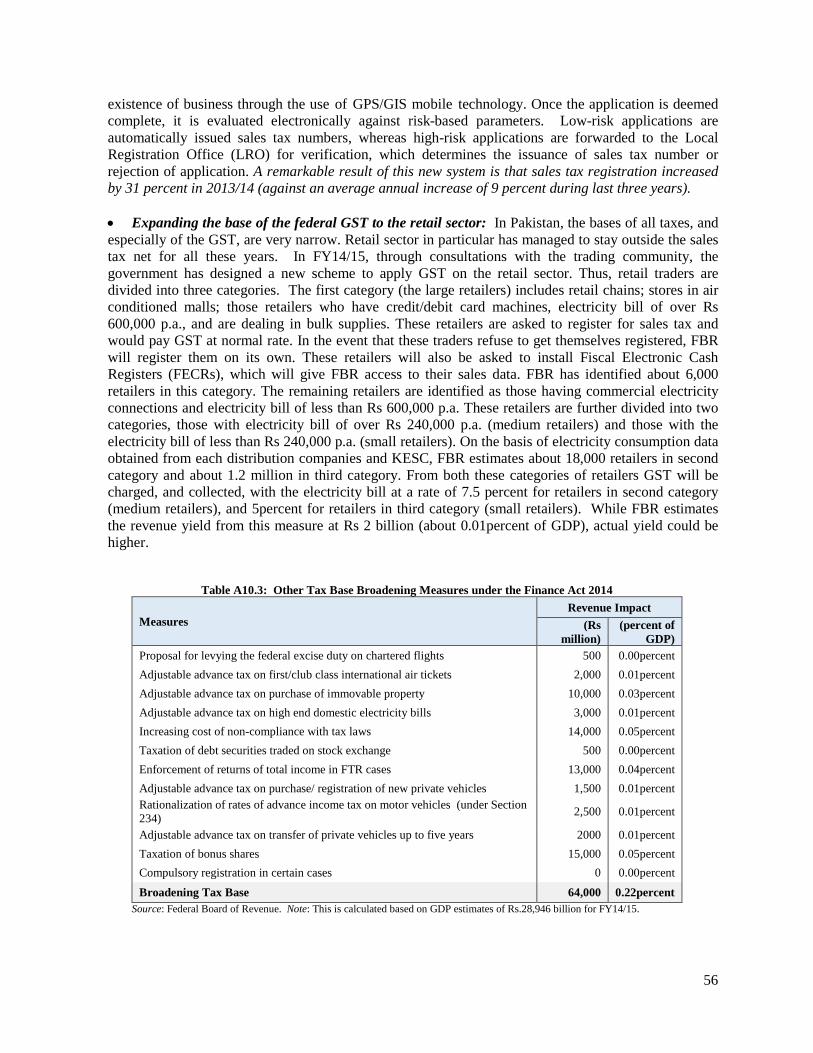
existence of business through the use of GPS/GIS mobile technology. Once the application is deemed complete, it is evaluated electronically against risk-based parameters. Low-risk applications are automatically issued sales tax numbers, whereas high-risk applications are forwarded to the Local Registration Office (LRO) for verification, which determines the issuance of sales tax number or rejection of application. A remarkable result of this new system is that sales tax registration increased by 31 percent in 2013/14 (against an average annual increase of 9 percent during last three years). • Expanding the base of the federal GST to the retail sector: In Pakistan, the bases of all taxes, and especially of the GST, are very narrow. Retail sector in particular has managed to stay outside the sales tax net for all these years. In FY14/15, through consultations with the trading community, the government has designed a new scheme to apply GST on the retail sector. Thus, retail traders are divided into three categories. The first category (the large retailers) includes retail chains; stores in air conditioned malls; those retailers who have credit/debit card machines, electricity bill of over Rs 600,000 p.a., and are dealing in bulk supplies. These retailers are asked to register for sales tax and would pay GST at normal rate. In the event that these traders refuse to get themselves registered, FBR will register them on its own. These retailers will also be asked to install Fiscal Electronic Cash Registers (FECRs), which will give FBR access to their sales data. FBR has identified about 6,000 retailers in this category. The remaining retailers are identified as those having commercial electricity connections and electricity bill of less than Rs 600,000 p.a. These retailers are further divided into two categories, those with electricity bill of over Rs 240,000 p.a. (medium retailers) and those with the electricity bill of less than Rs 240,000 p.a. (small retailers). On the basis of electricity consumption data obtained from each distribution companies and KESC, FBR estimates about 18,000 retailers in second category and about 1.2 million in third category. From both these categories of retailers GST will be charged, and collected, with the electricity bill at a rate of 7.5 percent for retailers in second category (medium retailers), and 5percent for retailers in third category (small retailers). While FBR estimates the revenue yield from this measure at Rs 2 billion (about 0.01percent of GDP), actual yield could be higher.
Table A10.3: Other Tax Base Broadening Measures under the Finance Act 2014
Measures Revenue Impact
(Rs million)
(percent of GDP)
Proposal for levying the federal excise duty on chartered flights 500 0.00percent
Adjustable advance tax on first/club class international air tickets 2,000 0.01percent
Adjustable advance tax on purchase of immovable property 10,000 0.03percent
Adjustable advance tax on high end domestic electricity bills 3,000 0.01percent
Increasing cost of non-compliance with tax laws 14,000 0.05percent
Taxation of debt securities traded on stock exchange 500 0.00percent
Enforcement of returns of total income in FTR cases 13,000 0.04percent
Adjustable advance tax on purchase/ registration of new private vehicles 1,500 0.01percent Rationalization of rates of advance income tax on motor vehicles (under Section 234)
2,500 0.01percent
Adjustable advance tax on transfer of private vehicles up to five years 2000 0.01percent
Taxation of bonus shares 15,000 0.05percent
Compulsory registration in certain cases 0 0.00percent
Broadening Tax Base 64,000 0.22percent Source: Federal Board of Revenue. Note: This is calculated based on GDP estimates of Rs.28,946 billion for FY14/15.
56

• Other tax base broadening measures: In the Finance Act 2014, the Government also took a number of other actions to broaden the base of the income and sales taxes, including levying of higher rates of withholding tax and sales on services rendered of supplies made by (or to) unregistered individuals and companies so as to increase the cost on non-compliance. Their estimated revenue potential is around Rs. 64 billion, as given in following Table A10.3.
Ensuring tax compliance through an effective tax audit system: An efficient tax audit system reduces tax avoidance and enhances government revenue. Tax audit (and enforcement) remained among the weakest areas of FBR. And this is an essential gap as most of the federal taxes encourage self-assessment by taxpayers. In the past, FBR had limited number and poor quality of tax audits. De facto, before 2012/13, the tax audit function was not performed. With orders from superior courts stemming the plan to undertake risk-based audits, FBR has opted to institute a system of tax audits based on computerized random balloting. For this, FBR has made operational an IT-based Tax Audits Management System (TAMS) and selected 5percent of non-salary tax returns filed for tax year 2012 for audits, and 80 percent of those by end-June 2014, creating a tax demand of about Rs 15 billion (0.05 percent of GDP). In the medium-term, FBR plans to take the number of tax audits to over 20 percent of filed tax returns. This implies that every taxpayer would be almost certain to be audited once every 5 years. In the meantime, FBR has increased the number of audits the returns filed for tax year 2013 to above 10 percent, and through a well-designed training process and close monitoring, improved the quality of these audits (see Table A10.4). This is estimated to create an additional tax demand of Rs 40 billion (0.1 percent of GDP).
Table A10.4: Tax Audit Plan for Tax Years 2012-2014
Tax Year
2012 Tax Year
2013
Number of Total Returns Received 735,188 865,721
(Less) Salary-Related Returns 155,540 189,878
(Less) Returns Related to FTR/PTR 119,181 134,470
Total Returns Available for Audits 460,467 541,373
Corporate 12,060 19,447
AOPs and Individuals 448,407 521,926
A. Cases Selected for Audit 36,758 64,838
In percent of Cases Available for Audit (Total minimum cases to be selected: 7.5percent)
8.0percent 12percent
B. Number of Audits Initiated 36,000 62,117
In percent of Cases Selected (A) (Minimum Number of Audits to be Initiated: 25percent of A)
98percent 96percent
Source: FBR.
57

Annex 11: Increasing Provincial Revenue for More Social Spending
Expansion in the Services Sales Tax Base in Punjab and Sindh
After the promulgation of their respective Sales Tax on Services Acts (Sindh in 2011, and Punjab in 2012), both provincial governments have introduced several measures to improve services sales tax (SST) collection by expanding the tax net. These include: adding new taxable services in the Second Schedules of their Sales Tax Ordinances; improving the targeting of exemptions to poor segments of the populations by expanding the scope of exemption eligibility conditions; and, in the case of Sindh, reducing the tax rate. The overall impact of these measures has so far been positive for both provinces and reflected in the form of increased total collection, reduced reliance on the telecommunication sector, and increased shares of collection from other services (notably banks, restaurants, courier, franchise, and other services; see figure A11.1). However, comparing potentially taxable services with those already taxed--grouped under the First and Second Schedules respectively--there still is considerable scope for adding new services.
Figure A11.1: Sectoral Shares in Total Services Sales Tax Collection (percent of total)
Source: Punjab Revenue Authority, Sindh Revenue Board, and World Bank staff calculations. In their 2014/15 budgets, both provinces further expanded the tax base by bringing more services into the SST net (See Table A11.1). In the classification code adopted by the Punjab Revenue Authority and the Sindh Revenue Board, 45 and 22 additional services were brought into the tax net respectively. Some of the new services in Sindh are levied at a lower (4percent to 5percent) rate.16 Sindh has also revised its rules17 for the withholding tax and devised a plan to bring all services (listed in the First Schedule) into the tax net over a period of three years. For its part, the Punjab government aims to introducing tax reforms and improving its tax collection system (based on transparency and better monitoring of tax collection); rewarding the taxpayers (special prize schemes); and revisiting the tax rates to avoid double taxation (removing bed-tax and rather imposing a 16percent sales tax on hotels). Its ultimate goal is to further expand the tax net over the next 10 years.
16 These apply to legal practitioners & consultants, accountants & auditors, tax consultants and constructor services. 17 These include: disallowing withholding by services recipient who are non-resident or do not have business in Sindh; 15% of SST on advertisement shall continue to be withheld by the withholding agents in Sindh; and a uniform rate of one-fifth of the tax amount shall be withheld by other withholding agents in Sindh.
74%
7% 2% 3% 2% 5% 1% 0% 1% 4%
60%
8%3%
3%3%
6% 3%0%
3%11%
0%10%20%30%40%50%60%70%80%
PunjabFY13 FY14
32%
17%13%
5%
26%
12%11%10%
6%
11%
0%5%
10%15%20%25%30%35%
Tele
com
mun
icat
ion
Term
inal
ope
rato
r
Insu
ranc
e
Bank
Fran
chise
Cont
ract
exe
cutio
n
Inve
stm
ent a
dviso
ry
Cour
ier
Rest
aura
nt &
car
e
Hote
ls
Stoc
kbro
kers
Adve
rtise
men
t
Stev
edor
es
Cons
truc
tion
Cust
om a
gent
s
Cons
ulta
nt
Secu
rity
serv
ices
Airp
ort s
ervi
ces
Busin
ess s
uppo
rt se
rvic
es
Ship
ping
age
nt
Oth
ers
SindhFY 13 FY14
58

Table A11.1: Key Features of Provincial Services Sales Tax
Punjab Sindh
2013/14 2014/15 2013/14 2014/15
Overall tax rate (percent) 16percent 16percent 15percent 16percent Number of taxable services (as per First Schedule) 245 245 240 240 Number of services taxed (as per Second Schedule) 90 135 155 178 Share of telecom services 28percent 19percent 42percent 37percent Share of other services 72percent 81percent 58percent 63percent Exemptions
Service listed in First but not the Second Schedule (or neither) 155 110 85 62 Services with conditional tax exemptions/ full exemption 15 22 19 27 Collection target (Rs billion) 62 95 42 49 Note: Number of services counted as per classification codes/tariff headings. Source: Punjab Revenue Authority, Sindh Revenue Board, and World Bank Staff calculations.
Increase in provincial non-salary allocations for education and Sindh Pakistan social indicators continue to lag behind those of comparable countries because the country has not made enough investment in social sectors. Provinces have a major responsibility of the social sectors, but their weak finance is an important factor for inadequate social spending. The 7th NFC Award made a substantial increase of the share of provinces in the federally collected taxes. Federal revenue transfers to the provinces increased from 3.9 percent of GDP in 2005/06 to 5.3 percent in 2011/12. Ensuing overall public spending on education increased from 1.9 percent of GDP to 2.1 percent, while on health increased from 0.5 percent of GDP to 0.7 during the same period. However, the bulk of such raise benefitted salary increases, with no or little effect at raising non-salary inputs in goods and services for the education and health sectors. Both education and health services are labor intensive services; yet non-salary inputs--like text books and educational material, medicines and other supplies/equipment for hospitals and clinics--are vital for delivery and better quality of social services. Many public schools and clinics are in bad state of disrepairs, solely because on inadequate or no allocation for repairs and maintenance. Through its interaction with the provincial finance authorities, the Federal Government has impressed upon the provincial governments to improve the quality of social services by increasing the non-salary budgetary allocations to the education and health sectors by at least 20 percent. In the 2014/15 budget, all provincial governments, with the exception of Balochistan, have made significant increases in non-salary allocation for both education and health sectors (see Table A11.2). Although there is considerable variation in the magnitude of this increase among provinces, and between sectors, on aggregate there is about 27 percent increase in non-salary allocations to both sectors.
Table A11.2: Non-Salary Budget Allocations for Education and Health Sectors
(Rs. Million), 2013/14 - 2014/15
2013/14 Budget 2014/15 Budget Increase,
percent Punjab Education 13,825 17,664 27.8
Health 18,756 24,912 32.8 Total 32,581 42,577 30.7
Sindh Education 26,223 32,910 25.5 Health 15,954 20,636 29.4 Total 42,177 53,546 27.0
Khyber Pakhtunkhwa
Education 4,743 8,544 80.1 Health 5,873 6,430 9.5 Total 10,617 14,974 41.0
Baluchistan Education 3,943 3,092 -21.6 Health 3,052 3,210 5.2 Total 6,994 6,302 -9.9
All provinces Education 48,734 62,211 27.7 Health 43,635 55,188 26.5 Total 92,369 117,399 27.1
59
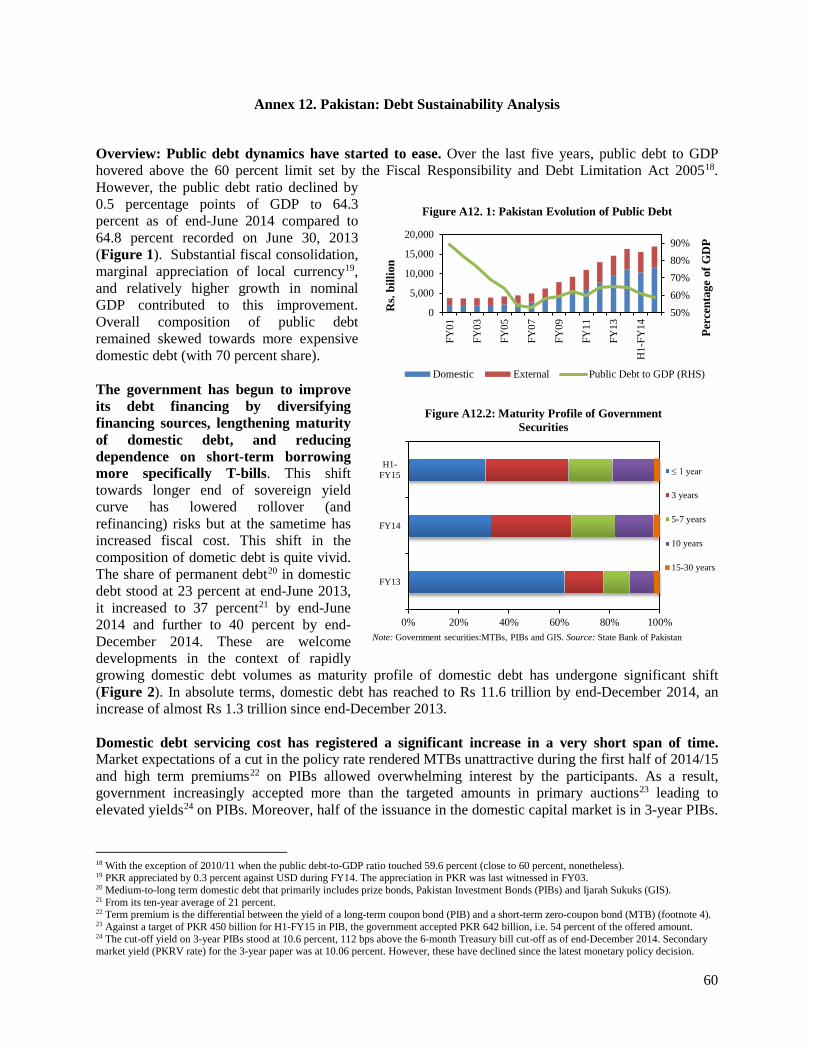
Annex 12. Pakistan: Debt Sustainability Analysis
Overview: Public debt dynamics have started to ease. Over the last five years, public debt to GDP hovered above the 60 percent limit set by the Fiscal Responsibility and Debt Limitation Act 200518. However, the public debt ratio declined by 0.5 percentage points of GDP to 64.3 percent as of end-June 2014 compared to 64.8 percent recorded on June 30, 2013 (Figure 1). Substantial fiscal consolidation, marginal appreciation of local currency19, and relatively higher growth in nominal GDP contributed to this improvement. Overall composition of public debt remained skewed towards more expensive domestic debt (with 70 percent share). The government has begun to improve its debt financing by diversifying financing sources, lengthening maturity of domestic debt, and reducing dependence on short-term borrowing more specifically T-bills. This shift towards longer end of sovereign yield curve has lowered rollover (and refinancing) risks but at the sametime has increased fiscal cost. This shift in the composition of dometic debt is quite vivid. The share of permanent debt20 in domestic debt stood at 23 percent at end-June 2013, it increased to 37 percent21 by end-June 2014 and further to 40 percent by end-December 2014. These are welcome developments in the context of rapidly growing domestic debt volumes as maturity profile of domestic debt has undergone significant shift (Figure 2). In absolute terms, domestic debt has reached to Rs 11.6 trillion by end-December 2014, an increase of almost Rs 1.3 trillion since end-December 2013. Domestic debt servicing cost has registered a significant increase in a very short span of time. Market expectations of a cut in the policy rate rendered MTBs unattractive during the first half of 2014/15 and high term premiums22 on PIBs allowed overwhelming interest by the participants. As a result, government increasingly accepted more than the targeted amounts in primary auctions23 leading to elevated yields24 on PIBs. Moreover, half of the issuance in the domestic capital market is in 3-year PIBs.
18 With the exception of 2010/11 when the public debt-to-GDP ratio touched 59.6 percent (close to 60 percent, nonetheless). 19 PKR appreciated by 0.3 percent against USD during FY14. The appreciation in PKR was last witnessed in FY03. 20 Medium-to-long term domestic debt that primarily includes prize bonds, Pakistan Investment Bonds (PIBs) and Ijarah Sukuks (GIS). 21 From its ten-year average of 21 percent. 22 Term premium is the differential between the yield of a long-term coupon bond (PIB) and a short-term zero-coupon bond (MTB) (footnote 4). 23 Against a target of PKR 450 billion for H1-FY15 in PIB, the government accepted PKR 642 billion, i.e. 54 percent of the offered amount. 24 The cut-off yield on 3-year PIBs stood at 10.6 percent, 112 bps above the 6-month Treasury bill cut-off as of end-December 2014. Secondary market yield (PKRV rate) for the 3-year paper was at 10.06 percent. However, these have declined since the latest monetary policy decision.
50%
60%
70%
80%
90%
0
5,000
10,000
15,000
20,000
FY01
FY03
FY05
FY07
FY09
FY11
FY13
H1-
FY14
Per
cent
age
of G
DP
Rs.
bil
lion
Figure A12. 1: Pakistan Evolution of Public Debt
Domestic External Public Debt to GDP (RHS)
0% 20% 40% 60% 80% 100%
FY13
FY14
H1-FY15
Figure A12.2: Maturity Profile of Government Securities
≤ 1 year
3 years
5-7 years
10 years
15-30 years
Note: Government securities:MTBs, PIBs and GIS. Source: State Bank of Pakistan
60

As a result, the debt servicing cost on permanent debt25 has almost doubled in just a year. Going forward, in order to curtail the fiscal burden as well as alleviate pressures on liquidity management, government needs to set its pre-auction targets strategically and to adhere to those targets.
Banks still remain the prime lender to the government. During the first half of 2014/15, banks held 70 percent of the outstanding PIBs as opposed to a 54 percent share in July-December 2014 (Figure 3). This buildup of long-term liabilities on the banking sector’s financial statements against the short-term nature of their assets (bank deposits) point to a maturity risk currently underlying the domestic banking industry. However, encouragingly, PIBs holding by the non-banks have increased tremendously, by about 80 percent during July-December 2014 as compared in volume to the same period last year.
Significant external debt inflows contributed to an increase in the stock after two years. Pakistan entered into a three year US$ 6.64 billion Extended Fund Facility (EFF) with the IMF in September 2013. This arrangement enabled a healthy flow of multilateral and bilateral monies. Moreover, the dual-tranche US$ 2.0 billion Eurobonds issuance26 in April 2014 and issuance of international sukuks worth US$ 1.0 billion in November 201427 marked two successful ventures for Pakistan in international capital market after a gap of almost a decade.
Table A12.1: DSA: Base case debt projections
(In percent of GDP, unless otherwise indicated)
Actual Projections 2012 2013 2014 2015 2016 2017 2018 2019
Public sector debt 1/ 64.5 64.8 64.3 63.0 62.4 61.3 59.8 58.7
o/w foreign-curr. denominated 2/ 26.0 22.0 20.9 19.9 20.1 19.9 19.8 20.0 Key Macroeconomic and Fiscal Assumptions Real GDP growth (in percent) 3.8 3.7 4.1 4.4 4.6 4.8 5.0 5.1 Inflation rate (in percent, period average) 11.0 7.4 8.6 5.5 5.0 5.0 5.0 5.0 Primary deficit 3/ 4.0 3.6 0.1 0.0 -0.3 -0.6 -1.0 -1.0 Source: World Bank staff estimates 1/ General government gross debt
2/ This includes medium and long term PPG debt as well as short-term external debt. This also includes IMF debt (both budget support and balance of payments support), Foreign currency bonds as well as PSEs non-guaranteed debt.
3/ Includes grants. '-' means a surplus.
25 At the end of December 2014 (H1-FY15), the interest payments on permanent debt rose to PKR 219 billion from a payment of PKR 111 billion at the end of December 2013 (H1-FY14). 26 US$ 1.0 billion each in 5 and 10 years tenors – 5 year bonds at a fixed rate of 7.25 percent (5-year US Treasury rate + 558 basis points) and 10 year bonds at a fixed rate of 8.25 percent (10-yr UST + 556 bps). 27 The issue was priced at 6.75 percent (5-year UST + 517 bps), lower than the (1) 5-year Eurobond issue in April 2014 by 50 bps and (2) initial guidelines of 6.9 percent.
0% 20% 40% 60% 80% 100%
FY12
FY13
FY14
H1-FY14
H1-FY15
Figure A12.3 : Bank and Non-Bank Holdings of Pakistan Investment Bonds
Banks Insurance Cos Funds Corporates/Others
Source: State Bank of Pakistan
61
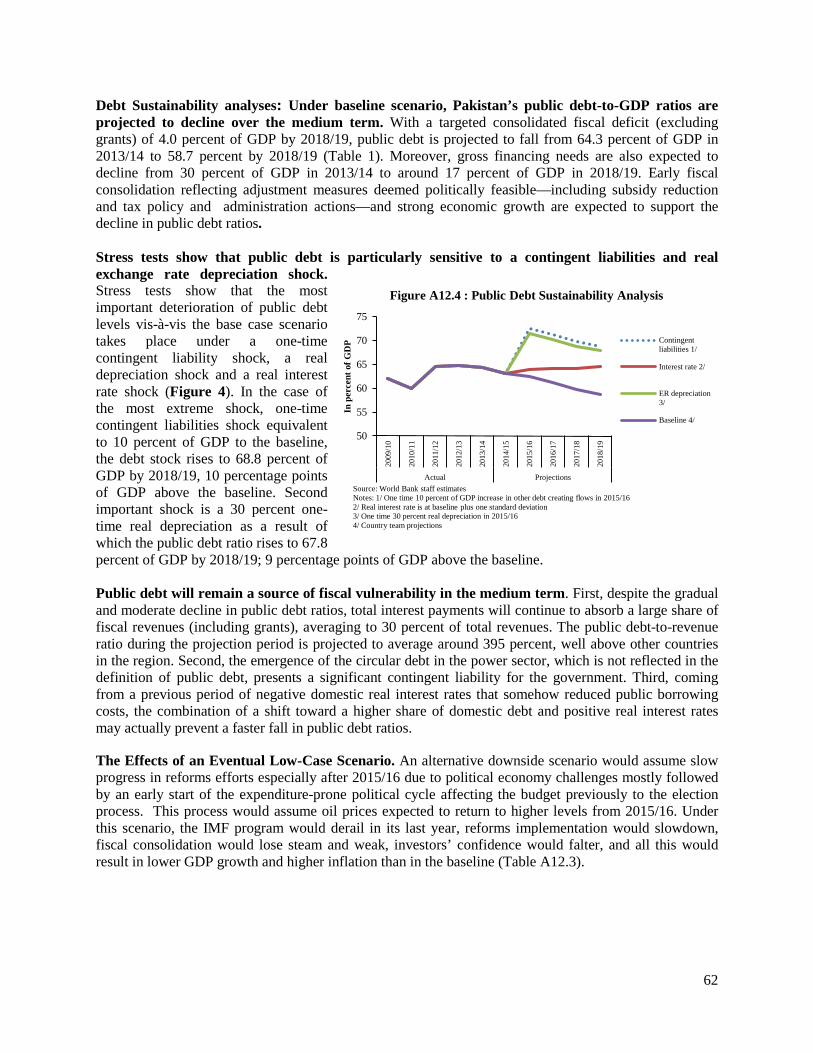
Debt Sustainability analyses: Under baseline scenario, Pakistan’s public debt-to-GDP ratios are projected to decline over the medium term. With a targeted consolidated fiscal deficit (excluding grants) of 4.0 percent of GDP by 2018/19, public debt is projected to fall from 64.3 percent of GDP in 2013/14 to 58.7 percent by 2018/19 (Table 1). Moreover, gross financing needs are also expected to decline from 30 percent of GDP in 2013/14 to around 17 percent of GDP in 2018/19. Early fiscal consolidation reflecting adjustment measures deemed politically feasible—including subsidy reduction and tax policy and administration actions—and strong economic growth are expected to support the decline in public debt ratios. Stress tests show that public debt is particularly sensitive to a contingent liabilities and real exchange rate depreciation shock. Stress tests show that the most important deterioration of public debt levels vis-à-vis the base case scenario takes place under a one-time contingent liability shock, a real depreciation shock and a real interest rate shock (Figure 4). In the case of the most extreme shock, one-time contingent liabilities shock equivalent to 10 percent of GDP to the baseline, the debt stock rises to 68.8 percent of GDP by 2018/19, 10 percentage points of GDP above the baseline. Second important shock is a 30 percent one-time real depreciation as a result of which the public debt ratio rises to 67.8 percent of GDP by 2018/19; 9 percentage points of GDP above the baseline. Public debt will remain a source of fiscal vulnerability in the medium term. First, despite the gradual and moderate decline in public debt ratios, total interest payments will continue to absorb a large share of fiscal revenues (including grants), averaging to 30 percent of total revenues. The public debt-to-revenue ratio during the projection period is projected to average around 395 percent, well above other countries in the region. Second, the emergence of the circular debt in the power sector, which is not reflected in the definition of public debt, presents a significant contingent liability for the government. Third, coming from a previous period of negative domestic real interest rates that somehow reduced public borrowing costs, the combination of a shift toward a higher share of domestic debt and positive real interest rates may actually prevent a faster fall in public debt ratios.
The Effects of an Eventual Low-Case Scenario. An alternative downside scenario would assume slow progress in reforms efforts especially after 2015/16 due to political economy challenges mostly followed by an early start of the expenditure-prone political cycle affecting the budget previously to the election process. This process would assume oil prices expected to return to higher levels from 2015/16. Under this scenario, the IMF program would derail in its last year, reforms implementation would slowdown, fiscal consolidation would lose steam and weak, investors’ confidence would falter, and all this would result in lower GDP growth and higher inflation than in the baseline (Table A12.3).
50
55
60
65
70
75
2009
/10
2010
/11
2011
/12
2012
/13
2013
/14
2014
/15
2015
/16
2016
/17
2017
/18
2018
/19
Actual Projections
In p
erce
nt o
f G
DP
Figure A12.4 : Public Debt Sustainability Analysis
Contingentliabilities 1/
Interest rate 2/
ER depreciation3/
Baseline 4/
Source: World Bank staff estimatesNotes: 1/ One time 10 percent of GDP increase in other debt creating flows in 2015/162/ Real interest rate is at baseline plus one standard deviation3/ One time 30 percent real depreciation in 2015/164/ Country team projections
62

Table A12.2: Key Economic Indicators: Low-Case Scenario
• After falling till 2014/15 inflation would reverse in 2015/16. Given the assumption that Pakistan will enter an early election cycle in 2016/17 means that political considerations would kick in higher public sector expenditures due to higher power subsidies (to a great extent due to the materialization of the contingent liabilities attached to unresolved circular debit problems and to the inability to reduce SOE-generated fiscal losses), fuel consumption and thus inflation 2015/16 onwards. In addition, as the external position weakens (see below) some ensuing exchange rate depreciation pass-through and higher oil prices would reflect in higher prices of imported goods and rapidly rising domestic inflation to double digits.
• Fiscal consolidation would stop. With weaker than expected revenue effort and higher outlays, especially on persistent power subsidies, Government would bring this deficit gradually back up to close to 6 percent in the medium term. Official borrowing required to finance higher deficits would lead public debt to start growing again and the improvement of its ratio to GDP in FY17/18 (64.2 percent) would become marginal with respect to FY13/14 (64.3 percent).
• The external current account would register a relatively larger deficit post 2015/16. Higher exchange rate volatility emanating from a relatively weaker macroeconomic position and the slowdown in reforms, post 2014/15, would dampen export dynamism. Fuelled consumption would support higher imports and a higher current account deficit. Resulting import coverage (months of reserves sufficient to cover next year’s imports of goods and services) would gradually decrease below the minimum cushion of 3 months of imports mainly due to the financing of increasingly higher current account deficits. This would bring the external position back to a highly vulnerable position.
2009/10 2010/11 2011/12 2012/13 2013/14 2014/15 2015/16 2016/17 2017/18
Output and Prices
Real GDP at factor cost 2.6 3.6 3.8 3.7 4.1 4.4 4.0 3.5 3.0
Consumer Prices (period average) 10.1 13.7 11.0 7.4 8.6 5.5 7.0 8.5 10.5
Balance of Payments
Current Account Balance (as % of GDP) (2.2) 0.1 (2.1) (1.1) (1.3) (1.2) (1.5) (1.8) (2.0)
Exports of goods & services 14.0 14.6 13.2 13.6 12.3 11.3 11.0 10.9 10.8
Imports of goods & services 21.5 20.4 21.7 20.9 20.1 18.7 18.9 19.0 18.5
Remittances 5.0 5.2 5.9 6.0 6.4 6.3 6.1 6.0 5.8
Public Finance
Revenues and Grants 14.3 12.6 13.2 13.4 15.1 14.9 14.7 14.6 14.5
Expenditures 20.2 19.3 21.6 21.4 19.8 19.5 19.7 19.9 20.1
of which: Current 16.5 16.7 18.2 16.3 15.8 16.2 16.4 16.4 16.5
Overall Fiscal Balance 2/ (6.2) (6.9) (8.8) (8.2) (5.5) (4.9) (5.2) (5.5) (5.7)
Total Public Debt (incl. obligation to IMF) 62.0 60.0 64.5 64.8 64.3 63.0 63.5 63.9 64.2
Memorandum:
GDP at Market price (in billion Pakistan Rupees) 14,867 18,276 20,047 22,489 25,402 28,081 30,371 33,078 36,202
Notes:
1/ Excluding gold and foreign currencu deposits of commercial banks held with the State Bank of Pakistan.
2/ Excluding grants.
Source: World Bank Staff estimates
Projections
63

Annex 13. Public Financial Management and Procurement
Pakistan has a fairly well-developed infrastructure for public financial management (PFM). At the policy level, Parliament has a key role in authorizing revenues, expenditures, and debts. The MOF plays a pivotal role in budget preparation and expenditure control. Line ministries, departments, and agencies have well-defined roles in implementing budgets and rendering accounts. The Controller General of Accounts prepares annual financial statements. PFM benefits from a comprehensive financial information system, which is now the core fiscal and financial management system of government. The government has established a sound legal framework for coordinating fiscal and debt management policies and for improving fiscal transparency through the Fiscal Responsibility and Debt Limitation Act of 2005. The Public Expenditure and Financial Accountability (PEFA) 2012 scores compare very favorably with other countries in the South Asia region (see Figure A13.1 below).
Figure A13.1 PEFA Assessment Scores for South Asia
Note: South Asia countries include Afghanistan (2008), Bangladesh (2006), Nepal (2008), Bhutan and India (2010), and Maldives (2009).
The financial statements of SBP for the financial year ended 30 June 2013 were audited and the auditors gave an unqualified opinion on the statements concluding that the statements gave a true and fair view of the financial position, financial performance, and cash flows. An IMF Safeguards Assessment of the SBP was issued on March 27 2009 and an update report was also produced on March 3 2010. A further update report was produced by the IMF on December 16, 2013. All three of these Safeguards Assessment reports have been reviewed by the World Bank. The review identified that some of the recommendations, such as improving internal operations and adoption of International Financial Reporting Standards as a Financial Reporting Framework has been met. Further, the remedial action are planned for the rest, and duly monitored by the IMF. However, further improvements of internal controls and foreign exchange reserve management are still in progress.
Information in budget documents is comprehensive and budget documents are available to the general public. The improvement in the Open Budget Survey score for 2012 from 38 to 58 reflects this. Implementation of the Integrated Financial Management Information System is based on the Government Finance Statistics-compliant chart of accounts at all levels of government has facilitated budget tracking down to the third tier and preparation of timely reliable financial reports. The System facilitates submission of annual financial statements for audit within two months of the close of the financial year and monthly financial reports are finalized within 10–15 days after the close of the month. Audit reports are presented to the legislature within eight months of the close of the financial year.
Despite progress in many areas of PFM, the latest federal and subnational PEFA reports show some areas of concern. The internal control system is largely based on rules and regulations issued by
0
1
2
3
4
5
PI-1
PI-2
PI-3
PI-4
PI-5
PI-6
PI-7
PI-8
PI-9
PI-1
0PI
-11
PI-1
2PI
-13
PI-1
4PI
-15
PI-1
6PI
-17
PI-1
8PI
-19
PI-2
0PI
-21
PI-2
2PI
-23
PI-2
4PI
-25
PI-2
6PI
-27
PI-2
8
Aver
age
PEFA
con
vert
ed sc
ore
Federal South Asia
64

the MOF, which are quite elaborate. However, instances of noncompliance with rules and regulations have been reported by the Auditor General of Pakistan. It is therefore of particular concern that no progress has been made on internal audit in recent years. The internal audit function is assigned as a responsibility of chief finance and accounting officers, but has not yet been developed as an administrative operating function. Progress in legislative oversight has also been mixed across federal and provincial governments, largely due to the absence of functioning public accounts committees in some provinces. The scrutiny of audit reports by the most recent federal committee, however, was extensive and succeeded in addressing a large backlog of audit reports to be reviewed.
Improving PFM capacity at provincial and lower tiers has emerged as a key challenge. The capacity to plan, manage, implement and account for results of policies and programs is critical for achieving development objectives. With the 18th Amendment to the Constitution (April 2010), the majority of service delivery–related functions have devolved to the provinces. The government realizes the need to strengthen its PFM systems by addressing the capacity of provincial institutions, processes, and individuals to use resources well. This is supported by findings of recent subnational PEFA assessments that have highlighted the scope for improving capacity to manage provincial finances. Weaknesses are somewhat mitigated by the consolidation of current PFM reforms which include nationwide automation of budgeting, accounting, and financial reporting; modernization of auditing practices; and adoption of medium-term budgetary frameworks.
Procurement
A strong public procurement system enhances the efficiency of budgetary expenditure. Typically for a developing country 15-20 percent of annual GDP is related to procurement contracts. Pakistan should be no exception. In Pakistan, procurement is a devolved subject. The Public Procurement Regulatory Authority (PPRA) at the federal and provincial levels is mandated to regulate procurement function and act as respective custodians of the regulatory frameworks. PPRAs are functional at the federal level, in Sindh and in the Punjab; with laws enacted, rules notified. In Khyber Pakhtunkhwa, however, the PPRA is at a nascent stage, law has been enacted and rules are yet to be notified. Baluchistan enacted procurement regulations in 2009 but are yet to implement it in earnest. Recently the National Procurement Strategy has been developed which highlights the need of harmonization amongst the various PPRAs. The Bank is supporting the PPRAs in developing the e-procurement strategy, as well as preparing a training strategy for procurement staff. The Sindh and Punjab PPRAs are also working towards developing their M&E systems. Federal and provincial regulations are also a good support in enhancing transparency and thus accountability of public expenditures.
While the good aspects of the regulatory regime that assures competitiveness may be diluted by gaps in implementation, there are certain SROs or Import Policy Orders (IPOs) or legal interpretations which overlap with the procurement function. Government has been engaged in a discussion with development partners on SRO 827(I)/2001 and SRO 809/I/86 that limit competition by making local participation in goods procurements compulsory. The review may cover SROs/directives and any other instructions having such implications, in order to facilitate equal opportunity and adequate support to local industry. A study is also deemed beneficial to review the overlapping jurisdiction of the various accountability and other institutions on procurement function, specifically in view of the 18th amendment, which may imply double/uneven taxation to bidders incorporated in different provinces. On privatization, governing regulations are: (i) Privatization Commission (Hiring of Financial Advisors) Regulations, 2007; and (ii) Privatization Commission (Hiring of Valuators) Regulations, 2001 amended in 2007. These regulations are framed under Section 41 of PC Ordinance 2000. In a letter to Transparency International in 2009 PC clarified the jurisdiction of Public Procurement Rules 2004 (PPR-2004). As the privatization process is about ‘selling’ rather than ‘acquiring’ assets it is not a considered as a procurement activity as defined by Section 2 (l) of Public Procurement Regulatory Authority Ordinance, 2002.
65

Annex 14. Analytical and Advisory Activities: Major Findings and Recommendations
DPC Focus Areas AAA work Key Recommendations
Growth Enhancing framework
Finding the Path to Job-Enhancing Growth - Country Economic Memorandum (FY13) considers reform choices for Pakistan (piecemeal or comprehensive), for its transformational agenda leading to job-enhancing growth.
1. Pakistan needs to create more productive jobs—with jobs defined to include all wage work and self-employment, formal or informal—for a reliable route to move away from poverty, crime, and civil conflict. Rapid growth and more and better jobs should be pursued in tandem for sustainability. In this regard, the report suggests a menu of reforms with political economy analysis.
2. A bold agenda is the only way to achieve the economy’s potential, and to reach high, sustained and inclusive rates of growth. 3. Stabilization itself is a necessary but not sufficient condition for growth acceleration. Instead the country must address its main constraints to growth: power
shortages, low savings and investments, business governance constraints and low openness. Expanding Social Protection and Mobilizing Revenue
Policy note: Mobilizing Revenue (2013) reviews key shortcomings in Pakistan’s revenue mobilization system and provides directions for its revitalization.
4. Proposed reforms include eliminating exemptions and zero rates, adjusting income tax rates, simplifying tariffs, expanding user-friendly electronic registration and filing, zero-tolerance policy for noncompliance and evasion, and overhauling the technical capacity and accountability of the administration, especially in information technology systems, auditing, and enforcement. The provincial level policy reforms include broadening the tax base/improving collections (from GST on services, motor vehicle tax, and property tax), incentivizing tax collection, and enhancing the capacity of tax administration.
Policy note: Promoting Efficient Service Delivery with Decentralization (2013) identifies key reasons for the failure of decentralization in Pakistan, and suggests policy reforms for positive impact on social outcomes.
1. There is a role for local governments in municipal and other local services, while devolving other key provincial services like health and education to autonomous provincial authorities. For the financial sustainability of devolved functions there is need for improved revenue efforts by the federal and provincial governments and maintenance of fiscal discipline by the provinces.
Policy note: Improving Financial Management (2013) outlines Pakistan’s challenges in Public financial management and suggests options for meeting them.
2. A second generation of reforms is to be introduced that focuses on decentralizing budget management (preparation and implementation to the line departments), strengthening cash management through business process reengineering, and augmenting the capacity of procurement regulatory authorities.
Khyber Pakhtunkhwa, Public Expenditure Review report (2012) analyzes overall budgetary, fiscal and financial management system for improving delivery of social services and quality of life.
1. Other than increasing its tax revenues, the province needs to analyze sustainability of current expenditure and its relevance to service delivery, improve human resource for development activities, avoid thin-spreading of funds over large number of projects, and enforce budget constraints favoring project completion. Linking expenditure and learning outcomes, and removing demand side barriers for greater access to social services are important.
Punjab Social Sector Public Expenditure Review report (2013) provides strengths and weaknesses of provincial government’s expenditure and financial management.
1. The efficiency and effectiveness of social spending require substantial improvements. The government needs to make additional efforts to remove the lingering limitations from the fiscal and financial management systems, as well as effectively and innovatively tackle the sectoral impediments with support from private sector investment.
Education and gender sectors: Policy note: Expanding Access to Quality Education (2013) reviews main reasons for disparities between provinces on access to quality education and low outcomes.
1. The main contributing factors include poor teacher quality and accountability, inadequate and inefficient funding, and weak management and governance. Post-18th Amendment, the provinces are responsible for management and financing of education, but Federal government also needs to set national standards and monitor their achievements to address disparities in access to quality education between provinces.
Pakistan Gender Policy Notes (FY13) makes suggestions to mainstream gender into education sector at provincial level.
1. Greater investment is to be made in education, particularly for girls in rural areas. There is need for province specific research and analysis and thus the role of academia, CSOs, and national machineries for women.
Health sector: Cost-effectiveness and financial consequences of new vaccine introduction in Pakistan (FY12)
2. While the investment in vaccine (pneumococcal (PCV-10), rotavirus (Rota-Teq), and Homophiles influenza type B (Hib)) would be worthwhile from an economic perspective, introducing all three vaccines in Pakistan will present financial challenges unless overall health spending increases. Careful consideration needs to be given to long-term financing after GAVI support ends.
Expanded program on immunization in Pakistan: recommendations for improving performance (FY12).
1. Increasing focus on supervision, monitoring and evaluation, (ii) performance-based incentives, (iii) partnerships with the private sector, (iv) expediting polio eradication initiatives, (v) improved management, (vi) targeted capacity development, (vii) targeting age group for immunization, (viii) a human resource strategy and implementation plan, and (x) improving planning at the local level.
Protecting Pakistan’s Poor Against Health Shocks in Disasters (FY13) assess the impact of 2010-floods on health status and access
2. Provincial Health Emergency Preparedness and Response Unit has been constituted to adopt a policy of preparedness for different disasters and their health consequences by effectively managing the risks and impact of natural and complex catastrophes affecting humans.
Social protection: Policy note: Consolidating Social Protection (2013) considers providing appropriate, adequate and predictable benefits to the poor, through a sound and financially viable system.
1. BISP can be further improved through partnership arrangement between federal and provincial governments for social protection (SP) service delivery; establishing a national SP framework that is coherent between federal and provincial authorities; harmonized system for design and delivery of above framework; and financing for SP based on affordability and efficiency principles. Enabling effective post-disaster early recovery cash transfers as part of disaster response action plan is also needed.
Social Safety Nets in Pakistan: Protecting and Empowering the Poor and Vulnerable (FY12) provides an assessment of Pakistan’s recent social safety net programs and suggests a road-map /recommendations for improvement.
1. The household poverty survey database can be used to target other human development or employment services programs. Further modernization of the sector would require: (i) using available resources effectively (establishing central bodies with responsibility for SP in provincial governments, implementing graduation programs, integrating the disaster response mechanisms and safety net institutions); (ii) responding to household-level crises (households insurance against the negative effects of catastrophic illness); and (iii) instituting regular monitoring mechanisms and improving program design over time.
Impact Evaluation of SSN Programs (FY14, ongoing): Short Term Impacts of the BISP Unconditional Cash Transfer.
1. The main findings of the report are: (i) the low benefit level and irregular payments of the BISP cash transfer are diluting the program impact on beneficiaries’ consumption; (ii) the program has positive impact on women empowerment, and (iii) the impact evaluation did not find evidence that BISP would produce ‘dependency’ or work disincentive effects.
66

DPC Focus Areas AAA work Key Recommendations
Labor Supply and Vulnerability in Pakistan (FY14, ongoing) aims to inform Bank lending in designs of poverty – exit / graduation projects that utilize BISP poverty scorecard database.
2. Improve the information/data base for analyzing these important development challenges, through fielding an Employment and Skills Survey. Limited capacity building will be carried out as part of this work, through (i) close collaboration with a local survey firm in the design and implementation of the employment and skills survey, including the training of master-trainers who would be tasked to train the interview teams; and (ii) commissioning papers to local researchers.
Reinvigorating State Owned Enterprises Reform
SOE Reforms – Technical Assistance (FY14, ongoing) is for helping develop and implement a strategic framework for SOE reforms.
1. The legal framework and institutional mechanisms for investment tracking and performance management of state-owned enterprises (SOEs) are weak. Corporate governance needs to be strengthened within SOEs by (i) making the board nomination process structured and transparent, (ii) improving board accountability, and (iii) developing performance contracts and indicators.
Reforming SOEs – Pakistan Policy Notes (FY13) a menu of policy choices for the Government.
2. Emphasizing the urgency of SOE reforms (including commercializing SOEs), main recommendations are to curtail fiscal costs, professionalize the role of the government as owner, and improve corporate governance and accountability in state enterprises.
SOE Reform: Time for Serious Corporate Governance (FY12) corporate governance is at the top of the 'constraints to economic growth
3. Improve the efficiency and effectiveness of SOEs, which include basic governance reforms, revamped commercialization processes and enhanced market regulations. The paper also provided perspectives on international experiences with SOE reforms combined with some suggestions on how the Government can move forward.
Improving Investment Climate Promote Access to
Policy note: Reinvigorating the Agenda for Open Trade (2013) measures to improve Pakistan’s trade performance for growth and jobs creation.
4. To improve its trade competitiveness and its place in international markets, Pakistan needs to simplify tariffs and trade regulations (to reduce the anti-export bias); accelerate deep preferential trade agreements to encourage trade creation; fully normalize trade relations with India to benefit from growth there; and address logistical weaknesses to reduce trade costs.
Doing Business in Pakistan (FY11) provides analysis of seven DB indicators in 13 districts across the country.
5. It would help generate Doing Business (DB) reform agenda at the provincial and Federal levels, as it provides a monitoring and evaluation framework to measure progress in the implementation of such reforms. The report highlights potential good practice on investment climate reform within Pakistan which can be adopted by other jurisdictions.
Doing Business Follow-up Reform Memos (FY12). 6. District-specific reform memos were prepared and disseminated for Gujranwala, Sialkot and Rawalpindi covering three DB indicators: starting a business, construction permits, and trading across borders.
A Blueprint for Business Registration Reform through a One-Stop-Shop (FY13 ongoing). Steps for OSS business registration implementation.
7. Implement integration of business registration processes through a virtual one-stop-shop (OSS) mechanism, by consolidating and streamlining key processes of SECP, FBR and EOBI for corporates in the first stage, and later setting up a physical OSS in one district before scaling it up and rolling it across Pakistan.
Pakistan FSAP Update 8. Diagnoses vulnerabilities and analyzed development priorities in the financial sector (banking sector, securities/capital markets, and financial inclusion related issues), while supporting a coordinated dialogue with national authorities, and enhanced effective collaboration between the Bank and the Fund.
Consumer Protection & Financial Literacy Diagnostic Assessment (FY13, ongoing) on consumer protection and financial literacy
9. Assessment of the legal, regulatory and institutional frameworks for financial consumer protection compared to international best practice benchmarks, covering the banking, insurance, microfinance, and securities sectors. The Micro Insurance Rules recently drafted by SECP include a Code on Consumer Protection.
Are Pakistan's Women Entrepreneurs Being Served by the Microfinance Sector? Report (FY13)
10. The report focused on products, services, policies, and other elements of the business model of microfinance in Pakistan that affect both demand for and access to microfinance by women borrowers, some of whom fall into the narrower category of entrepreneurs. The report documents consumer protection issues (giving loans to male household members despite women being a better potential customer with high return rate), and highlights a very low proportion of female entrepreneurs as microfinance clients.
NLTA - A New Generation of Women Entrepreneurs in Pakistan (FY14-FY15) is to help selected women entrepreneurs grow their businesses in measurable and replicable manner.
11. Pilot intervention on an entrepreneurial microcosm for a selected group of businesswomen operating micro and small firms in Pakistan. 12. This pilot program will incorporate a packaged approach including: mentoring and networking support, access to more appropriate financial services, and
building and enhancing relevant business skills. Trade Finance – Knowledge Product (FY14) identifies constraints and opportunities to expand access to trade finance for the private sector.
13. Domestic and international trade finance mechanisms to (ii) identify whether there are potential opportunities to expand access to trade finance; and (iii) provide an informed assessment of whether undertaking the necessary reforms and investments would likely have a measurable impact for exporters, potential exporters, suppliers to exporters, and/or specific industries.
67

Annex 15. Country at a Glance
Pakistan at a glance 1/9/15
LowerKey Development Indicators South middle
Pakistan Asia income(2013)
Population, mid-year (millions) 182.1 1,649 2,507Surface area (thousand sq. km) 796 5,131 20,742Population growth (%) 1.7 1.3 1.5Urban population (% of total population) 37 31 39
GNI (Atlas method, US$ billions) 247.0 2,370 4,745GNI per capita (Atlas method, US$) 1,360 1,437 1,893GNI per capita (PPP, international $) 2,880 3,503 3,877
GDP growth (%) 4.4 4.9 4.7GDP per capita growth (%) 2.7 3.5 3.2
(most recent estimate, 2005–2012)
Poverty headcount ratio at $1.25 a day (PPP, %) 21 31 27.1Poverty headcount ratio at $2.00 a day (PPP, %) 60 67 56.3Life expectancy at birth (years) 66 67 66Infant mortality (per 1,000 live births) 69 47 46Child malnutrition (% of children under 5) 31 32 24
Adult literacy, male (% of ages 15 and older) 69 73 80Adult literacy, female (% of ages 15 and older) 40 50 62Gross primary enrollment, male (% of age group) 99 111 107Gross primary enrollment, female (% of age group) 86 109 104
Access to an improved water source (% of population) 91 91 88Access to improved sanitation facilities (% of population) 48 40 47
Net Aid Flows 1980 1990 2000 2013 a
(US$ millions)Net ODA and official aid 1,181 1,127 703 2,019Top 3 donors (in 2012): United States 42 167 88 625 United Kingdom 44 54 24 300 Japan 112 194 280 256
Aid (% of GNI) 4.6 2.7 1.0 0.9Aid per capita (US$) 15 10 5 11
Long-Term Economic Trends
Consumer prices (annual % change) .. 9.7 3.6 7.4GDP implicit deflator (annual % change) 9.1 6.5 24.9 7.4
Exchange rate (annual average, local per US$) 9.9 21.4 51.7 96.8Terms of trade index (2000 = 100) .. 102 100 55
1980–90 1990–2000 2000–13
Population, mid-year (millions) 80.0 111.1 143.8 182.1 3.3 2.6 1.8GDP (US$ millions) 23,690 40,010 73,952 232,287 6.3 3.8 4.2
Agriculture 29.5 26.0 25.9 25.1 4.0 4.4 3.1Industry 24.9 25.2 23.3 21.1 7.7 4.1 5.5 Manufacturing 15.9 17.4 14.7 13.0 8.1 3.8 6.3Services 45.6 48.8 50.7 47.8 6.8 4.4 4.9
Household final consumption expenditure 83.1 73.8 75.4 81.2 4.3 4.9 4.0General gov't final consumption expenditure 10.0 15.1 8.6 11.0 10.3 0.7 7.3Gross capital formation 18.5 18.9 17.2 14.6 5.8 1.8 2.4
Exports of goods and services 12.5 15.5 13.4 13.2 8.4 1.7 4.8Imports of goods and services 24.1 23.4 14.7 19.9 2.1 2.5 4.1Gross savings .. .. .. 14.1
Note: Figures in italics are for years other than those specified. .. indicates data are not available.a. Aid data are for 2012.
Development Economics, Development Data Group (DECDG).
(average annual growth %)
(% of GDP)
10 5 0 5 100-4
15-19
30-34
45-49
60-64
75-79
percent of total population
Age distribution, 2012
Male (..) Female (..)
0
20
40
60
80
100
120
140
160
1990 1995 2000 2012
Pakistan South Asia
Under-5 mortality rate (per 1,000)
-4
-2
0
2
4
6
8
10
95 05
GDP GDP per capita
Growth of GDP and GDP per capita (%)
68

Pakistan
Balance of Payments and Trade 2000 2013
(US$ millions)Total merchandise exports (fob) 8,191 24,795Total merchandise imports (cif) 9,602 40,226Net trade in goods and services -2,275 -16,903
Current account balance -217 -2,496 as a % of GDP -0.3 -1.1
Workers' remittances and compensation of employees (receipts) 1,075 14,007
Reserves, including gold 1,510 7,198
Central Government Finance
(% of GDP)Current revenue (including grants) 13.7 13.3 Tax revenue 10.2 9.8Current expenditure 16.7 16.3
Technology and Infrastructure 2000 2012Overall surplus/deficit -5.3 -8.1
Paved roads (% of total) 56.0 72.6Highest marginal tax rate (%) Fixed line and mobile phone Individual 30 20 subscribers (per 100 people) 2 70 Corporate 35 35 High technology exports
(% of manufactured exports) 0.4 1.7External Debt and Resource Flows
Environment(US$ millions)Total debt outstanding and disbursed 32,954 56,459 Agricultural land (% of land area) 35 34Total debt service 2,864 9,347 Forest area (% of land area) 2.7 2.1Debt relief (HIPC, MDRI) – – Terrestrial protected areas (% of land area) 10.2 10.7
Total debt (% of GDP) 44.6 24.3 Freshwater resources per capita (cu. meters) 367 312Total debt service (% of exports) 26.8 20.4 Freshwater withdrawal (% of internal resources) 313.8 333.6
Foreign direct investment (net inflows) 308 .. CO2 emissions per capita (mt) 0.74 0.93Portfolio equity (net inflows) 35 ..
GDP per unit of energy use (2005 PPP $ per kg of oil equivalent) 4.2 4.9
Energy use per capita (kg of oil equivalent) 445 482
World Bank Group portfolio 2000 2012
(US$ millions)
IBRD Total debt outstanding and disbursed 3,093 1,486 Disbursements 159 78 Principal repayments 227 160 Interest payments 182 16
IDA Total debt outstanding and disbursed 3,828 11,136 Disbursements 141 555
Private Sector Development 2000 2012 Total debt service 93 295
Time required to start a business (days) – 21 IFC (fiscal year)Cost to start a business (% of GNI per capita) – 9.9 Total disbursed and outstanding portfolio 718 685Time required to register property (days) – 50 of which IFC own account 455 648
Disbursements for IFC own account 2 92Ranked as a major constraint to business 2000 2012 Portfolio sales, prepayments and (% of managers surveyed who agreed) repayments for IFC own account 52 40 n.a. 47.5 .. n.a. 46.0 .. MIGA
Gross exposure 111 237Stock market capitalization (% of GDP) 8.9 19.5 New guarantees 0 149Bank capital to asset ratio (%) 4.9 9.6
Note: Figures in italics are for years other than those specified. 1/9/15.. indicates data are not available. – indicates observation is not applicable.
Development Economics, Development Data Group (DECDG).
0.0 25.0 50.0 75.0 100.0
Control of corruption
Rule of law
Regulatory quality
Polit ical stability
Voice and accountability
Country's percentile rank (0-100)higher values imply better ratings
2012
2000
Governance indicators, 2000 and 2012
Source: Worldw ide Governance Indicators (www.govindicators.org)
IBRD, 1,486IDA, 11,136
IMF, 7,684
Other multi-lateral, 12,480
Bilateral, 17,905
Private, 8,578
Short-term, 2,598
Composition of total external debt, 2012
US$ millions
69

Millennium Development Goals Pakistan
With selected targets to achieve between 1990 and 2015(estimate closest to date shown, +/- 2 years)
Goal 1: halve the rates for extreme poverty and malnutrition 1990 1995 2000 2012 Poverty headcount ratio at $1.25 a day (PPP, % of population) 64.7 48.1 29.1 21.0 Poverty headcount ratio at national poverty line (% of population) .. .. 30.6 12.4 Share of income or consumption to the poorest qunitile (%) 8.1 10.0 8.7 9.6 Prevalence of malnutrition (% of children under 5) 39.0 34.2 31.3 30.9
Goal 2: ensure that children are able to complete primary schooling Primary school enrollment (net, %) .. .. 56 72 Primary completion rate (% of relevant age group) .. .. .. 72 Secondary school enrollment (gross, %) 21 .. .. 37 Youth literacy rate (% of people ages 15-24) .. .. 55 71
Goal 3: eliminate gender disparity in education and empower women Ratio of girls to boys in primary and secondary education (%) 50 .. .. 82 Women employed in the nonagricultural sector (% of nonagricultural employment) 8 9 13 13 Proportion of seats held by women in national parliament (%) 10 2 21 23
Goal 4: reduce under-5 mortality by two-thirds Under-5 mortality rate (per 1,000) 138 126 112 86 Infant mortality rate (per 1,000 live births) 106 97 88 69 Measles immunization (proportion of one-year olds immunized, %) 50 47 59 83
Goal 5: reduce maternal mortality by three-fourths Maternal mortality ratio (modeled estimate, per 100,000 live births) 400 330 280 190 Births attended by skilled health staff (% of total) 19 18 23 49 Contraceptive prevalence (% of women ages 15-49) 15 18 28 29
Goal 6: halt and begin to reverse the spread of HIV/AIDS and other major diseases Prevalence of HIV (% of population ages 15-49) 0.1 0.1 0.1 0.1 Incidence of tuberculosis (per 100,000 people) 231 231 231 231 Tuberculosis case detection rate (%, all forms) 61 5 3 65
Goal 7: halve the proportion of people without sustainable access to basic needs Access to an improved water source (% of population) 85 87 88 91 Access to improved sanitation facilities (% of population) 27 32 37 48 Forest area (% of land area) 3.3 3.0 2.7 2.1 Terrestrial protected areas (% of land area) 10.1 10.1 10.2 10.7 CO2 emissions (metric tons per capita) 0.6 0.7 0.7 0.9 GDP per unit of energy use (constant 2005 PPP $ per kg of oil equivalent) 4.2 4.2 4.2 4.9
Goal 8: develop a global partnership for development Telephone mainlines (per 100 people) 0.8 1.7 2.1 3.2 Mobile phone subscribers (per 100 people) 0.0 0.0 0.2 67.1 Internet users (per 100 people) 0.0 0.0 1.3 10.0 Households with a computer (%) .. .. .. 12.5
Note: Figures in italics are for years other than those specified. .. indicates data are not available. 1/9/15
Development Economics, Development Data Group (DECDG).
Pakistan
0
25
50
75
100
2000 2005 2010
Primary net enrollm ent ratio
Ratio of girls to boys in pr ima ry & secondaryeducation
Education indicators (%)
01020304050607080
2000 2005 2010
Fixed + mob ile subscribers
Internet users
ICT indicators (per 100 people)
0
25
50
75
100
1990 1995 2000 2012
Pakistan South Asia
Measles immunization (% of 1-year olds)
70

Map Section
71