document of the world bankdocuments.worldbank.org/curated/en/803501468296447… · ·...
TRANSCRIPT

Document of The World Bank
Report No: ICR0000606
IMPLEMENTATION COMPLETION AND RESULTS REPORT (IBRD-71180 JPN-52836)
ON A
LOAN
IN THE AMOUNT OF US$100.0 MILLION
TO THE
REPUBLIC OF THE PHILIPPINES
FOR A
SECOND SOCIAL EXPENDITURE MANAGEMENT PROJECT
April 29, 2008
Human Development Sector Unit East Asia and Pacific Region
Pub
lic D
iscl
osur
e A
utho
rized
Pub
lic D
iscl
osur
e A
utho
rized
Pub
lic D
iscl
osur
e A
utho
rized
Pub
lic D
iscl
osur
e A
utho
rized
Pub
lic D
iscl
osur
e A
utho
rized
Pub
lic D
iscl
osur
e A
utho
rized
Pub
lic D
iscl
osur
e A
utho
rized
Pub
lic D
iscl
osur
e A
utho
rized

CURRENCY EQUIVALENTS
(Exchange Rate Effective 10/23/2007) Currency Unit = PHP PHP 1.00 = US$ 0.02 US$ 1.00 = PHP 44
FISCAL YEAR July 1 – June 30
ABBREVIATIONS AND ACRONYMS
BACs Bids and Awards Committees LAN Local Area Network BEIS Basic Education Information System LGU Local Government Unit BFAD Bureau of Food and Drugs MIS Management Information System CAS Country Assistance Strategy MOU Memorandum of Understanding CIDSS Comprehensive and Integrated Delivery of
Social Services NCAs National Cash Allotments
COA Commission on Audit NCB National Competitive Bidding CSOs Civil Society Organizations NPS National Program Support CY Calendar Year PDF Participatory Development Fund DBM Department of Budget and Management PDO Project Development Objectives DepEd Department of Education PETS Public Expenditure Tracking Survey DALY Disability Adjusted Life Year PMUs Project Management Units DOH Department of Health PTCA Parent-Teacher Community Associations DOTS Directly Observed Treatment, Short Course SBP School Building Program DPL Development Policy Loan SBRMS School-Based Repair and Maintenance
Scheme DPWH Department of Public Works and Highways SEMP1 Social Expenditure Management Project DSWD Department of Social Welfare and
Development SEMP2 Second Social Expenditure Management
Project eNGAS Electronic Government Accounting System SOE Statement of Expenditure EPI Expanded Program for Immunization TB Tuberculosis FHSIS Field Health Services Information System TEEP Third Elementary Education Project FM Financial Management FMRs Financial Management Reports UNICEF United Nations Children’s Fund GOP Government of Philippines USAID United States Agency for International
Development ICB International Competitive Bidding WAN Wide Area Network ICT Information and Communication
Technologies WB World Bank
IQR Inter-quartile ratios WHO World Health Organization IT Information Technology
Vice President: James Adams (EAPVP) Country Director: Bert Hofman (EACPF)
Sector Manager: Fadia Saadah (EASHD) Project Team Leader: Timothy Johnston (EASHD)
ICR Team Leader: Timothy Johnston (EASHD)
PHILIPPINES SECOND SOCIAL EXPENDITURE MANAGEMENT PROJECT
CONTENTS
Data Sheet
A. Basic Information B. Key Dates C. Rating Summary D. Sector and Theme Codes E. Bank Staff F. Results Framework Analysis G. Ratings of Project Performance in ISRs H. Restructuring (if any) I. Disbursement Profile 1. Project Context, Development Objectives and Design............................................... 12. Key Factors Affecting Implementation and Outcomes .............................................. 63. Assessment of Outcomes ............................................................................................ 94. Assessment of Risk to Development Outcome......................................................... 235. Assessment of Bank and Borrower Performance ..................................................... 246. Lessons Learned ....................................................................................................... 267. Comments on Issues Raised by Borrower/Implementing Agencies/Partners .......... 28Annex 1. Project Costs and Financing.......................................................................... 29Annex 2. Outputs by Component and Revised Key Performance Indicators............... 30Annex 3. Economic and Financial Analysis................................................................. 34Annex 4. Bank Lending and Implementation Support/Supervision Processes ............ 45Annex 5. Summary of Borrower's ICR......................................................................... 47Annex 6: Summary of ICR Stakeholder Workshop Report ........................................ 51Annex 7: Summary of “Impact Study on the Localization of CIDSS” ....................... 56Annex 8: School Building Program (SBP) – summary of evaluation findings ........... 59Annex 9. Experience and lessons from textbook procurement and distribution ......... 63Annex 10. List of Supporting Documents .................................................................... 66MAP IBRD 35773 ........................................................................................................ 68

i
A. Basic Information Country: Philippines Project Name:
2nd Social Expenditure Management
Project ID: P069916 L/C/TF Number(s): IBRD-71180,JPN-52836
ICR Date: 04/29/2008 ICR Type: Core ICR
Lending Instrument: SIM Borrower: REPUBLIC OF THE PHILIPPINES
Original Total Commitment:
USD 100.0M Disbursed Amount: USD 100.0M
Environmental Category: C Implementing Agencies: Department of Health Department of Social Welfare and Development Department of Education Department of Public Works and Highways Cofinanciers and Other External Partners: B. Key Dates
Process Date Process Original Date Revised / Actual Date(s)
Concept Review: 06/08/2001 Effectiveness: 12/11/2002 12/11/2002 Appraisal: 03/09/2002 Restructuring(s): Approval: 06/04/2002 Mid-term Review: March 15, 2004 n.a. Closing: 12/31/2005 06/30/2007 C. Ratings Summary C.1 Performance Rating by ICR Outcomes: Satisfactory Risk to Development Outcome: Modest Bank Performance: Satisfactory Borrower Performance: Satisfactory
C.2 Detailed Ratings of Bank and Borrower Performance (by ICR) Bank Ratings Borrower Ratings
Quality at Entry: Satisfactory Government: Satisfactory
Quality of Supervision: Satisfactory Implementing Agency/Agencies: Satisfactory
Overall Bank Performance: Satisfactory Overall Borrower
Performance: Satisfactory

ii
C.3 Quality at Entry and Implementation Performance Indicators
Implementation Performance Indicators QAG Assessments
(if any) Rating
Potential Problem Project at any time (Yes/No):
No Quality at Entry (QEA):
None
Problem Project at any time (Yes/No):
No Quality of Supervision (QSA):
None
DO rating before Closing/Inactive status:
Satisfactory
D. Sector and Theme Codes
Original Actual Sector Code (as % of total Bank financing) General education sector 70 70 General water, sanitation and flood protection sector 5 5 Health 20 20 Roads and highways 5 5
Theme Code (Primary/Secondary) Decentralization Secondary Secondary Education for all Primary Primary Health system performance Secondary Secondary Other accountability/anti-corruption Secondary Secondary Other communicable diseases Secondary Secondary E. Bank Staff
Positions At ICR At Approval Vice President: James W. Adams Jemal-ud-din Kassum Country Director: Bert Hofman Robert V. Pulley Sector Manager: Fadia M. Saadah Fadia M. Saadah Project Team Leader: Timothy A. Johnston Jayshree Balachander ICR Team Leader: Timothy A. Johnston ICR Primary Author: Timothy A. Johnston

iii
F. Results Framework Analysis Project Development Objectives (from Project Appraisal Document) (i) Enhancing performance (efficiency, quality and equity) and governance (transparency and accountability) in the three social sector Departments - (Education [DepEd], Health [DOH] and Social Welfare and Development [DSWD], and the school building program implemented by the Department of Public Works and Highways [DPWH] - with oversight and support of the Department of Budget and Management [DBM]; and (ii) providing quality inputs to basic social services. Revised Project Development Objectives (as approved by original approving authority) N.A. (a) PDO Indicator(s)
Indicator Baseline Value
Original Target Values (from
approval documents)
Formally Revised Target Values
Actual Value Achieved at
Completion or Target Years
Indicator 1 : Improve textbook: pupil ratio in 4 core subjects (Math, Science, English, and Filipino).
Value quantitative or Qualitative)
1:2.5 1:1 1:1.32 (elementary)1: 1.35 (high school)
Date achieved 01/01/2003 12/31/2006 04/30/2007
Comments (incl. % achievement)
Ratios represent the national averages for these four subjects. The target was nearly fully achieved. Elementary (grades 1-5) textbook ratios are between 1:1 and 1: 1.1 for 16 of the 36 textbook series. Ten series have ratios between 1: 1.2 and 1: 1.3, while nine are between 1: 1.5 and 1: 2. High school ratios are somewhat higher, but still represent significant improvement compared to beginning of project. 11 of 20 HS series texts have ratios less than 1: 1.2, although year III and IV English have ratios between 1: 2.4 and 1: 2.9.
Indicator 2 : Rabies-free population (national) (<1 case/1,000,000 population) Value Quantitative or Qualitative)
6 per million < 1 case per million 1.8 case per million
population
Date achieved 01/01/2003 12/31/2006 04/30/2007 Comments (incl. % achievement)
Significant progress, but short of initial target
Indicator 3 : Improve TB cure rate. Value Quantitative or Qualitative)
73% 85% 82%
Date achieved 01/01/2003 12/31/2006 12/31/2006 Comments (incl. %
Significant progress compared to baseline, but short of target (75% of progress toward target achieved)

iv
achievement) Indicator 4 : Maintain polio-free certification. Value Quantitative or Qualitative)
n/a <1 case per 100,000 in under 15 population
maintained
Date achieved 01/01/2003 12/31/2006 12/31/2006 Comments (incl. % achievement)
Target fully achieved.
Indicator 5 : Reduce child measles cases by 50% Value Quantitative or Qualitative)
7,194 cases <3,500 173 cases
Date achieved 01/01/2003 12/31/2006 12/31/2006
Comments (incl. % achievement)
Vaccine shortages had led to resurgence of measles epidemics prior to Project. The combination of improved vaccine supply (due to project and JICA support) with intensive national Measles Elimination Campaign in 2003 led to a dramatic (97%) reduction in measles cases, far exceeding the original target.
Indicator 6: Improvement in the inter-quartile ratios (IQR) for teacher deployment at elementary and secondary levels
Value Quantitative or Qualitative)
2.17 elementary 2.62 secondary
1.75 elementary 2.20 secondary 2.01 elementary
2.44 secondary
Date achieved 01/01/2003 12/31/2006 04/30/2007
Comments (incl. % achievement)
The IQR is the ratio between the student-teacher ratio in worst-off 25% of schools, compared to the best-off 25%. A system to improve teacher distribution was implemented (Basic Education Information System, BEIS) – including color-coding schools according to their staffing situation, and prioritizing new teacher allocations to shortage schools. Progress in reducing IQR fell short of targets, however, due to limited progress in reallocation of vacant teacher posts, and high levels of population in-migration to areas with teacher shortages.
(b) Intermediate Outcome Indicator(s)
Indicator Baseline Value
Original Target Values (from
approval documents)
Formally Revised
Target Values
Actual Value Achieved at
Completion or Target Years
Indicator 1 : Number of classrooms completed to specifications.
Value (Quantitative or Qualitative)
n/a 1750
841 new classrooms and 1,820 rehabilitated by DepEd; 481 new classrooms constructed by DPWH
Date achieved 01/01/2003 12/31/2006 04/30/2007 Comments Total number of new and rehabilitated classrooms exceeded the original targets.
v
(incl. % achievement)
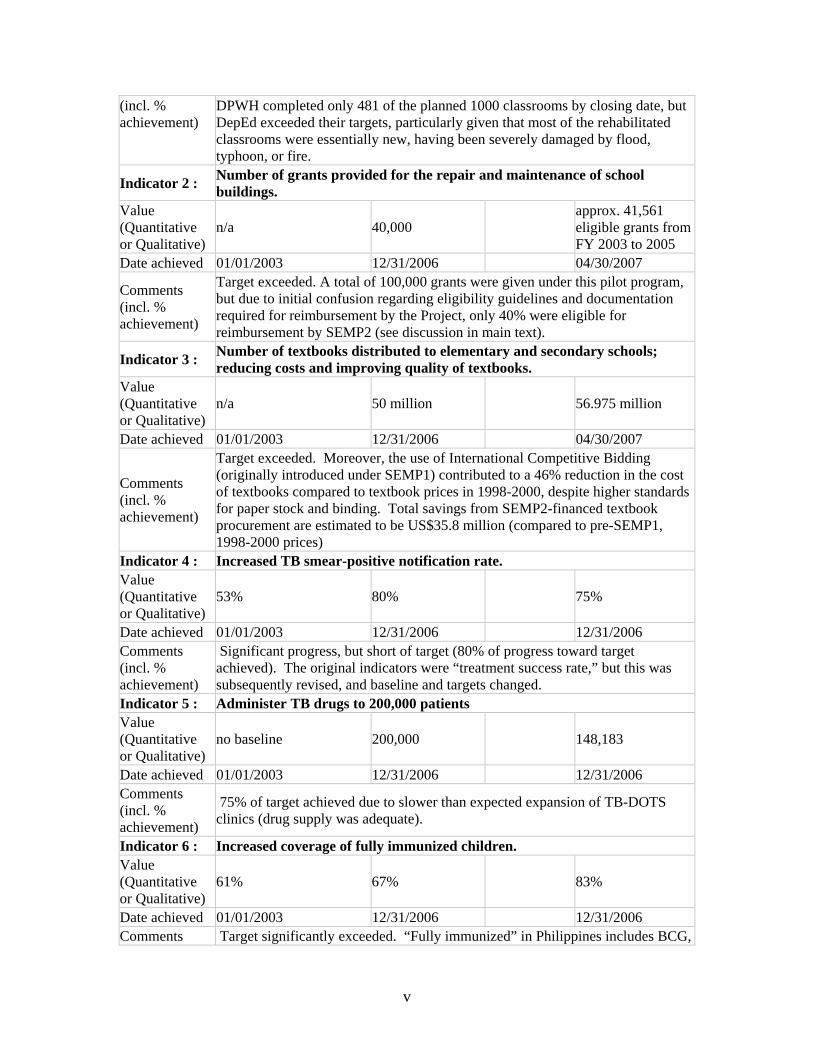
DPWH completed only 481 of the planned 1000 classrooms by closing date, but DepEd exceeded their targets, particularly given that most of the rehabilitated classrooms were essentially new, having been severely damaged by flood, typhoon, or fire.
Indicator 2 : Number of grants provided for the repair and maintenance of school buildings.
Value (Quantitative or Qualitative)
n/a 40,000 approx. 41,561 eligible grants from FY 2003 to 2005
Date achieved 01/01/2003 12/31/2006 04/30/2007
Comments (incl. % achievement)
Target exceeded. A total of 100,000 grants were given under this pilot program, but due to initial confusion regarding eligibility guidelines and documentation required for reimbursement by the Project, only 40% were eligible for reimbursement by SEMP2 (see discussion in main text).
Indicator 3 : Number of textbooks distributed to elementary and secondary schools; reducing costs and improving quality of textbooks.
Value (Quantitative or Qualitative)
n/a 50 million 56.975 million
Date achieved 01/01/2003 12/31/2006 04/30/2007
Comments (incl. % achievement)
Target exceeded. Moreover, the use of International Competitive Bidding (originally introduced under SEMP1) contributed to a 46% reduction in the cost of textbooks compared to textbook prices in 1998-2000, despite higher standards for paper stock and binding. Total savings from SEMP2-financed textbook procurement are estimated to be US$35.8 million (compared to pre-SEMP1, 1998-2000 prices)
Indicator 4 : Increased TB smear-positive notification rate. Value (Quantitative or Qualitative)
53% 80% 75%
Date achieved 01/01/2003 12/31/2006 12/31/2006 Comments (incl. % achievement)
Significant progress, but short of target (80% of progress toward target achieved). The original indicators were “treatment success rate,” but this was subsequently revised, and baseline and targets changed.
Indicator 5 : Administer TB drugs to 200,000 patients Value (Quantitative or Qualitative)
no baseline 200,000 148,183
Date achieved 01/01/2003 12/31/2006 12/31/2006 Comments (incl. % achievement)
75% of target achieved due to slower than expected expansion of TB-DOTS clinics (drug supply was adequate).
Indicator 6 : Increased coverage of fully immunized children. Value (Quantitative or Qualitative)
61% 67% 83%
Date achieved 01/01/2003 12/31/2006 12/31/2006 Comments Target significantly exceeded. “Fully immunized” in Philippines includes BCG,

vi
(incl. % achievement)
DPT3, OPV(3) and measles.
Indicator 7 : Increase child protected at birth with tetanus toxoid by 100%. Value (Quantitative or Qualitative)
0.2/1000 live births 0.4/1,000 live births None reported
Date achieved 01/01/2003 12/31/2006 12/31/2006
Comments (incl. % achievement)
This indicator was incorrectly specified in the Loan Agreement in terms of the number of infants/1000 born with neonatal tetanus (suggesting a target to increase % of children infected). No cases were reported in 2006, largely because DOH stopped systemically recording data. The percentage of children protected at birth with tetanus toxoid (mothers receiving 2 doses of TT during pregnancy) increased modestly from 54% in 2002 to 59% in 2006.
Indicator 8 : Implementation of 2000 CIDSS sub-projects. Value (Quantitative or Qualitative)
n/a 2000 2,495
Date achieved 01/01/2003 12/31/2006 04/30/2007 Comments (incl. % achievement)
Target significantly exceeded, and an independent impact evaluation concluded that the sub-projects had made a significant improvement to the well-being of targeted communities.
Indicator 9 : Financial Management, Procurement, and MIS/IT improvement plans prepared.
Value (Quantitative or Qualitative)
n/a plans prepared completed
Date achieved 01/01/2003 12/31/2006 04/30/2007 Comments (incl. % achievement)
Target achieved.
Indicator 10 : eNGAS operational in DSWD, DepEd and DOH central offices.
Value (quantitative or Qualitative)
n/a Operational
Completed in DSWD and DOH. Not yet fully operational in DepEd.
Date achieved 01/01/2003 12/31/2006 04/30/2007
Comments (incl. % achievement)
eNGAS = Electronic National Government Accounting System. For DOH and DSWD, target fully achieved for central offices, and has been rolled out to regional offices. But in DepEd, eNGAS is fully operational in only two very small bureaus at the Central Office and in one out of the 16 Regions.
Indicator 11 : Streamlined budget process in DepEd, DOH, and DSWD. Value (Quantitative or Qualitative)
Implemented Partially Implemented
Date achieved 12/31/2006 04/30/2007 Comments (incl. %

vii
achievement) Indicator 12 : Procurement units re-constituted and procurement processes streamlined. Value (Quantitative or Qualitative)
Implemented Implemented
Date achieved 12/31/2006 04/30/2007
Comments (incl. % achievement)
Significant progress in establishing and operationalizing procurement units in social sector ministries, and implementing the 2004 procurement reform legislation. Modest progress in streamlining procurement processes and shortening time from advertisement to award of contracts.
Indicator 13 : Contract distribution system maintained in DOH. Value (Quantitative or Qualitative)
adopted Adopted and maintained Adopted and
maintained
Date achieved 01/01/2003 12/31/2006 04/30/2007 Comments (incl. % achievement)
Indicator 14 : IT organization formed in DepEd. Value (Quantitative or Qualitative)
n/a Organization formed Organization
pending
Date achieved 01/01/2003 12/31/2006 04/30/2007 Comments (incl. % achievement)
DepEd Memo issued forming IT organization in DepEd; however, staffing and organization is still pending DBM’s approval of the DepEd’s Rationalization Plan.
Indicator 15 : New teacher deployment system adopted. Value (Quantitative or Qualitative)
adopted Adopted
Date achieved 12/31/2006 04/30/2007 Comments (incl. % achievement)
System is adopted and functioning, but needs to be further strengthened to achieve the targets on teacher deployment (see comments above and in text).
Indicator 16 : BFAD Improvement plan adopted. Value (Quantitative or Qualitative)
n/a Adopted Adopted
Date achieved 01/01/2003 12/31/2006 04/30/2007 Comments (incl. % achievement)
Improvement plan has been adopted, with modest progress in implementation.
Indicator 17 : DepEd annual statistics published within 6 months of year end. Value (Quantitative or Qualitative)
n/a each year SY 2002/2003 Statistical Bulletin released
Date achieved 01/01/2003 12/31/2006 04/30/2007 Comments The SY 2002/2003 was prepared and released within six months of year end, but

viii
(incl. % achievement)
the SY 2003-04 statistical bulletin is still under preparation.
Indicator 18 : Develop and adopt action plan for increased transparency in budgetary processes.
Value (Quantitative or Qualitative)
n/a Adopted Adopted and under Implementation
Date achieved 01/01/2003 12/31/2006 04/30/2007
Comments (incl. % achievement)
Plan adopted by DBM, and some measures implemented including posting budget information on their web site. Modest progress in involving civil society organizations in budget process. A planned Public Expenditure Tracking Survey (PETS) for education was not implemented, and an independent public expenditure tracking system has not yet been established.
Indicator 19 : 150,000 individuals served by protective services in 2004 and 2005 Value (Quantitative or Qualitative)
n/a 150,000 360,988
Date achieved 01/01/2003 12/31/2006 06/30/2007 Comments (incl. % achievement)
Target significantly exceeded. Indicator was added following addition of this component.
Indicator 20 : Develop and adopt program evaluation and monitoring tools for improved management of residential centers and institutions
Value (Quantitative or Qualitative)
n/a Adopted Adopted
Date achieved 01/01/2003 12/31/2006 04/30/2007 Comments (incl. % achievement)
Target achieved. Indicators and targets were adopted following addition of this sub-component.
G. Ratings of Project Performance in ISRs
No. Date ISR Archived DO IP
Actual Disbursements (USD millions)
1 06/26/2002 Satisfactory Satisfactory 0.00 2 12/23/2002 Satisfactory Satisfactory 1.00 3 06/20/2003 Satisfactory Satisfactory 14.17 4 11/26/2003 Satisfactory Satisfactory 29.64 5 05/05/2004 Satisfactory Satisfactory 40.63 6 12/21/2004 Satisfactory Satisfactory 56.14 7 06/08/2005 Satisfactory Satisfactory 59.87 8 12/12/2005 Satisfactory Satisfactory 72.54 9 10/30/2006 Satisfactory Satisfactory 93.40 10 11/14/2007 Satisfactory Satisfactory 100.00

ix
H. Restructuring (if any) Not Applicable I. Disbursement Profile
1. Project Context, Development Objectives and Design1
1.1 Context at Appraisal Economic crisis and fiscal constraints: The East Asian economic crisis of 1997 created severe fiscal constraints and forced a 15% reduction in the Government of the Philippines (GOP) national budget. Despite efforts by the GOP to allocate at least 40 percent of the government budget to the social sectors, capital expenditures and non-wage recurrent spending for operations and maintenance were negatively affected (including for textbooks and vaccines). Shortages of social sector inputs contributed to declines in key indicators, including reduced vaccination coverage and availability of textbooks in classrooms. These fiscal constraints in turn highlighted the problem of high costs and inefficient expenditures on many critical inputs in the social sectors, due to lack of transparency and inefficiencies in procurement, contract management, construction, and logistics systems. Weak governance and corruption. The Philippines suffers from weak governance and high levels of public sector corruption (with perceived levels of corruption similar to Indonesia and Vietnam).2 While governance and corruption were problems throughout government, a survey in the mid-1990s found that the health and education sectors were perceived as being among the most corrupt government departments, and a report by investigative journalists in 1998 estimated that corruption and various payoffs represented 15% to 30% of the cost of government-financed school textbooks.3 In the late 1990s, all of the Bank-financed projects in the social sectors were either rated unsatisfactory or at risk of unsatisfactory outcomes, due largely to the weaknesses in procurement, financial management, and implementation capacity noted above. Decentralization reforms launched by the government in the early 1990s led to the devolution of responsibility for basic health and social welfare services to local governments (although the education sector remained centrally managed). Decentralization was intended to improve service delivery and accountability to the local populations, but was implemented with insufficient preparation, which created confusion regarding role and accountabilities. Active civil society sector. Despite weak governance, a vibrant and diverse civil society sector has emerged in the Philippines, with a growing number of Civil Society Organizations (CSOs) seeking to strengthen accountability of government at national and local levels. SEMP1 design and rationale. Although a 1998 evaluation by the World Bank’s Operations Evaluation Department recommended discontinuing lending to the social sectors, the Bank instead initiated the first Social Sector Expenditure Management Project (SEMP1), which supported the Departments of Education (DepEd) and Social Welfare and Development (DSWD),
1 This ICR was prepared by a World Bank team composed of Timothy Johnston (Task Team Leader), Lynnette Perez, Eduardo Banzon, Maria Loreto Padua, Cesar Banzon, and Arindam Dutta. The document was developed through consultation with government agencies – DBM, DepED, DOH and DSWD and civil society organizations. Special thanks to these agencies and to DBM Undersecretary Laura Pascua for their input and support. 2 Source: Kaufmann D., A. Kraay, and M. Mastruzzi, Governance Matters VI: Governance Indicators for 1996-2006, World Bank. 2007. 3 Sheila Coronel, Robbed: An Investigation of Corruption in Philippine Education Books, Philippine Center for Investigative Journalism. 1998.

2
under the leadership of the Department of Budget and Management (DBM). Instead of a classic “project” design, the SEMP financed specific line items in the government’s budget within the budget ceilings established by DBM. As such, the SEMP design adopted a two-track strategy of (i) using loan proceeds to provide “cash backing” for purchase of critical social sector inputs, while using World Bank International Competitive Bidding (ICB) procedures to increase transparency and reduce costs; and (ii) promoting core fiduciary and governance reforms. The approach was championed by reformers in the Department of Budget and Management, who sought to leverage reforms with support from reform-minded leaders in the sectoral Departments, and to establish links with civil society organizations to improve accountability for service delivery. SEMP1 implementation and rationale for SEMP2. Despite the fundamental challenges, the first SEMP was largely successful in achieving its objectives, which in turn improved implementation of other Bank-financed projects in the social sectors. With a relatively short period of project execution (two and a half years), however, progress in implementing agreed financial management and procurement reforms was modest. The SEMP2 therefore sought to further deepen and support implementation of the reform process, ensure continued financing for key social sector inputs, and extend the project activities to the Department of Health (DOH).
1.2 Original Project Development Objectives (PDO) and Key Indicators (as approved) The SEMP2 had the following Development Objectives: (i) Enhancing performance (efficiency, quality and equity) and governance (transparency and accountability) in the three social sector Departments - (Education [DepEd], Health [DOH] and Social Welfare and Development [DSWD], and the school building program implemented by the Department of Public Works and Highways [DPWH] - with oversight and support of the Department of Budget and Management [DBM]; and (ii) providing quality inputs to basic social services. The Loan agreement included an extensive list of performance indicators, including: Improvement in the delivery of basic social services:
• Improve student : textbook ratios (1:2.5 to 1:1 in the four core subjects—math, science, English, Filipino) by distributing 50 million new textbooks;
• Increase the percentage of fully immunized children from 61% (2001) to 67% (2005); • Improve TB cure rates from 80% to 85%.
Improvement in management of social expenditures:
• Percentage savings resulting from improved procurement of textbooks and drugs; • Financial Management (FM) improvement, including:
o spread sheet-based automated accounting systems installed; o management reporting established.
• Procurement Improvement: o Procurement units established in three social sector Departments; o Procurement processes streamlined; o Electronic procurement (E-procurement) implemented.
• Teacher Deployment: o Reduction in the number of "red" zone schools – student : teacher ratio (STR>50) o Inter-quartile ratios (IQRs) for each division close to 1;

3
o Institutionalization of a new teacher deployment system. • Drug Regulatory System:
o Performance standards for the Bureau of Food and Drugs defined and maintained.
Key indicators for improved governance and accountability
• Develop and implement an independent Public Expenditure Tracking System; • Increase in client satisfaction with basic social services according to a Report Card
Survey;
1.3 Revised PDO (as approved by original approving authority) and Key Indicators, and reasons/justification No changes were made to the PDO. The Loan Agreement was amended on October 19, 2004, in order to reallocate funds, add additional subcomponents, and revise some of the key performance indicators and/or update baseline data and targets (see summary table in Annex 2). Changes included:
• Two additional indicators were added to reflect additional activities implemented by DSWD using cost savings from the project: (a) 150,000 individuals served by protective services in 2004 and 2005; and (ii) develop and adopt program evaluation and monitoring tools for improved management of residential centers and institutions.
• Baseline data and targets were (a) established for improving student: teacher interquartile ratios, and (b) revised/updated for TB smear positive notification rates.
• The indicator for development of a MIS “flash” reporting system was dropped. • Under Component C, two indicators were dropped: (a) increase in client satisfaction with
basic social services according to a Report Card survey; and (b) develop and implement a Public Expenditure Tracking System. A new indicator was added in their place: Develop and adopt action plan for increased transparency and accountability in budgetary processes in the social sectors.
The addition of the new indicators was clearly justified, as was the updating of targets and baseline data for TB and IQRs once updated information became available. The decision to drop the three indicators may have been justified in that it allowed implementing agencies to focus on a more limited set of priorities, but it partly reflected limited progress with respect to these specific activities.
1.4 Main Beneficiaries The primary beneficiaries of the project were users of government-financed social services, through increasing the availability of key inputs to improve the quality of basic social services, as well as through improving the efficiency and effectiveness of public social sector agencies. While the financing was not specifically targeted at the poor, the poor and disadvantaged sections of the population rely heavily on publicly provided basic social services.
1.5 Original Components (as approved) Project activities were grouped into three main components: strengthening key budgetary programs the social sector departments; systems improvements and reforms; and strengthening transparency and accountability.

4
A. Strengthening Key Budgetary Programs A. 1 Basic Education Services (US$75.1 million at appraisal) covered the provision of key educational inputs such as textbooks, classrooms, and repairs and maintenance of existing schools. For textbooks, international competitive bidding procedures in SEMP 1 resulted in significant savings. These gains were to be consolidated while improving manuscript evaluation procedures, and assessing textbook availability and utilization. The construction of classrooms using competitive bidding procedures was to help bridge a large backlog while benchmarking cost and quality. Responsibility for school repairs and maintenance was to be formally decentralized to the school level, through financing small grants (up to PHP 10,000) for minor repairs to school buildings. A. 2 Public Health Services (US$26.75 million at appraisal) covered the procurement of drugs, vaccines and supplies for important public health programs—TB control, the Expanded Program for Immunization (EPI), and the prevention and control of rabies. The declining coverage from a previously successful immunization program was to be reversed by ensuring the timely and efficient procurement and distribution of vaccines. A steady supply of TB control drugs would be assured to the DOTS (Directly Observed Treatment, Short Course) program being implemented with technical support from WHO. DOTS had also entailed improvements/changes in diagnostic policies and microscopy services, case-holding strategies, treatment regimen, drug supply and monitoring. The project financed the purchase of vaccines for the Rabies Action Project in the Visayas which aimed to declare the Visayas Region a rabies-free zone by 2005. A. 3 Social Services (US$11 million at appraisal) were to be provided through the Comprehensive and Integrated Delivery of Social Services (CIDSS). CIDSS financed barangay-centered activity in poor municipalities. The poorest barangays were identified using minimum basic needs indicators. Communities used the same indicators to determine their most urgent needs, and subsequently planned projects to address these needs (e.g., water supply, sanitation, day-care centers, skills training, rural roads, and livelihood development projects). The project financed small grants to communities (up to PHP 10,000) for such initiatives. B. Systems Improvement and Reform ($1 million appraisal estimate): This component sought to support: (i) further implementation of the financial management, procurement and MIS/IT improvement program initiated under SEMP 1 in DepEd and DSWD, and support for financial management, procurement and MIS/IT improvement in DOH; (ii) teacher deployment and human resources planning in DepEd; and (iii) strengthening of the Bureau of Food and Drugs (BFAD). Due to GOP reluctance to use loan financing for technical assistance, key inputs in support of this component -- including technical assistance, training, and associated hardware -- were to be either from the GOP budget and/or from capacity building grant funds, with technical advice and supervision support from the Bank. B. 1 FM/Procurement/MIS/IT. The strategy for financial management improvements under SEMP 2 was to focus on introducing computerized database management systems that would facilitate the introduction of the new electronic National Government Accounting System (eNGAS), roll-out of a “flash management” reporting system, and skills upgrading of FM staff. Procurement improvements would focus on building capacity in the agencies for planning, streamlining processes, improving payment mechanisms, performing price analysis and maintaining benchmarks, tracking distribution and implementing e-procurement. The project sought to support an in-house effort to upgrade the Unified Data Gathering System (UDGS) and

5
for Personnel Information Systems in DepEd, using standard database software, and providing necessary training at all levels. The IT improvement program planned to develop IT infrastructure, upgrade IT knowledge and skills, develop strategic plans for information technology and create a governance and organizational structure for IT in the departments. B.2 Teacher Deployment and Human Resources Planning. A study of teacher deployment issues, carried out during project preparation, provided the basis for this component. It was found that while the national distribution of teachers was fairly equitable, the regional distribution among divisions was less so, and that at the local level, the distribution of teachers among the schools showed major inequalities in most divisions. The following activities were to be implemented during the project: (i) monitoring teacher deployment; (ii) deploying new teachers under an improved allocation system so that teachers could be targeted to the most needy schools, and institutionalizing the system; (iii) identifying and eliminating long-term vacancies; (iv) transfer of vacant teacher positions from teacher-surplus to teacher-shortage schools and (v) review and reverse (where appropriate) the designation of teachers to non-teaching roles. B.3 Strengthening of the Bureau of Food and Drugs (BFAD). On the basis of a diagnostic assessment of BFAD financed during project preparation, an action plan for the improvement of BFAD was to be implemented to strengthen BFAD's capacity to meet agreed performance standards with regard to the rate of issue of product registration certificates, accreditation and conduct of testing and inspections, and issue of Good Manufacturing Practice certification. C. Strengthening Transparency and Accountability (US$0.5 million appraisal estimate) The project aimed to support initiatives to strengthen transparency and accountability in the various stages of the budget process. These include collaborative efforts with civil society in analyzing budgets, tracking expenditures and leakages, and obtaining client feedback. At least one round of implementation of the initiatives were to be implemented, and the tools that underpinned these initiatives were to be popularized and made available to interested citizen’s groups for continuous national and local application.
1.6 Revised Components The components were not revised. Following the anticipated phase-out in 2004 of financing for the CIDSS program, the DSWD requested that additional social protection activities that had been financed under SEMP1 be financed using cost savings from other components of the project. The SEMP2 loan agreement was amended on October 19, 2004, to include “Support Services on Social Protection and Promotion of Rights and Welfare of the Poor and Disadvantaged,” under component (A3). The new components were funded using the unused $1.4 million balance of the unallocated category and $2.3 million initially allocated for the CIDSS grants under the Project.4 Two new indicators were added to the results framework to reflect these new activities.
4 Support Services Programs included assistance to: victims of disasters and natural calamities; persons with disability and senior citizens; protective services for individuals and families in especially difficult circumstances; protective and rehabilitation services for Center-Based Constituents; social laboratories.
6
1.7 Other significant changes There were no significant changes in project design or objectives. The closing date for the project was extended three times (from December 31, 2005 to June 2006; then to December 31, 2006; and finally to June 30, 2007), primarily to complete the final procurements and delivery of textbooks, as well as school construction managed by DPWH. Initially, the project was to be implemented with support from Project Management Units (PMUs) in the sectoral departments, but these were phased out after the second year of implementation, in order to mainstream activities and reforms into the line units of sector departments.
2. Key Factors Affecting Implementation and Outcomes
2.1 Project Preparation, Design and Quality at Entry The Project design was well-grounded both in lessons of earlier operations and in analysis of key sectoral and reform issues, and developed by field-based staff who had been responsible for design and implementation of SEMP1. The SEMP concept had been developed by DBM, with close involvement and support of sector departments. A project preparation grant financed several key studies in preparation, which in turn served as the basis for implementation of reforms under the SEMP2.5 Risks were well identified, including fiduciary risks, potential opposition to reforms from certain vested interests, and weaknesses in fiduciary and implementation capacity. Appropriate mitigating measures were introduced to address these risks. Ownership of project objectives was strong among key senior officials in the implementing ministries, and particularly in the DBM. In addition, project preparation involved civil society organizations seeking to strengthen accountability for government spending.
2.2 Implementation Due to continuity in the World Bank and government teams that designed the project, and advance planning for procurement, the project implementation took off quickly following project effectiveness. The project benefited from remarkable stability of key counterparts in DBM, who were strong supporters of the reform agenda and remained in place from the design of SEMP1 through the close of SEMP2. The World Bank’s Team Leader changed only once during the main implementation phase, with a third Team Leader taking over in the final months before project closure. The key local sector specialists and fiduciary staff in the World Bank country office remained in place throughout the project. The pace of implementation slowed by the second year, however, and the project took two years longer to implement than expected (with three extensions of the closing date, as noted above).
5 The $918,000 PHRD grant financed the following studies: a study on strategic planning for education materials; teacher deployment and utilization; a textbook quality review; establishing a school registry tracking system; a review of the Health Sector Reform Agenda; pharmaceuticals regulation; financial management and information and communication technologies (ICT) strengthening of DOH, master plan for the Bureau of Food and Drugs, a study on Budget Execution and Accountability Tracking Systems Integration and data architecture, a review of the CIDSS and management systems for DSWD-managed centers and institutions. The grant closed on October 31, 2002, all activities having been completed except the education Public Expenditure Tracking Survey (PETS) and procurement support to DOH

7
The reasons for the delays were several. First, the Bank and government agreed to extend SEMP1 by a year, and several activities that were expected to be financed through SEMP2 were instead reimbursed by SEMP1. Second, progress in implementation of core fiduciary reforms was initially slow and uneven across the three social sector Departments (see below).6 Third, while school construction undertaken on a delegated basis by DepEd progressed relatively on schedule, school construction undertaken by the DPWH suffered from repeated delays. Fourth, cash management restrictions imposed by DBM contributed to delayed release of National Cash Allotments (NCAs), which delayed implementation of some activities.7
Finally, while DepEd made progress in reducing the time from advertisement to contract completion, the total time for completing textbook procurement typically exceed one year. Moreover, losing bidders mobilized to overturn the final round of textbook contract awards through domestic litigation, submitting procurement complaints to World Bank headquarters, and orchestrated media campaigns (see discussion below and in Annex 9). A lower court issued a Restraining Order against the final textbook contract award a month prior to the revised closing date of December 31, 2006. This Order was subsequently overturned by the Supreme Court in March 2007—which represented a major victory in efforts to defend procurement reforms in general and the integrity of procurement under World Bank-financed projects specifically—but necessitated the final project extension to June 30, 2007, which allowed for distribution of the textbooks.
Despite delays, project development objective and implementation ratings were satisfactory throughout implementation. The project benefited from twice-yearly supervision missions, which provided an opportunity to discuss progress in reforms, resolve implementation bottlenecks, and review progress toward key indicators. While a mid-term review was originally planned for early 2004, the project team and government agreed that a formal MTR was not necessary, given that the project was subject to regular supervision and was on track for achieving its objectives. Finally, the project was implemented during a time of periodic political turmoil, as well as unrest and conflict situations in several areas of the country (including Mindanao), which negatively affected implementation in those regions.
2.3 Monitoring and Evaluation (M&E) Design, Implementation and Utilization The results framework for the project was comprehensive, and included a mix of outcome and intermediate indicators, the majority of which were available through the routine monitoring systems of the government. An amendment of the Grant Agreement in October 2004 resulted in revision of some key performance indicators as well as updating of baseline data and targets for two others (see Section 1.3 above and Annex 2). An additional indicator was inadequately specified (tetanus toxoid), but not corrected during the amendment (see below). Key performance indicators were regularly updated in Aide Memoires, and discussed with government during supervision missions. In addition, the Project supported the strengthening and establishment of
6 DSWD was the smallest of the Departments with a history of good management, and progressed rapidly in implementing procurement, financial management, and ICT reforms. DepEd was the largest Department in government, and implementation of reforms and project activities slowed by periodic leadership changes, as well as mid-level staff being preoccupied with day-to-day responsibilities. 7 For example, the NCA for the Calendar Year 2003 School Building Program (SBP-CY03) was released in last quarter of CY, and the contracts had to be put on hold. In addition, delayed transfer by DBM of DepEd’s 10% allocation under SBP delayed implementation of DepEd construction and the principal-led school building program.

8
monitoring systems in the social sector ministries, including the establishment of Basic Education Information System (BEIS). The government did not regularly produce its own annual project Progress Reports, however, as agreed in the Loan Agreement. In addition, despite progress in improving monitoring systems, supervision missions noted concerns regarding fragmentation among different information systems and databases, and uneven use of information for decision-making at central and local levels.
2.4 Safeguard and Fiduciary Compliance
Environment and social safeguards. With respect to environmental Safeguards, the Project was rated as environmental category “C”, which meant that no specific environmental safeguards were required, although DOH was expected to maintain standards with respect to medical waste Management, and guidelines for asbestos management applied to construction programs. Compliance was satisfactory overall, but compliance to guidelines on school building construction by DPWH engineers was only moderately satisfactory. For social safeguards, the Project social analysis focused on measures to ensure that basic social services are available to poor and marginalized groups, and to ensure adequate participation by civil society groups in project implementation and monitoring.
Fiduciary safeguards. Fiduciary risks were judged to be substantial. The Bank sought to address these through an integrated approach of requiring compliance with World Bank guidelines on financial management and procurement; regular supervision by Bank procurement and financial management specialists and consultants; and support for reforms to strengthen fiduciary capacity, regulations, and systems. The Bank undertook regular fiduciary supervision of the operation, and provided technical support and guidance in terms of implementing system-strengthening reforms. Fiduciary compliance was rated satisfactory overall throughout project implementation, although various issues were identified and addressed in the course of project implementation. These included initial problems with delayed submission of Financial Management Reports (FMRs), due to weak FM systems, although timeliness of FMRs submission improved by the third year of the project. Project disbursement was also slowed by delayed submission of Statements of Expenditure (SOEs) by participating departments, or problems with incomplete documentation in SOEs. As the transparency and capacity for procurement improved, the Bank and government gave increased attention to reducing leakages and wastage in the logistics and distribution of social sector commodities (including textbooks and vaccines).
2.5 Post-completion Operation/Next Phase The commodity support, activities, and reforms promoted by SEMP2 are being continued and enhanced by follow-on sectoral National Program Support (NPS) operations, including in education and health (already under implementation), and social protection (under preparation). The current Country Assistance Strategy (CAS) has adopted the NPS model as one of the key instruments for support to the social sectors. NPS operations focus on core mandates and service delivery improvements, through financing specific budgetary line items within the overall budget ceilings of the departments, and provide greater confidence in the use of procurement and financial management country systems in these new operations. A few specific contracts and activities initiated under SEMP2 but not completed prior to the closing date (including a final procurement of Social Studies textbooks) will be financed by these successor operations, or financed through the government budget (including DPWH school construction). Some of the cross-cutting reforms supported under SEMP1 and SEMP2, including improving budgetary execution and transparency and strengthened social accountabilities, are being addressed through

9
the Bank’s governance and public sector management program, including a budget expenditure review that has been undertaken for DepEd and is planned for DOH. Civil society and social accountability activities are being carried forward in the NPS projects, as well as through cross-cutting social accountability activities being led by the Bank’s Social Development Network.
3. Assessment of Outcomes
3.1 Relevance of Objectives, Design and Implementation The relevance of the Project objectives is rated as High. The Project objectives were fully aligned both with the World Bank's Country Assistance Strategy (CAS), as well as the government's national development strategy, both in terms of a focus on improving availability of key social services and commodities, as well as improving governance and management in the social sectors. Project objectives and components continue to be highly relevant to the current CAS (2006-08), which emphasizes social inclusion, greater decentralization, and transition from project-based to program-based operations compatible with fiscal constraints, and aligned with core mandates and service delivery improvements within the budget. The relevance of project design is rated as Substantial. Project design incorporated lessons from earlier operations. Rather than avoiding or seeking to bypass fiduciary and governance weaknesses in the social sector, the Project sought to address these directly. Project design gave responsibility to the organization’s regular/organic staff to ensure institutionalization and mainstreaming of innovations, reforms, policies/programs, and also balanced “top down” measures to improve governance (such as implementation of the new procurement law) with “bottom up” measures to strengthen accountability for service delivery (through involving civil society organizations in monitoring delivery of social services). Minor design shortcomings included lack of baseline data for some indicators, and inadequate arrangements for financing some planned activities (for example, client scorecards). On balance, overall relevance is rated as High.
3.2 Achievement of Project Development Objectives Overall progress in achieving project Development Objectives (efficacy) is rated Substantial. The majority of key Project indicator targets were achieved or exceeded, although a few key indicators registered only modest progress compared to original targets. Sub-objectives (i) and (ii) are both rated Substantial. Outcomes by objective are briefly summarized below, followed by a more detailed discussion of outputs and outcomes by project component. (i) Enhance the performance and governance in the three social sector Departments. The project contributed to substantial progress on core fiduciary and governance reforms in the social sector ministries, despite the challenges—and strong resistance and opposition—encountered. These included implementation of reforms and capacity building in procurement and financial management; strengthening the involvement of civil society organizations in monitoring service delivery; and establishing new systems and processes for teacher deployment, information systems and monitoring. Implementations of financial management reforms, and some planned activities for improving governance and accountability, were not completed (public expenditure tracking surveys, and mainstreaming client scorecards). Despite these shortcomings, overall progress is rated substantial.

10
(ii) Provide quality inputs to basic social services. Substantial. The project reached or exceeded the majority of output targets with respect to financing critical social sector commodities and programs (despite cash rationing), and improved quality and reduced costs through competitive procurement processes. The project contributed to significantly improving the availability of school textbooks, improving the quality of school construction, assuring availability of vaccines and TB drugs; and supporting community-driven development activities and social protection programs through DSWD.
A. Strengthening Key Budgetary Programs A.1 Basic Education Services (US$50.35 million actual -- US$75.1 million appraisal). The subcomponent sought to ensure provision of key educational inputs, while reducing costs and improving efficiency in distribution and allocation of resources. Most of the targets were achieved or exceeded. Overall rating for this component is therefore judged as Satisfactory. Textbook procurement and distribution: Despite the controversies and negative media coverage surrounding textbook procurement under the project (see Annex 9), this component was very successful. Prior to 1998, DepEd was responsible for the development and production of textbooks and teachers manuals. Complaints from the private book industry led Congress to pass new legislation mandating that textbook development, printing, and distribution should be subcontracted to the private sector. The pre-SEMP contracts were awarded with limited transparency and competition, however, leading to escalating prices, problems with textbook quality (both text and quality of stock) and distribution.8
• Improved availability of books. 56.97 million textbooks were procured under SEMP2, exceeding the original target of 50 million. These textbooks, combined with those funded under the Bank-financed Third Elementary Education Project (TEEP), contributed to significant improvements in the textbook-student ratio, from 1:2.5 prior to the project to almost 1:1 for the core elementary subjects (Math, Science, English, and Filipino) by the end of project. Textbook-student ratios at the high school level did not fully reach the target, but still improved significantly (to 1: 1.3 on average). While the project performance indicator was stated in terms of textbook ratios at the school level, actual availability at school level is more variable.
• Cost savings. ICB for textbooks (which was initially introduced under SEMP1 and continued under SEMP2) resulted in 46% decline in prices for textbooks (from an average of Php90 to 100 per elementary textbook pre-SEMP 1 to an average of Php40 per textbook), despite increased quality standards for paper thickness and bindings. This resulted in estimated savings of US$35.8 million in textbook procurement during SEMP2, compared to prices prevailing prior to SEMP1 (1998-2000). This direct savings estimate is conservative, since it does not account for inflation or for the likely increased lifespan of textbooks due to increased page and cover thickness. Overall, the introduction of international competitive bidding for textbook procurement (including textbooks financed by SEMP1, SEMP2, and TEEP) generated approximately US$125 million in cost savings for the GOP over a seven-year period; adjusting for inflation yields an estimated $153 million in total savings (2006 prices).
• Revised Textbook Policy and quality improvements: One weakness identified during SEMP1 was inadequate quality of textbooks: the problem predated SEMP1, but the
8 See Coronel, 1998.

11
introduction of ICB alone did not solve the problem. Dialogue during supervision missions and a background study commissioned during project preparation formed the basis for a new textbook policy, which was issued by DepEd in July 2004. Among other measures, the new policy introduced a four-stage quality review process, and increased quality standards for textbook production and content. This contributed to improved physical quality of textbook (in terms of thickness of paper, binding, printing), and ensuring increased textbook life.9 DepEd sought to improve content of textbooks through a rigorous and stringent evaluation process, including contracting more than a hundred independent evaluators to review the accuracy and content of textbooks. The quality review process continues to undergo refinements based on experience, including introducing pre-bid evaluations for publishers to improve manuscripts prior to the formal bidding and evaluation process. Errors and inconsistencies have been reduced, but not eliminated. Recently, DepEd introduced further revisions to further streamline and strengthen the content evaluation and overall quality review process.
• Improved transparency in distribution. The project supported and mainstreamed a
nationwide partnership between DepEd and a consortium of more than 36 Civil Society Organizations (CSOs) to ensure quality production and timely delivery of textbooks to all public schools. This was piloted in one province under SEMP1, but is now a national program formalized through a memorandum of understanding between DepEd and CSOs, and has been cited as “best practice” in an OECD procurement publication.10 The Textbook Count led by Government Watch (G-Watch) has contributed to significant improvements in textbook distribution and delivery; improved feedback mechanisms, which led to speedier identification and resolution of issues; and greater coordination between and among stakeholders for improving service delivery and mobilizing partnerships and resources.
• Textbook exchange. The National Textbook Exchange Program was introduced during
implementation to address disparities in the availability of textbooks in schools due to multiple titles, owing to procurement of textbooks from different sources prior to SEMP 2 and an inefficient distribution and allocation system. A total of 597,851 elementary textbooks and 133,037 high school textbooks were exchanged among schools/divisions with excess textbooks and those with shortages in 2004/2005, benefiting 38% of the total divisions in the country.
Classroom construction and rehabilitation: SEMP2 financed school construction at the central level through the Department of Public Works and Highways (DPWH), and expanded the
9 It is still too early to assess the actual increase in textbook life from these improvements, but the increase should be at least 15% in the average shelf life of textbooks. 10 “In the 1990s corruption was rampant in the Department of Education in the Philippines. The Department was unable to deliver the most basic services to its 18 million public school students. Unqualified bidders were over-pricing their school text books and corrupt officials were awarding them contracts to deliver books which seldom arrived at schools. In 2001 a new government decided to fight corruption and reform the way text books were ordered and delivered. The ‘Textbook Count 1-2-3’ project made sure that every text book was accounted for and delivered. NGOs, parents, Boy Scouts and Girl Guides were all involved, including the Coca Cola company who agreed to deliver text books for free in their trunks when delivering soft drinks to remote areas.” Development Assistance Committee, Organization for Economic Development and Cooperation (OECD/DAC), “Why is Procurement Important?” Factsheet, December 2006. http://www.oecd.org/dataoecd/35/58/37766795.pdf.

12
“principal-led approach” to school construction piloted under the WB-financed Third Elementary Education Project. For the latter, an MOU was developed between DPWH and DepEd, in which 10 percent of the school construction and maintenance budget allocated to DPWH was delegated to DepEd for “principal-led” school construction and rehabilitation. This budget line was entirely financed by SEMP2. The Project demonstrated that increased involvement of principals and parent associations in school construction decreased costs and significantly improved quality. In addition, the DepEd made use of the Basic Education Information System (BEIS) to better prioritize decisions regarding new classroom construction, which had previously been heavily influenced by political considerations.
• Principal-led school construction and rehabilitation. Despite the DepEd managing only
10% of the Regular School Building Program (SBP) Budget of the Government, it was able to build 841 new classrooms and repair and/or rehabilitate 1,820 classrooms in 856 schools, which represents a substantial portion of the total original target of 1,750 classrooms constructed. Many of the classrooms rehabilitated by DepEd had been severely damaged by fire, typhoon or flood, and had been unusable. The Project supported the development of streamlined operational manuals, and principals received training in bidding and construction supervision. Independent NGO evaluations11 and an independent consultant evaluation commissioned for the ICR (see Annex 8) concluded that schools constructed through this program resulted in better quality, lower cost (by 4 percent on average) compared to schools constructed by DPWH, largely due to greater involvement of school staff and parent associations in the bidding and construction monitoring process. In addition, the success of the principal-led school building had several positive “spin-offs.” First, it enhanced school-based management, which now underpins the Basic Education Reform Agenda of the Government. Second, it boosted the self-confidence of school heads and enhanced their status in the community; and because the construction or repair was usually well done, it helped the school head mobilize additional resources from the LGU and the community. Third, the successes in terms of physical quality, cost and resource mobilization through the principal-led approach led Government to allocate more budgetary resources for the DepEd-managed school building/classroom construction in 2006 (Php1.1 billion) and 2007 (Php1.539 billion), compared to previous years when DepEd received only 10% of the total Regular School Building budget.
• DPWH construction. While the School Building Program (SBP) had historically been the
responsibility of DPWH, it had been beset by serious problems in non-transparent procurement, poor supervision and quality control, political influences in school selection and bidding, and limited involvement of schools and communities. The Bank agreed to finance the central SBP under two conditions: (i) adoption of World Bank-approved procurement practices for National Competitive Bidding (NCB), and changes in the previous procurement practices of DPWH for school buildings (including wide advertising, no pre-qualification of contractors, no fixed prices per classroom); (ii)
11 Government Watch (G-Watch), Ateneo School of Government, “Main Report of the BAYANIHANG ESKWELA: The Citizens' Monitoring of DPWH-Implemented School Building Projects, April 2007. In 2003, a “Consolidated Report on the Joint DepEd/DPWH/WB/G-Watch Monitoring of School Building Projects” was undertaken in the context of a World Bank supervision mission, which compared the quality and cost of construction among a sample of DPWH, principal-led, and NGO-finance school building projects. In this survey, all 12 of the SEMP-financed school building projects were judged satisfactory, but half of the 24 DPWH-constructed classrooms were found to be either incomplete or of poor quality.

13
DPWH was to sign a Memorandum of Understanding with civil society organizations for the local monitoring of the bidding and construction process. The MOU was signed in 2004, and the NGO involvement has subsequently received support from USAID and other donors. NGOs annually visit a sample of schools being constructed by DPWH. Initial reports found serious problems with quality in at least half the schools; while problems still persist, the involvement of NGOs and schools has improved oversight and quality. Execution of SBP financed by SEMP2 was repeatedly beset by delays, however, due initially to a lack of compliance by DPWH district offices to agreed procurement guidelines. This led to all these contracts being rebid at central level, but contractor performance was uneven at best, since most winning contractors were based in the Luzon region. As of project closing in June 2007, 481 classrooms had been completed and were reimbursed by the project. The average cost per classroom was Php550,000, which was comparable to the DepEd’s classroom cost.
• Repairs and maintenance of existing schools. To address persistent problems of
inadequate school maintenance, SEMP1 piloted a new system for providing grants of up to 10,000 Php to school principals for repair and maintenance of schools. This program was scaled up nationally under SEMP2. A total of 41,561 school repair and maintenance grants were provided, exceeding the target of 40,000 grants during the project life. Field supervision conducted during the project found that about 90% of the work was consistent with the guidelines. An independent evaluation commissioned for the ICR found that preventive maintenance and minor repairs supported by the grant were well executed, and are likely to extend the effective life of existing school buildings (see Annex 8). The amounts of the grants were relatively small, but helped school principals to mobilize additional funds from communities. Implementation was negatively affected initially, however, by overly complex procedures for the grants and inadequate understanding by principals and DepEd regional offices regarding eligibility criteria and the documentation required by the project for reimbursement.12 Due to slow initial implementation, DBM also subsequently reduced the Project funds allocated for this component. As such, over 100,000 grants were in fact rewarded, but only 40% were ultimately submitted for reimbursement by the Project (the grants not eligible for reimbursement by the Project were financed by the national budget).
While increased school enrollment and test performance were not included as formal project outcome indicators, these improved during the initial years of project implementation, possibly due to increased teacher and textbook availability. Total school enrollment continued to increase in the 2005/6 school year, but the net enrollment ratio declined slightly due to population growth. Test scores also declined in 2005/6, although the reasons for the decline are still being analyzed by DepEd. These trends underline the need for continued focus on progress toward education sector outcome indicators.
12 The Operational Guidelines developed for the Program specified that signed a Implementing Agreement (IA) was required between school principal and Division Superintendent in order to be eligible for reimbursement by SEMP2, but IAs were lacking for many schools. Many principals and regional education officials did not participate in the initial orientation workshops for this program (in contrast to the much higher coverage of training for the principal-led school construction program). Many SOEs were submitted with improper documentation, and the finance unit of DepEd did not provide adequate monitoring oversight in the first two years. The percentage of SOEs eligible for reimbursement improved somewhat to over 60% by 2006, however.

14
A.2 Public Health Services (US$37.5 million actual, US$26.75 million appraisal estimate) The sharp decline in vaccination coverage prior to the Project had been precipitated not only by the financial crisis, but also by a 1998 decision by DOH leadership to undertake procurement of vaccines and essential public health drugs (such as for TB control) through local suppliers, rather than through UN agencies. Due to procurement difficulties, none of these commodities were delivered from 1999 to 2001. Project financing supported the reintroduction of procurement through UN agencies for these essential commodities, and the Loan backing ensured timely payment for these supplies, which were necessary -- but not sufficient -- conditions for improving key coverage indicators. The DOH and UN agencies took a lead role in seeking to improve implementation of these programs at national and local levels. Delays in signing supply contracts with UN agencies and in payment releases delayed delivery of some commodities. In addition, late delivery of vaccines procured through the DOH system prior to the project, together with the donation of additional vaccines prior to the measles campaign, contributed to an oversupply of vaccines in 2003/4. This combined with inadequate warehouse management resulted in spoilage of some vaccines in 2005 (see below). Commodity supplies remained adequate throughout implementation, however, and did not negatively affect availability or coverage. Overall rating for this component is satisfactory. Expanded Program for Immunization (EPI): The Project financed the purchase of US$24.2 million worth of EPI vaccines and tetanus toxoid through UNICEF. It also facilitated the development and adoption by the DOH of a multi-year plan for vaccine procurement under the EPI Program. • Child vaccination: The Project helped stabilized the supply of EPI vaccines, and with
technical support UNICEF and WHO, DOH made significant progress in its campaign to immunize all children with the DPT, polio and measles vaccines. The percentage of children fully vaccinated (FIC rate) increased from 61% in 2003 to 83% in 2006, significantly surpassing the original target of 67%. The campaign to eradicate measles – which included the regular health center vaccination as well as a nationwide measles vaccination campaign in 2003, and for which the project ensured an adequate vaccine supply -- led to the drop of measles cases in 2006 to 173 cases, which is a 97% decrease from the 2003 baseline.13 The project also contributed to the country's successful maintenance of polio-free certification.
• Tetanus toxoid. The loan agreement used an indicator “the number of children protected at
birth (from tetanus neonatorum) by tetanus toxoid vaccine,” but the baseline figure and targets were mistakenly specified in terms of children infected with tetanus at birth (baseline figure of 0.2 per thousand live births in 2003). By 2006, there were no reported cases of tetanus neonatorum for the year, although this was largely because DOH no longer systematically tracked this indicator, since most neonatal tetanus cases result from at-home deliveries. With respect to the appropriate indicator; the percentage of children protected at birth with tetanus toxoid (defined as newborns whose mothers had 2 doses of TT during pregnancy child or had 3 doses prior to delivery) increased modestly from 54% in 2002 to 59% in 2006. The relatively low coverage reflects continued issues with regard to quality
13 Accord to data from the routine information system (FHSIS), measles vaccination coverage increased from 76% in 2002 to 83% in 2004 (with coverage sustained at 83% in 2006). Given the typical three-year cycle for measles epidemics, DOH undertook a month-long measles vaccination campaign in October 2007.

15
and attendance of antenatal services, as well as preference by some women (particularly those planning facility deliveries) not to receive the vaccination.
TB control: The Project financed procurement of US$9.4 million worth of TB drugs (through WHO/IAPSO and WHO/GTZ drug facilities) for 148,183 persons, against an original target of 200,000. TB drug procurement had been decentralized to regional DOH offices, which had led to a two-three fold increase in prices and unreliable supplies. The DOH re-centralized procurement, and with the shift in TB Regimen to single dose combination, project-financed procurement was done through WHO-IAPSO, which resulted in significant savings. The number of Public-Private Mix DOTS clinics increased more slowly than expected, which contributed to a shortfall in the number of TB cases identified and treated relative to projections. The TB cure rate increased steadily from 73 percent in 2003 to 83 percent in 2006, compared to an original target of 85 percent. The actual cure rate may have been higher, as a portion of TB patients who completed treatment and may have been cured were not confirmed microscopically for the absence of TB. The TB smear-positive notification rate increased from 53% to 75% in 2006, against the original target of 80 %.14 The Bank team worked closely with WHO specialists during supervision and program reviews. Supervision missions noted that regions with high TB cure rates tended to also have high case identification rates and smear-positive notification rates, suggesting continued variations by region in the quality of program implementation.
Prevention and control of rabies: Rabies was endemic to the Visayas region of the Philippines. The project financed purchase of 1.6 million USD worth of rabies immunoglobulins and rabies vaccines for people who were bitten by potential rabid animals, particularly dogs. Minimal rabies vaccines for animals were also procured. The incidence of rabies declined from 6 per million in January 2003 to 1.8 cases per million in 2006 against an original target of 1.0 case per million. While the original goal was to eliminate rabies in Visayas region, the DOH concluded in 2004 that this goal was unrealistic (due to poor logistics, low LGU support and inadequate advocacy), and instead focused its resources on eliminating rabies in Bicol Peninsula and Davao city, where the incidence was high. As of 2006, however, the incidence remains relatively high in both regions. There were 22 reported human rabies cases in Bicol translating into an incidence rate of 4.5 per million, and 10 human rabies cases in region 11 (the Davao region) translating into an incidence rate of 2.3 cases per million. One cause for the failure to attain the national and regional objective has been the persistent low coverage of rabies vaccination of dogs (which falls under the responsibility of local governments and the Department of Agriculture, whereas DOH is responsible only for human vaccination). In 2006, it was reported that only 10% of dogs were vaccinated for rabies versus the ideal coverage of 75%. A.3 Social Services (US$11.1 million actual; US$11 million appraisal estimate) This component met or exceeded all its targets. Performance is rated as satisfactory.
14 In the loan agreement, the targets were originally 95% for December 31, 2003 and 100% by the closing date, but these numbers were corrected as these numbers were targets for TB success rate (the number of cured TB cases plus cases who have completed DOTS) and not for TB smear-positive notification rate. Nonetheless, the corrected target was also not reached and was attributed by the TB program staff to the less than expected growth of the PPMD clinics.

16
Comprehensive and Integrated Delivery of Social Services (CIDSS). Under this component, the Project supported the implementation of the Comprehensive and Integrated Delivery of Social Services (CIDSS) program of the DSWD until December 2004. By the end of 2004, CIDSS reached 3,850 barangays (villages) in 1,475 municipalities/ cities of 78 provinces. Evaluation studies by academic and research institutions on the CIDSS program highlighted its effectiveness in empowering communities and LGUs to address poverty alleviation.15 Specifically, the Program built the capacities of organized community-based organizations to identify, implement and maintain sub-projects that respond to the most pressing minimum basic needs of the communities and enhanced LGU capacities to support various community projects (see Annex 7). CIDSS implementation was fully devolved in December 2004 to participating LGUs, with DSWD’s role refocused on the provision of technical assistance. The program also served as the basis for the design of the KALAHI/CIDSS project of the DSWD, which is supported by a separate World Bank loan. Support Services on Social Protection and Promotion of Rights and Welfare of the Poor and Disadvantaged In parallel with the phase-out of CIDSS financing, the project incorporated several other DSWD programs that had been financed under SEMP1. The Protective Services were designed to respond to special needs of children, women and families to safeguard them from physical harm, violence, abuse and exploitation. From CY 2004-2006, the various community-based services reached about 360,988 clients (see Annex 2). These community-based protective services16 provided the DSWD with an alternative strategy to center-based services. DSWD’s Protective services also provided relief and rehabilitation assistance to victims of disasters and calamities in coordination with the LGUs. From CY2004-06, around $3.085M was disbursed for relief assistance and $0.298M for Emergency Shelter Assistance which involved the repair of 3,169 units of damaged houses. Based on the recommendations of a report prepared during SEMP1 (the “Hoffman Report”), the DSWD prepared a Divestment Program for its Centers and Institutions. As a result of this Program, the number of DSWD-managed facilities has been reduced from 78 to 65. The divestment of facilities involved the adoption of innovative arrangements for center management, including enhancement of partnership with NGOs; and resource sharing with local government units (LGUs). The “Hoffman Report” also provided the basis for the development of the Program Supervision Model, which has been adopted by DSWD for its center-based and community-based programs, as well as in providing technical assistance to NGOs. DSWD also adopted a de-institutionalization policy which involved implementation of community-based services and other alternative placement approaches. B. Systems Improvement and Reform Total financing needs for this component were estimated at $1 million during appraisal, which were to be financed through the GOP counterpart contribution, since (as noted above) the GOP
15 Bautista, Victoria, Combating Poverty through the Comprehensive and Integrated Delivery of Social Services (CIDSS), UP National College of Public Administration and Governance, 1999. 16 Child Care and Placement; Child Protective Behavior Progrram; Tuloy Aral Walang Sagabal (TAWAG) for children with disability; Neighborhood Support Services for Older Persons, National Family Violence Prevention Program.

17
was reluctant to borrow for technical assistance. The Bank provided technical advice and support through supervision missions and local fiduciary staff on these issues, and also mobilized grant funds through a project preparation grant and capacity building grants (including Institutional Development Fund (IDF) grants for procurement and financial management). While the various participating departments incurred budgetary expenditures in support of these systems improvements and reforms, they were not separately tracked by the project reporting systems, so no disaggregated data on the GOP counterpart contribution to this component were available. Overall performance for this component is judged to be moderately satisfactory, reflecting satisfactory progress in implementing procurement reforms and improved logistics, moderately satisfactory progress in financial management, moderately satisfactory overall progress in ICT, and moderately satisfactory progress in BFAD reforms and improved teacher deployment. B.1 FM/Procurement/MIS/IT. Financial Management: Prior to the project, financial management in three social sector departments was entirely manual: accounts were rarely fully reconciled, there was no computerized accounting for system, and qualified audit opinions were the norm. Progress has been significant relative to this weak starting point, but needs further consolidation, particularly in DepEd and DOH.
• eNGAS. The Project supported the introduction and implementation [in the three Departments of eNGAS], a financial management software developed by the Commission on Audit (COA). As of the project close, eNGAS was fully operational in DSWD and DOH central offices, and partially implemented in DepEd. It is also being rolled out to DOH and DSWD field offices, and to DOH retained hospitals. The accounting division at the DepEd central office began using eNGAS in 2004, but the system is still not fully operational because of slow progress in encoding transactions and reconciling balances from earlier years. It is fully operational in only two small bureaus at the Central Office, and in one of 16 DepEd regions. DepEd is the largest Department in government, but several factors have hindered progress, including: (i) insufficient allocation of funds to support staff salaries and for IT procurement; (ii) the absence of a strong champion at DepEd for eNGAS implementation, due to frequent changes in the head of the agency and of the undersecretary for finance and administration. Progress of eNGAS implementation is to be followed up under NPSBE, and also under the NSSHRP for health.
• Strengthening overall financial management. To strengthen the effectiveness and profile of financial management, DSWD and DOH elevated the financial management units to be headed by Assistant Secretaries. DSWD has made the most progress in shifting financial management from a book-keeping to a strategic management function. DOH recruited its first “non-doctor” manager -- a senior executive from a government financial institution -- to serve as the Assistant Secretary for Finance. At the time of the ICR mission, however, performance of the DOH Finance Service has yet to reach a level where strategic financial management is in place and functioning. DepEd has made the least progress in elevating the role and function of their finance unit, and staff continue to focus mostly on transaction processing.
• Management reporting. Production of quarterly Financial Management Reports (FMRs) improved during the project, but only modest progress was made in strengthening internal management reporting in the three departments. Initial templates were developed for “flash reports” and piloted in DOH. But with incomplete roll-out of eNGAS in the three Departments, completing Flash Reports proved tedious and have not been fully implemented (as noted above, this performance indicator was dropped in 2004).

18
Procurement reform:
• Passage and implementation of procurement reform law. The increased transparency and savings generated by international competitive bidding (ICB) under SEMP1 provided evidence that contributed to the adoption in 2004 by GOP of a comprehensive national Procurement Reform Law (RA 9184). SEMP2 supported implementation in the social sector Departments of the various mandates under the new procurement law, including the establishment of procurement units, Bids and Awards Committees (BACs), the development and adoption of procurement manuals, and involvement of civil society organizations in procurement monitoring. As such, the social sectors—with support from DBM—were in the vanguard of procurement reforms nationally, even though these reforms have encountered resistance internally and externally. Reform implementation progressed the most rapidly in DSWD and DOH (even though the latter did not benefit from technical support in procurement during project preparation), due largely to “champions” for reforms in these departments.17 DepEd continued to obtain savings from ICB and NCB procurement using project financing, but procurement reforms proceeded more slowly, in part due to frequent leadership changes, although the key reforms were eventually implemented.
• Electronic Procurement. The GOP initiated development of a national electronic procurement system (eprocurement) in the year 2000, which was institutionalized through the 2003 procurement reform law. Project supervision missions provided advice and support for implementation. DOH and DSWD have made the most progress in electronic procurement. Beginning in 2004, DOH and DSWD began posting drug prices, procurement notices and awards, and misprocurements on their websites.18 These experiences have facilitated to the development of a new national electronic procurement system which is currently being rolled out nationally.19
• Civil society procurement monitoring. The SEMP2 facilitated involvement of CSOs in monitoring the procurement process in social sectors, including participating as observers in Bids and Awards Committee meetings at central level in both DOH and DepEd.
17 In its comments on the draft ICR, DSWD noted various activities undertaken by the Department in support of procurement reform. These include trainings for procurement personnel on the Government Procurement Reform Act (GPRA); the hiring of a National Procurement Specialist (NPS), who developed a national procurement manual for KALAHI-CIDSS and a Procurement Improvement Plan (PIP) for DSWD; procurement trainings for DSWD Field Offices in 2006; development in 2005 of a Project Procurement Management Plan (PPMP) in compliance with the planning and budgeting linkage provision of RA 9184; and designation of supply Officers from every office/unit to ensure compliance in the preparation of Project Procurement Management Plan (PPMP) and for requests for procurement of goods and services. 18 DSWD also actively participated in the development of e-procurement by consistently posting Invitation to Apply for Eligibility and to Bid (IAEB), Request for Quotations (RFQs), Requests for Expression of Interest (REI), not only at the Philippine Government Electronic Procurement System (PhilGEPS) but also at the DSWD website. This practice has promoted transparency and wider dissemination of procurement information and opportunities (since 2004). Further, the Department developed in 2007 the Electronic Procurement Transaction Monitoring System (EPTMS), a multi-stakeholder web-based monitoring system of procurement transactions to increase transparency and as an enhancement in the government e-procurement process 19 The Philippines Government Electronic Procurement System (PhilGEPS) will initially provide information to bidders and the public on all central public procurement, but is being rapidly rolled out to local governments, and is expected to contribute significantly to improved competition and transparency in public procurement. PhilGEPS has received technical support from various donors and from an IDF grant. Online bidding is planned for the next phase. See website: www.philgeps.net

19
During project preparation, DOH cooperated with G-Watch to review medicine procurement, including TB drugs, which revealed high prices and regional discrepancies. This contributed to the decision to return to central procurement of TB drugs, and the posting of essential drug prices on the DOH web site. Involving CSOs in provincial and LGU bids and awards committees has proven more difficult, due to resistance by some LGUs and limited procurement expertise among local CSOs.
Improved logistics. As procurement practices improved, attention increasingly turned to improving logistics and distribution systems for textbooks and vaccines. DepEd adopted a series of measures to improve efficiency and transparency of textbook distribution, including involvement of civil society monitors down to school level (see below), as well as partnering with private sector companies (such as Coca Cola) to assist in distribution to remote areas. In DOH, Bank supervision missions in 2004 and 2005 identified significant weaknesses in the storage and distribution system for vaccines. These reports and an ensuing government investigation led to personnel changes and to the adoption by DOH of a logistics strengthening program, which has significantly improved vaccine warehousing and distribution and reduced spoilage.20 An inspection of the central and a regional office warehousing facilities found that most of the agreed changes had been implemented. Management information systems (MIS) and information technologies (IT). Several key improvements were implemented, including establishment of management information systems (MIS) units and adoption of IT strategies in DOH and DSWD; establishment of Local Area Networks (LAN) and initiation of Wide Area Networks (WAN); adoption of the Information and Communication Technology Service Management (ICTSM) framework in DSWD for service and technical support; and upgrading of skills and equipment in all SEMP2 departments. A team of DepEd staff developed a Basic Education Information System (BEIS), which has become a key tool for planning, budget preparation, policy formulation, resource allocation and performance monitoring. Overall progress has been modest with respect to the more fundamental objective of using IT tools to improve operational efficiency and use information for decision making in the three departments. Fragmentation among multiple project-based information systems continues to be a problem. Integration of systems for budgeting, procurement, financial management, and supplier payment would contribute to further efficiency gains and help consolidate the reforms in each of these areas (e.g., ensuring procurement plans are linked to budgets, and that no payments are made for contracts unless they were processed according to procurement regulations). B.2 Teacher Deployment and Human Resources Planning. On the basis of the background study financed during project preparation, DepEd adopted a new teacher deployment policy. A system to improve teacher distribution was implemented, including using the Basic Education Information System (BEIS) to color-code schools according to their staffing situation, and prioritizing new teacher allocations and transfer of vacant positions to shortage schools. In the 2006 deployment, 100 percent of the 7,237 new teaching posts were allocated to “red” or “black” zone schools. Progress was achieved in reducing interquartile ratios (IQRs21), but fell short of targets – with gains coming mostly from improved teacher distribution
20 Weaknesses in the storage and logistics for vaccines were first identified in Aide Memoires in 2004, but it was the uncovering of spoilage of some 20,000 vials of vaccines in 2005 that led a government investigation, significant media government, and subsequent changes in management of logistics in DOH. 21 The IQR is the ratio between the student-teacher ratio in worst-off 25% of schools, compared to the best-off 25%.

20
within local “departments.” There were several reasons. First, new posts only represented less than 2 percent of public sector teachers. DepEd also sought to use the system to reallocate vacant teaching posts to underserved schools. This was successful among elementary schools within local departments, but efforts to reallocate vacancies from secondary schools or among departments encountered stiff resistance from local stakeholders. Second, areas with teacher shortages experienced population growth (due to in-migration) at more than double the national average. As such, inequities might have increased (rather than decreasing slightly) had the new deployment system not been implemented. B.3 Strengthening of the Bureau of Food and Drugs (BFAD). The project preparation grant supported the development of a BFAD “Masterplan” to strengthen its capacity to regulation the pharmaceutical sector and improve internal systems and processes, which was adopted by BFAD. Its management implemented a number of measures in the first years of the implementation, including hiring additional personnel to reduce the processing time of pending drug registration, completion of the Cebu and Davao satellite laboratories, and initiated computerization of its registration databases with support from a government e-technology fund. Implementation of other measures was constrained, however, by government’s restrictions on BFAD revenue retention, a shortage of personnel relative to mandates, and a limited GOP budget allocation.22 Other actions needed to strengthen BFAD are either pending or still need enactment, including the quantification of performance standards, the roll-out of the much-awaited automation of several key functions particularly drug registration, the full implementation of the new staffing based on a product-based approach, and sustained income retention. Over-all progress in improving BFAD performance relative to the initial objectives was therefore modest, and many planned activities have been “rolled” into the successor NSSHRP project. C. Strengthening Transparency and Accountability The project contributed to substantial progress in improving the transparency and efficiency in the procurement and distribution of social sector commodities (textbooks, school construction, vaccines and pharmaceuticals), through involvement of CSOs in the procurement and distribution process. Progress was modest in improving CSO involvement in the budgetary process, however, as well as in mainstreaming accountability tools such as citizen score cards. The cost of this component was estimated at US$0.5 million at appraisal, to be financed through GOP counterpart contributions and preparation grants. As in component B, the GOP did not separately track counterpart contributions for this component. Overall performance is judged moderately satisfactory¸ reflecting highly satisfactory experience in civil society involvement in textbook distribution and school construction, satisfactory progress in involving CSOs in procurement monitoring, and modest progress on improving budget transparency, expenditure tracking systems, and client scorecards.
• On the basis of a Memorandum of Understanding (MOU) developed during the project, CSOs regularly participate as observers in the procurement process at central DepEd,
22 BFAD was allowed to retain income based on provisions inserted in the 2005 General Appropriations Act. However, it was only allowed to retain the 2005 income and the provision was subsequently vetoed in the 2007 GAA.

21
DOH, and DSWD, which has increased transparency.23 Strengthening CSO involvement in procurement monitoring at the regional and LGU level is the next challenge.
• The project was highly successful in improving the transparency and efficiency of textbook distribution through involving CSOs in the monitoring of procurement and distribution of textbooks. The Textbook Count and Textbook Walk sponsored by DepEd in partnership with Government Watch – in which over three dozen CSOs were involved in monitoring textbook distribution down to individual school level -- has been cited by OECD as an international “best practice” in improving transparency of government procurement and logistics.
• Both DepEd and DPWH have signed MOUs for civil society monitoring of the school building program. The first Joint Monitoring of School building in 2003 - involving the Government Watch, with DepEd, DPWH, and World Bank - revealed high quality of SEMP and TEEP-financed school buildings, but highlighted weaknesses in the DPWH school building program. On the basis of these findings, DPWH agreed to allow greater role for school principals and parent-teacher-community associations in monitoring construction and contractor performance. Subsequent Joint Monitoring missions (now financed by USAID) have found improved performance by DPWH-financed school construction, particularly when local stakeholders were involved in on-site monitoring.24
• Annual Brigada Eskwela initiative of DepEd (from 2004) mobilized active participation and involvement of parents, communities, local government units, private sector, civil society groups during school maintenance week; generated significant resources in terms of imputed labor cost and materials (paint, supplies and materials, etc); resulted in significant cost-savings for schools; led to substantial physical improvements in school facilities/environs in many schools; and initiated good practices of actively involving stakeholders, especially of parent-teacher-community associations (PTCA) in school and student improvement, which was subsequently continued and institutionalized in many areas.
• A first round of Client Scorecards was implemented in 2002, which continues to be widely cited,25 but no follow up round has been undertaken. The indicator was dropped during the October 2004 amendment to the Loan Agreement. DBM would prefer that these surveys be financed independently from government, but an appropriate financing mechanism still needs to be developed.
• Public Expenditure Tracking Surveys (PETS). A PETS survey for education was budgeted in the project preparation grant, but not completed prior to project effectiveness. Due to a combination of funding constraints and focus on other priorities, this indicator was subsequently dropped. Various approaches for improved tracking of public expenditures are being pursued in the sectoral programs and through the Bank’s governance dialogue.
• Budget monitoring – DBM has begun posting budgetary and budget execution information on its web site, and prepared a brief action plan for improving budget monitoring and civil society involvement. Progress on the latter has been limited, due to
23 National-level Civil Society Organizations (CSOs) that have regularly participated in procurement monitoring include the Transparency Accountability Network (TAN), NORFIL, and Procurement Watch. Fewer local CSOs have experience in procurement monitoring, which has constrained CSO involvement in procurement monitoring at LGU level. 24 See G-Watch, April 2007. 25 World Bank and Social Weather Station. “Filipino Report Card on Pro-Poor Services,” Manila, 2002. An October 2007 workshop in Manila on social accountability highlighted a variety of tools and experiences that have been developed, and made recommendations for further mainstreaming.

22
DBM’s focus on other priorities and limited capacity among CSOs to engage in budget monitoring.
3.3 Efficiency The Project’s overall efficiency is rated as substantial. This is based on (i) substantial direct cost savings generated by the project, particularly for textbooks; (ii) substantial improvements in cost-effectiveness of social sector inputs and processes, such as for school construction; (iii) substantial cost-effectiveness of health sector interventions, particularly for vaccination; (iv) substantial “spin-offs” and externalities from reforms introduced by the project on overall government social sector expenditures, including implementation of procurement reforms, logistics improvements, increased civil society involvement in procurement monitoring and service delivery (see Annex 3). While the economic returns from improving access to education and improved health care are known to be high, as a multifaceted social sector project, it is not possible to calculate an overall Economic Rate of Return or Net Present Value. Strictly on the basis of cost savings, however, SEMP2 contributed direct savings to the government equal to $35.8 million for textbooks alone, relative to prevailing prices of government textbook procurement in 1998-99, prior to the SEMP projects. Moreover, international competitive bidding by SEMP1, SEMP2, and TEEP generated approximately US$125 million in cost savings over 1999-2006 million. Adjusting for inflation (2006 prices) increases the estimated savings textbook procurement to $153 million (see Annex 3). Direct cost savings for the principal-led school construction program were more modest ($131,000 savings relative to construction costs by DPWH, and $350,000 savings relative to the originally budget costs for classroom construction). The direct cost savings estimates do not include, however, significant indirect savings due to improved quality for textbook and school construction, or the substantial savings and efficiencies in the logistics and distribution systems for textbooks and vaccines, which are difficult to estimate quantitatively. While vaccination is an eminently cost-effective intervention, the project contributed to DALY reductions at costs below international standards. Available data suggest that the cost per incremental Disability Adjusted Life Year (DALY) averted ranged from US$30.5 (measles) to US$134 (for DPT). Incomplete data for the TB program make estimations more difficult, but available data suggest that the project contributed to DALY reductions from TB mortality at approximately $34 per DALY reduced, which is cost-effective but slightly higher than average estimates for developing countries.
3.4 Justification of Overall Outcome Rating The overall outcome rating is Satisfactory, on the basis of high relevance, substantial efficacy, and substantial efficiency.
3.5 Overarching Themes, Other Outcomes and Impacts (a) Poverty Impacts, Gender Aspects, and Social Development No direct data are available on poverty impacts. The project increased availability of social sector inputs in the public sector (including vaccines, school textbooks, etc) that disproportionately are used by the poor. Evaluation of the CIDSS subcomponent showed positive contributions to community infrastructure and social capital.
23
(b) Institutional Change/Strengthening The project made significant contributions to promoting key policy reforms, as well as to translating those reforms into guidelines, procedures, and practices, which contributed to improved performance in the social sectors, and also created a “demonstration effect” that helped promulgate reforms in other government departments. International procurement practices as applied in the SEMP and other WB projects provided evidence that supported passage of the (Phil) Government Procurement Reform Act (RA 9184), and SEMP2 supporting implementation and operationalization of the reforms. The project introduced new accountability arrangements and innovative practices, including community school construction, improved teacher deployment system, civil society monitoring of textbook distribution and school construction, and formalized these arrangements through MOUs between government departments and CSOs, many of which are now being “mainstreamed.” (c) Other Unintended Outcomes and Impacts (positive or negative) While the procurement reforms supported by the project were expected to generate opposition, few anticipated the aggressiveness and highly organized nature of the campaign by losing bidders to overturn textbook procurement award decisions and to undermine the procurement reforms (including making public accusation of corruption against DepEd and World Bank staff 26). While a great deal of misinformation was, and continues to be disseminated in the media and public fora, a positive outcome has been the confirmation by the Supreme Court of the award decision, and mobilization of reform supporters in government and civil society to defend the reforms. (See Annex 9).
3.6 Summary of Findings of Stakeholder Workshops As two-day stakeholder workshop was organized during the ICR mission, which included key staff from participating departments, and representatives of civil society organizations that were involved in the project. The workshop summarized project results, summarized lessons and recommendations (see Annex 6). Participants also anonymously rated project outcome, Bank and borrower performance. Stakeholders rated all of these to have been fully satisfactory.
4. Assessment of Risk to Development Outcome The risk to development outcomes is rated as Modest. The most significant risks to development outcomes include (i) risks to sustaining and consolidating the reforms and systems improvements supported by the project, including for procurement and financial management, (ii) risks to sustaining or maintaining inputs or programs supported by the project, including school buildings, textbooks, or the teacher deployment system. While the project has helped implement and consolidate the procurement reform law and electronic financial management system, opposition to procurement reforms persists. To mitigate this risk, reformers within the GOP, WB, and civil society partners have sought to publicize the benefits of the reforms and mobilize
26 In addition to making various corruption accusations in print and electronic mass media, lawyers for some of the losing bidders filed formal procurement protests to World Bank headquarters, as well as several formal complaints with the World Bank’s Department of Institutional Integrity (INT) against Bank Staff. INT reviewed the accusations according to its procedures and found insufficient basis to warrant further investigation.

24
support for further deepening the reform process. The recent Supreme Court ruling represented an important victory against legal challenges to procurement reforms. Systems improvements (in FM and IT) face risks in terms of staff turnover (DOH) and the need for senior management to consolidate progress. The successor projects in health, education and (under preparation) social protection will seek to continue progress in implementing improved practices and replicate successful programs in the sector departments. To mitigate risks to inputs financed by the project, GOP has increased budget allocations for operations and maintenance, and new health and education projects are supporting efforts to ensure adequate maintenance. In terms of budgetary reforms, the shift to a national Medium Term Expenditure Framework (MTEF) is helping to uphold yearly provisions of teacher positions to keep up with population growth, and to gradually shift budget funds toward education and health.
5. Assessment of Bank and Borrower Performance
5.1 Bank Performance (a) Bank Performance in Ensuring Quality at Entry Bank performance during project preparation was fully Satisfactory. The project design was well grounded in lessons of previous operations, and a project preparation grant helped strengthen preparation of key components and reforms. There was strong continuity of team members from the SEMP1 project—including for procurement and financial management—and the team worked closely with key counterparts in DBM, sector departments, and civil society in preparing the operation. (b) Quality of Supervision The quality of Bank supervision is also rated as Satisfactory. The project benefited from twice-yearly formal supervision missions, which regularly included subsector specialists (e.g., IT or education specialists), as well as regular follow-up from field-based fiduciary and technical staff. Supervision missions and Aide Memoires were used to monitor progress toward agreed objectives, and to raise policy and technical issues with DBM and the sector departments. The Bank’s procurement and financial management team members devoted significant time to providing advice and technical support to their GOP counterparts in implementing reforms – above and beyond their regular responsibility for monitoring and clearing project-specific transactions. Given the wide range of activities and reforms supported by the project, a few issues did not receive consistent attention during supervision missions (such as client scorecards, or improving transparency of the budget process), although many of these are now being picked up by other Bank country program activities. Continuity of the Bank’s engagement in activities and reforms supported by the project have been assured by the design and implementation of national program support operations in education and health, and a social protection operation is under preparation. (c) Justification of Rating for Overall Bank Performance On the basis of satisfactory performance during both preparation and supervision, overall Bank performance is rated Satisfactory.

25
5.2 Borrower Performance (a) Government Performance Government performance is rated as Satisfactory. (b) Implementing Agency or Agencies Performance Overall rating of implementing agency performance is judged satisfactory, based on average the performance of the four key implementing agencies.
• DepEd: Performance was fully satisfactory with respect to achievement of output targets for textbook procurement and school construction, moderately satisfactory with respect to reform implementation (with satisfactory progress on procurement reforms, moderately unsatisfactory progress in eNGAS implementation and FM reforms, and moderately satisfactory progress on teacher deployment), and highly satisfactory with respect to increasing civil society involvement. As the largest government ministry (with schools not devolved to Local Government Units (LGUs)), implementing reforms (such as in financial management) was clearly a challenge, but was also exacerbated by frequent leadership changes and varied commitment by mid-level managers. Performance is judged satisfactory overall.
• DOH: DOH performance with respect to provision of vaccines (including the decision to use UN agencies for procurement) was fully satisfactory; performance for the TB and rabies programs were moderately satisfactory, since they did not meet original performance targets. Despite having not participated in SEMP1, DOH made substantial progress in implementing procurement reforms (although streamlining procedures remains a priority), and modest progress in financial management reforms (the latter has been undermined by inadequate capacities for strategic finance management at the DOH Finance Service, however). When problems in vaccine logistics were uncovered, DOH management moved quickly to address them. Overall performance is rated satisfactory.
• DSWD: DSWD was usually the first department to implement reforms in procurement, financial management, and information technology systems, and also fully met or exceeded initial targets with respect to the CIDSS program and support services on social protection. Recommended reforms with respect to centers and institutions have been only partially implemented, however. Overall performance is rated satisfactory
• DPWH: The School Building Program implemented by DPWH was plagued by prolonged delays; although it was agreed to adopt National Competitive Bidding (NCB) procedures for school construction, the Bank was forced to reject all initial contract packages prepared by DPWH district offices. When the packages were rebid centrally, DPWH leadership was slow to exercise legal remedies against poorly performing contractors. Mitigating this poor performance was the agreement by DPWH to involve CSOs in monitoring the school building program, and efforts by central staff to complete the centrally bid contracts despite delays. Overall performance is judged moderately unsatisfactory.
• DBM: DBM staff and senior managers demonstrated strong ownership of project objectives, and strong commitment to implementation of key reforms in the sector departments and nationally. Key staff have been remarkably stable throughout SEMP1 and SEMP2, contributing to continuity in implementation and oversight. Delays in release of cash allotments for some programs contributed to implementation delays. Overall performance is rated Satisfactory.

26
(c) Justification of Rating for Overall Borrower Performance On the basis of an overall satisfactory rating for government performance, and a majority of implementing agencies performing satisfactorily, overall borrower performance is rated Satisfactory.
6. Lessons Learned The SEMP2 experience demonstrated the importance of linking reforms to clear outputs and anchoring the program very clearly within the macroeconomic constraints and policy context of the country. It also demonstrated that progress is possible on difficult governance reforms in the social sectors, while illustrating the “stop and start” nature of the reforms and the varied progress across sectors and reforms.27 The Borrower’s ICR and The ICR stakeholders workshop produced a wide range of lessons and recommendations (Annexes 5 and 6). Some of the key lessons are summarized below. Promoting and consolidating governance reforms. The stakeholder workshop underlined the role of SEMP2 in the reform process. “DBM was charting new orientations in public expenditure management and embarking on wider budget reforms. The SEMP lessons provided demonstration windows for policy definition and validation – for example, providing the learning for GOP on the need to work on the framework for procurement reforms, which contributed to the drafting and passage of the procurement law (RA 9184).” The SEMP2 supported implementation of reforms through translation of reform policies into actual processes, guidelines and transactions involving project components, which were subsequently integrated into mainstream departmental and governmental processes. Key elements of success included:
• Sustained championship for reforms at the Secretary, Undersecretary, and Assistant Secretary levels was the key factor in the degree of progress. Given turnover at the senior management level, strengthening capacity and commitment by middle managers was key to success and essential for sustaining reforms and system improvements.
• Demonstrated successes were replicated across social sector departments, and subsequently other government departments.
• The involvement of World Bank and other donors in reform implementation provided value added in terms of the discipline and oversight involved in WB procurement and financial management rules (particularly prior to passage of RA 9184), and helped strengthen the position of reform-oriented senior managers and line personnel, particularly when they were subject to internal or external “pressures.” Supervision missions provided important opportunities for assessing progress, sharing lessons, and dialogue on technical and policy issues.
27 The 2003 joint report on the School Building Program opened with the following quote: “…Getting good government is a lengthy, laborious and multifaceted process, fraught with opportunities for failure and misspent resources.” Quoted from Merilee Grindle (ed.), Getting Good Government: Capacity Building in the Public Sectors of Developing Countries (Harvard University Press: Boston, MA 1997). The SEMP2 experience confirms the “lengthy and laborious” nature of reform processes, but it is notable that SEMP2 financing for social sector inputs were spent effectively and efficiently.

27
• Reform efforts met with (continuing) resistance and created considerable stress for those working on changes. Reform supporters in government and civil society will need to continue to work together to publicize the positive contributions of reforms, including in public and the media, in order to stem efforts by reform opponents to reverse or weaken key legislation and systems.
Strengthening accountability and civil society engagement. Efforts to strengthen “bottom up” accountability were a crucial complement to “top down” reforms and systems strengthening efforts. Key lessons include: (i) The participation of civil society and other stakeholders in procurement and monitoring of service delivery is essential to ensuring efficiency in resource use, enhancing impact, mobilizing resources, and increasing accountability; (ii) piloting of CSO involvement in the context of a Bank-financed project helped establish relationships and build confidence among central government, CSO, and local stakeholders, and to demonstrate the value added of CSO monitoring; (iii) formalizing these relationships through MOUs has helped “mainstream” these arrangements nationally; (iv) the quality and depth of CSO participation has been greatest in monitoring delivery of books and school construction at the local level, and in monitoring procurement at central level. CSO involvement has been more limited in procurement monitoring at LGU level, and in budget monitoring at national level, largely due to lack of capacity and resources; (v) CSO participation could be made more sustainable through enhancing technical capacity and networking among CSOs, identifying stable funding sources, strategic deployment and/or enhancing local CSO capacity in rural/remote areas. Decentralization. Project experience demonstrated that if local accountability and participatory mechanisms are in place, decentralization of service delivery (e.g., for school construction) can improve quality and efficiency. If those conditions are not in place (e.g., as was the case for TB drug procurement or textbook procurement), centralized procurement and oversight, combined with local monitoring of service delivery, led to better outcomes. Given that delivery of most social services is devolved, however, a strong message from the ICR workshop is that supporting the implementation of fiduciary reforms and increasing transparency and accountability for results at the LGU level is critical. This requires an integrated effort of dialogue and capacity building with local chief executives and politicians (involving both central authorities and local constituents) with respect to national reform laws and regulations; rolling out system strengthening reforms at local level, including eNGAS, eProcurement (PhilGEPS), and revised chart of accounts; strengthened oversight and monitoring by central agencies, both fiduciary oversight and service delivery (through “LGU Scorecards”); and strengthening capacity of local CSOs and communities to monitor service delivery and use of LGU resources. Implications for National Program Support (NPS) and instrument “mix.” The SEMP projects introduced the use of investment lending to finance priority line items in agency budgets.
• In doing so, it assured cash availability for priority expenditure items while providing an entry point for improving national fiduciary systems and related reforms. The use of national systems was both an advantage and constraint. It helped mainstream systems reforms, but meant that project execution was at times negatively affected by delays in the cash allotment process, weaknesses in the human resource management system, etc.
• Technical assistance was not included in the loan, and even if eligible, was difficult to procure through government processes. The Bank and GOP managed to mobilize TA through various other sources, including project preparation grants and capacity building grants (PDF). While insufficient TA was not the binding constraint for slow progress of some reforms (e.g., FM reforms), it is clear that having flexible TA available through other sources (including development partners) is an important complement to the NPS approach, particularly to support capacity building and reform implementation.

28
• Would a Development Policy Loan (DPL) have been equally effective in promoting these reforms (e.g., providing direct budget financing based on achievement of agreed reforms)? The consensus among stakeholders and the ICR team is “no.” While a DPL could have included policy conditions related to certain reforms, the complex and highly political nature of these reforms suggests that policy conditionality alone would have had limited impact. Policy lending should be considered a complement to, rather than a substitute for, this type of targeted support for sector reform implementation.
• With the transition toward “sectoral” NPSs, one lesson emerging is the need to establish other forum for lesson sharing among the social sector departments and to facilitate dialogue with DBM and other central departments.
Systems strengthening. Targeting strategic (sector/fiduciary ) policies and monitoring their implementation in Bank-funded projects is useful in ensuring greater effectiveness in the use of existing resources, and effective use of savings from policy interventions and additional resource mobilization to enhance quality. Specific lessons include: (i) assigning responsibility to the Government agency organic staff helps to ensure institutionalization and mainstreaming of innovations and reforms and sustainability of gains; (ii) systems improvements and reforms in procurement, FM, IT need to be integrated in order to achieve further efficiency gains, particularly with regard to timely payment systems, planning and budget execution; (iii) while the multi-sectoral design of the SEMP2 increased project complexity, it also facilitated cross-agency learning and demonstration effect of the faster reformers on other departments/units. An ICR workshop recommendation was to continue this through annual social sector reviews involving the three departments and DBM.
7. Comments on Issues Raised by Borrower/Implementing Agencies/Partners (a) Borrower/implementing agencies: DBM and implementing agencies provided comments on the draft ICR, which have been incorporated into the final document. See Annex 5 for a summary of the Borrower’s ICR. (b) Cofinanciers: Not Applicable. (c) Other partners and stakeholders: See Annex 6 for a summary of stakeholder workshop finding and recommendations. The key messages have been incorporated in the ICR.

29
Annex 1. Project Costs and Financing
(a) Project Cost by Component (in USD Million equivalent)
Components Appraisal Estimate (USD millions)
Actual/Latest Estimate (USD
millions)
Percentage of Appraisal
A. STRENGTHENING KEY BUDGETARY PROGRAMS
A.1. BASIC EDUCATION SERVICES 75.10 50.35 67.04
A.2. PUBLIC HEALTH SERVICES 26.75 37.53 140.30
A.3. SOCIAL SERVICES 11.00 11.11 101.00 B. SYSTEMS IMPROVEMENT AND REFORM 1.00 0.00* 0.00*
C. STRENGTHENING TRANSPARENCY AND ACCOUNTABILITY
0.50 0.00* 0.00*
Total Baseline Cost 114.35 99.00 115.50
Physical Contingencies 0.00
0.00
0.00
Price Contingencies 0.00
0.00
0.00
Total Project Costs 0.00 0.00 Project Preparation Fund 0.00 0.00 .00 Front-end fee IBRD 1.00 1.00 100.00
Total Financing Required 115.35 100.00 115.35
(b) Financing
Source of Funds Type of Cofinancing
Appraisal Estimate
(USD millions)
Actual/Latest Estimate
(USD millions)
Percentage of Appraisal
Borrower 15.35 0.00* 0.00* International Bank for Reconstruction and Development 100.00 100.00 100.00
* Components B and C were to be financed through the GOP counterpart contribution. While the sectoral departments incurred expenditures related activities under these components (including for staff, equipment, and logistics), these were not tracked separately by the project monitoring system.
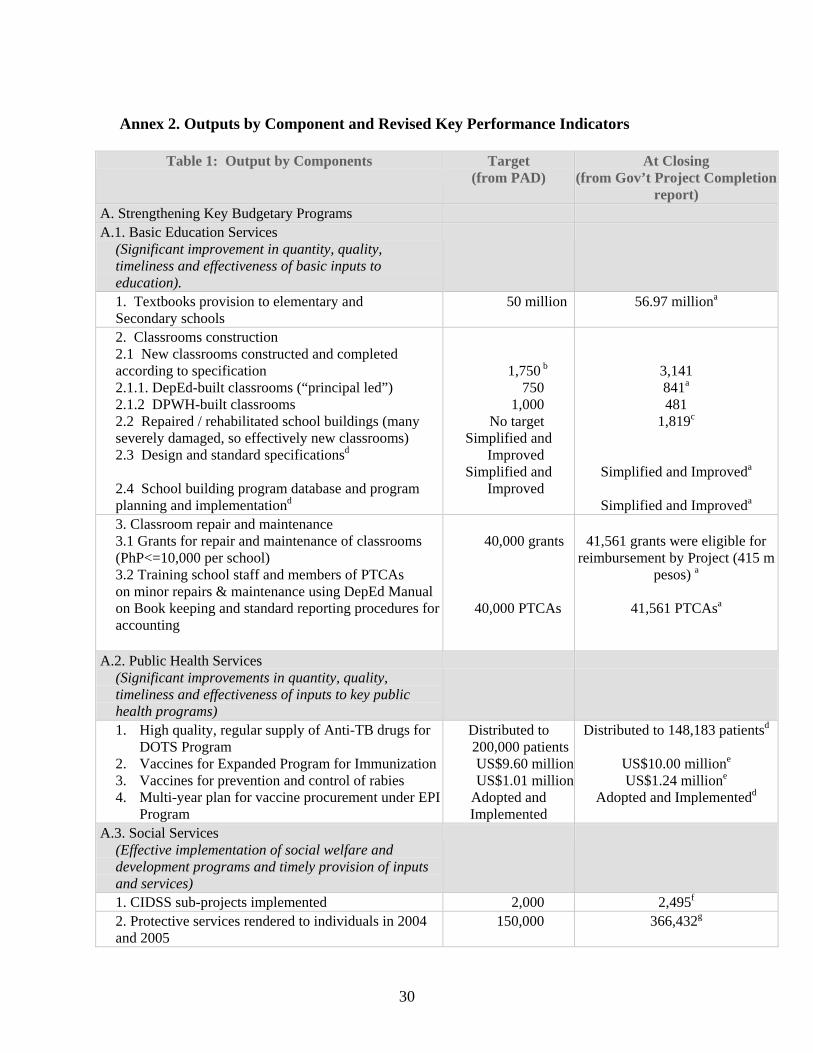
30
Annex 2. Outputs by Component and Revised Key Performance Indicators
Table 1: Output by Components Target (from PAD)
At Closing (from Gov’t Project Completion
report) A. Strengthening Key Budgetary Programs A.1. Basic Education Services
(Significant improvement in quantity, quality, timeliness and effectiveness of basic inputs to education).
1. Textbooks provision to elementary and Secondary schools
50 million 56.97 milliona
2. Classrooms construction 2.1 New classrooms constructed and completed according to specification
2.1.1. DepEd-built classrooms (“principal led”) 2.1.2 DPWH-built classrooms 2.2 Repaired / rehabilitated school buildings (many severely damaged, so effectively new classrooms) 2.3 Design and standard specificationsd 2.4 School building program database and program planning and implementationd
1,750 b 750
1,000 No target
Simplified and Improved
Simplified and Improved
3,141 841a 481
1,819c
Simplified and Improveda
Simplified and Improveda 3. Classroom repair and maintenance 3.1 Grants for repair and maintenance of classrooms (PhP<=10,000 per school) 3.2 Training school staff and members of PTCAs on minor repairs & maintenance using DepEd Manual on Book keeping and standard reporting procedures for accounting
40,000 grants
40,000 PTCAs
41,561 grants were eligible for
reimbursement by Project (415 m pesos) a
41,561 PTCAsa
A.2. Public Health Services (Significant improvements in quantity, quality, timeliness and effectiveness of inputs to key public health programs)
1. High quality, regular supply of Anti-TB drugs for DOTS Program
2. Vaccines for Expanded Program for Immunization 3. Vaccines for prevention and control of rabies 4. Multi-year plan for vaccine procurement under EPI
Program
Distributed to 200,000 patientsUS$9.60 million US$1.01 million
Adopted and Implemented
Distributed to 148,183 patientsd
US$10.00 millione US$1.24 millione
Adopted and Implementedd
A.3. Social Services (Effective implementation of social welfare and development programs and timely provision of inputs and services)
1. CIDSS sub-projects implemented 2,000 2,495f 2. Protective services rendered to individuals in 2004 and 2005
150,000 366,432g

31
3. Evaluation and monitoring tools for improved management of residential centers and institutions
Developed and Adopted
Developed and Adoptedd
4. Relief goods for victims of disasters/ calamities PhP26.78 millionh PhP141.94 millioni 5. Core shelter for victims of disasters/ calamities 2,363 Unitsh 5,515 Unitsi 6. Emergency shelter assistance for victims of disasters/ calamities
2,983 Unitsh 3,169 Unitsi
B. Systems Improvement and Reform B.1 Strengthening of FM/Procurement/IT systems 1.FM-procurement-MIS-IT improvement plans Completed Completed 2. eNGAS in DSWD, DOH and DepEd Central offices Completed Completed in DSWD and DOH;
not yet fully operational in DepEd3. Streamlining of budget process in DepEd, DOH and DSWD
Implemented Implemented
4. Financial analysis capability training and development for central office (CO) and 16 regional offices (ROs)
Developed and Trained
DOH and DSWD- developed and Trained at CO and selected ROs; DepEd developed and trained at
CO and ROs 5. Training and skills upgrading of FM staff as part of governance capacity building
Trained Training program developed, training starts in early 2008
6. Establishment of procurement unit and streamlining of procurement processes in DepEd and DOH
Completed Implemented
7. Modern tracking and monitoring system to include whole procurement cycle in particular, execution of contract management functions
Developed Under development
8. Annual Statistics of DepEd published within 6 months of year-end
SY2003/2004 stats published
SY 2002/2003 stats published; SY 2003/2004 under preparation
9. Computerized filing system for bidding process with record codification
Develop Developed
10. Contract distribution system in DOH Adopted Maintained 11. Interim IT organization formed in DepEd Completed Pending approval of DepEd
“reengineering” plan 12. Procurement staff profiles and training Established Implemented 13. E- procurement system Developed Electronic advertisement only.
Bidding and awarding system are manual
14. MIS “flash reporting” system in DepEd, DSWD and DOHj
Completed Completed in DepEd; not implemented in DOH or DSWD
B.2 Human Resources Management Improvement New teacher deployment system in DepEd Completed A new teacher deployment Policy
was adopted by DepEd, and a system for targeting new teacher
deployment to underserved schools was implemented.a
B.3 Strengthening Bureau of Food and Drugs 1. Plan for streamlining of Bureau of Food and Drugs Completed BFAD Masterplan was formally
adopted; modest progress in implementation
2. Define and maintain BFAD performance standards Maintained Maintainedd

32
C. Strengthening Transparency and Accountability Action plan for increased transparency and accountability in budgetary processes in social sectors
Implemented Under implementationk
Notes to data: a Data as of May 2007 (DepEd Project Completion Report, 2007) b Target includes combined DepEd- and DPWH-built construction (Project Appraisal Document) c No target from PAD. Actual accomplishment from cost savings by DepEd in school building. d DOH Project Completion Report , 2007
e Difference of target and actual amount may be due to peso dollar rate fluctuation. At PAD, the rate is at US$1=PhP51, at ICR, the rate is US$1=PhP44. Data from DOH BIHC as of end 2006. f DSWD SEMP2 Project Completion Report, 2007 g Cumulative accomplishment from 2004 to 1st semester of 2006 broken down as 158,450 (2004), 175,319 (2005) and 30,780 (1st semester 2006). (DSWD SEMP2 Project Completion Report, 2007) h No target, actual amount for CY 2004. i Cumulative amount from CY 2004 to CY2006 (DSWD SEMP2 Project Completion Report, 2007). j Dropped in the amendment of the loan agreement
Table 2: DSWD Physical Accomplishment for Protective Services By Sector: CY 2004- First Semester, 2006
Year Sector 2004 2005 2006 (First Sem.) Total
Children 76,341 73,647 10,894 160,882 Youth 3,570 9,183 2,383 15,136 Women 4,576 6,218 1,462 12,256 Persons with Disability (PWD)
197 13,114 807 14,118
Older Persons 1,665 1,727 373 5,654 Families 64,636 64,749 10,404 139,789 Deportees 7,459 6,681 4,457 18,597

33
Table 3: Summary of Revised Key Performance Indicators* Original Amendment A.2 Basic Health # 5 Rabies free Visayas Rabies free population # 6 Increase TB smear positive notification rate Baseline: 85%; 12/31/2003: 95% Closing: 100%
-same indicator, with revised baseline and targets: Baseline: 53%; 12/31/2003: 70%; Closing: 83%
A.3 Social Services [new indicator for new subcomponent] #2 150,000 individuals served by protective services
in 2004 and 2005 [new indicator for new subcomponent] #3 Develop and adopt program evaluation and
monitoring tools for improved management of residential centers and institutions
B.1 Strengthening of FM/ Procurement/ IT Systems #2 Spreadsheet based accounting systems installed in central offices of DepEd and DSWD
# 2: NGAS operational in DSWD, DOH and DepEd central offices
#3 Implement a MIS flash reporting system in DepEd
Indicator dropped;
B.2 Human Resources Management Improvement # 1 Reduce number of schools with pupil:teacher ratio >50:1
This indicator was dropped, since it is already captured in indicator #2 below.
#2 Reduce inter quartile ratio for teacher deployment at division, region, and national level
#2 Indicators split into elementary and secondary, and data source identified Baseline 12/31/2003 Closing Elementary 2.17 2.10 1.75 Secondary 2.62 2.5 2.20
C: Increase Transparency and Accountability Develop and implement a Public Expenditure Tracking System
Indicator was dropped
# 2 Increase in client satisfaction with basic social services
Indicator was dropped
[new indicator] Develop and adopt action plan for increased transparency and accountability in budgetary processes in the social sectors
*Based on amendment of Loan Agreement, approved on October 19, 2004

34
Annex 3. Economic and Financial Analysis As described in the main text, section 3.2, the Project enhanced development objectives in three areas: (A) Strengthening Key Budgetary Programs, (B) Systems Improvement and Reform, and (C) Strengthening Transparency and Accountability. The actual costs by area and programmatic section are provided in Table 1 below.
Table 1: SEMP2 costs, US$ millions
Components Appraisal Estimate
Actual/Latest Estimate
Percentage of Total Actual
A. Strengthening Key Budgetary Programs A.1. Basic Education Services 75.1 50.35 50.9% A.2. Public Health Services 26.75 37.53 37.9% A.3. Social Services 11 11.11 11.2%
B. Systems Improvement and Reform 1 0* 0* C. Strengthening Transparency and
Accountability 0.5 0* 0*
• Components B and C were to be financed though the GOP counterpart contribution. While the sectoral departments incurred expenditures related activities under these components (including for staff, equipment, and logistics), there were not tracked separately by the project monitoring system.
Of these areas, (B) and (C) represent the most difficulty in assigning economic benefits, because of the reforms and improvements are process oriented, with accumulated developmental outcomes. These areas represented only 1.3% of Project costs at appraisal. The benefits from these program areas are potentially significant over time; – particularly since they seek to improve the effectiveness and efficiency of all budgetary expenditures in the social sectors -- implying that in a long-term analysis, these Project investments would be rewarded with large benefit-cost ratios. The intermediate outcomes for the two areas (B) and (C) were noted in part F of the introductory Data Sheet, and include demonstrable increases in the capacity of partner government organizations and entities to perform their functions on time, as per plan, and on budget. These areas were rated moderately satisfactory overall based on performance in component activities. The associated improvements in service delivery will impact developmental outcomes in the Philippines in two ways:
• Direct benefits accruing to customers of public services: For component B.2, the benefits to pupils of teacher redeployment funded through the Project over 2003-07 are direct, especially in underserved schools where new nationally-funded teachers were deployed.28 Per PDO indicator 6 in the Data Sheet (section F), the reduction in the overall IQR is a metric of the reducing overall inequity in teaching resources across the Philippines. The redeployment should also reduce overall Pupil-Teacher-Ratios (PTR) without requiring
28 “Second Social Expenditure Management Project (SEMP 2) – Project Completion Report”, Draft Version 2 (December 12, 2007), Project Development and Evaluation Division, Office of Planning Service, Department of Education, Republic of The Philippines.

35
an increase in the total number of teachers29. Based on review studies for developing countries, while the effect on student attainment from reducing the PTR is less significant than teacher education and experience,30 benefits of reducing PTR increase as the educational system develops.31 Therefore, if both the overall IQR and overall PTR continue to fall, the benefits to society from reduced inequity in education and higher student attainment will continue to accrue. The value of these benefits is not immediately quantifiable in monetary terms.
• Benefits to Government departments/agencies from improvement procurement, financial management, planning/budgeting, and information technologies (indirect benefits to customers and society): Improved functioning in participating agencies and departments of the Government under component B.1 will lead to cost savings for the budget, reduced wastage/leakage of funds, and enhanced coverage and quality of services to customers. Improved procurement, logistics, and financial management will contribute to significant cost savings for public sector funds and reduced wastage of resources, although the extent of savings are difficult to quantify. Improved budgetary planning and transparency, and improved internal management systems are likely to contribute to increase efficiency in the allocation of government resources in the social sectors. The cost of providing high quality government services to society should thus decline over the future due reforms support by the project.
The rest of this Annex concerns the area Strengthening Key Budgetary Programs – accounting for nearly 100% of actual Project costs – in which the programs are: (1) Basic Education Services, (2) Public Health Services, and (3) Social Services. Instead of the standard benefit-cost or internal rate of return analysis, the focus below is on economic aspects of the program benefits and to quantify these where possible. The dates below are used as indicators for the assignment of specific benefits recorded in various calendar or fiscal years to the SEMP projects.
Signed Project Closing
SEMP 2 Project dates Sept-2002 June-2007
SEMP 1 Project dates Sept-1998 Dec-2002 1. Basic Education Services (i) Textbooks and teacher manuals procurement and distribution: This component generated benefits for students, the Government, and the formal education sector in general. First, from the investments under the Project as well as the Third Elementary Education Project (TEEP), the availability of textbooks increased from the average country-level textbook-student ratio of 1:2.5 prior to the Project to nearly 1:1 for core elementary subjects. For secondary students, the textbook-student ratio increased to 1:1.3 on average. Besides the increase in textbook availability, the quality of textbooks provided – physical (thicker paper, durable binding, and better printing)
29 This effect follows since all schools are not equal – large, well-funded schools can have higher attainment at a given PTR compared to smaller schools because of other resource advantages. 30 Eric A. Hanushek, “Interpreting recent research on schooling in developing countries,” World Bank Research Observer 10(2): August 1995, pp. 227-246 31 For example, the evidence from the U.K. shows that reducing PTR, ceteris paribus, raises math and science attainment in secondary schools. See: Steele et al, J.R. Statist. Soc.(2007) 170, Part 3, pp 801-824

36
and content/accuracy – improved. Both the quantity and quality32 of textbooks can be related to student attainment. The international evidence base for the relationship between quantity of textbooks and student attainment is discussed below. Second, the Project also instituted international competitive bidding (ICB), a process improvement that generated cost savings for the Government which can be expected to continue to accrue in the future. Third, the Project improved processes related to the distribution and allocation of textbooks across schools which improved the equity, timeliness, and efficiency of the system. These benefits to the education sector will also accrue as long as the processes are maintained. This lattermost benefit is not amenable to quantification for purposes of this analysis. Student Attainment: Increased textbook resources in developing countries have been related to student attainment in a vast literature of statistical analyses and in natural experiments. 33 34 35 Results broadly indicate that where textbooks are scarce, providing them to students yields high returns36. In the Philippines, a study in the mid-1980s of the impact of increased textbook availability on student attainment concluded that the overall effect of the first year of increase in textbook availability was to raise academic achievement by one-third of a standard deviation for language and math, and one-half for science (in the affected grade levels).37 These impact coefficients are relevant to their time period, but also inform the benefits of the reduction in textbook-student ratios achieved two decades later under this Project (SEMP 2).
32 Specifically, the physical quality improvements also raise the usable life of the textbook – from 2 years in 1999 to 4-5 years now, which increases the period during which benefits accrue from a single purchased copy. Source: testing done by Industrial Technology Development Institute of DOST 33 Lockheed et al. “How textbooks affect achievement in developing countries: Evidence from Thailand,” Educational Evaluation and Policy Analysis 8(4): Winter 1986, pp. 379-392 34 Results from a randomized evaluation in Kenya suggest that the benefits largely accrue to students with stronger academic backgrounds, and are sensitive to the language of the textbooks. Glewwe et al. “Many children left behind? Textbooks and test scores in Kenya.” Poverty Action Lab Paper No. 44, July 2007 35 Cost effectiveness of the increase in textbook availability compared to other inputs into education varies according to country context. An early review found that textbooks were more cost-effective in a country (Brazil) vs. teacher training, and vice-versa in another country (Nicaragua). M. Lockheed & E.A. Hanushek, “Improving educational efficiency in developing countries: what do we know?”, Compare 18(1), 1988. 36 Michael Kremer, “Research on schooling: What we know and what we don’t. A comment on Hanushek,” World Bank Research Observer 10(1): August 1995, pp. 247-254. 37 The study evaluated the impact of the “Philippines Textbook Project” (rollout during 1977-78, a part of the Third Education Project funded with a World Bank loan). The project reduced the textbook-student ratio from 1:10 prior to the investments to 1:2 at the end of the project. The study compared the with-project student achievements to the natural control group of prior year students (who did not receive the project benefits) See Heyneman et al. “Textbooks in the Philippines: Evaluation of the pedagogical impact of a nationwide investment,” Educational Evaluation and Policy Analysis 6(2): Summer 1984, pp. 139-150.

37
Table 2: National Achievement Test (NAT) Results for core subjects
School Year Achievement Rates 2002-2003 2003-2004 2004-2005 2005-2006
Elementary Achievement Rate * 43.54 * 53.99 * 57.46 * 51.49 Mathematics 44.84 59.45 59.10 53.66 Science 43.98 52.59 54.12 46.77 English 41.80 49.92 59.15 54.05 Filipino 61.75 60.68
Secondary Achievement Rate * 36.07 * 44.36 * 47.17 * 44.51 Mathematics 32.09 46.2 50.7 47.82 Science 34.65 36.8 39.49 37.98 English 41.48 50.08 51.33 47.73 Filipino 50.01 47.62
* Average NAT for Mathematics, Science and English subjects only. Prior to 2005-06, tests were administered by classroom teachers, while independent examiners administered the NAT in 2005-06.
The Project contributed to a significant increase in textbook availability for elementary students and some improvement for secondary students. This suggests that student achievement should increase, based on the literature. The overall impact will depend in part on the distribution of student backgrounds, and it should be noted that the availability of textbooks at the school level is variable. Results from standardized test in the Philippines (see Table 2) show a significant rise (over 12 percentage points) in achievement scores for “core subjects” for both elementary and high school levels, from 2002-03 to 2004-5, which corresponds to the increased availability of textbooks financed through SEMP1, SEMP2, and TEEP. Scores subsequently fell in 2005-06, although part of that decline may be attributable to changes in test administration, including introduction of independent monitors. These data do not permit specific attribution of improved test scores to textbooks financed by SEMP2, or quantification of economic benefits from these investments. But test score data provide further evidence that increased availability of textbooks have contributed to improve student achievement. Cost savings: Over the period of the procurements under SEMP 2, 52.7 million textbooks and manuals were procured against the original target of 50 million. These were delivered over Class Years 2002/03 through 2006/2007. Estimating the cost savings for the SEMP 2 procurements requires the baseline costs per copy – for example, from the 1998 DECS catalogue – and detailed cost data for the SEMP 1 and SEMP 2 procurements to disentangle and attribute the savings. Based on such calculation, SEMP2 savings have been estimated by DepED and are shown in Table 5. For SEMP 1 related savings, weighted average cost data were available for the periods 1998-2000 (the comparable procurement period prior to SEMP 1) and 1999-2003 (for the procurement period under SEMP 1, TEEP, SEDIP, and 2003-2006/7 (specific for SEMP 2 only.) These are listed in Table 4 below.

38
Table 3: Procurement and distribution of teaching materials
Total number of copies delivered from CY 1999/2000 to 2002/03 Textbooks Teacher Manuals
Elementary 91,150,752 2,051,286 Secondary 18,493,911 341,420
Total number of copies delivered from CY 2003/04 to 2006/07 Textbooks and teacher Manuals
Elementary 40,607,941 Secondary 12,126,332
Table 4: Weighted average cost per copy of teaching materials procured, by dates
Dates Delivered Weighted Average Cost,
PHP Elementary 1998 to 20001 79.55 Secondary 1998 to 20001 107.03 Elementary 1999 to 20032 37.82 Textbook
Secondary 1999 to 20032 46.34
Elementary 1998 to 2000 N/A Secondary 1998 to 2000 N/A Elementary 1999 to 20032 36.97 Teacher Manual
Secondary 1999 to 20032 51.52 Data sources: 1 DepED Order No. 35, s. 2000 - School-based procurement/ordering
2 SEMP 1, TEEP, SEDIP – as relevant – based on national procurement
Table 5: Estimation of savings, SEMP 2 period only (US Dollars)
Year Delivered
Quantity Textbooks Procured (TX/TM)
Elem HS Total
Total Contract
Cost (in USD)
Total per DECS
catalogue (USD)
Estimated Savings (USD)
Percent Savings
2003 23,435,142 5,352,521 28,787,663 22,905,136 45,506,242 22,601,106 50% 2004 2,336,753 2,336,753 2,967,588 2004 5,207,431 3,534,450 8,741,881 6,882.255 14,894,354 8,012,102 54% 2005 902,608 902,608 808,507 2,451,489 1,642,991 67% 2006-2007 11,965,368 11,956,368 11,965,467 15,469,502 3,504,034 23%
TOTAL 40,607,941 12,126,332 52,734,273 45,528,953 78,321,596 35,760,231 46% Source: DepED. The following assumptions and compromises are made for the estimation of cost savings:
a. The weighted average costs per copy (textbook or teacher manual) that existed before SEMP would have continued without the Project’s introduction of international competitive bidding processes. Specifically, if SEMP 1 was not initiated, it is assumed prices would revert to the levels before competitive bidding began (i.e., pre-SEMP 1).
b. The implementation of the international bidding process under SEMP 1 and SEMP 2 imposed no additional costs on the procurement system compared to what existed without these projects. Therefore, the total costs of procurement under these projects are taken to represent the entire cost to Government and donors.
c. The weighted average cost values are not adjusted for inflation. Based on CPI (national series, all income households, 2000=100), annual inflation in the Philippines over 1999-

39
2006 averaged 5.3%38. With inflation adjustment, the estimated (real) cost savings would be even higher. Therefore, the savings estimates below are inherently conservative.
d. Given that no baseline costs are available for teacher manuals for 1998-2000 (i.e., pre-SEMP), the estimated percentage savings on a weighted cost per unit basis for the SEMP 1 period are assumed the same as for textbooks in the analysis below.
Based on the cost figures in Table 4 and the assumptions, Table 6 below presents the estimated percentage savings on a weighted average cost per unit basis over the SEMP 1 period. Table 6: Percentage with-Project savings on a weighted average cost per unit (WACU) basis
SEMP 1 WACU as % of 1998-2000 WACU SEMP 1 period Elementary Secondary Textbooks 48% 43%
Teacher manuals 48% 43 The cost savings are estimated based on the counterfactual implied by a. above, and the volume figures and percentage savings from Tables 3 and 4. For example, the cost of purchasing 91.15 million elementary textbooks (delivered CY 1999/2000 – 2002/03) is first calculated using 1998-2000 prices, and then the cost of the same volume of resources using the 1999-2003 prices is subtracted to yield the total savings in PHP for the SEMP 1 period. This is then valued at US dollars at the average nominal exchange rate prevailing at the end of the period, US$1=55PHP.
Table 7: SEMP 1 savings on a weighted average cost per unit (WACU) basis Valued using total copies delivered CY 1999/2000 to 2002/03 SEMP 1 period Elementary Secondary Total
Textbooks $69,158,561 $20,187,505 $89,346,066 Teacher manuals $116,438 $61,533 $177,972
The teaching materials – textbooks and teacher manuals – will generate intrinsic benefits for students and instructors over their usable lifetimes which have not been quantified in this analysis. For example, the increased availability of textbooks has the effects on attainment as already discussed. In this context, the savings on procurement costs are an added bonus, freeing up Government resources for alternative uses. If effectively invested, these free resources will generate their own developmental benefits. The overall SEMP 1+2 innovations in international competitive bidding generated approximately US$125.3 million in cost savings over a seven year period (1999-2006). SEMP2 specifically generated US$35.76 million in savings from textbook procurement alone. Using 2001 as the base of SEMP 1 savings and 2005 as the base of SEMP 2 savings, the value can be approximately adjusted for consumer price inflation (index series: all income households, IMF) to yield an estimate at 2006 prices of $153 million in total savings. Given that many positive effects were not quantifiable, the overall estimate of benefits is conservative. (ii) School room construction and repair by DepED and DPWH: The construction of school rooms where none existed or where crowding or inconvenient schedules existed previous to the construction would increase access to education and possibly improved student achievement. The analysis here will focus on efficiency and cost gains in the construction program initiated under
38 Based on International Financial Statistics series, International Monetary Fund

40
SEMP2, especially with the DepEd-managed construction, which was directly financed with Project funds. As discussed in the main text and the independent evaluation (Annex 8), as of project closing (June 2007) the DepEd-managed construction with 10% of the regular school building program (SBP) budget finished 841 new classrooms and the repair/rehabilitation of 1,819 classrooms. The DPWH finished 481 classrooms. There were also differences in quality: DepEd-constructed classrooms were found by the independent evaluation to be of better quality due to involvement of school administration and parent associations in the building. These improvements in quality represented significant indirect cost savings (for example, completed DepEd schools typically included electrical wiring and chalkboards, whereas these had to be separately financed and installed for DPWH-financed schools). Better quality construction may also contribute to a positive learning environment and have an incremental effect on student attainment at the margin.
Table 8: SEMP 2 school building program construction costs by agency and year (US$) Agency 2003 2004 2005 2006 2007 Agency Total DEPED $285,714 $1,900,133 $2,817,584 $5,003,431 DPWH $2,091,088 $305,885 $2,396,973 Total $285,714 $1,900,133 $4,908,673 $305,885 $7,400,405
The specific calculation and attribution of cost savings in the SBP under SEMP 2 is complicated by a lack of baseline data (e.g., cost of construction by type of classroom and agency, number to be constructed in the absence of the Project). The cost of construction varies by the size of classroom, the school, as well as the contractor. However, detailed data are not available for all the classrooms constructed for the DepED program, and very little data is available at this point for the DPWH construction program either before or during the Project period. Therefore, while it would be worthwhile to compare weighted average cost of construction per classroom type to baseline values for both DPWH and DepED building programs, the data do not permit this evaluation. The direct cost savings are relatively modest compared to savings under the textbook component. The indirect savings from better quality likely exceed the direct savings, but available data did not allow quantitative estimates of savings from quality improvements. The independent consultant field visits (see Annex 8) yielded some comparator data for a small sample of DepEd and DPWH constructed classrooms across 23 schools:
Table 9: Average cost and savings per classroom Average unit cost per classroom (PHP) Savings per classroom Building type and
size DepED DPWH Prescribed budget DepED DPWH 1 storey 7m x 9m 387,929.32 404,060.49 400,000 12,070.68 -4,060.49 1 storey 7m x 7m (no sample) 338,293.97 300,000 N/A -38,293.97 2 storey 7m x 9m 800,861.06 764,362.24 850,000 49,138.94 85,637.76
Source: M.C. Fagela “Main report of the comparative review of DPWH and DepED-constructed school buildings under the Second Social Expenditure Management Project,” First draft, 5/12/07
DepEd- constructed classrooms in the sampled schools to the prescribed ‘7m x 9m’ standard set for secondary schools, and did so at lower cost than DPWH, except for two-storey classrooms of size ‘7m x 9m’. The figures in the table above could be used to estimate total savings for the SBP under SEMP 2. Based on data from the DepED’s centrally bid-out school-building contract packages for CY 2004-2005, it can be established that 37.5% were ‘7m x 7m’ and 62.5% were ‘7m x 9m’ classrooms across the sample of 696 classrooms, but it cannot be distinguished if the

41
latter type of classrooms were single or double-storied. Therefore, if 62.5% of the DepEd construction of new structures during SEMP 2 (841 classrooms) was of the type 1 storey ‘7m x 9m’, then a total of US$131,160 was saved. Data is also available from DepED on construction savings over prescribed budget cost by the type of construction process: principal-led or national competitive bidding. Table 9 below illustrates the savings and the number of new classrooms constructed using the two modes. Table 10: SEMP 2 school building construction costs per classroom & savings (PhP)
Average unit cost per classroom (PHP) Constructed Mode of Procurement Building Type CY 2003 CY 2004 Average
CY 2003-04
Savings* (PHP) CY
2003 CY
2004 1 storey 7m x 9m 354,453.2 413,769.2 384,111.2 15,888.8 173 76 National
Shopping (Principal-Led) 2 storey 7m x 9m - - - - - -
1 storey 7m x 9m 229,648 - 229,648 17,0352 - National Competitive
Bidding (NCB) 2 storey 7m x 9m 580,330.79 - 580,330.79 269,669.2 12**
- Source: Antonia M. Alhambra, Unit Head, SEU, PFSED-OPS, “Average Cost of Classroom Construction under SEMP 2 by Department of Education,” Physical Facilities and Schools Engineering Division, Department of Education * Based on average, CY 2003-04 ** Split between 1 storey vs. 2 storey is unknown at this point. Based on Table 9, using just the values for Principal-led construction and the average cost per classroom over CY 2003-04, for the construction of 249 new classrooms, approximate savings of US$89,916 were registered. Over the SEMP 2 period, the DepEd SBP also generated savings in its contracting of construction as compared to the programmed cost. These savings are listed in Table 9 below. They suggest that over the SBP in the class year 2003, DepEd contracting saved 2.84% from programmed costs with 99.7% of construction completed. over the class year’s period 2004-05, the contracted costs are slated to be 5.21% under program values, with nearly 77% of construction completed at time of reporting. In US$ terms, the savings for the two periods are US$96,727 and US$350,619 respectively (at 1US$=44PHP). These “book” savings, together with indirect savings from improved quality, imply that in future DepEd can construct more classrooms at the same budget and/or that the budget/programmed costs for SBP can be rationalized to suit other priorities.
Table 11: DepED School building program, SEMP 2: programmed and contracted costs Total Cost
Programmed Total Cost Contracted
Rooms contracted; % accomplished Contract Savings Years
PHP 149,681,150 PHP 145,425,161 185 new + 858 repaired; 99.71% PHP 4,255,989 CY 20031
PHP 296,138,262.2 PHP 280,711,021.8 696 new; 76.16% PHP 14,658,448 CY 2004-052 1 Appendix D (data as of Oct 31, 2006), “SEMP 2 – Project Completion Report”, DepED, December 20 2007. 2 DepEd, CY 2004-2005 SBP, data as of October 22, 2007 2. Public Health Services The Public Health Services area of the Project was delivered with the joint efforts of the DOH, UN agencies and other local partners (suppliers and nongovernmental organizations). Of the various programmatic heads under this area, vaccine shortage issues within the Expanded Program for Immunization (EPI) in the Philippines were the major target of Project funds (Table 10). The EPI portions supported by Project funds comprised measles, DPT (Diphtheria, Pertussis, Tetanus), and polio vaccination, along with additional tetanus toxoid (TT2) inoculation. The very

42
low incidence rate of rabies in the target Visayas region – maintained through the Project – implies that the analysis below is better suited for the other two major targets of spending.
Table 12: DOH spending under SEMP 2: by year and major program heading (US$) Major Program Head 2003 2004 2005 2006 Total % of
Total (i) Expanded Program for
Immunization (EPI) $10,944,649 $6,004,788 $5,382,169 $4,725,695 $27,057,300 72.1%
(ii) TB Control Program $5,342,472 $1,773,779 $1,726,798 $8,843,048 23.6%(iii) Prevention & Control
of Inf. Disease (rabies) $560,335 $413,407 $659,244 $1,632,986 4.4%
Total $16,847,455 $8,191,974 $6,041,413 $6,452,493 $37,533,334 100% (i) Expanded Program for Immunization (EPI): Vaccination programs satisfy public finance criteria very well because of their prevention focus, the positive externalities to society from the vaccination of an individual, and the fact that these services usually face some form market failure requiring public provision. In addition, most types of vaccination programs – and especially for measles – are known to be very cost-effective for reducing child mortality and morbidity per dollar of unit cost. Given the severe symptoms of measles, pertussis, et al., and lasting disability in the case of untreated poliomyelitis, the case is very strong for universal coverage with these childhood vaccines. In the case of the TT2 vaccine, besides protection from neonatal tetanus for the infant, the mother is also protected for up to 3 years after inoculation. Over the SEMP 2 period, as EPI-related vaccine supplies were stabilized and implementation improved given initial procurement issues (see main text, section 3.2.A.2), such that coverage in the target population increased as per Table 12. Data on the exact composition of the vaccines for DPT3, cost of vaccine per dose or per child for the various diseases, the without-Project incidence of disease (baseline/counterfactual), and complete coverage data for all years are not available at this point; hence traditional cost analyses of vaccination programming cannot be performed. There are also issues with the tracking and reporting of cases of neonatal tetanus which are required to establish current and baseline incidence for the disease (see main text). Trend data are also not available for urban-rural differentials in vaccination coverage to evaluate the important factor of Project impact on existing inequity in health outcomes. In addition, the impact on current/future measles incidence from the efforts to ensure vaccine supply for measles under the Project will be confounded with the general efforts under the Government’s ‘Knock out Tigdas (KOT)’ initiative, which aims to eliminate the disease from the country with a door-to-door campaign to immunize 9 million children aged between nine months and four years. The reduction in measles incidence from about 5700 cases in 2003 to 173 in 2006 (97% reduction) is at least partly attributable to improved vaccine availability in the SEMP 2 financing period. Though 2007 is the peak of a three-year measles epidemic cycle, and incidence has risen in the year, the KOT program, if implemented as per plan, can reduce the incidence further going forward.
Table 13: EPI trends in coverage by program year and type of vaccination Year* Measles coverage1 DPT3 coverage2 Tetanus toxoid (TT2) coverage3 2002 76% 73.2% 54.4% 2004 83.4% 79.5% 60% 2005 84.1% 81% 58.5% 2006 83.2% 80% 59.1%
* Data for 2003 not available. Data based on Philippines Field Health Information System (FHSIS 2006) and NCDPC 1 % of 1 y/o fully vaccinated with one dose of measles 2 % of 1 y/o fully vaccinated with three doses of DPT
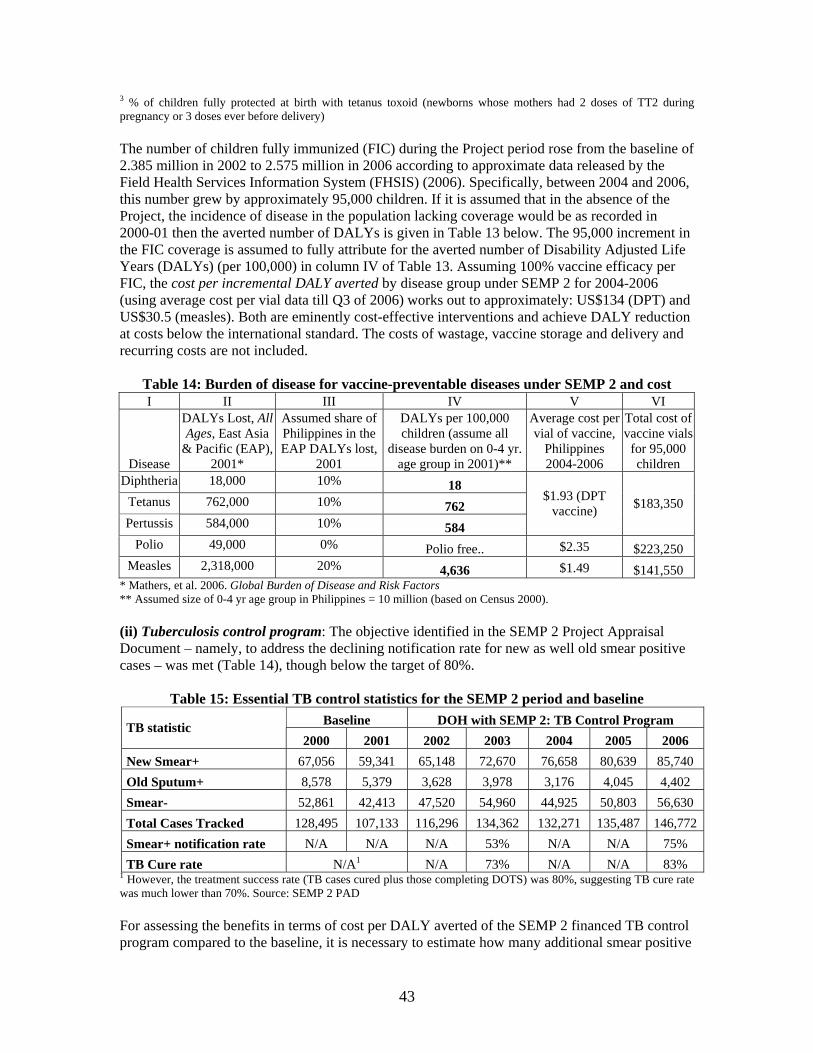
43
3 % of children fully protected at birth with tetanus toxoid (newborns whose mothers had 2 doses of TT2 during pregnancy or 3 doses ever before delivery) The number of children fully immunized (FIC) during the Project period rose from the baseline of 2.385 million in 2002 to 2.575 million in 2006 according to approximate data released by the Field Health Services Information System (FHSIS) (2006). Specifically, between 2004 and 2006, this number grew by approximately 95,000 children. If it is assumed that in the absence of the Project, the incidence of disease in the population lacking coverage would be as recorded in 2000-01 then the averted number of DALYs is given in Table 13 below. The 95,000 increment in the FIC coverage is assumed to fully attribute for the averted number of Disability Adjusted Life Years (DALYs) (per 100,000) in column IV of Table 13. Assuming 100% vaccine efficacy per FIC, the cost per incremental DALY averted by disease group under SEMP 2 for 2004-2006 (using average cost per vial data till Q3 of 2006) works out to approximately: US$134 (DPT) and US$30.5 (measles). Both are eminently cost-effective interventions and achieve DALY reduction at costs below the international standard. The costs of wastage, vaccine storage and delivery and recurring costs are not included.
Table 14: Burden of disease for vaccine-preventable diseases under SEMP 2 and cost I II III IV V VI
Disease
DALYs Lost, All Ages, East Asia
& Pacific (EAP), 2001*
Assumed share of Philippines in the EAP DALYs lost,
2001
DALYs per 100,000 children (assume all
disease burden on 0-4 yr. age group in 2001)**
Average cost per vial of vaccine,
Philippines 2004-2006
Total cost of vaccine vials
for 95,000 children
Diphtheria 18,000 10% 18 Tetanus 762,000 10% 762 Pertussis 584,000 10% 584
$1.93 (DPT vaccine) $183,350
Polio 49,000 0% Polio free.. $2.35 $223,250 Measles 2,318,000 20% 4,636 $1.49 $141,550
* Mathers, et al. 2006. Global Burden of Disease and Risk Factors ** Assumed size of 0-4 yr age group in Philippines = 10 million (based on Census 2000). (ii) Tuberculosis control program: The objective identified in the SEMP 2 Project Appraisal Document – namely, to address the declining notification rate for new as well old smear positive cases – was met (Table 14), though below the target of 80%.
Table 15: Essential TB control statistics for the SEMP 2 period and baseline Baseline DOH with SEMP 2: TB Control Program TB statistic
2000 2001 2002 2003 2004 2005 2006 New Smear+ 67,056 59,341 65,148 72,670 76,658 80,639 85,740 Old Sputum+ 8,578 5,379 3,628 3,978 3,176 4,045 4,402 Smear- 52,861 42,413 47,520 54,960 44,925 50,803 56,630 Total Cases Tracked 128,495 107,133 116,296 134,362 132,271 135,487 146,772Smear+ notification rate N/A N/A N/A 53% N/A N/A 75% TB Cure rate N/A1 N/A 73% N/A N/A 83%
1 However, the treatment success rate (TB cases cured plus those completing DOTS) was 80%, suggesting TB cure rate was much lower than 70%. Source: SEMP 2 PAD For assessing the benefits in terms of cost per DALY averted of the SEMP 2 financed TB control program compared to the baseline, it is necessary to estimate how many additional smear positive

44
TB cases and deaths were averted. Data required include baseline and with-Project detection rates and cure rates, and baseline death rates. Approximate estimates of 25000 deaths p.a. in the Philippines prior to SEMP 2 indicate a death rate of 20%39. All of these metrics improved with the Project, according to qualitative and limited quantitative records. However, baselines and the with-Project data on death rates in smear positive and smear negative TB patients in the Philippines are not available. This complicates the economic analysis specific for the Philippines case. However, estimates are available from similar DOTS programs in developing countries with a high TB burden. Based on a prior estimation from a World Bank supported TB-DOTS project in India40, 99% of the benefits were from deaths averted, yielding an overall $34 per DALY reduced. Data from sub-Saharan Africa (specifically, Malawi) suggests a year of healthy life could be gained for less than US$541 with TB treatment, and other review studies have suggested $25 per DALY for comprehensive TB-DOTS interventions in developing countries. 3. Social Services Of these, the Social Services activity contained the Comprehensive Integrated Delivery of Social Services (CIDSS). A separately funded World Bank loan for the KALAHI/CIDSS project was the subject of a prior independent and comprehensive analysis which established that the design – adopted from the SEMP2 CIDSS program – was economically beneficial, generating a net IRR of 21% and a NPV of PHP 1.03 billion42. The SEMP2 CIDSS component over-achieved its targets in terms of the number of sub-projects implemented (2,495 by project closing compared to the PAD target of 2,000).
39 Source: SEMP 2 PAD 40 Project Appraisal Document, Annex 9: Economic and Financial Analysis, India Second National Tuberculosis Control Program, The World Bank 2006 41 Christopher Dye and Katherine Floyd, "Tuberculosis." 2006. Disease Control Priorities in Developing Countries (2nd Edition), ed., 289-312. New York: Oxford University Press. 42 Eduardo Araral & Camilla Holmemo, “Measuring the costs and benefits of community driven development: the KALAHI-CIDSS project, Philippines”, Paper No. 102, Social Development Working Papers: Community Driven Development, The World Bank, January 2007.

45
Annex 4. Bank Lending and Implementation Support/Supervision Processes
a) Task Team members
Names Title Unit Responsibility/ Specialty
Lending Jayshree Balachander Sr. Human Resources Specialist EASHD Task Manager
Dominic Reyes Aumentado Procurement Specialist EAPCO Procurement/Civil Works
May Olalia Operations Specialist EACPF Operations Karin Nordlander Legal Counsel LEGEA Legal Wijaya Wikrema Financial Management Specialist EAPCO FM Yolanda Taylor Procurement Specialist EAPCO Procurement Sabrina Terry Team Assistant EASHD Team Asst
Christian Rey Manager, Portfolio and Operations EACPF Procurement/ Operations
Bhuvan Bhatnagar Sr. Social Scientist EASSO Social DevelopmentAlfonso De Guzman Education Specialist EASHD Textbook Lisa Bhansali Sr. Legal Counsel LEGEA Legal Teresa Ho Lead Health Specialist EASHD Health Hung Kim Phung Senior Finance Officer LOAG Finance Cynthia Manalastas Team Assistant EACPF Team Asst Parmesh Shah Coordinator, Participation SDV Social DevelopmentLingzhi Xu Procurement Specialist EASHD Procurement
Supervision/ICR Timothy Johnston Senior Health Specialist EASHD Task Team Leader Salvador Jiao Consultant EASHD Civil Works Ronaldo Oblepias Education Specialist EASHD Education Rekha Menon Senior Economist ECSHD Task Team Leader Rebecca Aquino ETT EACPF Team Asst Preselyn Abella Financial Management Specialis EAPCO FM Natasha Beschorner Senior ICT Policy Specialist CITPO ICT Michel Dorval Consultant EASHD Procurement Maria Loreto Padua Social Development Specialist EASSO Social DevelopmentLynnette Dela Cruz Perez Sr Education Specialist EASHD Education Hugh C. A. Somerset Consultant EASHD Education Evelyn Quirante Program Assistant EACPF Program Assistant Ernesto Diaz Senior FM Specialist EAPCO FM Eduardo Banzon Senior Health Specialist EASHD Health Dominic Reyes Aumentado Procurement Specialist EAPCO Procurement Cesar Banzon Team Assistant EACPF Team Asst Raul Gonzales Social Development Specialist EASSO Social DevelopmentMarifer Fagela Consultant EASHD Civil Works
Victoria Catibog Consultant EASHD Financial Assessment

46
Ateneo School of Government Consultant EASHD ICR Workshop Arin Dutta Consultant Economist EASHD Economic analysis
(b) Staff Time and Cost Staff Time and Cost (Bank Budget Only)
Stage of Project Cycle No. of staff weeks USD Thousands (including
travel and consultant costs) Lending
FY01 10 38.72 FY02 21 72.39 FY03 2 10.41 FY04 0 1.80 FY05 0 0.00 FY06 0 0.00 FY07 0 0.00
Total: 33 123.32
Supervision/ICR FY01 0 0.00 FY02 0 0.00 FY03 9 25.97 FY04 18 49.25 FY05 14 39.04 FY06 11 49.13 FY07 6 20.71 FY08 (planned) 17 33.38
Total: 75 217.48

47
Annex 5. Summary of Borrower's ICR 1. From June 2002 to June 2007, the Philippine Government implemented the Second Social
Expenditure Management Project (SEMP2) in accordance with its $100-million Loan Agreement with the World Bank. The Departments of Education (DepEd), Health (DOH), Social Welfare and Development (DSWD) and Public Works and Highways (DPWH) were in charge of the implementation while the Department of Budget and Management (DBM) performed oversight.
On its completion, the project’s development objectives to provide inputs to basic social services and enhance performance and governance had been satisfactorily achieved. The accomplishments in 16 out of 25 development and intermediate outcome indicators met or exceeded the targets while the others were not very far below the target or nevertheless surpassed the available baseline value. In terms of budget allocation, 50% of the loan went to the education sector, 38 percent to health, and 11 percent to social welfare.
The entire SEMP2 experience offered key lessons that should be adopted and utilized for future undertakings.
2. In the education sector, the project covered textbooks, school buildings and teachers’ deployment. The DepEd was the implementing agency of all these project components, with the DPWH co-implementing the school building component.
A total of 56.97 million textbooks for core subjects, Math, Science, English and Filipino, was procured and delivered, which exceeded the target by 6.97 million. It has improved the textbook-pupil ratio in the said four subjects from a baseline of 1:2.5 to 1:1.
Combined DepEd and DPWH accomplishments resulted in the construction of 1,441 new classrooms, which was short of the target by 309. DepEd finished 841 new classrooms and repaired/rehabilitated 1,819, 119 of which qualified as new ones because they were severely damaged. It therefore contributed 960 new classrooms, which surpassed its individual agency target of 750. DPWH was responsible for the shortage as it finished only 481 classrooms, including repaired/rehabilitated ones, out of its individual agency target of 1,000.
For the grants for repair and maintenance, which targeted 40,000 recipients, 41,561 were considered eligible for reimbursement. Trainings on minor repairs and maintenance were also provided to 41,561 Parent-Teacher-Community Associations (PTCAs).
Finally, the Inter-quartile ratios (IQR) for teacher deployment, which was targeted to improve to 1.75, only reached 2.01. There were still resistance from Division Offices to give up vacant teaching positions to other divisions that need them. Note, however, that DepEd managed to pull the ratio down from the recorded baseline of 2.17.
3. In the health sector, the project covered the Expanded Program of Immunization (EPI), Rabies Control, and Tuberculosis Control. The DOH was the implementing agency.
The EPI’s sub-program for fully immunized children (FIC) reached 83% against the target of 67%. Measles cases, which were targeted to be halved to 3,500, were reduced to 173 cases or 97% reduction. The polio free certification was also maintained, but there was no report on the number of child protected at birth (CPAB) with tetanus toxoid because of problematic reporting system; the use of tetanus toxoid also met opposition from a religious group.

48
In the case of rabies control, the recorded accomplishment was 1.8 cases per million population, which fell below the target by 0.8.
The TB drugs were administered to 148,183 patients against the target of 200,000 patients. DOH attributed the failure to reach the target to the stricter and more specialized administration of the drugs to patients. Also, the reported TB smear notification rate of 75% was below the target of 80%, but improved much on the baseline of 53%. The TB cure rate was better off from a baseline of 73% to 82%, but was also lower than the project target of 85%.
4. In the social welfare sector, the project covered the Comprehensive and Integrated Delivery of Social Services (CIDSS) projects, support services and social protection, and administration of centers and institutions. The DSWD was the implementing agency.
A total of 2,495 CIDSS subprojects were successfully implemented and made significant improvement in the lives of beneficiary communities. This accomplishment exceeded the target of 2,000.
The area of protective services registered an impressive accomplishment of serving 366,432 individuals in years 2004 and 2005 against the target of only 150,000. Relief goods amounting to P141.94 million were distributed to victims of disasters and calamities; the target was P26.78 million. On the other hand, 5,515 units of core shelters and 3,169 units of emergency shelter assistance were extended to victims of disasters and calamities, from their respective targets of 2,363 units and 2,983 units.
5. The target timeframe for budget disbursement and project completion was generally observed. DBM reported 98.1% disbursement as of 31 December 2006 and 100% disbursement as of 30 June 2007. The short delay was due to the legal dispute in textbooks procurement.
6. The achievement of the SEMP2 development objectives and key performance indicators was largely credited to the significant progress, though at varying degrees, in the social sectors’ systems reform and improvement efforts, especially in the case of DSWD. This, at the minimum, confirmed the correct direction of the reforms.
The preparation of plans for Financial Management, Procurement and Information, Communication and Technology (ICT) systems had been completed. The operationalization of the electronic New Government Accounting System (e-NGAS) in the Central Offices, on the other hand, was likewise completed in DOH and DSWD, though not in DepEd. DepEd cited lack of manpower, hardware and funds as reasons for its failure to operationalize e-NGAS.
Also, the passage of the RA 9184 or the Government Procurement Reform Act (GPRA) paved the way for successful efforts to reconstitute procurement units and streamlining of procurement processes in all agencies.
DOH adopted and maintained the contract distribution system, and likewise achieved 70% automation of the Bureau of Food and Drugs (BFAD) through the Integrated Information System for quality assurance. DepEd, on the other hand, has organized an IT unit and developed the Basic Education Information System (BEIS), which serves as the department’s primary source of national statistical data on elementary and secondary education.
DSWD likewise installed department-wide ICT infrastructures, one of which was the establishment of the Regional Management Information System (RMIS) Unit in all of its 16 Field Offices.

49
Finally, measures to strengthen transparency and accountability across agencies, specifically in the budgetary process, were carried in the implementation stage, though still not completed.
7. Aside from the positive effect of systems reforms on performance, the SEMP2 implementation left vital lessons on leadership, decentralization, accountability, linking reforms in procurement, financial management and IT, and sustainability and institutionalization. These were documented and synthesized in the SEMP2 Stakeholders’ Workshop.
Leadership played a major role in pushing for the needed reforms. This was very evident in top-level management initiatives in the social sector departments to put in place procurement systems and procedures and motivate adherence to these systems and procedures, especially with the passage of the GPRA. Notably, these led to lower prices, a more efficient system of procurement from contracting to award and delivery, and improved credibility of the transactions.
It is worth noting, however, that the diligence and persistence of middle-level managers greatly supplemented the top-level leadership, where there had been fast and often unpredictable transitions. The middle managers, therefore, “provided continuity and stability by keeping the reform measures on check.” Given such strategic role, a recommendation to organize better the selection and/or appointment process and provide them continuing professional development program was forwarded. A more stable top-level leadership, however, would still be the ideal condition to ensure consistency in policy reform implementation.
The gains of decentralization presented another lesson. DSWD’s best practice in community-based procurement and DepEd’s Principal-Led School Building Program illustrated these gains. On the other hand, DOH’s decision to recentralize the procurement of anti-TB drugs after seeing high increase in prices and longer contracting period in the regional offices’ procurements pointed to the need for accountability systems to go hand-in-hand with decentralization.
Lesson on strengthening accountability also emerged with the additional mechanism provided by the Internal Audit Units (IAUs) and the interventions of civil society as third-party monitors, which made important contributions to effective project implementation. The environment was deemed favorable to pursue the full activation of the IAUs in the entire bureaucracy and the continued partnership with civil society, but limited resources and capacities pose great constraints. Bringing these mechanisms in the local setting would even be a bigger challenge.
Going back to procurement reforms, its central role in SEMP2 implementation also marked an important lesson—it must be linked with the entire financial management system and ICT. The complete picture of an effective system could only be seen within a framework that bring together in and through ICT the entire process of budgeting, procurement planning, contracting and implementation, and accounting and audit, This, of course, would entail budgetary, human resource and time requirements.
Finally, the need to ensure that SEMP2 accomplishments would be sustained left a challenging lesson. In response, the agencies started devising different ways to bring it about. DOH’s “FOURmula One for Health”, DSWD’s transfer of CIDSS to the local government units, and DepEd’s Textbook Count and DepEd-DPWH joint policy on coordination on the school building program, were examples of these efforts on sustainability. The lesson,

50
moreover, underlined the importance of establishing a network of support and a strong pro-reform advocacy program to realize sustainability and institutionalization.
8. A post-SEMP2 completion scenario has many positive openings to sustain the accomplishments. The positive results themselves planted the seed of confidence in the overall capability of the government to deliver services. The political stability and persisting question on the credibility of the President, however, remain to be a serious concern.
At any rate, the familiarity with the reformed systems’ processes that key stakeholders, especially the government implementers, had developed, and the benefits that they had seen accrue from these reforms indicate strong likelihood of continued support for these reforms. Lessons pointed to the need for follow-up efforts for wider information dissemination and public advocacy. These are important to generate a broader constituency that would express appreciation and acceptance of the reforms. Such support mechanism, in turn, could be harnessed to counter possible attacks by those who had been negatively affected by the reforms.
Lessons on linking reforms and growing demand for sustainability and institutionalization hinted at a maturing process. Consolidation of the lessons from previous project implementation experiences could be considered to map out strategic directions of future reforms and interventions. This should provide lens to see clearly the way in which the projects could really impact on poverty reduction and national development.
51
Annex 6: Summary of ICR Stakeholder Workshop Report The results of SEMP2 Stakeholders’ Workshop43 are here synthesized into the major accomplishments of the projects and the categories of cross-cutting lessons that emerged from the exercise, namely (1) Leadership and Human Resource, (2) Decentralization, (3) Accountability, (4) Procurement, Financial Management and ICT, and (5) Sustainability and Institutionalization of Reforms. The following were the salient points:
Many outcome indicators in service provision were satisfactorily met, but with some prominent exceptions of programs for school buildings, teacher deployment and anti-TB drugs. Systems reform and improvement helped deliver better services.
Systems reform and improvement was largely a function of the support of the top leadership of agencies, the championing of the middle managers and the level of capacity and competency of the human resource as a whole.
Decentralization yielded favorable results when complemented by accountability measures. Accountability measures in the forms of civil society participation and internal audit
enhanced government effectiveness and credibility. Sustaining such efforts would have long-term effect on institutional development.
Financial management and procurement reforms must be linked for effective and results-oriented expenditure management. Information technology (IT) is a critical component of these reforms.
Sustaining the gains of the project is a serious concern to realize growth and poverty reduction.
Satisfactory Service Provision through Systems Reform and Improvement Based on the SEMP2 Results Framework Analysis44 and the agency presentations of accomplishments during the workshop, the government met satisfactorily many outcome indicators, in both areas of service delivery and systems improvement. Remarkably, the accomplishments surpassed the targets in DSWD’s CIDSS and protective services, in DOH’s measles reduction and fully immunized children (FIC) programs, and DepEd’s textbook procurement. On the other hand, the government accomplishment in the programs for school buildings, teachers’ deployment, and anti-TB drugs fell below the set targets. DPWH cited shortage of funds for their below-target accomplishment. DepEd attributed the higher Inter-Quartile Ratio for Teacher Deployment to the resistance of some divisions to give up their vacant teaching items for areas with shortages. DOH explained it became difficult to reach the target 200,000 TB patients after it introduced a stricter and more specialized drug administration scheme. It is important to note, however, that for all the indicators with baseline information, the condition was better off after the SEMP2 completion.45 In the area of systems improvement, the plans for financial management systems improvement, specifically procurement and ICT, had been completed. The Electronic National Government Accounting System (E-NGAS) was made fully operational in all the implementing agencies, except DepEd. The advanced phase of these systems reforms in DSWD was identified during the workshop
43 The Stakeholder Workshop was organized by Government Watch (G-Watch), Ateneo School of Government. G-watch also produced this summary of workshop findings and recommendations. 44 Prepared by Tim Johnston (WB, 25 November 2007) based on preliminary ICR Reports submitted by the DepEd, DOH, DepEd and DSWD. 45 The indicator for administering anti-TB Drug has no baseline information.

52
as the main reason for the agency’s good performance. In DOH, the groundwork for these reforms had also been instituted successfully with its procurement and logistics divisions and Bureau of Food and Drugs’ (BFAD’s) 70% automation. The impact on project implementation, however, was still limited because they were only starting to take root. The institution was still undergoing adjustments, which take time. In DepEd, even bigger efforts and adjustments must be put in place in view of the scope of its centralized operation and size of organization; the efforts require more resources. In DPWH, systems reform had to contend with the traditional work environment, which remains prone to external interference and highly undesirable practices. At any rate, while the extent and level of systems improvement varied across agencies and its impact differed in terms of pace, it provided all the agencies the building block for sustained and even wider institutional strengthening. This partly explained the generally satisfactory accomplishment of the agencies in SEMP2 implementation, which was also validated in the rating exercise46. DBM reported 98.1% disbursement as of 31 December 2006 and 100% as of 31 December 2007. The delay was due mainly to the legal dispute in textbooks procurement. Leadership, Middle-Managers and Human Resource There was a consensus among the workshop participants that leadership was crucial for reforms. In all the agencies, especially DOH and DepEd, the top executives were at the forefront of pushing for and eventually putting in place the mechanisms of the new Government Procurement Reform Act (GPRA). In DepEd, for instance, the leadership spearheaded the effort to bring down textbook prices and pursue better arrangements with DPWH for the school building program. In DOH, the leadership also moved to lower anti-TB drug prices. These were done side-by-side with the setting up of procurement and logistics offices. The DSWD leadership, for its part, supported the creation of a specific structure for finance service in compliance with the SEMP requirement. It also had a plan for a separate finance manager so that financial management would no longer be regarded as a mere support structure. The DBM leadership had been crucial in introducing and implementing system-wide improvement. It was instrumental in translating reform pronouncements into actual guidelines and processes, the successful use of which was spread in many departments. At any rate, these initiatives could not have prospered without the pivotal role of the middle managers. With frequent changes in the top-level positions (since 2002, all of the original Secretaries left before their term ended and some key Undersecretaries have also left), it was the middle managers who provided continuity and stability by keeping the reform measures on check. Thus, the middle managers did not only support, but also sustained the systems reform program. But to ensure that they would pursue the reforms consistently and effectively, the workshop participants recommended an agency Human Resource Development Plan that would address the need for a clear and accountable selection and/or appointment process and an adequate program for continuing professional development, especially for those involved in financial management. Some factors that were considered to realize these measures were support from the senior management, participation of key stakeholders, including civil society, and availability of funds. The constraints that should be anticipated include turfing issues within the units and the resistance from those who benefit from the old system.
46 See results of assessment rating.

53
Decentralization Decentralizing project implementation functions were reported in the workshop to yield good results. DSWD had the best practice in community-based procurement. It worked because integral in it was the accountability and transparency ensured through “people’s participation”. DepEd took great interest in DSWD’s achievement because it appreciated the importance of such direction, consistent with its school-based management policy. It still had a limited venture into the decentralization through its Principal-Led School Building Program, which resulted in better quality projects. The DPWH had no major decentralization effort, except for delegating contracting to its district offices, the effects of which had yet to be assessed. The case of DOH proved the importance of emphasizing accountability in a decentralized setup. Prior to SEMP, its regional offices handled anti-TB medicines procurements, but these were as much as three hundred times more expensive than the national bulk price and took longer to finish contracting. Thus, DOH decided to revert the procurement functions for TB goods back to the Central Office to avail of the economics of scale and due to the fact that procurement of program drugs is not a regional health office core function. Despite this, accountability system in the regional offices was an area for improvement. The emphasis on accountability implied the need for performance indicators for both regional agencies and Local Government Units (LGUs). One effective way of exacting accountability was the use of scorecards to reward well-performing agencies and identify a more equitable distribution of project recipients. To achieve these reform measures, the workshop participants proposed incorporating indicators on health and other social services in the Local Government Project Monitoring System (LGPMS). They also suggested that less capable LGUs be oriented more on the budget and expenditure programming of national government agencies. The Department of Interior and Local Government (DILG) must open the information system to other departments and work to minimize political considerations in incorporating the identified indicators. For a more equitable use of national budget for local service delivery, the workshop also forwarded a reform measure that waive the Internal Revenue Allotment (IRA) of the G-36 (36 richest LGUs) in favor of the more needy LGUs. The DBM’s and the Office of the President’s leading role in the advocacy and negotiation were considered the main factors to advance this reform measure. The civil society must also be engaged in the process. Political considerations as well as some resistance from the G-36 were the possible constraints. Accountability through Civil Society Participation and Internal Audit Unit All the SEMP2 agencies had an engagement with civil society in monitoring project implementation. Prominently mentioned in the reports of the DepEd, DOH, DSWD and DPWH was the research and monitoring interventions of Government Watch (G-Watch), the transparency and accountability program of the Ateneo School of Government. G-Watch partnered with DepEd for the Textbook Count, a national program to ensure transparent procurement and effective delivery of textbooks. It was done in collaboration with civil society, Scouts, church parishioners, private sector (such as Coca-Cola), students, parents and the community. The program was credited for the lower price, shorter procurement period, improved quality and improved delivery of textbooks. G-Watch also joined the inspection of school buildings with DepEd and DPWH, the findings and recommendation of which served as the basis for the drafting the DepEd-DPWH joint memorandum on school building monitoring and inspection. This effort has also evolved now into Bayanihang Eskwela, a community-led monitoring of school building construction, which was successfully pilot-tested in 25 school sites in Luzon. The DOH also tapped G-Watch to monitor its medicines procurement, whose report revealed (a) higher prices and longer delays in the procurement of anti-TB drugs, and (b) big

54
discrepancies in medicines prices across regional offices and hospitals. These prompted the DOH to do necessary adjustments in its regional procurements and install system for the posting of regional medicines prices in the web. Finally, the DSWD also engaged G-Watch in a study on disaster relief distribution. This enabled the Department to see the need to institute a transparency and accountability mechanism. It responded by establishing a third-party monitoring of relief goods with the help inter-faith groups, which greatly reduced pilferage in the distribution of disaster relief. The active participation of civil society coincided with and complemented the government effort to establish Internal Audit Units (IAUs). It is meant to strengthen accountability through preventive means, especially in government transactions involving procurement and service delivery. The IAU in DSWD and DPWH had already been established, but DepEd and DOH were still awaiting the plantilla positions therefor. The significance of both participatory and government-led accountability reform initiatives could not be overemphasized. The remaining challenge was to mainstream and integrate them in all layers and systems of the bureaucracy. In response to this, the workshop participants recommended the following steps: (a) create functional IAUs in all agencies; develop appropriate manuals for their operation; (b) support civil society efforts by helping it improve capacity; make monitoring templates available down to community or barangay organizations. It was also suggested that external scorecards be developed to validate or verify agency performance. The workshop participants identified many facilitating factors, such as the presence of CSO networks and willingness to do monitoring work and the enabling environment with the establishment of a Procurement Transparency Group under GPPB; the issuance of Executive Order No. 124 Creating Internal Audit Units in All Government Agencies; PAGC’s efforts to develop generic manuals for internal audit and DBM’s guidelines on internal control; and the completion of the Organizational Performance Indicator Framework (OPIF), which was introduced in all departments. Some constraints, however, include the limited capacity and resources for information dissemination and operations. Linking Financial Management, Procurement Reforms and ICT SEMP2 contributed to vital reforms in procurement and financial management (PFM) by way of providing the impetus or setting the agenda for them. The most well-known as well as the most successful of these reforms was the adoption of a macro-framework for procurement reform, which culminated in the passage of the GPRA (RA 9184). The other equally relevant reforms that had been adopted were:
automation of accounting systems from COGAS to ENGAS; strengthening of FM functions and review of structures with the drafting of the PFM manual; flash reporting of financial data; and PFM training course is also being drafted.
Interestingly, the convergence of many efforts and initiatives around procurement reform made the stakeholders realize that it could not happen in isolation. A holistic systems reform must be pursued. From one end of financial management, for instance, budget planning remained weak and highly politicized in many, if not all, government agencies. From another end, processing and release of payment to suppliers or contractors had not been prompt and efficient. Both affect the quality of procurement. Bad plans could jack up unit prices; late payment increases cost of money, which bidders could charge to their bid price. The point, of course, was not only to pursue other reforms as aggressively as was done with procurement, but rather to make sure that these reforms were linked with each other. The entire financial management system, from budgeting, procurement planning and contracting, to accounting

55
and audit, should be taken together. This entails that the financial management unit must be transformed into a strategic partner, and that it be allowed to exert stronger influence in the operation of the agency. That way, it can help shape outcome of projects and programs, which traditionally were the domain of planning and program units. It was argued in the workshop that one of the most effective ways of linking these systems reforms was through ICT. A caveat was, however, raised on the nature of ICT as a tool, whose results may look good only on paper. The point about the holistic approach, therefore, still holds. The menu of recommendations that the workshop provided appears to offer such holistic approach:
Promote capacity development on procurement from top management down to the staff level; Integrate systems on IT across procurement, planning and financial management; Link/synchronize the procurement plan with the planning and budgeting; Conduct supplier orientation and development program; Dialogue with Congressmen on projects from the procurement down to the implementation of
the projects; Reduce payment delays to encourage bidder participation; cut processing of payment from
one month to a shorter period through bi-monthly submissions; Implement E-NGAS and integrate other features of E-NGAS with the existing system; Advocate for Finance Managers to support FM in their own agency; Create Customized Users Manual for Procurement and Financial Management per agency;
and Enhance compliance of LGUs to RA9184 through their usage of their procurement manual.
The major constraints identified include budgetary, human resource and time constraints as well as particularistic interests. Sustainability and Institutionalization The implementing agencies were looking beyond SEMP2. They had to confront the challenges of sustaining the accomplishments in service delivery and the best practices in systems improvement. DOH’s blueprint for sustainability was enshrined in the program “FOURmula One (F1) for Health” It integrated the same SEMP components of (1) health outcomes and (2) health systems performance, with service delivery as a pillar of the first component, and good governance plus health regulations as pillars of the second. For DSWD, the way to sustain the gains was through the localization of the programs. This meant the transfer of administration and management (including fund sourcing) of the programs to the LGUs and the communities themselves. LGUs, for instance, had been assuming the implementation of CIDSS. DepEd, on the other hand, has sustained the gains of textbook procurement through the adoption of the Textbook Count in the Department’s regular program. The practice of proper coordination with DPWH on the monitoring and inspection of school buildings had also been galvanized by the joint memorandum. Finally, DepEd Order 59, series of 2007, manifested the Department’s commitment to the institutionalization of citizen’s participation in procurement monitoring. By and large, the workshop emphasized the need for continued partnership-building and public advocacy to promote sustainability. The established network of support for the systems reforms and development interventions that started through SEMP, admittedly, still had a long way to go and should continue to reinvent and recalibrate itself to address new challenges. Sustainability approaches would be needed until the gains of the program had finally made evident impact on poverty reduction and growth.

56
Annex 7: Summary of “Impact Study on the Localization of CIDSS”
As provided for in Executive Order No. 443 of 1997, the implementation of the Comprehensive and Integrated Delivery of Social Services (CIDSS) Project was designed to be turned-over to the local government units within a 5-year period. Specifically, the turn-over involved the adoption of the CIDSS strategies, components and structures by the local government units as part of their response to address poverty in their localities. In anticipation of the full phase of CIDSS in 2004 and its integration with the new KALAHI-CIDSS Project, the Department of Social Welfare and Development (DSWD) undertook a study to determine the impact of the CIDSS localization in terms of the following aspects:
• Level of access to social services • Level of empowerment among families and communities in terms of their capacity
for self-governance, specifically in undertaking collective problem-solving as well as broadened control over productive assets;
• Quality of governance in terms of adoption and management of CIDSS concepts and principles
• Effectiveness of DSWD in preparing the local government units and the communities for the localization of CIDSS Project
The Study covered a sample of 30 municipalities where CIDSS was localized 3-4 years after its localization at the time of the evaluation (17 municipalities started CIDSS implementation in 1994/95 and localized in 1999; and 13 started CIDSS implementation in 1996/97 and localized in 2000). On the overall, the Study revealed that the localization of CIDSS was successful as indicated by continued reduction of unmet needs as well as the continuing strong commitment of the LGUs to apply the prescribed principles and procedures of the Project. The continuity of CIDSS were mainly attributed to the participation of the communities in the identification of their needs, using the MBN as major information tool; planning out and implementing the solutions; and the partnership with various agencies as well as with the LGU. The Study also recognized though that continuation of CIDSS is constrained by the changes in LGU leadership and staff. Highlights of the findings were as follows: Impact on Poverty Reduction Based on the tracking of the results of the Minimum Basic Needs (MBN) surveys conducted during three periods (i.e., the baseline year, the localization year and the latest year), a progressive reduction in percentage of households with unmet needs was registered in the sample municipalities across the island groups of Luzon, Bicol-Visayas and Mindanao. The Study further noted that the MBN was a useful tool for the community to analyze their level of needs and identify priority projects/beneficiaries.

57
Impact on Accessibility to Social Services and Community Resource Mobilization The Study reported the improved physical, financial and institutional access to social services which was attributed to the community leaders’ confidence and capability as developed through their participation in CIDSS. The findings also noted that the provision of social services involved resource sharing arrangements among the national government agencies, LGUs, non-government organizations and business groups. Moreover, there were manifestations of self-help as the communities undertook simple projects such as primary health care, home sanitation and environmental projects. Impact on Empowerment Communities continued to organize community welfare structures (CWS) as a venue to plan actions and access support that will address their needs. The Study also reported of the community members’ pride regarding their democratic/participatory decision-making that is responsive to their needs and reflective of their desires as well as regarding their practices on fund management which they learned from CIDSS. Quality of Governance The Survey respondents registered awareness of the key CIDSS concepts related to community organization, total family approach, focused targeting and convergence. The continued application of these concepts manifested through the implementation of LGU projects through the CWS; updating of the MBN; updating of the community development plans; and monitoring activities on CIDSS. Effectiveness of DSWD Assistance in Preparing LGUs for Localization The Study raised the need for the DSWD to be flexible in its operational policies on localization with due consideration to the preparedness of the municipalities to implement CIDSS particularly with regard the LGU’s financial capacity. Related to this, the Study recommended that DSWD maintains a Special Fund to continue supporting LGUs in implementing its localized CIDSS, particularly for innovative initiatives. Likewise, continued technical assistance from DSWD as well as from other national government agencies was recommended. The major recommendations forwarded by the Study were as follows:
• MBN approach be continued as monitoring tool; • Issuance of policy instrument to strengthen resource sharing to enhance
community access to basic services; • Continued technical assistance/training for the CWS to achieve status as true
peoples’ organization that can undertake advocacy • Issuance of LGU policy, recognizing CWS; • Issuance of national policy to encourage LGUs to deploy more workers to the
community; • Continued training for LGU staff on CIDSS concepts and procedures as well as
their application/integration not only in local social welfare offices but in the management and planning processes for local programs and projects;

58
• Enhancement of operational guidelines on CIDSS localization, taking into consideration the level of preparedness of the LGUs, particularly with regard financial capability;
• Setting up of Special Fund by DSWD to continue supporting innovative LGU projects;
• Adoption of the CIDSS processes by all national departments with primary services that address the MBNs

59
Annex 8: School Building Program (SBP) – summary of evaluation findings Construction Cost and Quality A comparative review of the school’s experience in the implementation of the DepEd and DPWH school building program and an analysis on the SBRMS experience was conducted as a part of the preparation of the Implementation Completion Report of the SEMP2.
The review had three objectives namely, to compare and analyze the implementation of the DepEd and DPWH school building program in terms of cost effectiveness, timeliness, and quality of construction, to assess the quality of execution of the SBRMS grants and the extent to which it contributed to improve maintenance of school facilities and physical improvements in the school infrastructure, and to assess impact of the Principal-led approach to the implementation of the school building projects. The 23 schools visited were located in Pangasinan (Region I), Cebu (Region VII), and Davao City (Region XI). Nineteen schools covered for the school building component were comprised of nine single storey buildings with 7m x 9m classroom size, six two storey buildings with 7m x 9m classrooms, five single storey buildings with 7m x 7m classrooms, and three of the schools have repair/rehabilitation works. For the SBRMS component, 15 recipient schools were visited. The total project cost for all 23 schools inspected is Php 27,333,066.37. The review involved physical inspection of the school buildings selected in collaboration with DepEd and DPWH, photo-documentation, a short interview with school principal and teachers, and analysis of the contract documents available. Twenty four (24) out of the 25 school buildings inspected that were implemented by DepEd and DPWH were all completed and found in generally good condition. All the fifteen (15) schools visited that received a Php10,000 grant from the SEMP2 have complied with the project guidelines and were all eligible for reimbursement by the project. DepEd and DPWH followed a common set of standard designs for single storey and multi-storey school buildings thus resulting in uniformity of appearance of school buildings. However, despite the prescribed classroom dimension by DepEd which is 7mx9m particularly for secondary schools, the DPWH constructed 7mx7m sized classrooms in secondary schools. In terms of quality of workmanship, the DepEd implemented school building projects are relatively better than those completed by DPWH. Although total quality management is the responsibility of the contractor, the degree of monitoring has a significant impact on the quality of works accomplished. Hence the involvement of the principal and stakeholders in the supervision of construction works helped ensure quality output and the contractor’s adherence to the approved program of works. All the 25 school building projects inspected are well within the original prescribed budget of the Department of Education per standard design. DepEd implemented SBPs have a lower average spending per classroom for a single-storey school building with an average cost of PHP387,929.32 for 7m x 9m classroom as compared to DPWH implemented school buildings with an average cost of Php404,060.49 for a 7m x 9m classroom.

60
Cost-wise, school building projects constructed by DepEd are relatively cheaper than those constructed by DPWH in terms of completeness of school building facilities, and better quality. DepEd is able to construct more with the same amount of money than DPWH. Of the 15 school buildings with available information on project duration, three were completed on time, four were completed ahead of schedule, while seven were delayed in completion, and one was left uncompleted for almost a year now since start of construction. DepEd-implemented school building projects are relatively completed earlier compared to DPWH-implemented projects. Six of the seven school buildings that have an on-time or earlier completion dates are all DepEd Principal-led implemented. All of the school principals and teachers interviewed said that the PHP10,000 grant they received was not sufficient to repair the urgent and priority needs of the schools. Most of the interviewee also commented on the extensive documentation requirements and requested that it be further simplified. The SBRMS grants, though small in amount, have significantly contributed to improving the condition of school facilities. It helped generated additional financial support from the community. The grant, however, was not sufficient to fund the major repair and rehabilitation needs of the schools hence projects that were implemented were only those that would fit in the PHP10,000 budget. The Principals who were interviewed generally expressed their satisfaction with the principal-led mode of implementation and preferred that all SBPs be done in this mode. Greater transparency and accountability is evident in principal-led school building projects. The school heads can clearly exercise their managerial functions in overseeing the construction works in their schools. The principal-led SBP can be expected to reduce irregularities since the school heads being the end users of these facilities have a greater stake in ensuring the qualities of construction works. The principal is also instrumental in mobilizing the community to participate in school improvement activities such as maintenance, minor repairs and security. The school-community partnership is very important to ensure successful implementation of projects and the delivery of the school’s objectives. Expenditure Review A review of the expenditure for school-based repairs and maintenance scheme (SBRMS) under the Second Social Expenditure Program (SEMP 2) was made to bring into light the following: 1) the reasons why some transactions were ineligible for bank financing; and 2) the factors that contributed to the low utilization of the funds provided for this loan category. In summary, the reasons why there was so much repair and maintenance expenditure that were adjudged ineligible for reimbursement from the loan are as follows:
1. The regional office implemented PHP200,935,582.90 worth of repairs and maintenance projects before the issuance of the new guidelines.
Most of the projects would have qualified in the list of works allowed but the mere fact it was implemented by the regional office made it ineligible. The regional office was

61
acting on the basis of previously allowed practice allowed practice in SEMP 1 (a big part of these projects were carried over from SEMP)1. Moreover, the regional office had a higher limit for entering into contracts so the transactions it entered into were more than the cap of PHP10,000 per school. This fact also made these transactions ineligible.
In addition, the regional office used funds to repair the facilities of regional offices like the Regional Education Learning Center (RELC). These again are not eligible for reimbursement. This led DepEd to put a cap of 20% of budget for repairs and maintenance that regions and divisions may use for purposes other than teaching related so that 80% will be available for school repairs and maintenance reimbursable under SEMP 2.
2. Included in the amount of Php140,712,306.61 worth of repairs and maintenance projects
were those implemented by division offices before the issuance of the new guidelines and those implemented by schools but with incomplete documentation.
Like the regional office, the projects implemented by the division would have qualified in the list of works allowed but these were not implemented by the principal so they are not eligible for reimbursement as well. The division was acting on the basis of previous guideline as the new guidelines were still not issued. Also, most of these projects were carried over from SEMP 1.
The division also used funds to repair division office facilities and these do not qualify for reimbursement. These also include some funds used to repair non-teaching rooms as the principal’s office or the PTCA room, etc., which also are not eligible for bank financing. (Please see samples of this highlighted in Attachment D-2.)
Included in this group are some SBRMS projects implemented by schools which would qualify for reimbursement but have incomplete documentation so they could not be included in the SOEs yet. Part of the problem was due to the movement of school heads that delayed liquidation of cash advances for SBRMS.
In general, it was determined that the main reason for the ineligibility for bank financing of repair and maintenance transactions done early in the project life was because these were implemented by regional and division offices continuing the previous practice allowed before SEMP 2. Late release of the guidelines for SBRMS compounded this problem. Meanwhile, the reasons for the low utilization of SBRMS funds have been identified as follows:
1. Late release of the guidelines for SBRMS contributed to the low utilization of SBRMS funds.
Early in the life of SEMP 2 regional and division offices continued to implement repairs and maintenance for schools following previously allowed practice using one-third of the total budget for the purpose over the life of the project. These transactions are ineligible for bank financing. Implementation of SBRMS following the new guidelines was actually done one-year late due to the late release of the guidelines.
62
2. The enormity of the DepEd organization slows down delivery of essential communication, e.g., changes in policy, and reduces the ability of DepEd personnel to monitor implementation of SBRMS.
The new guidelines for SBRMS and the reports that had to be made thereafter had to be coursed through several levels of the organization and this delayed delivery slowing down the process. This is compounded by the dearth of finance staff at the division level to follow-up on liquidation of cash advances of principals implementing SBRMS. Likewise, essential skills in handling funds for principal grantees was wanting as not all were given the benefit of training.
3. DBM apparently underestimated the ability of DepEd to produce SBRMS SOEs
eligible for bank financing as indicated by the drastic reduction in the fund allocation for the purpose.
There is an apparent underestimation by DBM as the PMO of the actual need of DepEd as one of the implementing agencies of SEMP 2, particularly in the fund allocation that DepEd can realistically utilize for SBRMS. As a result, not all SOEs eligible for bank financing were used and the level of utilization of this allocation was only at 45% when it could have been at 64%.
In summation, low utilization of SBRMS funds resulted from delays in the release of new guidelines that led to ineligible repairs and maintenance transactions. DepEd management apparently took too long to release the department memorandum governing the implementation of SBRMS. The subsequent amendment provided in a department order was also released late. The size of the DepEd bureaucracy added to the delay. Finally, DBM also contributed to the low drawdown as it exercised discretion to reduce the allocation for SBRMS and not to use all SBRMS SOEs eligible for bank financing submitted by DepEd within the deadline set.

63
Annex 9. Experience and lessons from textbook procurement and distribution
Prior to 1999, the public schools had been experiencing acute shortages of textbooks and other learning materials, with a textbook-pupil ratio of as low as 1 textbook per 8 students. The problem was not only rooted in the inadequacy of the budget to finance procurement and delivery of these textbooks but also rampant corruption and inefficiencies that had plagued government textbook procurement for decades. A Social Weather Stations survey in September 1999 ranked the then Department of Education, Culture and Sports (DECS) as the sixth most corrupt government agency, because of the blatant and highly complex cheating in its purchases of educational materials, especially textbooks and supplementary materials. An investigative report by Yvonne Chua of the Philippine Center for Investigative Journalism (PCIJ) in 1999 concluded that government textbook procurement was subject to significant corruption and collusion by a small number of local suppliers, and estimated that payoffs to corrupt officials in government represented 15 to 30 percent of the cost of textbook contracts.
Since 1999, however, the succeeding Secretaries of the Department of Education have developed and implemented wide-ranging reforms in textbook procurement. In July 2004, DepEd issued its new Textbook Policy through DepEd Memo No. 289, which sought to strengthen upstream quality and cost-effectiveness in the textbook evaluation and procurement process, as well as downstream distribution issues. Consistent with this new policy, the textbooks financed under the WB-assisted First and Second Social Expenditure Management Projects (SEMP 1 and 2) and the Third Elementary Education Project were acquired through international competitive bidding. Through increasing the transparency and competition during textbook procurement, the Government was able to lower the cost of textbooks by at least 46%, improve physical quality in terms of paper, body and cover, thus ensuring longer textbook life; and realizing significant cumulative savings to an estimated US$125 million (US$153 million if adjusting for inflation (see Annex 3). The strong involvement of at least 36 civil society organizations in textbook procurement, delivery and distribution have ensured timely distribution of textbooks to the 42,000 public schools nationwide, thus, enabling the almost reaching of the desired national average of 1:1 textbook-pupil ratio. A four-stage content evaluation process of different specialists was put in place starting December 2005. The initial gains from the implementation of procurement reforms have also earned international recognition for the Philippines, including the recent citation by the Organization for Economic Cooperation and Development – Development Assistance Committee (OECD-DAC) on the successful reforms in textbook procurement. The independent conclusions of OECD-DAC procurement specialists deserve to be quoted in detail:
“In the 1990s, corruption was rampant in the Department of Education in the Philippines. The Department was unable to deliver the most basic services to its 18 million public school students. Unqualified bidders were overpricing their school text books and corrupt officials were awarding them contracts to deliver books which seldom arrived at schools. In 2001 a new government decided to fight corruption and reform the way textbooks were ordered and delivered. The ‘Textbook Count 1-2-3’ project made sure that every text book was accounted for and delivered. NGOs, parents, Boy Scouts and Girl Guides were all involved, including the Coca Cola company who agreed to deliver textbooks for free in their trunks when delivering soft drinks to remote areas.” (Development Assistance Committee, Organization for Economic Cooperation and Development (OECD/DAC), “Why is Procurement Important?” Factsheet, December 2006).

64
The gains were not without challenges and resistance, most recent of which were the procurement protests and cases filed by the losing bidders in the latter half of 2006 against the Philippine Government on the awarding of contracts for Social Studies textbooks financed by SEMP 2. Allegations included the winning bidders have engaged in collusion, and that the government has favored certain bidders during the procurement process. These allegations were repeatedly aired in the electronic and print media by the losing bidders, including making direct and indirect accusation of corruption against the winning bidders, DepEd officials, and even World Bank staff. The Philippine Government is responsible for implementation, including all procurement (from the bidding, evaluation, and awarding of contracts) on projects financed by WB loans, such as SEMP 2. It is the World Bank’s responsibility, however, to review implementation, including procurement, to ensure that funds are used for the intended purpose and that the agreed procurement procedures as stated in the Loan Agreement are strictly followed. In response to the protest registered by the losing bidders, the World Bank’s Regional Procurement Advisor and Head of the Legal Procurement department reviewed the procurement complaints relative to the Social Studies textbook procurement. On the basis of this review, it was found that the suppliers’ complaints were without merit and that the awards were made in accordance with the applicable guidelines for procurement under WB financing and with the provisions of the legal agreement for the SEMP 2 project. The losing bidders were informed as such in writing. Further complaints were lodged against the winning bidders and against World Bank team members with the World Bank’s Department of Institutional Integrity (INT), which is responsible for investigating all allegations of corruption involving Bank-financed projects or staff. INT reviewed the accusations according to its procedures and found insufficient basis to warrant further investigation. Following the dismissal of the procurement complaints filed with the World Bank, the losing bidders sought a Restraining Order (RO) against the delivery of the final order of textbooks. A lower court granted the RO – which resulted in further delays of textbook distribution – but, on appeal by way of certiorari, the Philippines’ Supreme Court ruled in favor of the Government and overturned the RO in March 2007. In doing so, the Supreme Court both affirmed the applicability of World Bank procurement procedures as stated in the project legal agreement, and sent a strong message of support for ensuring the integrity of the procurement process in the government, in particular in the Department of Education. Thus, the legal and procedural challenges lodged against the social studies textbook procurement process were thoroughly review and rejected. Moreover, typically, companies collude in order to obtain a higher price for the procured goods (the situation that prevailed prior to the SEMP1 and 2, according to both the Philippine Center for Investigative Journalism and OECD-DAC). But as noted above and detailed in Annex 3, the introduction of international competitive bidding (ICB) under the SEMP projects drove down the cost of textbooks by nearly 50 percent. Furthermore, much of the complaints and legal challenges against the procurement awards under SEMP2 were based on efforts to disqualify or otherwise exclude firms that had submitted the lowest responsive bids. Had these efforts succeeded, the result would have been less competition and higher prices. Remarkably, there continues to be efforts in the Philippine media and through the political process to assert that a “textbook scandal” transpired, even as the project was financed by SEMP2. Efforts are also underway to seek repeals or reforms of key elements of the national procurement law. The need to sustain and strengthen procurement reforms therefore, has become an imperative for the Philippine Government. Despite progress made, there is still much to be done. The DepEd continues to intensify its efforts to strengthen content evaluation process, increase

65
involvement of other stakeholders in content evaluation, procurement and textbook distribution, and increase transparency and accountability mechanisms. A general review of the DepEd’s textbook policy will be undertaken soon to ensure that the problems are addressed, weaknesses are corrected, and gains are sustained. In addition, civil society and other supporters of procurement reform within and outside of government, will also need to be mobilized to ensure that further reforms or legislative changes will strengthen—rather than weaken—transparency and efficiency gains from the Philippines procurement reform process.
66
Annex 10. List of Supporting Documents Project documentation: Aide Memoires, Back-to-Office Reports, Project Status reports and Implementation
Status Reports, 2001-2007 Project Appraisal Document, 23340-PH, 2002. Project Monitoring Reports. Implementation Completion Report, DepEd, 2007. Implementation Completion Report, DSWD, 2007. SEMP2 Project Implementation Manual, DBM. SEMP2 Loan Agreement, 2002. Reports, studies, and references Bautista, Victoria, Combating Poverty through the Comprehensive and Integrated Delivery of Social Services (CIDSS), National College of Public Administration and Governance, prepared for the Department of Social Welfare and Development, 1999. Bureau of Food and Drugs (BFAD). “Master Plan for Strengthening of Bureau of Food and Drugs,” 2002. Coronel, Sheila, Robbed: An Investigation of Corruption in Philippine Education Books, Philippine Center for Investigative Journalism. 1998. Development Assistance Committee, Organization for Economic Development and Cooperation (OECD/DAC), “Why is Procurement Important?” Fact sheet, December 2006. http://www.oecd.org/dataoecd/35/58/37766795.pdf Dichter, Thomas. CIDSS Review: Final Report. World Bank. 2002 Department of Education. The Deployment and Utilization of Public School Teachers in the Philippines. 2001. Department of Health (DOH). Field Health Services Information System (FHSIS) Annual Reports, National Epidemiology Center, various years (2003-2006) DOH. National Tuberculosis Program (NTP) Report. Various years (2003-2006). Department of Social Welfare and Development (DSWD). “Project Implementation Plan and 2004-2005 Action Plan for Residential Centers and Institutions,” 2004. DSWD and Orient Integrated Development Consultants, Inc (OIDCI), Impact Study on the Localization of CIDSS, Vol. 1, Main Report, November 2004. Fagela, Marifer Cumigad, “Main Report on the Comparative Review of DPWH and DepEd-constructed School Buildings under the Second Social Expenditure Management Project,” consultancy report commissioned by the World Bank for the SEMP2 ICR, December 2007.
67
Fagela, Marifer Cumigad, , “A Study of the Expenditure for School-Based Repair and Maintenance Grants Implemented by the Department of Education as a Component of The Second Social Expenditure Management Project,” consultancy report commissioned by the World Bank for the SEMP2 ICR, December 2007. Government of the Philippines, DepEd. Evaluation of the School-Based Repair and Maintenance Scheme. July 2001. Government Watch (G-Watch), Ateneo School of Government, “Main Report of the BAYANIHANG ESKWELA: The Citizens' Monitoring of DPWH-Implemented School Building Projects, April 2007. Grindle, Merilee (ed.). Getting Good Government: Capacity Building in the Public Sectors of Developing Countries (Harvard University Press: Boston, MA 1997). Hoffman, Joseph, Technical Assistance on DSWD Institutions and Center, Final Report on Findings for the DSWD and the DBM, Philippines, August 2002. Kaufmann D., A. Kraay, and M. Mastruzzi, Governance Matters VI: Governance Indicators for 1996-2006. World Bank, 2007. : Manasan, Rosario. Education Financing and Service Delivery. (Prepared for PER). December 2001. Moses, Kurt. A Strategy for Education Management Information Systems. April 2002. Ex-Post Review of SEMP2 and TEEP School Building Program, World Bank. 2006. Parafina, Dondon. Diagnosing DOH’s Drug Procurement Program: A Case Study on Government Systems Monitoring. Ateneo School of Government. 2003. Somerset, Anthony and East Sussex Lewes. Getting Teachers Into the Schools Where They Are Most Needed: A Philippines Action Research Project. 2002. The World Bank and Social Weather Station. “Filipino Report Card on Pro-Poor Services,” Manila, 2002. University of the Philippines, National College of Public Administration and Governance: Impact Evaluation of CIDSS; 1997.

1
2
4
6
7
1111
1414
1717
1818
1919
2020
21212222
1616
2323
24242525
2727
3131
3939
4242 4646
4747
4949
5454
7575
5959
6262
6565
6666
7171
7373
7474
7676
8181
8080
7777
78787979
6363
3
5 9
1010
8
1212
1313
1515
2828
2929
3030
2626
3232
3333
3434
3535 3636
3737
3838
4040
4141
4343
4444 4545
4848
5050
5151
5252
5353
5555
5656
5858
6161
6464
6868
6969
7070
6060
6767
7272
5757
IliganIligan
PasigPasigQuezon Quezon
LucenaLucena
ViracViracBatangasBatangas
BoacBoacMamburaoMamburao
RomblonRomblon
Santa CruzSanta Cruz
AntipoloAntipolo
BalerBalerPalayan Palayan
TarlacTarlacIbaIba
MalolosMalolosBalangaBalanga
Trece MartiresTrece Martires
Laoag CityLaoag City
ViganViganBanguedBangued
TabukTabuk
IlaganIlagan
CabarroguisCabarroguis
BontocBontocLagaweLagawe
BayombongBayombongLa TrinidadLa Trinidad
LingayenLingayen
KabugaoKabugao
BascoBasco
Puerto PrincesaPuerto Princesa
PiliPili
SorsogonSorsogon
DaetDaet
MasbateMasbateCatarmanCatarman
BoronganBoronganCatbaloganCatbalogan
NavalNaval
MaasinMaasin
BacolodBacolod
DumagueteDumaguete SiquijorSiquijor
TagbilaranTagbilaran
MambajaoMambajao
SurigaoSurigao
San JoseSan Jose
TandagTandag
Tubod Tubod
ProsperidadProsperidad
TagumTagumNabunturanNabunturan
MatiMatiKidapawanKidapawan
DigosDigos
IsulanIsulan
Marawi Marawi
MalaybalayMalaybalay
OroquietaOroquietaDipologDipolog
IpilIpil
IsabelaIsabelaCityCity
JoloJolo
KaliboKaliboRoxas CityRoxas City
San Jose deSan Jose deBuenavistaBuenavista
JordanJordan
AlabelAlabel
KabuntalanKabuntalan
PanglimaPanglimaSugalaSugala
ZamboangaZamboanga
CalambaCalamba
San FernandoSan Fernando
TuguegaraoTuguegarao
BaguioBaguioSan FernandoSan Fernando
LegaspiLegaspi
TaclobanTacloban
CebuCebu
ButuanButuan
DavaoDavaoCotabatoCotabato
CagayanCagayande Oro de Oro
IloiloIloilo
PagadianPagadian
KoronadalKoronadal
CalapanCalapan
MANILAMANILA
Shariff AguakShariff Aguak(Maganoy)(Maganoy)
Sultan KudaratSultan KudaratZAMBOANGA CITYZAMBOANGA CITY
1
2
4
6
7
11
14
17
18
19
20
2122
16
23
2425
27
31
39
42 46
47
49
54
75
59
62
65
66
71
73
74
76
81
80
77
7879
63
3
5 9
10
8
12
13
15
28
29
30
26
32
33
34
35 36
37
38
40
41
43
44 45
48
50
51
52
53
55
56
58
61
64
68
69
70
60
67
72
57
ZAMBOANGA CITY
ICAR II
III
IV-A
V
IV-B VI VII
VIII
IX X
XIII
XI
XII
ARMM
NCR
Iligan
PasigQuezon
Lucena
ViracBatangas
BoacMamburao
Romblon
Santa Cruz
Antipolo
BalerPalayan
TarlacIba
MalolosBalanga
Trece Martires
Laoag City
ViganBangued
Tabuk
Ilagan
Cabarroguis
BontocLagawe
BayombongLa Trinidad
Lingayen
Kabugao
Basco
Puerto Princesa
Pili
Sorsogon
Daet
MasbateCatarman
BoronganCatbalogan
Naval
Maasin
Bacolod
Dumaguete Siquijor
Tagbilaran
Mambajao
Surigao
San Jose
Tandag
Tubod
Prosperidad
TagumNabunturan
MatiKidapawan
Digos
Isulan
Marawi
Malaybalay
OroquietaDipolog
Ipil
IsabelaCity
Jolo
KaliboRoxas City
San Jose deBuenavista
Jordan
Alabel
Kabuntalan
PanglimaSugala
Zamboanga Shariff Aguak(Maganoy)
Sultan Kudarat
San Fernando
Tuguegarao
BaguioSan Fernando
Legaspi
Tacloban
Cebu
Butuan
DavaoCotabato
Cagayande Oro
Iloilo
Pagadian
Koronadal
Calapan
Calamba
MANILA
MALAYSIA
Celebes Sea
Moro
Sulu Sea
Leyte Gulf
Visayan
Sea
Mindoro Strait
SibuyanSea
Phi l ippine
Sea
Babuyan Channel
Luzon Strai t
Gulf
DavaoGulf
MindanaoSea
BatanIslands
BabuyanIslands
PolilloIslands
LubangIslands
Catanduanes
TicaoSibuyanTablas
Busuanga
SemiraraIslands
CuyoIslands
Culion
Linapacah
Dumaran
Bugsuk
Balabac
Cagayan Sulu
Tawi-Tawi
Sulu
Basilan
Mindanao
CamiguinSiquijor
Negros
Panay
Bohol
Cebu Leyte
SamarMasbate
Marinduque
BuriasMindoro
Palawan
Luzon
Dinagat
Siargao
Sarangani
20ºN
10ºN
5ºN125ºE
120ºE
125ºE
IlocosIlocos NorteIlocos SurLa UnionPangasinan
Cordillera Admin. Reg.AbraApayaoBenguetIfugaoKalingaMountain Province
Cagayan ValleyBatanesCagayanIsabelaNueva VizcayaQuirino
Central LuzonAuroraBataanBulacanNueva EcijaPampangaTarlacZambales
National Capital Reg.
CALABARZONBatangasCaviteLagunaQuezonRizal
MIMAROPAMarinduqueMindoro OccidentalMindoro OrientalPalawan*Romblon
BicolAlbayCamarines NorteCamarines SurCatanduanesMasbateSorsogon
Western VisayasAklanAntiqueCapizGuimarasIloiloNegros Occidental
Central VisayasBoholCebuNegros OrientalSiquijor
Eastern VisayasBiliranEastern SamarLeyteNorthern SamarSamarSouthern Leyte
Zamboanga PeninsulaZamboanga del NorteZamboanga del SurZamboanga SibugayZamboanga City
I1234
CAR56789
10
II1112131415
III16171819202122
NCR
IV-A2324252627
IV-B2829303132
V333435363738
VI394041424344
VII45464748
VIII495051525354
IX555657---
Northern MindanaoBukidnonCamiguinLanao del NorteMisamis OccidentalMisamis Oriental
Davao Reg.Compostela ValleyDavao del NorteDavao del SurDavao Oriental
SOCCSKSARGENNorth CotabatoSaranganiSouth CotabatoSultan Kudarat
CaragaAgusan del NorteAgusan del SurDinagat IslandsSurigao del NorteSurigao del Sur
Autonomous Reg. inMuslim MindanaoBasilanLanao del SurMaguindanao**Shariff KabunsuanSuluTawi-Tawi
X5859606162
XI63646566
XII67686970
XIII7172737475
ARMM
767778798081
**Shariff Aguak (Maganoy) andSultan Kudarat serve as co-capitalsof the province.
*Executive Order 429, May 23, 2005,provides for the transfer of Palawanprovince (#31) from Region IV toRegion VI; Administrative Order 129holds EO429 in abeyance until animplementation plan is approvedby the President.
PHILIPPINES
0 50 100
0 50 100 Miles
150 Kilometers
IBRD 35773
NOVEMBER 2007
PHILIPPINESSECOND
SOCIAL EXPENDITUREMANAGEMENT PROJECT
(SEMP2)SELECTED CITIESPROVINCE CAPITALSREGION CAPITALSNATIONAL CAPITALRIVERSMAIN ROADSRAILROADSPROVINCE BOUNDARIESREGION BOUNDARIESINTERNATIONAL BOUNDARIES
This map was produced by the Map Design Unit of The World Bank. The boundaries, colors, denominations and any other information shown on this map do not imply, on the part of The World Bank Group, any judgment on the legal status of any territory, o r any endo r s emen t o r a c c e p t a n c e o f s u c h boundaries.