document id: tr-09-02 authors: karen raven and sean ... report title: drilling fluid management and...
TRANSCRIPT

Technical Report Title: Drilling Fluid Management and Testing in
DGR-5 and DGR-6 Document ID: TR-09-02 Authors: Karen Raven and Sean Sterling Revision: 0 Date: April 1, 2011
DGR Site Characterization Document Geofirma Engineering Project 08-200
Technical Report: Drilling Fluid Management and Testing in DGR-5 and DGR-6 Revision 0 Doc ID: TR-09-02
April 1, 2011 ii
Geofirma Engineering DGR Site Characterization Document
Title: Drilling Fluid Management and Testing in DGR-5 and DGR-6
Document ID: TR-09-02
Revision Number: 0 Date: April 1, 2011
Author: Karen Raven and Sean Sterling
Technical Review: Kenneth Raven; Dylan Luhowy (NWMO)
QA Review: John Avis
Approved by:
Kenneth Raven
Document Revision History
Revision Effective Date Description of Changes
0 April 1, 2011 Initial release
Technical Report: Drilling Fluid Management and Testing in DGR-5 and DGR-6 Revision 0 Doc ID: TR-09-02
April 1, 2011 iii
TABLE OF CONTENTS
1 INTRODUCTION ................................................................................................................. 1
2 BACKGROUND ................................................................................................................... 1
3 METHODOLOGY ................................................................................................................ 3 3.1 Proposed Drilling Fluids ................................................................................................ 3 3.2 Drilling Fluid Preparation and Monitoring ...................................................................... 4 3.3 Drilling Fluid Storage, Reuse and Disposal ................................................................... 4 3.4 Tracer Preparation ........................................................................................................ 4 3.5 Sample Collection ......................................................................................................... 5 3.6 Sample Analysis ............................................................................................................ 7
4 RESULTS AND CONCLUSIONS ........................................................................................ 8 4.1 Field Physical Property Measurements ......................................................................... 8 4.2 Field Chemical Property Measurements ....................................................................... 8 4.3 Laboratory Analyses ...................................................................................................... 9
5 DATA QUALITY AND USE ................................................................................................. 9
6 REFERENCES .................................................................................................................... 9
LIST OF FIGURES
Figure 1 Location of DGR-1, DGR-2, DGR-3, DGR-4, DGR-5 and DGR-6 at the Bruce Site ........................ 2
LIST OF TABLES
Table 1 Summary of Analyses of Drilling Fluids – DGR-5 and DGR-6 ...................................................................... 6 Table 2 Summary of Container Requirements for Drilling Fluid Samples .................................................................. 7
LIST OF APPENDICES
APPENDIX A Summary of Field Physical Property Measurements of DGR-5 and DGR-6 Drilling Fluids APPENDIX B Summary of Field Chemical Property Measurements and Laboratory Analyses of DGR-5 and
DGR-6 Drilling Fluids APPENDIX C Depth Plots of Selected Analyses of DGR-5 and DGR-6 Drilling Fluids

Technical Report: Drilling Fluid Management and Testing in DGR-5 and DGR-6 Revision 0 Doc ID: TR-09-02
April 1, 2011 1
1 Introduction
Geofirma Engineering Ltd. (formerly Intera Engineering Ltd.) has been contracted by the Nuclear Waste Management Organization (NWMO) on behalf of Ontario Power Generation to implement the Geoscientific Site Characterization Plan (GSCP) for the Bruce nuclear site located near Tiverton, Ontario. The purpose of this site characterization work is to assess the suitability of the Bruce nuclear site for the construction of a Deep Geologic Repository (DGR) to store low-level and intermediate-level radioactive waste. The GSCP is described by Intera Engineering Ltd. (2006, 2008a).
This report summarizes the preparation, handling, tracing, sampling and disposal of drilling fluid at two deep bedrock boreholes (DGR-5 and DGR-6) conducted as part of Phase 2B of the GSCP. Work described in this Technical Report (TR) was completed in accordance with Test Plan TP-08-21 – DGR-5 and DGR-6 Drilling Fluid Management (Intera Engineering Ltd., 2009a), which was prepared following the general requirements of the DGR Project Quality Plan (Intera Engineering Ltd., 2010a).
2 Background
The GSCP is composed of two phases of borehole drilling and investigations. Phase 1 included the drilling and testing of two deep boreholes, DGR-1 and DGR-2, to total depths of 462.9 and 862.3 metres below ground surface (mBGS) respectively, and the drilling and testing of one shallow borehole, US-8, to a total depth of 200 mBGS. Both of the Phase 1 DGR boreholes were drilled at one location (Drill Site #1, see Figure 1), approximately 40 metres apart from each other. The shallow borehole (US-8) was drilled at a second location (Drill Site #2); both drill sites are at the Bruce site as shown on Figure 1. Phase 1 drilling and testing was completed between December 2006 and December 2007.
Phase 2 of the GSCP included the drilling and testing of four additional deep boreholes and was divided into two smaller phases, Phase 2A and 2B. Phase 2A included the drilling and testing of two deep vertical boreholes, DGR-3 and DGR-4, to total depths of 869.2 and 857.0 mBGS respectively. DGR-3 was drilled at Drill Site #2 and DGR-4 was drilled approximately 1050 metres to the north at Drill Site #3; both drill sites are at the Bruce site as shown on Figure 1. Phase 2A drilling and testing was completed between April and October 2008.
Geofirma Engineering Ltd. recently completed Phase 2B investigations which included the drilling and testing of two deep inclined boreholes, DGR-5 and DGR-6, drilled at an inclination of approximately 65 and 60 degrees from the horizontal, respectively. DGR-5 was drilled to a total depth of 807.2 metres of length below ground surface (mLBGS) and DGR-6 was drilled to a total depth of 903.2 mLBGS. DGR-5 was drilled at Drill Site #1 and DGR-6 was drilled approximately 630 metres to the northwest at Drill Site #4; both drill sites are at the Bruce site as shown on Figure 1. Phase 2B drilling and testing was completed between December 2008 and February 2010. TR-09-01 - Drilling, Logging and Sampling of DGR-5 and DGR-6 (Geofirma Engineering Ltd., 2011) summarizes the Phase 2B drilling and core logging activities.
Davidson Drilling Ltd. (Davidson), based in Wingham Ontario, was originally contracted by Geofirma Engineering Ltd. to complete the borehole drilling and permanent casing installation for Phase 2B work. Davidson also completed the Phase 1 and Phase 2A borehole drilling and casing installation of DGR-1, DGR-2, DGR-3 and DGR-4. During the drilling program of DGR-5 and DGR-6, Davidson had difficulty maintaining the required borehole orientation (azimuth and inclination) and as a result, the objectives of borehole DGR-6 would not be met without directional drilling correction. Therefore, Geofirma contracted with Layne Christensen Canada Ltd. (Layne), based in Capreol, Ontario, in conjunction with International Directional Services (IDS), also based in Capreol, Ontario, to complete DGR-6 below a depth of 516.33 mLBGS at the top of the Queenston Formation. Layne used conventional mineral exploration drilling equipment with the assistance of directional coring equipment (IDS) as necessary.

&<
&<
+U
&<
&<
&<
ç
Core Storage Facility
DGR-2
DGR-1
çDrill Site #1
çDrill Site #2
ç
Drill Site #3
çDrill Site #4
DGR-4
DGR-6
DGR-3 DGR-5
0 200 400 600 800100Meters
1:15,000Scale
PROJECT No. 08-200 TR-09-02
PROJECTION: UTM NAD 83 Zone 17NSOURCE: NRVIS/OBM, MNR, OPG, NWMO
DESIGN: GDBCAD/GIS: NMPCHECK: GDBREV: 0
Figure 1DGR-1 through DGR-6
Site Location
PROJECT NWMO DGR Site Characterization Project
LEGEND
³
Pits or Landfills
Wetland Area, Permanent
Waterbody
Buildings
Stream or DrainageRoadsTransmission Line
Railways
L a k e H u r o n
Drill Sites
+U DGR Boreholes
P:\QMS_DGR\TR_WorkingFiles\TR-09-02 Drilling Fluid Management and Testing in DGR-5 and DGR-6\Figures\TR-09-02_Figure1_SiteLocationDGR1-6_R0.mxd
DATE: 30/03/2011
Technical Report: Drilling Fluid Management and Testing in DGR-5 and DGR-6 Revision 0 Doc ID: TR-09-02
April 1, 2011 3
During these drilling activities, different drilling fluids were prepared to optimize success of the drilling program including removing fines from the borehole, minimization of borehole deterioration and control of downhole formation pressures and flow. All drilling fluids were traced using a naturally-present tracer (tritium) and an added tracer (Na Fluorescein) to allow future quantification of drilling fluid contamination levels in any groundwater or porewater sample collected from the boreholes during and following completion of drilling.
3 Methodology
3.1 Proposed Drilling Fluids
Proposed major ion chemistry of drilling fluids for drilling of DGR-5 and DGR-6 were specified by Geofirma Engineering Ltd. based on: [1] the groundwater and porewater chemistry measured during Phase 1 and Phase 2A drilling and testing of DGR-1, DGR-2, DGR-3 and DGR-4 (Intera Engineering Ltd, 2010b; 2010c; 2010d: 2010e; 2009b), [2] previous groundwater sampling results from the same geological formations both from on-site (Lee et al., 1995) and off-site (McNutt et al., 1987) work, and [3] practical experience gained from Phase 1 drilling of DGR-1 and DGR-2 and Phase 2A drilling of DGR-3 and DGR-4.
MiSwaco of Calgary, Alberta initially prepared drilling fluid formulations on behalf of Davidson to address hole cleaning, fluid loss reduction and corrosion inhibition requirements of the drilling fluids during Phase 1 drilling (Intera Engineering Ltd., 2007). The proposed drilling fluid formulations for Phase 2B drilling activities were similar to Phase 1 and Phase 2A with the following modifications:
• Rotary drilling through overburden and the upper 15-25 m of bedrock for the purpose of conductor and surface casing installations used air-rotary drilling methods, instead of the mud-based drilling fluid used in Phase 2A and the addition of a series of polymers that were used in Phase 1.
• Rotary drilling of the upper 200 m of bedrock (i.e. above the Salina Formation F-Unit shale) used treated Lake Huron water, without any additives, as a drilling fluid. In the event that fresh water was not sufficient to remove the drilling cuttings and fines from the borehole, a fresh water-based drilling fluid created by adding a series of polymers, similar to the formulation that were used in Phase 1 and Phase 2A, was used. As such, the formulation of drilling fluids used during Phase 1 and Phase 2A (Intera Engineering Ltd., 2007; 2008b) remained as a backup recipe in the event that the drilling program required additional additives.
• Target brine concentrations were reduced by about 50% to yield a brine total dissolved solids (TDS) of about 135 g/L and the need for corrosion inhibitors (i.e., Conqor 404) was eliminated.
• Layne used conventional mineral exploration rotary drilling equipment with diamond impregnated bits and high rotations per minute (~900 rpm) drill string settings and therefore required the use of flocculant to assist with cleaning fines from the borehole. By comparison, Davidson used poly-diamond crystal (PDC) cutter bits that turned at a lower rpm (~80 rpm) and produced coarser cuttings and therefore did not require the use of flocculant to assist with their drilling operations. MagnaFloc 338 is a non-toxic high molecular weight anionic, water-soluble flocculant drilling fluid additive that was used by Layne to increase removal of fine drill cuttings. Experience while drilling with flocculants at DGR-1 showed that some loss of Na Fluorescein to this flocculant was noted during drilling and therefore flocculant was only used sparingly when deemed necessary to prevent equipment problems while drilling and reaming of DGR-6.
Two different drilling fluids were used to complete the drilling program. One drilling fluid, prepared using fresh water, was used for shallow rotary drilling (above Salina Formation F-Unit shale approximately 210 mLBGS) in DGR-5 and DGR-6). A second drilling fluid, prepared using brine, was used for deeper coring and reaming (greater than approximately 210 mLBGS) in DGR-5 and DGR-6 to protect against dissolution and wash-out of Silurian bedrock containing gypsum, anhydrite and halite zones and to protect against weathering/deterioration of the Ordovician shale formations (Queenston, Georgian Bay and Blue Mountain). In all cases the starting

Technical Report: Drilling Fluid Management and Testing in DGR-5 and DGR-6 Revision 0 Doc ID: TR-09-02
April 1, 2011 4
source of the drill water was Lake Huron water treated at the Bruce site water treatment plant.
Brine-based drilling fluids were prepared by addition of NaCl and CaCl2 salts to fresh lake water. The proposed deep drilling fluid was a Na:Ca:Cl brine with maximum target concentrations of about 35:16:84 g/L, respectively, for a maximum target total dissolved solids content of about 135 g/L. The maximum density of this brine-based drilling fluid (~1100 kg/m3) also provided protection against possible artesian flows and minor gas flow zones during drilling.
3.2 Drilling Fluid Preparation and Monitoring
All drilling fluids were prepared using treated Lake Huron water which was obtained from Building B-19 (Spent Solvent Treatment Facility) or Building B-25 (Heavy Water Plant Operations Building B). Water was obtained from a service outlet on the southeast side of B-19 that is normally used for filling water tankers or from a hose bibb located in the unloading area of the Core Storage Facility at B-25.
Treated Lake Huron water was trucked from Building B-19 by the drilling contractors and pumped into a multi-tank drill fluid preparation and cleaning system. Drilling fluid tanks were provided by the drilling contractors. The total number and size of tanks depended on the section of borehole being drilled (i.e., shallow bedrock drilling for surface casing installation had a much simplified drill fluid preparation and cleaning system). Geofirma added the necessary amounts of Na Fluorescein tracer to the drilling fluid tank to achieve a target tracer concentration of 1 mg/L. Drilling fluids were prepared in tanks, by addition of the necessary drilling fluid additives to traced Lake Huron water, by the drilling contractors.
Once coring started, the physical properties of the drilling fluids were monitored for fluid density and funnel viscosity on a once per drilling shift basis (i.e., once every 12 hours), or more frequently if necessary, by Davidson. During Layne drilling operations (below 516.33 mLBGS in DGR-6) Geofirma field staff monitored drilling fluid density every two to three days, or more frequently if necessary, however funnel viscosity was not measured during these drilling activities. Maintenance of the drilling fluids was the responsibility of the drilling contractor. Fluid density was monitored by Davidson using a bulb hydrometer (measured in grams per cubic centimetre, g/cc) and by Geofirma using a graduated cylinder to measure volume and a field scale to measure mass. Funnel viscosity was monitored by Davidson using a field wellhead Marsh funnel viscosity meter (measured in seconds that it takes 1 litre of drilling fluid to pass through the funnel). Additions of drilling fluid additives to maintain drilling fluid density and viscosity were the responsibility of the drilling contractors.
Geofirma retained responsibility for maintenance of Na Fluorescein drill water tracer levels.
Records of the above drilling fluid preparation and physical property measurements were retained in Scientific Notebooks (ID: SN-08-21).
3.3 Drilling Fluid Storage, Reuse and Disposal
Prepared drilling fluids (both freshwater and brine based) were stored in on-site drilling fluid storage tanks.
All drilling fluids and solids identified for disposal were disposed of in accordance with provincial regulations, including Ontario Regulation 347 (Waste Management) as well as O. Reg. 245/97 (Exploration, Drilling and Production).
3.4 Tracer Preparation
Na Fluorescein stock solutions were prepared at concentrations of 10 g/L using treated Lake Huron water with appropriate drilling fluid additives for both the fresh water and brine-based drilling fluids. Na Fluorescein stock
Technical Report: Drilling Fluid Management and Testing in DGR-5 and DGR-6 Revision 0 Doc ID: TR-09-02
April 1, 2011 5
solutions were used for dosing the drill water tanks to achieve the target drill fluid concentration of 1 mg/L and for preparing Na Fluorescein drilling water standards.
Na Fluorescein drilling water standards were prepared at concentrations bracketing the target drill fluid concentration of 1 mg/L. Standards were prepared from Na Fluorescein stock solutions containing appropriate drilling fluid additives for either the fresh water or brine-based drilling fluids, as required. Na Fluorescein standards were prepared at concentrations of 10, 100, 500, 1000 and 1500 µg/L. The standards were then diluted 1:10 prior to calibration of the fluorometer.
These standards were identified as NaFl-mmmm.m, where NaFl is Na Fluorescein and mmmm.m is the concentration in µg/L. In addition to a name, drill water standards had the following information on the label:
1. the date of preparation;
2. the name of the person who created it;
3. the Scientific Notebook name and page number showing the record of the standard preparation; and
4. the requirement to store standard in a dark place out of direct light.
Na Fluorescein standards were stored in the field lab refrigerator, at approximately 4°C.
Records of the above tracer preparation were retained by Geofirma in Scientific Notebooks (ID: SN-08-21).
3.5 Sample Collection
Sampling and routine testing of drilling fluids was conducted on a regular basis throughout the drilling of DGR-5 and DGR-6, as specified in Table 1. Samples were collected for field and lab determination of drill water tracer concentrations and for characterization of general drill water major ion, metals and environmental isotope contents. Sample collection was based on Table 2 of TP-08-21. Na Fluorescein and electrical conductivity were regularly measured (two times per 12 hr shift = four times per day) in the field from drill water samples to both ensure maintenance of drill water tracer levels and for detection of production of formation fluids that may trigger opportunistic groundwater sampling. Drill water samples for tritium analyses were regularly collected at a frequency of once per 10 m of coring advancement within the Devonian and upper Silurian bedrock formation (i.e. above approximately 210 mLBGS) and at a frequency of once per 25 m of coring advancement below this depth. Tritium samples were then selected for analysis (35 for DGR-5, 30 for DGR-6) based on depth and site activities.
Samples were collected from the drill water tank (DWT) to quantify drill water concentrations entering the borehole during drilling.
Table 1 summarizes the total number of samples collected and analysed for different GSCP analytical parameter groups.
Samples collected for Na Fluorescein analyses were collected as well-mixed grab samples in 125 mL high density polyethylene (HDPE) containers that were protected from heat and light and stored in refrigerators. Although the drill water return was mechanically cleaned by passage through a shale shaker and silt/sand separation unit, some suspended particulate was present in water returned to the drill water return tank(s). The collected samples for Na Fluorescein analyses were allowed to settle for a reasonable period of time (i.e. up to 3 or 4 hours) to remove suspended fine particulate.

Technical Report: Drilling Fluid Management and Testing in DGR-5 and DGR-6 Revision 0 Doc ID: TR-09-02
April 1, 2011 6
Table 1 Summary of Analyses of Drilling Fluids – DGR-5 and DGR-6
GSCP Group and Analytes
Total No. of Samples Collected
Total No. of Samples Analysed
Distribution of Analysed Samples
Group E (Drill Water Tracers [Na Fluorescein
and Conductivity])
407 396 152 for DGR-5; 255 for DGR-6
Group E (Drill Water Tracers [Tritium])
88 65 35 for DGR-5; 30 for DGR-6
Group A (Master Variables and Major Ions, including field pH, Conductivity and
Temperature)
17 17 8 for DGR-5; 9 for DGR-6
Group B (Trace Elements and Environmental Isotopes [18O, 2H])
17 17 8 for DGR-5; 9 for DGR-6
Although TP-08-21 called for dilution to yield a 10:1 diluted, 20 mL sample for Na Fluorescein determination only if the sample did not clear, a 20 mL sample was created for ease of sample handling and filtration for all samples. Consequently 20 mL of sample was filtered with a 0.45 μm filter using a syringe. A 2 mL sample of the settled or filtered drilling fluid was collected with a 1-5 mL pipettor and was mixed with 18 mL of deionized water, which was collected with a 2-10 mL pipettor, to generate a 20 mL water sample for analysis of Na Fluorescein content.
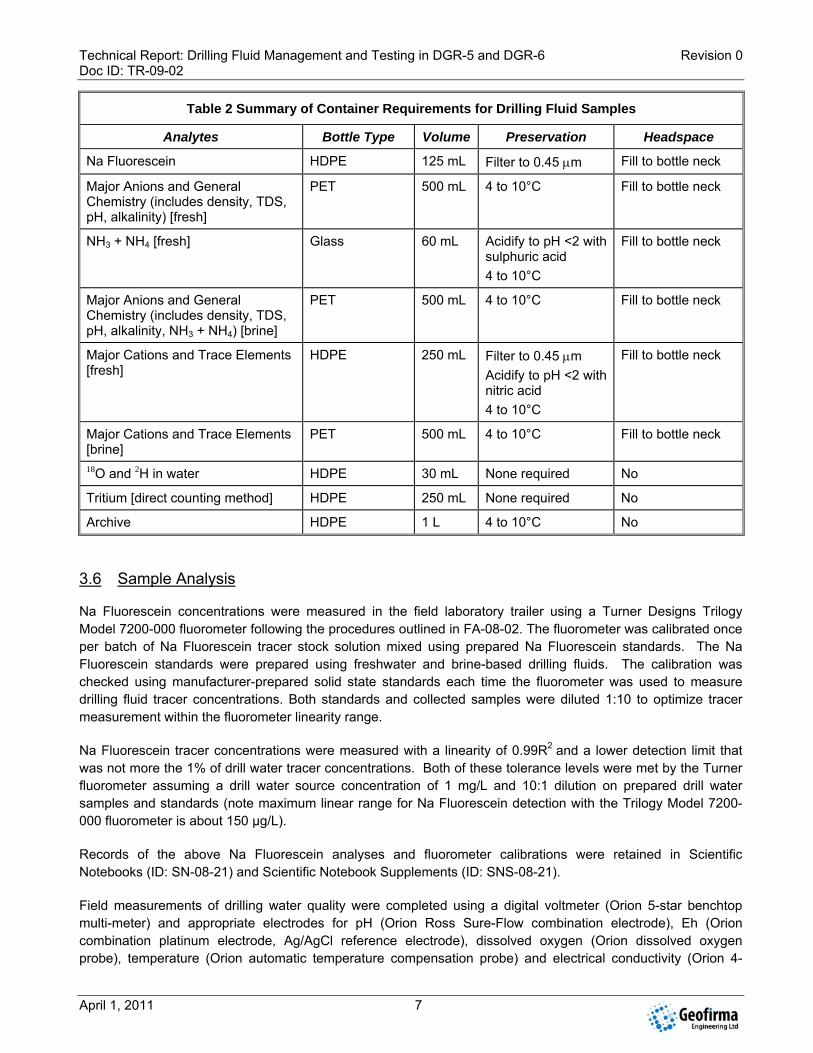
Samples of drilling water were collected for specific analytical tests in high density polyethylene (HDPE) bottles. Some samples were shipped to laboratories for analysis, while others were retained for later on-site tests or for archiving. Table 2 summarizes the drilling water sample container requirements for all analytical parameters that are listed in Table 1.
Drilling water tracer samples collected from the drill-water tank (DWT) were identified by DWT-XXXX-YYY where XXXX is the borehole identifier and YYY is the index number of the sample. All drill water samples required the time and date of sampling to be recorded on the sample label, as well as the name of the person who collected the sample.
Records of the above drilling fluid sample collection were retained by Geofirma in Scientific Notebooks (ID: SN-08-21) and Scientific Notebook Supplements (ID: SNS-08-21).
Samples were kept in the field lab refrigerator or in the refrigerators in the Core Storage Facility, at approximately 4°C until analysis or shipment to laboratories. Archived water samples were stored in the Core Storage Facility refrigerators.
Technical Report: Drilling Fluid Management and Testing in DGR-5 and DGR-6 Revision 0 Doc ID: TR-09-02
April 1, 2011 7
Table 2 Summary of Container Requirements for Drilling Fluid Samples
Analytes Bottle Type Volume Preservation Headspace
Na Fluorescein HDPE 125 mL Filter to 0.45 μm Fill to bottle neck
Major Anions and General Chemistry (includes density, TDS, pH, alkalinity) [fresh]
PET 500 mL 4 to 10°C Fill to bottle neck
NH3 + NH4 [fresh] Glass 60 mL Acidify to pH <2 with sulphuric acid 4 to 10°C
Fill to bottle neck
Major Anions and General Chemistry (includes density, TDS, pH, alkalinity, NH3 + NH4) [brine]
PET 500 mL 4 to 10°C Fill to bottle neck
Major Cations and Trace Elements [fresh]
HDPE 250 mL Filter to 0.45 μm Acidify to pH <2 with nitric acid 4 to 10°C
Fill to bottle neck
Major Cations and Trace Elements [brine]
PET 500 mL 4 to 10°C Fill to bottle neck
18O and 2H in water HDPE 30 mL None required No
Tritium [direct counting method] HDPE 250 mL None required No
Archive HDPE 1 L 4 to 10°C No
3.6 Sample Analysis
Na Fluorescein concentrations were measured in the field laboratory trailer using a Turner Designs Trilogy Model 7200-000 fluorometer following the procedures outlined in FA-08-02. The fluorometer was calibrated once per batch of Na Fluorescein tracer stock solution mixed using prepared Na Fluorescein standards. The Na Fluorescein standards were prepared using freshwater and brine-based drilling fluids. The calibration was checked using manufacturer-prepared solid state standards each time the fluorometer was used to measure drilling fluid tracer concentrations. Both standards and collected samples were diluted 1:10 to optimize tracer measurement within the fluorometer linearity range.
Na Fluorescein tracer concentrations were measured with a linearity of 0.99R2 and a lower detection limit that was not more the 1% of drill water tracer concentrations. Both of these tolerance levels were met by the Turner fluorometer assuming a drill water source concentration of 1 mg/L and 10:1 dilution on prepared drill water samples and standards (note maximum linear range for Na Fluorescein detection with the Trilogy Model 7200-000 fluorometer is about 150 μg/L).
Records of the above Na Fluorescein analyses and fluorometer calibrations were retained in Scientific Notebooks (ID: SN-08-21) and Scientific Notebook Supplements (ID: SNS-08-21).
Field measurements of drilling water quality were completed using a digital voltmeter (Orion 5-star benchtop multi-meter) and appropriate electrodes for pH (Orion Ross Sure-Flow combination electrode), Eh (Orion combination platinum electrode, Ag/AgCl reference electrode), dissolved oxygen (Orion dissolved oxygen probe), temperature (Orion automatic temperature compensation probe) and electrical conductivity (Orion 4-

Technical Report: Drilling Fluid Management and Testing in DGR-5 and DGR-6 Revision 0 Doc ID: TR-09-02
April 1, 2011 8
electrode conductivity cell) measurements.
Electrical conductivity analysis was performed following the methods outlined in FA-08-03. Field measurements for pH, Eh and dissolved oxygen were carried out according to the methods outlined in FA-08-04, FA-08-06 and FA-08-05 respectively.
Records of the above field measured parameters and digital voltmeter calibrations were retained in Scientific Notebooks (ID: SN-08-21) and Scientific Notebook Supplements (ID: SNS-08-21).
Tritium analyses were completed by the Environmental Isotope Laboratory, University of Waterloo in Waterloo, Ontario. General Chemistry, Major Anions, Major Cations and Trace Elements analyses were completed by SGS Lakefield Research Limited in Lakefield, Ontario. 18O and 2H analyses were completed by the GG Hatch Isotope Laboratory, University of Ottawa in Ottawa, Ontario. Note that the Horita et al. (1993) correction for elevated solution salinity was not applied to the 18O and 2H results for samples collected from brine-based drilling fluids. Methods of laboratory analysis are described in TP-07-08 and TP-08-13 (Intera Engineering Ltd., 2008c; 2008d).
4 Results and Conclusions
4.1 Field Physical Property Measurements
Tabular results of the physical property measurements of the drilling fluids, including fluid density and funnel viscosity, for DGR-5 and DGR-6 are provided as Tables A.1 and A.2, respectively, in Appendix A. Graphical results of the physical property measurements of the drilling fluids, including plots of fluid density and funnel viscosity versus drilling depth, for DGR-5 and DGR-6 are provided as Figures C.1 and C.4, respectively, in Appendix C.
Field measurements of drilling fluid density for both DGR-5 and DGR-6 ranged from 1,000 to 1,135 kg/m3. For DGR-5, density measurements of the fresh water drilling fluid were not collected. The density of the brine drilling fluid in DGR-5 ranged from 1,000 to 1,115 kg/m3 with an average value of 1,098 kg/m3. For DGR-6, the density of the fresh water drilling fluid ranged from 1,000 to 1,060 kg/m3 with an average value of 1,007 kg/m3. The density of the deeper brine drilling fluid in DGR-6 ranged from 1,000 to 1,135 kg/m3 with an average value of 1,096 kg/m3.
The funnel viscosity in DGR-5 was constant at 29 sec/qt. For DGR-6, the funnel viscosity of the fresh water drilling fluid ranged from 29 to 41 sec/qt with an average value of 36 sec/qt. The funnel viscosity of the deeper brine drilling fluid in DGR-6 ranged from 29 to 41 sec/qt with an average value of 29 sec/qt. The funnel viscosity of fresh water at 20°C is 26 sec/qt or 0.001 Pascal-seconds.
4.2 Field Chemical Property Measurements
Tabular results of the field chemical property measurements of the drilling fluids, including Na Fluorescein and electrical conductivity, for DGR-5 and DGR-6 are provided as Tables B.1 and B.4, respectively, in Appendix B. Graphical results of the field measurements of the drilling fluids, including plots of Na Fluorescein and electrical conductivity versus depth, for DGR-5 and DGR-6 are provided as Figures C.2 and C.3 and Figures C.5 and C.6, respectively, in Appendix C.
Na Fluorescein concentrations in DGR-5 ranged from 263.9 to 1609.2 µg/L, with an average concentration of 838.6 µg/L. Na Fluorescein concentrations in DGR-6 ranged from 2.9 to 13776.3 µg/L, with an average concentration of 994.0 µg/L.

Technical Report: Drilling Fluid Management and Testing in DGR-5 and DGR-6 Revision 0 Doc ID: TR-09-02
April 1, 2011 9
Electrical conductivity measurements in the shallow (less than approximately 207 mLBGS) section of DGR-5 ranged from 212.8 to 2071 µS/cm, with an average concentration of 569.7 µS/cm. Electrical conductivity measurements in the deeper (greater than approximately 207 mLBGS) section of DGR-5 ranged from 19.2 to 207.3 mS/cm, with an average concentration of 184.2 mS/cm. Electrical conductivity measurements in the shallow (less than approximately 215 mLBGS) section of DGR-6 ranged from 220.0 to 2582 µS/cm, with an average concentration of 863.9 µS/cm. Electrical conductivity measurements in the deeper (greater than approximately 215 mLBGS) section of DGR-6 ranged from 2050 µS/cm to 239.3 mS/cm, with an average concentration of 188.2 mS/cm.
4.3 Laboratory Analyses
Tabular results of the laboratory analyses of the drilling fluids, including tritium and other environmental isotopes, major anions and cations, trace elements and general chemistry parameters, for DGR-5 and DGR-6 are provided as Tables B.2 and B.5, respectively, in Appendix B. Graphical results of the laboratory analyses of the drilling fluids, including plots of tritium versus depth, for DGR-5 and DGR-6 are provided as Figures C.3 and C.5, respectively, in Appendix C. Tabular results of the tritium analysis for DGR-5 and DGR-6 are provided as Tables B.3 and B.6, respectively, in Appendix B.
Some of the reported drilling fluid densities for fresh water determined from laboratory testing shown in Tables B.2 and B.2 are less than the field measurements of 1000 kg/m3 given in Tables A.1 and A.2. These minor differences are due to analytical uncertainty in the laboratory analyses which are determined gravimetrically from smaller samples volumes submitted to the lab.
Tritium concentrations in DGR-5 ranged from 61.7 to 948.9 TU, with an average concentration of 585.8 TU. Tritium concentrations in DGR-6 ranged from 84.1 to 1723.0 TU, with an average concentration of 687.0 TU.
5 Data Quality and Use
The data presented in this Technical Report describe the physical and chemical properties of drilling fluids used to complete boreholes DGR-5 and DGR-6. The physical data, in particular the fluid density data, are suitable for estimation of downhole formation pressures during drilling and in reconstruction of borehole pressure histories to aid in analysis and interpretation of borehole straddle-packer hydraulic tests. The chemical data are suitable for estimation of drilling fluid contamination in subsequent groundwater and potentially in porewater samples collected for laboratory analyses and chemical/isotopic characterization.
There are no identifiable limitations on the use of the data presented in this Technical Report.
6 References
Horita, J., D.J. Wesolowksi, and D.R. Cole, 1993. The activity composition relationship of oxygen and hydrogen isotopes in aqueous salt solutions: I. Vapour-liquid water equilibration of single salt solution from 50 to 100°C. Geochimica et Cosmochimica Acta, Vol. 57, pp 2797-2817.
Geofirma Engineering Ltd., 2011. Technical Report: Drilling, Logging and Sampling of DGR-5 and DGR-6, TR-09-01, Revision 0, in preparation, Ottawa.
Intera Engineering Ltd., 2010a. Project Quality Plan, DGR Site Characterization, Revision 5, December 6, Ottawa.
Intera Engineering Ltd., 2010b. Technical Report: Opportunistic Groundwater Sampling in DGR-1 and DGR-2, TR-07-11, Revision 2, May 19, Ottawa.

Technical Report: Drilling Fluid Management and Testing in DGR-5 and DGR-6 Revision 0 Doc ID: TR-09-02
April 1, 2011 10
Intera Engineering Ltd., 2010c. Technical Report: Pore Water and Gas Analyses in DGR-1 and DGR-2 Core, TR-07-21, Revision 1, May 20, Ottawa.
Intera Engineering Ltd., 2010d. Technical Report: Pore Water and Gas Analyses in DGR-3 and DGR-4 Core, TR-08-19, Revision 0, June 3, Ottawa.
Intera Engineering Ltd., 2010e. Technical Report: Opportunistic Groundwater Sampling in DGR-3 and DGR-4, TR-08-18, Revision 1, June 18, Ottawa.
Intera Engineering Ltd., 2009a. Test Plan for DGR-5 and DGR-6 Drilling Fluid Management, TP-08-21, Revision 1, April 9, Ottawa.
Intera Engineering Ltd., 2009b. Technical Report: Borehole DGR-2: Pore-Water Investigations, TR-08-06, Revision 0, August 4, Ottawa.
Intera Engineering Ltd., 2008a. Phase 2 Geoscientific Site Characterization Plan, OPG’s Deep Geologic Repository for Low and Intermediate Level Waste, Report INTERA 06-219.50-Phase 2 GSCP-R0, OPG 00216-PLAN-03902-00002-R00, April, Ottawa.
Intera Engineering Ltd., 2008b. Test Plan for DGR-3 and DGR-4 Drilling Fluid Management, TP-08-02, Revision 3, August 5, Ottawa.
Intera Engineering Ltd., 2008c: Test Plan for Phase 1 Lab Testing: Analysis of Opportunistic and Westbay Samples of Groundwater, TP-07-08, Revision 2, July 25, Ottawa.
Intera Engineering Ltd., 2008d. Test Plan for Phase 2 Lab Testing of Opportunistic and Westbay Samples of Groundwater, TP-08-13, Revision 1, July 25, Ottawa.
Intera Engineering Ltd., 2007. Test Plan for DGR-1 & DGR-2 Drilling Fluid Management, TP-06-08, Revision 1, February 7, Ottawa.
Intera Engineering Ltd., 2006. Geoscientific Site Characterization Plan, OPG’s Deep Geologic Repository for Low and Intermediate Level Waste, Report INTERA 05-220-1, OPG 00216-REP-03902-00002-R00, April, Ottawa.
Lee, D., T. Kotzer and K. King, 1995. Preliminary assessment of low- and intermediate-level waste disposal in the Michigan Basin: isotopic and geochemical measurements. AECL Chalk River Laboratories, Chalk River, Ontario, COG-95-248-I.
McNutt, R. H., S. K. Frape and P. Dollar, 1987. A strontium, oxygen and hydrogen isotopic composition of brines, Michigan and Appalachian Basins, Ontario and Michigan, Appl. Geochem., Vol. 2, pp 495-505.
APPENDIX A
Summary of Field Physical Property Measurements of DGR-5 and DGR-6 Drilling Fluids
Table A.1 – Summary of Field Physical Property Measurements of DGR-5 Drilling Fluids
Table A.2 – Summary of Field Physical Property Measurements for DGR-6 Drilling Fluids

Table A.1 - Summary of Field Physical Property Measurements of DGR-5 Drilling Fluids
Date Depth (mLBGS)
Density (kg/m3)
Funnel Viscosity (sec/qt)
Date Depth (mLBGS)
Density (kg/m3)
Funnel Viscosity (sec/qt)
2-Sep-09 207.92 1,000 29 17-Sep-09 364.01 1,100 292-Sep-09 207.92 1,000 29 17-Sep-09 370.11 1,100 292-Sep-09 207.92 1,000 29 18-Sep-09 370.11 1,100 298-Sep-09 207.92 1,040 -- 18-Sep-09 370.11 1,100 298-Sep-09 207.92 1,060 -- 18-Sep-09 370.11 1,100 299-Sep-09 210.58 1,080 -- 18-Sep-09 373.16 1,100 299-Sep-09 213.63 1,090 -- 18-Sep-09 376.21 1,100 299-Sep-09 219.73 1,095 29 19-Sep-09 376.21 1,100 299-Sep-09 219.73 1,100 29 19-Sep-09 379.26 1,100 299-Sep-09 219.73 -- 29 19-Sep-09 382.31 1,110 299-Sep-09 222.78 1,100 29 19-Sep-09 388.41 1,110 --
10-Sep-09 228.88 1,100 29 19-Sep-09 389.21 1,100 2910-Sep-09 231.93 1,100 29 20-Sep-09 389.21 1,100 2910-Sep-09 234.98 1,100 29 20-Sep-09 389.21 1,100 2910-Sep-09 238.03 1,100 29 20-Sep-09 389.21 1,100 2910-Sep-09 244.13 1,100 29 21-Sep-09 389.21 1,100 2910-Sep-09 247.18 1,100 29 21-Sep-09 389.21 1,100 2911-Sep-09 253.28 1,100 29 24-Sep-09 389.21 1,100 2911-Sep-09 259.38 1,100 29 24-Sep-09 394.82 1,109 2911-Sep-09 268.53 1,100 29 24-Sep-09 397.87 1,110 2912-Sep-09 268.53 1,100 29 24-Sep-09 400.92 1,100 2912-Sep-09 271.58 1,100 29 25-Sep-09 403.97 1,100 2912-Sep-09 275.56 1,100 29 25-Sep-09 407.02 1,100 2912-Sep-09 287.76 1,100 29 25-Sep-09 413.12 1,100 2912-Sep-09 290.81 1,100 29 25-Sep-09 416.17 1,115 2913-Sep-09 293.86 1,100 29 25-Sep-09 419.22 1,100 2913-Sep-09 303.01 1,100 29 25-Sep-09 419.22 1,100 2913-Sep-09 306.06 1,100 29 26-Sep-09 422.27 1,100 2913-Sep-09 315.21 1,100 29 26-Sep-09 425.32 1,100 2913-Sep-09 315.21 1,100 29 26-Sep-09 428.37 1,100 2913-Sep-09 315.21 1,100 29 26-Sep-09 431.42 1,100 2914-Sep-09 318.26 1,100 29 26-Sep-09 434.47 1,100 2914-Sep-09 321.31 1,100 29 26-Sep-09 434.47 1,100 2914-Sep-09 324.36 1,100 29 27-Sep-09 437.52 1,100 2914-Sep-09 327.41 1,100 29 27-Sep-09 443.62 1,100 2914-Sep-09 330.46 1,100 29 27-Sep-09 446.67 1,100 2914-Sep-09 330.46 1,100 29 27-Sep-09 449.72 1,100 2915-Sep-09 333.51 1,100 29 27-Sep-09 455.37 1,100 2915-Sep-09 339.61 1,100 29 28-Sep-09 455.37 1,100 2915-Sep-09 339.61 1,100 29 28-Sep-09 455.37 1,100 2915-Sep-09 342.66 1,100 29 29-Sep-09 455.82 1,080 --15-Sep-09 345.71 1,100 29 29-Sep-09 455.82 1,085 2915-Sep-09 348.76 1,100 29 30-Sep-09 455.82 1,100 2916-Sep-09 351.81 1,100 29 30-Sep-09 455.82 1,100 2916-Sep-09 357.91 1,100 29 2-Oct-09 458.87 1,100 2916-Sep-09 360.96 1,110 29 3-Oct-09 458.87 1,100 2916-Sep-09 364.01 1,100 29 3-Oct-09 458.87 1,100 2916-Sep-09 364.01 1,110 29 5-Oct-09 458.87 1,100 2916-Sep-09 364.01 1,100 29 6-Oct-09 458.87 1,100 2917-Sep-09 364.01 1,100 29 6-Oct-09 465.50 1,100 2917-Sep-09 364.01 1,100 29 6-Oct-09 465.50 1,100 29
Prepared by: KERReviewed by: EKS/SNGDate: 30-Mar-11TR-09-02_Drilling Fluid Physical Properties Summary_R0.xls Page 1 of 2

Table A.1 - Summary of Field Physical Property Measurements of DGR-5 Drilling Fluids
Date Depth (mLBGS)
Density (kg/m3)
Funnel Viscosity (sec/qt)
Date Depth (mLBGS)
Density (kg/m3)
Funnel Viscosity (sec/qt)
6-Oct-09 471.60 1,100 29 20-Oct-09 639.73 1,100 297-Oct-09 471.60 1,100 29 21-Oct-09 639.73 1,100 297-Oct-09 477.70 1,100 29 21-Oct-09 642.45 1,100 297-Oct-09 480.75 1,100 29 21-Oct-09 645.50 1,100 297-Oct-09 486.85 1,100 29 21-Oct-09 648.55 1,100 297-Oct-09 492.95 1,100 29 21-Oct-09 654.65 1,100 297-Oct-09 492.95 1,100 29 22-Oct-09 660.75 1,100 298-Oct-09 496.00 1,100 29 22-Oct-09 666.85 1,100 298-Oct-09 502.10 1,100 29 22-Oct-09 666.85 1,100 298-Oct-09 502.10 1,100 29 22-Oct-09 676.00 1,100 299-Oct-09 502.10 1,100 29 23-Oct-09 682.10 1,100 299-Oct-09 502.10 1,100 29 23-Oct-09 688.20 1,100 29
13-Oct-09 502.10 1,100 29 23-Oct-09 691.25 1,100 2913-Oct-09 511.25 1,100 29 23-Oct-09 694.30 1,100 2914-Oct-09 514.30 1,100 29 23-Oct-09 700.40 1,100 2914-Oct-09 523.45 1,100 29 23-Oct-09 703.45 1,100 2914-Oct-09 529.55 1,100 29 24-Oct-09 706.50 1,100 2914-Oct-09 529.55 1,100 29 24-Oct-09 709.55 1,100 2915-Oct-09 529.55 1,100 29 24-Oct-09 709.55 1,100 2915-Oct-09 529.55 1,100 29 24-Oct-09 715.65 1,100 2915-Oct-09 532.65 1,100 29 24-Oct-09 718.70 1,100 2915-Oct-09 535.70 1,100 29 25-Oct-09 721.75 1,100 2915-Oct-09 544.85 1,100 29 25-Oct-09 727.85 1,100 2916-Oct-09 547.90 1,100 29 25-Oct-09 727.85 1,100 2916-Oct-09 554.00 1,100 29 25-Oct-09 730.90 1,100 2916-Oct-09 560.10 1,100 29 25-Oct-09 733.95 1,100 2916-Oct-09 569.25 1,100 29 25-Oct-09 737.00 1,100 2917-Oct-09 572.30 1,100 29 26-Oct-09 740.05 1,100 2917-Oct-09 572.30 1,100 29 26-Oct-09 746.15 1,100 2917-Oct-09 575.35 1,100 29 26-Oct-09 749.20 1,100 2917-Oct-09 575.35 1,100 29 26-Oct-09 752.25 1,100 2917-Oct-09 578.40 1,100 29 26-Oct-09 752.25 1,100 2917-Oct-09 581.45 1,100 29 26-Oct-09 755.30 1,100 2918-Oct-09 587.55 1,100 29 27-Oct-09 758.35 1,100 2918-Oct-09 587.55 1,100 29 27-Oct-09 764.45 1,100 2918-Oct-09 587.55 1,100 29 27-Oct-09 764.45 1,090 2918-Oct-09 596.70 1,100 29 27-Oct-09 770.55 1,100 2919-Oct-09 602.80 1,100 29 27-Oct-09 773.60 1,100 2919-Oct-09 608.90 1,100 29 27-Oct-09 776.65 1,100 2919-Oct-09 611.95 1,100 -- 28-Oct-09 779.70 1,100 2919-Oct-09 615.00 1,100 -- 28-Oct-09 782.75 1,100 2919-Oct-09 621.10 1,100 -- 28-Oct-09 785.80 1,100 2919-Oct-09 627.20 1,100 29 28-Oct-09 791.90 1,100 2920-Oct-09 630.25 1,100 29 28-Oct-09 794.95 1,100 2920-Oct-09 636.35 1,100 29 29-Oct-09 801.05 1,100 2920-Oct-09 639.73 1,100 29 29-Oct-09 804.10 1,100 29
Prepared by: KERReviewed by: EKS/SNGDate: 30-Mar-11TR-09-02_Drilling Fluid Physical Properties Summary_R0.xls Page 2 of 2

Table A.2 - Summary of Field Physical Property Measurements of DGR-6 Drilling Fluids
Date Depth (mLBGS)
Density (kg/m3)
Funnel Viscosity (sec/qt)
Date Depth (mLBGS)
Density (kg/m3)
Funnel Viscosity (sec/qt)
28-May-09 34.80 1,000 29 14-Jun-09 101.11 1,020 3428-May-09 34.80 1,000 29 14-Jun-09 101.11 1,020 3428-May-09 34.80 1,000 29 14-Jun-09 101.11 1,020 3429-May-09 34.80 1,000 29 15-Jun-09 105.67 1,000 3029-May-09 34.80 1,000 29 15-Jun-09 105.67 1,000 3129-May-09 34.80 1,000 29 15-Jun-09 105.67 1,000 3230-May-09 36.77 1,000 29 16-Jun-09 109.76 1,000 3330-May-09 36.77 1,000 32 16-Jun-09 109.76 1,000 3330-May-09 36.77 1,000 40 16-Jun-09 109.76 1,000 3431-May-09 36.77 1,000 38 17-Jun-09 115.61 1,000 3231-May-09 36.77 1,000 38 17-Jun-09 115.61 1,000 3231-May-09 36.77 1,000 38 17-Jun-09 115.61 1,000 321-Jun-09 40.23 1,000 38 18-Jun-09 117.13 1,005 341-Jun-09 40.23 1,000 38 18-Jun-09 117.13 1,005 361-Jun-09 40.23 1,000 38 18-Jun-09 117.13 1,005 352-Jun-09 41.41 1,000 38 18-Jun-09 130.43 1,005 352-Jun-09 41.41 1,000 38 19-Jun-09 130.43 1,010 382-Jun-09 41.41 1,000 38 19-Jun-09 130.43 1,010 373-Jun-09 42.91 1,000 38 19-Jun-09 145.00 1,010 363-Jun-09 42.91 1,000 38 20-Jun-09 145.00 1,010 343-Jun-09 42.91 1,000 38 20-Jun-09 145.00 1,010 344-Jun-09 45.61 1,000 38 20-Jun-09 170.00 1,015 364-Jun-09 45.61 1,000 38 21-Jun-09 170.00 1,015 364-Jun-09 45.61 1,000 38 21-Jun-09 170.00 1,020 355-Jun-09 50.05 1,000 38 21-Jun-09 179.80 1,020 345-Jun-09 50.05 1,000 36 22-Jun-09 179.80 1,020 365-Jun-09 50.05 1,000 34 22-Jun-09 179.80 1,020 386-Jun-09 56.15 1,000 34 22-Jun-09 200.50 1,030 406-Jun-09 56.15 1,000 37 23-Jun-09 200.50 1,030 386-Jun-09 56.15 1,000 40 23-Jun-09 200.50 1,030 377-Jun-09 63.25 1,000 38 23-Jun-09 209.91 1,020 417-Jun-09 63.25 1,000 38 23-Jun-09 209.91 1,020 417-Jun-09 63.25 1,000 38 23-Jun-09 213.11 1,020 418-Jun-09 71.21 1,000 38 24-Jun-09 213.11 1,020 408-Jun-09 71.21 1,000 38 24-Jun-09 213.11 1,020 408-Jun-09 71.21 1,000 38 24-Jun-09 213.11 1,020 389-Jun-09 74.80 1,000 38 25-Jun-09 213.11 1,020 389-Jun-09 74.80 1,000 38 25-Jun-09 213.11 1,020 389-Jun-09 74.80 1,000 36 12-Jul-09 214.81 1,010 --
10-Jun-09 80.90 1,000 36 13-Jul-09 214.81 1,030 --10-Jun-09 80.90 1,000 36 13-Jul-09 214.81 1,060 --10-Jun-09 80.90 1,000 36 13-Jul-09 215.91 1,100 2911-Jun-09 86.01 1,000 36 14-Jul-09 215.91 1,100 2911-Jun-09 86.01 1,000 36 14-Jul-09 215.91 1,100 2911-Jun-09 86.01 1,000 36 14-Jul-09 215.91 1,070 --12-Jun-09 91.61 1,000 36 14-Jul-09 218.65 1,070 --12-Jun-09 91.61 1,000 35 14-Jul-09 221.70 -- --12-Jun-09 91.61 1,000 34 14-Jul-09 224.75 1,070 --13-Jun-09 96.11 1,010 34 15-Jul-09 224.75 1,070 --13-Jun-09 96.11 1,010 34 15-Jul-09 224.75 1,070 --13-Jun-09 96.11 1,010 34 15-Jul-09 224.75 1,080 29
Prepared by: KERReviewed by: EKS/SNGDate: 30-Mar-11TR-09-02_Drilling Fluid Physical Properties Summary_R0.xls Page 1 of 3

Table A.2 - Summary of Field Physical Property Measurements of DGR-6 Drilling Fluids
Date Depth (mLBGS)
Density (kg/m3)
Funnel Viscosity (sec/qt)
Date Depth (mLBGS)
Density (kg/m3)
Funnel Viscosity (sec/qt)
15-Jul-09 225.67 1,080 29 25-Jul-09 369.00 1,100 2915-Jul-09 226.67 1,080 29 25-Jul-09 372.05 1,100 2915-Jul-09 228.72 1,080 29 25-Jul-09 372.05 1,100 2916-Jul-09 231.77 1,080 29 25-Jul-09 372.05 1,100 2916-Jul-09 234.82 1,080 29 25-Jul-09 375.10 1,100 2916-Jul-09 237.87 1,080 -- 26-Jul-09 375.10 1,100 2916-Jul-09 243.97 1,090 -- 26-Jul-09 375.10 1,100 2916-Jul-09 247.02 1,095 29 26-Jul-09 375.83 1,100 2917-Jul-09 250.07 1,095 29 26-Jul-09 376.66 1,100 2917-Jul-09 253.12 1,095 29 26-Jul-09 376.66 1,100 2917-Jul-09 265.32 1,100 -- 27-Jul-09 376.66 1,100 2917-Jul-09 265.32 1,100 29 27-Jul-09 378.15 1,100 2918-Jul-09 268.37 1,100 29 27-Jul-09 378.15 1,100 2918-Jul-09 271.42 1,100 29 27-Jul-09 381.20 1,100 2918-Jul-09 271.42 1,100 29 27-Jul-09 384.25 1,100 2918-Jul-09 274.31 1,100 29 28-Jul-09 387.30 1,100 2918-Jul-09 274.31 1,100 29 28-Jul-09 390.35 1,100 2918-Jul-09 274.31 1,100 29 28-Jul-09 390.35 1,100 2919-Jul-09 277.44 1,100 29 28-Jul-09 393.40 1,100 2919-Jul-09 280.57 1,100 29 28-Jul-09 399.50 1,100 2919-Jul-09 286.67 1,100 29 29-Jul-09 402.55 1,100 2919-Jul-09 292.77 1,100 29 29-Jul-09 408.65 1,100 2919-Jul-09 292.77 1,100 29 29-Jul-09 408.65 1,100 2920-Jul-09 295.82 1,100 29 29-Jul-09 411.70 1,100 2920-Jul-09 301.92 1,100 29 29-Jul-09 414.75 1,100 2920-Jul-09 304.97 1,100 29 29-Jul-09 417.80 1,100 2920-Jul-09 308.02 1,100 29 30-Jul-09 420.85 1,100 2920-Jul-09 314.12 1,100 29 30-Jul-09 423.90 1,100 2920-Jul-09 317.17 1,100 29 30-Jul-09 426.95 1,100 2921-Jul-09 320.22 1,100 29 30-Jul-09 433.05 1,100 2921-Jul-09 326.32 1,100 29 30-Jul-09 433.05 1,100 2921-Jul-09 329.37 1,100 29 30-Jul-09 436.10 1,100 2921-Jul-09 332.42 1,100 29 31-Jul-09 439.15 1,100 2921-Jul-09 335.32 1,100 29 31-Jul-09 439.15 1,100 2921-Jul-09 338.37 1,100 29 5-Aug-09 439.15 1,100 2922-Jul-09 338.37 1,100 29 6-Aug-09 442.20 1,100 2922-Jul-09 340.73 1,100 29 6-Aug-09 445.25 1,100 2922-Jul-09 343.62 1,100 29 6-Aug-09 448.30 1,100 2922-Jul-09 347.67 1,100 29 6-Aug-09 451.35 1,100 2922-Jul-09 347.67 1,100 29 6-Aug-09 454.40 1,100 2923-Jul-09 347.67 1,100 29 7-Aug-09 457.45 1,100 2923-Jul-09 347.67 1,100 29 7-Aug-09 463.55 1,100 2923-Jul-09 350.70 1,100 29 7-Aug-09 469.65 1,060 --23-Jul-09 353.75 1,100 29 7-Aug-09 475.75 1,100 2923-Jul-09 356.30 1,100 29 7-Aug-09 475.75 1,100 2924-Jul-09 357.00 1,100 29 8-Aug-09 475.75 1,100 2924-Jul-09 359.85 1,100 29 8-Aug-09 475.75 1,100 2924-Jul-09 359.85 1,100 29 8-Aug-09 479.73 1,090 --24-Jul-09 362.90 1,100 29 8-Aug-09 485.56 1,100 --24-Jul-09 365.95 1,100 29 8-Aug-09 494.98 1,100 2924-Jul-09 365.95 1,100 29 9-Aug-09 498.03 1,100 29
Prepared by: KERReviewed by: EKS/SNGDate: 30-Mar-11TR-09-02_Drilling Fluid Physical Properties Summary_R0.xls Page 2 of 3

Table A.2 - Summary of Field Physical Property Measurements of DGR-6 Drilling Fluids
Date Depth (mLBGS)
Density (kg/m3)
Funnel Viscosity (sec/qt)
Date Depth (mLBGS)
Density (kg/m3)
Funnel Viscosity (sec/qt)
9-Aug-09 507.18 1,100 29 4-Dec-09 518.70 1112 --9-Aug-09 507.18 1,090 -- 5-Dec-09 551.75 1,110 --9-Aug-09 516.33 1,100 29 7-Dec-09 578.75 1,109 --9-Aug-09 516.33 1,100 29 6-Jan-10 642.16 1,091 --
10-Aug-09 516.33 1,100 29 7-Jan-10 657.16 1,102 --10-Aug-09 516.33 1,100 29 8-Jan-10 669.16 1,099 --22-Nov-09 516.33 1,093 -- 10-Jan-10 672.16 1,101 --24-Nov-09 518.15 1,118 -- 11-Jan-10 690.16 1,107 --27-Nov-09 563.90 1,111 -- 25-Jan-10 516.33 1,135 --30-Nov-09 604.96 1,123 --
Prepared by: KERReviewed by: EKS/SNGDate: 30-Mar-11TR-09-02_Drilling Fluid Physical Properties Summary_R0.xls Page 3 of 3
APPENDIX B
Summary of Field Chemical Property Measurements and Laboratory Analyses of DGR-5 and DGR-6 Drilling Fluids
Table B.1 – Summary of Field Chemical Measurements of DGR-5 Drilling Fluids
Table B.2 – Summary of Laboratory Analyses of DGR-5 Drilling Fluids
Table B.3 – Tritium Analysis of DGR-5 Drilling Fluids
Table B.4 – Summary of Field Chemical Measurements of DGR-6 Drilling Fluids
Table B.5 – Summary of Laboratory Analyses of DGR-6 Drilling Fluids
Table B.6 – Tritium Analysis of DGR-6 Drilling Fluids

Table B.1 - Summary of Field Chemical Measurements of DGR-5 Drilling Fluids
Sample ID Date Collected
Depth (mLBGS)
Na Fluorescein
(µg/L)
Electrical Conductivity
(µS/cm)
DWT-DGR5-001 17-Dec-08 -- -- --DWT-DGR5-002 18-Dec-08 -- -- --DWT-DGR5-003 24-Jan-09 38.49 1027.3 1020DWT-DGR5-004 25-Jan-09 49.51 895.7 894DWT-DGR5-005 25-Jan-09 49.51 935.3 866DWT-DGR5-006 26-Jan-09 56.16 889.8 788DWT-DGR5-007 26-Jan-09 56.16 889.9 608DWT-DGR5-008 27-Jan-09 67.81 879.3 391DWT-DGR5-009 27-Jan-09 67.81 816.7 292.6DWT-DGR5-010 27-Jan-09 67.81 794.2 338DWT-DGR5-011 28-Jan-09 78.64 977.1 299DWT-DGR5-012 28-Jan-09 78.64 740.7 229.1DWT-DGR5-013 29-Jan-09 86.66 896.1 226.8DWT-DGR5-014 29-Jan-09 86.66 781.0 239.1DWT-DGR5-015 30-Jan-09 99.16 606.3 256.5DWT-DGR5-016 30-Jan-09 99.16 648.7 253.4DWT-DGR5-017 31-Jan-09 103.10 601.0 284.5DWT-DGR5-018 31-Jan-09 103.10 534.5 314.7DWT-DGR5-019 1-Feb-09 117.81 337.7 489DWT-DGR5-020 1-Feb-09 117.81 563.1 410DWT-DGR5-021 2-Feb-09 128.96 544.8 377DWT-DGR5-022 3-Feb-09 128.96 580.7 669DWT-DGR5-023 3-Feb-09 128.96 684.1 650DWT-DGR5-024 4-Feb-09 133.15 377.9 463DWT-DGR5-025 4-Feb-09 133.15 1256.4 539DWT-DGR5-026 5-Feb-09 145.35 1327.5 619DWT-DGR5-027 5-Feb-09 145.35 1278.5 604DWT-DGR5-028 6-Feb-09 160.66 952.4 650DWT-DGR5-029 6-Feb-09 160.66 782.5 609DWT-DGR5-030 7-Feb-09 172.66 709.6 565DWT-DGR5-031 7-Feb-09 172.66 -- 212.8DWT-DGR5-032 7-Feb-09 172.66 842.2 666DWT-DGR5-033 8-Feb-09 191.05 940.3 1337DWT-DGR5-034 8-Feb-09 191.05 705.5 2071DWT-DGR5-035 8-Sep-09 207.92 886.1 134300DWT-DGR5-036 9-Sep-09 213.63 862.7 154800DWT-DGR5-037 9-Sep-09 216.68 944.0 165300DWT-DGR5-038 9-Sep-09 225.83 821.4 175100DWT-DGR5-039 10-Sep-09 228.88 -- --DWT-DGR5-040 10-Sep-09 228.88 777.3 176500DWT-DGR5-041 10-Sep-09 234.98 1028.9 176000DWT-DGR5-042 10-Sep-09 241.08 1216.1 173300DWT-DGR5-043 10-Sep-09 250.23 1035.4 177700DWT-DGR5-044 11-Sep-09 259.38 901.3 179100DWT-DGR5-045 11-Sep-09 268.53 667.3 178100DWT-DGR5-046 11-Sep-09 268.53 1481.1 179200
Prepared by: KERReviewed by: SNGDate: 30-Mar-11TR-09-02 Drillling Fluid Lab and Field Results R0.xls Page 1 of 4

Table B.1 - Summary of Field Chemical Measurements of DGR-5 Drilling Fluids
Sample ID Date Collected
Depth (mLBGS)
Na Fluorescein
(µg/L)
Electrical Conductivity
(µS/cm)
DWT-DGR5-047 12-Sep-09 268.53 1043.7 184400DWT-DGR5-048 12-Sep-09 275.56 986.7 184700DWT-DGR5-049 12-Sep-09 284.71 871.6 181600DWT-DGR5-050 13-Sep-09 299.96 804.5 184600DWT-DGR5-051 13-Sep-09 303.01 -- --DWT-DGR5-052 13-Sep-09 309.11 1030.1 185700DWT-DGR5-053 13-Sep-09 315.21 863.7 184300DWT-DGR5-054 13-Sep-09 318.26 1566.5 183300DWT-DGR5-055 14-Sep-09 321.31 804.4 185100DWT-DGR5-056 14-Sep-09 324.36 1064.2 183400DWT-DGR5-057 14-Sep-09 327.41 969.8 191100DWT-DGR5-058 14-Sep-09 333.51 778.3 183900DWT-DGR5-059 15-Sep-09 336.56 1050.3 184500DWT-DGR5-060 15-Sep-09 345.71 713.7 189700DWT-DGR5-061 15-Sep-09 351.81 1098.7 190000DWT-DGR5-062 16-Sep-09 357.91 1029.6 190500DWT-DGR5-063 16-Sep-09 360.96 876.4 196700DWT-DGR5-064 16-Sep-09 364.01 808.4 201000DWT-DGR5-065 17-Sep-09 364.01 543.9 193600DWT-DGR5-066 17-Sep-09 370.11 622.3 191000DWT-DGR5-067 18-Sep-09 370.11 820.9 190300DWT-DGR5-068 18-Sep-09 373.16 455.9 186000DWT-DGR5-068 19-Sep-09 376.21 910.1 193300DWT-DGR5-069 19-Sep-09 385.36 438.7 202200DWT-DGR5-070 19-Sep-09 389.21 575.1 200200DWT-DGR5-071 24-Sep-09 391.77 376.3 176400DWT-DGR5-072 24-Sep-09 397.87 319.0 181200DWT-DGR5-073 24-Sep-09 400.92 1072.4 184100DWT-DGR5-074 25-Sep-09 403.97 942.3 185300DWT-DGR5-075 25-Sep-09 416.17 931.3 179800DWT-DGR5-076 25-Sep-09 416.17 616.4 180000DWT-DGR5-077 25-Sep-09 422.27 742.4 185200DWT-DGR5-078 26-Sep-09 425.32 1441.7 184400DWT-DGR5-079 26-Sep-09 431.42 1350.0 183100DWT-DGR5-080 26-Sep-09 434.47 998.3 184500DWT-DGR5-081 26-Sep-09 437.52 775.6 186500DWT-DGR5-082 27-Sep-09 440.57 1609.2 186400DWT-DGR5-083 27-Sep-09 446.67 1581.9 158900DWT-DGR5-084 27-Sep-09 449.72 1214.0 187000DWT-DGR5-085 30-Sep-09 455.82 592.5 189100DWT-DGR5-086 30-Sep-09 458.87 819.7 185900DWT-DGR5-087 5-Oct-09 458.87 299.7 170000DWT-DGR5-088 5-Oct-09 458.87 427.0 181400DWT-DGR5-089 6-Oct-09 468.55 281.8 185800DWT-DGR5-090 6-Oct-09 468.55 294.1 182900DWT-DGR5-091 6-Oct-09 417.60 594.5 180600
Prepared by: KERReviewed by: SNGDate: 30-Mar-11TR-09-02 Drillling Fluid Lab and Field Results R0.xls Page 2 of 4
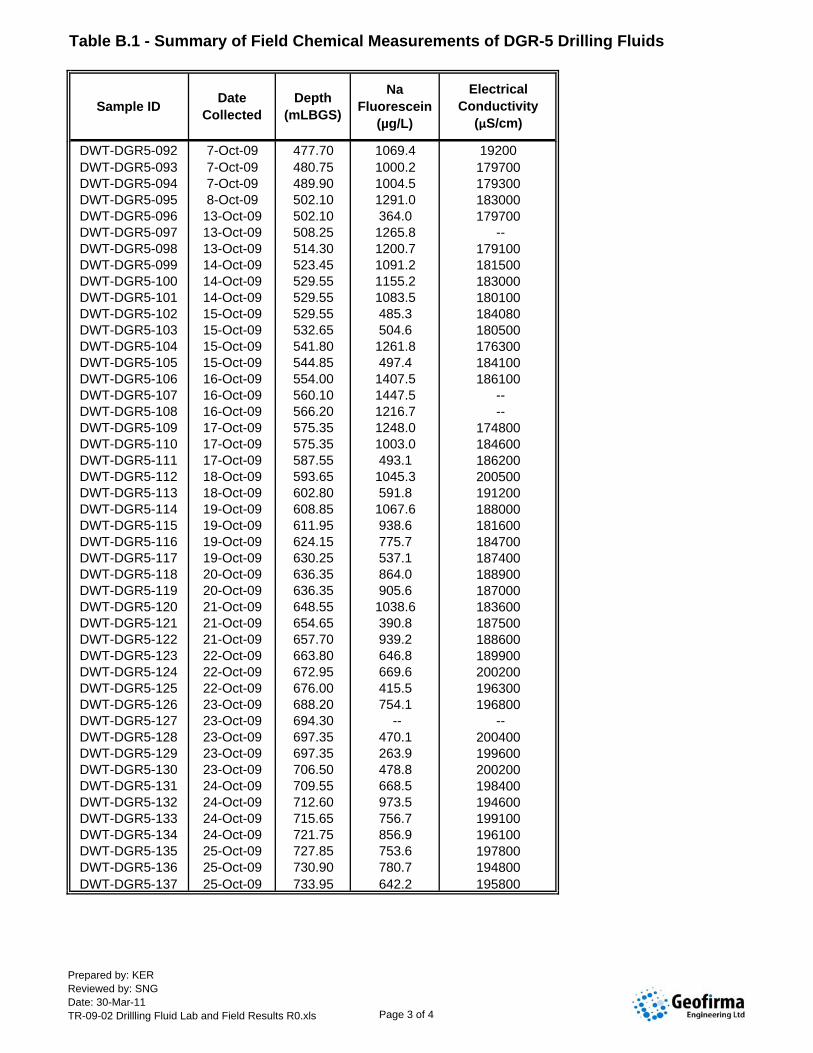
Table B.1 - Summary of Field Chemical Measurements of DGR-5 Drilling Fluids
Sample ID Date Collected
Depth (mLBGS)
Na Fluorescein
(µg/L)
Electrical Conductivity
(µS/cm)
DWT-DGR5-092 7-Oct-09 477.70 1069.4 19200DWT-DGR5-093 7-Oct-09 480.75 1000.2 179700DWT-DGR5-094 7-Oct-09 489.90 1004.5 179300DWT-DGR5-095 8-Oct-09 502.10 1291.0 183000DWT-DGR5-096 13-Oct-09 502.10 364.0 179700DWT-DGR5-097 13-Oct-09 508.25 1265.8 --DWT-DGR5-098 13-Oct-09 514.30 1200.7 179100DWT-DGR5-099 14-Oct-09 523.45 1091.2 181500DWT-DGR5-100 14-Oct-09 529.55 1155.2 183000DWT-DGR5-101 14-Oct-09 529.55 1083.5 180100DWT-DGR5-102 15-Oct-09 529.55 485.3 184080DWT-DGR5-103 15-Oct-09 532.65 504.6 180500DWT-DGR5-104 15-Oct-09 541.80 1261.8 176300DWT-DGR5-105 15-Oct-09 544.85 497.4 184100DWT-DGR5-106 16-Oct-09 554.00 1407.5 186100DWT-DGR5-107 16-Oct-09 560.10 1447.5 --DWT-DGR5-108 16-Oct-09 566.20 1216.7 --DWT-DGR5-109 17-Oct-09 575.35 1248.0 174800DWT-DGR5-110 17-Oct-09 575.35 1003.0 184600DWT-DGR5-111 17-Oct-09 587.55 493.1 186200DWT-DGR5-112 18-Oct-09 593.65 1045.3 200500DWT-DGR5-113 18-Oct-09 602.80 591.8 191200DWT-DGR5-114 19-Oct-09 608.85 1067.6 188000DWT-DGR5-115 19-Oct-09 611.95 938.6 181600DWT-DGR5-116 19-Oct-09 624.15 775.7 184700DWT-DGR5-117 19-Oct-09 630.25 537.1 187400DWT-DGR5-118 20-Oct-09 636.35 864.0 188900DWT-DGR5-119 20-Oct-09 636.35 905.6 187000DWT-DGR5-120 21-Oct-09 648.55 1038.6 183600DWT-DGR5-121 21-Oct-09 654.65 390.8 187500DWT-DGR5-122 21-Oct-09 657.70 939.2 188600DWT-DGR5-123 22-Oct-09 663.80 646.8 189900DWT-DGR5-124 22-Oct-09 672.95 669.6 200200DWT-DGR5-125 22-Oct-09 676.00 415.5 196300DWT-DGR5-126 23-Oct-09 688.20 754.1 196800DWT-DGR5-127 23-Oct-09 694.30 -- --DWT-DGR5-128 23-Oct-09 697.35 470.1 200400DWT-DGR5-129 23-Oct-09 697.35 263.9 199600DWT-DGR5-130 23-Oct-09 706.50 478.8 200200DWT-DGR5-131 24-Oct-09 709.55 668.5 198400DWT-DGR5-132 24-Oct-09 712.60 973.5 194600DWT-DGR5-133 24-Oct-09 715.65 756.7 199100DWT-DGR5-134 24-Oct-09 721.75 856.9 196100DWT-DGR5-135 25-Oct-09 727.85 753.6 197800DWT-DGR5-136 25-Oct-09 730.90 780.7 194800DWT-DGR5-137 25-Oct-09 733.95 642.2 195800
Prepared by: KERReviewed by: SNGDate: 30-Mar-11TR-09-02 Drillling Fluid Lab and Field Results R0.xls Page 3 of 4

Table B.1 - Summary of Field Chemical Measurements of DGR-5 Drilling Fluids
Sample ID Date Collected
Depth (mLBGS)
Na Fluorescein
(µg/L)
Electrical Conductivity
(µS/cm)
DWT-DGR5-138 25-Oct-09 740.05 1081.4 195700DWT-DGR5-139 26-Oct-09 746.15 793.4 197400DWT-DGR5-140 26-Oct-09 746.15 397.6 207300DWT-DGR5-141 26-Oct-09 752.25 -- --DWT-DGR5-142 26-Oct-09 752.25 734.8 207200DWT-DGR5-143 26-Oct-09 755.30 635.2 194400DWT-DGR5-144 27-Oct-09 761.40 846.3 198600DWT-DGR5-145 27-Oct-09 767.50 707.3 193400DWT-DGR5-146 27-Oct-09 770.55 1047.3 195500DWT-DGR5-147 27-Oct-09 773.60 627.9 195300DWT-DGR5-148 28-Oct-09 782.75 544.6 198700DWT-DGR5-149 28-Oct-09 788.85 528.0 189000DWT-DGR5-150 28-Oct-09 794.95 615.0 159800DWT-DGR5-151 28-Oct-09 798.00 992.6 158600DWT-DGR5-152 29-Oct-09 804.10 1144.8 165300
Prepared by: KERReviewed by: SNGDate: 30-Mar-11TR-09-02 Drillling Fluid Lab and Field Results R0.xls Page 4 of 4

Table B.2 - Summary of Laboratory Analyses of DGR-5 Drilling Fluids
Parameter Units DW
T-D
GR
5-00
9
DW
T-D
GR
5-03
1
DW
T-D
GR
5-04
8
DW
T-D
GR
5-06
8
DW
T-D
GR
5-09
2
DW
T-D
GR
5-11
0
DW
T-D
GR
5-12
5
DW
T-D
GR
5-14
7
Depth (mLBGS)> 67.81 172.66 275.56 376.21 477.70 575.35 676.00 773.60Date Sampled> 27-Jan-09 7-Feb-09 12-Sep-09 18-Sep-09 7-Oct-09 17-Oct-09 22-Oct-09 27-Oct-09
FIELD PARAMETERSpH pH units -- 7.14 7.95 6.86 6.78 6.82 7.12 7.48Eh mV 105.3 587.2 136.5 240.9 233 66.4 74.5 -163.7Dissolved Oxygen mg/L -- 10.15 8.77 13.90 -- 8.05 7.03 0.66Electrical Conductivity µS/cm 292.6 212.8 184700 186000 179200 184600 196300 195300Temperature ºC 20.5 17.2 14.9 15.0 15.2 13.8 12.7 16.6Na Fluorescein µg/L 816.7 -- 986.7 455.9 1069.4 1003.0 415.5 627.9LAB PARAMETERSGeneral ParametersAlkalinity mg/L CaCO3 37 85 113 101 41 37 26 36Ammonia + Ammonium as N mg/L 0.2 <0.1 2.3 3.8 4.0 6.9 10.1 12.2Fluid Density g/L 994 976 1118 1100 1100 1090 1080 1110Hardness mg/L as CaCO3 86 13 41600 42300 40000 41000 41000 41000pH pH units 10.1 8.05 7.71 6.87 6.52 6.80 6.98 6.74Total Dissolved Solids mg/L 300 146 167000 159000 162000 165000 175000 173000CationsCalcium mg/L 31.9 33.3 16300 16400 15600 15900 16100 15800Iron mg/L <0.1 0.1 5.6 1.9 14.6 22.9 7.5 46.7Magnesium mg/L 1.60 12.3 201 366 245 275 239 265Manganese mg/L 0.00271 0.0105 0.713 3.84 3.64 5.22 5.68 5.71Potassium mg/L 7.0 1.1 1120 1100 703 791 845 897Silica mg/L 4.1 1.1 8.4 2.3 22.2 36.9 9.6 74.3Sodium mg/L 19.3 6.1 39900 37600 37400 39700 41000 41600Strontium mg/L 0.930 0.124 108 109 283 286 287 277AnionsBromide mg/L <0.3 <0.3 440 440 440 430 450 440Chloride mg/L 56 9.6 95000 90000 95000 92000 100000 100000Fluoride mg/L 0.49 0.10 0.17 0.18 0.12 0.12 0.12 0.12Iodide mg/L <0.3 <0.3 0.03 0.05 0.04 0.04 0.04 0.04Nitrate as N mg/L 0.34 0.33 <6 <6 <5 <5 <5 <5Phosphorus mg/L <0.1 <0.1 <0.1 <0.1 0.1 0.4 <0.1 0.7Sulphate mg/L 26 17 850 880 850 910 850 900IsotopesTritium, 3H TU 230.1 61.7 784.2 947.5 716.2 761.0 712.2 642.9Deuterium, 2H dD (‰) -58.1 -54.3 -53.3 -49.1 -55.2 -51.7 -54.0 -43.2Oxygen-18, 18O d18O (‰) -7.5 -7.2 -6.4 -5.3 -6.4 -6.6 -6.6 -6.6
Prepared by: KERReviewed by: SMQDate: 30-Mar-11TR-09-02 Drillling Fluid Lab and Field Results R0.xls Page 1 of 2

Table B.2 - Summary of Laboratory Analyses of DGR-5 Drilling Fluids
Parameter Units DW
T-D
GR
5-00
9
DW
T-D
GR
5-03
1
DW
T-D
GR
5-04
8
DW
T-D
GR
5-06
8
DW
T-D
GR
5-09
2
DW
T-D
GR
5-11
0
DW
T-D
GR
5-12
5
DW
T-D
GR
5-14
7
Depth (mLBGS)> 67.81 172.66 275.56 376.21 477.70 575.35 676.00 773.60Date Sampled> 27-Jan-09 7-Feb-09 12-Sep-09 18-Sep-09 7-Oct-09 17-Oct-09 22-Oct-09 27-Oct-09
Selected Trace ElementsAluminum mg/L 0.0640 0.0793 2.20 0.304 1.1 3.3 1.0 4.6Antimony mg/L 0.0017 0.0006 <0.002 <0.002 <0.02 <0.02 <0.02 <0.02Arsenic mg/L 0.0027 0.0003 0.307 0.327 0.68 0.73 0.76 0.73Barium mg/L 0.160 0.0188 0.709 0.688 0.483 0.663 0.762 0.866Beryllium mg/L <0.00002 <0.00002 <0.0002 <0.0002 <0.002 <0.002 <0.002 <0.002Boron mg/L 0.243 0.0141 3.61 3.58 3.91 3.84 3.72 3.14Bismuth mg/L 0.00010 <0.00001 <0.0001 <0.0001 <0.001 <0.001 <0.001 <0.001Cadmium mg/L 0.000099 0.000011 0.00037 0.00070 <0.0003 <0.0003 <0.0003 <0.0003Cesium mg/L 0.0003 <0.0001 0.008 0.007 0.01 0.01 0.02 0.01Chromium mg/L 0.0036 <0.0005 0.032 0.015 <0.05 <0.05 <0.05 0.07Cobalt mg/L 0.000717 0.000103 0.0236 0.0242 0.0722 0.0757 0.0731 0.0755Copper mg/L 0.0061 0.0141 0.108 0.052 0.20 0.28 0.23 0.15Gadolinium mg/L 0.00024 <0.00005 0.0009 <0.0005 <0.005 <0.005 <0.005 <0.005Lead mg/L 0.00036 0.00118 0.0066 0.0023 0.015 0.004 0.006 0.011Lithium mg/L <0.02 <0.02 6.41 6.11 5.12 5.05 5.18 4.93Molybdenum mg/L 0.0950 0.00058 0.0397 0.0089 0.013 0.016 0.015 0.035Nickel mg/L 0.0108 0.0022 0.277 0.307 0.76 0.82 0.77 0.77Rubidium mg/L 0.0109 0.0013 0.902 0.857 0.85 0.82 0.90 0.89Selenium mg/L 0.006 <0.001 0.22 0.26 <0.1 <0.1 <0.1 <0.1Silver mg/L 0.00009 <0.00001 0.0035 0.0002 0.014 0.005 0.001 <0.001Thallium mg/L 0.000255 <0.000002 <0.002 <0.002 <0.02 <0.02 <0.02 <0.02Tin mg/L <0.00001 0.00015 0.0041 <0.0001 0.008 0.004 0.001 0.001Titanium mg/L 0.0017 0.0021 0.098 0.025 0.06 0.16 0.06 0.35Uranium mg/L 0.00872 0.000279 0.00257 0.00271 0.0007 0.0007 0.0005 0.0003Vanadium mg/L 0.00536 0.00037 <0.0003 <0.0003 <0.003 0.011 <0.003 0.015Zinc mg/L 0.017 0.033 0.06 0.20 <0.1 0.7 0.2 0.4
Prepared by: KERReviewed by: SMQDate: 30-Mar-11TR-09-02 Drillling Fluid Lab and Field Results R0.xls Page 2 of 2

Table B.3 - Tritium Analysis of DGR-5 Drilling Fluids
Sample ID Date Collected Depth (mLBGS) Tritium (TU)
DWT-DGR5-002 18-Dec-08 -- 189.1DWT-DGR5-006 26-Jan-09 56.16 216.0DWT-DGR5-009 27-Jan-09 67.81 230.1DWT-DGR5-014 29-Jan-09 86.66 233.3DWT-DGR5-017 31-Jan-09 103.10 215.8DWT-DGR5-021 2-Feb-09 128.96 141.1DWT-DGR5-027 5-Feb-09 145.35 118.2DWT-DGR5-028 6-Feb-09 160.66 125.8DWT-DGR5-031 7-Feb-09 172.66 61.7DWT-DGR5-033 8-Feb-09 191.05 309.3DWT-DGR5-035 8-Sep-09 207.92 485.4DWT-DGR5-039 10-Sep-09 228.88 545.3DWT-DGR5-043 10-Sep-09 250.23 742.1DWT-DGR5-048 12-Sep-09 275.56 784.2DWT-DGR5-051 13-Sep-09 303.01 750.3DWT-DGR5-057 14-Sep-09 327.41 812.3DWT-DGR5-061 15-Sep-09 351.81 821.1DWT-DGR5-068 18-Sep-09 373.16 947.5DWT-DGR5-073 24-Sep-09 400.92 942.1DWT-DGR5-078 26-Sep-09 425.32 948.9DWT-DGR5-084 27-Sep-09 449.72 876.1DWT-DGR5-092 7-Oct-09 477.70 716.2DWT-DGR5-095 8-Oct-09 502.10 727.3DWT-DGR5-100 14-Oct-09 529.55 775.8DWT-DGR5-106 16-Oct-09 554.00 787.6DWT-DGR5-110 17-Oct-09 575.35 761.0DWT-DGR5-113 18-Oct-09 602.80 733.6DWT-DGR5-117 19-Oct-09 630.25 678.2DWT-DGR5-122 21-Oct-09 657.70 713.7DWT-DGR5-125 22-Oct-09 676.00 712.2DWT-DGR5-128 23-Oct-09 697.35 700.8DWT-DGR5-135 25-Oct-09 727.85 697.2DWT-DGR5-141 26-Oct-09 752.25 691.0DWT-DGR5-147 27-Oct-09 773.60 642.9DWT-DGR5-152 29-Oct-09 804.10 671.1
Prepared by: KERReviewed by: SMQDate: 30-Mar-11TR-09-02 Drillling Fluid Lab and Field Results R0.xls Page 1 of 1

Table B.4 - Summary of Field Chemical Measurements of DGR-6 Drilling Fluids
Sample ID Date Collected
Depth (mLBGS)
Na Fluorescein
(µg/L)
Electrical Conductivity
(µS/cm)
DWT-DGR6-001 31-May-09 36.77 1045.0 671DWT-DGR6-002 31-May-09 36.77 956.5 744DWT-DGR6-003 01-Jun-09 40.23 716.5 700DWT-DGR6-004 01-Jun-09 40.23 1164.1 691DWT-DGR6-005 02-Jun-09 41.41 1016.5 690DWT-DGR6-006 02-Jun-09 41.41 825.1 606DWT-DGR6-007 03-Jun-09 42.91 1476.2 638DWT-DGR6-008 03-Jun-09 42.91 1555.9 629DWT-DGR6-009 04-Jun-09 45.61 1468.4 609DWT-DGR6-010 04-Jun-09 45.61 1496.1 605DWT-DGR6-011 05-Jun-09 50.05 1422.6 494DWT-DGR6-012 05-Jun-09 50.05 1362.2 536DWT-DGR6-013 06-Jun-09 56.15 1167.0 490DWT-DGR6-014 06-Jun-09 56.15 1143.9 741DWT-DGR6-015 07-Jun-09 63.25 850.8 589DWT-DGR6-016 07-Jun-09 63.25 893.4 613DWT-DGR6-017 08-Jun-09 71.21 1072.0 731DWT-DGR6-018 08-Jun-09 71.21 1050.5 759DWT-DGR6-019 08-Jun-09 71.21 -- 220DWT-DGR6-019 09-Jun-09 74.80 987.2 714DWT-DGR6-020 09-Jun-09 74.80 956.7 784DWT-DGR6-021 10-Jun-09 80.90 1007.5 791DWT-DGR6-022 10-Jun-09 80.90 1152.1 789DWT-DGR6-023 11-Jun-09 86.01 1071.9 773DWT-DGR6-024 11-Jun-09 86.01 1075.4 778DWT-DGR6-025 12-Jun-09 91.61 947.2 755DWT-DGR6-026 12-Jun-09 91.61 940.9 744DWT-DGR6-027 13-Jun-09 96.11 903.9 756DWT-DGR6-028 13-Jun-09 96.11 857.5 736DWT-DGR6-029 14-Jun-09 101.11 1098.7 743DWT-DGR6-030 14-Jun-09 101.11 1076.3 716DWT-DGR6-031 15-Jun-09 105.67 705.6 461DWT-DGR6-032 16-Jun-09 109.76 1067.9 539DWT-DGR6-033 16-Jun-09 109.76 1035.0 568DWT-DGR6-034 17-Jun-09 115.61 718.6 622DWT-DGR6-035 18-Jun-09 117.13 1059.8 879DWT-DGR6-036 18-Jun-09 130.43 1050.6 904DWT-DGR6-037 18-Jun-09 130.43 841.1 883DWT-DGR6-038 19-Jun-09 142.30 660.7 918DWT-DGR6-039 19-Jun-09 142.30 1135.9 937DWT-DGR6-040 19-Jun-09 142.30 1087.9 989DWT-DGR6-041 19-Jun-09 145.00 1019.8 922DWT-DGR6-042 20-Jun-09 145.00 956.7 977DWT-DGR6-043 20-Jun-09 156.45 944.8 1010DWT-DGR6-044 20-Jun-09 156.45 957.7 1013DWT-DGR6-045 20-Jun-09 170.00 609.3 888
Prepared by: KERReviewed by: SNGDate: 30-Mar-11TR-09-02 Drillling Fluid Lab and Field Results R0.xls Page 1 of 6

Table B.4 - Summary of Field Chemical Measurements of DGR-6 Drilling Fluids
Sample ID Date Collected
Depth (mLBGS)
Na Fluorescein
(µg/L)
Electrical Conductivity
(µS/cm)
DWT-DGR6-046 21-Jun-09 170.00 665.9 953DWT-DGR6-047 21-Jun-09 173.70 830.3 851DWT-DGR6-048 21-Jun-09 179.80 402.5 619DWT-DGR6-049 22-Jun-09 179.80 13776.3 673DWT-DGR6-050 22-Jun-09 186.00 765.0 988DWT-DGR6-051 22-Jun-09 186.00 1598.4 1000DWT-DGR6-052 22-Jun-09 200.50 429.1 2582DWT-DGR6-053 23-Jun-09 200.50 1063.3 2494DWT-DGR6-054 23-Jun-09 209.91 962.6 2425DWT-DGR6-055 23-Jun-09 209.91 1001.5 2450DWT-DGR6-056 23-Jun-09 215.91 988.6 2419DWT-DGR6-057 11-Jul-09 215.91 806.4 2050DWT-DGR6-058 12-Jul-09 215.91 685.5 43100DWT-DGR6-059 13-Jul-09 215.91 599.8 124500DWT-DGR6-060 13-Jul-09 215.91 558.2 133500DWT-DGR6-061 13-Jul-09 215.91 223.1 131900DWT-DGR6-062 13-Jul-09 215.91 615.4 132800DWT-DGR6-063 14-Jul-09 215.91 752.9 133500DWT-DGR6-064 14-Jul-09 221.70 647.1 137500DWT-DGR6-065 14-Jul-09 224.75 801.4 141800DWT-DGR6-066 15-Jul-09 224.75 1006.3 142600DWT-DGR6-067 15-Jul-09 226.67 922.7 150100DWT-DGR6-068 15-Jul-09 228.72 874.2 145400DWT-DGR6-069 15-Jul-09 231.77 876.3 148300DWT-DGR6-070 16-Jul-09 234.82 1104.4 147600DWT-DGR6-071 16-Jul-09 237.87 962.0 161600DWT-DGR6-072 16-Jul-09 243.97 535.4 166800DWT-DGR6-073 16-Jul-09 247.02 1151.7 173600DWT-DGR6-074 17-Jul-09 253.12 1165.7 174800DWT-DGR6-075 17-Jul-09 259.22 1067.9 190300DWT-DGR6-076 17-Jul-09 265.32 943.5 182300DWT-DGR6-077 17-Jul-09 268.37 924.4 182200DWT-DGR6-078 18-Jul-09 271.42 883.3 182200DWT-DGR6-079 18-Jul-09 271.42 783.4 182500DWT-DGR6-080 18-Jul-09 274.31 720.3 176200DWT-DGR6-081 19-Jul-09 280.57 1000.1 179400DWT-DGR6-082 19-Jul-09 286.67 802.4 185600DWT-DGR6-083 19-Jul-09 289.72 623.7 183800DWT-DGR6-084 19-Jul-09 295.82 1125.8 183700DWT-DGR6-085 20-Jul-09 298.87 1053.4 184600DWT-DGR6-086 20-Jul-09 304.97 940.2 189600DWT-DGR6-087 20-Jul-09 314.12 675.2 186600DWT-DGR6-088 20-Jul-09 317.17 1027.1 187400DWT-DGR6-089 21-Jul-09 326.32 999.8 188600DWT-DGR6-090 21-Jul-09 329.37 812.0 189400DWT-DGR6-091 21-Jul-09 335.32 887.2 188500
Prepared by: KERReviewed by: SNGDate: 30-Mar-11TR-09-02 Drillling Fluid Lab and Field Results R0.xls Page 2 of 6

Table B.4 - Summary of Field Chemical Measurements of DGR-6 Drilling Fluids
Sample ID Date Collected
Depth (mLBGS)
Na Fluorescein
(µg/L)
Electrical Conductivity
(µS/cm)
DWT-DGR6-092 21-Jul-09 338.37 1064.3 188800DWT-DGR6-093 22-Jul-09 340.73 1014.3 189100DWT-DGR6-094 22-Jul-09 344.62 777.5 192100DWT-DGR6-095 23-Jul-09 347.67 886.9 190000DWT-DGR6-096 23-Jul-09 347.67 1063.2 195200DWT-DGR6-097 23-Jul-09 350.70 985.5 195300DWT-DGR6-098 23-Jul-09 353.75 1178.5 194900DWT-DGR6-099 23-Jul-09 357.00 1113.7 197500DWT-DGR6-100 24-Jul-09 357.00 1107.1 202400DWT-DGR6-101 24-Jul-09 359.85 1056.1 202700DWT-DGR6-102 24-Jul-09 362.90 935.1 200800DWT-DGR6-103 24-Jul-09 365.95 1002.8 202100DWT-DGR6-104 25-Jul-09 369.00 1025.3 203900DWT-DGR6-105 25-Jul-09 372.05 989.5 203400DWT-DGR6-106 25-Jul-09 375.10 1169.7 196600DWT-DGR6-107 26-Jul-09 375.10 1113.3 198600DWT-DGR6-108 26-Jul-09 375.83 1063.3 200200DWT-DGR6-109 26-Jul-09 376.66 864.9 199300DWT-DGR6-110 27-Jul-09 376.66 1196.0 204900DWT-DGR6-111 27-Jul-09 378.15 1116.3 203700DWT-DGR6-112 27-Jul-09 381.20 1097.2 204200DWT-DGR6-113 27-Jul-09 381.20 848.5 201100DWT-DGR6-114 27-Jul-09 384.25 1103.6 206800DWT-DGR6-115 28-Jul-09 390.35 821.2 214200DWT-DGR6-116 28-Jul-09 393.40 1017.4 215000DWT-DGR6-117 28-Jul-09 396.45 668.0 210900DWT-DGR6-118 28-Jul-09 399.50 1037.4 213800DWT-DGR6-119 29-Jul-09 405.60 711.2 215200DWT-DGR6-120 29-Jul-09 411.70 770.3 213700DWT-DGR6-121 29-Jul-09 414.75 1140.1 213140DWT-DGR6-122 29-Jul-09 420.85 1065.9 213100DWT-DGR6-123 30-Jul-09 423.90 902.2 216600DWT-DGR6-124 30-Jul-09 430.00 1050.3 219800DWT-DGR6-125 30-Jul-09 433.05 846.3 217200DWT-DGR6-126 30-Jul-09 436.10 1181.6 218700DWT-DGR6-127 05-Aug-09 439.15 2.9 220800DWT-DGR6-128 05-Aug-09 439.15 55.8 --DWT-DGR6-129 05-Aug-09 439.15 1425.8 174100DWT-DGR6-130 06-Aug-09 445.25 1343.3 175500DWT-DGR6-131 06-Aug-09 448.30 1243.8 174000DWT-DGR6-132 06-Aug-09 451.35 1100.2 172500DWT-DGR6-133 06-Aug-09 457.45 1005.3 174100DWT-DGR6-134 07-Aug-09 463.55 939.3 176900DWT-DGR6-135 07-Aug-09 469.65 692.3 159100DWT-DGR6-136 07-Aug-09 475.75 864.6 163600DWT-DGR6-137 08-Aug-09 475.75 769.5 168300
Prepared by: KERReviewed by: SNGDate: 30-Mar-11TR-09-02 Drillling Fluid Lab and Field Results R0.xls Page 3 of 6

Table B.4 - Summary of Field Chemical Measurements of DGR-6 Drilling Fluids
Sample ID Date Collected
Depth (mLBGS)
Na Fluorescein
(µg/L)
Electrical Conductivity
(µS/cm)
DWT-DGR6-138 08-Aug-09 479.73 1155.9 167710DWT-DGR6-139 08-Aug-09 490.11 989.5 168500DWT-DGR6-140 08-Aug-09 498.03 1023.7 172200DWT-DGR6-141 08-Aug-09 498.03 -- --DWT-DGR6-142 09-Aug-09 504.13 967.9 174100DWT-DGR6-143 09-Aug-09 507.18 825.5 168900DWT-DGR6-144 09-Aug-09 513.28 850.6 174400DWT-DGR6-145 23-Nov-09 516.33 1346.6 202400DWT-DGR6-146 24-Nov-09 518.15 1357.0 205500DWT-DGR6-147 24-Nov-09 523.43 1229.0 203700DWT-DGR6-148 24-Nov-09 528.71 1021.0 195100DWT-DGR6-149 24-Nov-09 528.71 1395.8 189000DWT-DGR6-150 25-Nov-09 531.76 568.9 199300DWT-DGR6-151 25-Nov-09 531.76 982.3 200400DWT-DGR6-152 26-Nov-09 535.00 670.6 200600DWT-DGR6-153 26-Nov-09 542.55 836.9 190200DWT-DGR6-154 26-Nov-09 559.21 614.6 192800DWT-DGR6-155 27-Nov-09 563.90 1952.3 187200DWT-DGR6-156 27-Nov-09 566.95 485.9 180100DWT-DGR6-157 28-Nov-09 566.95 1171.2 188100DWT-DGR6-158 28-Nov-09 571.41 747.9 189300DWT-DGR6-159 28-Nov-09 577.51 899.1 182400DWT-DGR6-160 28-Nov-09 577.51 1146.0 188500DWT-DGR6-161 28-Nov-09 589.71 611.7 194300DWT-DGR6-162 29-Nov-09 589.71 555.3 197800DWT-DGR6-163 29-Nov-09 595.81 778.4 180500DWT-DGR6-164 30-Nov-09 604.96 949.4 194900DWT-DGR6-165 01-Dec-09 608.01 437.4 194500DWT-DGR6-166 01-Dec-09 614.11 844.8 186500DWT-DGR6-167 01-Dec-09 617.16 1138.4 188900DWT-DGR6-168 02-Dec-09 623.26 644.4 189100DWT-DGR6-169 02-Dec-09 629.36 1466.9 189200DWT-DGR6-170 02-Dec-09 635.46 1362.4 191300DWT-DGR6-171 02-Dec-09 636.96 932.0 190300DWT-DGR6-172 04-Dec-09 518.70 543.8 --DWT-DGR6-173 04-Dec-09 518.70 1048.6 --DWT-DGR6-174 04-Dec-09 533.70 1277.3 192900DWT-DGR6-175 05-Dec-09 533.70 1327.5 192800DWT-DGR6-176 05-Dec-09 551.75 1150.9 188200DWT-DGR6-177 06-Dec-09 562.75 516.4 196100DWT-DGR6-178 07-Dec-09 578.75 1301.5 188600DWT-DGR6-179 07-Dec-09 578.75 1096.3 190100DWT-DGR6-180 07-Dec-09 578.75 1038.9 193200DWT-DGR6-181 07-Dec-09 594.75 539.5 195400DWT-DGR6-182 08-Dec-09 594.75 587.0 193300DWT-DGR6-183 08-Dec-09 615.75 579.5 193100
Prepared by: KERReviewed by: SNGDate: 30-Mar-11TR-09-02 Drillling Fluid Lab and Field Results R0.xls Page 4 of 6

Table B.4 - Summary of Field Chemical Measurements of DGR-6 Drilling Fluids
Sample ID Date Collected
Depth (mLBGS)
Na Fluorescein
(µg/L)
Electrical Conductivity
(µS/cm)
DWT-DGR6-184 08-Dec-09 631.75 1163.5 183700DWT-DGR6-185 09-Dec-09 631.75 798.0 166700DWT-DGR6-186 06-Jan-10 642.56 252.0 --DWT-DGR6-187 06-Jan-10 648.16 1828.0 165000DWT-DGR6-188 07-Jan-10 651.16 1176.2 163500DWT-DGR6-189 07-Jan-10 657.16 1109.3 164600DWT-DGR6-190 07-Jan-10 660.16 698.0 167700DWT-DGR6-191 07-Jan-10 663.16 997.0 188500DWT-DGR6-192 08-Jan-10 663.16 1394.2 165600DWT-DGR6-193 08-Jan-10 669.16 1289.0 180900DWT-DGR6-194 8-Jan-10 669.26 754.0 174100DWT-DGR6-195 09-Jan-10 669.26 699.4 184900DWT-DGR6-196 10-Jan-10 669.26 1738.1 174300DWT-DGR6-197 10-Jan-10 675.16 1303.7 179900DWT-DGR6-198 10-Jan-10 681.16 1126.4 173000DWT-DGR6-199 11-Jan-10 684.16 1132.2 173600DWT-DGR6-200 11-Jan-10 690.16 931.7 181100DWT-DGR6-201 11-Jan-10 696.16 525.3 184700DWT-DGR6-202 11-Jan-10 696.16 1191.3 180700DWT-DGR6-203 12-Jan-10 702.16 931.0 183100DWT-DGR6-204 15-Jan-10 711.16 737.2 187400DWT-DGR6-205 15-Jan-10 720.16 763.5 182700DWT-DGR6-206 16-Jan-10 726.16 577.5 174100DWT-DGR6-207 17-Jan-10 762.16 463.3 178300DWT-DGR6-208 17-Jan-10 780.16 688.4 181900DWT-DGR6-209 18-Jan-10 792.16 755.8 179400DWT-DGR6-210 18-Jan-10 -- 654.2 183400DWT-DGR6-211 18-Jan-10 807.16 1315.3 193600DWT-DGR6-212 19-Jan-10 819.16 1048.2 181200DWT-DGR6-213 19-Jan-10 822.16 -- --DWT-DGR6-214 19-Jan-10 828.16 2546.5 194500DWT-DGR6-215 19-Jan-10 834.16 3533.7 180900DWT-DGR6-216 19-Jan-10 843.16 1084.6 --DWT-DGR6-217 20-Jan-10 852.16 991.2 --DWT-DGR6-218 20-Jan-10 861.16 546.5 208300DWT-DGR6-219 21-Jan-10 876.16 290.0 207200DWT-DGR6-220 21-Jan-10 879.16 2095.9 186700DWT-DGR6-221 23-Jan-10 882.16 156.9 207300DWT-DGR6-222 23-Jan-10 885.16 905.3 213300DWT-DGR6-223 24-Jan-10 891.16 1104.4 203200DWT-DGR6-224 24-Jan-10 897.16 861.7 203600DWT-DGR6-225 24-Jan-10 903.16 956.0 203500DWT-DGR6-226 25-Jan-10 516.00 521.3 212900DWT-DGR6-227 29-Jan-10 566.75 322.2 216100DWT-DGR6-228 29-Jan-10 592.75 643.4 203500DWT-DGR6-229 30-Jan-10 592.75 745.9 210000
Prepared by: KERReviewed by: SNGDate: 30-Mar-11TR-09-02 Drillling Fluid Lab and Field Results R0.xls Page 5 of 6
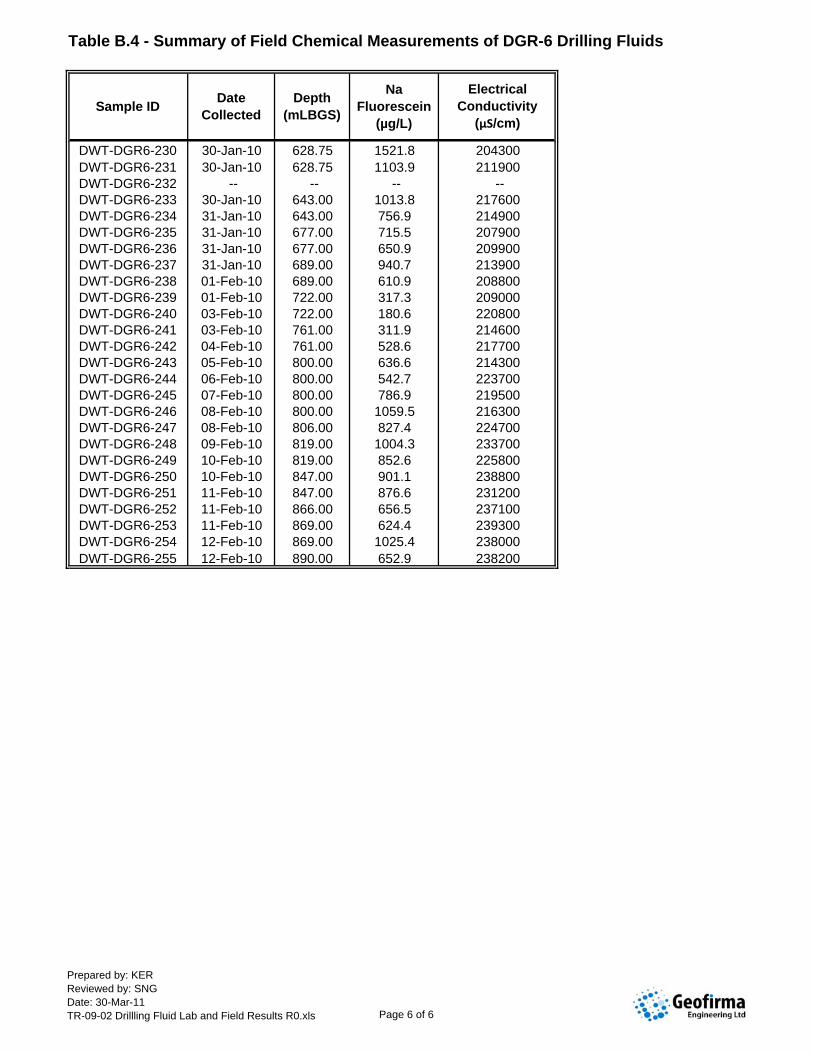
Table B.4 - Summary of Field Chemical Measurements of DGR-6 Drilling Fluids
Sample ID Date Collected
Depth (mLBGS)
Na Fluorescein
(µg/L)
Electrical Conductivity
(µS/cm)
DWT-DGR6-230 30-Jan-10 628.75 1521.8 204300DWT-DGR6-231 30-Jan-10 628.75 1103.9 211900DWT-DGR6-232 -- -- -- --DWT-DGR6-233 30-Jan-10 643.00 1013.8 217600DWT-DGR6-234 31-Jan-10 643.00 756.9 214900DWT-DGR6-235 31-Jan-10 677.00 715.5 207900DWT-DGR6-236 31-Jan-10 677.00 650.9 209900DWT-DGR6-237 31-Jan-10 689.00 940.7 213900DWT-DGR6-238 01-Feb-10 689.00 610.9 208800DWT-DGR6-239 01-Feb-10 722.00 317.3 209000DWT-DGR6-240 03-Feb-10 722.00 180.6 220800DWT-DGR6-241 03-Feb-10 761.00 311.9 214600DWT-DGR6-242 04-Feb-10 761.00 528.6 217700DWT-DGR6-243 05-Feb-10 800.00 636.6 214300DWT-DGR6-244 06-Feb-10 800.00 542.7 223700DWT-DGR6-245 07-Feb-10 800.00 786.9 219500DWT-DGR6-246 08-Feb-10 800.00 1059.5 216300DWT-DGR6-247 08-Feb-10 806.00 827.4 224700DWT-DGR6-248 09-Feb-10 819.00 1004.3 233700DWT-DGR6-249 10-Feb-10 819.00 852.6 225800DWT-DGR6-250 10-Feb-10 847.00 901.1 238800DWT-DGR6-251 11-Feb-10 847.00 876.6 231200DWT-DGR6-252 11-Feb-10 866.00 656.5 237100DWT-DGR6-253 11-Feb-10 869.00 624.4 239300DWT-DGR6-254 12-Feb-10 869.00 1025.4 238000DWT-DGR6-255 12-Feb-10 890.00 652.9 238200
Prepared by: KERReviewed by: SNGDate: 30-Mar-11TR-09-02 Drillling Fluid Lab and Field Results R0.xls Page 6 of 6
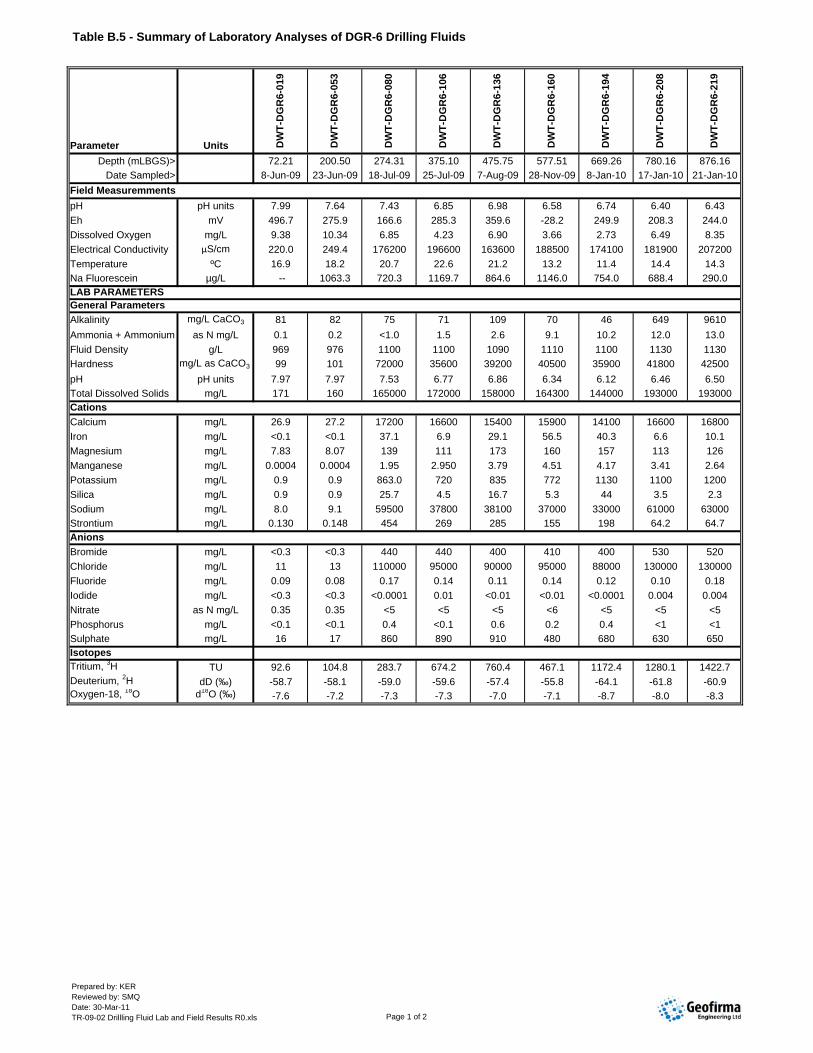
Table B.5 - Summary of Laboratory Analyses of DGR-6 Drilling Fluids
Parameter Units DW
T-D
GR
6-01
9
DW
T-D
GR
6-05
3
DW
T-D
GR
6-08
0
DW
T-D
GR
6-10
6
DW
T-D
GR
6-13
6
DW
T-D
GR
6-16
0
DW
T-D
GR
6-19
4
DW
T-D
GR
6-20
8
DW
T-D
GR
6-21
9
Depth (mLBGS)> 72.21 200.50 274.31 375.10 475.75 577.51 669.26 780.16 876.16Date Sampled> 8-Jun-09 23-Jun-09 18-Jul-09 25-Jul-09 7-Aug-09 28-Nov-09 8-Jan-10 17-Jan-10 21-Jan-10
Field MeasuremmentspH pH units 7.99 7.64 7.43 6.85 6.98 6.58 6.74 6.40 6.43Eh mV 496.7 275.9 166.6 285.3 359.6 -28.2 249.9 208.3 244.0Dissolved Oxygen mg/L 9.38 10.34 6.85 4.23 6.90 3.66 2.73 6.49 8.35Electrical Conductivity µS/cm 220.0 249.4 176200 196600 163600 188500 174100 181900 207200Temperature ºC 16.9 18.2 20.7 22.6 21.2 13.2 11.4 14.4 14.3Na Fluorescein µg/L -- 1063.3 720.3 1169.7 864.6 1146.0 754.0 688.4 290.0LAB PARAMETERSGeneral ParametersAlkalinity mg/L CaCO3 81 82 75 71 109 70 46 649 9610Ammonia + Ammonium as N mg/L 0.1 0.2 <1.0 1.5 2.6 9.1 10.2 12.0 13.0Fluid Density g/L 969 976 1100 1100 1090 1110 1100 1130 1130Hardness mg/L as CaCO3 99 101 72000 35600 39200 40500 35900 41800 42500pH pH units 7.97 7.97 7.53 6.77 6.86 6.34 6.12 6.46 6.50Total Dissolved Solids mg/L 171 160 165000 172000 158000 164300 144000 193000 193000CationsCalcium mg/L 26.9 27.2 17200 16600 15400 15900 14100 16600 16800Iron mg/L <0.1 <0.1 37.1 6.9 29.1 56.5 40.3 6.6 10.1Magnesium mg/L 7.83 8.07 139 111 173 160 157 113 126Manganese mg/L 0.0004 0.0004 1.95 2.950 3.79 4.51 4.17 3.41 2.64Potassium mg/L 0.9 0.9 863.0 720 835 772 1130 1100 1200Silica mg/L 0.9 0.9 25.7 4.5 16.7 5.3 44 3.5 2.3Sodium mg/L 8.0 9.1 59500 37800 38100 37000 33000 61000 63000Strontium mg/L 0.130 0.148 454 269 285 155 198 64.2 64.7AnionsBromide mg/L <0.3 <0.3 440 440 400 410 400 530 520Chloride mg/L 11 13 110000 95000 90000 95000 88000 130000 130000Fluoride mg/L 0.09 0.08 0.17 0.14 0.11 0.14 0.12 0.10 0.18Iodide mg/L <0.3 <0.3 <0.0001 0.01 <0.01 <0.01 <0.0001 0.004 0.004Nitrate as N mg/L 0.35 0.35 <5 <5 <5 <6 <5 <5 <5Phosphorus mg/L <0.1 <0.1 0.4 <0.1 0.6 0.2 0.4 <1 <1Sulphate mg/L 16 17 860 890 910 480 680 630 650IsotopesTritium, 3H TU 92.6 104.8 283.7 674.2 760.4 467.1 1172.4 1280.1 1422.7Deuterium, 2H dD (‰) -58.7 -58.1 -59.0 -59.6 -57.4 -55.8 -64.1 -61.8 -60.9Oxygen-18, 18O d18O (‰) -7.6 -7.2 -7.3 -7.3 -7.0 -7.1 -8.7 -8.0 -8.3
Prepared by: KERReviewed by: SMQDate: 30-Mar-11TR-09-02 Drillling Fluid Lab and Field Results R0.xls Page 1 of 2

Table B.5 - Summary of Laboratory Analyses of DGR-6 Drilling Fluids
Parameter Units DW
T-D
GR
6-01
9
DW
T-D
GR
6-05
3
DW
T-D
GR
6-08
0
DW
T-D
GR
6-10
6
DW
T-D
GR
6-13
6
DW
T-D
GR
6-16
0
DW
T-D
GR
6-19
4
DW
T-D
GR
6-20
8
DW
T-D
GR
6-21
9
Depth (mLBGS)> 72.21 200.50 274.31 375.10 475.75 577.51 669.26 780.16 876.16Date Sampled> 8-Jun-09 23-Jun-09 18-Jul-09 25-Jul-09 7-Aug-09 28-Nov-09 8-Jan-10 17-Jan-10 21-Jan-10
Selected Trace ElementsAluminum mg/L 0.005 0.012 3.49 0.649 6.03 3.28 12.8 1.45 0.51Antimony mg/L <0.002 <0.002 <0.002 0.003 0.002 <0.02 <0.02 0.002 0.002Arsenic mg/L <0.002 <0.002 0.289 0.414 0.413 0.36 0.33 0.43 0.45Barium mg/L 0.115 0.220 0.480 0.795 0.648 7.03 3.57 3.14 2.42Beryllium mg/L <0.0002 <0.0002 <0.0002 <0.0002 0.0005 <0.002 <0.002 <0.002 <0.002Boron mg/L 0.028 0.034 4.11 3.33 3.25 4.51 4.44 5.09 4.67Bismuth mg/L <0.0001 <0.0001 0.0002 0.0002 <0.0001 <0.001 0.003 <0.001 <0.001Cadmium mg/L 0.00003 <0.00003 0.00086 0.00099 0.00090 0.0007 0.0009 0.0020 0.0008Cesium mg/L <0.001 <0.001 0.013 0.002 0.002 0.01 <0.01 0.01 0.02Chromium mg/L <0.005 <0.005 0.066 0.016 0.041 <0.05 <0.05 <0.05 <0.05Cobalt mg/L 0.00005 0.00004 0.01982 0.0164 0.0209 0.0353 0.0430 0.0356 0.0340Copper mg/L <0.005 <0.005 0.110 0.034 0.091 0.09 <0.05 0.07 <0.05Gadolinium mg/L <0.0005 <0.0005 0.0040 <0.0005 0.0017 <0.005 <0.005 <0.005 <0.005Lead mg/L 0.0002 0.0006 0.0109 0.0010 0.0057 0.083 0.018 0.013 0.023Lithium mg/L <0.02 <0.02 4.30 7.28 6.70 8.71 7.46 8.02 8.19Molybdenum mg/L 0.0005 0.0011 0.0292 0.0174 0.0190 0.080 0.027 0.019 0.041Nickel mg/L <0.001 0.001 0.175 0.335 0.323 0.36 0.32 0.44 0.46Rubidium mg/L <0.001 <0.001 0.554 1.17 1.08 0.89 0.78 <0.01 0.27Selenium mg/L <0.01 <0.01 0.55 0.05 0.05 0.8 <0.1 0.1 0.2Silver mg/L <0.0001 <0.0001 0.0006 0.0006 0.0005 0.004 0.002 0.002 0.001Thallium mg/L <0.002 <0.002 <0.002 0.0004 0.0006 <0.02 <0.02 <0.002 <0.002Tin mg/L <0.0001 <0.0001 0.0032 0.0051 0.0028 <0.001 0.001 0.007 0.002Titanium mg/L <0.001 <0.001 0.176 0.046 0.124 0.09 0.40 0.07 0.04Uranium mg/L 0.00044 0.00042 0.00246 0.00209 0.00143 <0.0001 0.0013 0.0012 0.0002Vanadium mg/L 0.0005 0.0004 0.0084 <0.0003 0.0081 0.003 0.018 <0.003 <0.003Zinc mg/L 0.02 0.02 0.44 0.02 0.12 0.4 0.8 0.6 0.5
Prepared by: KERReviewed by: SMQDate: 30-Mar-11TR-09-02 Drillling Fluid Lab and Field Results R0.xls Page 2 of 2

Table B.6 - Tritium Analysis of DGR-6 Drilling Fluids
Sample ID Date Collected Depth (mLBGS) Tritium (TU)
DWT-DGR6-019 8-Jun-09 71.21 92.6DWT-DGR6-026 12-Jun-09 91.61 122.2DWT-DGR6-031 15-Jun-09 105.67 93.7DWT-DGR6-034 17-Jun-09 115.61 123.4DWT-DGR6-044 20-Jun-09 156.45 113.9DWT-DGR6-051 22-Jun-09 186.00 84.1DWT-DGR6-053 23-Jun-09 200.50 104.8DWT-DGR6-080 18-Jul-09 274.31 283.7DWT-DGR6-106 25-Jul-09 375.10 674.2DWT-DGR6-132 06-Aug-09 451.35 677.0DWT-DGR6-136 7-Aug-09 475.75 760.4DWT-DGR6-145 23-Nov-09 516.33 286.5DWT-DGR6-154 26-Nov-09 559.21 385.2DWT-DGR6-160 28-Nov-09 577.51 467.1DWT-DGR6-164 30-Nov-09 604.96 491.0DWT-DGR6-169 2-Dec-09 629.36 558.1DWT-DGR6-174 4-Dec-09 533.70 548.9DWT-DGR6-179 7-Dec-09 578.75 655.6DWT-DGR6-184 8-Dec-09 631.75 711.2DWT-DGR6-194 8-Jan-10 669.26 1172.4DWT-DGR6-205 15-Jan-10 720.16 1723.0DWT-DGR6-208 17-Jan-10 780.16 1280.1DWT-DGR6-213 19-Jan-10 822.16 1215.4DWT-DGR6-219 21-Jan-10 876.16 1422.7DWT-DGR6-227 29-Jan-10 566.75 1169.8DWT-DGR6-235 31-Jan-10 677.00 1234.2DWT-DGR6-241 3-Feb-10 761.00 1152.7DWT-DGR6-244 6-Feb-10 800.00 877.6DWT-DGR6-248 9-Feb-10 819.00 948.4DWT-DGR6-253 11-Feb-10 869.00 1181.5
Prepared by: KERReviewed by: SMQDate: 30-Mar-11TR-09-02 Drillling Fluid Lab and Field Results R0.xls Page 1 of 1

APPENDIX C
Depth Plots of Selected Analyses of DGR-5 and DGR-6 Drilling Fluid
Figure C.1 – Fluid Density and Funnel Viscosity in DGR-5
Figure C.2 – Na Fluorescein and Tritium in DGR-5
Figure C.3 – Electrical Conductivity in DGR-5
Figure C.4 – Fluid Density and Funnel Viscosity in DGR-6
Figure C.5 – Na Fluorescein and Tritium in DGR-6
Figure C.6 – Electrical Conductivity in DGR-6

33
35
37
39
41
43
45
1,050
1,150
Visc
osity
(sec
/qt)
Flui
d D
ensi
ty (k
g/m
3 )
Figure C.1 - Fluid Density and Funnel Viscosity in DGR-5
Density
Viscosity
25
27
29
31
9500 100 200 300 400 500 600 700 800 900
F
Depth (mLBGS)

400
500
600
700
800
900
1000
100
1000
10000
Triti
um (T
U)
NaF
l (ug
/L)
Figure C.2 - Na Fluorescein and Tritium in DGR-5
NaFl
Tritium
0
100
200
300
1
10
0 100 200 300 400 500 600 700 800 900
Depth (mLBGS)
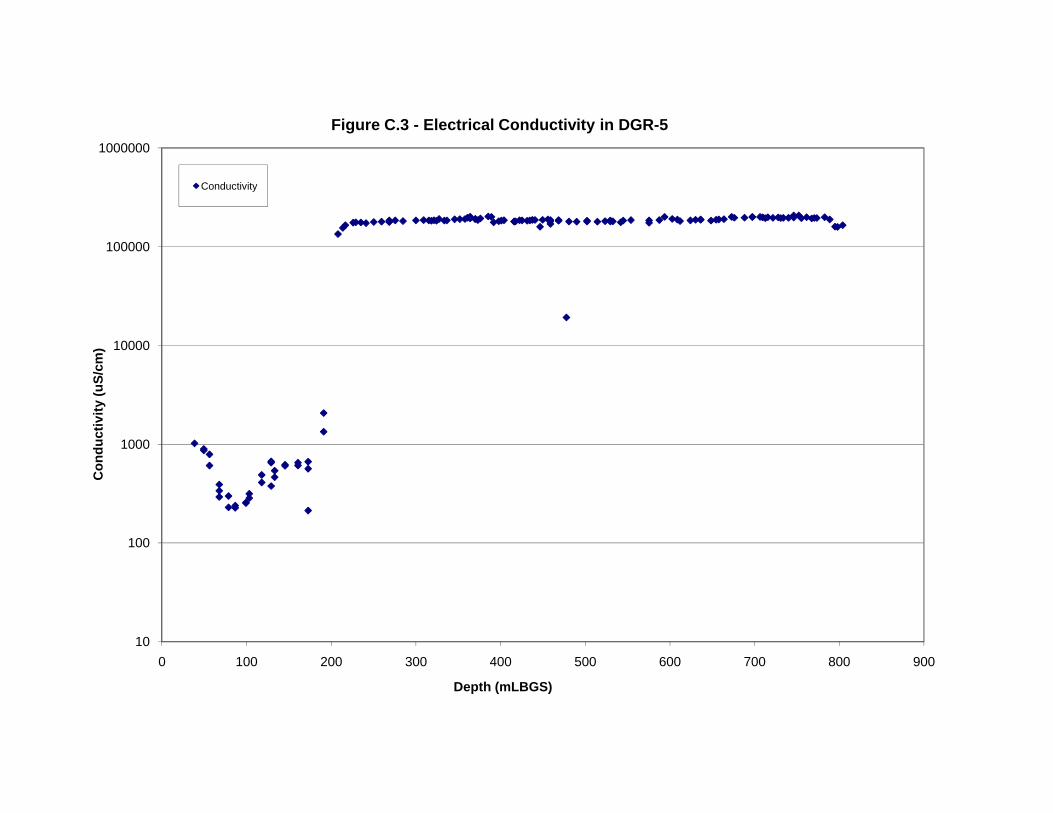
1000
10000
100000
1000000
Con
duct
ivity
(uS/
cm)
Figure C.3 - Electrical Conductivity in DGR-5
Conductivity
10
100
0 100 200 300 400 500 600 700 800 900
C
Depth (mLBGS)

451,150
Figure C.4 - Fluid Density and Funnel Viscosity in DGR-6
Density
41
43Density
Viscosity
37
39
c/qt
)
g/m
3 )
33
351,050
Visc
osity
(sec
Flui
d D
ensi
ty (k
29
31
F
25
27
9500 100 200 300 400 500 600 700 800 900

800
1000
1200
1400
1600
1800
2000
100
1000
10000
100000
Triti
um (T
U)
NaF
l (ug
/L)
Figure C.5 - Na Fluorescein and Tritium in DGR-6
NaFl - Coring
NaFl - Reaming
Tritium - Coring
Tritium - Reaming
0
200
400
600
1
10
0 100 200 300 400 500 600 700 800 900 1000
Depth (mLBGS)

100
1000
10000
100000
1000000
Con
duct
ivity
(uS/
cm)
Figure C.6 - Electrical Conductivity in DGR-6
Conductivity - Coring
Conductivity - Reaming
1
10
100
0 100 200 300 400 500 600 700 800 900 1000
C
Depth (mLBGS)