documeit men - eric · documeit men --ed 111 878. 95 _. author guilliams, clark i.. title item...
TRANSCRIPT

DOCUMEIT men --
ED 111 878 95_ .
AUTHOR Guilliams, Clark I. .,
TITLE item Analyses of Amerindian and.Chicano Responses on- the vocabulary Scales of the Stanfar -Binet LN andWechsler Battpriese. Final Report.
SPONS AGENCY .National Inst. of EdUcatiOn (DREW), Washington, .
TM004 846.
D.C..BUREAU NO BR-3-1955TUB DATE '75NOTE-- 65p.
* 4
EDRS PRICE NF-'-$0.7.6 pc7$3.32 Plus Postage:; ,.
DESCRIPTORS *American'IndiansCCorrelatiOn; Cultural ;Disadvantag4ment; Elementary Education; *IntelligenceTests; *Item Analysis; *Aexican-Americans; HdltipleRegression Analysis.; Notiesf Retarded.Children; TestBias; Testing Problems; Testfteliabilitn TestValidity; -Verbal -Minity; *oCdbularY
IDENTIFIERS Stanford Binet.LO; WecbSier,Intslligence,Scale forChildren
-, -
ABSTRACT 0 ,. ,AChi nCano and Ametindia vocabulary scale responses
° f;Pm-the Stanford-Binet (LN) and Wechsler IntelligenOe Scale for,Children were item- analyzed for 1,00 subjects.,The respohse patterns
-diffeted both. by:ethnic group and test, as well 'as by age. The postcommon; and recurrifigo.pattern_fouhd was level,..of-difficulty ,.
,gradient inconsistencies. he item - analysis :method employed int'his'report was that of. the covaripnce-matrip where the sum of the matrixis the:taial-teste's variance; vocabulary scale totalsAiere, for' boththe SB -LM and the WI4C. Tribes sampled vete NEotaipi Apache; and agroup Of subjects with mixed-tribal backgrounds designated ,Icelledl'Indian. n- Host of., the protocols, that Could, be analyied on. the . .
'vocabulary scales ,were pulled from the testing-course files atArizci-na State University; other protocols-vere-obtained-trom-the
.
reservations mentioned above. Inthe'epilogue, based on-the findings,-\itis:suggested, that bilingual program similar to'those being used-In Teiaso NIE funded program for the . sing academic year be adoptedfor other large-minority groups whobe primary language is not eitherEnglisi.or.Spanish. (Author). ,, ,
it
****************4******************************************************** Documents acquired by ERIC include many, informal unpublished* materials not available from other sources, ERIC makes every effort ***to 'obtain the best copy available. nevertheless, items of marginal ** reproducibility are often encountered and this affects the quality ** of, the kiciofiche and' hardcopy reproductions ERIC makes available. *
ERIC 4:0* via thk,ERIC Document Reproduction Service (EDRS). EDRS is not* responSIble-for the'quality of the original document. Reproductions ** supPlied by EDRS are the'best that can'be Made from the original. ***************************#*****************4c**************************
'

z.
O . ,SCOPE Of*INTENEST NOTICE
The ERIC Facility has aenined, this document for processing
'10:
In oui iudgemsnt, this documentbats* of intwest wilt* dewing-houses noted to the right. Index.ing should reflect thew sptciat,Points of view.
_
.FINAL
Iteni'inalyses-of Amerindian and. Chicane .Responses'on-the ocabulary`Seales.of the Stanford -Binet and Wedhsler'tatterieti .
S ty
National Institute 4Educat on ProjectNa.: 34955.
Clark I. GUiiliais
Missouri' outhern State:CollegeJoplin, Missouri
. 1475 .
,
The research reported he'rein-iies-perforned pursuant to a grantcontract yith the-National-Institute ofEdueation, U. S. DepartrAnent oOlealthL Educ4tion,..4651,Melfare. ,,Contractors undertakingsuch projects undet Oovermentsponsorship Are,ericouraged,to ex-press freely-their Professional judgmenkirrthe conduct of the'project. Points of view or-opinions stated do.not,-therefore,necessarily represent official National inititute of Education
:postiien-or.OoKcy.
U.S. DEPARTMENT OF HEALTH,p EDUCATION& WELFARE
NATIONAL INSTITUTE OFEDUCATION
THIS DOCUMENT HAS BEEN REPROOUCED EXACTLY AS RECEIVED FJtOMTHE PERSON 00 ORGANIZATION ORIGIN,ATING T. POINTS OF VIEW OR OPINIONSSTATED DO NOT NECESSARILY REPRESENT OFFICIAL NATIONAL` INSTITUTE OF.EDUCATION POSITION OR POLICY
0
I
Copy No.. One ;of Eight)
A

List of Tables ;*
List of. Figures
Summai-y
Introduction : .;
. .
. . 5
5
6
.. 6
8
14
14
16
17
Method .. .. . .......Subjects. . ....
,Apparatus-i;
troceduresand-Statistical.Analysis
ReSillts
'Discussion
Overvi6y,
General. Considerations
Tages,
'.
Figures ,. . .,.. id
VodabOlary Scales
Bibliogra;hy.
Appendixes
Appendix A
Directory-Of Bureua of Indian Affairs 53
Adde#da,.
Appendix B'y.
Appendix C
Appendix .
-t>

LIST-OF
TABLE
'I test-Retest-Correlations. nd Standard Errors. of Measurement 17
. .
/I Correlaiions of School Marks.Witlechsler Scores 4 ....'III, Chicano NormsResponSes of Stanford-Binet (11),-Cii lo.13
;17, COVariance Batrii*of Chicano Responses,onStanford-Binet,
V Navaho Norma Responses of Stanford - Binet (11),-CA: 10.42' ..1. 21
VI Covariance Matrix of Navaho Responses on -Stanford4inet 22
VII Apache Norma RespOnSes of Stanford -Binet (LM), CA: 7.37 41.
VIII Covariance Matrix of Apache Responseson Stanford-Binet .
-IX Apache. Nor Responses of Stanford - Binet (LM)4 CA: 9.8 24
X. Covariance Matrix of Apache Responses on Stanford=Binet, . , . 24
XI Call Iddain Norms "Responses of Stanford-Binet (LM), CA: 9.95 25
XII Covariance Matrix of Call Indain kespOnses on Stanford- Binet . . . .26
XIII Johnson - O'Malley" Indain Norms ResponSes of WISC (Ages'6, 7, 8, & 9). .27
XIV Covariance Matrix of Johnson - O'Malley Indain' Responses on WISC . . . .28
XV ,Johnson-O'Malley Indain Norms Responses, -of WISC (Age 10) 29.
XVI Covariance Matrix of Johnson - O'Malley Indian Responses On,WISC . . . 30
,xvii Johnson-O'Malley Indain Norms Responses ofWISC (Ages 11 & . . :32
,XVIII Covariance Matrix of Johnson - O'Malley Indain RespOnses on WISC . . .ci
XI.% Johnson-O'Malley Indian Norms Responses of WISC (Ages 13 & 14) . . . .35
XX Covariance Matrix of Johnson - O'Malley Indian Responses on WISC . . . .36
:.SCI JohnSon7-0'Malley Indian Norms Responses of WISC (Ages 15, 15, & 17). .39. ,
XXII :Covariance Matrix of Johnson- O'Malley Indain Responses on WISC . . . .40

v,
FIGURE'4
LIST OF-FIGURES
4
a.
4
Mean WISC Sub-test-Storel-fa-- retarded and. ':1", --..3_---,
. .
----'----4,Ton-4r-=-----etardeii Riaders . 41..
_,-II 'Mean
.
WISC Sub-test qcoies.fot Male Retarded and ....
Female Retarded Readers . . c ° 42-
III WISC Profile !Or Grade 2 * '43
'.
IV WISC Profile for Grade 3 44. is
a
.z. . ..-: V. wrsc, Profile "for._,Grade._,.........,*: __._. 4?...... 2. . .4,5 . , .. ;.90 ___... _
..,-.. .in WISC Profile for Grade 6, . , 46
VII 1, Pupil Ability Leyels' lOr. Anglo, Spanish-AMetican *:,... .
and, Indain. Pupils * ':47
0
R..

4, 0
V
iv
Summary
Chicano and AmeTtilidian vocabularyscale responses from-the Stanford-
Binet.cba and Wechsler Intelligence Scale for Children were item-analysed
1,009 subjects. The response patterns differed both by ethnic groupt4 A A
and test, as.well as by age. ThecRmost common, and reoccuring, pattern* *
.
'found was "level-of-difficulty" gradient inconsistencies. The item-analysis
0methtd employed in this report was that of the covariance matrix where
. . .
,j1le sum of the matrix& &..
totals herefor'both
ApacWanda.group of
is the total-test's Variance; vocabulary scale
'the SB111,and the WISC: Tribes sampled were Navajo,.
Ss sdith mixed-tribal backgrounds designated "called
.
Ihdian". Most of the protocols that could be analysed on the vocabulary0
0'
f
sales were pulled from the testing-course files at Arizona State Univer-,
:
sity; other protocols were obtained from the reservations mention above.
In the Epilogue, bated of the findings, it is suggested that bilingual
. programs similar to those being used in Texas' NIE funded program for the
coming academic year be adopted for other, large minority groups whose pri-
mary language is not either English or Spanish (SEDL, 211 E. 7th St.,
Austin, Tex. 78701);
6

NATIONAL INSTITUTE OF EDUCATIONGrants for ReseartOin Education - .Small Grants_
,PROPOSAL TITLE; ItemAnalyseS'of Amerindian,and Chidano-ResPonsei on theNrotabulary, Stales of the Stanford-Binet LM andWechslerBatteries
AUTHOR: Clark I. Guillians Ed.'D.Head, Department-of PsychologyMissoUri Southern 'State College
Joplin, Missouri "64801(417) 624 -8100 (Ext. 225)
Introduction
Artioles critical of the current role of standardized tests in our educational
system are in mode currently; particularly, individual mental tests and the
stigma attached to approximately. forty million disadvantaged youngsters in
thd'United States. However;,thia does nothing-to stop the use of the Stanford-
Binet LM or the Wechsler batteties by State Departments of Education for special
screening and-placement. Ballinger (1963) proposed the establishment of a
national commission to examine the nature and use ofstanardized testing
instruments, but a decade later, one sees that an IQ of 70'+/- 5 points,
still is the criterion for special education placement, or is at least enough
empirical evidence to award a youngster with the label; "retarded". Since
there are no Nader Raiders to champion the cause for the culturally dis-
adiintaged, nor a federal agency to police the policies and researdh'practices
(or lack of them) of the major testing companies--namely, Houghton Mifflin
(SB-LM)., Psych Corp (Wechsler batteries), and in higher education"ETS (Nat-
ional.
Teachers Exam & Graduate Record Exam's) and Psych Corp (Miller Analogies) -
the best that one Can do is try to improve individual mental tests. Culture
free tests and tests favoring one social group over another may not be even
theoretically attainable and certainly will not be available in the near,

tuture, and- most certainly not if edkational researchers sit back and
,criticize the weaknesses of tests waiting for a minor-miracle metamorp hoiii---
within the testing company domain.
Close scrutiny Of the items on the major mental tests in the various sub-&
cultures of the country is a since qua non for the next revisions, but
the NIE will'have to haVe emPirical.proof that special scales can be
constructed for spebial groups, and then demand that pilot standardization
. .
studies show conclusively that the culturally disadvantaged groups, most
certainly bilingual populations, have not been raped in the verbal in-..
intelligence area. EPIEGRAM (Feb. 15, 1973) states that California is the
only state that has legally_ mandated publishers to provide evidence of how
effectively their material will work with specific learners. But the law
is so recent that it has not yet been implemented. The few educational
producers who have spent time and money testing theii.programs say thatca
local and state officials seldom, if ever, ask for evidence of validity,
or take the trouble,of gathering it themselves before demanding that
school districts use standardized tests to make critical decisions about
41111
individuals.
Amerindian and Chicano subjects typically do best on the performance
scales of the "big two" individual mental tests, as do other disadvantaggd,
groups where verbal skills are not continually reinforced. HoWever, the
subtest that contributes the most to the §B-LM-IQ, and the Verbal and
Full &ale IQ's of the Wechsler batteries is vocabulary (Terman & Merrill,
1960; Wechsler, 1967; Cronbach, 1970, Buros, 1972). Vocabulary is a

relatively weak input to total intelligence for both retarded and nonretarded,
male or female, Amerindians. Figures 1 and 2 (lifted from Hollingshead &
Clayton, 1972) show results from a.recently, federally funded study. ,Figure
1 underscores the fact that it is-not just retarded Amerindians that have
'trouble with vocabulary on the WISC but also the nonretarded Amerindian Ss.
Figure-2 relates to sex differences, but ones for retarded Ss.' The Verbal
subtest scaled scores on the left; the Performance scaled scores on the
right of Vocabulary. The reviewer may note- that females, in general - -re-
tarded or not,.do better than males on the'verbal skills; and the converse
for the performance skills. However, also note that both sexes do equally
7+ '
poor on Vocabulary. {INSERT FIGURES 1 & 2 ABOUTHERE:}
Tables 1 end-'2 show_Xharin the general U.S. population'the test-
retest reliability and predictive validity correlation coefficients lor
the Vocabulary scale of the WISC and WAIS.. The validity coefficients are
:particulary striking when considering that the SCAT and GRE or MAT ,,usually
only correlate in the 0.20.L 0.45 xange with high school and college CPA's.
This is one of the reasons tha an item analysis must be conducted with
the special populations in this proposal. Regardless of.how one .feels
about reinforcing the Amerindian .0T Chicano to.pursue his culture -lan -.
guage, rituals; arts, ad infin.--the empirical data about their disadvan-
tages with English verbal skills, namely vocabularly, when we look at'the
school and college reports on success cannot simply be filed,away as
minute nightmares in the, "Ameridan dream". {INSERT-TABLES 11 2 ABOUT HERE..}
Palomares and Cummins (1967). present the tame findings for Chicanos
in their report for the California State Department of _Education, as
Hollingshead and Clayton did for Indians. They used the WISC to measure
9'

Page 4
fl
the mental aidlity'of rural Mexican-Americans in grades K-6. Figurgs.
. ,
.3; 4, 5,. and 6 are lifted from their ERIC 'fiche (ED 017 959) And are.
g
. .
representative of the WISC profiles reported. Notice that the Voca-1
,
Voca-
bulary scale again is the culprit of the profileslor Ss in grades two'
and three, and in gradis.fivellid'six: Theprofiles alllave positive
A
slopes toward the Performance scales, exceptior grade six; but even.
101 . .
in grade six, Vocabulary is one standard dev ation belowthe national e
mean. Looking back at grade two (Figure 3) the reader sees that the mean
Verbal Scale, excluding Vocabulaty;.is 7.25; or approximately a Verbal
IQ-of 87 (100 -2.75/3600 X 15). If the...Vocabulary Scale were used as
an index,of the Verbal IQ for these children it would be around 70-71
*(Scaled Score =4.10, or -5.90/3.00 X 15 + 100 = 70). Thus, we cannot
generalize by saying that Amerindians and Chicanos merely have low
verbal intellignece --Which certainly is valid fdr individual mental
test results -- instead, it must be emphasized that the lowof the lows
is vocabulary. The same statements are equally clearcut about grades1
three and five. {INSERT FIGURES 3, 4, 5, '& 6 ABOUT HERE.)
The E is concurrently engaged with collecting WISC and SB-LM
Vocabulary subtest data from the-Regional Diagnostic Clinic- Joplin,
Students in measurement and diraluation sections at MSSC have
collected over 200 cases todate, but there are nearly 2,500 indivi-
dual files yet to go before-future sections of our'advanced statistical
analysis students get to punch the cards and dump into the 1130. How-,
ever, we are noticing, weak items for specific diagnostic categories
by inspection. Consequently, "The Great Hope" for the utilization of
the findings for the present proposal.
One last study concerning the mental ability of Culturally ciis7
advantaged groups by Anderson and Safar (1969) compares Ang.o, Spanish-
10
tOEM

a. ga ..
.... . ., ..
. , .' Ii
..
4q
group. Five of the six.Xn.. .
are less,than the 0.001 level of signi-. .
ficance. High, medful4,
,
and IOW were defined respectively by percentiler ':. .L
..,. 4 : 'I. groupings of 60-99Zile, 40-5941e, and 1-j9Zile on several different.. ,
.
m ental ability tests: e. g., WISC, SB-IX, CCMT., or the Otis. System4 / I
'' Ill A was, typicafly; rural New Mexico; while Syttem B.was rural but en-,s,
,
American, and Indian samples frail- two New Mexico school systems.
Tis a-lift job frpm their'study -(ERIC accession no.:,
. .
ED.'029 70)*and shows the expected., NAmelyi that Angolls Spanish-'-
American Ss Indian Ss in the proportion of children in the high ability :
A, ' ,compassed several military and government installation dependents.!
opulation, the expected proportions-for H, M, and L would be
46, 20, and 40. It'does not take a Jean Dixon act to see who tent the
4
In a normal
cheese in this type of cross-cultural study of mental ability as
measured by Angol-culture tests. Yes, tests constructed by Anglost.
1 '.. .
(if not WASP's)', for the Anglos, undioweiter., 'i
i':-)
With less license, the hypothesis of this proposal is (the Ho
avoided intentionally):.
t
Item analy*ii of WISC, and SB-IM Vocabulity itemresponses of Amerindian & Chicano Ss (also bydifferent geographical bocale) will yield signif-icantly different item-Vocabular)%subtest covar.7iances.
Method .
Subjects. -During the spring semester of 1974 the vocabularly
sections of.WISC and Stanford-Binet .(LM) protocols`- that had already
been admirditered.to Amerindian and Chicaio Ss were/collected from
several sources. The major source of protocols for botA of the individ-
ual mental tests, and for both ethnic groups, Were obtained from
11
-Page 6 *
. ,
Arizona S tate University's Department of Educational Psychology.. Files
_ -from their, individual mental testing courses proved to be the single
best source of protocols primarily because the public schools tended' to
use the two major tests in question usually for special education' place -
went, and even then the investigator found that fewer and fewer,Individ-
ual mental tests are admini4tered as one goes up- the academic ladder.
Gallqp-McKinley County, New Mexico PubliL Schools was anticipated as
an ideal data sourcebecause the school population there is approximately,
40-, 40-, 20-pei cent respectively, Chicano, Amerindian, and Anglo children.
However, New Mexico's Department of Education informed the E that individ-
ual mental tests were no longer being administered. The same held for
Albuquerque, which was anticipated as one of the ideal pLotocol collecting
ourbpn stations.. Consequently, the investigation was limited to data
sources from,theWhite Mt. Apache reservation, and the Navajo reservation;
mixed-tribal data from the Mesa, Arizona, Public Schools, and Final
'County, Arizona Superintendent of. Education office. The sources above
were located through the Arizona State Department of Education..
Apparatus. No instruments, or special equipment, was used in this
study, other than, those tests that had already been administered. Final
analyses of the data were run on an IBIS 370-125. at the School .of the
Ozarks, Point Lookout, Missouri, by their chief computer.
Procedures and Statistical Analysis. The major research sites have
been listed above.
Test statistics are as varied as the number of authors publishing;
however, two of the best appear to be Ferguson (1971) and DuBois (1965).
The former approaches item analysis through covariance matrices, which is
12

Page 7
simple enough, but very time.tonsuming without Computer'aidk in fact,
so time consuming no one bothers with it period; 'parpularly the respect-,. . . . .
ive test coMpanies. After all, if One changed the flavor of "Cake for1
_'the better, then it wouldn't be "Coke".anymore,-`would it? 'ComOnuing,
covariance- matrix method starts by working on the internal consistency of
the partiCuIar reference variable; namely, finding all the item-total
`test covariances (riSiSt's). NM amall.job,fOr uhsttO 40 vocabuiarly
items` by 1009 Ss. Ilese respective covariances were found by summing
up an individual item's iariance and all. of its inter -item covariances.
- 0
,Frala thisLcolumnar sumi one, can determine each item's relative value,
, -
or input by checking the:propottion of the total test's variance (the
stint of the entire matri*),accounted for by :that .Particular item. Matrices
v+re constructedas well' as'CA, MA, and IQ-n.
orms, and CA-MA, MA-IQ, and
eA-IQ-coeificienta carrelation-rfor. the Chicano; Apache and "called
*.
Indian" St. The latter Ss were of mixed-tribes._ Johnson - O'Malley Indian.
.
norms for the WISC were also constructed;as wall, as matrices. The WISC
norms include Means,'vatiaaces'and standard deviations fot the V-, P -,
and full - scale -24's; and coefficients of correlation for V-P., k4S, and .
V4WiiitelligeaCe quotients.
;Muftis' approach to' item- analysis is by ,way ,Of apptoximations to
multiple-linear R. Theoretically the correlation between some Vocabuf ry.
score, say on the Wechsler or the SB -LM, and some other variable, say. , .
the full-scale IQ .on either
Multiple correlation, which
test, can be imprOved,,by some approxiination to
would select items on the basis of high
correlations withhe criterion and low inter -item correlations with the
predicting variable. Multiple correlation itself is as time-consuming
,--- as the approadh mOhtioned first (Ferguson, 1971) to use as an item
13
_et

c.s
selection technique. This -approach is no worse than the first, if a
big computer is available. The chief draw back, is' that its use would
requiiefr;ctional weights to be applied to the items in scoring the
_ 1.
redeveloped4Wcablarly-scales. For examnle, regressidn weight one amount-
t- .
. . ...
of .item one, plug regression weight two times item two...plus-regrAsion.
.,
weight. k times item k, plus an error term. 1While the latter technique-,
'Troltides the best, perhaps, answer to the problemoftredeveloping the. 4
A'Vocabularly.Seales on :the. two major mental tests, it would be impossible
without contracting, with the parent compAnies,:and.even_if. the scales
were redeveloped, it is predicted'that they would seldom be used by test,
administrators in student personnel services Of. the schools. 'Why? Because
those- professionals did not-have that technique pregented to thei by4
'
their psydhometric prof and a level-Tt0b,statistical analysis course
dealing wit multiple-Tegressionmed not required. .4everthelesst serious
.qv
students of individual, mental tests can appreciate the concept of what
t .
regression weights for individual items. for specific ethnic groups means",
and can certainly utilize the findings, :of this report at show-what
. .
the.propOrtidnate value of. each item's contribdtiOn to the total vocab-.
ularly. In the' approach to ite'
m.analYsis used in'this.report, the item-1
vecabularly total covariandes were converted to per cent of the total. .
vocabularly score variance accounted for; and these item per cents are
-4Mnalogoui to multiple-regression weights.
Results. Chicano norms are presented in Table 3 and their, covar-:
iance matrix in Table 4. It must be remembered that0 Chicado Ss that
SpdAk.Spanish astheir major language do not represent all Spanish speak-\
ing people on individuAl, mental tests given in English; however, they
are no doubt very representative )of Chi Ss in the Southwest Desert
I
14
1
rt
S

'Page 9.
ICountry who speak andcomprdhend little, or very little, English on the SB-LM.
The respective per cent 44 the total vocabulary scale's variance
for which. each item accounts is as follows: 1. 3.47 2. 7.56 3. 5.11. . A
.
4. 8.79 5. 9.81-6. 11,86 7. 10:94 8. 5.93 -9. 9,50 10. 8.99 11. 5.52.
12 Z.:55 13. 5.31 14. 3.37 15. 1.43 16:14.63 17. 18,1-0: 19. 1,43'.
.Responses foritem 40 and above were-not included as the ceiling item
reached for-this "group was.item 19. The same reporting procedure for
(INSERT TABLES 3 & 4 ABOUT HERE.()
the item- covariance matrices of the o ther. sub- groups will be maintained_
throughout the remainder of the'result section; that is, the last item
_enterediin each. matrix is the last item scored correct before reaching."die ceiling:-
`Note in -the per tents presented for the.Chicarid Ss-l-whieh of course
are the item total vocabulary -covariance's- proportionate part of the'vtotat
vodabulary'sea variance (0,.which is also the sum of, the matrix)- -that
. they do:not orm- any systematic cur*i.in:regard to magnitude of each re-
apectiVe item's"-per cent of the total 'variance." One would assume that
ihe,firat ttema-should- contribute zero inputs andkthe items toward the
ceiling iteM'should.also contribute zero amounts to the total variance,
=
beeaUse the relative constant of either "all passing" or ':all failing"
P,
is, by definition, pen-variant; hence, the BAR led to. interprete this
finding for the group above as an indication that the Jamie, are.not on
a.,"progreasively-difficult -gradiene.rroreicample, item "8. eyelash".
contributes considerably less than do the,following, supposedly more
'difficult items "9. Marge'-and "10. juggler". And item "16.: haste"
bas a negative covariance, which is followed-by two items with zero
'coliiances, and then unexpectedly item "19. regard"has a positive co-
15

8;
a
variance of 1.43..
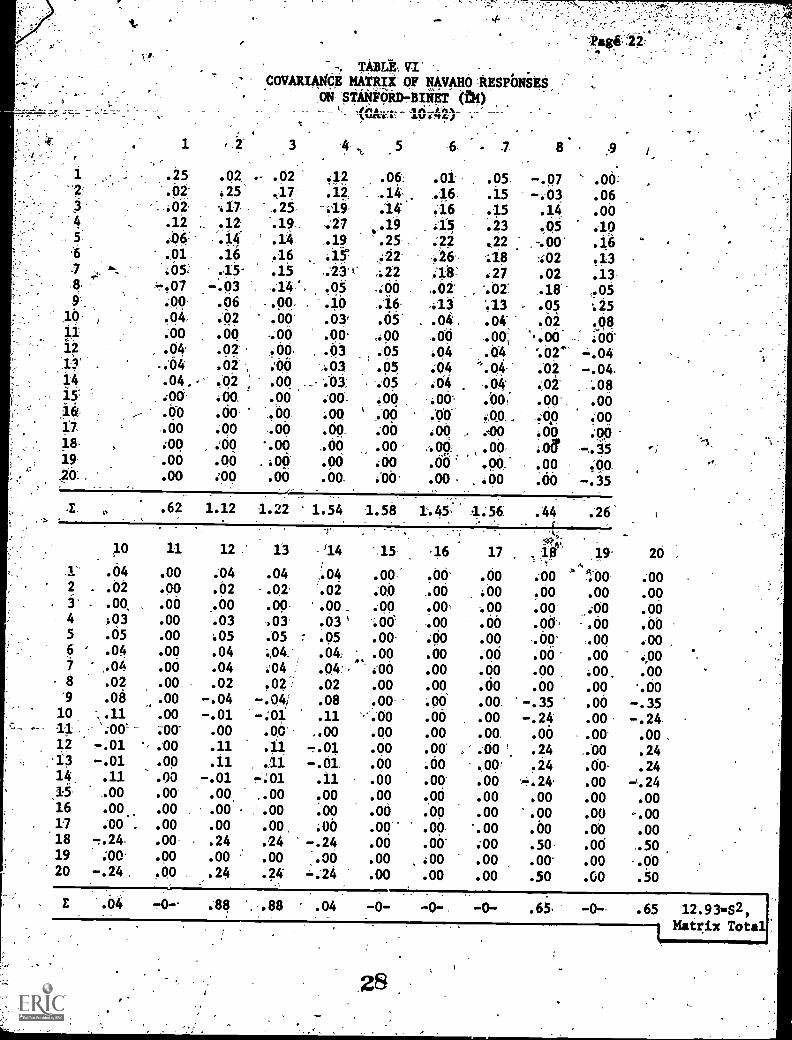
Nsy'ajo norms for Ss with mean. CA of 10.42 (S=1.86) are presented
.in Table'5 and their item - vocabulary total, covariance matrix in Table
4 6 for the SB-LM. The meanIQ (SB-LM) of`this, group is low, but again,
sunder the language handicap, this is. understood; however, these children
are public school Ss and individual, mental test, scores are being used
for special education placement purposes; N =-. 92:
{INSERT TABLES 5 & 6 ABOUT HERE}The respective per ceET761tHe.total SD=1195.rocabulary scale's
variance for which each item accounts,is as followsfor Table 6:
.1. 4.79 2. 8.66 3. 9.43 4. 11.91 5. 12.21 6. 11.21 7. 12.06
'148t 3.40 9. 2.01 10. 0.30 11. -0- 12. 6.80 13. 6.80 14. 0.30
15. -0- 16. -0-' 17. -0- 18. 5.02 19. -0- 20. 5:02. As with the
Chicano group, there is no consistent,' or symetrical, curve . formed.
The sporadic pattern suggests that extreme caution should be used-in
administering the vocabulary section to,bi- and limited-bilingual Ss.
Norms for Apache Ss on the vocabulary scale of the SB-LM (CA=7.37,
& S=1.10) are shown in Table 7; the item-total vocabulary covariance
matri,cin Table 8. The respective per cents for each item's covariance
input-of Table 8 are as follows: 1. 6.97 2.17.05 3. 17.05 4. 17.05
5. 13.17 6. 17.05 7. -0- 8. 1.16. These covariances are not as in-.
consistent as the two group above;-however the CA is lower and less
variance is expected. There are unexpected_ reversals of levels of
difficulty as indicated by items "5." vs. "6." and "7." vs. "8."{INSERT TABLES 7 & 8 ABOUT HERE}
The SB-LM norms for Apache Ss, CA=9.8 (S=1.76), on the vocabulary
scale are seen in Table 9, an the corresponding item-covariance per
cents in Table 10. The respective per cents of Table 10 are: 1. 3.77
2. 17.92 3. 11.94 4. 8.17 5. 14.15 6.. 9.11 7. 9.43 8. 12.89
9. 6.60 10. -0- 11. 5.97. The N for this group of Ss was 113. The
16

same general result is found with this group; namely, no systematic
level-of-difficulty gradient as can be seen with item "8." vs. items
"6." and/or "7 ", `or item 10.vs.' 11".
'{INSERT-TABLES. 9 & 10 -ABOUT HERE}Notrus on the SB-Ia for 106 Ss, called Indian T, on the vocabulary
Scale a.e shden in table 11; the covariance matrix follows-in Table 12.
The.mean CA was 9195 and the standard deviation 1.75. The per cent of the
variance for which each item accounted is as follows: 1. 2.35 2. 6.45
3. 12.14 4. 13.67 5. 9.92 6. 9.09 7. 9.99 8. 4.09 9: 9.71 10. 9.99
11. 4.30 12. -0- 13. 2.84 14. 2.56 15 -0- 16. -0- 17.2.84. Item
"8. eyelash" again shows up accounting for a small .per cent of the total
variance of the vocabu/ary, scale; especially, when compared with items
"6." and "7.",, and the immediate items following, "9." and ".10 ". Items
"15:." and "16.", with zero input, appear out of place also, compared with
the relative magnitudes of the per cents surrounding them.
{INSERT TABLES & 12 ABOUT HERBY
Johnson - O'Malley. Indian (P.L. 874 defined 'Indian' as one-fourth)
mans for the-vocabulary section of' the WISC are presented in Table 13.
Themeart 0A'for this group was 7.80;"the S was 1.89. The performance
.IQ. wag considerably higher than the verbal IQ. This pattern was noted
in the review of the literature as a common finding among "English
,deprived" Ss. Table 14 is the respective item-total voclabulary covari-
ance matrix. The per dent of the variance for which each item accounted
5
was: 1. 3.47' 2.. 7.56W 3. 5.11 4. 8.79 5. 9.81 6-11186 7. 10.94_!.
.8. 5.93 9. 9.50 10. 8.99' 11. 5.52 12. 2.55 .13. 5.31' 14. 3.37
15. 1.43 16. -1.63 17. -0- 18. -0- 19 1.43. IteE "8." and items
"12." and "17,".and "18." appear to be relatively poOr compared with
items surrounding. them. Apparently this group know more about "nails"
17

and "fur" thadthey do about "donkey". And the also know more about
"nitroglycerine" (item 19,), than they do about Aero", and, '.'- gamble (items
. ti17. and 18.). The same inference. can -'be drawn oOncerting "spade" (item
12.) vs. "join" and "sword" (items 11.:;and 130..
{INSERT TABLES 13'& 14' ABOUT HERO'
Johnson-O'Malley Indian norms on the WISC for Ss age;10 (mean C4=10.4; ,
s=2.06) are shomOn Table 15; the covariance Matrix for_ the vocabularly
Table 161, The same relative high P -IQ Vs 1.774Q holds for this,1
tgroUp of 130 Ss also. The individual item per cents were: 1.. 2.74
2. 1".32 3. 1.97 Yf. 3.31 5. 2.56 t. 7:-3.79 81: 4.89 1. 9.07
10. 6.49 11. 7.78 12. 5.34 13: 5,50 14. 1,12' 15. 7..30 16. 3.81
17. 5:04 18. 4.17' 19. 2.16. 20. 3,30 :21: -07, -22. 4'.37 23. -0=
24. -0- 25. 3.38. These per cents-do not follow a systematic gradient
of difficulty. either. Note that 'sword"-and "btave account for more
of the vocabulary. variance than the item they sandwich, "nuisance".
Other items that probably depict the lack of extra-cultural interaction
are "shilling" (item 21.) with zero input, an4 also "belfry" and
"espionage" (items 23. & 24.); however, item "25." (stanza) follows with-
a per cent input of 3..38%
{INSERT TABLES.15 & 16 ABOUT HERE)
Norms for Johnson -O'Malley Ss (N=106) a=11.64 & S=1.74) on the
WISC are shown in Table 17 and the accompanying itemrtotal,vocabulary,
covariance, matrix in:Table 18. The is significantly higher than
the VrIQ for thee Ss alio.
The indAridual item per cents of the total vocabulary variance
were: 1. 0.61 2. -0- 3. 0.79 4. 2.99 5. 1.26 6. 8.20 7. 4.51
/ 018'-I

8. 2.36 9. 7.33 10. 6.51 11. 6.76 12. 4.56- 13. 5.94 14. 3.19
15. 5.61 16. 7.51 17. 7.58 18. 6.13 19..3.86 20. 5.42 21. 2.23
22. "2.02 23. -0- 24: 1.13 25. 3.40. The relatively small per cents
for the initial items are to be expected as nearly all Ss pass those
items; consequently, a relativel constant gives no variance, thus no
covariance either. Item "8." (donkey) again appears out of order,
as does item "23." ,(belfry) with its zero input. The lattet, when
compared, with a supposedly more difficult word, "stanza" (item 25),
appears to be a consistent findihg.
{INSERT TABLES 17 & 18 ABOUT HERE} NWISC norms for Johnson-0 0Malley Indian Ss.7=g5,CA=13.4, & 5 014)-
are presented inlable 19. Typical of pastnorms reported for Indian Ss,
the P -IQ is significantly higher than the V-IQ. The r between the P-IQ's
and the FS -IQ's is 0.85, which is considerably higher than tO V-FS r of
.73 of the Vi-P r of 0.37. However, these WISC, inter-IQ r's have not
been found consistently in other Ihdian age groups.
The individual item-totaljvocabulary variance per cents from the
covariance matrix of Table 20 were: 1. 2.00 2. 0.31 3. 0.96 4. 3.67
5. 2.00 6. 8.84 7. 2.31 8. 1.83 9. 6,36 10. 7.78, 11. 5.09 12. 6.67
13. 1.60 14. 5.93 15. 6:99 16. 6.25 17. 8.85 18. 7.47 19. 3.00
20.. 5.23 21. 2.60 22. 2.77 23. -0- 24. 4.13 25. -0- 26. -0-
27. -2.87. Item "23." (belfry) bombs, out again and item "27." (spangle)
has a negative covariance. The latter finding means that there was a
tendency, but not a great one, for the higher scoring Ss to pail the item,
and the lower scoring Ss to pass the item. Certainly, negative covariances
4are. worse` than zero covariances and even a classroom teacher would know
enough about,item analysis to "dump" the negative and zero input items.
'(INSERT TABLES 19 & 20 ABOUT HERE}

''Page 14
The WISC norms for the last,-group of Ss, 62 Johnson- O'Malley Indians
.(4=15.84 S.q.04),, are shown in Table 21. As with the othei-WISC norms
presented for Indian Ss in .this study, the P-IQ is significantly higher
than the V-IQ.. The individual item-total vocabulary covariances, converted
to per cents of the' total variance of the vocabulary scale, were: 1. -0,-
2. -0- 3. -0- 4. 2.17 5. 1.07 6. 4.93 7. 7.32 8. 3.58 9. 8.41
10. 8.37 11. 7.80 12. -0- 13. 10.43 14. -0- 15. 10.90 16. 0-
17. 13.15 18. 11.24 19. 6.47 20 8.35 21. -0- 22. -4.23. No vari-
ance is accounted for by items "1.-3." 11:%:ause all Ss ',Resod-. those rela-
tively easy items; the same finding for item "12." (spade). Item "14."
(nuisance) shows zero contribution to the variance of the vocabulary scale
also, but this time because all Ss failed the item. Items "16." and "21.'"
(nonsense and shilling) made no'input either. This is a :consistent findin0
for Indian Spon the WISC vocabulary apparentii; at least for Ss with .
limited English backgrounds. Unexpectedly, this older group Of Ss shows
a negative covariance for item "22." (fable),. which was also the ceiling.
No consistent level-of-difficulty'gradient can be observed with this. -i-----
group either.
Discussion
-
Overview While the Stanford -Binet remains the standard instrument
for intelligence testing with young children, it is lesp,frequently used4
today in testing Chicano and Amerindian Ss; and with the WPPSI rWTSCand
the recent WISC-R, and WAIS available the Standford-Einet should- probably
r.
not be used at all with Ss who have limited English language backgrounds.
.At least the-Performance IQ from the .Wechsler series is less culturally
biased than the SB -LM, eand the differential between th V-IQ and the P-IQ
.20

is, no doubt, primarily an .indication of ignorance ---or lack of knowledge--
rather than lack of intelligence. The major problem of both the vocab-
ulary scales involved is that the items from the scalei preauppose. a
particular background of experience. Is a "culture-fair" teat the answer?
No, because therecannot tealiy'be a "culture-fair" test as no individual is
.cultute-free. His performance will always be affected by his background
and experience, no matter what the nature of the test. More important
for the ethnic groups of this report would be culture-fair "interpretations".
The results of this study offet a possible solution by showing how the
internal consistencies-of the vocabulary scales for specific groups :an
be improved. with item analysis techniques; namely, the coVariance-matrix
method.fOr determing weak items. This method deals with all Ss of a
sample rather than some uppei and lower fraction Of the group (for a USAFE
itei,analysis that would be the upper, and the lower, 27 per cent) and
cOmbelleS the dual criteria of level-of-difficuity and discriminatory index,
orvcaPa.Fity,into a single indew--ih%item-total test (vocabulary scale)
covariance. The problem of improving the internal consistencies 6f tests
appears to have a simple, solution via item - analysis, covariance matrix,
or even multiple-regression, methods. But.there is a rub. Test companies
are resistent to change, even though their mission is to construct tests
to capture maximum variability. Specific norms for every ethnic group
and frequent revisions are costly. Nevertheless, the covariance - matrix
method could, and should, be used more frequently thamii..currently is.
Particulary with the major ethnic groups in the U.S. Merely including a
potportionate number of, say, Blacks, Chicanos, Amerindians or Welshmen
in the standardization population looks very fair; but do you "reckon"
that a Navajo Reservation Indian child, in his "right mind", would. alk
o the next trading post for a loaf of bread if the local had none(?).
21

And even if the local had bread, or-More probable, flur.,do you suppose
the child would use "shillings" for Payment? Or would he just make a
"nuisance" of himself by trying to pawn some of the family's turquoise.
Yes, the WASP E speak with forked-facetiae; but well-intended for the
ethnic groups of this report.
The cost of specifillorms for specific groups would noi'-be as
prohibitive as saving-face for most test companies. Annual norms could
be provided and sold to specific groups; surely,, at a profit.
General considerations. The item-total vocabulary covariances provided
in this report can serve as a single Index "worth'. This-index is the
contribution of the individual item to the variance of the scalcores.
The presumption herd is that in the construction, or re-constructforr, of
tests we wish, as it were, to acquire or capture variance. An item-that
contributes more to the total variance is presumed tobe a "better" item
than one that contributes less. This report has listed several vocabulary
items for specific reference groups that contribute very little, and
often, in a negative direction, to the variance Of the two vocabulary
scales studies.
Many of the findings defy explanation when age, or tribal, groups
are compared. But shoe manufacturers know, as do test construction
companies, that no shoe, mass produced, fits as well as a moccasin or Spanish
boot that has been handmade in scale with the foot of the wearer.
Item analysis is not the answer to culture-fair tests.
Epilogue
Bilingual programs for Chicano children are being developed in at
least 15 states besides Texas for students who speak primarily Spanish
(SEDL, 211 E. 7th St., Austin, Tex. 78701). Bilingual kindergarten pro-
.-, grams for Amerindian children should also be deireloped and NIE is. funding.
1
22

U.F r
4 r.
;Fate':
TABLE:
Test- Retest Correlations and Standard Errors.ofMeasurement for Form I
158)
-
Subtests Correlations SE meas.,
-InformationComprehensidm
.86
,.74,68,
1.21'.
DigitSpan ; , .67 1.68Arithmetic ,.62 24064milaritieS-. .71 ' 1;22'Vocabulary :88 .73Picture Arrangement. ".64 1.82Ficture Completion .83 .95Block Design .84 1.10Object Assembly. .69 1.31Digit.Symbal'' .80 1.06'Verbal IQ' .84 : 3.96liOnverbal IQ .86 .4.49Full -Scale pq .90 3.29
Source: G.F. Derner et al. .0
23

TABLE II
Correlations of school marks withWechsler scores:
*4
High school Co114e
information 0.54 0.48 ..
Comprehension.% 0.55 0.33Arithmetid 0.45 ' 0.19Similarities 0.50 0.39Digit'Span '0.37 0.04
'`Vocabulary 0.65 0.46
TigitSymbol 0.34 0.15Picture Completion 0.33 0.20nook:Design 0.9 0.19Pciture Arrangement 0.22. 0.07Object Assembly 0.17 0.12
..
11erbal '063 '0.47rerformance 0.43 '0.24
"Tnll'Scale 0.62 0.44,
Source: Conry & Plant, 1965:
24

H
IQ
TABLE. IIICHICANO NOR* psroNsEs OF
STANFORD-snizz 'MO CA: 10.23 .
MEAN VARIANCE: ,ST4 'BEV.
10:23' 5.7 2.40
7.2 . 2.81 1.68
73.51 133.84 -- 17
4
COEFFICIENTS OF CORRELATION
:CA and
/4,A,
anct4,4
CA and IQ'
1,
0.42
-0:33 "
I
:"
/ft

r :
Page- 20
TABLE IV .
` COVARIANCE MATRIX OF CHICANO -RESPONSESON STANFORD-4±NET .010...
(CA.. : . 10.23)
2 '3 - 4- 6 7. 8 9 10. -. .
1 .07 .04 '',.01. % : .03' .05 .05 .06 .02 .00, -.02 -.04 .11 :09 - 4,09 .08-:- ..6 , .09 .07 . .04 - .03I.,- .01 . :op' :13 .'pr%i - .04 -.,67; .09 .05 .02 .01'4 .03 ..09, ,, .06 421 .-.09--. .Q-,. :08, .07 .04
0*5 :05 .08. k;'4- 04- .09- , .25 .10 .09 _4(:14 .03 .066 .05 a '4'07 -05 .10 -.24 .10- .Q8 .10 .087 .06 .09 .a., .08 .09. .3,o -.2.3.c .04- .07 . .06t 402 '',, .07 ' 405' ''' .04 .04 .08 .--.08 - .16z: .os . .01 a9 .00 , .04.; .02 .07 --. .03 ,-,*.10, = .o7'' .08 .26 .08
16:' -.03 c.,0 ..03 .01 .04- :06' .-.08- .06: ';-' .014, .08' ,.2511 - :01 . .01 .02 .01 4.04 .07. . ...04- ..00 .03 :09-12. .00 %01 '.01 ..-02- :bo, :01- .. .02 -.02 , .01 .05 .13'Ir -'-.01t); .00, .02- .136+ .02c ,,:-01 ., 0.0, '' -01 .09 .0814 :01 `', .00 --%06 .9.4 '',. : .06 .04 6 10i C 402' .06 .0115 . .01 .00 -.07 /y02 -.02 ..02 ..-0. ' .01 .02 .0316 .00 '. .00 ...00 -44,'..,,,,`'.:01 .ior ,. ;pi. ---.,06 -.05 .0117 .00 ' .00 , '0 .00 -.60 :,..00 .. ,.00 ._-'7.66 .00 .00 .00
.--18 . .00 .00 .00 400 -'6', ,-40,0, .00- .00 1,00 :00 .00-19 .00 :007, ,.01 .01 - ,' 161 .61. .00 % .01 .02 .02
-v-.741 .50 . .96 1.16 1.07 .58 91 88
12 13 1S 16- 17- 18 19
1 ,c)o .oi ' .00 .66-2 .01 0101 .00 .00° .00, .00 .00 .00 ,- .003 .02 -.06 -=.07 .00 .00 : .00 .01'4 .Q1 :02 :06 .04 .02 -1...06 .00 .bo .615 .04 , .00 .02 .06 -.02 .01 -.00 .00 .026. .07. .03 .04 .02 .00 %, .00 .017. .04 .02 .03 .03 .01 .01 40* .00 .008 ..00 -.02 -.01 .02 - .01. . . ; -.00 .019 .03 .41 ..09 .06 .02 -.05 . .00 .00
10 .Q9 0.05 .08 .01 .01 .00 .00 .0211 . .17 .0 ..04 .02 . -.02 .00 .00 -.0212 i.04 :09 .04 -.02 -.01 -.01 .00 .00 -.0113 '.`-:04 .19. -.05 .02 -.02 .00 .00 -.03
-.01 .15 .02 ;-.01; -.00 .0415 .02 -.01 ..02 .08. -.01 .00 .0016 -.02 . -:01 -.01 -.05 .00 -40017 .00 .00 .60, .00 .00 ..00 .00 .0018 .00; .00 .00- . .00 .00 ; .00. .00 .00 .0019 -.02 --AI -.03 .04 -.01. -.01 .00 .00 , .08
E .54 .25 .52 .33 .14 -.16 -r . .14
26.
4
9.78..04Matrix Total

-440rNAVAHO =110RHS ,EsPoNgEgoir
s1 ar9RD-BAINNr 11109, '4: 10.42
MEAN ya.wilews. s*:. :pp.,ck 10.42' 3.,4- iiw.)(k ,- 5.78. 3;4 -1;017.:.IQ: , .$1946'' ' 105.48 ' 1441
, .
COEFFICIENTS OF 'dOltRELATION-
cAHinci 114: 044
!NA '.1* .0.90
tr4i., /Q -0.06
Z34
-. 5
6
.7 ,
:8- -.''
9',
10- i
412'
1114I.S
1it,
ii18-
19-
.20.
,z,,,.
10
1" .04
2 . .02
J. - .00,
, 4 :035 .05
6 ' .04
7 .048 .02
9 .08
10 -,.11
12 ,.01:13 -.0114 .1115' .0016 .00,17 .00 .
18 -.24.
19 .00
20 -.24.
E
olEs sif
-Page 21:
1
TABLE, VI
COVARIAHOH- MATRIX' OF 'NAVAHO :RESPONSES
ON 'stitiftc#,BIrirr (0!)
Alarm. r.
3 -4 5 -6. .7- 8'
.25 .02 .- .02 .12 .06: .01- .05. -.07 .00:
.02 425' .17- .12 . .14, .16, .15 -.03 .06..02'' 117,, ..25- -.19' .14 .16 .15 .14 .00'.12 .1 -.19- ,27 .19 .:0 .23 .05 .10.06: -.4 _' .14. .19 '.25-- .22 ,22 : ,-.00" .16&al, .16 .16 .15' , .22* .26- .18 AZ .13
':05*,- .15- .15 .211' ,'.21 :I.& .27 .02, .13-.!..07 -.01 . 414. .05 .06 . ..62- .02 .18- .05:pa .06 ..00. -.10 A6- .13 :13 .05 :25.04. .62 .00 .61, .65' . .04. . .04' .02 .08.00 .00 400 .00° .0 .0 .00; %.06" -.: :oil
, .04 .02 ..90 , -.03 :05 .04 .04 .02* -.04.:04 .02-, gl,o -Al .05 .04 -44.. .02 -.04..04 , . ,02 .00 ;03: 405 .04 .04-, 02- ,_;.0,0
,:o0- Jo!), .00 -.ao, .00, -ioo, .to, .00' . .00.60 .60 loo :oo ' Ao .00- 41. 49 :60.0 .00 .0 .0. .00 AO , AO- .00 .00.00 .ao '.00 .00 .00 ...00, ,.06- :off -,.jS
-.00 .06 .:00 .00 .00 .66. .0: .00 ioo.00 .00 .00 .00.
.
:66' .00, . .00 .00 -.15
.62 1.12 1.22 1.54 1.58 1.45' 1:56 .44 .26'- (1-
11 12.' 13 -14 '.15, 16 17 slit- 19- 20
.00 .04 .04 04 .00- .00 .00 .00 !'.-6a .00
.00 .02 -.02- 1.02 .00 :00 .00 .00 .00
.00 .00, '.00 .00 .00, .00, .00' .00
.00 .03 .01 .01' ..00 .00 .00 .06-, -.60
.00 .05 .05 7 .05 .00- .00 .00 .06- .00 .00
.00 .04 .04: .00A, ,
.00 .00 .00- .00 600.00 .04 604 .0,4- .00 .00 .60. .00 ioo. .00.00 .02 .027 .02 .00 .00 .00 .00 .06.00 -.04 ,.041 .08 .00- .00 .00. '-.35 .00 -.35.00 -.01 -.01 .11 '''100 .00 .00 -.24 .00. -.24.00 .00' ,00 .00 .00 .00. .00 .00' .00.00 .11 .11 -.01 .00 .00 A'.00' .24 AO .24.00 .11 1 -.01. .00 .00 -.0- .24 .60- .24.00 -.01 T-101 .11 .00 .00 .00 -,5.24 .00 -i.24.00' .00 ,.00 .00 .00 .00 .00 .00 .00 .00.00 .00 - :.00 .00 .00 .00 .00 '.00 .00 -.00.00 .00 .00, :06 .00- .00 '.00 .00 .00 .00.00- .24 24 -.24 .00 .06- .00 .50 .00 .50.00 .00 .00 :.0 .00 :oo .00 .00- -.00.00 .24 .24 =-.24 .00 .00 .00 .50 .GO .50
.88 .04 -0- -0-, -0- .65.- -0- .65 12.93=S2,Matrix Tot*
28

TABLE VIIAPACHE NORMS- EESPONES'
E.TANECED=..EIMET' (1.1.1)
.C.).
144
-A:
MEAN- VARIANCE .ST". DEV.
-7'.37; , 1.20 1..10
4.92' 2.6'3 1.62'
62:78- -615:63 24.811
CAEFFICIEPTIE OF 'CORRELATION
CA
Mk 404 IQ
CtS aaci.
o0.87
0..05
:TABLE VIIIco#ARIANd4 MATRIX` APACWZ `RESPONSES
t)*
(cA:4; 7447).
.'36 -.88 86,
1. 2.. 4 6
1 .14 , .05 .05- -.02 :OS2 .0$ .24- -.07- .2' 44 t3 ;:05 .07 .24 .24 .1:24 -XS .07 .24 .24 .12" :075 .02. 12 .12, .12 -.14 .12.6- .05 44 .07 ...12 .247 .60, ,oo. ,.Oo .00 .00,8 .00 -.09- 09., .09 ..04 _49
.88 .68 .88
7 8:
oo .00
.00. .09
:00: .09
.00 .09
.60- .04
.00 .09
.00
.20
3.16S2,
Matrix Total

:TABLE,AUCNE 'NORMS RESPONSES OF'
t:StANFORD4:130 CA': 9.8
MEAN`
9.80
CA:-.44.144
14 and IQ-
CA And IQ
TABLE XCOVARIANCE MATRIX, .00- APACHE -NESPONSES
-4Iiii#914)714Nei (14)(CA: 9:8)
1 3
-.04 .26 .07 :013, -.02 .123-'4 . .02 ..01 .125- 41 . .03 .02
-.01 .05 :05.7", -.:04 .03 .02 ,Or.8 .03; ..10 -.05 .03 .009 =-..0,1 .04 .04
10' :00' .00 .00 .0011 .0.1 . .01.
4 5
:02 .01.07 .01:03.02
.0002
.12 -.57 , .38 .28' :45'
;,.
'6 ' 7
.01
8
.039.
7..01.04 .10 .03,
.05 :03 -.05 .04
.04 .02' .03 -.02
.05, . "01. :00 .04
.12 .02 :02.02 .08 :04 .02
.00 .04 .25 -.00.
.00. .00:03 .03
.29 .30
30
-.00 .14.00 .00.0 -.01
.41 .21
10 11
.00 .01.00 .02.00 .01..00 .03:00 .02.00 ..03.00 .03.00 .01.00 -.01.00 .00
..00 , .04
-0- .19 3.18,,S2,
Matrix Total

TABLE-XICALL INDIAN-NOWRESPONSES OF
sTANg00,140gt 1140, 0.95
MEAN. VARIANCE -ST. gr.CA 9.95 3.08 1.75
6.69 2-.26
IQ. 17849' 13.35,
COEFFICIENTS OF CORRELATION
0.41
NA .and. IQ -0.7;
'-CA 1120 IQ'
31

TABLE XIICOVARIANCE MATRIX' OF CALL INDIAN RESPONSES
..ON STANFORDrBINET(0A: 9.95).
1 2- 3. . 4 . -5 6 8'
..09 .07 .05 ,05 .03 ;oi_ .0- .00:07- .22, ..16. .14= .08 44, .i2 .00-
.05 46 .27- .23' c14 .23. ;13- . .12
.05 .14 .23- ..27 .1 47: .2i .095, ,.03 .08 .14 .16 . 422. .06- .12. ,056 , -,05. .14 .23 .17 .06 .27, :08 --.09.
..7 . .,00 .12 .13 ;21 414 :08 : 25 .12S' .. .00 .op .12 .09, .05 109, - ..12, .12ss .00 .00, .16 .25 .12 .08 .16. :op'
10 ,op, .06, .11 _.-,20 ;19= .04- .13 2.00'1..1, .00 .00 .01.
.05- .0 As, .03, .00'
12,, :00 .00 vrO: .00 .00 .00 ,
13 .po .:00 ,07 410 AO' -.08', ;40, . .00.
'Ili .00 .00 .03. .05 .08' .41mc :03/ 40\ 15 . .00, .00 .00-- .00 .00. ;00 .00.,- ,00.\ 16 .00 .00 Too .00 .00 .00. ' :00" .00.-17' .00 400 .00 .00 .08, A9 .00' .00
.93 .75
\9 10 11
.00 ,.po
2 .00 .00 .00
3 .16 .13 .034 ;2 .20 .05
5 .12 .19 .08
.,6' .08 .03 .05,
7 .16 .13 .038, :06 .00 .00
'9 .24 .19 .05
10 .19 .29 .07
11 ,05 .0.7 .14
_12 .00 .00 .00
13 . .10 ,14. -.0514' .05 .07 .-.02
li .00 .00 .00
16 :00, .00 .00,
17 ,OD, .00 .19
E 1.40' 1.44 .62
1.97 1;437 131 1.44 .59
12" 13 '14 -15, 16' 17
.00 .00: .00 .oa .00 .00
.00 .00- .00 .00 .00-
.00- .07 .03 .00 .00- .00
.00 ;10- .05, .00 .00 .00
.00 .02- .08 .00 .00 :0
.00 -.08 .05 .00 .00 .09
.00
.00
.0t.00
.0j.00
,00.00
.00
.00
.00
.00.00 .10 .05 .00 .00 .00,00 .14 .07 .00 100 .00.00 -.05. -.02 .00 .00. .19.00 .00 ,00 , .00 .00 .00io .24. -.05 .00- .00 -.14.00 -.05 414 .00 ;00 -.06.00 .00 .00 .00 .00 .00.00. .00 .00 .00 .00.00, r.414 -.06 .00 .00 .25
.41 .37 -0- .41 14.41S2
32
Matrix Total

a
V.
TABLE XIII-JOINSON-6 'MALEY INDIAN'WRNS 'RESPONSES
(Ages "0, i8, --i-'9),
MEAN VARIANCE DEV.
71.18 ;80:52l! -230.28' 15;44''80.63 15.48
COEFFICIENTS OF CORRELATION
V. and P. 0.58
P. and 2S.. 0.87
V. and FS. 0.90
33

..TABLE XIVCOVARIANCE MATRIX OF
Tata- 26,.-!
.
1
JOHNSON-0
2 3
Ill',
4
14IAN,REVIINSES ON
"9=cli
5' 6", 7 -8- 9, 10, .
1 2T ,;12 .29 .03 .10 .11 .19" -.022 -.27 .52: :41 .26, .40 ..09 .05 ..073. .45 .A1 .59 :32 Ai 36 .11 -.94, .12 -.69.4' ,3g- 1:00 .58 46. :22 .14 .36 . .275- '.29 JO .36 .58 .93 .26 .29 .31 :5 .24-
.6' 4.03' .09 .11. -.26 :26 .58 :22- .02 ,23 .12:10 --.04 .22 .29' r 74 .22 .14' 09
8' .12 .10 -.09 .14 .51 .02 .22 ;55. :-.02 .11.9 .08 :12 :36 .2-5 ..23 -:14 -.02 -.72: .44
10 .02 .07 =.09- .27- .24 .12 .09 .11 .44 :6611 ..18 .67' .11 .4-1 .24 45 .44 .02 .37 .46.12 .02 .03 ,104 .06. .06- ..05 .07 .0713 .27 -.13- .20 ":35 .15 .13 -.pp .25-- .1114 .02 .00 .61 .04 .02 ..10 .1115 .21 .-00- .20 -.41- .04 .20 .14 .14 .16 .1616 :06 .66 .0 .00- .06 .09 -:02 .08 .03- :1517 .00- .00 .00' .-.44 .04 .29 -=.2218 09 ,op .00° .05- .0419 .00 .00 .00, r .Q6 .03 -.1420 .00 .00- .00- -.05- .-10 .13. '.03- -.05 -.0821 . 00_ .00 ..00 .12 :00 .00 -.22 ..09 .06
5.23 2.47 2.69' 4:99 4.85 .2.902.78 2.19. 3.44 3.30
11
1 .18
.2 -.073 -.1141 .4151 .24
-6 .157 , .24,
.8 .02'9' ..37
10 .4611 .6612 .06,11 .44
12. -13
.Q4,02.03
-.04. .06
..06--.07.05.07.07.06:26.01
14 .0015 i.43 :0716 "''.13 -.0217 1 .08 -.03.18' .07 =.0119 .16
20 ,-=';'.03 -4021 -.03
:27.13
,.20.35.15.13.15
-.00.25
11.24.01.75
..08.39.16.05.08-
r..06.31.15
.-
14 15 16 17 16: 19 '20 21:02 ..21 .00 .00 :00 .00 .00 .00-:00, .00 ! .00- AO .,00 .00 .00 ,00
,00. .00 .00' .00- .00- .00.09 -.18 .05' -.06, -.05- -.42
.62 .04 .06 .21 .03 .10- . .00?,.04 .20 .09 .04 .04 .17 .14 .00-.04 .14 -.02 .39 -.01 .66 .13 -.22
.Q3 .14 .08 .29 .04 .05 .03 .09'
.10 ,16 .03 -.22 .02 .14 =.05.11 .16 ..-15 -.02 .09' .15 -.08 .1-7.-02 .43 .13 .08 ..07 .12 -.03 .04.00 .07 -.02 -.03 -.01 .16 -.08- -.03;08 .39 .16 .05 .08 -.06. .31 .15.17 .08 .17 ,;06 .09 -.01 -.04 .22.08 .79 .16 .10 .08 .08 . .13.17 .16 .36 .07 .19 -.02 .13 .35
-.06 .10- .07- .87" .04 .03 '.28 -.11.09- 108. .19 .'..04 .09 -.01 ..07 .18
,-,01 .08 -.02 '.03 -.01 .22 -.05 -.04-.04 .01 .13 .28 .07 -.05- .51 .02
.22 .13 .35 -.11 ".18 -.04' .02 .39
.01 .20.04 .41
4.07- .68 3.81 .97 3.98 '2.16 1.83 1.13 1.08 1.35 1.52
3455.42$-S2,Matrix Total

TABLE XV '.
, JOHNSONieMALLEtINDIAN-low' RESPONSES` orwisc ,
-(Age .1.4 .,
\ 4 **\\ ''
MEAN` VARIANCE ST.-"DEV-. \
V. 75.69 231.40' 15.21.P. 95.17 19.97 , 14.00P$. 81:49 194.38. , 13:14
".1".
COEFFICIENTS OF CORRELATION
V. and T. 0.'47
P. and FS'. 0.83 ,
V. and 'P$. 0.88
4.
as

6-,78'
,
'4411-12131415
'161.7-
- 18
1920'21
22
232415
TABLE XVI3/-
.COVARIANCE`MATRIX OF"..TOHNSON-01.14A.I.LEY INDIAN: gE6porisEs: ON wr.sq
Op 10
1 2 3 4 5 7 8 9- 10, 11 12 , 13
.10 .20 . 4.15 .27 .17 .15 .19 .10 .07- ..0611. - 12 .11 .11 . 1i *05- .09' .10 .05 .06 .03 .09
:11.20'.1I
.23
.09.:09
.43
.10
.08; .20
05
".30 .34' .15 .19
.14.03 .16
.10 .08 .33 5 .14 .11 .36 .13 -.22. .09 .14.15 05.27.-. .09-
.1:7- :10
.10"
.05
:14
4.20-
.. 30.,34
15%1'47,>,
.11
.93,
.37
.34
.37
.73'
.23
.34
g3.-49 '
.73
.33;
.27
.41
.19
.24
.162
:36,48:-
.42
-4 06
.33
.15 .05_ .1 ,.15 .15 ..;73- 33' ..79 ;44 59 .44 '.39:19 .06 .13 19 43- .19 "24 .36: .22 33.10 .07., 67 .03.06 .09'.62 .01
.14
-.00.12
.17-
.03,
.16
.02
. 09 ?'
.14,
.02
62
. 42
.33
.04
.35.
.09'
.34
.04
_ 38,:06,.15'.01
.59.41
39.04:
.36:22
.31 .-
.06
1124
46,.02.
.24.. 63:3..66
.36
.30
. 6806
.12. .00 .10 -.12" ,.12 .63 .25 .08' :72 ,..36- .57 31 .24
.05 ..op
.07. :00:05.00 .00
.04
.06,
.04
.00
.05
. 08,
.05
.07'
.05
.07
. 05
.00
:3'6.52
.33
.28
.19
.20
-.11-.27
-.18-
:23
.15 ,
.01
.35
43-. 25.30 z
.28"-
14.13
.04
.32'
,,29'
.17
.07.
.04
1 .18
.29
.13
.17
.20
:05.0000
..-zo '.00
.00
.00
.00
.01
.00
.69
.00,
.00
.00
. 26
.00.
.28"
-. 09-.00
.1; . 33.00.16
.47:
.00
.29
16
.00,.33
.00
.23
.25
.00,:06
.00.25
.06. .'00 :00 . 00' .00 .00' . 00 .00 . 00 .00 .00 .00
.60 . 00
.00 :00.00 .00
. 08.00.00
00221, .
-.00-.10
. 00
.12
.00
..00.24
.00..15"
.00
.39
.00
.23
2.30 1.11 1.66 2.78 2.15. '7.71 3.18 4.11 7.61 5.45 6.53 4.48 4.62
J

144.' ,
1.' .02 .12
2 '100-
3 40''4 :02
5. .oi .1g
6' :04 .637 258 .131,:n 08
91 04;;.72 :35.06 .28
12 .08 .31.;. .04-13' .06 .24 .
.09 .03 -10315. .03 85 28'
16 '.28; .40
17 04- .32
18 '47 .10. .25 ..;.19,
.26 .. 04 .0O.
211 .00 ,'.00'22 :26- .27.23. .GO" 00 .0024 .00 .. 00 .0025 .67 .17 .01
TABLE MICOVARIANCE 3.1ATRIE OP
jONNSONf01MALLEY INGIAN:.EBSPONSES ON .WISC10Y
16 13 18', 19- 20 21 22 25
.35. 07- 05.; 00. . 00 . 00 .00 k, :00' :00' .00
.00 06 .66. .00 ..66 .00. .06 .00 430
94 :06 .00 -.00 .00 .,00 x,00 -.00: .00..05 . 08 .05 .07- .01 ..- 00 09 .: 00 . .00 .08'
.07 '.05 .00 00 :00' .00- .00 :00 .00
.36 .52 .33 :28 .26, .00: .28 :00 .00 .21
.19 .,20 -.11 -.27 .00' -.33 .0O .00 -.i0-..18 .23 .15 .61 .15 00 .005 - :00- .12
.'43. .25 .30- .47 .00 . .69 :00 .21
.14 .13 .04; .16 .00 .33 :00-- .00
.29 ..1:7 .07 .40- 40 00' .15
.18 .25' .-29 .00 .39 .
.17 .. 20 . 05 -.16 .00 too. .0o .23
-.64 .11 .12 .00
-40- .17 ,25` :46 '.00 :26 .00 .00
.32., .10 -.19 .00 .27 .00 .00- .01
.57' .34- .04 .27 '00 00'
.34 , 51. . 22.702 .00 44: .00 ..00, .07
-.04 22 06 , 25 .00: .00 .04
-.04. ;;-.30- .79 .06. 14 :oo :60 .31.. .00 ,460 .00. :00 :00. .00 ;.00-
.27'" .44 ". 14 .00. .80 .00 .00 1 .04
.00 .00 to .00 .66 .00.. .00
.400 .00- .00 .00 .00 .00 .00 .00 :00
.03 ..67 :04 .31 .00 '.04 .00 , .00
..94 6.13 3.20 4.23 3.50 2.49 3.19 -0- 3. 67 2.84
37
83.88_82,,Matrix Total
,c

TABLE INIIJOHNSON1,0'MALLEY INDIAN'NORMS RESPONSES_ OF WISC. -
(Ages 11 6 12)
MEAN , VARIANCE ST. DEV.:
79.26 314.16 17.72.P. 90.56: 42.91Fs. 262.21 16.19
COEFFICIENTS OF CORRELATION'
V. and P.
P.e and FS.
V. and FS.
0.58
0.83
0.93
38

fl
0
TABLE till.-COVARIANCE 'MATRIX OF
40ANSON-0!MAiLET INDiA14,11.ESPON80 91411gIpb,40s- :121
o 0,1 2. , 3, 4 5 6 7 8 9 10 3 ,12 13
. -.00 -.00, ...07 -.00: ..04 .03 -.05, .05 .06
.06 .00 0.00, -.00 .00: .00 . op , .00- . .00 .00 40 .00 :00
s90 40 .08 -,.01 .04 .07, :03 :05 .05, . .01, .02
.07 7:0. .37 .07 .14 .27 ..-12 .15 '00 .00 -.00 .07 .16 :06_- .06' ,08 .08 .02, :03
,6. ;09 `..b4 :14 .09 .87 .27 .18 :41 .42 ..5: '..35
. .03 .00 .07' .Z7 .06 .2T .43 '.12 J.34- .17 -' .28. .15
.r 1 .14 :02 :09 . :068 .03 '00 03 .2 .06 .18 .129 :95 .90'1,- :05 .08'`."- :41 .34 .14 .85, I 41 7 .43 16
10- .60,' .05 ..16 .06 .42 .7 .02 -.41 .40 .22 :28
. .65 .60 .65 .08 .51 .43 .40 -.60 .21, 43712 . of .66 .02 .28 JO .07 .16 .22 .21 .16
13 .06 ;00 .0 .18 .03 .35. ..15- .66 .30 .28 .37 .16,,
14 .00 .00' .01 .02 .01 .13:. .04 °:03, .10. :12 .09 .25 .07 "-15., .00 .00 .05 .16 .08 22 .;17 .16 .30 .18 -.29 .25
.26 .00 .66 -04 .12 .05. ,8 .24 .,16 .40 :23 .34 41 .31 '.- 17 :00 .00 .05 .14 .0 :51 18, .18 .48 .41 .17 .19
18 .00 .00' .04 .08 .05 .30' .15: .08. .29' 48 .25 -.01 ..30
10 :09 .00 .03 .00 .00 .23 .02 .03 .08 .07 .06 .06.. :22
20- .00 .00 .00 .00 .00 .30 .26 .11 .5 .24 .25 J5 .23
21. .00, oo .60 .00 .00. .08 :02 ;02 .06 .09 .06 .19
22 .00 ..)!cr ;00 .00 .00 .20 .06 -.16 -:08 5 .06, .94 .11
23. .0 .00- .00 .00 .00 .00 .00 .CO - .00. :00 .00' .00:
24 , .00 .00 .00- .00 .00 .04 .01 .01 /- .05 .03 :10 .02'
25 .00' .00 .00 .00 .00- .14 .03 .92 .09' .15 .09 .29 '.07
.47 -0- .61 ,2..30, .97 . 6.31 3.47 1.82 5,64 5 0 i, 5'.20 3.51 '4.57
.39

.1!
-
-12
14
1516
718
19
20
21
22
-23
24
25
E
ABLE. XVIIIcow OF
JOHNSON -0' 149W1ETirli5SPONSES, ON WT SC
14. 15 .16!
,00 .00:
.00 .00-
.01 X05 :04
.02 . .12
.01 .08,-? 05'
.22'b, .48-
-,.04' .17 ''..24
.12 . , 127'
.09 -.34
.25 , .25 ..21
%07 .337- .31.28 .12- --.14
.2:14 , .32( .87'
-.35, `ti 41.09 .15 . .39
-.12 .04 .18.05 .14 -44-.21 .08 .06..08. .;..09 .17.06 .00 .00.11 .04 .07."
.34 .12 .11
17 18
.00
.00 .00
.05 .04
.14 .08
.'07 .05
.51 .38
.18 I5
.18 *.08'
48; .29.41 ,281
.41 .25
.17 .01
.39 .30
;09
.35 .15
.41 .39
.84 .49
.49 .66'
.36 .29
.37 .26.
.04 .08 .
-.03 .31
.00 .00
-.03 .00*
-.00 .09
2.46 4.12m:5.78 5.83 4.72
. 19
,T:oo
.0"
.00
.00
.23'
.03
.08
.07
.06
..06
.22
.12
.04:18
.,.36
.29
.84
07.05
-.05.0.10
.17
a
20 21 22
- .00 .00.00 .0Q .00
.oa .00 .00
.00 .00 .00.
-.00 .00 ,.00
.30 .Q8 .- .20
.26 .:02
.11 -.02
. .52 .dr -.084 .09-. .15
W5 .06 . .06.15 .19
.23 .05 .11
.05 .21 .08
.14 .08 -'.09
..44 .06 .17
.37 .04, -.03,.:6 .08' .31
.117 .05. -.05:!.9 44.C1 .19 .11.04 .11 .57
.00 .00 .00
.04 .06 -.02
.00 .26 .09
23 24 25
.00 .do .00
.00 .00.00 ,.00 .00
.00 .Q0 .00
.00 .00 .00
.00 .04 .14
.00 .01 .03-
,00 .01 .02AO .03 .096 :as .15
.00 .03 .09
.00 .10 .29-
.00 .02 .07
.00 .11 .34
.00 .04 .12
:DI .07 .11.00 -.03 -.00.00. .00 .09
.00 : .10 '.17
.00 .04 .00
.00 .06 .26
.40 -.02 .09
.00 .00 .00
.00 .07 .14
.00 .14 .42-
2.97. 4.17 1.72 1.56 -0-
-40
2.-62/
a
76.90819
Matrix- Total 11

Join .$4*0 ODT414:-
,054*, 0.000*.1.14. 44)
_WS 14.4144.4. :ST. TO.,(4.48'. 30940-- : 174* -:-'li. ,87.44 0, '20343 i4.26
(:',. 7,S. -73'4119 '16031 '1,4,88;--,
COF.i7F/CIENTS-, OF C001,11ATIQN
V.1;
V. .aid
41
4'

.15.45
.-I4-' 1,12 .
1° ."
-11
.67'
4-i, 1.03.05
'14IS -.1116
:17.0609
4c.COVARIANCE' MATRIX OF
JOHNSON41 MAI.LEY, INDIAN. RESPONSES- ON ViISCs :13=1. :14)
-. 00.04
-.60-
03_.03
.1500
.1.5"
.09.43
.00,
-.,ä4 loo,
. 0002 ':00;
:02 00.05 .00
04., .00
151 .0
.15"44 -45
.34..3,4
.45. ,47
.30 :08
.15 :02:42 .93.
.05
.-17'18. .08 .04 .00 .2519' .00 . "00 .00 202021
.00 .00. :.00 -.13',.00 ..00 .00,
22 .00 - :do' .00 , .00;3' . oo .00 .00,, .0024 .00 .00 . 00 .0025 .00 .00 .00 .0026 .00 .00 .oP .0027 .00 . . .00 .00 .00
11
fir 8.;
AA: 07.01 .03'
.--
.46... 49- 45-1.-12 _ .11
:93-- .09 :14: :74
t!".4-03' 7 44'1 044,(31: ,:152, :33-
44. '-. 05
.31,- .40 ".01 .1329 02 14,
:10 -=:01 .05
.00. .48" :05-7 . OS
49- .44 : 4;` 40:
-47-4:25
.34,Pi! r. 16 ,
.00 ...21 .24'-44 48-; :00 .36
.21 .90 ..25.001' :. 12" .04-. 06 .00 .00 ,.00,.00 -.24. 23:06- :oo- .00 ..00 .op,
.00 ..00 .
..00 .00 .00 40 .56
1.66 .26 1.04 7.32 . 1:92 1.52 5.27,
42

10
.04
.10
1- .20-
.11S'
-9 : ;33-19 .176
.'2612
13 .29-
.21
15 .48'it .:So17 . ;6578; :jos19- .03
20. .08
21 -.6122
*23
24
TABLE ;31::
-00VARIANOE.IIATRiX OF.
JOHNSON-OIMACEEY:ItibIAN_RZSPOI4SES4N WISC13-& 14)."-
2-3
11 1 13 14 15 17
. 02 ...03 .. 05 .r04 r .,.00 .09 :08
03 .02 .02 .02 05 .03 .04 .:04
.00 od .00 .op. 466 .00, ..00 ..00'
:15 .12 :1 ..34 .19 .17 !:x,02 .03 :05 -.04` .11 .06 .09
.64 41 .29' 48 .43. .48. --.14 .44'
.05 .10 -. 17 05, :i6-.13 :01. -.02 03 .17 . .05
-,13 ,25 34 16".26 .29 ; .21- ,50- .65
.64 .1.6 .23 .21 .15 .31 .1.
.,16 .6,5' -.08 ,56 .. 37 -42' :15 ,:43
.23 .08 4'50 ..,14 4-19- .11 -
.21 .56 .,14 ri 65- .34 .40 .34
. 15 .37 .19 -.34 ...91 :34..13' .40' .37. .77,. .31
44' .14 .55, r:60 .
.64 .40 .44 60 -4,71
;.,02 .48 -. 33 .42: .41- .2019; '.38
42: .2709
, 33 .
35
.43-
,24 .35
.25 .37
.29 :69.22 .60 :.:38.
460. .00. .00 .00.39 -.22 :58
25 :op 490 .00 X00 .00.00 .00 00 .00
27 .00 -:46 -.00 93
.3i
.11
.43:_ .29- 4823 49 .15
.14 .11 :07. .12
.6a 40-
.24( ,.16 .22. -.1340- 40 :op :66.66 ..00 -.
.66 =1.01 .55 .49
6.44 4.22 5.60 1.33 4.91 5.79 5.18 7.33 6.19
43'

TABLE ,XECOVARIANCE "MATRIX
JoOsor;-0,14Ault oN misc(Agee' 13 4.,14)1. -
19' 20- .21 22 23 24 25, 26 2700 .00 .00 .to
'7 .00 .00 .0 .-00 -.00- ..ocY
..qo .00 -:.od 400 ..ocr .064 20, =-:13 .00 .00 :00 .00
.66 ..00 . .00. .00- .00 .00 :0035 ,- :36 .21 .:12 .00- .13 .00 .00
7 21 -.14 :06- :04 .00' 07 .06 .60: 1.008 7.14 7.09'
.?4 48:10 .03 .08
.24 .25:35.02 7.19
.14 .48- -.38'15, 7.33 .3616. .43171 .41
.20 .1819 1:06 .26
.26 80-.01 .24
'22' 35-23 0024 .20 -.36,25- too, .0026 .00- .0027- , -1.19 .00
.06
.257.01
.29.
7.2520
.22
..00-
4 oo;. 00;
.09 38. -.00
.12' . .09" go:
.27" :46 :06.00
.12 .31 .00.
.09 .07 .00-..15 .12- .00
.35. :00°
.24 .00:40 .> .02 . 00
. .53 .:00.00 .00
-.06 .56 .00.00 :00 .00. .00 .00.
7.3,6 00,
7.49 4.33 . 2.16 2.30
4'
7.24. -:00 '7.30 ,
.00,. -.56139 00 00 .00
_ 400 .00 7.46..58 .00 .00
-. 00 :00 7.82,06' .00 -743'
- 00 .00 00. .16 06: :00- ,-4.61
.. 22:.00
.20 .0036 .00
-.06 .00..00-
-.00.00
:00 . 00:..00 \ .00. 00 .00
.00 *55'
.00' .49
.00 =;.1.19
.66 :60_00- 36-
.00 7.84, .00
:do .00.00 00.00. .60'i 00 1.33
'3:42 -2.38 82.76.'82,
:Matrix T9taI
44

TAIIII`,XXIJOHN ON-O'MALLEY INDIANNO -RESPONSES OF WISC:
(Ages, 15,, & '17)
,MEAN. VARIANCE -St ., DEV.
'V.P.ES.
,- 65.2586:5373.03'
161.25'121.18119: 36 .
12.76,,11.0110.93
A
COEFFIcIF/ITS "OF CORRELATION
V'. and P.
P. and ES.
. and "FS.
0.44
. -0.79
11,
Rtge 39

JOHNSON.70!MALL'a.... v INDIAN RESPONSES ON 4IT6C(Age's 15, 16-,, 17)-
1
3',
4
1'.00
.óó
.011
.00
-.00-
.6o
1.06
.60,
.00
4:00
.00,
.90
.24
,136
.60-.12
5 .00 00 .00 ,61.
'6: .00 .00 ,00 -.06 .48-
, .00 .00' .00. .12.00 .00 .21- -.15
: '9 ,00 :00. .00 . .39.00 .00 .00- . .21 -.21ii .00 ,00 .27
12, .00 .06 .00 .00. .60-
'13 .00 .00 .60. .23 .37'14 . .06 .00 .00 :00' Aor
..00 .00 .bo .00 .00bo .00 :do.
-.00 .0 .00 ,0018'. . 400 .00- .06 ,00.19 ,00 .66 .00 .66:io .00 .00 .00 .00!21. .00 .0022 .00. . .00 .00 .oO
-0- '-0- -0- 1.49- .74
12 13 14 15 16
1 .00 .00 .00 .00 .002 .00' .00 .00 .00 .003 .00 .00 .00 .00 .004 .00 .23 .00 .00 .005 .00. .37 .00 .00 .006 .00 .35 .00 .43 .007 .00. -.05 .00 .76 .008 .00 .20 .00 .25 .009 .00 .39 .00 ,71 .00
10 .00 .60 .00 .73 .0011 .00 .43 .00 .70 .0012 .00 .00 .00 .00 .0013 .00 .77 .00 .64 .0014 .00 .00 .00 .00 .0015 .00 .64 .00 .80 .0016 .00 ;00 .00 .00 .0017 .00 ..96 .00 .80 .0018 ,00 .80 .00 .80 .00
L19 .00 .88 .00 .52 0020 .00 .58 .00 , 1.03 .0021 .00 .00 .00 .00 ;0022 .00 .00. ,00 -.63 .00
E -0- 7.15 -0- 7.54 -0-
:Zo.00. -.DO.'
.,00
.48 -.24.
.79 .24
,97-.12 .24
-.12 ..41'
.42' .0'. .18 .55
-46 06.3$ =...t6-
,00 :do.43 ,70'
cur:.
.36, .64.bo:
.00
.60" .60
.00
.801
.00 :00 .00 . 000
.00 .06 Ad'./t \ .30
-.33 ,21 -.09.:.16
,61 .42, .55.
.27 .49_ .27- .34:49- .09' .58 , .75
.27
.34 -.7$
.00 .00, .00 .00
.20 .39 .60 .43bo. ,bo
.251 474 .13 - .70
-46 -.bp ..06" .00'
.25 .71 .55' .53
.21. .60 -,,58 '.156
-,10.. -.29'-AO .00 .60 56-.00' ..00, .00 , .00-
Aa ,06 -.04! -.61
!80 .66
.76
3.38 5,02 : 2.46 25.77 5.74' 5.35
17 18 19. 20
.00
'.00
.00,
.00
. 00
.43
.76
S25.71
.55
. 53'
.00
.96
.00
.80
.00
1.201.00
1.10,.73
.00
.00
.00
.00
.00
.00
.00
.36
.64
.21
.60
,58
.56
.00
.80
.80
.00
1.00
.97'
.86
1.03
.00
-.70
.00 .6o
.00. .00,00, .00.00 .o6
.00
.00.00
.00.00 .00
.60
.5800 ' .00.88' .58.00 .00.52 1.03.00 .00
1.10 .73.86 1.03
1.00 .67.67 (1.33-
.0 .00
.00 -.82
21 ,22
.00.00 .00.00 .06.00 .00.00. .00.06 .00
.00 '.00
.00 .00
.00 .00
.00 -.64:00 -.61.00 .00.00 .00
.00 .90.
.00 -.63
.00 .00
.00 .00
.00 -.70
.00 .00
.00 -.82
.00, .00
.00 ,.50
9.02 7.71 4.44 5.73 -0- -2.90 6:55.s2,
46
, ,
Matrix Total

14
13
:10
9;
7
6
5
:Figure I
lidau-WI40 SUb-test Scores for Retarded and-Non- Retarded #ndian) Readers
,..
-C.
".. "414.44114.
- 1..
: lIPPr. AK
- .
.. 4
Suf. Camp. Arith Sim. Vocab Digit Pict Pict Brock Obj COOARSpan Comp Arr Des Asses-
IndianCode:- Retarded
Indian';NoiRetaided'
47,
5
4
"3'
Source: ERIC Fiche iED 057 931, p. 14.Hollingshead, Maybelle C.,Clayton,Charles, 1972.

Figure II'.
*ail; VisO, sub--,test 6cores, for Retarded and Feaksle,Retarded Readers.
-i4
..
'NV- ...........
.!" __-N.'
..--"OW
.
.
Digit .. ._
'Code:. Male-Retarded ReadersIndian
Female Retarded Readers
t Blo k CodingSpan Comp Arr Des Assem-
Indian
OM, OM IMO Mb
48
Source: ERIC Fiche # ED 057 931,. 14.
Rollingshead, Maybelle C., & Claytcn,Charles, 1972.
1
0

tOIN
I:00
:0-6
3t-4
rd)
-1"
.3''
(AC
47.
An
- -a%
V03
%C
cI%
iI,
1,0
.1-
1I-
71 to),
N.
F+_
.0. ,
Information
Comprehensions,
-Arithmetic-
SimilArities
.
,
,.
1.
'
..
4.v
ocab
ular
y,,
Digit
Span
-Picture
COmpletidn
Picture
Arril!***#
'Bloat,
-
Design
Object
isseMbly,
Coding

Ca
ra P
:)0
C)
Cil
O
ad tr
d. 0
in1-
.IV
La-I
,.to -
Ch
V- 00
LO1-
1 01-
.1-
.,
1-.
IV1-
+'
La ,1-
1-.
1".-
--
.
Info
rmat
ion
Coi
apre
heiu
siO
n,
Ari
thm
etic
Sim
4ari
,tieq
Vad
ahill
ary,
-
Dig
itSp
in-
Pict
ure.
Col
piet
ion,
Xe.
?1,d
t14,
Arr
eate
men
tlg
ock,
Des
ign
401:
det
'
Ass
embl
y
.
',
,
..
:
..
,
'
.,
-:'
.,
- .
4..ii
g.
1
r

ul
0,V
00$p
-. o-1,
-.t-
..1- N.
p=a.
La
...z.
,
, r<
Information.-
..
Comprehenaiori.
Sim.filatities
,.
:1ToOabulary,
Algi
*MI
'110turd
"Completion.
Ticture
Arrangement
Nock -
Design-
,
hisesably
CoAing.
.
.
_._
.,
..
.
.
"Atithmeti,c
,
,.
.
.
---,.
,.
1
TT
1r
,
'
.
-,
.
.
..;5bject
P-
.

titt.pd-o
cr,
tir4
0:6
- 0
co
W- +
"., 0
1:4
CO
.'O1-
6 01-
6'1-
617
4ts
,)
1-6 t
1-6
..Z. .--,
4,Iniormation.
.
Comprehension
Arithmetic
Similarities
Nocahuli'
'-'-'
PICtUre
.
CoMpletion
Pidture
'AiraugeMent
:, -Moak.
"'
,Design
Object
Assembly
_-
'Coding
--
. .
..,
,
.
. --
'
4.-
-
.,.

c.
Ii
14
H
14:
L
SYSTEM A
Anglci ,Spanist-Araeridan-Indian
55%
.27% '
..
,26%
41%
H.'isz
9%-
73%
N =Anglo H5-
% = 13Ind, %'=, 2'
N-335 Nr64 "4N141.
x2=33.19- x3:04 ; x220.09p <.001 p,3.20 <401
'SYSTEM B. -7 TOTAL _SCHOOLS
AnglO ,Spanish-America Indian
70%
15%
. 16%
H
L
.1=122x`=43.66.p '4401 -
21%
32%
47%
la
15%
73%
'N = 3,500Anglo = 30%Span. - 55%
- 15%
L Source: Anderson& Safar, ERIC
N=136 4.82: me: ED 029 746x2=21.46 x`=40.10.p <.001 - p <.001
53

1.,Orangeenvelope
3. straw-'s 4. ,puddle,0 5. 'tap(2= 6: gown
7. roar1-8. eyelash'
9:":Mars,juggler'
lecture
a...
i., el49
......i.,,
...4., ;,....e,,......t.,....._... u:.-
rt.'V
VOCABULARY' iStanforcH3,5 o. .
- .
1,-.,\..0^ t.it-A..4011141..C.J
4ge 48Score
'r7("4.q4
.L.
.471.- e' ti
.brunette015. muzzle , e\
16.
ty.c,
'haste AR 6- *Lc,
.. .. 17. peculiarity:riceleSs
19. regard20. tolerate21. disproportionate22. lotus.,23. shrewd.24. Mosaic
.. ...25.. stavebewail
27. ochre28. repose29.' ambergris30. limpet,>1. frustiate
32. flaunt33. incrustation34. retroactive
35. philanthropy36. 'piscatorial
37.' milksop38. harpy39. depredation40 perfunctory41. actin c
42. casuistry
foN
f
43. homunculus44. sudorific45. parterre
54
AgeLevel Score
VI 6VIIIX 11
Xli- 15
XIV 17
AA 20SA I 23SA II 26SA III 30

-'Sots24. 0' 5. - VOCABULARY WISC.
.
lige':ility ev
. Knife- 2..
. pt..
:4. , .2
5.., Urnbrella : -2,
,2.1`.t0
Cushion .
. air _
8. Donkey.
ilifflinglic=1745=21011111P11,1111M
-p,
. .
M . _ Ar i2 ..e)
M. DiCanionil,
11...lein;
12. Spade / A IM' .
..13 -Sitord- .4.4........e.e'
14. Neisance: vv-
15: Brave - -i4::Nonwnse /
. ,.....;
1 . Hero .
'1e, Ginnble .
19. Nitroglycerine
:20. MieroscoPei /
21'. Shilling..,..c...i..r...,d
22. Fable. _
23. Belfry..
.o.24. Elpionage
.I',. ,
,
4 '
25. 'Stanza
t i/26. \Seclude d.."27. Spangle,. Jc2.'e.d_.1
28.'Hara-Kiri '...0d...4)29. Reci4e i-
.30. Affliction .,31. Ballast-
32. Catacomb
33..:Irrunk5ent ' ,
-34..Mantis
\35. Vesper
36. Aseptic .
37: Chattel ..
38. Dilatory
39. Flout ..
.
40: Traduce

Bibliography ti
Anderson, Jabes G., & DwightSafar. Enuality-of Educational_ Opportunityto Two 1611ti-Cultural Communitida:_ An EXploratory Assessment. U. S.Senate Cei:;Mittee on LabOr and .PubliC Welfare Special 'SUbdemMittee onIndian Education, ERIq NO.-ED 029. 746,.1969.
-I Ballinger, Stanley Of testing and Its Tyranny.- 'Phi Data KapPanl1963, 44;176-180.
. ,Bute-AU-Of Indian-Affairs. Statistics_doncerning Indian Education:'Fiscal-Year; 1970.' Department of Interior, Washington, D. C. ERICNo'.1D.046.569; 1970.
./
Buros, Oscar R. '(Ed.-) the Seventh' Mental Measurements Yearbook. Vol.ls& II. Highland-Park,'N. J. i. The-Gtyphoii.Pregs.,-_1972.-,
CrOnbaCh, Lee J. Essentials of Psychological_Test-ing,(3rd.ti.)'. NewYork:, 'Harper- ROw, Publicie"rs, 1970.
Conry, R,, & W. T. Plant. '104s and. Group Fredietilinaefan,AcademicSucCtas,
iCr4erion:.High SchoOl_and College; Educational and"Psych.-
oJegcalreaagement, 196505, 493 -500.
Derner,' G. F., et al.' Reliability of the:Wechsler-Belleyue,Subtests andScales. Journal of 'Consulting Psychology, 1950, 14,, 177,-179r
BuBois, Philip U. An 71421721421141L1111130liEqii9SISYork: Harper,A.Row, PUblishera; 1956.
,
EPIEgram Editor. 'Looking Ahead: What'aHappening on the EducationalMateriala Scene? TWIEgram, 1973, Yebrnary 15, 1(10,
Ferguson, George. Statistical AnaIyaia Faycholesy & EducationDrd. Ed). Now York:', 'MOGrawHill Book, Company, 1971.
,Hollingshead,__Maybelle, &'Clayton,'Charles. -the-Mental-Ability ofRetarded and Nen-7.?tarded American Indian Readers. ERIC No. ED057'931,-1972.
-Palomares, Uvaldo H., & Emery :T. Cummins, Assessment of Rural MeXican-AMericanYupilq it Preschool and Grades One.through Six: PreliminaryReport. California State Department of Education, Sacramento, 1967.
Terman, L. M., & Maude Merrill. Measuring Intelligence. Boston:Houghton Mifflin, 1960.
Wechsler, David. WoChsler Intelligence Scale for Children: Manual.New'York: The Puchological Corporation, 1949.
56

. .
l
s

!Artairerer
.:1'001-11C".t:trt.r.rtrt Civ..iribesCs:T.,.
Appendix
Tab/14-U AnnUal,SO4.1. Caw* Repirt.iri.IMIlin Childroot (comiiiIne4)
tsfO,
4
`Total.' -- - 0 7-64 s 0;j o 0I.15 rir.7. Ft-lert1 se1.**18.11 Public Schnolili. -Other 3e1,8618rtrate-3. 5 -18' Orer-13 1-1i ; II `5.111, Oryr111 '5.111 -,177-rinr1
21.260`..7967 , 241 25:640' 24 1,171 .17.631zi137 263-- 3 * -14 "50 1 314._ -113!7.3,461 -_.716 , -21,;745- ,: . , -1;16: .13.461 "-1,745`3,714 :"14 2.632" ".10, "6 - 2.656 6,
24.1232 . 770 '2 731 .t-463 41;403 -2;455- .757 -44.11;469::.- 452 '1,627 ' -623 "26061 1.166 -3,409 -.146
1.013,r 321 .19:967 492, 2.143is/ - -2$ 205"; 71-
43,111,_ 21,442' 11232--33;316 13,365 791 -
22.462 - 7;0721 331, 2;703 994 -50
17;776- 4.101 -442-1,012'. 47"1.9:7 ',' 544 '"3r"3:'-1;592' 1,2z9 ..-,111^-.-
'2 070 - -125,657- -123
--,2004 34- -1 171' 334 ..30-
-2 413 2:9 '24
:84 -ftSchad3-11 Onknviionly . 5-11 17'
74f "31171,,
124 3
,,113;473 , 2440 .122 16;341. 1.38t 733 ;47-133 . Irr 1.012' ' -,1.464,. t 449 8I 2,83F-'7-7118. -37
415 1.96$ 21$ 29-1.473 - e 10 1,520 143 122' -'
--2) ", 512 -139- - 2,447 237,r == 357. -17, '-.356 -25' -4126' ' IOS 44 1. 141-, 61 :-211- --
1 434' " 17 '708' 313 70 ,395 , 143,, -20 252, , 3 - 345 41 .363' 334 35' - 11
.......
Source: atatitics concerning Indian edudation; fisdal year 1970
TOreau-of Indian Affairs (Department of Interior)
Washington D.C;,' (Ed 046 569),
SS
r4

ORECitifiY;BUREAU. IND*41-AFFAOS
*INC Atigidaelli;.s.p.-.57401
E* 011*; 0: 44700:N..«;1***". 041114'59763'Tolten; N. Osik ,P*: 6
-071100.1457570`
:,Dak...011638*Oak. :tithe
fill: "68071:
All* *440 Otika,f, K ti.lsox 6327, AlliipOstbe; N: Max: 87108COniolideted. ftency,T.O."&ia 115;:fgnicio,=ColO. 81137'Jonah A Tgere Oulce,14441S;117528
Meetalero* 'mi.-,00.401:6 -; BoxignirniOqUirip",-,N: 87103Zuni- ; . ".-Mex.4*,327
Anadarko Area Ofhirt 73005:
6.14okle.,73022:
tiffs 6643e'Old:1;14058
'0!4,-1400 1'
.111insi Ara Offfea,11649._St.,.811Hriii,,,Menterii -69101-
...5040:
Mom.'04250, Mont:. 0243
F!cieky, Boy*A9eoci;.Boifkiii;' 59521- Wind:Rivet . 82614
Anneal Area Office, do* 3900, June Alaska 410301'
Southeast Oistrict Office, P: 0.90 ; JUltellU; AMSke 9900O. 80x'1 ,,AOchorage, Alaska 99501
Offico; P; 0. Box 347, 8 he, Alaska': 99559:Fairbanks Oittriol"Pffice; 0: Box 530, eirbirks, Alaska 99701NOme0iialct of ficei Udine, Alaska 997
Mkinelpolle Atte Office,- ,931' Second Avenue nth; 2iid Floor,Minneapolis, M nn. 5502
Great Lakes ivericy;Asillant Wis: 54806Minnesota Aiency,Fadeial 0.13ox 489, ,Bemidji, Minn: 55601-.9edlake Ag4cy, 1:taillike; Minn. 56671Sec and Fox AFezt ried Office, Iqma, Iowa 52339

Mite Woe: Are. Office, , Federal Bldg.; ; MuskOgsa,401t10., 74401
Ardm AO#f*frf,' P 0, Box 007. *di** 4:1* *340Plia; 30360`
.04;404i Agoiyiiidiffik0A4011C'Clik 7440-01cinulIPC Agency. P0 =E14* 671, qtaii$00.1;01di14447:Os*. Agency, Pawhuuka, OkIa. -NW.raii:Ogocii;.04,4O*391:41iirai:=0444364,TahlaqU4hA66(04 P,:ti/Bost46B,,Tahliquak Okla. -74464
901:.74.571.'vhwio*kfiencv:Koi1%1/4004; 0*14e1t
Naiijo-Arai (Mick P.O. pix-i040,,00114,N.B4sit:47301.
Oki? Agency, CNn$e, Aria. 86603poem- Nav&o Atialci,K0.-piae!za;,Cvaampoint;N:Mea... 87313-Fort pet*. ,Ariz. 06604Shiprock Agent*, ShiPrOili,-.N:Milic::87420'TubaCity Agtn4,,,Tuhatino, to;rik. :00045.
Phoenix Area Of fiá P.O. 80 x 707; PhOenht, Arizona 65011.
Colorado kiyie4garob ilarkei ;Ariz:46344Fort Apache Agenty,, Whiterivei," Aria 85041Hopi Agency, Iceami Canyoa, Ma. 86034'
-NriadaAgt110,-,Stewariitiev:. 89437PaPago Agency, Sells; Arii. 85634;Pima Agency, SaCaton,Ariz. 85247Salt-River Ageney, Rotite1,0Ox 907; Scottsdale, Ariz. 85251Sin earkis, AgencY, Sari tarloi,Arit, 85650'fluxion tanyOn Agincy, Valentina' Ariz.. 86437bintah and Ouray Agency," Ft. Duiltiants, Utah 84028
Portland Araa Office 1425.NE-Irving St.,-Box"3785,PortlandAregorv97208
CoMlil AgencY; Cooke Dam, Wash. -99116Fort Hall Ageriey; Ft. Hall,ldsho-83203'Northern Idaho Agency,- Lapwel, Idaho 83540Warm Springs Ageney,..Warm Springi, Oregon 97761Umatilla Age*, Pendlebin; Oregon '97801,,Western Washington Agency, 3006 Colby Ave., Everett, Wash. 98201Yakima Agency, Toppenish,-Waish. 98948
Sacramento ;Arai Office, 2800 Ostt 'gamy, Sacramento, Calif. 95825
California Agency;"P. O. Box 4775, SieramentO; Calif. 95825Hoops Area Field office,,Hoopa, Calif., 95546Palm Springs Office, 587 So. Palm Canyon Dr.,Palm'Springs, Calif. 92262
Riverside Area Field Offite, 6843 Magnolia Ave., Suite 8,RiVereile Calif. 92506
Ned Offices Under Central Mkt Washington, D. C. 20242
Carol:ea Agency, Cherokee, N. Caroline 28719Miccoskkce A?ency, P..0: Box 1369, Homestead, Fla. 33090Samino!c Agency, 6076 Stirling Road; Hollywood, Fla. 33024
60

`.,

Research ProposalSubmitted.to thviNational Institute of-Education
(Title of NIE'activity tocWhich submitted)
Title of Project:- Itemnalybes.ofAmpr1ndian atdChicano Responses-on theViicahu1ary.S)c4es of the,Stanfotel-Dinet LM :and Wechsler' Batteriesv* ,
.Ap4liaafl Institution: "MISSOURI "SOUTHERN STATE COLLEGE .
JQPIAN, MISSOURI 6401
Principal InvOttigator: (Fplt name, title, address and telephone numberof the-indiVidual whomill direct the,stUdy),
C1.471; (31.11i-4411.9;
oF -P,SYCHOLOW'E
MISSvURT SOUTHERN STATECOLLEGE--
Co- investigator (if ,Ntspoun 6480 ,(417) 524-4100 '(ext. 225)
Tratitmitter: (Full name, title, address and teleOhone.number of theindividual empowered to commit the institution to theactivity), Mt. PAUL SHIPMEN
,
I.DMINISTRATIVE ASSISTANT TO THE PRESIDENTMISSOURI SOUTHERN STATE COLLEGEJCPLIN, MISSOURI (A801
Proposed Project Duration: From January 1, 1974 To May 31, 1974
.
Total Federal Funds Requested: $9,153.88
Date Submitted: March 1, 1973
Technical data contained in pages of propOsal shall not be used ordisclosed, except for evaluation purposes: Provided, That if a grant or contractis awarded to this submittor as a result of or with the submissionof this proposal, the Government shall have the right,to use or disclose thistechnical data to,the extent provided in the award. This restriction does notlimit the Government's right to use or disclose any technical data obtainedfrom another source without restriction.
62

-Project Budget Suirmary
(Federal: SUpPort
Project Director CLt\RK I: GUILLIAMS, ED.D.
Time Period: From JANUARY 1, 1974
A. Direct Costs:
HENU,.DEPARTMENT OF PSYCHOLOW.Institution insswar sbisintiti, STATE COLLEGE.
,J01 LIN,- MISSOURI 64tS01.
To IL,NY-,S,1 1974
ferSonnej Salaries:
tmplbyee Benefits: 87 Mo. State Retirement(600.00),, MSTA110alth insur.(6 mo's @ 11.48/mo.=$68.83)
Travel: 3,000. miles @ .10e/ragno request 'being made for
per diem food /housing; director.,considers included in
Supplies and :Materials: salary)..
Communications: L.D. telephone & postage-
Services:.
Duplicating and ReproducinOhotocop.l000 vocal). sheets)
StatiStiCal: IBM 370 Comp. time, Sch.of the Ozartzs,Other (eXpIain)Clerical: test protocol I -Lookout, Mo.
retrieval froth sch. cum. records.
Final, 'Report Production: Director .wilt type rough drafts $ 25.00
$ 50.00
400.00160.00
until submit. to sec:Equipment:',
Other Direct Costs: (explain)
Subtotal, Direct COsts
Indirect CostsIndicate the 'basis for calcikilati.ng indirect costs
C. Total Costs (Federal, Support)
Notes: 1. Use one sheet for each 12-month period and a
summary. sheet for totals.
.2. Consultants: Show fees under personnel, trans-,portation and per diem under travel.
63

Description of Project Costs
Direct t-on4
Personnel Salaries:PrOjeat'Director's salary for second semester would.beone/half415,194 (nine mo. contract excluded evening.,divisionand Summer session salary at MSSC, Joplin, Me.-
Director Will. take a leave of absence -tor the second
semester, academic year, 1973 -74; thus, one-hundred-per-cent of-his time will be- devoted to the project proposed..
Page '58
Eiployee.lenefitstEight.per-dent Of'project director's salary Withheld,and'eight.per-cent is matched by institution (MSSC)
for the Mo.. State Retirement System: therefore, 8%.
of $7,500.00 Wouidlbe_16*00. The monthly withholdingfor MSTA,Health Insurance is 11.48/mo: (Jan. 1974 - May
1974; six TO'S"- 68.88).
.Travel: /
Miles- traveled by car - Approx. 3,000; @ =-$300.
The project- director is making no request for per, diemfoodhousing; holds the- latter included in salary above.
'Supplies and Materials:No materials requested', other than paper, which.will befurnished-by-director's institution at no cost.
Communications:Telephone: estimated L. D. calls at $40.00. Director'sinstitution has absorbed approximately $50.00 already,at nacost to project, in calls to research sites inOklahoma, Kansas, New Mexico, and Arizona; andapproxi-mately $10.00 postage.
Services:
Duplicating & Reproducing: Photocopying of 1,000' vocabularysubtests. protocols from WPPSI, WISC or Stanford-Binet intelli-gence tests, at approximately .054 /copy*= $50.00.
Statistical: IBM computer time for producing covariance-,
matrices and multiple-linear regression analyses; N=1,000;up to 45 items by CA, MA; Sex, Urban=aurai, ethnic group-ing, Verbal-performance,?and Full Scale IQ criteria =/$400.00.Service will be provided hy The School of the Ozarka=ComputerCenter, Point Lookout, Missouri (Chief Computer: Mi. RobertCarpenter). The bid from the directoes'homeinstitution(MSSC) was $600.00; primarily, because of longer computertime required With an IBM. 1130.
$ 1,500.00
Other:Clerical help needed for the retrieval of test protocolsfrom participating schools, cumulative record files, at
approximately $160400. Anticipate at least 100 hours ofassistance needed from local site. paraprofessional personnel,at approximately $1:60/hour.
64
568.88
300.00
.00
50.00
50.00
400.00
160.00

Pa 51\\
Appen x D cont.-
Final Report Production: \ f
The director will do: all of the typing of rough drafts, table $ 25.00figure preparation, until the final\draft of the project isready to be typed. This cost for, final draft is estimatedat $25.00 at .20o/page for approximately 125 pages.
Equipment:'None requested
'Other Direct Costs:None anticipated
Subtotal, Direct Costs $9,151.88
B. Indirect Costs: .
\,
None, -as principle investigator. will not be using, home,institution facilities, except to allocate salary'Andother-costs .check. The director's institution (MSSC)has not asked ,for payment for these minor business Officetransaction.
C. Total Costs (Federal-Support): $9,153.88