documb3t resume taylor, marvin j., ed. title fact book on ... · documb3t resume. he 005 454....
TRANSCRIPT

ED 090 856
AUTHORTITLEINSTITUTION
PUB DATENOTEAVAILABLE FROM
EDRS PRICEDESCRIPTORS
DOCUMB3T RESUME
HE 005 454
Taylor, Marvin J., Ed.Fact Book on Theological Education 1973-74.American Association of Theological Schools,Vandalia, Ohio.[74]94p.American Association of Theological Schools in theUnited States and Canada, P.O. Box 396, Vandalia,Ohio 45377 ($3.00)
MF-$0.75 HC-$4.20 PLUS POSTAGE*Church Related Colleges; College Faculty;Educational Finance; *Enrollment; Expenditures;*Higher Education; Minority Groups; *StaffUtilization; Statistical Data; *Theological'Education
ABSTRACTThis factbook presents statistical data concerning
theological education for 1973-74. Tables cover: enrollment, sex,degree level, sex distribution, minority group enrollment, fulitimepersonnel, parttime personnel, employment of women, financial data,compensation provisions, revenue/expenditures, denominationalaffiliation, administrative officers' distribution, and faculty.distribution. (MJM)

I .0InnCOO0-%
tsJ
FACT BOOK
ON
THEOLOGICAL
EDUCATiON
1973-74
. Marvin J. Taylor, Ed4tor
U.S DEPARTMENTOF HEALTH.EDUCATION & *Elf ARENATIONAL INSTITUTE OF
EDUCATIONTHIS DOCUMENT HAS BEEN REPRODUCE() EXACTLY AS RECEIVED FROM
1E PERSON OR ORGANIZATiON ORS GIN"qNsO IT POINTS OF VIEW OR OP,N1ONS
STATED 00 NOT NECESSARILY REPRESENT OFFICIAL NATIONAL INSTITUTE OFEDUCATION POSrl iON OR POLICY,
American Association of Theological Schoolsin the United States and CanadaP.O. Box 396Vandalia, Ohio 45377
$3.00 per copy

ACKNOWLEDGEMENTS
In behalf of all those persons who will use this resource on theologicaleducation, I express the deepest gratitude--
(1) to the administrators and staff of member institutions who supplythe basic information;
(2) to Marvin J. Taylor, Associate Director of AATS, who has investedtime and energy far beyond the call of duty in the writing and editingof this resource;
(3) to Charles E. Little of Health Management Associates for counselabout data processing and preparing the computer program;
(4) to Charlotte M. Thompson for invaluable assistance in checking andediting the data prior to computer work;
(5) to Arlene Galloway for her untiring work of assistance to the editorat every stage of the process but especially in the production ofcamera-ready copy;
(6) to Marilynn Horner for typing of copy;
(7) to the Andrew W. Mellon Foundation for encouraging the Associationto undertake the project and for generous assistance in underwritingthe costs essential to its achievement.
Jesse H. Ziegler, Executive DirectorThe American Association of Theological
Schools

INDEX OF TABLES
Table Title Page
1 Total Enrollment Trends, 1969-73 1
2 Adjusted Enrollment Data for 189 Schools ReportingBoth in 1972 and 1973 1
3 Changes in Number and Percentage of Total ProfessionalEnrollment Within Various Categories of Programs 2
4 Changes in Graduate Enrollments 4
5 Distribution by Sex and Degree Level of All Students 5
6 Changes in Black Student Enrollment 6
7 Sex Distribution of Black Students 7
8 Sex Distribution of Hispanic-American Students 8
9 Changes in Enrollment in Denominational Schools 10
10 Changes in Numbers of Full-Time Administrative, Faculty,and Library Personnel Contrasted with Numbers of Students 13
11 Comparisons of Fun-Time and Part-Time InstructionalPersonnel as Percentage of Total Teaching Staff 14
12 Sex Distribution of Personnel 15
13 Changes in Employment of Women by Position Held 1G
14 Changes in Employment of Blacks by Position Held 18
15 Trends in Total Financial Data (Includes All Schools) 20
16 Trends in Categories of Financial Data: Per Student Basis(Includes All Schools) 21
17 Variations in Per Student Revenue/Expenditures (Educational& General) by Size of School (All Schools Included) 22
18 Trends in Per Student Educational and General Revenuesand Expenditures in Denominational Groups of Schools 23
19 Trends in Per Student Total Expense Surplus/Deficitin Denominational Groups of Schools 24
20 Trends in Total Administrative Compensation Averages(Excludes Roman Catholic Schools) 28
21 Trends in Total Faculty Compensation Averages(Excludes Roman Catholic Schools) 29
22 Trends in Library Staff Compensation(Excludes Roman Catholic Schools) 30
23 Five Year Comparisons in Compensation Patterns(Excludes Roman Catholic Schools) 31

Table Title laa!
A Index to Classification of Schools 33
LI Enrollment Trends of Member Schools, 1956-73 37
C Enrollment by Size, Status, and Racial Characterof School (Fall 1973, All Schools) 45
D Enrollment by Denominational Affiliation ofSchool (Fall 1973, All Schools) 46
E Enrollment by Regions (Fall 1971,, All Schools),and by Highest Degree Offered (AccreditedSchools Only) 47
Number Completing Programs During 1972-73 bySize, Status, and Racial Character of School(All Schools) 48
Number Completing Programs During 1972-73 byDenominational Affiliation of School (All Schools) 49
H Numbc:, Completing Programs During 1972-73 byRegions (All Schools), and by Highest DegreeOffered (Accredited Schools Only) 50
I Denominational Affiliation of ProfessionalEnrollment by Size, Status, and RacialCharacter of School (Fall 1973, All Schools) 51
Denominational Affiliation of ProfessionalEnrollment by Denomination of Schools (Fall1973, All Schools) 52
K Denominational Affiliation of ProfessionalEnrollment by Regions (Fall 1973, All Schools),and by Highest Degree Offered (Accredited SchoolsOnly) 53
L Denominational Affiliation of Graduate Enrollmentby Size, Status, and Racial Character of School(Fall 1973) 54
ld Denominational Affiliation of Graduate Enrollmentby Denomination of Schools (Fall 1973, All Schools) 55
N Denominational Affiliation of GraduateEnrollment by Regions (Fall 1973, All Schools),and by Highest Degree Offered (Accredited Schools Only) 56
O Administrative Officers' Distribution bySize, Status, and Racial Character of School(Fall 1973, All Schools) 57
P Administrative Officers' Distribution byDenominational Affiliation of School(Fall 1973, All Schools) 58
- ii

Table--, Title Page,
Q Administrative Officers' Pistribution by Regions(Fall 1973, All Schools), and by Highest DegreeOffered (Accredited Schools Only) 59
R Faculty Distribution by Size, Status, and RacialCharacter of School (Fall 1973, All Schools) 60
S Faculty Cistribution by DenominationalAffiliation of School (Fall 1973, All Schools) 61
T Faculty Distribution by. Regions (Fall 1973,All Schools), and by Highest Degree Offered(Accredited Schools Only) 62
U Library Staff Distribution by Size, Status, andRacial Character of School (Pall 1973, All Schools) 63
Library Staff Distribution by DenominationalAffiliation of School (Fall 1973, All Schools) 64
Library Staff Distribution by Regions (Fall 1973, AllSchools), and by Highest Degree Offered (AccreditedSchools Only) 65
AA Analysis of Revenues by Size, Status, and RacialCharacter of School (1972-73, All Schools) 66
BB Analysis of Revenues by Size, Status, and RacialCharacter of School (1972-73, Excludes RomanCatholic School.? 67
CC Analysis of Revenues by Denominational Affiliationof School (1972-73, All Schools) 68
DD Analysis of Revenues by Regions (1972-73, AllSchools), and by Highest Degree Offered(Accredited Schools Only) 69
EE Analysis of Revenues by Regions (1972-73, ExcludesRoman Catholic Schools), and by Highest DegreeOffered (Accredited Schools Only) 70
FF Analysis of Expenditures 1'i Size, Status, and RacialCharacter Of School (1972-73, All Schools) 71
00 Analysis of Expenditures by Size, Status, and RacialCharacter of School (1972 -73, Excludes Roman CatholicSchools) 72
HH Analysis of Expenditures by Denominational Affiliationof School (1972-73, All Schools) 73
II Analysis of Expenditures by Regions (1972-73, AllSchools), and by Highest Degree Offered (Ac- creditedSchools Only) 74
J.). Analysis of Expenditures by Regions (1972-73, ExcludesRoman Catholic Schools), and by Highest Degree Offered(Accredited Schools Only) 75

K1 Liurary Data by Size, Status, and Racial Characterof School (1972-73, All Schools) 76
LL Library Data by Denominational Affiliation ofSchool (1972-73) 76
MM Library Data by Regions (1972-73, All Schools), andby Highest Degree Offered (Accredited Schools Only) 76
NM Administrative Officers' Compensation by Size, Status,and Racial Character of School (1973-74, ExcludesRoman Catholic Schools) 77
00 Administrative Officers' Compensation byDenominational Affiliation of School (1973-74,Excludes Roman Catholic Schools) 78
PP Administrative Officers' Compensation by Regions(1973-74, Excludes Roman Catholic Schools), andby Highest Degree Offered (Accredited Schools Only) 79
QQ Faculty Compensation by Size, Status, and RacialCharacter of School (1973-74, Excludes RomanCatholic Schools) 80
RR Faculty Compensation by Denominational Affiliation ofSchool (1973-74, Excludes Roman Catholic Schools) 81
SS Faculty Compensation by Regions (1973-74, ExcludesRoman Catholic Schools), and by Highest DegreeOffered (Accredited Schools Only) 82
TT Library Staff Compensation by Size, Status, and RacialCharacter of School (1973-74, Excludes Roman CatholicSchools) 83
UU Library Staff Compensation by Denominational. Affiliationof School (1973-74, Excludes Roman Catholic Schools) 84
VV Library Staff Compensation by Regions (1973-74, ExcludesRoman Catholic Schools), and by Highest Degree Offered(Accredited Schools Only) 85

INTRODUCTIOR
The same format has been preserved in this fifth annual Fact Book on Theological
Education which has been published by the American Association of Theological Schools.
This will facilitate comparisons beyond those which are included in the text. Data
are derived from Fall, 1973 Annual Report forms: i.e., October, 1973 enrollment,
1973-74 personnel and salary information, and 1972-73 audited revenue-expenditure
figures. All tables are labeled accordingly, both in the text and appendices.
Tables AA-JJ reflect 1972-73 data, with the per student and per faculty aver-
ages based on Fall, 1972 staff reports. These may be found in the 1972-73 edition
of the Fact Book, if specific numbers are desired.
Table A lists all AATS member schools and indicates the basis for the classi-
fications used in the appendices. These include size and status factors, as well
as denomination and region. Table B provides enrollment data for four year inter-
vals, beginning in 1956.
Certain arbitrary definitfons have been necessary for the classification of
schools. For example, a seminary is classified as a part of a university only if
the larger institution possesses at least two other professional or graduate
schools or departments. Schools are classified as related to a cluster only if
the relationship includes at least two other seminaries. Denominational groups
of schools are sorted and reported only if the denomination has at least four
schools which are members of the association. Because the computer cannot accom-
modate dual denominational relationships of some schools, each has been classified
on the basis of its primary student body affilliation. Thus, Louisville Presby-
terian is included in the United Presbyterian grouping and Andover Newton with
the United Church of Christ schools. Both Bexley Hall and Berkeley Divinity
School, Episcopal seminaries, are not included in the Episcopal tables because of
their relationships with Colgate Rochester - Crozer and Yale University, respec-
tively.
This edition of the Fact Book also includes a set of tables providing data for
accredited institutions distributed on the basis of the highest degree offered by

the school. These tabulations appear on the right side of each regional page in
the appendices. The degree codings are B.D./M.Div.; Th.M./S.T.M.; D.Min.; and
Th.D/Ph.D.
This is the second year that AATS has received student data regarding sex,
race, and Hispanic-American origin. Thus far, this information has not been com-
puterized, and it does not appear in the appendices. However, the most important
categories have been reported it the text.
Several cautions are necessary in using the Fact Book. About 40% of the
schools in the 51-150 size category are Roman Catholic, and the data reflect this.
Four of the eleven schools (and 48.1% of the students) in the 501+ group are
Southern Baptist institutions, and the category is influenced thereby. And one
associate school with atypical financial characteristics has been eliminated from
some calculations where averages would have been substantially altered. This fact
is indicated in footnotes where appropriate, and some alternative tables provided.
The text has been prepared to identify and emphasize the most important data.
Our purpose has been factual reporting. No value judgments regarding size of
school, mode of financing, patterns of expenditure, or other characteristics are
either intended or implied. Each reader is invited to make his own judgments in
the light of the data presented about such matters in reference to his own perspec-
tives on theological education.

ENROLLMENT
Total Fall 1973 enrollment showed an unexpected increase when compared with
the record for the past several years. But the reader should not be misled by
simply examining gross registration data, since they imply conclusions which care-
ful analysis of the changes in the various categories of students do not confirm.
Hence, it is important that each of the next several tables be read and compared
to obtain an accurate understanding of the complete picture regarding theological
seminary enrollment.
In terms of total numbers of registrants there was a substantial increase
this year (1,887 persons, or +5.7%). By way of contrast, the increase in 1972 was
only 220 persons comprising +0.7%. Comparable data for the past five Fall enroll-
ment periods, 1969-1973, are reported in Table 1 below.
TABLE 1
TOTAL ENROLLMENT TRENDS, 1969-1973
YearNumber Schools
ReportingProfessional
ProgramsGraduatePrograms Total
1969 170 25,950 3,865 29,8151970 179 26,322 4,750 31,0721971 187 28,208 4,608 32,8161972 189 29,034 4,002 33,0361973 190 11,156 3,767 34,923
It will be noted in Table 1 that precise year by year comparisons cannot be
readily made, since the Association membership continues to grow. Hence, Table 2
shows the enrollment data for the same group of schools (189) reporting both in
1972 and 1973.
TABLE 2
ADJUSTED ENROLLMENT DATA FOR 189 SCHOOLS
REPORTING BOTH IN 1972 AND 1973
1972 1973 % Change
Professional 29,034 31,131 (+7.2%)Graduate 4,002 3,767 (-5.9%)Total 33,036 34,898 (+5.6%)

The general observation above about changes in various categories of students
will be immediately evident here. While total enrollment did rise +5.6%, the grad-
uate sector of that total (graduate masters, Th.D., Ph.D.) revealed an opposite
pattern, declining -5.9%. This continues a trend across the past several years
during which persons seeking these advanced degrees have been fewer in each succes-
sive enrollment period, dropping almost one thousand students since 1970.
Professional Degree Enrollments
The above observations about reduced graduate registration obviously imply
that professional categories have continued to increase across the years. In
tabulating enrollments the Association includes in this broad designation those
programs which equip persons for ministry, either lay or ordained. Thus, not only
the B.D./M.Div,/D.Min./ and Ed. D. degrees are listed here, but so also are the
one and two-year masters programs requiring only a baccalaureate degree for admis-
sion (M.A./M.A.R./M.T.S./M.R.E.,etc.). They have traditionally prepared candidates
for religious education, social work, church music, and other forms of service.
TABLE 3
CHANGES IN NUMBER AND PERCENTAGE OF TOTAL
PROFESSIONAL ENROLLMENT WITHIN VARIOUS
CATEGORIES OF PROGRAMS
D.Min. B.D.M.Div.
M.A./M.R.E./M.T.S.
Certificate,Diploma, &
Special Students
1969NITIUer 201 20,620 2,640 2 136% of Total 0.8% 79.5% 10.2% 6.2%1970Number 564 20,914 2,647 2,071% of Total 2.1% 79.6% 10.1% 7.9%1971Number 688 22249 2,760 21330% of Total 2.4% 78.9% 9.8% 8.3%1972Number 1,540 21,305 3,256 2,670% of Total 5.3% 73.4% 11.2% 9.2%
12/1Number 2,458 20,679 3,828 3,999% of Total 7.9% 66.4% 12.3% 12.8%
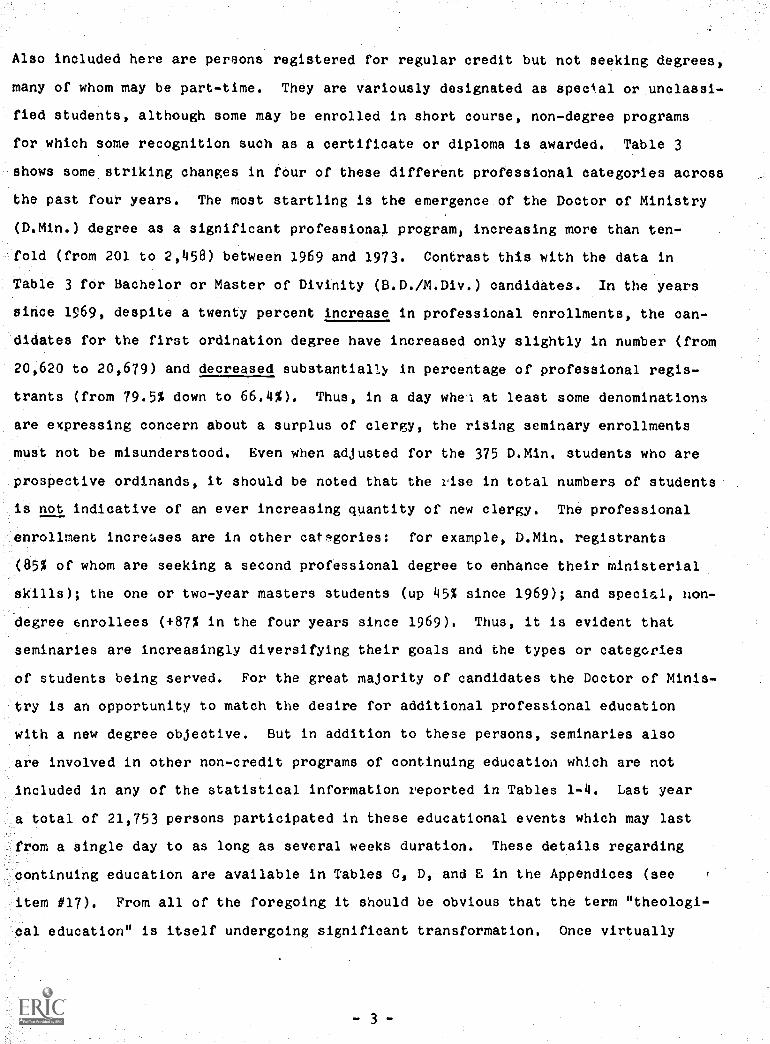
Also included here are persons registered for regular credit but not seeking degrees,
many of whom may be part-time. They are variously designated as special or unclassi-
fied students, although some may be enrolled in short course, non-degree programs
for which some recognition such as a certificate or diploma is awarded. Table 3
shows some striking changes in four of these different professional categories across
the past four years. The most startling is the emergence of the Doctor of Ministry
(D.Min.) degree as a significant professional program, increasing more than ten-
fold (from 201 to 2,458) between 1969 and 1973 Contrast this with the data in
Table 3 for Bachelor or Master of Divinity (B.D./M.Div.) candidates. In the years
since 1969, despite a twenty percent increase in professional enrollments, the can-
didates for the first ordination degree have increased only slightly in number (from
20,620 to 20,679) and decreased substantially in percentage of professional regis-
trants (from 79.5% down to 66.4%). Thus, in a day whel at least some denominations
are expressing concern about a surplus of clergy, the rising seminary enrollments
must not be misunderstood. Even when adjusted for the 375 D.Min. students who are
prospective ordlnands, it should be noted that the rise in total numbers of students
is not indicative of an ever increasing quantity of new clergy. The professional
enrollment Increases are in other categories: for example, D.Min. registrants
(85% of whom are seeking a second professional degree to enhance their ministerial
skills); the one or two-year masters students (up 45% since 1969); and special, non-
degree enrollees (+87% in the four years since 1969). Thus, it is evident that
seminaries are increasingly diversifying their goals and the types or categories
of students being served. For the great majority of candidates the Doctor of Minis-
try is an opportunity to match the desire for additional professional education
with a new degree objective. But in addition to these persons, seminaries also
are involved in other non-credit programs of continuing education which are not
included in any of the statistical information reported in Tables 1-4. Last year
a total of 21,753 persons participated in these educational events which may last
from a single day to as long as several weeks duration. These details regarding
continuing education are available in Tables C, D, and E in the Appendices (see
item #17). From all of the foregoing it should be obvious that the term "theologi-
cal education" is itself undergoing significant transformation. Once virtually
3

synonymous with pre-ordination education, it must now be broadened to include
numerous additional facets of educational endeavor.
Graduate Degree Enrollments
I3y definition the Association includes in this sub-division programs for
which the first professional degree is a prerequisite. These have usually been
confined to some M.A. degrees, as well as Th.M./S.T.M., Th.D., S.T.D., and Ph.D.
programs. As indicated above, there has been a steady decrease in numbers of per-
sons in this total category since 1970. Please refer to Table 4 for specific data.
Just as noted above within the professional sub-categories, the trends are not
TABLE 4
CHANGES IN GRADUATE ENROLLMENTS
Th.D.S.T.D.
Ph.D. Masters,4 Total
1969Number 590 876 2,399 3,865
540 1 220 2,990 4,750uN
Chanle -8. % 4- '.3% +24.6% +22.9%
1211Number 779 1,283 2,546 4,608% Chan e +44.3% +5.2% -14.8% -3.0%19
733 1,134 2 135 4,002umber% Change -5.9% -11.6% -16.1% -13.2%1973Number 703 1,328 1,736 3,767% Chanle -4.1% +17.1% -18.7% .9%
parallel in all graduate degree groupings. The overall one year decrease in all
graduate numbers (-5.9%) was paralleled by a -4.1% reduction in S.T.D./Th.D.
students. The reduction was tripled in the graduate masters' category, which
went down -18.7%. However, precisely the opposite trend is apparent in Ph.D.
enrollments. They increased (+17.1%) this year, reaching an all-time high in
the years since AATS has been collecting such data. In the light of the highly
publicized over-supply of teachers in the field of religion, this continued in-
crease is surprising.
Sex Distribution of Theological Students
The Association has been collecting data on both sex and race of theological

80001 students for only two years. Hence no trends may be reported, although
some comparisons will be apparent. Please refer to Table 5 for these data.' The
most Obvious change is the sharp increase in numbers of women enrolled, up from
3,358,1ast year to 4,550. Even when a special non-degree prograM offered by one
sohooL and enrolling more than five hundred women is discounted the increase is
still quite evident. An additional 240 women are registered in the one and two
year professional programs, as well as an even larger rise in the special and
unclassified category. But the largest change is in the three and four year pro
grams leading to ordination, one of the last arenas which have tended to be re-
served for men-. Here women increased from 1,077 to 1,484 candidates (+37.8%).
Even with the influx of D.Min. stunts (who are included in this category) there
was an actual reduction of almost two hundred men preparing for ordination. The
slight over-all increase is explained totally by the 407 additional women regis-
trants.
TABLE 5
DISTRIBUTION BY SEX AND DEGREE LEVEL OF ALL STUDENTS
Women Men TotalNumberNumber Number %
1 or 2 Yr. Prof. Degrees19.72 1,101 33.8% 2,155 66.2% 3,2561973 1.341 35.0% 2,487 65.0% 3,828
3 or 4 Yr. Prof. Degrees1972 1,077 4.7% 22,031 95.3% 23,108---121314"6.1---115"."232-
Special & Unclassified1972 680 25.5% 1,990 74.5% 2,6701973 1.409 35.2% 2.590 64.8% 3,999
Total Prof.1972 2,858 9.8% 26,176 90.2% 29,0341973 4,234 13.6% 26,922 86.4% 31,156
Graduate Masters1972,1973
353112
16.5%6.5%
1,7821,624
83.5%93.5%
2,1351,736
Doctors1972 147 7.9% 1,720 92.1% 1,8671973 204 10.0% 1,827 90.0% 2,031
Total Grad.1972 500 12.5% 3,502 87.5% 4,0021973 316 8.4% 3,451 91,6% 3,767
Total All1972 3,358 10.2% 29,678 89.8% 33,0361973
. 4,550 13.0% 30,373 87.0% 34,923

When one turns to the post B,D./M,Div. programs, the situation is less clear,
Last year exactly five-hundred women were enrolled (33 for masters and 147 for
either the Th.D. or Ph.D.). In 1973 this dropped 36.8 %I But please be careful to
note the precise nature of the data, The decrease is in candidates for the graduate
masters degrees, In an era when faculty positions are becoming very diffioult to
obtain and the credentials expected are rising sharply, far fewer men or women
have any interest in that degree (the S.T.M. or Th.M.). Both decreased in the past
year. But significantly the number of women seeking the doctorate rose sharply
(up 38.8%). Thus it is apparent that both ordination and teaching posts are being
more actively sought by women (each up more than one-third) in 1973 than was true
even one year ago. It sho,,Ild be quickly noted, of course, that numbers and per-
centages involved still fall far below (6,4% and 10.0 %, respectively) one-half of
the population.
Black Student Enrollment
Data on black enrollment has been obtained during the past four years, and
there has been a substantial increase in each of those periods. See Table 6 for
these details.
TABLE 6
CHANGES IN BLACK STUDENT ENROLLMENT
Year Number % Change
1970197119721973
808908
1,0611,210
+12.4%+16.9%+14.0%
Additional sub-groupings of these data are reported in Tables C, D, and E (item
#14) in the Appendices where black enrollment in various categories of schools
(size, denomination, region, etc.) may be found. Comparisons may also be made
with previous Fact Books to identify changes in enrollment patterns.
Table 7 contains data for sex distribution of black students within the
various degree categories for both 1972 and 1973.
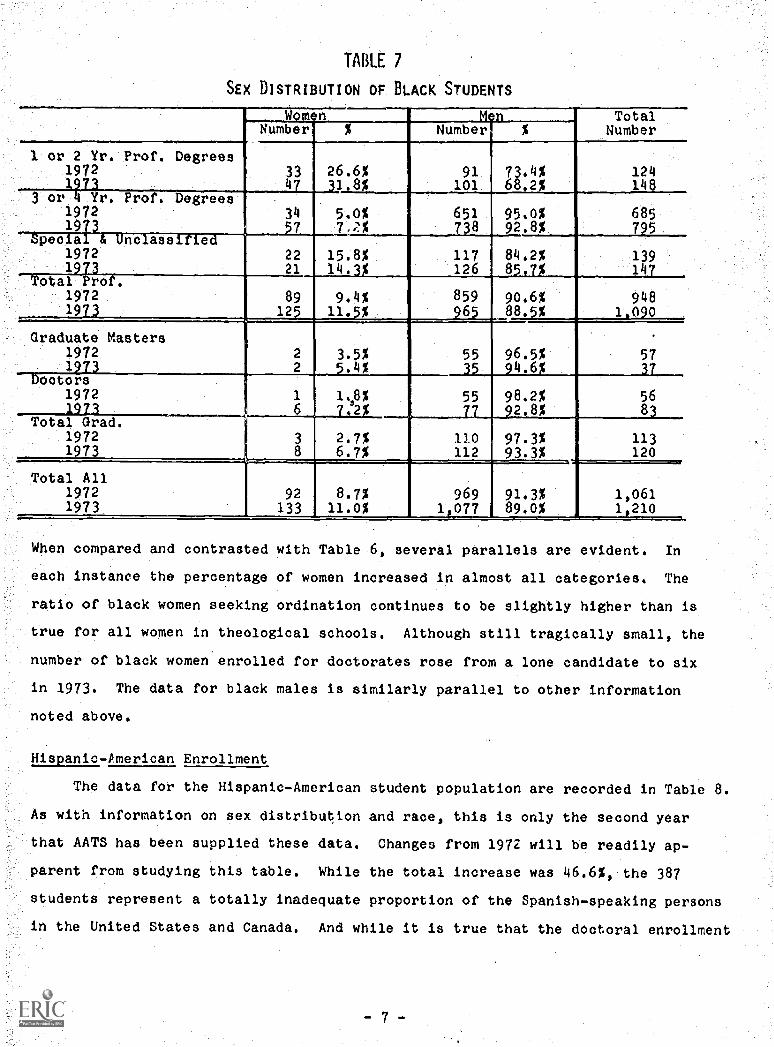
TABLE 7
SEX DISTRIBUTION OF BLACK STUDENTS
Wom n MO TotalNumberNumber Number
1 or 2 Yr, Prof. Degrees1972
nr.
33
k726.6%31.8%
91101
73.4%68.2%
124148
3 or Prof. Degrees197219
34
7
5.0%7.2%
651738
95.0%92.8%
685795
pec a Inc ass e.19721
2221
15,8%14.
117126
84.2%8 .
13914
otal 'ro .
19721973
8912
9.4%11.
859965
90.6%88.
9481 WO
Graduate Masters19721*
22
3.5%.4%
55 96.5%.4.6
98.2%92.8%
573_5683
octors1972
-1913------4Total Grad.
19721973
1
61.8%7'2%
5577
3
8
2.7%6.7%
110112
97.3%93.3%
113120
Total All19721973
92133
8.7%11.0%
9691,077
91.3%89.0%
1,0611,210
When compared and contrasted with Table 6, several parallels are evident. In
each instance the percentage of women increased in almost all categories. The
ratio of black women seeking ordination continues to be slightly higher than is
true for all women in theological schools. Although still tragically small, the
number of black women enrolled for doctorates rose from a lone candidate to six
in 1973. The data for black males is similarly parallel to other information
noted above.
Hispanic-Pmerican Enrollment
The data for the Hispanic-American student population are recorded in Table 8.
As with information on sex distribution and race, this is only the second year
that AATS has been supplied these data. Changes from 1972 will be readily ap-
parent from studying this table. While the total increase was 46.6%, the 387
students represent a totally inadequate proportion of the Spanish-speaking persons
in the United States and Canada. And while it is true that the doctoral enrollment
7

WLE 3
SEX DiSTRIBUrION OF IIISPANkC-AMERICAN STUDENTS
Women M n TotalNumberNumber Number
1 or 2 Yr.; Prof. Degrees1972 5 26.3% 14 73.7% 19
7 12.3% 50 87.7% 573 oririr. Prof. Degrees
1972 7 3.3% 202 96.7% 2091973 15 5.8% 243 94.2 % 258
Special & Unclassified1972 3 15.8% 16 84.2% 191973 11 30.6% ?I 62.4 36
Total Prof.1972 15 6.1% 232 93.9% 247Lia 33 9.4% 318 90.6% 51
Graduate Masters1972 0 0 10 100.0% 101973 1 5.6% 17 94,4% 18
Doctors1972 0 0 7 100.0% 71973 3 16.7% 15 83.3 18
Total Grad.1972 0 0 17 100.0% 171973 4 11.1% 12 88.9% 36
Total All1972 15 5.7% 249 94.3% 2641973 37 9.6% 350 90.4% 387
more than doubled (157.1%), it still comprises only eighteen persons. This
hardly bodes well for the future as seminaries seek to broaden their faculties
by employing minority persons. However, even though the numbers are small, it
is encouraging to note that the percentage increase of women students was sub-
stantial, moving upward from 5.7% last year to 9.6% in 1973.
Changes in Enrollments in Denominational Schools
Table 9 reports the changing patterns of enrollment in the selected group of
denominational schools for each year since Fall, 1969. The data have been divided
into professional and graduate categories to provide comparisons with other pre-
vious tables as well as more precision in understanding the changes in total reg-
istration. The table should be read with careful attention to the footnotes,
since different numbers of schools were Association members in successive years.
In contrast with last year (when seven of the twelve denominational groups re-
ported losses), in 1973 eight of twelve show gains--some of which are quite large.

A small portion of the United Church of Canada increase (26 students) is ex-
plained by a different number of schools, but oven without this the growth would
have been substantial. Very small changes in numbers are apparent in Roman
Catholic-Canada, Christian Churches, Presbyterian U.S., and United Church of
Christ. In several instances these modest total changes hide decreases in gradu-
ate students who are offset by increases in professional categories. As noted
last year (Fact Book on Theological Education, 1922-1212, pp. 2-3), this change
may well be more apparent than real. Clergy who once enrolled in S.T.M,/Th.M.
(graduate) programs are now electing the professional D.Min.
When Doctor of Ministry factors are included in analyzing these data in
Table 9, several more precise observations are in order. For example: American
Baptist total enrollment declined slightly (-5.0%), but its D.Min. students
increased 240%. Even when the Th.M. phenomenon noted above is discounted in
this D.Min. enrollment, it is apparent that American Baptist professional students
(i.e., M.Div.) declined substantially more than the overall 5.0% decrease noted
in Table 9. Such specific detailed comparisons can readily be made by examining
Tables D in the two Fact Books. Parallel observations may be made about the six
Southern Baptist schools whose M.Div. as well as D.Min. registrants both increased
substantially, more than offsetting the slight declire in graduate students.
United Methodist data reveal two interesting statistics. The apparent increase
in professional totals is more than explained by the D.Min. Without the regis-
trants from several new "in-ministry" D.Min. programs, the decline in professional
enrollment would have approached two hundred persons. United Methodist schools
also ran counter to the general decline in graduate enrollments. All of these
are increased doctoral enrollments.
The most striking illustration of the impact of Doctor of. Ministry regis-
trants on total enrollments is evident in the United PresbyLerian group of
schools. Table 9 reveals a rather startling increase of 26.4% in professional
enrollment. Under careful analysis, this amounts to 357 additional persons, but
the increase of D.Min. students over 1972 was 399 registrants. Thus, without
the new Doctor of Ministry students there would have been a loss of 2.8% in
9

MULL J
CHANGES IN ENROLLMENT IN flENomINATIoNAL SatooLs
Denomtna-tion
Year Prof.,
Pgms.. I-
Orad. Pgms. Total
Enroll-ment
%
YearlyChange
Enroll-ment
%
YearlyChange
Enroll-ment
%YearlyChange
- 3.4%-12.1%-10.2%31.1%
Canada -UnitedChurch'
1969-701970-771971-721979-731971-74
189186147125189
1.6%-21.0%-15.0%+51,2%
3i5052111
11.6%
+ 31.6%+ 4.0%
17.1%
23222419717721?
Canada -RomanCatholic
1969-701970-711971-721972-731973-741969-701970-711971-721972-731973-74
225351
441465731707730667685
+33.1%+56.0%+25.6%+ 5.4%
- 3.3%+ 3.3%- 8.6%+ 2.7%
9
122434eil
72636914
+ 33,3%+100.0%+ 41.7%+ 11.8%
+ 63.6%12.5%
+ 9.5%79.7%
i
237375475503775779
793736699
+33.1%+58.2%+26.7%+ 5.9%
+ .5%+ 1.8%- 7.2%- 5.0%
Baptist -American
Baptist -Southern
1969-701970-711971-721972-731973-74
4,0894,0724,2544,5554.981
.4%+ 4.5%+ 7.1%+ 9.4%
461379370287229
- 17.8%2.4%
- 22.4%- 20.2%
4,5504,4514,6244,8425,210
- 2.2%+ 3,9%+ 4.7%+ 7.6%
ChristianChurches3
1969-701970-711971-721972-731973-74
546643708676685
+17.8%+10.1%- 4.5%+ 1.3%
8675281926
12.8%- 62.7%- 32.1%+ 16.8%
632718736695711
+13.6%+ 2.5%- 5.6%+ 2.3%
LutheranChurch in
America
1969-701970-711971-721972-73
1,1471,0801,0481,027
- 5.8%- 3.0%- 2.0%
7."
188237118122
+ 26.1%50.2%3.4%3.3%
1,3351,3171,1661,1491.065
- 1.3%-11.5%- 1.5%- 7.3%
MethodistUnited
13B:1970-711971-721972-731973-74
2 N703,0243,0243,0523,089
2.2%0
+ 0.9%+ 1.2%
ta584617575624
+ 28.1%+ 5.7%- 6.8%
8.5%
3,4163,6083,6413,6273.74
+ 5.6%+ .9%- 0.4%+ 2.4%
Presby.U.S.
1969-703970-711971-721972-73
505496505571
- 1.8%+ 1.8%+13.1%
+ 4.9%
23998
1116650
59.0%+ 13.3%- 40.5%- 24,2%
5946166376119
-20.2%+ 3.7%+ 3.4%+ 1.9%
Presby.United
138:7701970-711971-721972-731971-74
1,3661,3981,4371,5031,900
+ 2.3%+ 2.8%+ 4.6%+26.4%
423618464466426
+ 46.1%- 24.9%
0.4%8.6%
1,702,0161,9011,9692.326
+12.7%- 5.7%+ 3.6%+18.1%
ProtestantEpiscopal
1969-701970-711971-721972-731973-74
946928861838799
- 1.9%- 7.2%- 2.7%
4.7%
5856
3843
53
3.4%32.1%
+ 13.2%+ 23.3%
1,004984899881852
- 2.0%- 8.6%- 2.0%- 3,3%
- 10 -

TABLE 9 (Coormun)
Denomina-Lion
Year Prof. Pgms,inol. Interns
Grad. Pgms. Total
nro Enroll- Enroll- %ment Yearly ment Yearly ment Yearly
Roman , 19.9 70 4,0.0 3:9 4 49'
Catholio7 1970-71 4,342 + 6.9$ 747 + 92.0% 5,089 - +14.4%1971-72 5,045 +16.2% 808 + 8.2% 5,853 +15.0%1972-73 4,947 - 1.9% 818 + 1.2%. 5,765 ., 1.5%.1973-74 4,891 104 576 29.6g 5,467 - 5.2%
United 1969-70 94,3 147 1,090Churoh of. 197071 929 - 1.5% 187 + 27.2% 1,116- .+ 2',4%-Christ 1971-72 1,092 +17.5% 78 . 58.3% 1,170_ + 4.8%
1972-73 1,130 + 3.5% 55 29.5% 1,185 + 1.3%1973-74 1,164 + 3.0% 61 + 10.9% 1,225 + 3.4%
1. Includes six schools ir 1969-71, five in 1971-72, three in 1972 -73, ant.five in 1973-74.
2. Includes data from two schools in 1969-70, three schools in 1970-71, andfour schools since 1971.
3. Includes data from five schools in 1969-72, but four schools in 1972-74.
4. Data from eleven schools in 1969-71, ten schools since 1971.
5. Roman Catholic - U.S. data based on 37 member schools in 1969-70; 42 in1970 - 71;.47 in 1971-72; and 50 in 1972-74.
professional students! Thus, the data in Table 9 must be used cautiously in
conjunction with Tables D in the two applicable Fact Books to obtain a totally
accurate understanding of the enrollment trends.
Finally, it should be noted that at least three denominational groups of
schools continue to show declining enrollments acl,oss the years reported. Once
again this year the Lutheran Church in America schools reported fewer students.
Although apprent in the graduate category also, it is especially evident in
professional enrollment. The total decline has been 20.2% since 1969. Protes-
tant Episcopal enrollment shows a similar slight decline again this year, as it
has in previous years also. Since 1969 the total decline has been 7.3%. Simi-
larly enrollment in Roman Catholic - U.S. theologates shows parallel reductions.
However, it is significant to note that this year the same 50 schools reported a
decline of only 56 students in professional programs (-1.1%). The major ingre-
dient in this year's reduction was the loss of 242 graduate students. Since the

D.Min. has not yet become a factor in this shift in Roman Catholic schools,
that explanation is not here applicable.
Size of School
Previous Fact Books have included tables reporting the interrelationship
between size of enrollment and numbers of member schools. This table is not
repeated this year primarily because the pattern has hardly changed in the five
years for which data are available. About sixty percent of all seminaries
together enroll only one-fourth of the total students. And eleven of the largest
schools (over 500 students) number 27.7% of the registrants. Or stated differ-
ently, the largest eleven schools actually serve four hundred more students than
the smallest 115 seminaries. The implications of these facts will bP discussed
later in the section on Finances.
- 12 -

NUMER AND DISTRIBUTIOA OF PERSONAEL
Tables 0 through W in the Appendices present the details on numbers and
distribution of seminary personnel in administrative, faculty, and library posi-
tions. Comparisons may be made with previous years by refering to earlier edi-
tions of this Fact Book where the tables are parallel.
JAM 10
CHANGES IN NUMBERS 0i FULL-TIME ADMINISTRATIVE, FACULTY,
AND LIBRARY PERSONNEL CONTRASTED WITH NUMBERS OF STUDENTS
Administrators Full-TimcFaculty
LibraryStaff
Total Students # Schools
1970-71 750 2,148 388 3,286 31,072 179Avg. # School 4.19 12.00 2.17 18.36 173.58
1971-72 846 2,297 404 3,547 32,816 187Avg. # School 4.52 12.28 2.16 18.97 175,49% Change +7.9% +2.3% -0.5% +3.3% +1.1%
1972-73 864 2,308 404 3,576 33,036 189Avg. # School 4.57 12.21 2.14 18.92 1714.79% Change +1.1% -0.6% -0.9% -0.3% -0.4%
luinn 888 2,255 394 3/537 34,923 190IVY,. 1-School 4.67 11.87 2.07 ld.62 183.81% Change +2.2% -2.8% -3.3% -1.6% +5.2%
Table 10 reports summary data from Tables 0 through W, indicating the changes
in both total numbers and average number per school for each of the three staffing
categories: administrators, faculty, and library personnel. The data obviously
are not parallel in their changes from year to year. For the second successive
year there has been a reduction in faculty and library personnel: -2.8% and -3.3%
respectively per school. Seminary faculties this year are actually employing
fifty-three fewer teachers full-time. Similarly ten fewer library staff are work-
ing full-time. Thus the well publicized financial crisis does appear to be influ-
encing staffing decisions, with some vacancies not being filled and actual dismis-
sals in other instances of necessary staff reduction. Yet there are two curiously
opposite statistics in the data repofted in Table 10. At the same time that the
average faculty has been reduced by 2.8%, the average size of student bodies rose
5.2% (from slightly less than 175 persons to more than 183)1 Even more curiously,
full-time administrative personnel continued to increase for the fourth consecu-
- 13-

tlye year. since 1970 the average administrative staff has risen 11% in number,
while the faculty has decreased 1.1%, and library staff declined 4.6%. For the
same period average Student body size has risen 5.9%.
A final observation must be added about the reduction in full-time faculty
members from 2,308 to 2,255 oersons. As will be evident in Tables 11 and 12
there was a correspondingly large increase in numbers or adjunct, part-time
teaching personnel used (from 1,661 to 1,911 in Fall 1972 and 1973 respectively).
Furthermore, the full-time equivalency in teaching responsibility assigned to
these part-time instructors also increased in an amount almost exactly equal to
the reduction in full-time faculty. Thus, smaller full-time faculties do not
necessarily imply fewer teaching personnel available. Rather it indicates an
increasing dependence on part-time persons to fulfill instructional duties, a
fact which may be related to the comparative costs involved in employing adjunct
as compared with regular, full-time teaching staff. An equally plausible expla-
nation may be an increased desire to utilize the professional skills of adjunct
faculty for the improvement of the quality of education for ministry. Table 11
provides these comparative details. Note particularly how the p6rcentage of all
TABU 11
COMPARISONS OF FULL -TimE AND PART-TIME INSTRUCTIONAL
f'ERsouNEL AS PERCENTAGE OF TOTAL TEACHING STAFF
1970-71 1971-72 1972-73 1973-74
NumberFull-Time 2,148 2,297 2,308 2,255dumberPart-Time 1,243 1,498 1,661 1,911Full-TimeEquivalent 357 429 470
.
522Total, includingFull-Time Equiv. 2,505
14.3%
2,726
15.7%
2,778
16.9%
2,777
.18.8%
% of Full-TimeEquiv. supplied byPart-Time Persons
teaching being done by part-time personnel has steadily risen across the four
reporting periods (a 31.5% increase). The full significance of this phenomenon
is obviously not available from the simple reporting of the statistical data.
- 14 -

Sex and (lace Distribution, of Seminary Personnel
Fall, 1973 was the third consecutive year that both sex and race data for
administrative, faculty, and library personnel have been obtained, Table 12
records this information for all three years. Several interesting observations
are immediately evident, For example, note the sex distribution percentage
for all administrators across the three years, .Despite the increases in num-
bers of persons employed each year, exactly 12.2% were women in each of the
successive years! In reference to full-time faculty, last year we reported a
decrease or eight women. In 1973 this situation was reversed. As noted earlier,
TABLE 12
SEX DISTRIBUTION OF PERSONNEL
Full-Time Administrators Facult Librar Total
Numberof
Total Number% of
Total Numberof
Total Number% of
Total
Men - 1971 743 87.8% 2,224 96.8% 214 53.0% 3,181 89.7%Women-1971 103 12.2% 73 3.2% 190 47.0% 366 10,3%
Totals 846 100.0% 297 100.0% 404 100.0% 3,547 100.0%
Men - 1972 759 87.8% 2,243 97.2% 217 53.7% 3,219 90.0%Women-1972 105 12.2% 65 2.8% 187 46.3% 357 10.0%
Totals 864 100.0% 2,308 100.0% 404 100.0% 3 576 100.0%
Men - 1973 780 87.8% 2,178 96.6% 204 51.8% 3,162 89.4%Women-1973 108 12.2% 77 3.4% 190 48.2% 375 10.6%
Totals 888 100.0% 2,255 100.0% 394 100.0% 3,537 ,100.0%
Part-Time Faculty Library Total__
Men - 1971 1,394 93.1% 55 49.1% 1,449 90.0%Women-1971 104 6.9% 57 50.9% 161 10.0%
Totals 1,498 100.0% 112 100.0% 1 610 100.0%
Men - 1972 1,528 92.0% 49 40.2% . 1,577 88.4%Women-1972 133 8.0% 73 59.8% 206 11.6%
Totals 1,661 100.0% 122 100.0% 1,783 100.0%
Men - 1973 1,719 90.0% 50 42.7% 1,769 87.2%Women-1973 192 10.0% 67 57.3% 259 1?.8%
Totals 1,911 100.0% 117 100.0% 2,028 100.0%
- 15 -

faculties actually were reduced this year by fifty-three persons, yet twelve
additional women were employed as full-time teachers. This raised the per-
centage of the total from 2.8% to 3.4%. A parallel phenomenon is also evident
among Cull-time library personnel. While ten fewer persons are working in
libraries, there are actually three more women in 1973 than last year. But
one should not be misled by these cited changes. Together women constitute
only 10.6% of the full-time professional employees of theological seminaries.
TABLE 13
CHANGES III EMPLOYMENT OF WOMEN BY POSITION HELD
1971-72 1972-73 1973 -74
Number ofWomen
% ofTotal
Number ofWomen
% ofTotal
Number ofWomen
% ofTotal
Administrators:Chief Admin. 0 0% 0 0% 0 0%Assit. Admin. 2 5.1% 1 2.5% 1 2.1%Academic Dean 1 0.9% 1 0.8% 1 0.8%Dean of Students 1 1.4% 2 2.9% 3 4.5%Registrar 54 49.5% 56 53.3% 57 54.8%Business Officer 11 10.6% 14 12.3% 12 10.6%Dir, of Devpt. 3 5.1% 2 3.2% 3 4.5%Dir. Pub. Rel. 5 14.3% r
, 20.8% 5 20.8%Other Positions 26 19.1% 24 17.5% 26 16.8%
Totals 103 12.2% 105 12.2% 108 12.2%
Faculty:Professor 15 1.3% 16 1.3% 13 1.1%Associate 11 2.1% 12 2.2% 24 4.6%Assistant 37 8.9% 22 5.6% 24 6.1%Instructor 10 6.2% 15 9.3% 16 15.1%Part-time 104 6.9% 133 8.0% 192 10.0%
Totals 177 4.7% 198 5.0% 269 6.5%
Library Staff:Librarian 36 23.4% 33 22.0% 36 23.8%Ass't. Librarian 25 42.4% 34 47.2% 31 44.9%Reference Lib. 19 65.5% 19 59.4% 17 63.0%Circulation Lib. 24 80.0% 16 69.6% 21 77.8%Cataloguer 48 76.2% 48 75.0% 52 76.5%Other 38 55.1% 37 58.7% 33 63.5%Part-time 57 50.9% 73 59.8% 67 57.3%
Totals 247 47.9% 260 49.4% 257 50.3%
This represents an almost totally insignificant improvement of +0.3% in the two
years since Fall, 1971.
- 16 -

Changes in part-time employment for women have been only slightly better.
While it is true that in terms of percentage almost three times as many women are
engaged as adjunct as compared with full-time faculty, they still constitute only
192 persons in contrast to 1,719 men. And this year there are actually fewer
women serving libraries on a part-time basis than in 1972. Thus, the over-all
data for the employment of women in the schools of theology shows no tendency to
change very rapidly.
Table 13 provides more specific data for the various individual positions
within the three general categories of administration, faculty, and library staff.
As the continuing 12.2% each year might well imply, there has been almost no
change from yt.-: to year for women employees in any administrative post. Numbers
tend to vary only one or two per year, and the shift in percentage is similarly
small.
The total employment picture for women on theological faculties once again
changed only slightly. Curiously enough, the number of full professors actually
diminished by three (from sixteen down to thirteen) despite the fact that full-
time women teachers increased from 65 to 77 this year. In contrast, the number
of associate professors doubled, from twelve to twenty-four. Thus, together
these two normally tenured ranks rose from 28 women to 37 (+32.1%). The percen-
tage of increase is deceptively impressive. These 37 persons still represent only
2.1% of the teaching personnel at these two ranks. And furthermore, this year
there are actually two fewer women employed at assistant professor or higher level
than was true two years ago. Thus, while there has been some upward movement in
rank, the numbers of women teaching full-time have not really shown very much im-
provement. When contrasted with higher education generally in the appointment of
women, theological seminaries do not compare very well.
The library situation remains similarly stable. Both the numbers of women
staff and their percentages fluctuate slightly each year. The very slow trend is
toward a few more women employees, but the shift is so small as to be virtually
imperceptible. As noted in previous years, the highest position (librarian) con-
tinues to be primarily a male prerogative.
-17 -
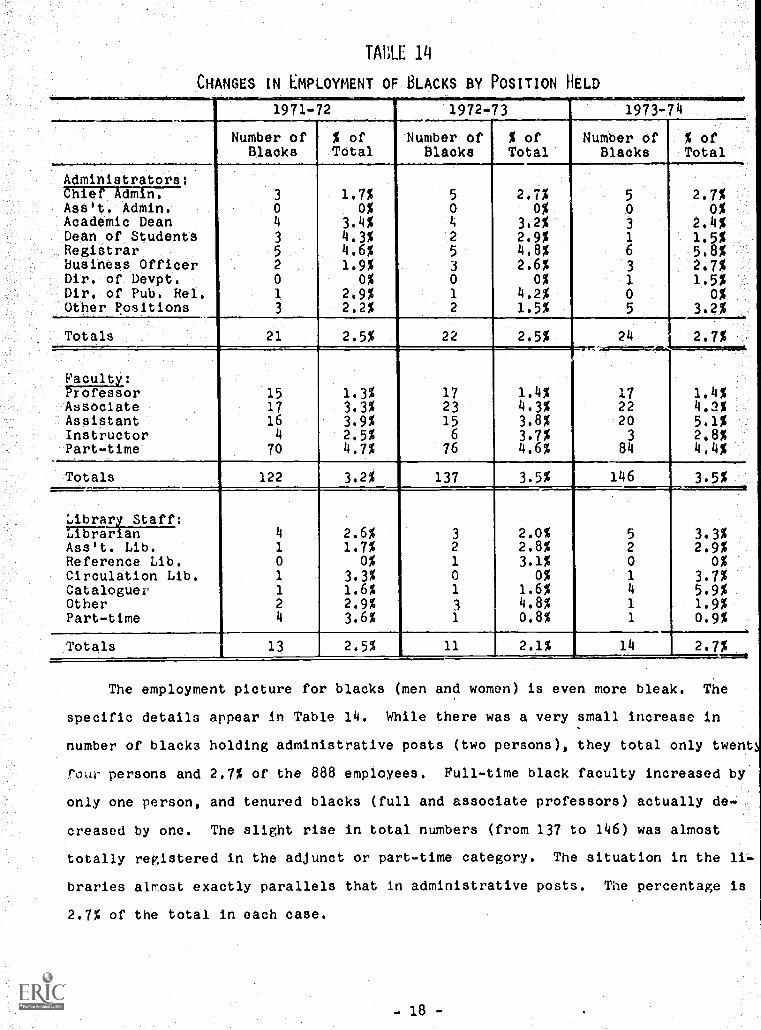
TAME 14
CHANGES IN EMPLOYMENT OF BLACKS BY POSITION HELD
1971 -72 1972 -73 1973 -74
Number ofBlaoks
% ofTotal
Number ofBlacks
% ofTotal
Number ofBlaoks
% ofTotal
Administrators:chief Admin. 3 1.7% 5 2.7% 5 2.7%Assq. Admin. 0 0% 0 0% 0 0%Academic Dean 4 3.4% 4 3,2% 3 2.4%Dean of Students 3 4.3% 2 2,9% 1 1.5%Registrar 5 4.6% 5 4.8% 6 5.8%Business Officer 2 1.9% 3 2,6% 3 2.7%Dir, of Devpt. 0 0% 0 0% 1 1.5%Dir. of Pub. Rel, 1 2.9% 1 4,2% 0 0%Other Positions 3 2.2% 2 1.5% 5 3.2%
Totals 21 2.5% 22 2.5% 24 1=2,=.7%.,..0,....
Faculty:Professor 15 1.3% 17 1.4% 17 1.4%Associate 17 3.3% 23 4.3% 22 4.2%Assistant 16 3.9% 15 3.8% 20 5,1%Instructor 4 2.5% 6 3.7% 3 2.8%Part-time 70 4.7% 76 4.6% 84 4.4%
Totals 122 3.2% 137 3.5% 146 3.5%
Library Staff:riFFirian 4 2.6% 3 2.0% 5 3.3%Ass't. Lib. 1 1.7% 2 2.8% 2 2.9%Reference Lib. 0 0% 1 3.1% 0 0%Circulation Lib. 1 3.3% 0 0% 1 3.7%Cataloguer 1 1.6% 1 1.6% 4 5.9%Other 2 2.9% 3 4.8% 1 1.9%Part-time 4 3.6% 1 0.8% 1 0.9%
Totals 13 2.5% 11 2.1% 14 2.7%
The employment picture for blacks (men and women) is even more bleak. The
specific details appear in Table 14. While there was a very small increase in
number of blacks holding administrative posts (two persons), they total only twent
four persons and 2.7% of the 888 employees. Full-time black faculty increased by
only one person, and tenured blacks (full and associate professors) actually de-
creased by one. The slight rise in total numbers (from 137 to 146) was almost
totally registered in the adjunct or part-time category. The situation in the li-
braries almost exactly parallels that in administrative posts. The percentage is
2.7% of the total in each case.
- 18 -

The import of these statistics is even more startling when one examines
where they are employed. There are five predominantly black schools in the
Association. Together they employ fourteen of the 24 administrators (58.3%),
twenty-five of the 62 full-time black faculty (40.3%), and eight of the 13
full-time librarians (61.5%). Thus, black presence in the 185 primarily white
schools is confined to only 52 persons, as compered filth P7 in the blac% cchoolc.
-19-

FINANCES - REVENUES AND EXPENDITURES
Last year we reported that the trend toward ever larger deficits had
apparently been reversed, when a $5 million excess in expenditures was reduced
by more than fifty percent. That was obviously a very significant improvement
TABLE 15
TRENDS IN TOTAL FINANCIAL DATA
(INCLUDES ALL SCHOOLS)
TotalRevenues
TotalExpenditures
Surplus/Deficit
1968-69 $ 95,585,000 $ 97,345,000 $-1,760,000
1969-70 107,485,000 110,417,000 -2,932,000
1970-71 113,510,000 118,574,000 -5,064,000
1971-72 127,389,000 129,859,000 -2,470,000
1972-73 138,420,000 140,855,000 -2,435,000
in the fiscal .situation, one that was mandatory. 1972-73 saw only very modest
change in the overall financial picture, with the previous $2,470,000 deficit
being reduced by only about one dollar or student. Total revenues rose by +8.7%,
while expenditures were increasing slightly less, +8.5%. A more substantial alter-
ing of this imbalance is clearly essential, since the cumulative deficit for the
five year period has now reached almost $15 million. These data are indicated in
Table 15 above.
A more careful analysis of the factors is evident in Table 16. Using the
standard educational categories found in much higher education reporting, the
Association collects information for Educational and General, student Aid, and
Auxiliary Enterprise revenues and expenditures. Reference should be made to
Tables AA-JJ in the appendices for detailed data in each of these areas for the
various groupings of schools based on size, status, denomination, and region. The
$80 surplus in educational and general income and expenses actually improved by
ten percent to + $88. The Student Aid situation also improved slightly, with
that per student deficit being reduced by ten dollars, or 7.2%. But these achieve-
- 20 -
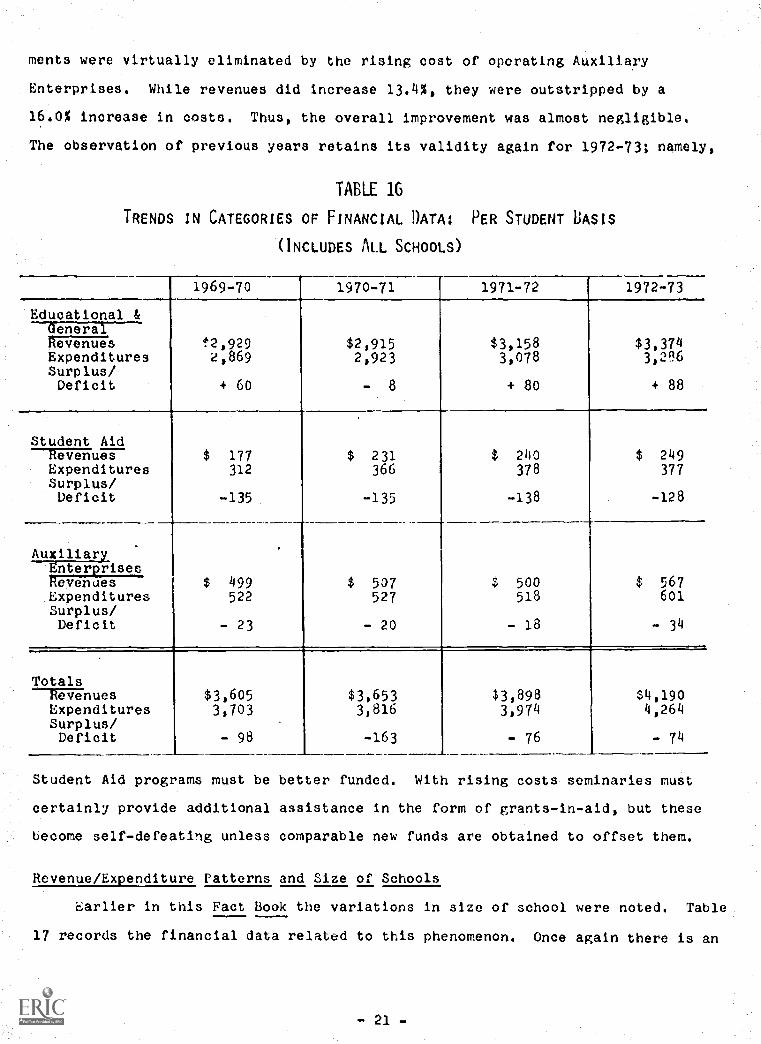
ments were virtually eliminated by the rising cost of operating Auxiliary
Enterprises. While revenues did increase 13.4%, they were outstripped by a
16.0% increase in costs. Thus, the overall improvement was almost negligible.
The observation of previous years retains its validity again for 1972-73; namely,
TABLE 16
TRENDS IN CATEGORIES OF FINANCIAL DATA: PER STUDENT BASIS
(INCLUDES ALL SCHOOLS)
1969-70 1970-71 1971-72 1972-73
Educational &
12,929e,869
+ 60
$2,9152,923
- 8
$3,1583,078
+ 80
$3,3743,296
+ 88
Generalevenues
ExpendituresSurplus/Deficit
Student Aid$ 177 $ 231 $ 2110 $ 249iereFues
Expenditures 312 366 378 377Surplus/Deficit -135 -135 -138 -128
.
Auxiliary.
EnterprisesRevenues $ 499 $ 507 $ 500 $ 567Expenditures 522 527 518 601Surplus/Deficit - 23 - 20 - 18 - 34
Totals--Fg7Fnues $3,605 $3,653 $3,898 $4,190
Expenditures 3,703 3,816 3,974 4,264Surplus/Deficit 98 -163 - 76 - 74
Student Aid programs must be better funded. With rising costs seminaries must
certainly provide additional assistance in the form of grants-in-aid, but these
become self-defeating unless comparable new funds are obtained to offset them.
Revenue/Expenditure Patterns and Size of Schools
Earlier in this Fact Book the variations in size of school were noted. Table
17 records the financial data related to this phenomenon. Once again there is an
- 21 -

TABLE 17
VARIATIONS IN PER STUDENT REVENUE/EXPENDITURES (EDUCATIONAL & GENERAL) BY
SIZE OF SCHOOL (ALL SCHOOLS INCLUDED)
50&under 51-150 151-300 301-5001 501+
1970-71
Revenues $4,797 $3,641 $2,933 $2,747 $2,158Expenditures 5,075 3,792 2,953 2,676 2,051Surplus/Deficit -278 -151 - 20 + 71 +107
1971-72--KFRinues $4,744 $3,795 $3,160 $2,827 $2,247
Expenditures 4,903 3,837 3,048 2,626 2,174Surplus/Deficit -159 - 42 +112 +201 + 73
1972-73Revenues $4,826 $4,012 $3,545 $3,119 $2,176Expenditures 4,963 4,079 3,400 2,990 1,970Surplus/Deficit -137 - 67 +145 +129 +206
1. One school with atypical financial characteristics has been eliminated fromthe 301-500 column in order to avoid distortion of the averages. Precisedetails regarding this may be found in Tables AA and FF.
orderly downward progression in per student data. In 1972-73 it actually cost
151.9% more to educate a person in a school of fifty or fewer students than it
did in those above 500 in enrollment. While these smaller institutions were able
to raise 121.8% more funds per student than the group of the largest size, these
efforts fell substantially short of matching costs. The deficit was $137 per
student. These data, of course, reveal nothing about quality of education or
values related thereto. Some families of schools or individual institutions
prize smallness and low teacher-pupil ratios, but they are by consequence called
upon to raise larger sums of money to finance those expectations. One curious
phenomenon in Table 17 is the fact that schools of 500 and more actually report
lower revenues and expenditures per pupil. An initial inference might be an
actual cash reduction in income and expenditures. This is not accurate however.
Income rose +0.8%; expenditures declined -5.7%; and the number of students being
served rose +4.1%. Together these fantors produce the unusual characteristic
evident in no other year by year comparisons in the table.
- 22-

TABLE 18
TRENDS IN PER STUDENT LDUCATIONAL AND GENERAL
REVENUES AND EXPENDITURES IN DENOMINATIONAL
GROUPS OF SCHOOLS
1969-70Expend.
1970-71Revenue Expend.
19Revenue
1-72Expend.
1972-73Revenue Expend.Revenue
R.C.-Canada1 2,750 2,823 2,313 2,427 2,206 2,440United- Canadal 3,827 4,634 4,318 5,398 4,062 5,351 3,732 4,261Baptist-Am. 4,470 4,860 4,269 4,819 4,304 4,595 4,492 5,0463aptist-So. 1,563 1,421 1,781 1,601 1,835 1,645 1,903 1,682Christ. Chs. 3,557 3,400 3,073 3,118 3,211 3,175 3,649 3,582Luth. Ch. Am. 2,428 2,552 2,796 2,695 3,229 3,251 3,458 3,504Meth.-United 3,177 2,948 3,494 3,118 3,672 3,346 3,747 3,479Prea.-U.S. 3,422 3,467 4,668 4,409 4,601 4,436 4,696 4,621Pres.-United 3,404 3,571 3,084 3,437 3,391 3,722 3,621 3,680Prot. Epis.3 4,984 4,886 5,142 5,681 5,561 5,754 6,313 6,474R.C.-U.S.A.4 3,711 3,441 2,957 2,890 3,269 3,100 3,696 3,517Un.Ch.Christ. 3,088 3,108 3,090 3,245 3,116 3,137 3,211 3,198Inter/Non-Den. 2,882 2,916 3,052 3,180 3,273 3,169 3,498 3,404
3. Includes data for three schools 1969 -71; four in 1971-73.
2. Includes data for six schools in 19b9-10; five in 1970-71; four in 1971-73.
3. Includes data for eleven schools in 1969-70; ten in 1970-73.
4. Includes data for 37 schools in 1969-70; 42 in 1970-71; 47 in 1971-72; and50 in 1972-73.
Denominational, Patterns
In addition to Tables 18 and 19, the reader should consult Tables CC and HH
in the appendices for full details on denominational patterns of financing. It is
readily apparent that variations related to size are even smaller than those among
the denominational families of schools. In 1972-73 revenues ranged from a low of
$1,903 to $6,313 per student from educational and general sources. Expenditures
followed the same patterns. It may be noted that within this category - educational
and general - seven of the groups of schools actually spent less money than was
received. This varies from year to year as may be observed in comparing the vari-
ous annual columns in Table 18.
As indicated in Table 16, this fact alone may actually be quite misleading.
The financial data in aid to students and the providing of auxiliary services
contribute much to theological education's fiscal stability. Hence, reference
- 23 -

TABLE 19
TRENDS IN PER STUDENT TOTAL EXPENSE1 SURPLUS /DEFICIT
IN DENOMINATIONAL GROUPS OF SCHOOLS
1970-71 1971-72 1972-73
R.C.-Canada2United Canhda2Baptist-Am.Baptist-So.Christ, Chs.
$-1,211-1,508- 810+ 169- 352
$- 416-1,343- 316+ 192- 257
$-507-604-517-+224
'-226Luth, Ch. Am. + 20 - 81 - 55Reth.-United + 50 - 63 -105Pres.-U.S. + 113 - 7 - 63Pres.-United, - 430 - 349 -150Prot. Episc 4 - 732 - 563 -642R.C.-U.S.A. - 193 - 100 - 9
Un. Ch. Christ - 308 - .6180
- 64Inter/Non-Den. - 369 - o -256
1. Includes Educational and General, Student Aid, and Auxiliary Enterprisefinancial data.
2. See Table 18 footnotes for numbers of schools included each year.
should be made to Table 19 for the inclusion of this information in the total
picture. For the second successive year, only one group of schools here exhibits
a per student surplus. Paralleling the observation above, seven groups (six of
whom had deficits) report somewhat improved circumstances when compared to the
previous year. Yet even these facts may also give somewhat erroneous impressions.
Such standard operating policies as the accumulation of reserves for unusual (and
usually unbudgeted) major expenditures are simply not reflected in these customary
categories for which the Association collects data. Wherever this commendable
practice prevails, the actual situation will be less favorable than Table 19
implies.
Sources of Revenue
Tables AA and 13B (those based on size and status of schools) reveal only
minute shifts in percentages of revenue source from year to year. Yet some
interesting comparisons are evident within the 1972-73 data. For example, per
student income from tuition is very similar in both accredited and associate
(unaccredited) schools. Schools over 500 in size receive substantially less
-24-

($500 as compared with $807) tuition per student. And institutions with the
highest per student costs (those fifty and under in size) collect the second
lowest tuition from each person. Similar observations may be made about the
other categories. Denominational variations (Table CC) tend to be considerably
wider. For example, the per student tuition ranges from a low of $121 in United
Church of Canada schools to a high of $1,173 in inter- or non-denominational
institutions. The percentages of total educational and general revenues repre-
sented here vary in precisely parallel fashion; i.e., from 3% to 33%. Endowment
provides an even wider range of income (from $70 per student in Canadian Homan
Catholic seminaries to $2,630 for Episcopal schools). Lifts and grants illustrate
similar patterns. Tables DO and EE report revenue information on a regional basis.
The lowest tuition ($325 per student) is in Canada, while the United States north-
east ($1,277) and east ($914) are at the opposite end of this continuum. The most
strikingly atypical percentage figure is the lowest endowment source (only 4%) in
Plains region schools. This is less than one-fourth the second lowest regions
(17% in the Great Lakes and Rocky Mountains areas).
Patterns of Expenditures
Except for the unexpectedly different situation noted above for schools with
more than 500 students, expenditure patterns tend to be darallel from year to
year. There are slight changes, but they are usually restricted to no more than
two or three percentage points in the same item in successive Fact Books. Adminis-.
trative costs range from 26% to 31%; instructional from 40% to 53%; and library
expenditures from 8% to 10%. Thus, groups of schools arranged by size and status
really do not exhibit great differences. Once again it is the denominational
groupings which reveal the most variations. In contrast to a five percentage-
point spread r administration, the denominational range is from 18% (United
Church of Canada) to 35% (American Baptist). That latter figure represents a
rather large increase, as well as the former being an even bigger decrease. The
1971-72 range was from 22% to 32%. Resources devoted to instruction vary sub-
stantially more (40% for Presbyterian-U.S. and Roman Catholic-U.S. up to 63%
for United Church of Canada). Although library expenditures on a percentage
basis show little change, more careful analysis indicates that there was sub-
- 25 -

stantial alteration in some groups of schools. United Church of Canada libraries
received 34,7% less support. Although the decreases were markedly lower, American
Baptist (-3.8%), Lutheran Church in America (-1.4%), and United Presbyterian (-3.5%),
libraries also had actual cash reductions in the percentages indicated. In a period
of rising inflation, when book costs are outstripping many other items in the cost
of living index, such data are not especially encouraging for the future of theo-
logical libraries. In fact, all but two of the denominational groups of schools
increased library support less than the percentage of total increase in educational
and general expenditures. Regional variations within the United SL,,:es tend to
be closely parallel. Only Canada shows much of an exception. It spends a some-
what smaller percentage of its funds for administration, concentrating a corre-
spondingly larger proportion on instruction.

COMPEASATIOA
In an era when inflation continues to rise, data on compensation for
professional employees of schOols of theology become increasin3ly important.
Tables NN-VV present this complete information for administrative personnel,
faculty, and library staff. For all three categories, total compensation is
reported. This includes contract salary, housing allowance or value (if provided),
and other fringe benefits except pension fund contributions. Compensation for
administrators and library staff is for twelve-month employment. Faculty sala-
ries include the same benefits but are for the nine-month academic year duties,
even though these salaries may have been paid in twelve installments. Additional
stipends for such things as summer teaching, etc. are not included.
Cash figures are, of course, misleading, since they do not represent the
impact of inflation on real purchasing power. Consequently, each of the following
tables includes the change in the Consumer Price Index during the preceding aca-
demic year. For example, the increase between July 1, 1969 and June 30, 1970 was
+5.9%. This percentage is placed below the 1970-71 data for ready comparison
with changes in salaries for that year, and an overall net real change is indi-
cated for averages in each of the administrative, faculty, and library categories.
Administrative Personnel
Table 20 presents the salary data for the past five academic years by admin-
istrative post held. As in previous reports, actual dollar amounts as well as
percentage of change have been included. It is quickly apparent that only once
in four years (1972-73) was there a net real gain among administrative personnel
in accredited schools. Thus, while salaries did continue to rise this year (+4.9%),
inflation almost doubled (up from 3.0% to 5,8%) more than offsetting the increases.
Across the four year period real purchasing power showed very little change (+0.8%).
Similar comparisons may be calculated for each position. They reveal very little
deviation from the overall averages.
The data fin. associate schools are somewhat different. Each category stands
well below its counterpart in accredited schools (-19.3% for averages). Yet,
despite the rapid increase in inflation, associate school administrative salaries
-27-

TABU 20
TRENDS IN TOTAL ADMINISTRATIVE COMPENSATION AVERAGES
(EXCLUDES RomAN CATHOLIC SCHOOLS)
Accredited Schools
1969-70 1970-71 1971-72 1972-73
Amount%
Change
1973-74
Amount%
ChangeAmount Amount%
Change Amount%
Change
Chf. Adm. $21,128 $22,308 + 5.6% $22,965 + 3.0% $24,015 + 4.6% $25,311 + 5.4%Asstt. Adm. 15,111 15,744 + 4.2% 16,190 + 2.8% 16,229 + 0.2% 17,141 + 5.6%Acad. Dean 16,590 17,006 + 2.5% 18,301 + 7.6% 19,284 + 5.4% 20,056 + 4.0%Dean Stud. 13,452 13,846 + 2.9% 14,623 + 5.6% 15,328 + 4.8% 15,868 + 3.5%Registrar 9,189 9,998 + 8.8% 10,445 + 4.5% 10,557 + 1.1% 10,480 - 0.7%Bus. Off. 12,899 23,761 + 6.7% 14,532 + 5.6% 15,577 + 7.2% 16,197 + 4.0%Dir. Dev. 14,284 15,252 + 6.8% 15,606 + 2.3% 16,826 + 7.8% 17,632 + 4.8%Pub. Rel. 9,852 11,234 +14.0% 12,470 +11.0% 11,951 - 4.2% 12,516 + 4.7%Other 12,036 11,726 - 2.6% 12,824 + 9.4% 13,388 + 4.4% 14,610 + 9.1%
All Avg. 14,470 15,150 + 4.7% 15 726 + 3.8% 16,719 + 6.3% 17,531 + 4.9%Consumer Price Index Change + 5.91] + 4.4% + 3.0% + 5.8fNet Real Change in Salary - 1.2% - 0.6% + 3.3f, - 0.9%
Associate Schools'
-- --1_1969-70T
Amount
1970-71 19 1- 2 1. le 4
I Amount%
Change Amount Change Amount Change Amount Change
Chf. Adm. $14,876 $14,691 - 1.2% $15,508 + 5.6% $16,782 + 8.2% $17,849 + 6.4%Ass,t. Adm, 12,318 12,536 + 1.8% 8,656 -31.0% 12,296 +42.1% 7,751 -37.0%Acad. Dean 11,736 11,614 - 1.0% 11,494 - 1.0% 12,933 +12.5% 13,551 + 4.8%Dean Stud. 11,636 9,469 -18.6% 11,453 +21.0% 12,428 + 8.5% 13,486 + 8.5%Registrar 7,990 9,183 +14.9% 10,861 +18.3% 10,697 - 1.5% 10,821 + 1.2%Bus. Off. 6,129 9,078 +48.1% 8,759 - 3.5% 9,742 +11.2% 11,134 +14.3%Dir. Dev. 12,103 11,134 - 8.0% 13,014 +16.9% 14,742 +13.3% 13,688 - 7.1%Pub. Rel. 9,410 11,130 +18.3% 9,840 -11.6% 8,820 -10.4% 9,261 + 5.0%Other 6,451 9,006 +39.6% 9,843 + 9.3% 9,645 - 2.0% 12,023 +24.7%
All Avg. 11,494 f 11,908 + 3.6% 12,064 + 1.3% 13,130 + 8.8% 14,153 + 7.8%Consumer Price Index Change + 5.9% + 4.4% + 3.g + 5.8%Net Real Change in Salary - 2.3% - 3.1% + 2.0%
1. One associate member school with salary patterns which are atypical has beeneliminated from this table to avoid undue distortion of the averages.
nonetheless represented a net purchasing power gain of +2.0% as contrasted with the
-0.9% loss in accredited institutions this year. Denominational variations are
considerably larger, ranging from a net real loss of -6.9% for one church to a genu-
ine increase of +7.4% for another. A comparison of Table 00 in consecutive Fact
Books will provide these data. Regional patterns reveal only three areas with net
-28-

eeal gains (Mid East, +1.8%; South East, +3.1%; and South West, +3.5%). The others
sustained losses in purchasing power. See Table PP for these data.
Faculty Compensation
Table 21 provides data on trends in total faculty compensation across the
past five years. For accredited schools' faculty it will be quickly apparent that
TABLE 21
TRENDS IN TOTAL FACULTY COMPENSATION AVERAGES
(EXCLUDES ROMAN CATHOLIC SCHOOLS)
Accredited Schools
-.......191.61:711911-21-
Amount Amount
1971-72 1972-73 197a-74%
Change Amount%
Change,
Amount
%
Change Amount%
Change. ,
Professor $14,108 $15,100 + 7.0% $16,002 + 6.0% $16,805 + 5.0% $17,567 + 4.5%Associate 12,112 12,935 + 6.8% 13,682 + 5.8% 14,419 + 5.4% 14,984 + 3.9%Assistant 10,917 11,459 + 5.0% 11,834 + 3.3% 12,426 + 5.0% 13,114 + 5.5%Instructor 8,828 9,879 +11.9% 8,796 -11.0% 11,736 +33.4% 11,786 + 0.4%
All Av:. 12 949 1 866 + .1% 14 02 + 4.6% 15 418 + 6. % 16 120 + 4 6onsumer ce ndex Chane + .9 + . + 0
et Real Change in Salary + 1.2% + 0.2% + 3.3% - 1.2%
Associate Schoolsl
1969-70 1970-71
Amount%
Change
1 1-
Amount
2
%
Change
10 2-
Amount%
Change
1Q
Amount
4
%
ChangeAmount
Professor $11,481 $11,709 + 2.0% $11,673 - 0.3% $13,332 +14.2% $14,183 + 6.4%Associate 10,464 10,479 + 0.3% 11,334 + 8.0% 12,086 + 6.6% 13,881 +14.9%Assistant 9,211 10,407 +13.0% 10,200 - 2.0% 11,397 +11.7% 12,179 + 6.9%Instructor 9,594 7,565 -21.2% 7,849 + 3.8% 9,804 +24.9% 11,129 +13.5%
All Avg. 10,905 11,137 + 2.1% 11,059 - 0.7% 12,471 +12.8% 13,6193 + .8
Consumer Price Index Change +5.9% + 4.4% + 3.0%-- + 5. %
Net Real Change in Salary - 3:8% - 5.1% + 9.8% + 4.0%
1. Footnote #1 in Table 20 is also applicable to this table.
1973-74 is the worst year of all five. In each preceding period, despite the pres-
sures of inflation, the faculty averages did increase slightly in actual purchasing
power. This year for the first time 1973-74 increases failed to match the cost of
living gain. The net loss was -1.2%. A comparison within ranks indicates that
this would have been even worse, without the larger increments given assistant
-29-

professors. For the second successive year the most significant changes occurred
in the associate schools. Although their all faculty averages are 15.1% below
accredited schools, this gap was reduced somewhat this year when associate schools
showed a cash gain of +9.8% and a net real gain of +4.0%. Just two years ago
accredited schools salaries stood at +23.7% higher. Thus, it is apparent that
improvements in faculty compensation are progressing more quickly in the associ-
ate schools. Among denominational groups of schools, only three posted real gains
in faculty compensation (Lutheran Church in America, +0.7%; Presbyterian Church-
U.S., +2.6%; and the inter- and non-denominational group, +1.5%), all rather small.
The other eight groups sustained real losses. Table Rh provides these comparisons,
as well as the range in average compensation (from $14,204 in Southern Baptist
schools to $17,627 in United Presbyterian institutions). Regional differences
are similarly wide ($14,525 in the Rocky Mountains to $17,534 in the Mid East).
Four regions reported increases greater than the consumer price index growth
(Canada, +3.6%; Mid East, +0.8%; South West, +1.7%; and Rocky Mountains, +2.6%).
The others fell below the cost of living rise. Table SS presents these data in
aetail.
TABLE 22
TRENDS IN LIBRARY STAFF COMPENSATION'
(EXCLUDES ROMAN CATHOLIC SCHOOLS)
_1969-70
Amount
1970-71
Amount%
Change
197
Amount
-72
Change
1972-73
Amount%
Change
197
Amount
-74 _%
Change
AccreditedSchools $ 8,872 9,030 + 1.8% 9,928 + 9.9% 10,672 + 7.5% 11,457 + 7.4%AssociateSchools 7,620 6,909 - 9.3% 7,872 +13.9% 8,198 + 4.1% 8,770 + 7.0%
C.F.I. Change + 5.9% + 4.4% + 3.0% + 5.8%
. Footnote #1 from Table 20 is also applicable to associate schools in this table.
Library Staff Compensation
Table 22 reports the trends in compensation for all library staff personnel
for each of the five years. Persons seeking specific information for the various
library positions will find these in Tables TT-VV, and comparisons can readily be
30 -

made by using the corresponding Fact books published in earlier years. One
rather obvious fact will be immediately apparent. Among administrative, faculty,
and library personnel, it is only the latter whose salaries have risen more than
the consumer price index in each of the past three years.
The Five-Year Compensation Record
Table 23 presents summary data for the five academic years since AATS began
to collect salary information. It requires very little comment, since the per-
centages are quite clear. There has been substantial cash progress in each of
TABLE 23
FIVE YEAR COMPARISONS IN
COMPENSATION PATTERNS
(EXCLUDES ROMAN CATHOLIC SCHOOLS)
1969-70 1973-74 % Change
All Administrative Avg:$14,470 $17,531 +21.2%Accredited Schools
Associate Schools 11,494 14,153 +23.1%
All Faculty Ay g.12,949 16,120 +24.5%Accredited -S6hools
Associate Schools 10,905 13,693 +:)5,6%
All Librar Aug.More ited Schools 8,872 11,457 +29.1%
Associate Schools 7,620 8,770 +15.1%
Consumer Price Index Change: July, 1969 to July, 1973 +20.4%
the categories. Except for librarian in associate member schools, the greater
progress has been among those with lower salaries. Yet despite this monetary im-
provement, almost no real gain in purchasing power has occurred. For administra-
tors in accredited schools it amounts to +0.2% per year; for faculty +1.0% per
year; for librarians +2.2% per year. Associate school administrators and faculty
are better only by a fraction of one percent, and their librarians actually regis-
tered a net loss in purchasing power of -5.3% since 1969. Thus, despite signifi-
cant efforts at improvement, virtually all of the change is absorbed by rising
inflationary costs.
- 31 -

One final word regarding the impact of inflation on compensation for all
seminary professional employees may be appropriate. Across the last academic
year (July 1, 1972 to June 30, 1973) the Consumer Price Index rose +5.8%, al-
most double the +3.0% of the previous year. And the rate of increase has been
continuing to accelerate. In the first five months of the current year (July'1,
1973 through November 30, 1973- -the latest data available at this writing), the
increase has been +4.1%, and the resent annual rate of inflation is calculated
to be at least 9.0%. This certainly should be among the factors considered in
using the data available in this Fact Book when planning budgets and compensa-
tion for 1974 -75.
32-

APPE1D10ESAtli A
INDEX TO CLASSIFICATION
F SCHOOLS
Re e oMinatiOn
IJ64e'
4;
COREDITED47 1r,r,
.
- 4' '1
_
c_,
',1;94MO:Fir ee'4Y 4 4Y$' s
A BAPTIS !NARY OP THE WESTBERKELEY, CALIFORNIA CAMPUSCOVINA, CALIFORNIA CAMPUS
P ERSON COLLEGE SCHOOL OP THEOLOGY., lo, It 0
6512075
4212168
x x .
x x ,
41111X x 1111111111 111111xCIU NAS INSTITUTE SCHOOL OP THEOLOGYWRY THEOLOGICAL SEMINARYMI LANI) THEOLOGICAL SEMINARYMIN PRESBYTERIAN THEOLOGICAL SEMINARY
S ARY
13744311194
2932021534
118483125858
33720015626
.
x
! III
IIII
111111
" x
III III
ill
x11111111
X111111 1111
1 1111
x
. .#
' TON UNIVERSITYRITE DIVIN/TYALVIN THEOLOGICAL. 1 A
SCHOOL OF THEOLOGYSCHOOL
SEMINARY1 Oa X
x
X
T HENTRAL BAPTISTCHICAGO) LUTHERANHICA00 THEOLOGICAL
.
H
AL UNIOTHEOLOGICAL SEMINARY
SCHOOL OF THEOLOGYSEMINARY
L CAL S NARY
1 565
210123262
1
5916212126
X
X
11111'F' III
CLAREMONT)()LOATH ROCHESTER/BEXLEYOLUMBIA THEOLOGICALNCORDIA SEMINARY
NITY SCH1. OF THE PACIPICSCHOOL OF THEOLOGY
HAWCROZERSEMINARY
ST. LOUIS MO.)
236122415966
1336820315R681
x
X
XX
x
xx
X
x
i
OIS'
8
:
it , et c. , S ,'IN' Lt.ERVATIVE BAPTIST THEOLOGICAL SEMINARYUNIVERSITY THEOLOGICAL SCHOOL-UNIVERSITY DIVINITY SCHOOL
i AM SCH$01, OF R LIG ON
175224
318
210267350
c
x
AA
1111 A
x
AA
X,EOM° CAL SEMINARY
DEN THEOLOGICAL SEMINARYANUEL COLLEGE OF VICTORIA UNIVERSITY
-PISCOPAL THEOLOGICAL SCHOOLPISCOPAL THEOLOGICAL SEMINARY OF THE
ST
1 3
23811017
4121117048426)1
20227846654
25110513833581
1731136A118
17200101128
44
X
A x
X x
x x
A A
xx
x
X
x
x
x
x
x
A
x
x
x
111111 II
:'A'O AL LUTHERAN THEOLOGICAL SEMINARY'VANGELICAL THEOLOGICAL SEMINARY'ULM THEOLOGICAL SEMINARYIARIIETT THEOLOGICAL SEMINARY!.,. L THEOLOGICAL SEMINARY
1951387302341?6
2222984906429/94753626620020214367
12
A X
A A)0 Axl A
t--i
A A ) A
X ; xx ; x
x' x
Y Y- ! -x x X
X A
A A X
x,
X
1111
X
I- 11U-t UTREgAH THEOLOGICALSEMINARY
'OLDEN GATE BAPTIST THEOLOGICAL SEMINARYORDONCONWELL THEOLOGICAL SEMINARY'OSHEN BIBLICAL SEMINARY
xt' A THEOLOGICAL UNIONAMMA SCHOOL OP THEOLOGYARTPORD SEMINARY FOUNDATIONARYARD DIVINITY SCHOOL.0 t E'S Y SCHOOL OF RELIGION 11
xx
xIII Ill X
xIL PP SCHOOL OF THEOLOGYINTERDENOMINATIONAL THEOLOGICAL CENTERESUIT SCHOOL OP THEOLOGY AT DERKELEYSUIT SCHOOL OF THEOLOGY TN CHICAGO
',Ili. S_,JNARY
Ax
x
x
Ax
xX
x
x
x
x
x
x
` *WASTER THEOLOGICAL SEMINARY
LEX/ROTOR THEOLOGICAL SEMINARYLOUISVILLE PRESBYTERIAN THEOLOGICAL
,,i
I17110
16051611856
+
148110
1625412254
X
x
x
x
X
X
x
X
x
x
x
xX
Ax
111111111LO HER THEOLOGICAL SEMINARY'LUTHERAN THEOLOGICAL SOUTHERN SEMINARYb, IMMACULATE SEMINARY
--X---
X
x

TARE A
(Cowl's)
INDEX TO CLASSIFICATION
OF SCHOOLS
Region Denomination
v'q P
..y. -i . ..,,- .4." -44 'V --., -,. "I , -. .
x11111
X
A
XA
X
x
ORYKNOLL SEMINARYMCCORMICK THEOLOGICAL SEMINARY
. MCGILL UNIVERSITY PACULTY op BELO/IOUsSTUDIESk S NW= 111
PI
?74R41
P41
III31q341
254
105?RR
1111
XX XIII
x
xx
xX
X))
xx
III
1111x
x
XlIIII
11111'-',I ' BPD THEOLOOICAL SCHOOLMEMPHIS THEOLOOICAL SEMINARYMENNONITE piniAcra, sxMlunityMETHODIST THEOLOOICAL SCHOOL IN OHIO
I ,./ .1 "'.1. ,'IMORAY AN THEOLOOICAL SRMINARYMOUNT SAINT ALPHONSUS SEMINARYMT, ST. MARY'S SEMINARY OF THE WESTNASHOTAH HOUSE
1i18;
105204 4 t.1 4 1 0 0' I , .4 1
NEW ORLEANS BAPTIST THEOLOSICAL SEMINARYNEW YORK THEOLOGICAL SEMINARYNORTN AMERICAN APTIST SEMINARYNORTHERN BAPTIST TNE--4.00ICAL SEMINARY
I)5qR11F55
_5377
IvOR
.1riv 1
6R
1
tn(2415170(907
Ira
110
116irl.,
50
111
1,4 1E LoWAL SEMINARYNORTHWESTERN LUTHERAN THEOLOOICALSEMINeY
PACIFIC LUTHERAN THEOLOOTCAL SEMINARYPACIFIC SCHOOL OP RELIGIONPERRTO MOO. OP fiWcifoSY(PHILADELPHIA) DIVINITY SCHOOL oP THE
PROTESTANT EPISCOPAL CHHRcH(PHILADELPHIA) LUTHERAN THEOL001CAL
cw
HI L 'S UNIVERSITY GRADUATE SEMINARYPITTSBUROS TBE0LOGICAL SEMINARYPONTIFICAL COLLEGE JosminlimPRESBYTERIAN nrmom OP CHRISTIANpUCATION
137101
6)27
1n4111h q14;
4475R14(,1 11
10537111
65
01II)216I 6
1
511
PRO135162
x
xx
'f
k
A
A
xx
x
7
x
7
7
x
x
i
i
A
7
A
11111
x
x
x
111111
x
IIIIIA
PRINCETON INEOLOGICAL SEMINARYREGIS COLLEGE.S1'. BERNARD'S SEMINARYST. CHARLES BORRoME0 SEMINARYST. JOHN'S SEMINARY BRIONTON, MASS,)ST. JOHN'S ilffIVOM s i nr, 0? DIVINITYST. JOSEPH'S SEMINARYST. LOUIS UNIVERSITY nclioni. OP DIVINITYST. MARY SEMINARY (mvvvrAun, 01110)ST. MARY OP THE LAKE SEMINARYST. MARY'S SEMINARY AND UNIVERSITYST. MEINRAD SCHOOL OF THEOLOOYST. PATRICK'S SEMINARY THELOOATESAINT PAUL SCHOOL OF THEOLonY METHODIST
Ow .0 SICAL SEMINARY
131601611
14287
755R767
01
5811106
3010)7R
15?117
(371R51
TR4
6341160
x
:
x
k
A
.
ST. VLADIMIR'S onTnotox THEOLOnICSEMINARY
SAN FRANCISCO TNEOLOSICAL SEMINARYSEABORY-WESTERN TNEOLOOICAL SEMINARYSEVENTH -DAY ADVENT1sT TnEmonicAt
AgagiOYERN
x
BAPTIST THEOLOOICALSEMINARY
SOUTHERN BAPTIST TUEnLon1CAL nvMPIARYSOUTHWESTERN BAPTIST TflEOLOGICAL
, t.iTRINITY COLLEGE FACULTY OP DIVINITYTRINITY EVANGELICAL DIVINITY SCHOOLUNION TototoarcAL SEMINARY (NEW YORK)
I. THEOLOOICAL WITNARY IN VIRGINIA
5.5254522AR
.7
4811940
x
x
x
x
A
x
x
i
_
x
- _ _ 111
- 34 -

TAKE A
(CON7e)
INDEX TO CLASSIFICATION
OP SCHOOLS
Re tort
ti acsZ>
42, ik4.4 b 00 0 0 A., 4 .4
4"i;"
41..1e 4belroomor V 721 1
,, -,, - --.-..,,...,"'S :W., w-cry .4 VT.7 %.1 NY,' N-..3-4.4N"DUNITED THEOLOGICAL SEMINARY 247 225 x x X 1
XUNITED THEOLOGICAL SEMINARY OF THE TWINCITIES 122 157 x x XUNIVERSITY OF CHICAGO DIVINITY SCHOOL 237 2110 x x xUNIVERSITY OP DUBUQUE THEOLOGICALAM 86 111 x x x
uP ST. MICHAEL J COLLEGEPACULTY OF THEOLOGY 133 145 x x A X XUNIVERSITY OF THE SOUTH SCHOOL OFTHEOLOGY 60 59 x x
xYANDERDILT UNIVERSITY DIVINITY SCHOOL 270 254 X:(VIROIRIA) PROTESTANT EPISCOPAL .
THEOLOGICAL SEMINARY 172 155 X X X xVIRGINIA UNION UNIVERSITY SCHOOL OFTHEOLOGY 26 31 x x
.,....WAUJWAalaPLSZILLIMILAU 23 207 x x xWASHINGTON TiiFOLO1ICAL COALITION 205 268WESLEY TEEGICA:, SEMINARY 310 267 X X xWESTERN THEOLOGICAL SEMINARY 115 109 x X 4 X
XWESTON COLLEGE SCHOOL OF THEOLOGY 114 142 x x x xxWOODSTOCK COLLEGE 115 81 x x xxYALE UNIVERSITY DIVINITY SCHOOL/BERKELEY 427 1151,x
ASSOCIATE
ACADIA DIVINITY CoLLEU OF ACADIAUNIVERSITY 42 48xxxx
xATLANTIC SCHOOL OF THEOLOGY 94 152 x x xx-,BANGOR THE^LO3ICAL SEMINARY :123 130 X X X X
BAPTIST MISSIONARY ASSOCIATION THEOLOGICAL2r 34 x xCdPITliA'Y
HOLIer SEMINARY FOUNDATION OFINDIANAPOLIS 31 28 x x x
xCATHOLIC UNIVERSITY OF AMERICA SCHOOL OPTHEOLOGY .224 234 x x x
xCHRIST THE KING SEMINARY 81 x x:
xcowtomum FOR HIGHER EDUCATION-RELTGIONSTUDIES IN OHIO (CONRAD) 54 64 X x X
DeANDRIES SEMINARY 51 x x x xxDR SALES HALL SCHOOL OF THEOLOGY 32 33 x x x xx
RigIMAgErONFS;Tt=34 40 X X X
X40 71- X XXEMMANUEL SCHOOL OF RELIGION 106 120 A X xXERSKINE THEOLOGICAL SEMINARY 23 30 A X
XELICALEVANGEVANGELICAL CONGREGATIONAL SCHOOL OF41 40
xEVANGELICAL SEMINARY PUERTO RICO 47 66 X x XFRANCISCAN SCHOOL OF THEOLOGY 32 36 x x x x XHEBREW UNION COLLEGE - JEWISH INSTITUTEOP RELIGION 442 1287 x x x
xfige CROSS ORTHODOX THEoLOGNAL SCHoOL 4537
440 x
X--
x x
X xx
HOD THEOLOGICAL SEMINARYHURON COLLEGE FACULTY OF THEOLOGY 26 30 x x x x
xIMMACULATE CONCEPTION SEMINARY (MAHWAII,NEW JERSEY) 150 158 x x x
x
EACONCTUUMCSALTAigARY134s4
12163x
x xXXAxX
(SASK.)MENNONITE BRETHREN BIBLICAL SEMINARY 64 75 x x x
xMOUNT ANGEL SEMINARY 36 34' X A X X XNEWMAN THEOLOGICAL COLLEGE 148 160x x x x xNOTRE DAME SEMINARY 185 16,3, xx x xxft couE0 (wAsHINdfial, Ute.) 40 41 2 x xOBLATE COLLEGE OP THE SOUTHWEST 64 65 x x x 4 XPAM THEOLOGICAL SEMINARY 31 28 x x x
i' .NC
-35-
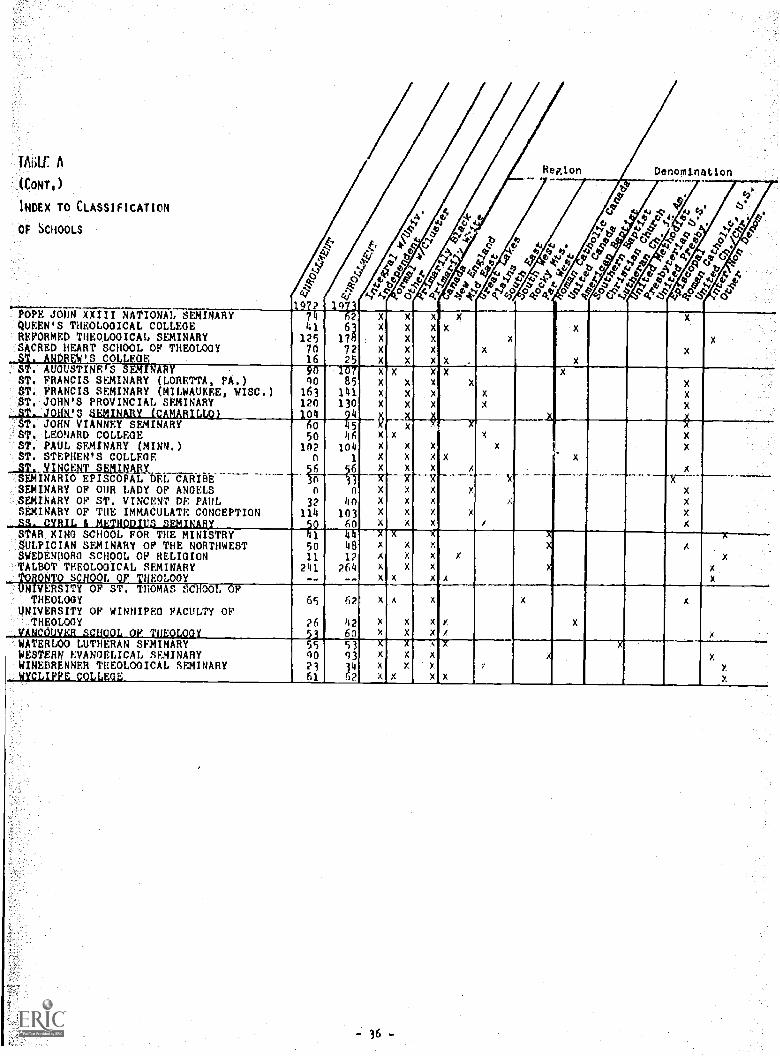
TAiiir A
((oNis)
INDEX TO CLASSIFICATION
OF SCHOOLS
Denomination
"J0 2
411257016
I 4, .p.,-
0
631787225
-,70,-o-Ae.-"KrP,..-,ticx-
X:xxxx
x
X
xx
xX
x
x
Q.- ox-px--s=4'.- v- %-- cv- cr x-x.w R.'4.-Axre- *WYoPOPE JOHN XXIII NATIONAL SEMINAFW47r4j+ricQUEEN'S THEOLOGICAL COLLEGEREFORMED THEOLOGICAL SEMINARYSACRED HEART SCHOOL OP THEOLOGY
,6 'S CO LEGE
XX
x
x
x
x
xX
:$T, AUOUSTINE S $'
ST. FRANCIS SEMINARY (LORETTA, PA.)ST. FRANCIS SEMINARY (MILWAUKEE, WISC.)ST, JOHN'S PROVINCIAL SEMINARYST. 61011W.3 SEMINARY (CAMARILLQ)
901631201 04
8514113094
xx
x
x
x
x
x
x
x
x
1.1-44x
x
xx
x
X
X
x
XX
71x
x
x
x
x
x
x
k
is
Xs
xx
x
Sr 6 JOHN VIANNEY SEMINARYST. LEONARD COLLEOEST. PAUL SEMINARY (MINN.)ST. STEPHEN'S COLLEGE§T. yINCKNT SEMINARY
6050
10205611-7
n
32114
45)16
1041xxxx56
xx
X
x
--A
X
x
x
xx
xx
SEMINARIO EPISCOPAL DEL CARIBESEMINARY OF OUR LADY OF ANGELSSEMINARY OF ST. VINCENT DR PAULSEMINARY OF THE IMMACULATE CONCEPTION
. , 'II, ° w 6.;
)3gx40
10360
x'
x
x
x
xox
X
x,
Nx
X
x
:STAR KING SCHOOL FOR THE MINISTRYHSULPICIAN SEMINARY OP THE NORTHWESTSWEDENDORG SCHOOL OF RELIGION
A'ALDOT THEOLOGICAL SEMINARY2'O4ONTO SCHOOL OP THEOLOGY
11
5011
241--
4812XXXX264-.
x
x
x
.
x
x
x
v
x
x A
'
,
x
A
x
x
X
UNIVERSITY OF ST. THOMAS SCHOOL OPTHEOLOGY
UNIVERSITY OF WINNIPEG FACULTY OFTHEOLOGY
VANCOUVER SCHOOL OF THEOLOGY
65
2653
62
112x60
x
x
A
x
x
x
x
x
x
x
x x
x
WATERLOO LUTHERAN SEMINARYWESTERN EVANGELICAL SEMINARYW/NEDRENNER TIIEOLOOICAL SEMINARY
5500
2361
530334
62
xx
xx x
xx
x
Axx
x
x x
x
Nx
x
r.
-36-

TABLE B.
ENROLLMENT TRENDS OF MEMBER SCHOOLS
1956 - 1973
Data in the table are presented for selected years between 1956 and 1973.Where the first year of membership falls between those listed in the table, itis indicated by the year.
Am. Bapt. of WestBerkeley
Covina
1956 1960
Accredited Schools
1972 19731964 1968
159 131
79
88
83
56
115
65
120
42
121
Anderson 77 78 61 82 75 68
Andover Newton 194 249 336 410 462 469
Aquinas '66-189 197 137 118
Asbury 212 242 264 405 443 483
Ashland9 '66- 41 43 111 125
Austin 134 139 147 112 94 85
Bethanyl 91 95 66 80 59 87
Bethel 108 110 103 207 217 247
Boston 404 406 348 372 293 337
Brite. 147 148 156 148 202 200
Calvin 126 106 174 210 153 156
Candler 420 452 470 476 491 526
Catholic Theoi. Un. '69-119 145 146
Central Baptist 200 59 53 45 65 59
(Chi) Lutheran2 354 451 392 296 219 162
Chicago Sem. 117 135 114 175 123 121
Christian 332 254 214 229 262 267
C.D.S.P. 133 150 108 89 82 93
Claremont 147 136 239 276 360 368
Colgate/Bexley/Crozer3 234 268 323 301 224 203
-37 -
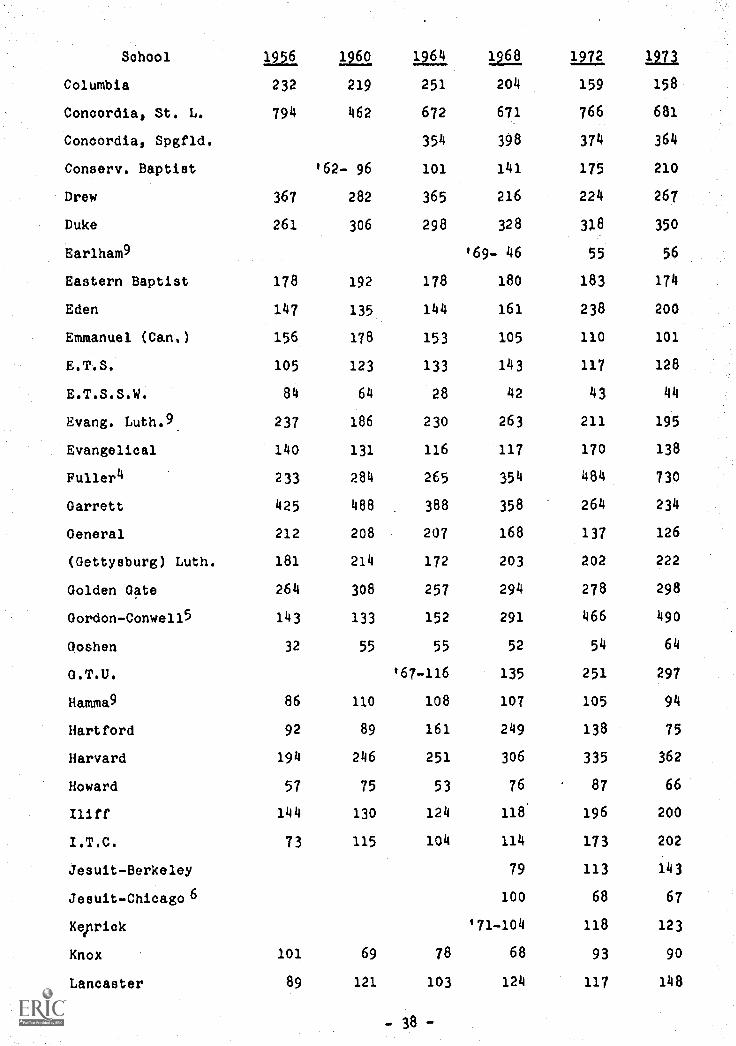
School 1956 1960 1964 Lig 1972 Liu
Columbia 232 219 251 204 159 158
Concordia, St. L. 794 462 672 671 766 681
Concordia, Spgfld. 354 398 374 364
Conserv. Baptist '62- 96 101 141 175 210
Drew 367 282 365 216 224 267
Duke 261 306 298 328 318 350
Earlham9 '69- 46 55 56
Eastern Baptist 178 192 178 180 183 174
Eden 147 135 144 161 238 200
Emmanuel (Can.) 156 178 153 105 110 101
E.T.S. 105 123 133 143 117 128
E.T.S.S.W. 84 64 28 42 43 44
Evang. Luth.9 237 186 230 263 211 195
Evangelical 140 131 116 117 170 138
Fuller4 233 284 265 354 484 730
Garrett 425 488 388 358 264 234
General 212 208 207 168 137 126
(Gettysburg) Luth. 181 214 172 203 202 222
Golden Gate 264 308 257 294 278 298
Gordon-Conwell5 143 133 152 291 466 490
Goshen 32 55 55 52 54 64
G.T.U. '67-116 135 251 297
Hamma9 86 110 108 107 105 94
Hartford 92 89 161 249 138 75
Harvard 194 246 251 306 335 362
Howard 57 75 53 76 87 66
Iliff 144 130 124 118' 196 200
I.T.C. 73 115 104 114 173 202
Jesuit-Berkeley 79 113 143
Jesuit-Chicago 6 100 68 67
Keprick '71-104 118 123
Knox 101 69 78 68 93 90
Lancaster 89 121 103 124 117 148
-38-

School 1956 1960 1964 1968 1972 1973
Lexington 147 144 130 94 110 110
Louisville 167 159 154 144 160 162
Luther 495 457 464 565 516 524
Lutheran Southern 118 83 127 154 138 122
Mary Immaculate '69- 53 56 54
Maryknoll '66-152 102 91 126
McCormick 278 292 208 240 172 303
McGill 70 72 70 118 113 97
McMaster 43 43 35 30 24 27
Meadville 21 27 28 27 27 31
Memphis 51 51 49 54 68 93
Mennonite Bib. 54 57 40 49 41
Methodist, Ohio9 161 153 261 254
Midwestern Bapt. '62-238 154 217 260 267
Moravian 28 39 32 33 46 43
Mt. St. Alphonsus '66- 70 81 94 78
Mt. St. Mary's '69-191 128 134
Nashotah 50 102 95 75 105 105
Nazarene 194 159 158 283 292 288
New Brunswick 56 64 52 35 46 49
New Orleans 461 485 442 691 598 624
New York 132 133 89 140 116 151
No. Am. Bapt. 31 40 31 45 55 70
Northern Bapt. 147 88 89 45 53 69
North Park 92 52 64 80 77 97
Northwest. Luth. 67 85 96 158 195 191
Pacific Luth. 70 86 90, 110 98 110
P.S.R. 148 139 155 170 163 156
Perkins 366 379 328 390 351 395
(Phila.) Divinity 90 69 70 76 68 50
(Phila.) Luth. 227 243 303 208 137 111
Phillips 112 127 106 112 121 134
- 39 -

School 1956 1960 1964 1968 1972 1973
Pittsburgh? 344 258 251 278 337 374
Pont. Josephinum 117 101 105
Pres. C.E. '65-127 125 96 116
Princeton 463 422 506 640 627 658
Regis 86 104 91
St. Bernard's 124 111 143
St. Charles Borr. '69-180 419 216
St. John's (Mass.) 205 172 176
St. John's (Minn.) 67 92 81
St. Joseph's '69- 67 64 59
St. Louis Univ. '69-274 258 280
St. Mary (Ohio) '69-111 146 135
St. Mary of the Lake '70-178 179 162
St. Mary's (Md.) 282 334 304
St. Meinrad '67-152 104 160 169
St. Patrick's '69-139 160 78
Saint Paul (Mo.) '62-159 166 186 142 152
St. Thomas68 87 97
St. Vladimir's '66- 89 93 75 63
San Francisco 294 211 283 423 587 718
Seabury-Western 85 72 107 85 67 59
Seventh-Day 158 123 190 270 301 284
Southeastern 583 700 555 582 581 634
Southern 1,245 844 860 1,077 1,106 1,160
Southwestern 1,213 1,173 1,036 1,735 2,019 2,227
Trinity (Can.) 52 51 68 42 56 67
Trinity Evang. '66-310 434 525 483
Union (N.Y.) 624 632 617 665 452 394
Union (Va.) 293 242 207 348 288 290
United (Ohio)9 213 179 167 190 247 225
United (Minn.) '62- 47 80 122 122 157
Univ. Chicago Div. 197 221 302 431 237 240
- 40 -

School 1956 1960 1964 1968 1972 1973
Univ. Dubuque 114 143 191 226 86 111
Univ. St. Michael's '69- 72 133 145
Univ. South 100 86 74 60 60 59
Vanderbilt 214 168 154 256 270 254
Virginia (Episc.) 181 189 185 180 172 155
Virginia Union 42 23 25 32 26 31
Wartburg 213 201 202 224 203 207
Wash. Coalition '69-277 275 268
Wesley 133 219 239 262 310 267
Western (Mich.) 105 86 107 153 115 109
Weston '66- 79 88 114 142
Woodstock '66-206 1u4 115 81
Yale/Berkeley8 531 506 481 537 427 453
Footnotes
1. Enrollment data reflect separation from Mennonite Biblical Seminary in 1960.
2. Pre-1968 enrollment data are combined totals of prior institutions.
3. Pre-1970 data are combined totals for the three institutions.
4. Fuller's total enrollment includes 110 students enrolled in regular seminarycourses for credit located at four extension centers, as well as its Schoolof Psychology students (69 in 1972, 71 in 1973) enrolled for degrees whiohAATS does not accredit.
5. 1968 figure is combined totals for Gordon and Conwell.
6. The Jesuit School of Theology in Chicago was formerly known as the BellarmineSchool of Theology.
7. 1956 enrollment is combined totals of Pittsburgh - Xenia and Western whichmerged in 1960.
8. Enrollment data are combined totals of Yale and Berkeley prior to 1971 whenthey combined programs.
This school participates in the Conrad D,Min. program. Its enrollees inthat program are listed under Conrr.d in the Associate Schools list.
- 41 -

1956 12§9.
Associate Schools
1972 12721964 1968
Acadia '62- 22 19 31 42 48
Atlanticl 43 62 53 55 94 152
Bangor 2.12 100 93 111 114 123 130
Bapt. Miss. Assn. '71- 26 25 34
Cath, Sem. 'dn. '69- 33 31 28
Catholic Univ. '71-213 224 234
Christ the King3 81
Conradil 54 94
DeAndreis3 51
DeSales 32 33
Dominican 34 40
East. Mennonite '71- 70 40 71
Emmanuel (Tenn.) '70-102 109 120
Erskine 25 49 27 26 23 30
Evang. Cong. '70- 43 41 40
Evang. Puerto Rico 15 33 45 61 47 66
Franciscan '71- 49 32 36
Hebrew-Union '71-393 442 1,287
Holy Cross 35 45 44
Hood 24 22 49 24 37 62
Huron 35 33 32 23 26 30
Immac. Conc. (N.J.) '70-155 150 158
Lincoln Christian '71-160 139 121
Lutheran (Sask.) '66- 30 31 69 63
Mennonite Brethren '70- 49 64 75
Mt. Angel '70- 38 36 34
1lewman '71-126 148 160
Notre Dame 117 185 163
Oblate (D.C.) 40 43
Oblate (Texas) '70- 54 64 65
paynell 12 9 18 21 31 28
- 42 -
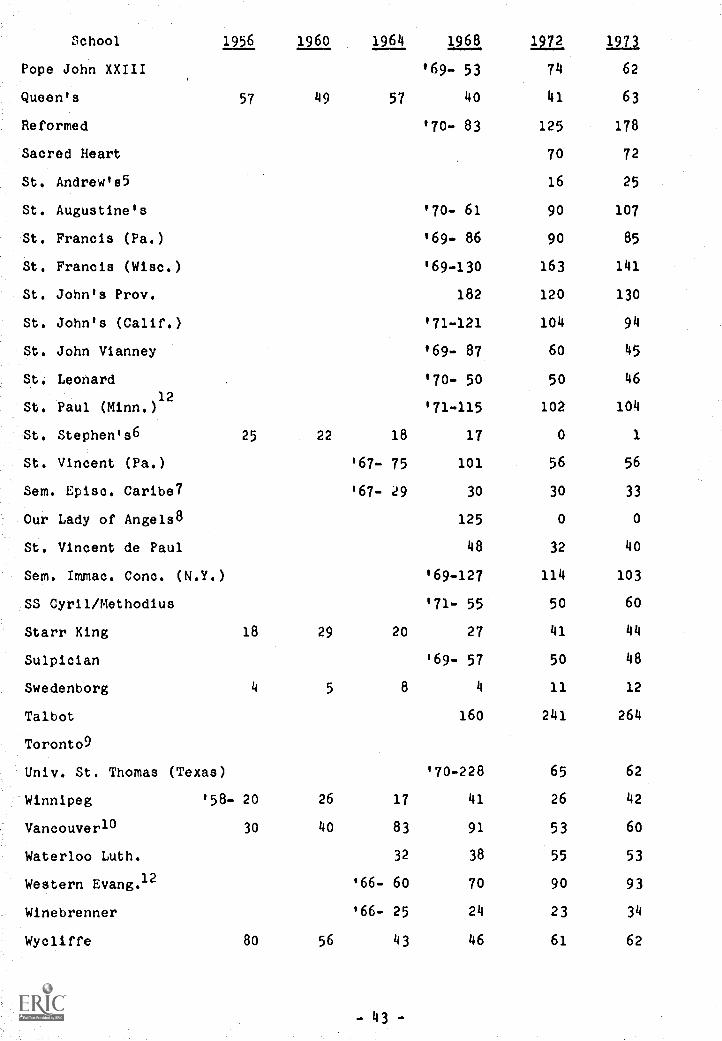
School 1956 1960 1964 1968 1972. 1973
Pope John XXIII
Queen's
Reformed
57 49 57
'69- 53
40
'70- 83
74
41
125
62
63
178
Sacred Heart 70 72
St, Andrew's5 16 25
St. Augustine's '70- 61 90 107
St. Francis (Pa.) '69- 86 90 85
St. Francis (Wisc.) '69-130 163 141
St. John's Prov, 182 120 130
St. John's (Calif.) '71-121 104 94
St, John Vianney '69- 87 60 45
St. Leonard '70- 50 50 46
,
St. Paul (Minn.)12
St. Stephen's6 25 22 18
'71-115
17
102
0
104
1
St. Vincent (Pa.) '67- 75 101 56 56
Sem. Episc, Caribe7 '67- 29 30 30 33
Our Lady of Angels8 125 0 0
St. Vincent de Paul 48 32 40
Sem. Immac. Conc. (N.Y.) '69-127 114 103
SS Cyril/Methodius '71- 55 50 60
Starr King 18 29 20 27 41 44
Sulpician '69- 57 50 48
Swedenborg 4 5 8 4 11 12
Talbot 160 241 264
Toronto9
Univ. St. Thomas (Texas) '70-228 65 62
Winnipeg '58- 20 26 17 41 26 42
Vancouverl° 30 40 83 91 53 60
Waterloo Luth. 32 38 55 53
Western Evang. 12 '66- 60 70 90 93
Winebrenner '66- 25 24 23 34
Wycliffe 80 56 43 46 61 62
-43-
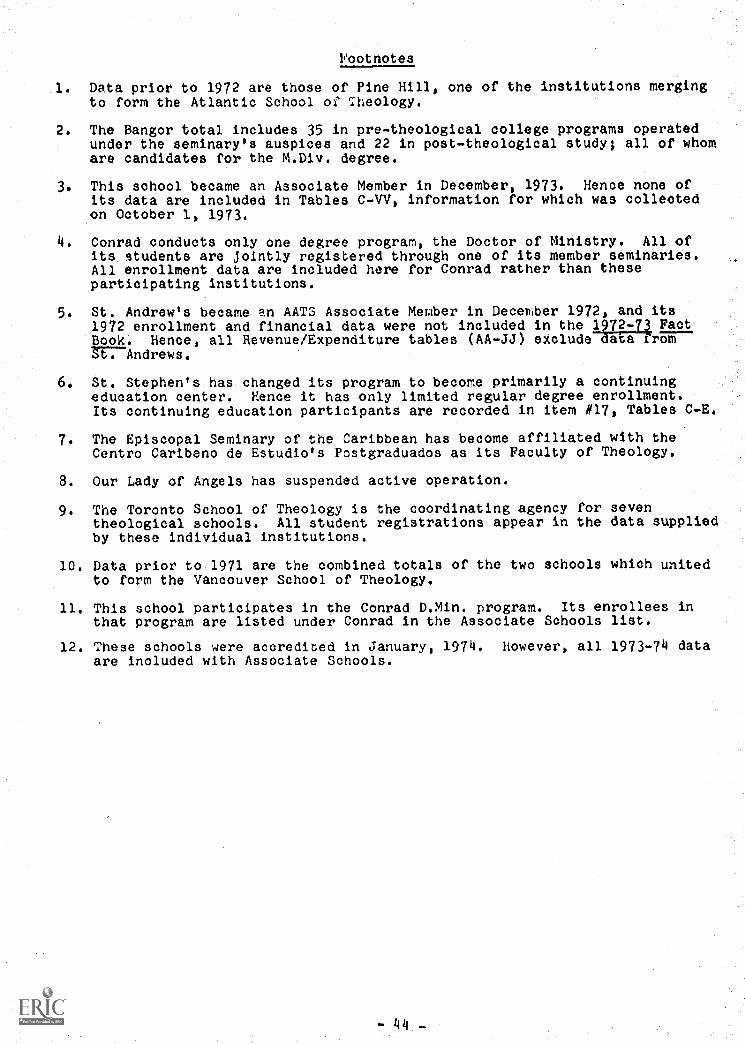
Vootnotes
1. Data prior to 1972 are those of Pine Hill, one of the institutions mergingto form the Atlantic School of Theology.
2. The Bangor total includes 35 in pre-theological college programs operatedunder the seminary's auspices and 22 in post-theological study; all of whomare candidates for the M.Div. degree.
This school became an Associate Member in December, 1973. Hence none ofits data are included in Tables C-VV, information for which was collectedon October 1, 1973.
4. Conrad conducts only one degree program, the Doctor of Ministry. All ofits students are Jointly registered through one of its member seminaries.All enrollment data are included here for Conrad rather than theseparticipating institutions.
St. Andrew's became an AATS Associate Member in December 1972, and its1972 enrollment and financial data were not included in the 1 72- FactBook. Hence, all Revenue/Expenditure tables (AA-JJ) exclude a a r(747--
t. Andrews.
6. St. Stephen's has changed its program to become primarily a continuingeducation center. Hence it has only limited regular degree enrollment.Its continuing education participants are recorded in item #17, Tables C-E.
7. The Episcopal Seminary of the Caribbean has become affiliated with theCentro Caribeno de Estudio's Postgraduados as its Faculty of Theology.
8. Our Lady of Angels has suspended active operation.
9. The Toronto School of Theology is the coordinating agency for seventheological schools. All student registrations appear in the data suppliedby these individual institutions.
10. Data prior to 1971 are the combined totals of the two schools which unitedto form the Vancouver School of Theology.
11. This school participates in the Conrad D.Min. program. Its enrollees inthat program are listed under Conrad in the Associate Schools list.
12. These schools were accredited in January, 1974. however, all 1973-74 dataare included with Associate Schools.
- 44 -

-53
TAW- C.
51-150
ENROLLMENT by SIZE, STATUS, AND RACIAL CHARACTER OF SCHOOL (FALL, 1373)
(includes all sct.00ls)
S:ZE
'LLEZLIF
REL. I, v.:IV.
REL. TO CLUSTEF
151-300
301-507,
501+
AZ;P,L.
ITEOI
=DEP.
FCRT.AL
OT:LEF
RACIAL CHARACT:.E
PRI-EL
PR:-.4-E1-
AvABEF OF SCHOOLS,
32
83
49
15
11
131
55
16
174
71
119
515
PROFESSIONAL PROORA:.:C
1.
ONE-TWO YEARE
A. '.1.A./4.R.E....
32
495
737
234
1,017
2,116
399
164
2,351
1,253
1,262
24
2,491
B. ::.C.::.
30
364
394
23
371
357
37
394
C. :.'...S.w.
42
42
42
42
42
D. A.TH./Y..A.R
21
119
255
382
100
781
96
185
692
330
497
877
2.
THREE YEARE
A. B.D.B.
44
303
68
122
315
222
146
391
305
232
537
E. ::.JIB'.
560
3,174
5,251
3,108
4,345
15,171
1,267
1,676
14,762
7,384
9.054
281
16,157
C. ADV. R.E.
249
912
15
57
72
55
17
72
3.
FOn-FIVE' YEARS
A.737D7TORE-rFITEOP.O.
60
312
319
143
251.
19
375
49
345
394
B. TH.6./M.DIV./.2H.N.
173
1,158
597
258
951
1,210
71
2,120
634
1,557
2,..91
C. D.:.!IN./REL.
23
260
808
532
830
2,353
105
192
2,266
1,550
908
12
2,446
D. D ::.E /LD.D.
73
73
73
49
24
73
E. 5.7..O./D.7..A.
641
47
47
33
14
47
4.
CERT./DIP./SHORT OCr,REE
54
292
166
71
332
705
230
113
322
375
560
54
881
5.
SPECIAL OR UNSLASEIRCED
84
765
856
357
1,002
1,743
1,321
224
2,840
937
2,127
12
3,052
6.
PROFESSIONAL TOTAL
1,063
6,927
3,770
4,361
8,416
24,537
5,200
2,813
27,224
13,361
16,676
383
29,654
GRADUATE PROORAMS
7.
FOUR-FIVE YEARS
T. NONRESI=T-DFXREE
63
60
71
120
79
25
174
27
172
199
E. S.T.M./TH.'!.
62
262
337
247
243
1,044
107
92
1,059
356
795
11,150
C. M.A./:.5.
20
139
204
14
9239
97
173
213
157
229
386
D. TH.3./S.T.3.
340
136
119
405
659
44
120
583
539
164
5698
E. PH.D.
84
539
490
215
1,265
60
705
622
471
857
1,328
3.
GRADUATE TOTAL
35
593
1,276
670
943
3,330
337
1,116
2,651
1,550
2,217
63,751
9.
INT-LT.:5
6326
229
193
300
993
121
60
1,059
442
677
1,119
10. TOTAL IN ALL PROGRAMS
1,154
7,846
10,335
5,929
9,659
29,215
5,708
3,989
30,934
15,353
19,570
389
34,534
11. NONCOLLEOE GRADUATES
104
337
154
31
143
455
364
30
789
216
603
59
760
12. :;ONACCREDITED COLLEGES
776
59
11
32
131
53
5179
46
138
8176
13. NONEZSIM:TS OF ::.S. OR
CANADA
55
286
394
269
213
1,055
170
154
1,041
495
730
33
1,192
14. NU".BER OP ELAC4 ST,,DENTS
76
27::
527
z:2
14.`.
1,:-r
1:.7.
158
1,..0:
-2-
:53
347
n1Fi
15. FIRST YEAR STDENTS
379
2,245
3,014
1,691
2,373
9,301
1,401
1,278
8,424
4.335
5,367
207
9,495
15. AU3:TOFS
229
306
260
266
132
902
341
44
1,199
491
752
11,242
17. CONTI:7ul.:0 LoucATIoN
963
2,955
7,90
4,233
5,617
16,977
4,776
3,181
13,572
9,370
12,383
21,753

DUE D.
ENROLLMENT BY
ENOMINATIONAL AFFILIATION OF SCHOOL (FALL, 1973)
(Includes .II Schools)
CA,.,....A
ill,...
L.:kTr,
CAb.AAJA
UNITED
BAPTIST
AMERICAN
BAPTILT CIRISi-N LLTrIEFA,.
SOUTnR..
Cr1,RCh
LCA
U.:IrED
E.I..
L.S.
PRE.
UNITED
PRES.
PROTEST_
EPISCOP
ROMAN
CATHOLIC
UNITED 1L"..:ER OE
CR.CHR :.X..;-141:-.1.
NUMBER OF SCHOOLS
45
76
48
13
46
10
50
619
PROFESSIONAL PROGRAMS
1.
ONE-TWO YEARS
A. v.A./" ° E.
19
550
916
31
31
82
101
57
7371
33
406
B. M.C.M.
364
23
7
C. M.S.W.
D. M.Th./M.A.R.
127
17
43
174
23
21
12
19
453
2.
THREE YEARS
-117-g7D./S.T.B.
34
54
52
122
97
1
B. M.D/V.
147
4419
2,768
347
704
2,145
182
964
629
1,411
551
2,454
C.
AD
S-.
R.E.
212
348
3.
FOUR-FIVE YEARS
A. NONDEGREE PREORD.
369
19
B. TH.E./x.piv./76.z.
60
71
41,798
C. D.4IN./REE.
102
374
143
284
248
687
11
325
225
D. D.R.L./ED.D.
73
E. S.N.D./D.M.A.
41
6
I4.
cLRT./0IF./SHORT COURSE
29
5373
557
63
33
86
101
52
.=-
cf.
i
5.
SPECIAL OR UNCLASSIFIED
184
43
78
43
59
30
215
54
126
85
526
97
241
6.
PROFESSIONAL TOTAL
446
189
681
4,981
635
775
3,002
591
1,860
778
4,729
1,126
3,864
GRADUATE PROGRAMS
7.
FOUR-FIVE YEARS
A. NORRI.SIDENT DEGREE
S2
50
9B. s.r.m./TR.M.
25
38
14
53
12
107
37
38
193
37
153
34
133
C. M.A./M.S.
614
33
7260
35
D. TH.D./S.T.D.
43
176
2103
12
176
16
46
6141
E. PH.D.
32
451
48
67
21
661
8.
GRADUATE TOTAL
38
43
14
229
26
118
624
50
426
53
576
61
1,029
9.
INTERNS
19
4172
87
840
21
162
38
45
10. TOTAL IN ALL PROGRAMS
503
232
699
5,210
711
1,065
3.713
649
2,326
852
5,467
1,225
4,933
11. NO::COLLEGE GRADUATES
12
33
11
129
711
25
20
20
43
84
106
55
' 12. NONACCREDITED COLLEGES
13. NOJRESIDENTS OF U.S. OR
622
12
22
826
CANADA
12
938
109
25
18
151
34
81
32
107
46
258
14. NUMbER OF BLACK STUDENTS
297
50
22
21
169
26
117
19
58
45
411
15. FIRST YEAR STUDENTS
79
71
245
1,614
242
249
354
159
456
238
1,463
267
1,758
16. AUDITORS
10
135
14
149
89
106
42
54
33
150
77
149
17. CONTINUING EDUCATIOI4
130
403
293
1,024
41
2,269
4,189
996
3,611
164
3,321
410
652

TkLE E.
ENROLLMEW BY REGIONS CFALL, 1973)
ENROO.MENT BY HIGHET DEGREEOFFERED
CANADA
(Includet All Schools)
NEW
MID
GREAT
ENGLAND
LAST
LAKES
PLAINS
SOUTH
EAST
SOUTH
WEST
ROCKY
YTNS.
FAR
WEST
B.D./M.DIV.
(Accredited
Schools Only)
TH.M./S.T.M.
D.MIN.
TH.D./PH.D.
NU' BER OF SCHOOLS
23
13
36
45
18
27
93
20
37
30
21
33
PROFESSIONAL PROGRAMS
1.
ONE-TWO YEARS
A. M.A./M.R.E.
B. M.C.M.
C. M.S.W.
30
41 3
319 2
321
42
105
622
165
535
224
143
399
r43
301 5
138
1,112
339
D. M.TH./M.4.R.
37
273
89
155
47
36
20
213
58
155
127
432
2.
THREE YEARS
FTSM./S-T.b.
88
122
144
43
139
1141
S2
122
B. MDIV
497
1,259
2.597
3,190
2,181
3,517
1,716
246
1,236
2,514
3,340
2,497
6,154
C. ADV. R.E.
93
12
48
15
3.
FOUR-FIVE YEARS
A. NONDECREE PREORD.
162
69
197
22
617
110
14
19
B. TH.B./M.DIV./TH.M.
135
195
441
820
250
75
43
229
511
281
26
C- D.MIN./REL.
188
333
337
137
590
171
6646
940
945
D. D.R.E./ED.D.
33
40
73E. S.M.D./D.M.A.
616
25
47
4.
CERT./DIP./SHORT COURSE
103
97
48
37
101
255
167
4118
119
21
145
438
5.
SPECIAL OR UNCLASSIFIED
302
185
493
1,235
222
286
99
48
186
359
446
296
536
-4 r
6.
PROFESSIONAL TOTAL
61,207
2,433
4,566
6.430
3.064
5,757
3,045
490
3,045
4,114
4,704
4,195
10,308
GPADUATE PROGRAMS
7-
FOUR-FIVE YEARS
A. NOURES:DENT DEGREE
13
18
146
22
,,5
920
B. S.T../TH.Y.
146
76
462
33
155
125
21
375
275
180
467
C. M.A./M.S.-
37
68
al
132
49
19
614
D. TH.D./S.T.D.
18
39
106
17
7129
98
14
275
at
E. P.Z.
K28
28o
154
306
59
186
20
289
1,242
8.
GRADUATE TOTAL
242
401
503
638
375
489
139
17
658
306
203
2,339
9.
INTERNS
35
46
155
322
421
46
62
29
239
367
53
316
10. TCT;.L I:. ALL PRCGRA75
1,454
2,880
5,532
7,390
3,860
6,292
3,246
507
3,732
4,353
5,377
4,451
13,013
11. NONCOLL.-
GRADLA-2ED
103
132
55
138
45
223
34
5Si.
190
62
44
190
12. NoNAooREDITED COLLEGES
15
58
27
37
12
14
30
57
17
16
39
13. NONRESIDENTS OF U.S. OR
CANADA
51
123
198
289
104
179
99
12
170
132
159
191
518
14. NUMBER OF BLACK STUDENTS
699
292
223
40
414
34
493
133
37
239
620
15. FIRST YEAR STUDENTS
365
805
1,433
1,734
1,073
2,180
912
191
1,009
1.376
1,676
1,305
3,540
16. AUDITORS
201
111
158
249
96
134
136
18
90
170
255
138
312
17. CONTINUING EDUCATION
696
249
4,462
3,312
1,656
6,420
2,401
as
2,249
1,436
2,991
1,260
9,499

TAU.E F.
AUMEER COMPLETING PROGRAMS DURING 1972-73
SIZE, STATUS, AND lACIAL CHARACTER OF SCHOOL
(Includes All Schools)
SIZE
MEMBERSHIP
REL. TO UNIV.
REL. TO CLUSTER
RACIAL. CHARACTER
-53
51-150
151-300
301-500
501+
ACCRED.
ASSOC.
INTEGRAL
/NDEP_
FOPXAL
OTHER
PRI-BLK
PRI-Wer
PROFESSIONAL PROGRAMS
1.
ONE-TWO YEARS
AY A./- ° E
11
182
209
91
296
712
77
29
760
359
430
7782
B. 1.0.:*.
37
77
114
8106
70
44
114
C. v..O.:,.
11
56
11
56
11
D. M.7::./M.A.R.
12
54
45
112
42
249
16
56
209
112
153
3262
2.
THREE YEARS
A. B.D./S.T.B.
13
94
75
67
160
89
101
148
153
96
249
B. M.OIV.
142
1,041
1,560
782
1,193
4,448
270
466
4,252
2,049
2,569
71
4.647
C. ADV. R.E.
21
211
13
21
34
24
10
34
3.
FOUR-FIVE YEARS
K. NONDEOREE fREORD.
11
108
224
97
1120
31
...-
90
121
B. TH.B./M.DIV./DIV./TH.M.
48
240
167
45
243
257
14
436
96
404
500
c. D."IIN./REL.
650
179
134
53
448
465
387
328
124
4448
D. D . a . E./ED.D.
18
la
18
11
718
E. S.X.D./D.M.A.
33
66
24
64.
CERT./DIP./SHORT COURSE
19
75
88
584
223
48
59
212
142
129
7264
5.
SPECIAL OR UNCLASSIFIED
10
116
60
259
416
29
21
424
38
407
445
6.
PROFESSIONAL TOTAL
272
1,981
2,387
1,490
1,863
7,079
914
820
7,173
3,420
4,573
92
7,901
GRADUATE PROGRAMS
7.
FOUR-FIV: YEARS
EC. NCNRESIMITDEGRZE
17
37
154
114
41
22
33
55
B. S.T.7./TH.M.
12
95
176
142
125
527
23
52
498
188
362
3547
C. m.A.c4.r.
468
66
69
138
15
82
71
67
86
153
D. TH.D./S.T.D.
429
15
53
92
923
78
77
24
101
E. PH.D.
28
94
56
33
207
4125
86
44
167
211
8.
GRADUATE TOTAL
26
212
402
219
221
1,018
52
296
774
398
672
31,067
9.
TOTAL TN ALL PROGRAMS
288
2,193
2,789
1,709
2,084
8,097
966
1,116
7,947
3,818
5,245
95
8,963

TALLZ G.
umSER COMPLETING PROGRAMSDuRING 172 -73
DENOMINATIONAL AFFILIATIONOF SCHOOL
(Includes All Schools)
PROFESSIONAL PROGRAMS
CANADA
RMN. CATh
CANADA
UNITED
BAPTIST
AMERICAN
BAPTIST CHRIST-N LUTHERAN
SOUTHRN
CHURCH
LCA
UNITED
METH.
U.S.
PREZ.
UNITED
PREZ.
PROTEST.
ROMAN
EP/SCOP CATHOLIC
UNITED I1TEB OR
CM.CHR ATON-DEM.
1.
oNE-Two YEARS
A. Ka7/2.R.E.
14
13
277.
912
37
38
19
189
22
137
B. M.C'.X.
77
829
C. '..S.W.
5D. :1.TR./X.A.R.
15
213
714.
15
316
15
118
2.
THREE YEARS
K. B.D.n.T.E.
13
22
15
64
259
2b. M.DIV.
49
S136
733
76
257
592
82
308
232
354
155
616
C. ADV. R.E.
11
215
3.
LOUR -FIVE; YEARS
r7 NONDErdREE-FffECRD.
1
116
B. TH.B./V..DIV./DIV./TP
"14
14
427
C. D.MIN./RE"...
747
70
38
63
37
138
46
D. D.R.E./ED.D.
18
E. S.X.S./D.M.A.
3
?1
4.
CERT./DIF./ShORT COURSE
11
295
11
115
54
822
.-
No
5.
SPECIAL OR UNCLASSIFIED
11
56
45
301
63
6.
PRDFESsIo:;AL TOTAL
90
67
173
1,263
133
283
753
134
380
300
1,431
338'
1,036
GRADDATE RicOGRAXS
7.
FOCR-FIVE YEARS
1C776115IS:FM-DECREE
28
18
23
b. S.T.X. /TH.;:.
12
422
22
15
20
35
19
97
IS
102
16
101
C. M.A./::.S.
41
11
881
17
D. TE.D./S.T.D.
133
221
910
91
bH. PH.D.
51
14
11
124
3.
GRADUATE TOTAL
12
522
55
19
25
113
28
137
18
221
17
273
9.
TOTAL I. AL
PRoGRAYLE
102
72
200
1,323
202
303
871
212
517
318
1,652
355
1,309

TABLE h,
;LUMBER COMPLETING PROGRAMS DURING 1972-73 DY aEGIONS
(Including All Schools)
:LUMBER COMPLETING PROGRAMS BY HIGHEST DEGREE OFFERE:
(Accredited Schools Only)
PROFESSIONAL FOGRAMf
CANADA
NEW
ENGLAND
MID
EAST
GREAT
LAKES
PLAINS
SOUTh
EAST
S6U7h
WEST
:/CY
:STNS.
FAR
W ST
l.D./q.DIV.
TY M /S T.M
D.MJN.
TH.:)./PR....
1.
ONE-TYo Y_ARE
A.-'1.A./-. 5-Y-
17
55
103
128
24
190
141
31
95
141
110
46
383
E. X.C.'!.
228
43
41
1113
C. M.W.
G.
6r -2
5D. M.Th./.:.A.7.
88
29
51
16
673
34
32
54
117
2.
TEREE YLARS
A. 13.0775 :f.F.
36
66
51
39
25
25
76
15
64
B. M. IV.
139
339
753
979
709
983
401
54
361
734
966
793
1,751
C. ADV. E.E.
62
11
15
13
3.
FOUR-FIVE YEARS
A. NON6EG2LE ffEORD
17
48
63
24
19
b. Th.E./M.DIV./DI./Th.::.
28
20
162
190
26
919
47
143
58
6C. D.MIN./REL.
95
12
41
29
154
45
le
259
161
D. D.R.E./ED.D.
13
518
E. S.r.D./D.::.A.
32
16
4.
CERT./DIP./SEORT C=351:
46
63
17
63
54
45
325
20
528
142
5.
SPECIAL on UNCLASSIFIED
16
54
302
37
21
10
533
13
22
342
..-
6.
PROPES2I0:AL TOTAL
289
732
1,529
1,553
893
1,502
701
106
689
1,114
1,280
1,217
3,121
o 1GRADUATE PROGRAMS
7.
FOUR-FIVE YEARS
A. NONREEI5E=DEGREE
25
322
13
23
14
B. G.T../Tii.::.
29
40
263
45
57
69
20
720
113
120
261
C. M.A./-1.Z.
31
23
13
51
20
15
94
106
D. TH.J./E.T.D.
36
15
55
36
11
218
81
E. PH.D.
743
22
63
II
39
26
207
8.
GRADUATE TOTAL
70
89
348
134
146
164
31
979
135
147
669
9.
TOTAL
ALL pR07,nA1c
359
821
1,677
1,687
1,039
1,666
732
115
767
1,114
1,415
1,364
3,790

1ABLE I.
DENOMINATIONAL AFFILIATION OF PROFESSIONAL ENROLLMENT (FALL, 1973)
1.v SIZE, STATUS, AND RACIAL CHARACTER Of SCHOOL
(Includes All Schools)
SIZE
MEMBERSHIP
REL. TO UNIV.
REL. TO CLUSTER
RACIAL CHARACTER
-50
51-150
151-300
301-503
501+
ACCRED.
ASSOC.
INTEGRAL
INDEF.
FORMAL
OTHER
PRX-BLL PRI-WET
CANADIAN CHURCHES
28
46 4 4
3616
25
14 3 3 220
4120 5 2
23 2
21
1927
12 4 8 7
113 42
366 H 12
84
11614
68
21
267
17255 9
156 4
14
314541
72
175
23566 3 943 1
77 8
43 346
362
23 5
1891
1043
419 2
30
134
151
539 390
2,763
12
21880
369
24 4 1 1
15641 6
301
325
154
14233
57828 9
28121
18 3
278 2 92218
15
12
354
494 47 4 2 743
15
1,482 4
14
473 7
271
248
130 7
1,705
16
274
229
559
3 7 5 2 6
22
10
183
4931 4
68 4
70 7C 4
12 3 3
la
801923
5565
375 2 2 3
11 4
1,222 7 2
133 8
532
153 221
388 50
326
228
706
1 7 2 5
891513
10
4,201 231
1022 1
14
13
21 7 4
1,166
332
36
647 3 3 4
490 2 747
538
27 728 28 a 53
326
71
45 6
18
159
11052
324
741
4,866
3381
53937
101 9
310
47
24
135
104 67
39
777
926
1,088 33 6
61
6422
3,521 2
51
654
11
1,467
1,n7
187
3,42499
789
507
1,792
101
3368
12
268
145
47 1
37
392823
29
36 918
23215
22 342
22 3 9
14
1,170 10 33 4 1
19
4525
40
111
12
137
1232 36 5 1
1,82639
9195
252
65
15 1
13 7
97 7
12 33 6 13
12
54 3
164 1 4 4 4 1 1 911
22 36
16 1 9 3
1,160 4
1543 1
41
91 1
367
ln
109
200
ANGLICAN
BAPTIST
LUTHERAN
PRESBYTERIAN
ROMAN CATHOLIC
UNITED CHURCH
OTHER
UNITED STATES CHURCHES
ADVENTIST, 7TH DAY
BAPTIST, AMER.
BAPTIST, CONSERV.
BAPTIST, GEN'L Co.
NF
BAPTIST, N.A. GEN'L. CONF.
BAPTIST, SOUTHERN
BRETHREN CHURCH
BRETHREN, CHURCH OF
CHRISTIAN CH., DISC.
CHRISTIAN CH., NO. AX.
CH. OF GOD, ANDEESCN
CH. OF GOD IN N.A.
CHURCH OF NAZARENE
EASTERN ORTHODOX
EVANGEL. CONCREG.
EVANGEL. CONVENANT
EVANG. FREE CHURCH
FRIENDS
JEWISH
LUTHERAN, A.L.C.
LUTHERAN, L.C.A.
LUTHERAN,MO. SYNOD
MENNONITE, GEN. CONF.
MENNONITE, BRETHREN
MENNONITE CHURCH
METHODIST, A.N.E.
METHODIST, A.M.E. ZION
METHODIST, UNITED
MORAVIAN
NEW CHURCH
PRESBY., CUABERLAND
PRESBY., U.S.
PRESBY., ASSOC. REF.
PRESBY., UNITED U.S.A.
PROT. EPISCOPAL
REFORMED, CHRISTIAN
REFORMED IN A7M-i.
ROXAN CATHOLIC
UNITARIAN UNIV.
UNITED CH. OF CHRIST
UNDECLARED/NONAFFILIATED
OTHER DENOMINATIONS
1076373
17
420
15892
313
745
216
19180
4,841 69
87
ma
112 27
309
88
46
137
11372
1,198
765
923
1,076
34
25
1058059
2,472
35
1436
748
22
1,458
989
142
187
4,883
105
776
493
1,844
89
83
11
67
173
723
261
166
90
165
30
69
19
306
325
453
33
189
20
184
21
71
3,141
1,754
861
69
21
309
248
3266
33
83
526
27
286
485
343
9129
6107
44
37
28
1,181
268
519
401
558
676
416
331
124
4102
63
26
18
44
1,960
1,672
537
212
20
31
506
285
815
555
944
413
667
6136
10
178
2,199
3,051
112
26
428
452
2O
308
831
1,213
1171 78
74
129
427
25599
6319
44
734
222
11
193
785
4.895
69
90
557
259
2114 31
313
89
46
138
113
180
1,209
787
959
1,09234
25
106
44
45
44
18
79
3,553
4214
348
791
221
19
1::/(6.
142
188
25,248
1 2i4i
1601
107
1,937

TAUE J.
DENOMINATIONAL AFFILIATION OF PROFESSIONALENROLLMENT (FALL, 1973)
LY ANOMINATION OF SCHOOLS
CANADIAN CHURCHES
CANADA
BMN. CATH
CANADA
UNITED
BAPTIST
AMERICAN
(Includes All Scnools)
BAPTIST CHRIST-N LUTHERAN
UNITED
SOUTHRN
CHURCH
LCA
METH.
U.S.
PRES.
UNITED
PRES.
PROTEST.
EPISCOP
ROMAN
CATHOLIC
UNITED INTER OR
CH.CHR NON-DEN.
ANGLICAN
213
12
25
BAPTIST
13
61
4
LUTHERAN
13
1
PRESBYTERIAN
54
14
ROMAN CATHOLIC
403
3
UNITED CHURCH
151
31
1.
17
1
OTHER
91
214
UNITED STATES CHURCHES
ADVENTIST, 7TH DAY
BAPTIST, AMER.
4
344
563
2
10
1
4
15
3
233
593
17
144
BAPTIST, CONSERV.
34
83.
as
BAPTIST, GEN'L CONF.
54
11
11
434
BAPTIST, N.A. GEN'L.
16
33
226
BAPTIST, SOUTHERN
13
4,639
19
145
43
25
27
59
vi 1
BRETHREN CHURCH
BRETHREN, CHURCH OF
CHRISTIAN CH., DISC.
CHRISTIAN CH., NO. An.
CH. OF GOD. ANDERSON
CH. OF GOD IN N.A.
CHURCH OF NAZARENE
2 5 2 3
2 9 515
11
365
14 7 1 1
1
1 556 110 3 7
3 3 1
211 4 1 2
1
2
1 317 1 1 1 1
35 5
78 13
15 4 20
EASTERN ORTHODOX
33
EVANGEL. COAGREG.
21
11
117
EVANGEL. CONVENANT
21
35
326
EVANG. FREE CHURCH
23
20
FRIENDS
41
11
34
331
JEWISH
21
32
922
LUTHERAN, A.L.C.
11
21
59
27
219
121
26
LUTHERAN, L.C.A.
is
1794
14
321
11
22
56
LUTHERAN,MC. SYNOD
63
10
,24
51
210
21
MENNONITE, GEN. CONF.
13
11
MENNONITE, BRETHREN
11
4
MENNONITE CHURCH
METHODIST, A.M.E.
41 1
2 13 4
216
1 41
3 43 31
METHODIST, A.M.E. ZION
59
22
4
METHODIST, UNITED
66
47
130
13
2,295
34
130
12
153
638
MORAVIAN
14
21
42
NEW CHURCH
2
PRESBY., CUMBERLAND
68
11
9
PRESBY., U.S.
PRESBY., ASSOC. REP.
2 211
7 11
56
385
101 1
6192 5
PRESBY., UNITED U.S.A.
32
315
229
42
853
169
384
PROT. EPISCOPAL
36
39
245
14
22
752
11
42
123
REFORMED, CHRISTIAN
15
19
REFORMED IN AMER.
32
16
227
ROMAN CATHOLIC
48
10
424
152
433
84,828
73
143
UNITARIAN UNIV.
31
114
31
25
3
UNITED CH. OF CHRIST
UNDECLARED/NONAFFILIATED
OTHER DENOMINATIONS
1 4
21
14
76
6
152
91328
1 114
70
64
131
7 142
45
33
130
1 410
212
32
4 81
16
50
193
393
815

TABLE K.
DENOMINATIONAL AFFILIATION OF PROFESSIONAL ENROLLMENT BY REGIONS (FALL, 1973)
DENOMINATIONAL AFFILIATION OF PROFESSIONAL
ENROLLMENT BY KIGHEST 9EGREE OFFERED
CANADIAN CHURCHES
CANADA
(Includes All Schools)
NEW
MID
GREAT
ENGLAND
EAST
LAKES
PLAINS
SOUTH
EAST
SOUTH
WEST
ROCKY
MTNS.
FAR
WEST
B.D./M.DIV.
(Accredited Schools Only)
TH.M./S.T.M.
D.MIN.
TH.D./PH.G.
ANGLICAN
162
43
21
14
11
BAPTIST
48
42
412
62
26
74
8
LUTHEFAN
68
14
14
11
PRESBYTERIAN
24
11
22
12
112
ROMAN CATHOLIC
423
22
16
UNITE: CHURCH
242
63
11
11
62
614
OTHER
41
126
512
113
24
21
13
UNITED STATES CHURCHES
ADVENTIST, 7TH DAY
63
283
64
2;1
41
302
17
BAPTIST, AMER.
1141
177
95
79
101
510
159
140
90
376
123
BAPTIST, CONSERV.
32
327
56
293
54
95
54
329
BAPTIST, GEN'L CONF.
82
21
106
27
12
28
16
125
727
BAPTIST, N.A. GEN'L. CONF.
12
14
35
19
219
30
76
21
BAPTIST
SOUTHERN
18
23
23
248
2,267
2,042
11
253
33
25
885
3.686
BRETHREN CHURCH
134
71
26
31
11
BRETHREN, CHURCH OF
25
70
67
44
64
6
CHRISTIAN CH., DISC.
18
20
121
23
128
196
645
811
389
127
CHRISTIAN CH., NO. AM.
1134
3117
14
24
16
11
CH. OF GOD, ANDERSON
12
5Go
210
17
316
51
411
34
CH. OF GOD IN N.A.
717
12
31
36
CHURCH OF NAZARENE
49
266
16
91
8269
11
10
20
EASTERN ORTHODOX
43
43
21
42
41
EVANGEL. CONGREG.
121
13
11
117
72
14
EVANGEL. CONVENANT
16
183
la
33
23
78
29
621
EVANG. FREE CHURCH
41
80
41
617
11
81
57
FRIEND.;
811
36
38
15
32
10
817
JEWISH
14
14
1,167
42
812
26
LUTHERAN, A_I,..C.
420
34
163
509
10
10
37
135
528
19
75
Li:T./MEAN, L.C.A.
24
42
317
237
182
106
51
12
643
36
196
LUTHERAN, M0. SYNOD
313
6379
656
88
19
360
39
26
652
MENNONITE, GEN. CONF.
130
21 ..
27
31
2
MENNONITE, BRETHREN
11
11
21
21
3
MENNONITE CHURCH
31
549
142
13
148
25
6
METHODIST, A.M.E.
96
3o
334
73
715
39
METHODIST, A.M.E. ZION
217
241
17
5
METHODIST, UNITED
3278
531
810
241
1,054
388
121
206
427
.7.0
697
1,808
MORAVIAN
228
23
52
28
16
7
NEW CHURCH
14
2
PRESBY. , CUMBERLAND
336
10
227
12
11
PRESBY., U.O.
146
22
73
11
549
59
624
86
91
101
374
PRESBY., ASSOC. REF.
110
10
26
41
PRESBY., UNITED U.S.A.
1144
503
235
111
166
19
7313
32
242
342
713
PROT. EPISCOPAL
4211
240
165
16
258
58
4124
128
413
87
317
REFORMED, CHRISTIAN
24
123
44
5128
16
REFORMED IN AMER.
757
101
11
21
45
100
10
32
ROMAN CATHOLIC
43
467
1,946
1,342
485
223
12a
103
503
1,682
802
112
641
UNITARIAN UN/V.
49
12
34
12
22
36
72
43
51
UNITED CH. OF CHRIST
2330
156
104
174
33
3.
3_ 65
112
112
368
229
UNDECLARED/NONAFFILIATED
182
95
59
16
45
96
190
33
93
54
282
OTHER DENOMINATIONS
'
13
252
275
373
125
462
126
.78
340
26o
595
134
711

TAUE L.
DENOMINATIONAL nPFILIATION OF GRADUATE ENROLLMENT (FALL, 1973)
EY SIZE, STATUS, AND ;tACIAL CHARACTER OF SCHOOL
CANADIAN CHURCHES
-50
51-150
SIZE
151-300
301-500
(Includes All Schools)
MEMBnSHIP
501+
ACCRED.
ASSOC.
REL. TO UNIV.
INTEGRAL
INDEP.
REL. TO CLUSTER
FORMAL
OTHER
RACIAL CHARACTER
PRI-BLX
PRI-WHT
ANGLICAN
25
11
20
717
10
18
927
BAPTIST
11
41
26
12
216
513
1
LUTHERAN
412
313
313
214
16
PRESBYTERIAN
43
52
34
16
7
ROMAN CATHOLIC
219
92
22
10
725
13
19
32
UNITED CHURCH
16
23
12
26
16
24
18
13
29
42
OTHER
410
21
98
710
116
17
UNITED STATES CHURCHES
ADVENTIST, 7TH DAY
211
76
26
818
521
26
BAPTIST, AMER.
630
15
37
88
17
71
37
51
88
BAPTIST, CONSERV.
14
16
.12
12
12
12
BAPTIST, GEN'L CONF.
81
211
11
110
11
BAPTIST, N.A. GEN'L. CONF.
29
12
13
18
61
13
14
BAPTIST, SOUTHERN
116
5186
203
15
193
155
53
208
BRETHREN CHURCH
12
14
42
24
BRETHREN, CHURCH OF
21
47
16
43
7
1CHRISTIAN CH., DISC.
125
12
22
59
125
35
23
37
60
oN
.e-
CHRISTIA'+ CH., NO. AM.
CE. OP GOD. ANDERSO.;
2 23 3
5 53 5
23 3
2 25 5
iCh. OP GOD IN N.A.
33
32
13
CHURCH 0--' NAZARENE
14
31
93
63
69
EASTERN ORTHODOX
33
11
27
32
81
910
EVANGEL. CONGP.EC.
21
31
23
3
EVANGEL. CONVENANT
42
10
16
214
610
16
EVANG. FREE CHURCH
11
22
66
66
FRIENDS
13
11
63
31
56
JEWISH
120
732
28
32
15
45
A56
60
LUTHERAN, A.L.C.
28
41
15
34
115
312
106
47
71
118
LUTHERAN, L.C.A.
36
55
728
126
13
113
61
65
126
LUTHERAN, MO. SYNOD
12
14
12
41
79
574
51
28
79
MENNONITE, GEN. CON ?.
12
58
26
62
8
MENNONITE, BRETHREN
MENNONITE CHURCH
13
14
11
43
25
METHODIST, A.I.E.
63
92
71
81
8
METHODIST, A.M.E. ZION
11
22
22
METHODIS2, UNITED
12
121
68
145
344
2110
236
178
168
2344
MORAVIAN
11
35
23
23
5
NEW CHURCH
PRESBY., CUMBERLAND
21
35
16
24
6PRESBY., U.s.
13
42
2;
23
103
21
82
63
40
1102
PRESBY., ASSOC. REF.
11
46
15
24
6
PRESBY.
UNITED U.S.A.
736
66
334
441
216
427
307
136
2441
PROT. EPISCOPAL
537
47
33
15
131
641
96
31
106
137
REFORMED, CHRISTIAN
220
64
32
527
131
32
REFORMED IN AMER.
99
35
26
224
323
26
ROMAN CATHOLIC
39
213
408
134
59
687
166
276
577
401
452
853
UNITARIAN UNIV.
210
43
19
511
613
14
UNITED CH. OF CHRIST
117
43
40
32
132
132
101
53
83
133
UNDECLARED/NONAFFILIATED
590
53
12
156
446
114
40
120
163
OTHER DENOMINATIONS
37
119
73
105
333
468
266
74
260
334

TABLE M.
DENOMINATIONAL AFFILIATION OF GRADUATE ENROLLMENT (FALL, 1973)
BY DENOMINATION OF SCHOOLS
(Includes All Schools)
CANADIAN CHURCHES
CANADA
HMN. CATH
CANADA
UNITED
BAPTIST
AMERICAN
BAPTIST CHRIST-N LUTHERAN
SOUTHRN
CHURCH
LCA
UNITED
METH.
U.S.
PRES.
UNITED
PRES.
PROTEST.
EPISCOP
ROMAN
CATHOLIC
UNITED INTER OR
CH.CHR NON-DEN.
ANGLICAN
11
1BAPTIST
13
12
LUTHERAN
4
PRESBYTERIAN
11
ROMAN CATHOLIC
21
23
UNITED CHURCH
28
21
oThEE
53
UNITED STATES CHURCHES
ADVENTIST, 7TH DAY
16
315
BAPTIST, AMER.
72
27
32
11
425
BAPTIST, CONSERV.
18
BAPTIST, GEN'L CONF.
11
3BAPTIST, N.A. GEN'L.
7.
21
t10
BAPTIST, SOUTHERN
166
14
216
BRETHREN CHURCH
13
BRETHREN, CHURCH OF
11
2CHRISTIAN CE., DISC.
110
128
CHRISTIAN CH.. NO. A.
23
CH. OF GOD, ANDERSON
32
CH. OF COD IN N.A.
2I
CHURCH OF NAZARENE
18
EASTERN 077HCDOX
31
EVANGEL. CoNonEo.
11
CONVa:ANT
17
6EvANG. FREE Ch,;RC::
12
FRIENDS
14
JEWISH
41
121
LUTHERAN, A.L.C.
11
91
23
19
222
LUTHERAN, L.C.A.
68
222
23
LUTHERAN,MC. SYNOD
113
71
41
13
MENNONITE, GE.;. CONF.
25
E,L;ONITE, BRETHREN
MEONITE CHURCH
11
12
METHODIST, A.M.E.
27
METHODIST, A.M.L. ZION
2METHODIST,
413
4109
3119
23
474
MORAVIAN
12
2NEW ChU:iCU
PRESBY., =BERLAND
21
11
1PRESBY., U.S.
31
29
30
14
213
9PRESS?., ASrOC. REF.
11
1PRESBY., UNITEi U.S.A.
44
364
46o
PROT. EPISCOPAL
113
15
35
22
64
REFORMED, CHRISTIAN
61.
4REFCRMED IN A"ER.
12
410
ROMAN CATHOLIC
10
21
43
46
7534
14
189
UNITARIAN UNIV.
UNITED Ch. 3F CHRIST
uN0EcLAFED/NONAF7ILIATED
OTHER DENOMINATIONS
39
2 1 3
1 210
117
6043
1 7
31
69
2 6
1 3 2
119 1 7
/4 n
122

TABLE
DENOMINATIONAL AFFILIATION OF GRADUATE ENROLLMENT BY REGIONS (FALL, 1973)
JENOMINATIONAL AFFILIATION OF 5RADU4TE
ENROLLMENT BY ::IGriEST 'AGREE UFFERED
CANADIAN CHDRChES
CANADA
(Includes Al' 5Ch0015)
NEW
MID
GREAT
ENGLAND
EAST
LAKES
PLAIN.,
SO,Tn
LAST
WE:-,T
ROCKY
FAF
WEST
(Ac-rdited Scr.
i
B.D./X.DIV.
TH.M./S.T.M.
Only)
D.MIN.
TH.D./PH.D
ANGLICAN
BAPTIST
LUTHERAN
PRESBYTERIAN
24
15
16 5
1 1
1
1 2 1
1 19 2 2 5
ROMAN CAT;;DLI0
UNITED CLUTCH
OTHER.
29 39 13
2 1 1
1 1 3
11
9 13 7
UNITED STATES CHURCHES
ADVENTIST, 7TH DAY
11
53
41
113
21
BAPTIST, AMER.
13
25
12
59
132
24
19
35
BAPTIST, CONSERV.
13
12
53
27
BAPTIST, CEN'L CONF.
12
62
71
3BAPTIST, N.A. GEN'L. CCNF.
19
42
1G
BAPTIST, SOUTHERN
18
42
73
95
20
3195
BRETHREN CHURCH
22
21
1BRETHREN, CHURGH OF
11
51
3CHRISTIAN Ch., DISC.
612
15
225
14
36
CHRISTIAN CH., NO. AM.
23
23
CH. OF GOD, ANDERSON
14
5CH. OF GOD IN N.A.
32
1CHURCH OF NAZARENE
21
24
9EASTERN ORTHODOX
33
21
13
4
EVANGEL. CONGREC.
1I
11
11
EV:sNGEL. CGNVENANT
32
29
21
7EVANG. FREE cRunch
11
,1
13
3FRIENDS
JEWISH
LUTHERAN, A.L.C.
1 1 31 3
320
24122
31
5 u2
2
3 4
29
14
24
3
62545
LUTHERAN, L.C.A.
326
19
26
10
141
251
234
LUTHERAN, HO. SYNOD
26
936
224
37
253
MENNONITE, GEN. CONF.
11
62
MENNONITE, BRETHREN
MENNONITE CHURCH
11
12
3 8METHODIST, A.M.E.
61
21
METHODIST, A.Y.E. ZION
21
1METHODIST, UNITED
19
44
55
964
31
9124
16
11
31
184 4
MO
RA
VIA
N2
21
NE
WCHURCH
PRESBY.
CUMBERLAND
11
12
15 83
,
PRESBY., U.S.
34
13
531
291
51
PRESBY., ASSOC. REF.
11
22
15
PRESBY., UNITED U.S.A.
22
90
17
47
3313
810 8
134
PROT. EPISCOPAL
214
43
24
122
323
15
98
REFORMED, CHRISTIAN
121
23
51
20
11
REFORMED IN AMER.
110
10
510
67
471
ROMAN CATHOLIC
11
44
314
153
192
36
1102
86
66
37
UNITARIAN UNIV.
32
86
115
UNITED Ch. OF CHRIST
25
24
17
10
81
345
10
21
72
UNDECLARED/NONAFFILIATED
22
17
30
318
88
25
149
OTHER DENOMINATIONS,
923
120 .
57
31
39
253
336
21
266

CHIEF AI:;ICTRATOR
MAL:: WHITE
MALL bLACK
MALb OTnEE
TOTAL
ASSISTA:ZT AJX:1.1.7,7R;.:-
MAL=.:: WHITE
FEMALE WHITE
TOTAL
ACAJZMIC DEA.si
MALE WEITE
FE:IALE WHITE
MALL BLACK
MALE OTHER
TOTAL
DEA:: OF .STUDLNTh
MALE WiiITL
FEMALE WHITE
MALE" BLACK
TOTAL
REOISTRAR
;IA:,:: 'WHITE
FLY.A.,L WKITE
MALE BLACK
FLALL' bLACK
TOTAL
bLI:LI:;ESS OFF:ZEh
MALL WnI7b
FLY.ALL WLT:b
MALL bLACk
FLY.-ALE "c'..ACK
MALE OTHER
DIRLOTOR
:ALL kliTE
FLNALE
:.:ALL BLACK
"..70TAL
viLITL
FE::ALL
TOTAL
OT1iLF.
71ALL wn::z
nv;:iIT;
AALE bLA.:K
:ALL OT:ILE
TOTAL
TA6LE 0.
ADMINISTRATIVE UFFICERS' DISTRIBUTION (FALL. 1973)
BY SIZE, STATUS, Au]) aACIAL CHARACTER OF SCHOOL
SIZE
(Includes All Schools)
MEMBERSHIP
REL. TO UNIV.
REL. TO CLUSTER
RACIAL CHARACTER
-50
51-150
151-300
301-500
501+
ACCRED.
ASSOC.
INTEGRAL
INDEF.
FORMAL
OTHER
FRI-BLIC
PRI -WIiT
27
82
46
16
11
127
55
15
167
68
114
182
22
13
21
44
15
29
84
148
16
11
1
131
57
117
171
72
1116
5
1183
415
18
55
36
11
339
16
31
47
11
11
415
19
55
36
12
a40
16
32
48
13
43
34
919
36
32
3115
42
76
1117
11
11
1
12
3'
31
21
2
11
11
1
14
43
35
11
20
90
33
3120
44
79
2121
524
21
76
45
18
36C
-
15
48
63
11
13
31
23
1.
11
11
525
22
87
49
13
364
17
50
67
322
97
431
14
3t, 7
15
30
45
719
20
25
39
14
3Sc
20
33
53
11
11
22
2
12
14
43
11
3
12
41
32
10
975
29
698
40
64
3101
13
41
23
11
10
71
27
296
38
60
98
25
3'1
92
2y
47
11
11 1 1
1 1 1
11
1
21 1
21 1
16
46
29
12
10
83
30
5108
44
69
2111
318
22
10
955
74
58
25
37
62
12 1
2 1
13 1
2 11
13
4I8
25
10
958
84
62
23
38
165
15
44
16
31
18
910
19
11
21
55
32
5
16
66
521
31
23
12
12
24
10
41
27
23
21
96
26
18
104
49
73
1:2
910
43
21
54
2'
13
13
2T:
41
51
43
22
a
11
22
11
2
10
50
42
28
25
124
31
23
132
66
89
2153

TABLE P.
ADMINISTRATIVE 3FFICERS' irISTRIBUTION (FALL, 1973)
BY DEnomATIoNAL AFFILIATION OF SCHOOL
(=ncludes All Sc.:idols)
vl co
CH:EF AI ::::ISTRATOR
::ALE 1,:,Acii,
:SA
L E
(...
r:L
E,.7
.TOTA:.
ASSIZT: ADMINISTRATOR
MALE ,:h:TE
FLNALL WHITE
TOTAL
ACAJEILIC ilLAN
MALE WHITE
FEMALE WHITE
MALE BLACK
LALE OTHER
TOTA.,
DEAN OF LTUBLNTS
?ALE WHITE
**4-:IAL- 4HITE
'ALL
LACA
TC-L=L
REGISTRAR
MALL WHITE
FEMA:.:1 WHITE
MALE SLACK
F7MALL BLACK
=L
BLIZILSL. OFFICER
MALE WHITE
FEnLE WHITE
MALE BLACK
FEMALE BLACK
MALE OTHER
TOTAL
DIRECTDH DEVELOPMENT
MALE WHITE
FLnAtz. WHITE
;;ALE BLACK
TOTAL
PUBLIC RELATIONS
MALE WHITE
FEMALE. WHITE
TOTAL
OTHER
MALE WHITE
FEv.ALE WHITE
: :ALE BLACK
vALE OTHER
TOTAL
CANADA
RMN. CATh 4 1 1 2 2 2 2 3 3 2
CANADA
UNITED 4 2 2 1 1 2
BAPTIST
AMERICA:, 1 5 3 3 6 6 1 1 4 1 5 5 5 3 3 3 3 3 2 a
BAPTIST CHRIS:7-N LUTHEFA%
SOUTBHN
CHURCH
LCA
64
8
12
1
12
1
112
5
11
25
21
31 3
13
u1
11
4
51
5
62
4 1
62
5
62
4
62
4
21
21
74
52
75
5
UNITED
%LTr..
13 13
6 6 9 9 4 4 4 4 8 4 3 1 8 5 1 6 2 1 3
23 2 1
26.
U.S.
PRES. 4 4 4 4 1 1 2 2 3 1 4 3 3 2 2. 3
UNITED
PPE S. 6 6 4 1 1 6 2 1 3 2 2 5 5 5 5 1 1 2 1
12
PROTEST.
EPISCOP 9 9 3 3 1 1 1 1 3 4 7 1 8 6 6 5 1
ROMA::
CATHOLIC
50 50
16
16
33 1
39
24
24 11 25
30 30
5 5 2 1 3
43 5 43
UNITED IZTER
CH.CHR 6 6 3 3 4 4 3 4 5 1 6 6 6 J.
1 2 1 1 1 3
OR
17 Z 120
11 2
13 8 1 9 7
14 7 1 1 1
10 9 1 111 2 1 3 7 7 3 1
13

TADLE Q,
ADMINISTRATIVE OFFICERS' 0/STRIBUTIOU BY REGIONS (FALL, 1973)
ADMINISTRATIVE OFFICERS' DISTRIBUTION
B`r HIGHEST DEGREE OFFERED
CHIEF ADMINISTRATOR
CANADA
(Includes All Schools)
NEW
MID
GREAT
ENGLAND
EAST
LAKES
PLAINS
SOUTH
EAST
SOUTH
WEST
ROCKY
MTNS.
FAR
WEST
B.D./M.DIV.
(Accredited Schools Only)
TH.M./S.T.M.
D.MIN.
TR-0./FR.D.
MALE WHITE
20
13
34
42
18
24
93
19
37
29
19
32
MALE BLACK
11
31
11
MAU OTHER
11
TOTAL
20
13
35
44
18
27
93
19
38
29
20
34
ASSISTANT ADMINISTRATOR
MALE WHITE
311
94
82
28
68
613
FEMALE WHITE
1TOTAL
13
11
94
82
28
68
613
ACADEMIC DEAN
MALE WHITE
FEMALE WHITE
35
24
32 1
13
18
71
15
22
18
16
26
MALE BLACK
MALE OTHER
21
13
TOTAL
35
26
33
13
19
71
16
22
18
16
29
DEAN OF STUDENTS
MALE WHITE
14
12
19
89
12
715
13
413
FEMALE WHITE
11
11
2MALE BLACK
11
TOTAL
15
13
20
810
12
715
13
615
REGISTRAR
MALE WHITE
64
10
65
21
210
74
8FEMALE WhITE
24
g18
54
21
10
10
10
810
MALE BLACK
11
1FEMALE BLACK
12
11
11
TOTAL
78
18
29
11
12
42
13
21
17
13
20
BUSINESS OFFICER
MALE WHITE
77
20
25
912
51
12
14
15
15
21
FEMALE WHITE
11
13
13
14
21
2MALE BLACK
11
1FEMALE BLACK
11
MALE OTHER
11
TOTAL
88
21
31
10
16
61
12
18
17
16
26
DIRECTOR DEVELOPMENT
MALE WHITE
58
16
515
41
87
$13
23
FEMALE WHITE
21
2MALE OTHER
11
TOTAL
510
16
516
41
97
815
24
PUBLIC RELATIONS
MALE WHITE
26
24
23
42
55
FEMALE WHITE
12
11
11
3TOTAL
14
73
42
34
36
8
OTHER
MALE WHITE
37
32
21
12
20
14
13
18
19
13
40
FEMALE WHITE
14
74
31
62
35
6MALE BLACK
11
32
3MALE OTHER
11
1TOTAL
411
41
25
16
24
14
20
20
22
21
49

SIZE
TALLE R.
FACULTY DISTRIBUTION .(FALL, 1973)
LY SIZE, STATUS, AND 11,CIAL CHARACTER OF SCHOOL
(Includes All Schools)
MEMBERSHIP
REL. TO UNIV.
REL. TO CLIISTER
RACIAL CHARACTER
-50
51-150
151-300
301-500
501*
ACCRED.
ASSOC.
INTEGRAL
INDEF.
FORMAL
OTHER
FaI-BLK
pn-WET.
FULL-TIME FACULTY
PROFECCOR
MALE WIII
81
352
374
187
206
973
227
133
1,067
480
720
51,195
FE::ALL WLITZ
75
110
3la
76
13
MALE 21,ACE
Nom: .: OTIu..ri
2 1
4 25 2
4 1
2 1
16 6
1 1
9 25
Il 4
6 37
10. 7
TOTAL
84
365
386
192
210
1,005
232
144
1,093
502
735
12
1,225
ASSOCIATE PrnFECSOR
MALE WHITE
.
23
146
141
78
78
403
69
67
405
162
310
-
2470
FEMALE WHITE
64
68
24
222
11
13
24
MALE 'BLACK
218
222
121
16
69
..
13
MALL OTHER
12
31
2TOTAL
31
152
163
.87
88
452
69
71
450
192
329
11
51
ASSISTANT PT.WESSOR
MALE WHITE
26
126
92
47
53
284
60
45
299
154
190
1343
FEMALE WHITE
55
84
22
913
13
91
21. .
MALE BLACK
14
7,
51
15
34
14
711
612
FEMALE BLAcK
22
21
.
11
1MALE OTHER
21
-2
32
23
32
5TOTAL
27
137
107
62
58
326
65
6o
331
178
213
9382
INSTRUCTOR
MALL WHITE
530
22
14
15
65
21
779
36
50
36
FEALE WhITE
12
44
513
32
14
88
115
MALE BLACM
11
12
11
22
12
.'MALE OTHEF
11
11
1TOTAL
633
27
20
20
31
25
10
96
46
60
3103
TOTAL FULL -TIME
143
637
633
361
376
1,864
391
285
1,970
918
1,337
35
2,220
PART-TIME FACULTY
OTHER
MALI: iCtITE
140
593
428
245
216
1,199
428
144
1,483
507
1,120
61,621
FEMALE WHITE
16
50
52
34
20
141
40
28
153
74
107
181
MALE BLACK
12
13
33
14
468
813
63
43
33
26
50
FEMALE BLACK
14
12
53
26
62
3a
MALE OTHER
64
42
11
52
14
610
16
FEMALE OTHiR
11
11
23
33
TOTAL PART-TIME
170
672
518
300
251
1,425
486
189
1,722
636
1,275
35
1,876
FULL-TIME EQUIVALE..f
49
199
136
69
69
387
135
44
478
183
339
10
512
TOTALS
TOTAL $ FULL-TIME
148
687
683
361
376
1,864
391
285
1,970
913
1,337
35
2,220
TOTAL # PART-TI4E
170
672
518
300
251
1,425
486
189
1,722
636
1,275
35
1,376
TOTAL # Full-TIME EQUIV.
49
199
136
69
69
387
135
44
478
133
339
10
512
TOTAL # INC. FULL-TIME EQUIV.
197
836
319
430
445
2,251
526
329
2,448
1,101
1,676
45
2,732
FACULTY/STUDENT RATIO
1:5.9
1:8.9
1:12.6
1:13.8
1:21.7
1:13.0
1:10.9
1:12.1
1:12.6
1:13.9
1:11.7
1:8.6
1:12.6

TABLE S.
FACULTY DISTRIBUTION (FALL, 1973)
BY DENOMINATIONAL AFFILIATION OF SCHOOL
(Includes All Schools)
PROFESSOR
CANADA
RMN. CATH
CANADA
UNITED
BAPTIST
AMERICAN
BAPTIST CHRIST-N LUTHERAN
UNITED
SOUTHRN
CHURCH
LCA
METH.
FULL-TIME FACULTY
U.S.
FRES.
UNITED
PRES.
PROTEST.
ROMAN
EPISCOP CATHOLIC
UNITED INTER OR
CR.CHR NON-DEN.
MALE WHITE
22
15
31
115
29
51
150
31
55
60
198
40
143
FEMALE WHITE
11
34
12
MALE BLACK
13
11
110
MALE OTHER
11
22
TOTAL
23
15
33
116
29
51
156
35
57
63
199
43
155
ASSOCIATE PROFESSOR
MALE WHITE
93
14
38
11
20
47
825
18
110
12
58
FEMALE WHITE
93
21
31
3MALE BLACK
41
61
11
8
MALE OTHER
11
TOTAL
'..'
318
48
12
20
57
828
19
114
14
69
ASSISTANT PROFESSOR
MALE WHITE
10
34
24
56
28
514
9128
532
FEMALE WHITE
31
41
22
16
MALE BLACK
32
17
o. r
FEMALE BLACK
MALE OTHER
11 1
11 2
tTOTAL
11
34
27
57
37
517
12
131
648
INSTRUCTOR
MALE WHITE
38
25
35
47
25
FEMALE WHITE
13
23
22
MALE BLACK
2MALE OTHER
1TOTAL
31
11
27
65
49
210
TOTAL FULL-TIME
43
24
56
202
46
80
257
48
108
99
493
65
282
PART-TIME FACULTY
OTHER
MALE WHITE
24
16
36
113
15
32
126
27
43
56
477
75
238
FEMALE WHITE
41
517
22
14
23
745
840
MALE BLACK
110
22
81
14
1_I
30
FEMALE BLACK
22
2MALE OTHER
26
5FEMALE OTHER
1
TOTAL PART-TIME
29
17
51
132
19
34
148
30
49
67
532
88
315
FULL-TIKE EQUIVALENT
74
15
36
49
37
610
19
162
23
77
TOTALS
TOTAL # FULL-TIME
43
24
56
202
46
80
257
48
108
99
493
65
282
TOTAL I PART-TIME
29
17
51
132
19
34
148
30
49
67
532
88
315
TOTAL I Full-TIME EQUIV.
74
15
36
49
37
610
19
162
23
77
TOTAL I INC. FULL-TIME EQUIV.
50
28
71
238
50
89
294
54
118
118
655
88
359
FACULTY/STUDENT RATIO
1:10.1
1:8.3
1:9.8
1:21.9
1:14.2
1:12.0
1:12.6
1:12.0
1:19.7
1:7.2
1:8.3
1:13.9
1:13.8

TABLE T.
FACULTY DISTRIBUTION BY REGIONS (FALL, 1973)
FACULTY DISTRIBUTION By HIGHEST DEGREE OFFERED
anclua-= All Schools)
(Accredited Schools Only)
1 cr.
na 1
PROFESSOR
MALE WHITE
FEMALE WHITE
MALE BLACK
MALE OTHER
TOTAL
ASSOCIATE PROFESSOR
MALE WHITE
FEMALE WHITE
MALE BLACK
MALE OTHER
TOTAL
ASSISTANT PROFESSOR
MALE WHITE
FEMALE WHITE
MALE BLACK
FEMALE BLACK
MALE OTHER
TOTAL
INSTRUCTOR
MALE WHITE
FEMALE WHITE
MALE BLACK
MALE OTHER
TOTAL
TOTAL FULL-TIME
OTHER
MALE WHITE
FEMALE WHITE
MALE BLACK
FEMALE BLACK
MALE OTHER
FEMALE OTHER
TOTAL PART-TIME
FULL-TIME EQUIVALENT
TOTAL 0 FULL-TIME
TOTAL 0 PART-TIME
TOTAL # FULL-TIME EQUIV.
TOTAL # INC. FULL -TIME
EQUIV.
FACULTY-STUDENT RATIO
CANADA
79 1
80
26
26
22 1 1
24 4 4
134 91
11 2 1
105
27
134
105
27
161
1:9.2
NEW
ENGLAND
94 3 3 1
101
35 2 2 1
40
28 6 3 138 3 1 1 5
184
16528
10 2 3
208
51
184
20851
235
1:12.3
MID
EAST
230 1 7 1
239
90 5 3
98 74 3 4
81
29 5 1
35
453
373
46
14 2 2
437
109
453
437
109
562
1:9.8
GREAT
LAKES
254 2 3 1
260
136 4 7
147
80 5 5 1 192
23 4
27
526
3513611 6 3
407
115
526
407
115
641
1:11.5
PLAINS
131 1
132
56 1 1
58 37 1 38 8 1 9
237
18821 5 1
215
56
237
21556
293
1:13.2
SOUTH
EAST
212 5 4 2
223
63 610 1
ao 46 3 5 1 1
56 9 2
11
370
22216
31 2
271
78
370
27178
448
1:14.0
SOUTH
ROCKY
FA-t
WEST
MTNS.
WEST
FULL-TIME FACULTY
80
12
108
11
81
12
109
25
932
42
29
934
24
924
21
1 128
925
81
12
3
10
14
148
31
172
PART-TIME FACULTY
66
29
142
93
11 3
1 13
77
32
159
23
952
TOTALS
148
31
172
77
32
159
23
952
171
40
224
1:19.:.,
1:12.7
1:16.7
B.D./M.DIV.
155 7 1
163
71 2 3
76
75 2 1
78
20
20
337
27421
12 1
3,3
95
33Z
308 95
432
1:10.1
TH.M./S.T.M.
197 1 2
200
85 2 1
88
63 4 1 169 16 1 17
374
22419 5 3
251i
69
374
252
69
443
1:12.1
D.MIH.
165 g 1
174 50 3 6
59
27 2 3 32 5 3 8
273
257
35 18 3 2
315
74
gg 74
347
1:12.8
TH.D./PH.D.
395 1
10 2
408
1741512 3
204
102
15 9 1 2
129
23 7 2 133
774
39260
32 2 2
488
127
174
488
127
901
1:14.4

TABLE U.
LIBRARY STAFF DISTRIRuTION (FALL, 1973)
LIbRAHIA:.
I.IAL= WHITE
FEMALE 14E1TE
MALE BLACK
FEMALE ELAC
MALE OTHLP.
TOTAL
AS0ISTAaT
mALL WHITE
FEMALE W=ITE
:MALE =LACK
-
FEMALE bLACK
MALE WH=H
FEMALE OTHER
TOTAL
REFE1-iE.:CE LIbRAHIA::
MALE WEITL
FEMALE WHITE
TOTAL
CIRCLLATIO:. LIEHARIA;;
MALL WiiITE
FEMALE WHITE
MALE BLACK
TOTAL
CATALOGEE
MALE WHITE
FEMALE WEITE
MALE BLACK
FEMALE
MALE OMER
FEMALE OTHER.
TOTAL
uTa...R
MALE iH:TE
F:MALE W=1TL
FEMALE BL' OK
FEMALE C.) fiLEF.
TOTAL
OTHER
MALE WELTE
FEMALE WE:T=
MALE ELACK
FEMALE OTEEE
FyLL-TIME
FARi-TIME
FULL-TIME EQU:V.
7oTAL I:.C. F.T. EQ;JIV.
-50
15 4 1
20 2 2 1 1 1 2 4 4 1 1 2
11 9 1 2
31
23 738
51-150
45
18 2
65
1614 1 1 4
36 1 6 7 2 4 6 4
12 1 2
19 2
10 1
13
18
29
146
4721
167
SIZE
151-300
33 7 1 1
42 12 7 1
20 3 6 9 1 9
10 5
15 2 1
23 6 9 1
16 7
16 1
120
24 12
132
BY SIZE, STATUS, AND RACIAL CHARACTER Cv- SCHOOL
(Includes All Schools)
MEMBERSHIP
RE.. TO UNIV.
301-500
501+
ACCRED.
ASSOC.
INTEGRAL
INDEF.
FULL-TIME LIBRARY STAFF
10
988
24
6106
31
20
13
429
12
21
21
21
114
10
112
39
11
140
71
33
33
33
21
14
12
125
11
11
11
44
92
54
15
564
32
82
10
32
16
215
64
24
32
25
14
11
45
219
23
18
11
63
23
44
23
41
12
214
97
40
64
42
11
13
12
11
1
33
13
96D
87
61
19
14
519
56
24
72
29
11
11
615
39
13
250
PART-TIME LIBRARY STAFF
85
31
18
544
62
41
21
359
11
23
22
3
TOTALS
54
43312
82
31
363
16
775
42
10
107
11
440
15
847
65
47
352
97
39
410
REL. TO CLUSTER
RACIAL CHARACTER
FORMAL
OTHER
PRI-BLK PRI-WHT
40
72
122
10
23
33
11
11
21.
31
153
98
4147
15
21
38
18
26
11
1/
11
13
426
43
267
55
10
89
17
13
14
27
25
312
21
11
12
15
27
410
14
16
30
46
11
21
12
11
21
1`
226
42
266
613
19
12
19
31
11
11
18
34
151
19
30
49
16
46
52
11
23
5
148
246
9385
38
79
1116
16
39
55
164
285
9440

TAbLE V.
LIBRARY STAFF LaSTRIbJTION (FALL, 1573)
BY DENOMINATIONAL AFFILIATION OF SC400L
(Includes All Schools)
LIBRARIAN
CANADA
RMN. CATH
CANADA
UNITED
BAPTIST
AMERICAN
BAPTIST CHRIST-N LUTHERAN
UNITED
SOUTNRN
CHURCH
LCA
METH.
FULL-TIME LIBRARY STAFF
U.S.
PRES.
UNITED
PRES.
PROTEST.
EPISCOP
ROMAN
CATHOLIC
UNITED INTER OR
CH.CHR NON-DEN.
mALE WHITE
FEMALE WHITE
2 24 1
644
613
-
35
8il
6
MALE BLACK
FEMALE BLACK
11 1
TOTAL
45
64
613
35
939
615
ASSISTANT LIBRARIAN
MALE WHITE
12
11
17
11
10
24
FEMALE WEITE
12
13
82
2MALE BLACK
1FEMALE BLACK
MALE OTHER
1".
FEMALE OTHER
11
1TOTAL
12
23
28
14
219
48
REFERENCE LIBRARIAN
MALE WHITE
21
12
3FEMALE WHITE
16
11
31
3TOTAL.
12
62
25
16
CIRCULATION LIBRARIAN
M4,E WHITE
11
11
FEMALE WHITE
MALE BLACK
12
51
12 1
15
TOTAL
13
15
11
41
6
CATALOGER
MAL.; WHITE
23
FEMALE WHITE
MALE BLACK
11
51
21
32
34
FEMALE BLACK
HALE OTHER
1
11
FEMALE OT:.ER
12
TOTAL
11
51
315
13
49
310
OTHER
MALE WRITE
-1
32
11
FEMALE WHITE
12
17
5FEMALE OTHER
1TOTAL
21
51
96
95
PART-TIME LIBRARY STAFF
OTHER
MALE WHITE
23
12
1.
25
6FEMALE WHITE
22
32
71
13
22
47
FEMALE OTHER
22
TOTALS
FULL-TIME
PART-TIME
FULL-TIME EQUIV.
TOTAL INC. F.T. EQUIV.
9 9
4 1
10 2
23 6 3
8 2 1
13
56 8 4
8 120 3 1
16 1
854917
20 4 2
4615 1
I10
26
913
60
821
17
102
22
57

C.
TAW U.
LIERARY STAFF DISTRIBUTION BY REGIONS (FALL, 1373)
(Includes All Schools)
LIBRARY STAFF D1STRIBUTI0U BY
HiGHEST DEGREE OFFERED
(Accredited Schools Only)
LIBRARIAN
MALE WHITE
FEMALE WHITE
MALE BLACK
FEMALE BLACK
MALE OTHER
TOTAL
ASSISTANT LIBRARIAN
MALE WHITE
FEMALE WHITE
MALE BLACK
FEMALE BLACK
MALE OTHER
FEMALE OTHER
TOTAL
REFERENCE LIBRARIAN
MALE WHITE
FEMALE WHITE
TOTAL
CIRCULATION LIBRARIAN
MALE WHITE
FEMALE WHITE
MALE BLACK
TOTAL
CATALOGER
MALE WHITE
FEMALE WHITE
MALE BLACK
FEMALE BLACK
MALE OTHER
FEMALE OTHER
TOTAL
OTHER
MALE WHITE
FEMALE WHITE
FEMALE BLACK
FEMALE OTHER
TOTAL
OTHER
MALE WHITE
FEMALE WHITE
MALE BLACK
FEMALE OThEF
FULL-TIME
PART-TIME
FULL -TxnE
TOTAL
F.T. EQUIV.
CANADA
10 1 2 3 1 1 1 1 2 1 3 1 1 2 3 3 20 6 2
22
NEW
ENGLAND 8 3
11 4 4 3 3 1 1 2 i 1 8 2 3 5 3 6 2 3311 a
.41
MID
EAST
28 2 1 1
32
16 4 1 122 1 4 5 I 6 7 6
10
16 4 9 1
14
11 6 2 96
19 7
103
GREAT
LAKES
27 8 1 137 8 7 1 2
13 4 4 2 1 1 4 410 1 1
16 7 3
10 1320 1 1 8935
16
105
PLAI:JS
13 3
16 1 4 5 3 3 3 3 1 4 5 1 7 8 4 6 40
12 4
44
SOUTH
EAST
16 5 1 1
23 1 5 1 7 4 2 6 1 4 5 2 8 1 1 1
13 1 5 1 7 6 4 61
10 3
64
SOUTH
ROCKY
FAR
WEST
MTNS.
WEST
FULL-TIME LIBRARY STAFF
71
92
3
73
12
31
12
2
1 61
3 11
31
4
14
14
15
1 25
21
21
42
PART-TIME LIBRARY STAFF
42
310
14
TO
TA
LS
20
530
14
37
a1
328
633
B.D./M.DIV.
20 9
29 7 2 1 2
12 1 1 2 2 6 1 7 2 5 7
1413 1 53
23
11
69
TH.M./S.T.M.
24
28 9 2 1
12 2 3 5 1 1 2 6 7
13 3 2 5 3
10 6513 E
72
D.MIN. 17 1 1 1
20 7 5 1
13 2 2 4 4 4 2 a
10 3 A. 4 2 3 55
13 5CO
TH.D./PH.D.
24 4 2 30 1 1 15 4 9 13 310
13 4
27 1 3 1 228 8
15
23
11 9 2
122
22
-15
233,

Mat AA.
ANALYSIS OF !;EVENUES (1372-73)
bY SIZE, STATUS, AND %AvAL CHARACTER OF Scum_
(Includes all Schools)
SIZE
REL. TO UNIV.
REL. TO CLUSTER
RACIAL CHARACTER
-50
51-150
151-300
301-50,:''
501+
ASSUO.
LIrEGRAL
INDEF.
FORMAL
OTHER
PRI-BLK
°O.1 -WdT
REVENUES
OTU0E= TUITIr
688+
6,151+
8,169+
7,723+
3,667+
22,937+
3,461+
5,077+
21,321+
11,439+
14,959+
304+
264094+
OF TOTAL
12
19
24
31
23
24
19
35
21
25
22
16
23
PE: STUDENT
581
768
867
1,086
500
802
775
1,337
79
7a,
809
859
798
E.:DOWME.:T
1,117+
6,236+
7,690
5,9r.).
2,043+
21,321,4
1,3934
4,170 :
19,053+
9,361+
13,863+
172+
23,052+
% OF TOTAL
19
19
23
24
12
22
10
919
20
20
921
3",n STJDLAT
944
785
828
340
279
746
424
1,098
651
643
750
484
GIFTS & GRANTS
OF TOTAL
2,497+
43
11,835+
36
12,913+
30
9,501+
39
9,566+
60
38,664+
41
7,647+
43
3,396+
24
42,915+
44
18,422+
40
27,890+
42
979+
53
45,332+
41
PER STUDENT
2,110
1,478
1,371
1,337
1,305
1,353
1,712
994
1,467
1,265
1,509
2,766
1,387
CC.:T. SRVICE.5
915+
4,656+
953+
257+
3,r+
2,946+
60+
6,760+
2,597+
4,223+
8+
6,812+
uF TUTAI.
16
15
21
17
75
66
YER STUDENT
773
605
101
36
135
693
15
236
173
236
23
213
OTHER SOURCES
494+
3,153+
3,555+
838+
652+
6,89:'1
1,810+
1,419+
7,283+
3,555+
5.147.
376+
8,326+
% OF TOTAL
810
11
34
1,
1-°
10
87
820
aPER STUDENT
417
374
377
117
90
21
371
373
243
244
270
1,061
250
TOTAL ED. & GE:..
5,710+
32,120+
33,389+
24,293+
15,5 ,
3 ,59',-
-1:,123-;-
51,332,-
45,374+
66,082+
1,839+
159,616+
PER ST:.'D::::T
4,826
4,012
3,545
3,416
2,174
3,21:
3,7
3,72C
3,328.
3,117
3,575
5,135
3,354
L.TJE:47 A:D
623+
1,650+
2,511+
1,986+
1,454+
7,2191
1,005+
1,378+
6,346+
3,392+
4,332+
113+
8,111+
AUX1L:A7.Y E.:T.
515+
5,587+
5,072+
3,399+
4,16S+
16,6291
2,111+
645+
18,095+
7,616+
11,124+
151+
18,589+
TCTAL :',=VENCt:S
6,847+
39,357+
40,972+
29,673+
21,565+
117,542+
20,878+
16,147+
122,273+
56,382+
82,038+
2,103+
136,316+
+ following a figure indicates thousands
* when the oata from one Associate
averages are as follows for the
Member School with atypical financial characteristics are eliminated, the per student
columns 1mmeoiately above:
Tuition
1,084
736
4ndownent
807
324
Gifts & Grants
1.079
1,327
Cont. Services
39
732
Other Sources
110
424
Total Ed. & Gen.
3,119
3,543

TAIlE
ANALYSTS OF REVENUES (1372-73)
EY SIZE, STATUS, AHD 2ACIAL CHARACTER OF SCHOOL
(Excluding Roman Catholic Schools)
-50
51-150
SIZE
151-300
301-500'
501+
MEMBERSHIP
ACCRED.
ASSOC.*
REVENUES
REL. TO UN/V.
Li:LGRAL
INDEF.
REL. TO CLUSTER
FORMAL
OTHER
RACIAL CHAEACTEE
PRI-BL
PRI-WHT
STUD1'...;7 TUITION
470+
3,084+
6,432+
7,287+
3,667+
19,479+
1,460+
4,403+
16,536+
8,870+
12,069+
304+
20,635+
5.' 02 TOTAL
.1.2
1u
22
32
23
24
16
33
21
23
23
16
23
PER STGDEAT
563
653
341
I,14e
5C"
731
663
1,328
734
734
820
859
73C
LNOCI9lE.7
1,067+
4,273+
7,676+
5,332+
2,043+
13,995+
1,451+
4,130+
16,316+
9,044+
11,402+
172+
20,274+
; OF TOTAL
29
23
26
23
12
23
16
31
21
23
22
923
PER STJOLNT
1,339
912
1,004
347
279
772
659
1,246
694
743
774
484
766
GIFTS & GRANTS
OF TOTAL
1,539+
44
9,310+
12,399+
43
9,157+
40
9,566+
60
37,341+
5,060+
57
3,364+
25
39,737+
51
17,450+
46
24,652+
43
979+
41,122+
47
PLR STUDENT
2,358
1,9'6
1,622
1,446
1,305
2,299
1,015
1,649
1,444
1,675
2,722
1,555
=VICES
29+
14+
6+
20+
30+
49+
4+
41+
8+
41+
; OF TOTAL
P4E STLLL.
36
35
82
813
23
7
OTHER SOURCES
445+
1,530+
2,138+
784+
662+
4,417+
741+
1,349+
4,210+
2510+
3,049+.
376+
5,163+
: OF TOTAL.
12
83
45
910
66
620
oPIT, 57;;D:=
558
294
27;
123
90
195
266
467
172
207
196
1,061
193
TJTAL EL. & GEN.
3,649+
13,212+
26,546+
22,645+
15,943+
80,353+
8,742+
13,247+
75,847+
37,882+
51,212+
1,839+
87,255+
PLR STU3E.:T
4,533
3,889
3,749
3,564
2,176
3,268
3,973
3,997
3,230
3,135
3113o
5195
3,299
STUDENT AI::
407+
1,601+
2,380+
1,850+
1,454+
6,945+
744+
1,338+
6,355+
3,198+
4,494+
113+
7,579+
A',.iI:,IARY E.T.
288+
3,238+
3,461+
3,026+
4,168+
13,306+
874+
645+
13.535+
5,715+
8,465+
151+
14,029+
REVE:.:JES
4,344+
23,051+
34,487+
27,521+
21,565+
103,607+
10,360+
15,230+
95,737+
46,795+
64,171+
2,103+
108,864*
+ following a figure Indicates thousands
* +/nen the data from one Associate Member School with atypical
averages are as follows for the columns immediately above:
Tuition
1,148
financial characteristics are eliminated, the oer sv.udent
546
endowment
810
457
Gifts & Grants
1,163
1,564
Cont. Services
017
Other Sources
115
362
Total Ed. & Gen.
3,236
2,976

CO
TABLE CC.
ANALYSIS OF REVENUES (1972-73)
BY DENOMINATIONAL AFFILIATION
OF SCHOOL
All Schools)
CANADA
RMN. CATH
CANADA
UNITED
BAPTIST
AMERICAN
BAPTIST CHRIST-N LUTHERAN
SOUTHRN
CHURCH
LCA
UNITED
METH.
REVENUES
U.S.
PRES.
UNITED
PRES.
PROTEST. ROMAN
EPISCOP
CATHOLIC
UNITED INTER OR
CH.CHR NON-DEN.
STUDENT TUITION
216+
22+
527+
1,322+
704+
567+
3,735+
514+
1,721+
949+
5,243+
1,043+
5,341+
% OF TOTAL
20
315
14
27
14
27
17
24
17
24
27
33
PER STUDENT
453
121
716
273
1,012
493
1,029
807
874
1,077
909
879
1,173
ENDOWMENT
33+
331+
1,289+
988+
801+
458+
2,470+
1,360+
2,586+
2,317+
2,744+
1,078+
4,788+
% OF TOTAL
350
39
10
31
11
18
45
36
41
12
28
30
PER STUDENT
70
1,870
1,752
203
1,152
398
680
2,135
1,313
2,630
476
909
1,052
GIFTS & GRANTS
% OF TOTAL
258+
24
144+
21
1,408+
42
6,638+
72
889+
35
2,799+
70
6,254+
46
869+
29
2,424+
33
2,007+
36
3,953+
18
1,490+
39
4,620+
29
PER STUDENT
542
815
1,912
1,370
1,278
2,435
1,724
1,364
1,230
2,277
685
1,257
1,015
CONT. SERVICES
537+
1+
6,234+
7+
% OF TOTAL
51
29
PER STUDENT
1,130
3.1,081
2
OTHER SOURCES
4+
164+
82+
270+
143+
149+
1,134+
248+
400+
289+
3,138+
195+
1,164+
.13 OF TOTAL
24
22
53
88
55
14
57
PER STUDENT
9925
111
55
205
129
312
389
203
327
544
164
255
TOTAL ED. & GEN.
1,048+
661+
3,307+
9,218+
2,536+
3,973+
13,593+
2,992+
7,130+
5,562+
21,313+
3,806+
15,920+
PER STUDENT
2,206
3,732
4,492
1,903
3,649
3,458
3,747
4,696
3,621
6,313
3,696
3,211
3.498
STUDENT AID
77+
267+
590+
195+
222+
1,074+
394+
1,090+
580+
532+
213+
1.599+
AUXILIARY ENT.
119+
54+
531+
2,103+
143+
648+
1.336+
347+
1,555+
726+
4,441+
534+
2,709+
TOTAL REVENUES
1,167+
792+
4,105+
11,912+
2,875+
4,843+
16,003+
3,733+
9,775+
6,868+
26,286+
4,553+
20,229+
+ following a figure indicates thousands

TAME DD.
ANALYSIS OF REVENUES BY REGIONS (1972-73)
ANALYSIS OF REVENUES BY HIGHEST DEGREE OFFERED
CANADA
NEW
ENGLAND
(Includes All Schools)
MID
GREAT*
EAST
LAKES
PLAINS
SOUTH
EAST
SOUTH
WEST
ROCKY
MTNS.
REVENUES
PAR
WEST
B.D./M.DIV.
(Accredited Schools Only)
TH.M./S.T.M.
DASH.
TH.D./PH.D.
STUDENT TUITION
436+
3,549+
5,292+
5,696+
2,653+
4,187+
1,568+
349+
2,669+
3,373+
4,152+
3,318+
11,132+
% OF TOTAL
11
31
21
22
25
22
22
26
30
23
22
23
26
PER STUDENT
325
1,277
914
873
686
711
525
760
780
720
779
768
886
ENDOWMENT
885+
3,386+
7,324+
4,496+
466+
3,487+
1,910+
233+
1,036+
2,432+
3.091+
3,679+
11,186+
% OF TOTAL
22
30
30
17
418
26
17
11
16
16
25
26
PER STUDENT
661
1,219
1,265
689
120
592
640
509
303
519
580
851
891
GIFTS & GRANTS
1,511+
2,561+
6,853+
12,044+
6,122+
9,770+
3,132+
636+
3,683+
5.553+
8,473+
6,503+
16,098+
% OF TOTAL
38
22
28
46
58
52
44
47
42
38
45
45
38
PER STUDENT
1,129
922
1,184
1,846
1,584
1,660
1,049
1.387
1,077
1,186
1,591
1,505
1,282
CONT. SERVICES
559+
451+
2,821+
1,307+
442+
274+
205+
86+
675+
1,594+
1,298+
13+
370+
% OF TOTAL
14
411
54
12
67
10
7
PER STUDENT
530
162
487
200
114
46
68
186
197
340
243
329
I
OTHER SOURCES
536+
1,316+
1,893+
2,201+
846.-
907+
274+
33+
695+
1,612+
1,496+
759+
2,822+
OF TOTAL
14
11
7a
84
32
711
85
6
tPER STUDENT
237
473
327
337
218
154
91
72
203
344
280
175
TOTAL ED. & GEN. 3,927+
11,262+
24,184+
25,743+
10,530+
18,625+
7,089+
1,336+
8,759+
14,565+
18,510+
14,272+
41,607+
PER STUDENT
2,934
4,055
4,178
3,946
2,725
3,164
2,375
2,917
2,561
3,112
3,476
3,304
STUDENT AID
293+
660+
1,G03+
2,081+
563+
1,839+
511+
81+
593+
737+
1,316+
1,117+
:::::+
AUXILIARY ENT.
686+
1,926+
3,907+
4,511+
2,071+
2,812+
948+
376+
1,504+
2,489+
3,814+
2,374+
6,964+
TOTAL REVENUES
4,905+
13,848+
29,694+
32,336+
13,163+
23,276+
8,549+
1,794+
10.856+
17.791+
23,640+
17,764+
52,293+
+ following a figure indicates thousands
When tne data from one Associate Member School with atypical financial
characteristics are eliminated, the
r student
averages are as follows for the columns immediately
above:
Tuition per student
855
Endowment
642
Gifts & Grants
1,601
Cont. Services
215
Other Sources
345
Total Ed. & Gen_
3,658

TABLE EE.
ANALYSIS OF REVENUES BY REGIONS (1272-73)
(Excluding Roman Catholic Schools)
ANALYSIS OF REVENUES BY HIGHEST DEGREE OFFERED
NEW
MID
GREAT *
SOUTH
SOUTH
ROCKY
FAR
CANADA
ENGLAND
EAST
LAKES
PLAINS
EAST
WEST
MTNS.
WEST
B.D./M.DIV.
STUDENT TUITION
% OF TOTAL
PER STUDENT
ENDOWMENT
% OF TOTAL
PER STUDENT
221+
7255
852+
29
987
3,030+
31
1,253
3,307+
34
1,368
3,173+
21
925
4,955+
34
1,445
4,656+
22
910
4,354+
20
851
1,941+
22
614
351+
4
111
4,037+
22
712
3,487+
19
615
1,457*
21
510
1,893+
28
662
REVENUES
263+
23
709
229+
20
616
2,161+
29
738
1,018+
14
348
GIFTS & GRANTS
S OF TOTAL
4253+
41
2,225+
23
5,181+
35
10,805+
51
5,924+
68
9,412+
53
3,097+
46
616+
54
3,588+
49PER STUDENT
4452
920
1,510
2,113
1,876
1,660
1,084
1,661
CONT. SERVICES
21+
84
14+
5+
; OF TOTAL
1PER STUDENT
199
22
-4OTHER SOURCES
532+
928+
1,166+
1,097+
443+
708+
192+
21+
471+
0S OF TOTAL
18
98
55
42
16
IPER STUDENT
441
384
340
214
140
124
67
56
161
TOTAL ED. & GEA. 2.879+
9,490+
14,484+
20,926+
8,660+
17,649+
6,638+
1,129+
7,238+
PER STUDENT
1335
3,926
4,224
4,093
2,743
3,113
2,325
3,04
STUDENT AID
293+
600+
1,371+
1,862+
553+
1,836+
510+
79+
589+
AUXILIARY ENT.
567+
1,013+
3,023+
3,001+
1,662+
2,669+
867+
292+
1,085+
TOTAL REVENUES
1739+
11,104+
18,878+
25,789+
10,876+
22,154+
8,016+
1,501+
8,911+
+ following a figure indicates thousands
1,784+
21
680
1,185+
13
451
4,846+
57
1,847 5+
2
656+
7250
MT 656+
1,239+
10,371+
(Accredited Schools Only)
TH-M./S.T.M.
3,426+
24
763
2,364+
D.MIN.
3,318+
23
768
3,679+
TH.D./PH.D.
10,317+
25
872
10,849+
16
25
27
526
851
917
7,788+
55
6,503+
45
16,030+
1,735
1.505
1,355
1+
13+
3
524+
759+
2,680+
35
6116
175
226
14,103+
3,142
14,272+
3,304
39,875+
3,372
1,246+
1,117+
3,601+
2,465+
2,374+
6,547+
17,813+
17,764+
50,023+
When the data from one Associate Member School with atypical financial characteristics are eliminated, the 2! student
averages are as follows for the columns immediately above:
Tuition per student
889
Endowment
Gifts & Grants
Cont. Services
Other Sources
Total Ed. & Gen.
805
1,818 3
212
3.727

TABLE FF.
ANALYSIS OF EXPENDITURES
(D72
-73)
BY SIZE, STATUS, AND RACIAL CHARACTER OF SCHOOL
ADMINISTRATION
OF TOTAL
PER STUDENT
PER FACULTY
INSTRUCTION
% OF TOTAL
PER STUDENT
PER FACULTY
LIBRARY
% OF TOTAL
PER STUDENT
PEP FACULTY
OPERAT. & MAINT.
; OF TOTAL
PER STUDENT
PER FACULTY
TOTAL ED. & GEN.
PER STUDENT
PER FACULTY
STUDENT AID
AJXIL/ARY ENT.
TOTAL EXPEND.
-50
1,834+
31
1,550
10,919
2,681+
45
2,266
15,958
532+
9
449
3,166
824+
14
696
4,903
5,871+
4,963
34,948
654+
678+
7,204+
51-150
9,506+
29
1,187
12,442
13,568+
41
1,694
17,759
3,313+
10
413
4,335
6,271+
19
783
8,208
32,658+
4,079
42745
2,459+
5,985+
41,101+
SIZE
151-300
8,984+
28
954
13,388
15,349+
47
1,630
22,874
3,207+
10
340
4,779
4,478+
13
475
6,673
32,018+
3,400
47,716
3,795+
5,333+
41,146+
301-500*
7,567+
32
1,064
17,354
10,900+
46
1,533
25,000
2,489+
10
350
5,707
2,609+
11
367
5,982
23,564+
3,316
54,046
4,072+
3,637+
31,273+
501+
3,810+
26
520
12,251
7,662+
53
1,046
24,637
1,278+
8
174
4,108
1,685+
11
230
5,419
14,436+
1,970
46,417
1,487+
4,208+
20,130+
(Includes All Schools)
MEMBERSdIP
REL. TO UNIV.
ACCRED.
ASSOC.*
INTEGRAL
INDEP.
EXPENDITURES
25,816+
5,885+
2,982+
28,719+
28
33
23
29
903
1,317
785
982
13,191
14,974
10,041
13,988
42,976+
7,184+
7,097+
43,064+
47
40
56
44
1,504
1,608
1,869
1,472
21,960
18,280
23,895
20,975
9,310+
1,508+
1,476+
9,343+
10
811
9
325
337
388
319
4,757
3,837
4,969
4,550
12,653+
3,214+
964+
14,903+
13
18
715
442
719
254
509
6,465
8,179
3,247
7,258
90,755+
17,792+
12,519+
96,028+
3,176
3,983
3,298
3,284
46,374
45,272
42,152
46,774
10,907+
1,560+
3,358+
9,108+
17,223+
2,618+
697+
19,145+
118,885+
21,970+
16,574+
124,280+
REL. TO CLUSTER
FORMAL
OTHER
12,264+ 19,437+
27
30
842
1,051
12,923
13,873
21,189+ 28,971+
48
44
1,455
1,567
22,327
20,679
4,404+
6,414+
10
9302
347
4,640
4,578
6,016+
9,851+
13
15
413
533
6,339
7,031
43,873+ 64,673+
3,014
3,499
46,231
46,162
5,362+
7,104+
7,542+ 12,299+
56,777+ 84,077+
RACIAL CHARACTER
PRI -BL
PRI-WHT
437+
31,264+
29
29
1,233
956
15,056
13,470
721'
49,439+
49
46
2,037
1,512
24,874
21,300
166+
10,652+
11
9469
325
5,733
4,589
147+
15,1210*
10
414
481
5.055
6.773
1,471+
107,076+
4,155
3,276
50,720
46,133
152+
12,315+
1,056+
18,785+
2,679+
138,176+
+ following a figure indicates thousands
* When the data from one Associate Member
averages are as follows for tne columns
Administration
876
Instruction
Library
Operat. & Maint.
Total Ed. & Gen.
1,465
312
337
2,990
School with atypical financial
immediately above: 1,033
1,502
273
709
3,517
characteristics are eliminated, the der student

TAKE GG,
ANALYSIS OF EXPENDITURES (1972-73)
-50
51-150
SIZE
151-300
301-500
by SIZE, STATUS, AND RACIAL CHARACTER OF SCHOOL
(Excluding Roman Catholic Schools)
MEMBERSHIP
REL. TO UNIV.
*501+
ACCRED.
ASSOC.* INTEGRAL
INDEP.
EXPENDITURES
REL. TO CLUSTER
FORMAL
OTHER
RACIAL CHARACTER
PRI-BL
PRY -WHT
ADMINISTRATION
1.194+
6,052+
7,869+
7,235+
3,810+
22,604+
3,556+
2,473+
23,487+
10,322+
15,838+
437+
25,723+
% OF TOTAL
3o
31
28
32
26
28
39
23
31
28
30
29
PER STUDENT
520
919
1,616
806
1,000
854
1,076
1,233
93072
PER FACULTY
11,156
13,912
14,708
12,251
14,013
20,204
10,399
15.331
14,537
14,678
15,056
14,615
INSTRUCTION
% OF TOTAL
1.879+
48
8.279+
43
13,175+
48
10,408+
46
7,662+
53
37.8443+
3,561+
96,561+
56
34,842+
46
17,682+
49
23,721+
46
721+
49
40,682+
47
PER. STUDENT
2,361
1,768
1,724
1,638
1,046
1,5388
1,618
1,979
1,483
1,463
1,612
2,036
1,538
PER FACULTY
17,565
19,031
24,626
25,955
24,637
23,461
20,232
25,530
22,742
24,904
21,984
24,874
23,114
LIBRARY
% OF TOTAL
327+
82,146+
11
2,838+
10
2,364+
10
1,278+
83,031+
10
922+
10
1.391+
12
7,562+
10
3,635+
10
5,318+
10
166+
11
8,786+
10
PER STUDENT
410
458
371
372
174
126
418
419
322
300
361
469
332
PER 2ACULTY
3,053
4,933
5,305
5,894
4,108
4,978
5,236
5,411
4,935
5,119
4,928
5,733
4,992
OPERAT. & PAINT.
% OF TOTAL
468+
.12
2,643+
13
3,466+
12
2,330+
10
1,685+
11
9,599+
i2
993+
11
926+8
9,666+
12
4,371+
12
6,222+
12
1417+
010,446+
12
PER STUDENT
587
564
453
366
230
390
451
. 279
411
361
422
414
395
PER FACULTY
4,373
6,075
6,479
5,809
5,419
5,951
5,643
3,604
6,309
6,156
5,766
5,055
5,935
TOTAL ED. & GER.
3,868+
19,120+
27,349+
22,337+
14,436+
78,077+
9,032+
11,551+
75,557+
36,010+51,099+
1,471+
85,638+
PER STUDENT
4,859
4,083
3,579
3,515
1,970
3,174
4,105
3,485
3,217
2,980
3,472
4,155
3,238
PER FACULTY
36,149
43,953
51,119
55,702
46,417
48,404
51,317
44,946
49,319
50,718
47,357
50,720
48,657
STUDENT AID
467+
1,853+
3,520+
3,433+
1,487+
9,854+
905+
3,198+
7,562+
5,065+
5,694+
152+
10,608+
AUXILIARY ENT.
323+
3,139+
4,599+
2,967+
4,208+
14,212+
1,025+
697+
14,540+
6,322+
8,914+
1,056+
14,180+
TOTAL EXPELS.
4,657+
24,112+
35,468+
28,737+
20,130+
102.142+
10,962+
15,445+
97,659+
47,397+65,707+
2,679+
110,426+
+ following a figure indicates thousands
* When the data from one Associate
Member School with
averages are astoi.lows for the
columns immediately
atypical financial Characteristics are eliminated,
the 2 student
above:
Administration
932
1,041
Instruction
1.568
1,377
Library
331
293
Operat. & faint.
333
359
Total Ed. & Gen.
3,164
3,070

TABLEJE. ANALYSIS OF EXPENDITURES (1972-75)
E DENOMINATIONAL AFFILIATION OF SCHOOL.
(Includes All Schools()
CANADA
RMN. CATH
CANADA
UNITED
BAPTIST
AMERICAN
BAPTIST CHRIST -N LUTHERAN
SOUTHRN
CHURCH
LCA.
EXPEND/V.:RES
U.S.
PRES.
UNITED
PRES.
PROTEST.
RONAN
EPISCOP
CATHOLIC
UNITED INTER OR
CH.CMR NON-DEN.
UNITED
METE.
ADMINISTRATION
256+
140+
1,327+
1,791+
701+
1,117+
3.649+
886+
2,225+
1,635+
5.485+
1,163+
4,810+
% OF TOTAL
22
18
35
.21
28
27
28
30
30
28
26
30
31
PER STUDENT
539
792
1,803
369
1,008
972
1,006
1,390
1,129
1,855
916
981
1,056
PER FACULTY
5,957
6,675
18,960
9,329
14,308
12,691
13,822
16,709
19,178
16,185
10,202
18,464
14,664
INSTRUCTION
635+
476+
1,535+
4,666+
1,225+
1,935+
6,530+
1,203+
3.311+
2,413+
8,122+
1,666+
7,295+
% OF TOTAL
54
63
41
57
49
48
51
40
45
42
40
43
47
PER STUDENT
1,337
2,686
2,085
963
1,763
1,683
1,800
1,889
1,681
2,738
1,408
1,405
1,602
PER FACULTY
14,773
22,644
21,926
24,303
25,006
21,983
24,735
22,703
28,540
23,890
15,678
26,442
22,240
LIBRARY
104+
79+
339+
831+
307+
433+
1,285+
315+
680+
576+
1,762+
376+
1,675+
% OF TOTAL
910
910
12
10
10
10
910
89
10'
PER STUJENT
219
447
460
171
441
376
354
494
345
654
305
316
368
PER FACULTY
2,424
3,774
4,837
4,325
6,256
4,916
-
4,868
5.939
5.858
5,706
3,400
5,961
5,107
OPERAT. & MAINT.
164+
59+
513+
858+
257+
542+
1,155+
540+
1,031+
1,080+
5,111+
585+
1,713+
% OF TOTAL
14
713
10
13
13
918
14
18
25
15
11
PER STUDENT
344
334
697
177
369
472
318
848
523
1,226
886
493
376
PER FACULTY
3,804
2,820
7,332
4,468
5,246
6,164
4,374
10,197
8,888
10,694
9,866
9,291
5.221
TOTAL ED. &
1.159+
754+
3,714+
8,146+
2,490+
4,026+
12,620+
2,944+
7,246+
5,704+
20,279+
3,790+
15,493+
PER STUDENT
2,440
4,261
5,046
1,682
3,582
3.504
3,479
4,621
3,680
6,474
3,517
3,198
3,404
PER FACULTY
26,960
35.915
53,057
42,427
50,817
45,755
47,801
55,550
62,466
56,476
39,148
60,159
47,234
STUD=NT AID
2+
84+
324+
556+
397*
255+
2,467+
416+
1,129+
651+
1,705+
368+
2,453+
AUXILIARY ENT.
247+
61+
447+
2,123+
145+
624+
1,296+
412+
1,694+
1,079+
4,358+
470+
3,450+
TOTAL EXPEND.
1,408+
899+
4,485+
.10,825+
3,032+
4,906+
16.383+
3,773+
10,069+
7,434+
26,342+
4,629+
21,396+
-+ following a figure Indicates thousands

TABLE II.
ANALYSIS OF EXPENDITURES BY REGIONS (1972-73)
ANALYSIS OF EXPENDITURES BY HIGHESTDEGREE OFFEREi:
CANADA
(Includes All Schools)
NEW
MID
GREAT
ENGLAND
EAST
LAKES + PLAINS
SOUTH
EAST
SOUTH
WEST
ROCKY
FAR
MTNS.
WEST
B.D./M.DIV.
EXPENDITURES
(Accredited Schools Only)
TH.M./S.T.M.
D.MIN.
TE.D./PH.I
ADMINISTRATION
872+
2,643+
6,855+
8,403+
2,734+
5,076+
1,169*
424+
3,325+
4,231+
5,086+
4,317+
10.776+
% OF TOTAL
"20
24
29
126
28
22
30
33
29
28
28
27
PER STUDENT
651
--
951
1,184
1,288
707
862
458
925
72
904
955
999
858
PER FACULTY
6,862
13,348
13,628
15,677
n,069
13,755
9,313
13,248
17,9409
12,228
13,174
13,576
13,469
INSTRUCTION
2,416+
5,106+
9,900+
10,855+
4,854+
8.579+
3,148+
706+
4,596+
6,098+
7,622+
7.065+
19.371+
% OF TOTAL
57
47
42
43
47
48
52
50
46
42
43
47
50
PER STUDENT
1,805
1,838
1,710
1,664
1,256
1;457
1,054
1,541
1,344
1,302
1,431
1,635
1,543
PER FACULTY
19,020
25.790
1 9,682
20,251
19,652
23,250
21,414
22,058
24,063
17,623
19,745
22,228
24,214
LIBRARY
39+
1,189+
2,323+
2,409+
1,040+
1,726+
771+
139+
827+
1,385+
1,810+
1,598+
3,572+
% OF TOTAL
11
10
910
912
98
10
10
I0
PER STUDENT
293
428
401
369
6293
258
304
241
296
339
370
316
PER FACULTY
3,096
6,006
4,618
4,493
4,210
4,678
5,248
4,353
4,328
4,003
4,688
5,025
4,965
OPERAT. & NALNT.
498+
1.873+
4,125+
3,563+
1.675+
2,141+
678+
138+
1,177+
2,634+
3,111+
1,964+
4,522+
% OF TOTAL
11
17
17
14
16
12
11
911
18
17
13
11
PER STUDENT
372
674
712
546
433
363
227
301
344
562
584
454
360
PER FACULTY
3,925
9,458
8,200
6,647
6,780
5,800
4,612
4,309
6,160
7,613
8,060
6,176
TOTAL ED. & GEN.
4,179
IG,812+ 2 3,204+
25,230+
10,303-f
11,522+
5.967 + -
1,407+
9,925+
14,348+
17,629+
14,945+
38,642
PER STUDENT
3,123
3,893
4.008
3,867
2,666
2,977
1,999
3,072
2,902
3,065
3,310
3,460
3.078
PER FACULTY
32,904
54.603
4 6,130
47,070
41,712
47,484
40,588
43,969
51,961
41,469
45,670
46,995
43,302
STUDENT AID
345+
1,686+
2,858+
2,650+
634+
2,174+
1,221+
84+
814+
1,525+
1,489+
1,520+
5,989+
AUXILIARY EAT.
868+
1,133+
4,790+
4,572+
2,142+
3.934+
905+
309+
1,188+
2,746+
3,195+
2,139+
8,292+
TOTAL EXPEND.
5.392+
13,631+
30,852+
32,452+
13,079+
23,630+
8,092+
1.800+
11,927+
18,620+
22,313+
18.604+
52,922+
+ following a figure indicates thousands
* When the data from one Associate Member
averages are as follows for the colamns
Administration
1,098
Instruction
Library
Operat. & Maint.
Total Ed. & Gen.
1,598
325
527
3.552
School with atypical financial characteristics are eliminated, the ex student
immediately above:
CANADA
TABLE JJ.
ANALYSIS OF EXPENDITURES BY REGIONS (1972-73)
ANALYSIS OF EXPENDITURES BY HIGHEST DEGREE OFFERE
(Excludes Roman Catholic Schools)
(Accredited Schools Only)
NEW
MID
GREAT
SOUTH
SOUTH
ROCKY
FAR
ENGLAND
EAST
LAKES
PLAINS
EAST
WEST
MTNS.
WEST
H.D./M.DIV.
TH.M./S.T.M.
D.MIN.
TE.D./FR.D.
EXPENDITURES
ADMINISTRATION
%,0F TOTAL
61 +
2,221+
24
4,424+
30
%Oil+
2,3M+
4,913+
1,23;+
341+
30
2,922+
35
2,610+
31
4,180+
30
4,317+
28
10,411+
28
PER STUDENT-
713
918
1,290
1,375
758
866
454
919
999
994
931
999
880
PER FACULTY
7,326
13.707
14,945
17,237
12.869
13,997
9,676
13,119
20,580
12,855
14,465
13,576
14,164
INSTRUCTION
% OF TOTAL
1,780+
58
4,5'.1+
50
6,625+
44
8,996+
44
4,061+
48
8,1349
+
2,953+
43
591+
52
3,722+
45
3,873+
46
6,254+
45
7,065+
47
18,625+
50
PER STUilEAT
2,062
1,878
1,932
1,759
1,286
1,435
1,034
1,592
1,272
1,476
1,393
1,635
1,575
PEP. FACULTY
21,194
28,032
22,382
22,048
21,835
23,174
22,034
22,720
26,211
19,076
21,640
22,218
25,339
LIBRARY
289+
1,027+
1,610+
1,996+
823+
1,661+
724+
117+
705+
811+
1,396+
1,598+
3,797+
% OF TOTAL
911
10
99
10
13
10
89
10
10
10
PER STUDENT
334
424
469
390
260
292
253
316
241
309
311
370
321
PER FACULTY
3,439
6,340
5,439
4,892
4,424
4,731
5,406
4,515
4,963
3,995
4,829
5,025
5,166
OPERAT. & "TAINT.
335+
1,294+
2,088+
2,407+
1,179+
1,875+
546+
86+
783+
1,108+
1,878+
1,964+
4,277+
OF TOTAL
11
14
14
11
13
11
97
913
13
13
11
PER STUDENT
388
535
609
470
373
330
191
231
267
422
418
454
361
PEP FACULTY
3,986
7,989
7,055
5,898
6,338
5,342
4,071
3,306
5,511
5,460
6,499
6.176
5,818
TOTAL F.D. & GEN.
3,020+
9,083+
14,748+
20,431+
8,457+
16,583+
5,519+
1,135+
8,132+
8,402+
13,708+
14,945+
37,110+
PER STUDENT
3,498
3,755
4,300
3.996
2,678
2,925
1,933
3,059
2,781
3,203
3,055
3,460
3,138
PER FACULTY
35,947
56,069
49,823
50,076
45,468
47,245
41,188
43,662
57,267
41,387
47,433
46,995
50,489
STUDENT AID
343+
1,604+
1,718+
2,243+
574+
2,167+
1,219+
82+
80+
718+
1,364+
1,520+
5,869+
AUXILIARY ENT.
621+
1,109+
3,137+
_3,027+
1,616+
3,759+
821+
248+
898+
1,287+
2,441+
2,139+
7,746+
TOTAL E;TEND.
3,984+
11,797+
19,603+
25,702+
10,647+
22,509+
7,560+
1,465+
9,838+
10,407+
17,514+
18,604+
50,725+
+ following a figure indicates thousands
When the data from one AssociLte Member
averages are as follows for the columns
Administration
1,135
Instruction
Library
Operat. & Maint.
Total Ed. & Gen.
1,681
340
438
3,594
School with atypical
immediately above:
financial characteristics are eliminated, the der_
Total spent for
hocks and periodicals
per student
per faculty
Total I books held
"Acquired last year
Periodicals received
. bysubscription
by gift
Microfilm Units
Total spent for
-4books and periodicals
per student
4per faculty
Total I books held
0 acquired last year
Periodicals received
by subscription
by gift
microfilm Units
TABLE M. LIBRARY DATA BY SIZE, STATUS, AND RACIAL CHARACTER OF
SCHOOL (1972-73)
(Includes All Schools)
SIZE
MEMBERSHIP
REL. TO UNIV.
-50
51-150
151-300
301-500
501*
ACCRED.
ASSOC.
INTEGRAL
INDEF.
212+
1,122+
962+
179
140
102
1,264
1,468
1,434
1,847+
5,048
4,379+
109,162
177,629
136,474
12,993
23,686
19,053
1,680
5,167
4,359
843,848
196,695
249,860
632+
88
1,450
2,875+.
80,967
10,548
3,186
37,682
270+
2,588+
611+
36
90
136
868
1,322
1,553
1,408+
13,193+
2,363+
42,867
441,620
105,481
5,183
57,233
14,230
1,709
13,839
2,262
5,912
254,672
149,325
REL. TC CLUSTER
RACIAL CHARACTER
FORMAL
OTHER
PRI-BL
PRI-WHT
449+
2,750+
1,254+
1,945+
118
94
86
105
1,511
1,339
1,321
1,388
2,634+
12,922+
5,781+
9,775+
118,404
428,697
182,229 364.872
12,789
58,674
22,864
48,599
2,167
13,934
6,652
9,449
873,183
530,814
199,939 204,058
TABLE LL.
LIBRARY DATA BY DENOMINATIONAL AFFILIATION OF SCHOOL
(1972-73)
CANADA
CANADA
BAPTIST
BAPTIST CHRIST-N LUTHERAN
RMN. OATH UNITED
AMERICAN
SOUTHRN
CHURCH
LCA
62+
20+
90+
130
111
122
1,442
9;7
1,286
173+
82+
103+
35
118
89
901
1.681
1,173
528+ .
14,549
2,106
969
312+
100+
449+
957+
368+
14,399
5.626
11.870
32.172
11,483
1,359
498
1,662
3,227
2,035
5127
737
1,638
749
3,342
3,697
71,682
28,011
9,221
UNITED
METH.
40
114+
3.196
1,393
1,360
159+
15.397+
5,980
541,121
702
70,761
81
16,020
1,222
402,775
U-S.
UNITED
PROTEST. ROMAN
UNITED INTER OR
PRES.
PRES.
EPISCOP
CATHOLIC
CH.CHR NON-DEN.
360+
69+
157+
99
107
79
1,363
1,296
1,351
1,464+
344+
826+
46,010
13,645
17,009
6,541
1,226
3,003
1,601
495
155
26,635
75,632
74,939
160+
678+
99+
516+
181
117
83
113
1,585
1.309
1,575
1,573
683+
3,260+
530+
2,467+
18,095
125,050
14,894
71,482
2,580
17,108
1.701
8,592
1,278
1.868
485
2,334
12,646
143,865
2.139
68,911
TABLE rim.
LIBRARY DATA BY REGIONS (1972-73)
LIBRARY DATA BY HIGHEST DEGREE OFFERED
(Includes All Schools)
(Accredited SchoOls Only)
NEW
MID
GREAT
SOUTH
SOUTH
ROCKY
FAR
CANADA
ENGLAND
EAST
LAKES
PLAINS
EAST
WEST
MTNS.
WEST B.D./M.DIV.
D.HIN.
TR.D./PH.D.
Total spent fci
books and periodicals
158+
per student
117
per faculty
1.241
Total 0 books held
0 acquired last year
Periodicals received
by subscription
by .gift
Microfilm Units
3u9+
697+
661+
316+
525+
229+
48+
256+
439+
111
120
101
81
89
76
105
75
93
1,558
1,385
1,233
1,278
1,422
1,560
1,512
1,342
1,269
1,551+
1,653+
3,840+
3,027+
1,377+
1,869+
957+
195+
1,087+
3,106+
93,897
42,024
104,031
91,369
49,719
88,263
31,184
7,615
38,999
151,657
9.953
5.328
16,339
14.829
6,739
8,554
3,466
861
5,394
18,266
336
1,704
3,192
2,629
2,231
2,954
1,882
202
971
2,673
840,622
13,358
140,053 /140,48
25,172
168,386
36,329 2,283
63,646
863,360
+ following a figure indicates thousands
534+
415+
100
96
1,382
1,305
2,343+
1,894+
73,577
53.423
11,299
7.666
3,111
2.339
37,363
162,073
1,102+
87
1,378
5,334+
142,686
18,028
5,447
139,004

TABLE NI,
ADMINISTRATIVE 3FFICER3' COMPENSATION (1973-70
BY SIZE, STATUS, AND RACIAL CHARACTEROF SCHOOL
CHIEF ADMINISTRATOR
-50
51-150
SIZE
151-300
(Excludes Rocku Catholic Schools)
MEMBERSHIP
REL- TO UNIV.
301-500
501*
ACCRED.
AZ-SOC.
INTEGRAL
INDEF.
REL. TO CLUSTER
FORMAL
OTWR
RACIAL CHARACTER
PRI-BLK PRI-WHT
NUMBER
19
51
38
15
11
134
30
15
119
51
83
5129
TOTAL COMP.
LOW
12,732
10,700
14,790
19,302 22,070
11,591
10,700
16,600
10,700
15,500
10,700
12,000
10,700
nIGH
25,388
35,657
34,850
45,780 56,367
45,780
56,367
41,920
56,367
36,869
56,367
30,240
56,367
AVER.
13,679
21,535
25,146
30,973 30,232
25,311
19,121
28,534
23,344
24,644
23,483
20,264
24,067
ASST. ADLINISTRATOR
NUMBER
27
13
45
28
36
25
10
21
31
TOTAL COMP.
LOW
RIGB
5,625
11,240
10,100
24,725
11,503
21,879
15,405 16,530
26,020 21,498
11,189
26,020
5,625
21,493
16,500
26,020
5,625
24,725
11,240
26,020
5,625
24,725
5,625
26,020
AVER.
8,432
15,895
16,635
19,153 19,234
17,141
12,407
19,011
16,124
16,231
16,898
16,683
ACADEMIC DLAN
NUMBER
715
30
10
20
69
13
379
31
51
280
TOTAL COMP.
LOW
1,920
13,130
14,414
15,497 13,316
13,291
10,100
23,297
10,100
10,920
10,100
12,468
10,100
HIGH
18,688
27,293
26,000
30,234 35,912
30,284
35.912
26,000
35,912
29,563
35,912
23,867
35,912
14,183
17,939
19,713
23,052 20,601
20,056
16,807
24,736
19,343
19,111
19,802
18,167
19.575
DEAN OF STUDENTS
NUMBER
29
13
77
36
7344
0100
243
TOTA.Z. COMP.
LOW
12,000
,
9,072
10,590
12,000 13,141
9,672
12,000
12,000
9,672
120
9,672
9,672
AVER.
13,115
15,057
17,303
13,641
19,200
16,033
25,730 18,350
16,111 15,773
25,730
15,868
16,954
13,486
18,000
14,737
25.730
15,536
19,200
16,267
25,730
15,101
25.730
15,480
REGISTRAR
NUMBER
723
29
99
62
15
671
32
45
374
TOTAL COMP.
LOW
6,000
4,523
6,295
8,922
9,198
4,523
6,000
6,800
4,523
5.722
4,523
6,300
4,523
HIGE
12,075
20,670
18,191
15,314 14,661
20,670
16,950
19,700
20,670
19,700
20,670
15,191
20,670
AVER.
8,939
9,846
10,722
12,531 11,893
10,480
11,334
12,719
10,471
9,799
11,250
11,426
10,615
BUSINESS OFFICER
N:JM:3ER
926
24
11
10
68
12
575
32
48
278
TOTAL co:. P
LOW
6,966
5,260
9,071
12,386 12,682
5,260
6,966
10,500
5,260
6,732
5,250
9,495
5,260
nIGB
16,615
22,697
24,962
28,670 36,525
23,670
36.525
19,989
36,525
23.608
36,525
15,900
36,525
AVER.
11,130
14,091
16,377
15,909 19,194
16,197
13,213
16,135
15,724
16,032
15,562
12,697
15,325
DIRECTOR OF DEVELOPMENT
NUMBER
TOT;-: COMP.
:_Ow
4
11,340
15
10,201
24
3,000
99
18,071 12,341
56
3,000
5
11,340
4
18,071
57
3,000
28
10,600
33
3,000
1
10,600
60
3,000
HIGH
19,575
25,000
27,405
25,411 32,249
27,405
32,249
25,411
32,249
25,500
32,249
10,600
32,249
AVER.
14,671
16,668
16,406
21,751 19,265
17,632
17,439
21,320
17,356
18.210
17,112
10,600
17,i33
PUBLIC RELATIONS
NM:3ER
13
66
519
21
20
10
11
21
TOTAL OOMP.
LOW
12,536
8,671
8,000
8,405 1n,271
8,000
9,261
15,841
8,000
8,405
8,000
8,000
HIGH
12,586
15,283
14,635
19,167 29,321
20,934
29,821
15,841
29,821
20,934
29,821
29,821
AVER.
12,580
11073
11,005
12,657 17,522
12,516
19,541
15,841
13,052
12,777
13,556
13,185
OTHER
314
39
24
25
101
23
82
58
47
2103
TOTAL co:. P
L04.
13,377
8,000
7,550
9,772
9,193
7,550
8,000
10,400
7,550
8,728
7,550
13,320
7,550
BIGB
16,250
19,836
27,913
22,523 26,090
27,913
26,090
22,000
27,913
22,000
27,913
15.000
27,913
AVER.
)5,108-
12,389
14,497
15,946 14,997
14,610
16,551
17,008
14,032
14.574
14,819
14,160
14,694
ALL ADM. AVG.
)k.v,3
16,282
17,113
19,576 18,639
17,531
15,377
19,845
16.997
17,101
17,431
15,75n
17,331

TABLE JO.
A0mINISTRATIVE GFFICERSt COMPENSATION (1973-74)
BY DENOMINATIONAL AFFILIATION OF SCHOOL
(Excludes Roman Catholic Schools)
CHIEF AL:LINISTFATOR
CANADA
CANADA
RMN. CAIN
UNITED
BAPTIST
AMERICAN
BAPTIST CHRIST -H LUTHERAN
SOUTHRN
CHURCH
LCA
-
UNITED
METH.
U.S.
PRES.
UNITED
PRES.
PROTEST.
ROMAN
EPISCOP
CATHOLIC
UNITED INTER OR
CH.CHR NON-DEN.
NUMBER
45
64
84
620
TOTAL
CO
RP.
LO
W16,000
20,000
22,809
18,715
22,000
22,152
20,030
18,469
17,057
21.78g
10,700
him:
25,900
34,850
29,686
29,900
27,800
35,501
25,983
35,679
35,657
36,869
45,780
AVER.
21,425
25.596
27,400
24,388
24,671
29,244
23,696
28,834
25,504
26,155
26,807
ASST. ADMINISTRATOR
NUMBER
TOTAL CORP. LOW
314.500
1
21,291
2
16,860
1
17,481
6
16,200
11,240
910,100
HIGH
AVER.
19,068
17,247
21,291
21,291
19,380
18,120
17,481
17,481
21,879
18,250
17,055
12:M
ACADEMIC DEAN
NUMBER
TOTAL CORP. LOW
616,288
11
13.316
2
20,524
517,313
918.372
4
17,683
622,361
20,098
317,760
13
10,100
HIGH
2a=°:
c0,123
21,270
23,680
25,001
21,636
26,871
20,098
1111:il:
AVER.
18,550
17,484
20,897
19,540
21,629
19,059
24,311
20,098
DEA:. OF SmUDENTS
NUMBER
13
13
41
31
49
TOTAL COMP. LOW
17,260
13,141
11.925
17,303
14,214
16,123
13,771
18,013
14,502
12,000
HIGH
17,260
26,503
11,925
19,200
16,777
26,123
27,573
18,023
18.417
25,730
AVER.
17,260
14,607
11,925
18,237
15,311
16,123
15,881
18,013
15,929
16,660
REGISTRAR
NUM2zR
25
51
58
22
44
14
TOTAL COMP. Low
16,950
5,926
8,058
6,894
6,633
8,000
6,480
6,729
7,124
5,722
4,523
HIGH
19,700
8,374
16,100
6,894
20,670
16,575
8,662
8.922
12,545
16,913
18,191
AVER.
18,325
7.337
12,260
6,894
10,900
11,978
7,571
7,825
9,095
10,482
10,717
BUSINESS OFFICER
NUMBER
56
25
84
58
610'
TOTAL COMP. L3'.:
10,411
12,682
15,699
8,000
9,071
12,680
20,156
9,336
8,686
10,500
HIGH
17,640
20,934
19,624
19,695
24,962
21,623
23,608
21,035
22,050
28,670
AVER.
15,356
15,909
17,661
14,484
16,135
17.991
22,148
15,736
14,198
18,224
DIRECTOR OF DEVELOPMENT
NUMBER
36
24
63
56
611
TOTAL COMP. LOW
13,650
12,341
17,490
15.700
13,142
16,100
20,086
10,201
14,660
3,000
HIGH
16,000
18,085
19,374
18,500
27,405
17,673
25,500
25,000
22,406
23,425
AVER.
15,046
15,353
18,432
17,117
18,732
16,639
22,293
16,238
19,268
17,361
PUBLIC RELATIONS
NUMBER
32.
13
22
3.TOTAL COMP. LOW
8,000
11,702
10,985
8,556
10,271
8,553
8,405
HIGH
15,288
20,934
10,985
15,841
14,685
10,756
19,167
AVER.
12,112
16,318
10,985
11,432
12,478
9,654
14,651
OT
HE
RN
UM
BE
R2
57
65
26
312
63
18
TOTAL CORP. LOW
8,000
7,875
10,922
7,550
14,065
9,772
11,531
8,728
5,571
9,361
9,000
HIGH
16,250
17,550
14,730
16,785
18,210
27,913
17,673
19,903
19,997
14,906
22,523
AVER.
32,125
12,477
12,552
12,188
15,603
17,405
14,745
14,119
17,052
11,454
13,916
ALL ADM. AVG.
18,325
15,711
16,834
16,700
17,796
18,912
17,543
19,482
17,916
17,143
18,101

TABLE PP.
ADMINISTRATIVE OFFICERS' COMPENSATION BY REGIONS (1973-74)
ADMINISTRATIVE OFFICERS' COMPENSATION BY
HIGHEST DEGREE OFFERED
I -a
CHIEF ADMINISTRATOR
NUMBER
TOTAL CORP. LOW
HIGH
AVER.
ASST. ADMINISTRATOR
NUMBER
TOTAL CORP. LOW
HIGH
AVER.
ACADEMIC DEAN
NUMBER
TOTAL COMP. LOW
HIGH
AVER.
DEAN OF STUDENTS
NUMBER
TOTAL COMP. LOW
HIGH
AVER.
NU
REGISTRAR
UMBER
TOTAL COMP. LOW
HIGH
AVER.
BUSINESS OFFICER
NUMBER
TOTAL COMP. LOW
HIGH
AVER.
DIRECTOR OF DEVELOPMENT
NUMBER
TOTAL COMP. LOW
HIGH
AVER.
PUBLIC RELATIONS
NUMBER
TOTAL CORP. Low
_
HIGH
AVER.
al NUR
NUMBER
TOTAL COMP. LOW
HIGH
AVER.
ALL ADM. AVG.
(Excludes Roman Catholic Schools)
NEW
MID
GREAT
CANADA
ENGLAND
EAST
LAKES
PLAINS
16
10
17
31
13
16,000
15,000 12,492
11,591
14,367
30.000
41,920 45,780
56,367
28,760
20,983
28,932 26,471
24,142
21,664
33
71
--15,kas 15000
5,625
12,357
26,020 24,725
21,498
12,357
20,138 19.299
16,346
12,357
14
12
20
10
15,833
16,500 11,622
12,468
:3,707
15,833
29,563 30,284
35,912
19,350
15,833
23,352 22,007
20,431
16,850
15
314
6
12,270
12,000
9,672
11,925
15,480
12,270
15,213 25,730
19,200
18,417
12,270
13,763 17,554
15,526
16,959
57
822
10
7,100
4,523
6,700
5,722
7,921
19,700
14,221 20,670
17,800
16,913
12,820
9,465 11,905
10,659
11,249
57
12
21
86,732
8,686
5,260
6,966
6,253
13,135
22,697 28,670
36,525
17,278
10,467
16,903 16,663
16,210
13,307
59
14
5
13,000
3,000
10,201
12,822
23,425 21,735
32,249
20,550
19,380 15,867
18,681
16,225
13
71
8,553 10,271
8,556
10,756
8.553 19,167
29,821
10,756
8,553 14,162
14,283
10,756
29
22
14
13
8,000
10,400
9,000
7,550
8,728
16,250
19,836 27,913
26,090
18,210
12,125
14,117 15,695
13,992
11,939
16,817
18,216 18,544
17,474
15.377
SOUTH
EAST
25
11,714
31,179
22,050 6
11,189
21.291
17,026
17
15,480
24,914
19,238 8
13,141
18,013
15,477
11
6,000
18,191
10,425 14
10,500
23,608
17,053
15
10,600
22,608
17,001 4
8,405
14,685
11,013
23
9,500
22,000
15,515
17,184
SOUTH
WEST 7
15.500
35,501
24,636 2
11,240
16,860
14,050 6
10,920
23,297
17,166 1
16,503
16,503
16,503 3
8,496
14,558
10,571 5
7,80o
20,934
14,844 3
12,341
25,411
17,801 2
15,841
20,934
18,387
10
12,692
21,138
18,148
17,888
RGCKY
MTNS. 2
17,292
33,179
25,235 2
15,255
21,879
18,567 1
14,414
14,414
14,414 1
10,590
10,590
10.590 1
6,298
6,298
6,298 1
15,56o
15,560
15,560 1
14,146
14,146
14,146
16,512
FAR
WEST
13
10,700
33,667
25,128 7
10,100
20,082
14,955
11
10,100
26,500
18,858 4
12,263
16,954
15,471
10
7,124
12,263
9,453 7
8,000
22,000
16,285 9
11,340
25,500
18,852 3
8,000
16,382
11,427
12
7,875
19,300
12,983
16,697
B.D./M.DIV. 24
11,591
28,099
20,154 4
11,189
17,972
14,754
11
13,291
23,577
17,124 6
10,590
16,777
14,418
13
5,926
17,800
9,871
10
6,253
17,737
12,641 6
12,822
19,999
15,593 4
8,671
15,288
12,656 5
10,947
19,836
13,413
15,465
(Accredited Schools Only)
TH.M./S.T.M.
D.MIN.
22
20
12,492
14,790
26,900
36,869
22,158
26,106
66
11,240
14,500
20,152
19,380
15.305
17.163
12
16
17,100
17,050
23,680
29,563
19,106
20,638
10
6
9,672
11,925
18,350
18,417
15,865
16,176
14
13
6,633
6,729
20,670
16,575
10,872
10,107
14
16
5,260
10,411
21,035
23,608
14,721
16,174
815
10,201
3,000
22,142
22,608
16,731
16,881
26
8,405
8,000
8,556
14,685
8,480
11,004
2C
21
8,728
7,550
19,997
17,550
14,407
12,781
16,338
17,060
TH.D./PH.D.
Ijii
30,987.
10
16,200
26,020
20,138
27
13.316
30,284
21,235
14
12,000
25,730
16,232
19
4,523
18,191
10,851
24
10,500
28,670
18,664 23
10,600
27,405
18.376 7
9,900
20,934
14,885
45
9,361
27,913
15,863
19,287

TABLE DO,
FACULTY ComPEnsATIDN (1973-74)
BY SIZE, STATUS, AND RACIAL CHARACTER OF ScR00L
(Excludes Roman Catholic School's)
PROFESSOR
-50
51-150
SIZE
151-300
--
301-500
502
yEv:iEnRIP
ACCR40.
ASSOC.
REL. TO UIV.
INTEGRAL
INDEF.
REL. TO CLUSTER
FORKAL
OTHER
RACIAL CHARACTER
PRI-BLK
PRI-WHT
NUMBER
52
237
330
186
210
896
119
137
878
425
590
12
1,003
TOTAL CLMP. LOW
7,800
3,268
12,302
11,064 13,102
8,832
3,268
13,500
3,268
7,800
3,268
11,500
3,268
HIGH
20,215
26,643
27,167
30,659 27,872
30,659
27,872
29,758
30,659
27,167
30,659
20,000
30,659
AVER.
14,727
16,447
17,192
19,653 17,767
17,567
16,664
21,066
16,899
17,233
17,626
16,504
17,473
ASSOCIATE PROFESSOR
NUMBER
24
67
139
80
88
367
31
61
337
142
256
11
387
TOTAL COMP. LOW
6,000
7,000
11,054
10,945 10,765
6,000
10,443
12,915
6,000
6,000
7,000
6,000
7,000
HIGH
16,128
19,903
21,601
27,415 19,897
27,415
19,643
20,427
27,415
20,427
27,415
15.900
27,415
AVER.
13,371
14,662
15,218
15.810 14.373
14,984
14,479
16,359
14,689
14,506
15,189
12,800
15,006
ASSISTANT PROFESSOR
NUMBER
16
55
66
54
58
225
24
47
202
99
150
9240
TOTAL COMP. LOW
10,500
5,100
6,105
7,221
9,381
5,100
8,500
11,300
5,100
9,224
5,100
8,500
5,100
HIGH
18,115
16,720
22,260
19,002 16,915
22,260
16,915
19,002
22,260
22,260
18,923
22,260
19,002
AVER.
13,114
13,016
13,360
13,576 12,306
13,114
12,653
14,012
12,850
13,181
12,996
13.858
13,040
INSTRUCTOR
NUMBER
212
716
20
47
10
651
23
34
354
TOTAL COMP. LOW
8,889
4,500
7,600
7,638
7,366
4,500
8,220
13,809
4,500
7,366
4,500
8,220
4,500
HIGH
11,468
16,084
15,075
24,505 16,862
24,505
16,862
18,900
24,505
18,900
24,505
12,720
24,505
AVER.
10,178
10,693
11,764
13,966 11,055
11,786
12,161
16,400
11,317
11,494
12,095
10,802
11,911
ALL FAG. AVG.
14,009
15,430
16,149
17,490 15,773
16.120
15,528
18,489
15,641
15,897
16,163
14,171
16,096

TABLE RR.
FACULTY COMPENSATION 01973-74)
FW DENOMINATIONAL AFFILIATION OF SCHOOL
CANADA
CANADA
RMN. CATH
UNITED
BAPTIST
AMERICAN
(Excludes Roman Catholic Schools)
BAPTIST CHRIST -N LUTHERAN
UNITED
SOUTHRN
CHURCH
LCA
METH.
U.S.
PRES.
UNITED
PRES.
PROTEST.
EPISCOP
ROMAN
UNITED INTER OR
CATHOLIC
CH.CHR NON-DEN.
PROFESSOR
NUMBER
15
33
116
29
51
156
35
57
63
43
155
.TOTAL COMP. LOW
14,000
11,500
13,102
12,924
15.260
13,252
11,790
14.683
13.363
14,502
3,268
HIGH
-------Z54-175
19,250
18,331
20,542
26,643
29,758
19,923
22,098
26,449
25,116
30,659
AVER.
19,333
15,941
15,699
15,590
17,987
18,651
17,018
19,650
17,896
17,778
19,454
ASSOCIATE PROFESSOR
AUMB4R
318
48
12
20
57
828
19
14
69
TOTAL COMP. LOW
15,000
6,000
10,765
11,890
13,800
12.450
11,233
13.020
11.648
12,614
'
11,800
HIGH
16,950
15,410
15,962
20,427
19,903
21,601
17,171
19,897
18,645
18,308
27,415
AVER.
15,733
13,222
13,264
14,419
16,754
15,989
15,484
16,558
14,969
15354
16,265
ASSISTANT PROFESSOR
NUMBER
34
27
57
37
517
12
648
TOTAL COMP. LOW----___
13,650
11,100
9,381
9,224
12,361
11,300
13,323
12,484
10,500
11.653
10,878
HIGH
15,650
14,630
14,253
12,615
16,720
19,002
15,600
16,770
16,108
15,028
22,260
AVER.
14,483
13,185
11,436
11,340
14,532
14,277
14,671
14,196
13,264
13,322
13,677
INSTRUCTOR
NUMBER
31
11
27
65
210
1TOTAL COMP. LOW
11,000
10,000
7,366
12,294
11,000
10,975
5,938
9,500
7,638
HIGH
13,650
10,000
13,060
14,455
15,965
16,810
11,307
16,084
24,505
I..
AVER.
12,216
10,000
9,200
13,374
13,620
13,117
9,002
12,792
14,756
I
ALL FAC. AVG.
17,393
14,764
14,204
14,823
17,261
17,294
16,518
17,627
16,323
16,691
17,524

TABLE SS.
FACULTY COMPENSATION BY REGIONS (1973-74)
FACULTY COMPENSATION BY HIGHEST DEGREE OFFERED
(Excludes Ronan Catholic Schools)
(Accredited Schools Only)
PROFESSOR
NUMBER
TOTAL COMP. LOW
HIGH
AVER.
CANADA
11,40507
26,643
17,718
NEW
ENGLAND 89
12,000
28,150
19,349
MID
EAST
146
8,832
30,659
19,321
GREAT
LAKES
223
11,064
27,872
17,818
PLAINS
110
12,388
19,087
15,403
SOUTH
EAST
210
9,741
29,758
16,555
SOUTH
WEST
78
7,800
26,420
17,202
ROCKY
MTNS. 10
12,302
21,479
15,988
FAR
WEST 92
3,268
27,167
16,571
ASSOCIATE PROFESSOR
NUMBER
17
32
61
103
44
8o
28
825
TOTAL C0'7. LOW
12,763
10,600
7,000
10,443
11,353
6,000
10,872
11,054
12,450
HIGH
19,595
19,737
27,415
21,601
16,347
18,645
20,427
16,379
18,882
AVER.
16,026
15,633
16,283
15,015
13,887
14,161
14,315
13,656
15,265
ASSISTANT PROFESSOR
NUMBER
13
25
35
61
22
51
24
513
TOTAL COMP. LOW
11,297
11,386
5,100
7,221
6,105
8,500
9,399
10,518
10,873
HIGH
15,650
16,440
16,923
13,115
15,028
22,260
19,002
15,579
15,600
AVER.
12,972
12,385
14,164
13,201
12,319
12,529
13,361
12,992
12,841
INSTRUCTOR
NUMBER
44
15
811
84
TOTAL COMP. LOW
11,000
9,500
4,500
5,938
9,000
7,638
7,366
7,600
HIGH
13,650
18,900
24,505
16,862
11,550
14,370
15,965
12,300
AVER.
12,236
15,940
13,036
12,637
10,516
10,306
9,617
10,908
ALL FAC. AVG.
16,483
17,388
17,534
16,269
14,570
15,232
15,508
14,525
15,796
B.D./M.DIV.
117
:15:2346
26,449
44
6,000
13,(17C9)
36
6,105
16,108
12,231
14,227
TH.M./S.T.M.
D.MIN.
170
174
8,832
12,441
21,800
21,208
16,565
16,415
61
59
7,000
11,890
19,903
20,427
14,608
14,615
42
32
5,100
9,224
16,720
18,115
12,686
12,988
10
84,500
9,060
14,455
15,075
9,448
11,786
15.316
15,489
TH.D./PH.D.
390
13,102
30,659
19,129
190
NZ
15,649
109
9,381
22,260
13,617
26
5,938
24,505
12,808
17,134

LIBRARIAN
NUMBER
TOTAL COMP. LOW
HIGH
AVER.
TAZLE TT.
LIBRARY STAFF COMPENSATION (1973-74)
LiY SIZE, STATUS, AND RACIAL CHARACTER OF SCHOOL
(Excludes Roman Catholic Schools)
SIZE
-50
51-150 151-300
301-500
501+
12
6,240
16,631
11,5'47
ASSISTANT LIBRARIA"
NUMBER
TOTAL CORP. LOW
4,900
HIGH
4,900
AVER.
4.900
REFERENCE LIBRARIAN
NUMBER
TOTAL COMP. LOW
HIGH
AVER.
CIRCULATION LIBRARIAN
NUMBER
TOTAL COMP. Low
HIGH.
AVER.
CATALOGER
NUMBER
TOTAL COMP. LOW
HIGH
AVER.
OTHER
NUMBER
TOTAL COMP. LOW
HIGH
AVER.
2
7,247
7,833
7,540
5,200
5,200
5,200
37
36
6,s,N0
8,932
18,720
26,449
13,082
15,182
20
18
5,100
6,100
14,587
17,116
10,198
10,473
13
10,495
24,696
17,201 a
10,291
15,320
12,076
86
4,70i
7,275
8,034
8,84
15,384
18,521
6,651
10,793
11,322
510
4,200
4,200
3,367 13,200
0,568
8,116
12
23
4,060
3,502
11;885
12,923
8,595
9,427
811
4,000
6,615
11,081
16,407
7,389
10,028
56,529
11,985
3,762 12
6,529
12,450
9,846 7
5,950
9,650
8,007
10
11,935
33,724
16,177 2
11,412
12,283
11,547 4
7,871
12,643
9,280 3
6,166
7,872
7,056 9
6,557
15,737
9,912 15
6,871
16,146
10,035
MEMBERSHIP
REL. TO UNIV.
ACCRED.
ASSOC.
INTEGRAL
INDEP.
89
19
8,932
6,240
26,449
33,724
14,970
11,680
43
6
6,100
4,900
17,116
11,685
10,971
7,654
20
6,806
18,521
10,359
22
4,200
13,200
7,945
1
4,763
4,763
4,763 1
4,200
4,200
4,200
55
3
3,502
4,080
12,923
15,737
9,292
10,452
10
98
12,692
6,240
22,526
33,724
16,627
14,163
544
9,657
4,900
15,320
17,116
11,936
10,409
219
9,425
4,763
12,451
18,521
10,938
10,004
419
6,529
4,200
10,313
13,200
8,572
7,615
751
6,529
3,502
11,287
15,737
9,738
9,299
9931
11
55
339
16,407
9,087
9,046
7,513
9,197
AVG. ALL LIBRARY STAFF
10,219
10,631
11,601
11,886
11,244
11,457
9,943
12,026
11,162
REL. TO CLUSTER
RACIAL CHARACTER
FORMAL
NER
PRI-BL
PRI-WHT
39
69
6,240
6,300
22,526
33,724
15,020
14,036
22
27
4,900
5,100
16,068
17,116
10,997
10,212
10
11
6,806
4,763
15,384
18,521
9,245
10,863
12
11
6,156
4,200
13,200
12,214
7,485
8,105
23
35
3,502
4.080
12,470
15,737
8,937
9,625
14
28
ii:gla
116:40,g!
8,493
9,368
4104
7,650
6,240
16,395
33,724
11.517
14,502
247
9,657
4.900
10,000
17,116
9,828
10,596
21
4,763
18.521
10,092
23
4,200
13,200
7,782
256
9,500
3,502
10,000
15,737
9,750
9,338
141
4,000
4,500
4,000
16,407
4,000
9,200
11,120
11,337
9,914
11,292
.,
TABLE UU.
LIBRARY STAFF COMPENSATION (1973-74)
BY DENOMINATIONAL AFFILIATION OF SCHOOL
(Excludes Roman Catholic Schools)
LIBRARIAN
CANADA
CANADA
bAPTIST
RMN. CATH
UNITED
AMERI::AN
BAPTIST CHRIST -.Y LUTBLRAN
SOUTBRN
CHURCH
LCA
UNITED
METH.
U.S.
PRES.
UNITED
PROTEST.
EPISCOP
ROM=
UNITED INTER OR
CATHOLIC
CH.CHR NON-DEN
NU7.bER
56
46
13
35
96
15
TOTAL =P. LOW
12,405
11,9_1)
12,692
12,204
12,342
15,033
13,943
9.335
14,204
6,300
HI3h
1D,548
1c,503
17,324
17,195
26,449
18,142
20,321
13,720
17,087
24,696
A4Ett.
13,331
13,951
14,652
15,747
17,689
16,882
18,467
14,243
15,472
14,565
ASSISTANT LIBRARIAN
NUMBER
22
32
81
42
48
TOTAL co:. '
LOW
5,030
7,030
9,135
12,39c
10,253
7,262
10,224
10,797
6,156
6,100
HIGH
13,743
11,412
9,652
14,455
17,116
7,262
16,068
14,587
10,519
15,320
AVER.
10,374
9,221
9,351
13,422
12,622
7,262
12,818
12,692
8,891
9,972
REFERE...CE LIBRARIAN
NINBER
26
22
16
TOTAL COMP. L0 4
7,871
7,275
8,225
6,836
8,208
4,763
hI0K
12,643
12,862
13,348
18,521
8,208
15,384
AVER.
10,257
9,931
10,756
12,66 3
8,208
9,437
CIRCULATIO:; LIBRAR:A:.
NUMBz.F
13
15
11.
'6
TOTAL C3MP. LOW
7,136
7,131
13,200
6,350
6,884
8,367
6,156
4,200
B13B
7,136
8,805
13,200
12,214
6,884
8,367
6,156
11,985
AV:LE.
7,136
7,936
13,200
8,289
6,884
8,367
6,156
8,254
CA7ALOO:r
Nvelor-R
15
13
15
13
43
10
TOTAL COMP. LC'
6,504
6,557
3,040
7,644
6,529
9,918
8,312
7,833
9,036
3,502
h:Oh
6,504
12,470
8,040
11,885
12,923
9,918
10,528
10,044
9,840
11,985
AVER.
6,504
9,038
6,040
9,409
10,236
9,918
9,506
9,102
9,401
9.453
OTHER
NUMBER
15
110
65
1
TOTAL C0p. LOW
6,615
6,871
6,979
5,950
6,315
5,990
10,093
LIG::
6,615
11,813
6,979
16,407
11,880
10,920
10,093
AVER.
6,615
8,857
6,979
10,201
8,516
7,906
10,093
AVG.. ALL LIBRARY STAFF
10,366
10,265
11,838
13,056
12,067
12,035
12,427
12,396
10,525
11,066
TABLE W. LIBRARY STAFF COMPENSATIOUBY REGIONS (1973-74)
LIBRARY STAFF COMPENSATION BY
HIGHEST DEGREE OFFERED
L/BRARIA.i
NUMBER
TOTAL COMP. LOW
HIGH
AVER.
ASSISTANT LIBRARIAN
NUMBER
TOTAL COMP. LOW
HIGH
AVER.
REFERENCE LIBRARIAN
NUMBER,
TOTAL COMP. LOW
AVER.
CIRCULATION LIBRARIAN
NUMBER
TOTAL COMP. LOW
BICH
AVER.
CATALOGER
NUMBER
TOTAL COMP. LOW
HIGH
AVER.
OTHER
NUMBER
TOTAL COMP. LO,;
HIGH
AVER.
AVG. ALL LIBRARY STAFF
(Excludes
CANADA
Roman Catholic Schools)
NEW
MID
GREAT
ENGLAND
EAST
LAKES
PLAINS
916
25
13
6,484
9,672
8,198
10,500
17,530 26,449
33,724
17,087
14,034 16,661
14,146
13,755
411
14
4
10,316
6,100
7,000
6,156
15,320 17,116
14,313
10,224
12,685 11,503
11,092
8,187
22
8,934
7,275
11,940
6,806
9,425 12,862
18,521
8,208
9,204 10,287
15,230
7,629
26
23
6,810
5,900
8,175
4,200
10,313 12,214
13,200
6,166
8,561
8,658
10,687
5,507
613
15
57,680
7,247
4,080
5,100
11,287 12,141
15,737
10,043
9,785
9,338
9,236
8.693
511
77
5,200
6,615
6,979
6,315
10,093 16,407
16,146
10.920
7,275 10,132
10,834
8,471
11,004 11,932
11,925
10,107
SOUTH
EAST 21
6,300
21,606
14,267 6
4,900
16,068
8,976 6
7,871
13,343
10,428 5
6,584
9,270
7,866
13
6,557
11,542
9,531 7
4,000
11,081
7,439
10,885
SOUTH
WEST 7
6,240
22,526
15,024 5
7,262
12,565
10,236 1
6,529
6,529
6,529 2
6,529
12,470
9,499 4
6,871
11,818
9,132
11,1495
ROCKY
IITNS. 2
8,932
15,979
12,455 1
10,250
10,250
10,250 1
9,104
9,104
9,104
11,066
FAR
WEST 9
6,651
22,061
13,748 2
8,441
11,685
10,063 4
4,763
15,384
9,413 3
4,200
8,805
6,651 2
3,502
12,450
7,976 1
9,650
9,650
9,650
10,813
(Accredited Schools Only)
B.D./M.DIV.
TH.M./S.T.M.
D.MIN.
16
22
20
8,932
9,672
12,307
18,244
17,195
20,321
12,785
14,278
15,132
87
13
7,000
6,156
6,100
14,813
14,455
16,068
11,819
9;715
10,225
34
6,806
7,275
11,940
18,521
6,926
11,661
22
44,200
5,900
6,156
8,175
6,810
7,872
6,187
6,355
6,878
611
10
5,100
6,387
6,557
10,675
11,885
10,293
7,809
9,050
9,159
23
45,990
6.31,
6,615
6,640
8,400
10,920
6,315
7,405
8,379
10,911
11,320
11,543
TH.D./PH.D. 28
11,739
26,449
16,903
14
8,441
17,116
11,744
13
7,871
15,384
10,289
12
6,166
13,200
8,932
27
3,502
12,923
9,901 24
5,950
16,407
9,416
11,627
6
9,000
15,450
12,514 2
5,100
11,850
3,475 1
6,200
6,200
6,200 2
5,736
8,565
7.150
10.230