doctor of philosophy in agricultural extension
TRANSCRIPT

EFFECTS OF USING SELECTED POST-HARVEST PRACTICES TO
STRENGTHEN VEGETABLE EXPORT MARKET
MD. JULFIKER MOIN
A DISSERTATION FOR THE DEGREE OF
DOCTOR OF PHILOSOPHY
IN
AGRICULTURAL EXTENSION & INFORMATION SYSTEM
DEPARTMENT OF AGRICULTURAL EXTENSION & INFORMATION SYSTEM
SHER-E- BANGLA AGRICULTURAL UNIVERSITY
DHAKA-1207, BANGLADESH
DECEMBER, 2018

EFFECTS OF USING SELECTED POST-HARVEST PRACTICES TO
STRENGTHEN VEGETABLE EXPORT MARKET
By
MD. JULFIKER MOIN
Reg. No. 00993
A Dissertation
Submitted to the faculty of Agriculture,
Sher-e-Bangla Agricultural University, Dhaka
In partial fulfilment of the requirements for the degree of
DOCTOR OF PHILOSOPHY
IN
AGRICULTURAL EXTENSION & INFORMATION SYSTEM
SUBMITTED TO
DEPARTMENT OF AGRICULTURAL EXTENSION & INFORMATION SYSTEM
SHER-E-BANGLA AGRICULTURAL UNIVERSITY
SHER-E-BANGLA NAGAR, DHAKA-1207, BANGLADESH
DECEMBER, 2018
Defense Date: 16 February, 2020

EFFECTS OF USING SELECTED POST-HARVEST PRACTICES TO
STRENGTHEN VEGETABLE EXPORT MARKET
MD. JULFIKER MOIN
Reg. No. 00993
A DISSERTATION
DOCTOR OF PHILOSOPHY IN
AGRICULTURAL EXTENSION & INFORMATION SYSTEM
SEMESTER: JULY- DECEMBER, 2018
Certificate of Approval
….……………………………………….. Prof. Dr. Muhammad Humayun Kabir
Member, Advisory Committee Department of AEIS, SAU
…………………………………………………. Prof. Dr. Mohammed Shofi Ullah Mazumder
Member, Advisory Committee Department of AEIS, SAU
………………………………….. Prof. Dr. Md. Nazrul Islam
Member, Advisory Committee Department of Horticulture, SAU
………………………………… Prof. Dr. Md. Sekender Ali
Chairman, Advisory Committee Department of AEIS, SAU

Department of Agricultural Extension & Information System
Sher-e-Bangla Agricultural University
Sher-e-Bangla Nagar, Dhaka-1207, Bangladesh
CERTIFICATE
This is to certify that the dissertation entitled “EFFECTS OF USING
SELECTED POST-HARVEST PRACTICES TO STRENGTHEN
VEGETABLE EXPORT MARKET” submitted to the department of
Agricultural Extension and Information System, Sher-e-Bangla Agricultural
University, Dhaka in partial fulfilment of the requirements for the degree of
DOCTOR OF PHILOSOPHY in Agricultural Extension & Information
System, embodies the result of a piece of bona fide research work carried out
by Md. Julfiker Moin, Registration No.00993 under my supervision and
guidance. No part of the dissertation has been submitted for any other degree
or diploma.
I further certify that any help or source of information, as has been availed of
during the course of this investigation has been duly acknowledged by the
Author.
Dated: 16 February, 2020
Dhaka, Bangladesh
..……………………………
Prof. Dr. Md. Sekender Ali
Chairman, Advisory Committee
of the Concerned PhD Student
Department of Agricultural Extension & Information System
Sher-e-Bangla Agricultural University Sher-e-Bangla Nagar, Dhaka-1207, Bangladesh

DEDICATION
DEDICATED TO
THIS DISSERTATION IS LOVINGLY
DEDICATED TO MY PARENTS.
THEIR SUPPORT,
ENCOURAGEMENT AND
CONSTANT LOVE HAVE
SUSTAINED ME THROUGHOUT MY
LIFE.

DECLARATION
It is hereby declared that except otherwise stated, this Dissertation is entirely
the own work of the present researcher under the guidance and supervision
of the Advisory Committee and has not been submitted in any form to any
other University for any degree.
The Researcher
December, 2018

BIOGRAPHICAL SKETCH
The author was born on 07 August 1981 at Village- Baher Char, P.O- Baher
Char, Upazila- Daudkandi, District- Cumilla, Bangladesh. He came from a
reputed and enlightened Muslim family. He passed the Secondary School
Certificate (S.S.C) examination from Govt. Laboratory High School, Kotbari,
Cumilla Sadar South, Cumilla in 1997 and Higher Secondary Certificate
(H.S.C) examination from Notre Dame College, Dhaka in 1999. He obtained
the degree of Bachelor of Science in Agriculture (Honours) in 2004 (held in
2006) and the degree of Master of Science in Agricultural Extension in 2009
bearing registration number 00993, from Sher-e-Bangla Agricultural
University, Dhaka- 1207, Bangladesh.
He is a Life Member of Bangladesh Agricultural Extension Network (BAEN),
General Member of Krishibid Institution of Bangladesh (KIB), General
Member of Sher-e Bangla Agricultural University Alumni Association
(SAUAA).
The Researcher

viii
ACKNOWLEDGEMENT
The author expresses his gratefulness to Almighty Allah who enables him to continue
higher education as well as complete the research work successfully and to submit the
dissertation for the degree of DOCTOR OF PHILOSOPHY (PhD) in Agricultural
Extension & information system, Sher-e-Bangla Agricultural University, Dhaka.
The author expresses his sincere and heartfelt gratitude, deep appreciation and regards
to the Chairman of his PhD Research Advisory Committee Professor Dr. Md.
Sekender Ali, Department of Agricultural Extension & Information System, Sher-e-
Bangla Agricultural University, Dhaka for his guidance, constructive criticism, constant
stimulation and encouragement throughout the study, without which this work would
not have come to the present shape. His scholarly suggestion and affection behaviour
has been a fountain of great inspiration for the author.
The researcher also humbly desires to express his deepest and most sincere gratitude
to Professor Dr. Md. Nazrul Islam, Honourable Member of Advisory Committee of
the Research work for his continuous co-operation, constant supervision, constructive
criticism and creative suggestions in the preparation of dissertation manuscript.
The researcher would like to express his heartfelt appreciation, indebtedness and
gratitude to the Member, Advisory Committee, Professor Dr. Mohammed Shofi
Ullah Mazumdar, Department of Agricultural Extension & Information System,
Sher-e-Bangla Agricultural University (SAU), Dhaka for his valuable advice and
suggestions, active co-operation, meticulous attention in every sphere of the research
work and for helping him to improve the manuscript.
The author desires to express his gratefulness to Professor Dr. Muhammad
Humayun Kabir, Honourable Member of Advisory Committee of the Research work
and Chairman, Department of Agricultural Extension & Information System, Sher-e-
Bangla Agricultural University, Dhaka, who served as an Advisor of this advisory
committee. He took keen interest to this piece of research and provided creative
suggestions, constructive criticism and guidance.
The researcher records his heartfelt appreciation and profound gratitude to Professor
Dr. Rafiquel Islam, Professor M. Zahidul Haque, Professor Md. Mahbubul
Alam, PhD, Professor Dr. Ranjon Roy, Professor Md. Abul Bashar, Professor
Mohammad Zamshed Alam, Kh. Zulfikar Hossain, Assistant Professor and other
teachers of the Department of Agricultural Extension & Information System for their
valuable suggestions and co-operation throughout the whole period of the research
work.
The researcher records his heartfelt appreciation and profound gratitude to Professor
Md. Shadat Ulla, Ex-Vice chancellor, Sher-e-Bangla Agricultural University;
Professor Dr. Kamal Uddin Ahamed, Vice-Chancellor, Sher-e- Bangla Agricultural

ix
University; Professor Mohammad Hossain Bhuiyan, Department of Agricultural
Extension & Information System, Sher-e- Bangla Agricultural University; Professor
Dr. A. S. M. Ziaul Karim, Department of Agricultural Extension Education,
Bangladesh Agricultural University (BAU), Mymensingh; Professor Dr. Md.
Monirul Islam, Department of Agricultural Extension Education, Bangladesh
Agricultural University (BAU), Mymensingh and Professor Dr. Shonia Sheheli,
Department of Agricultural Extension Education, Bangladesh Agricultural University
(BAU), Mymensingh for their valuable suggestions and co-operations throughout the
whole period of the research work.
I express my sincere gratitude to the Ministry of Science and Technology,
Government of the People's Republic of Bangladesh for providing National Science
and Technology Fellowship (NST Fellowship) for conducting this research work.
Heartfelt thanks and appreciation are also expressed to Bangladesh Fruits, Vegetables
and Allied Products Exporter’s Association (BFVAPEA) Officials for their
benevolent help and co-operation in data collection during the interview of the
respondents and the respondent farmers of the study area for their co-operation and
patience and providing of information during data collection.
I extend my heartfelt thanks to all of my classmates, PhD fellows of the Department
of Agricultural Extension & Information System, Sher-e-Bangla Agricultural
University, Dhaka who created brotherhood relationship and inspired me to achieve
the target.
The deepest appreciation is also extended to officers and staff of the Department of
Agricultural Extension & Information System, and officers and staff of the Pro-vice
Chancellor’s Office, Sher-e-Bangla Agricultural University, Dhaka.
The author tendered his indebtedness to his father Md. Amir Hossain and mother
Anjuman Ara Begum for special care and affection that reflects the author’s
educational life all along. The author highly indebted to his all elder brothers, sister,
sister-in law, brother-in law, nephew, niece and relatives for their blessing,
inspirations, co-operation in all phases of this academic pursuit from beginning to the
end.
Lastly, the researcher owes his heartiest thanks to those who helped him in different
ways and means to complete this research work.
The Researcher

x
LIST OF CONTENTS
CHAPTER 1 INTRODUCTION 1
1.1 General background of the study 1
1.1.1 Country overview and economy 1
1.1.2 Vision 2021 of Bangladesh 3
1.1.3 Strategy for agriculture under the 7th Five Year Plan
(FY2016-FY2020)
4
1.1.4 Crop sub-sector strategies under the 7th Five Year Plan
(FY2016-FY2020)
5
1.1.5 Agricultural research under the 7th Five Year Plan (FY2016-
FY2020)
5
1.1.6 Value chain development under the 7th Five Year Plan
(FY2016-FY2020)
6
1.1.7 Introductory note on vegetable production and export
Scenario in Bangladesh
6
1.1.8 Introductory note on post-harvest practice in Bangladesh 10
1.1.9 Introductory note on vegetable value chain in Bangladesh 12
1.2 Statement of the problem 14
1.3 Objectives of the study 16
1.4 Justification of the study 16
1.5 Scope of the study 18
1.6 Assumptions of the study 19
1.7 Limitations of the study 19
1.8 Definition of key terms 20
1.9 Organizing of the study 26
CHAPTER TITLE PAGE
ACKNOWLEDGEMENT viii
LIST OF CONTENTS x
LIST OF TABLES xvii
LIST OF FIGURES xx
LIST OF APPENDICES xxi
ACRONYMS AND SYMBOLS USED xxii
ABSTRACT xxiv

xi
CHAPTER 2 REVIEW OF LITERATURE 27
2.1 Review of studies relating post-harvest practices 27
2.1.1 Minimization of post-harvest losses by various technological
adoptions
27
2.1.2 Post-harvest management practices 28
2.1.2.1 Harvesting 28
2.1.2.2 Postharvest handling 28
2.1.2.3 Cleaning 29
2.1.2.4 Sorting 29
2.1.2.5 Grading 29
2.1.2.6 Treatment before packing 30
2.1.2.7 Curing 31
2.1.2.8 Waxing 31
2.1.2.9 Precooling 31
2.1.2.10 Packaging 32
2.1.2.11 Storage 33
2.1.2.11.1 Coolbot cold storage 34
2.1.2.11.2 Evaporative cooling storage 34
2.1.2.12 Post-harvest disease control 35
2.1.2.13 Sprout inhibition 35
2.1.2.14 Transport 36
2.1.2.15 Marketing system 37
2.1.3 Effects of post-harvest practices 37
2.2 Review of studies relating value chain 39
2.2.1 Value chain concept 39
2.2.2 Value chain study approaches 41
2.2.3 Value chain actors 42
2.2.4 Value addition 43
2.2.5 Value chain upgrading 43
2.2.6 Value chain approach for agricultural products 44
2.3 Review of studies relating to measurement of effectiveness 45
2.4 Review of studies relating to effectiveness 47
2.5 Review of studies relating to farmers characteristics 48
2.6 Research gap of the study 50

xii
CHAPTER 2 REVIEW OF LITERATURE 27
2.7 Conceptual framework of the study 50
CHAPTER 3 MATERIALS AND METHODS 52
3.1 Locale of the Study 52
3.2 Population of the study 57
3.3 Sample and sampling procedure of the study 57
3.4 Data collecting instrument 59
3.5 Data collection procedure 60
3.6 Variables of the study 60
3.7 Measurement of independent variables 62
3.7.1 Personal characteristics 63
3.7.1.1 Age 63
3.7.1.2 Education 63
3.7.1.3 Family agricultural labour 63
3.7.1.4 Experience in vegetables cultivation 64
3.7.1.5 Experience in exportable vegetables production 64
3.7.2 Economical characteristics 64
3.7.2.1 Exportable vegetables cultivation area 64
3.7.2.2 Exportable vegetables production 64
3.7.2.3 Annual family income 65
3.7.2.4 Exportable vegetables production and post-harvest practice
cost
65
3.7.2.5 Credit received for exportable vegetable production 65
3.7.3 Social characteristics 65
3.7.3.1 Training exposure on vegetables post-harvest practices 65
3.7.3.2 Contact with value chain actors 66
3.7.3.3 Contract with value chain actors 66
3.7.3.4 Depth of relationship with value chain actors 67
3.7.3.5 Trust with value chain actors 67
3.7.3.6 Extension contact 67
3.7.4 Professional characteristics 68
3.7.4.1 Knowledge on selected vegetable post-harvest practices 68
3.7.4.2 Use of selected vegetables post-harvest practices 74

xiii
CHAPTER 3 MATERIALS AND METHODS 52
3.7.4.3 Problems faced in vegetable value chain 76
3.8 Measurement of dependent variables 78
3.9 Validity and Reliability of Scale 81
3.9.1 Validity of knowledge on selected vegetables post-harvest
practices scale
81
3.9.2 Reliability of knowledge on selected vegetable post-harvest
practices scale
82
3.9.3 Validity of use of selected vegetables post-harvest practices
scale
83
3.9.4 Reliability of use of selected vegetables post-harvest
practices scale
84
3.9.5 Validity of problems faced in vegetable value chain scale 84
3.9.6 Reliability of problems faced in vegetable value chain scale 85
3.9.7 Validity of effects of using selected vegetable post-harvest
practice scale
85
3.9.8 Reliability of effects of using selected vegetable post-harvest
practice scale
86
3.10 Statement of hypothesis 87
3.10.1 Research hypothesis 87
3.10.2 Null hypothesis 87
3.11 Data Processing 87
3.11.1 Editing 87
3.11.2 Coding and tabulation 88
3.11.3 Categorization of data 88
3.12 Statistical analysis 88
CHAPTER 4 CHARACTERISTICS PROFILE OF THE FARMERS 90
4.1 Personal characteristics 90
4.1.1 Age 91
4.1.2 Education 92
4.1.3 Family agricultural labour 93
4.1.4 Experience in vegetables cultivation 95
4.1.5 Experience in exportable vegetables cultivation 96

xiv
CHAPTER 4 CHARACTERISTICS PROFILE OF THE FARMERS 90
4.2 Economical characteristics 97
4.2.1 Exportable vegetables cultivation area 98
4.2.2 Exportable vegetables production 99
4.2.3 Annual family income 101
4.2.4 Exportable vegetables production and post-harvest practices
cost
102
4.2.5 Credit received for exportable vegetables production 103
4.3 Social Characteristics 104
4.3.1 Training exposure on vegetables post-harvest practices 105
4.3.2 Contact with value chain actors 106
4.3.3 Contract with value chain actors 108
4.3.4 Depth of relationship with value chain actors 109
4.3.5 Trust with value chain actors 110
4.3.6 Extension contact 111
4.4 Professional characteristics 112
4.4.1 Knowledge on selected vegetable post-harvest practices 113
4.4.2 Use of selected vegetables post-harvest practices 114
4.4.3 Problems faced in vegetable value chain 115
CHAPTER 5 EFFECTS OF USING SELECTED POST-HARVEST
PRACTICES TO STRENGTHEN VEGETABLE
EXPORT MARKET AND RELATED MATTERS
117
5.1 Effects of using selected post-harvest practices to strengthen
vegetable export market
117
5.2 Item wise comparative effects of using post-harvest practices 119
5.3 Item wise use of selected post-harvest practices of vegetables 129
5.4 Item wise Comparative severity of the problem faced by the
farmers in vegetable value chain
136
5.5 Suggestions for solving farmer’s problems in vegetable value
chain
139

xv
CHAPTER 6 CONTRIBUTION AND EFFECT OF SELECTED
CHARACTERISTICS OF THE FARMERS TO/ON
THEIR PERCEIVED EFFECTS OF USING
SELECTED POST-HARVEST PRACTICES TO
STRENGTHEN VEGETABLE EXPORT MARKET
146
6.1
Contribution of the selected characteristics of the farmers to
their perceived effects of using selected post-harvest
practices to strengthen vegetable export market
148
6.2 Direct and Indirect effects of the selected characteristics of
the farmers on their perceived effects of using selected post-
harvest practices to strengthen vegetable export market
161
CHAPTER 7 SUMMARY, CONCLUSIONS AND
RECOMMENDATIONS
169
7.1 Summary 169
7.1.1 Introduction 169
7.1.2 Objectives of the study 170
7.1.3 Methodology 170
7.1.4 Statement of hypotheses 172
7.1.5 Characteristics profile of the farmers 172
7.1.6 Effects of using selected post-harvest practices to strengthen
vegetable export market
175
7.1.7 Item wise use of selected post-harvest practices of vegetables 176
7.1.8 Item wise comparative severity of the problem faced by the
farmers in vegetable value chain
176
7.1.9 Contribution of the selected characteristics of the farmers to
their perceived effects of using selected post-harvest
practices to strengthen vegetable export market
176
7.1.10 Direct and Indirect effects of the selected characteristics of
the farmers on their perceived effects of using selected post-
harvest practices to strengthen vegetable export market
177
7.2 Conclusions 177
7.3 Recommendations 179

xvi
CHAPTER 7 SUMMARY, CONCLUSIONS AND
RECOMMENDATIONS
169
7.3.1 Recommendations for policy implication 179
7.3.2 Recommendations for future study 181
7.4 Message from the study 182
REFERENCES 183
APPENDICES 197

xvii
LIST OF TABLES
Tables Title Pages
2. 1 Shelf life and weight loss of vegetables stored in the
Coolbot storage
34
2. 2 Technical and economic benefits of storage of vegetables in
evaporative coolers
35
3. 1 Number distribution of the population and sample of
farmers and those included in the reserve list
58
3. 2 Summarized operationalization of the variables of the study
with measuring unit
61
3. 3 Example of computation of difficulty and discrimination
index
72
4. 1 Salient features including measuring unit, possible and
observed range, Mean, Standard Deviation (SD) and Co-
efficient of variance (CV) of the five (5) selected personal
characteristics of the farmers
91
4. 2 Distribution of the farmers according to their age 91
4. 3 Distribution of the farmers according to their education 93
4. 4 Distribution of the sample farmers according to family
agricultural labour
94
4. 5 Distribution of the farmers according to experience in
vegetables cultivation
95
4. 6 Distribution of the farmers according to experience in
exportable vegetables cultivation
96
4. 7 Salient features including measuring unit, possible and
observed range, Mean, Standard Deviation (SD) and Co-
efficient of variance (CV) of the five (5) selected
economical characteristics of the farmers
98
4. 8 Distribution of the farmers according to exportable
vegetables cultivation area
99
4. 9 Distribution of the farmers according to exportable
vegetables production
100

xviii
Tables Title Pages
4. 10 Distribution of the farmers according to their annual family
income
101
4. 11 Distribution of the farmers according to their exportable
vegetables production and post-harvest practices cost
102
4. 12 Distribution of the farmers according to their credit received
for exportable vegetables production
104
4. 13 Salient features including measuring unit, possible and
observed range, Mean, Standard Deviation (SD) and Co-
efficient of variance (CV) of the six (6) selected social
characteristics of the farmers
105
4. 14 Distribution of the farmers according to their training
exposure on vegetables post-harvest practices
106
4. 15 Distribution of the farmers according to their contact with
value chain actors
107
4. 16 Distribution of the sample farmers according to their
contract with value chain actors
108
4. 17 Distribution of the farmers according to their depth of
relationship with value chain actors
109
4. 18 Distribution of the farmers according to their trust with
value chain actors
110
4. 19 Distribution of the farmers according to their extension
contact
111
4. 20 Salient features including measuring unit, possible and
observed range, Mean, Standard Deviation (SD) and Co-
efficient of variance (CV) of the three (3) selected
professional characteristics of the farmers
112
4. 21 Distribution of the farmers according to their knowledge on
selected vegetable post-harvest practices
113
4. 22 Distribution of the farmers according to their use of selected
vegetables post-harvest practices
114
4. 23 Distribution of the farmers according to problem faced in
vegetable value chain
116
5. 1 Measuring unit, possible and observed range, mean, 117

xix
Tables Title Pages
standard deviation (SD) and co-efficient of variance (CV) of
the effects of using selected post-harvest practices as
perceived by the farmers
5. 2 Distribution of the farmers according to their perceived
effects of using selected post-harvest practices to strengthen
vegetable export market
118
5. 3 Effects Index (EI) of using post-harvest practices scores of
each items with rank order
119
5. 4 Use Index (UI) scores of the each items with rank order 129
5. 5 Problem Faced Index (PFI) scores of the each items with
rank order
137
5. 6 Suggestions to mitigate the problems faced by the farmers 140
6. 1 Results of correlation co-efficient of each of the selected
characteristics of the respondent farmer with their perceived
effects of using selected post-harvest practices to strengthen
vegetable export market
147
6. 2 Summary of stepwise multiple regression analysis showing
the contribution of all the 19 independent variables to the
effects of using selected post-harvest practices to strengthen
vegetable export market
150
6. 3 Summary of stepwise multiple regression analysis showing
the contribution of all the twelve (12) independent variables
to the effects of using selected post-harvest practices to
strengthen vegetable export market
155
6. 4 Path coefficients showing the direct and indirect effects of 6
significant independent variables of stepwise multiple
regression analysis on the farmers’ effects of using selected
post-harvest practices to strengthen vegetable export market
163

xx
LIST OF FIGURES
Figures Title Pages
1. 1 Trend in Agricultural Value Added as a share of GDP (%)
Source: World Bank, WDI, 2012
4
2. 1 Value chain concept; Porter (1985) 39
2. 2 Supply chain and value chain (Fredendall & Hill, 2000) 40
2. 3 Linkages and flow of tomato value chain in the study area 42
2. 4 Typical agricultural value chain and associated business
development services (Anandjaysekeram & Gebremedhin,
2009)
44
2. 5 Conceptual framework of the study 51
3. 1 Map of Narsingdi district showing the three selected
upazilas 53
3. 2 Map of Belabo upazila showing the study unions 54
3. 3 Map of Raipura upazila showing the study unions 55
3. 4 Map of Shibpur upazila showing the study unions 56

xxi
LIST OF APPENDICES
Appendix Title Page
Appendix- I Interview schedule for farmer to conduct research on
“EFFECTS OF USING SELECTED POST-
HARVEST PRACTICES TO STRENGTHEN
VEGETABLE EXPORT MARKET”
197
Appendix- II Letter to Judges for Judges’ Rating from Chairman,
Advisory Committee of the concerned PhD student 207
Appendix- III Average Appropriateness Score (AASk) of the ith item of
knowledge scale 214
Appendix- IV Difficulty Indices and Discrimination Indices of the 36
Items of Post-harvest Knowledge Test 215
Appendix- V Average Appropriateness Score (AASu) of the ith item of
use scale 216
Appendix- VI Average Appropriateness Score (AASp) of ith item of
problem scale 217
Appendix- VII Average Appropriateness Score (AASe) of the ith item of
effects scale 219
Appendix- VIII Result of Stepwise Regression 220
Appendix- IX Inter Correlation Matrix 224

xxii
ACRONYMS AND SYMBOLS USED
AICC Agriculture Information and Communication Center
AEIS Agricultural Extension & Information System
AEO Agricultural Extension Officer
AVRDC Asian Vegetable Research and Development Center
BBS Bangladesh Bureau of Statistics
BCIP Bangladesh Country Investment Plan BDHS Bangladesh Demographic and Health Survey
BFVAPEA Bangladesh Fruits, Vegetables & Allied Products
Exporter’s Association
BARI Bangladesh Agricultural Research Institute
BRRI Bangladesh Rice Research Institute
DAE Department of Agricultural Extension DAM Department of Agricultural Marketing
EI Effects Index
EPB Export Promotion Bureau
EUREPGAP Euro-Retailer Produce Working Group Good
Agricultural Practices
FAO Food and Agriculture Organization
FFS Farmer Field School
FY Fiscal Year
FYP Five Year Plan
GAP Good Agricultural Practice
GDP Gross Domestic Product
GO Government Organization
GED General Economics Division
HRC Horticulture Research Center
IBM International Business Machines Corporation
HEIS Household Income Expenditure Survey HORTEX Horticulture Export Development Foundation ICT Information and Communication Technology
MDG Millennium Development Goal
MoA Ministry of Agriculture
MoC Ministry of Commerce
MOU Memorandum of Understanding
NARS National Agricultural Research System
NGO Non-Governmentl Organization
NFP National Food Policy Plan
PFI Problem Faced Index
PHL Post-harvest Loss
PPP Public Private Partnership
SAAO Sub Assistant Agriculture Officers
SAU Sher-e-Bangla Agricultural University
SDG Sustainable Development Goal
SPSS Statistical Package for the Social Sciences
TSS Toxic Shock Syndrome
UNESCO United Nations Educational, Scientific and Cultural
Organization
UAO Upazila Agriculture Officer

xxiii
UI Use Index
USA United States of America
USDA United States Department of Agriculture
VCA Value Chain Analysis
WB World Bank WDI World Development Indicators WHO World Health Organization
‘a’ Surface Hunter Redness
alum Aluminium approx. Approximate BDT Bangladeshi Taka AAS Average Appropriateness Score
β Beta
CIPC 3-Cholorisopropyly-N-Phynle Carbamate
CA Controlled Atmosphere
CO2 Carbon Dioxide
CV Co-efficient of variance
df Degree of freedom
EC Evaporative Cooler eg. exempli gratia (for example)
et al. et all (and other people) etc. et cetera (and the rest)
g Gram
Ho Hypothesis
i.e. id est (that is)
kcal Kilo Calorie
kg Kilogram
kGy Kilogray
L Surface Hunter Lightness
MA Modified Atmosphere
MENA Methyl ester of a-Napthaleneacetic Acid
MH-40 Maleic Hydrazide
μl Microlitre
ml Milliliter
NaOCL Sodium Hypochlorite
O2 Oxygen
PE Polythene
ppm Parts Per Million
SD Standard Deviation
RH Relative Humudity sq.km Square Kilometer sq. mile Square Mile
TCNB 2,3,4,6 Tetra Nitro Benzene Tk./tk. Taka
USD United States Dollar
TV Television viz. videlicet (namely)
% Percent °C Degree Celsius °F Degree Fahrenheit

xxiv
EFFECTS OF USING SELECTED POST-HARVEST PRACTICES TO
STRENGTHEN VEGETABLE EXPORT MARKET
MD. JULFIKER MOIN
ABSTRACT
The study was conducted to determine the extent of effects of using selected post-
harvest practices as perceived by the farmers and explore the contribution of the
selected characteristics of the farmers to their perceived effects of using selected post-
harvest practices to strengthen vegetable export market. The study was conducted in
three upazilas namely Belabo, Raipura and Shibpur under Narsingdi district in
Bangladesh. A total of 717 farmers of these three upazilas are actively producing and
exporting Bitter Gourd, Brinjal and Teasel Gourd with the help of Bangladesh Fruits,
Vegetables and Allied Products Exporter’s Association (BFVAPEA) which
constituted the population of the study. By using sample size formula, 250 farmers
founded the sample of the study. Proportionate random sampling technique was used
for selecting sample farmers from farmers’ group formed by BFVAPEA in different
villages of different unions of these three selected upazilas. Finally 91, 75 and 84
farmers were included for Bitter Gourd, Brinjal and Teasel Gourd respectively as the
sample. Data were collected from a sample of 250 farmers during August 01, 2019 to
November 30, 2019 by using an interview schedule. Nineteen (19) selected
characteristics of the farmers were considered as the independent variables. Effects of
using selected post-harvest practices to strengthen vegetable export market was the
dependent variable. Majority (83.60%) of the farmers perceived that the use of
selected post-harvest practices was medium to high effective to strengthen vegetable
export market. Stepwise multiple regression analysis indicated that the whole model
of 19 variables explained 35.90 percent of the total variation in effects of using
selected post-harvest practices to strengthen vegetable export market as perceived by
the farmers. But since the standardized regression co-efficient of 6 variables formed
the equation and were significant, it might be assumed that whatever contribution was
there, it was due to these 6 variables. Results of stepwise multiple regression analysis
showed that use of selected vegetables post-harvest practices, knowledge on selected
vegetable post-harvest practices, exportable vegetables production, experience in
exportable vegetables production and extension contact had significant positive
contribution whereas problems faced in vegetable value chain had negative
contribution to their perceived effects of using selected post-harvest practices to
strengthen vegetable export market. Path analysis indicated that knowledge on
selected vegetable post-harvest practices had the highest total indirect effect followed
by extension contact, use of selected vegetables post-harvest practices, experience in
exportable vegetables production and exportable vegetables production on their
perceived effects of using selected post-harvest practices to strengthen vegetable
export market. Problems faced by the farmers had negative total indirect effect on
their perceived effects of using selected post-harvest practices to strengthen vegetable
export market. Finally, it was found that use of selected post-harvest practices was
effective to strengthen vegetable export market.

1
CHAPTER 1
INTRODUCTION
1.1 General background of the study
1.1.1 Country overview and economy
Bangladesh has a rich historical and cultural past; the land, the rivers and the lives of
the common people combined have formed a rich heritage. It appeared on the world
atlas as an independent and sovereign state named Bangladesh on December 16, 1971
following victory at the War of Liberation (from March 25 to December 16, 1971). Bangla is
the mother tongue of Bangladesh. But to establish Bangla as the mother language,
Bangalees had to sacrifice their lives. A number of People were martyrized in
February 21, 1952 to establish the rights of mother language. In recognition of their
supreme sacrifice, UNESCO declared 21st February as the “International Mother
Language Day” throughout the world. Bangladesh lies in the north eastern part of South
Asia between 20°34' and 26°38' north latitude and 88°01' and 92°41' east longitude. The
country is bounded by India on the west, north and north-east while Myanmar on the south-
east and the Bay of Bengal on the south. The area of the country is 56,977 sq. miles or
147,570 sq. km. The limits of territorial water area of Bangladesh are 12 nautical miles and
the area of the high seas extending to 200 nautical miles measured from the base lines
constitutes the economic zone of the country. Bangladesh won in Arbitral Tribunal/PCA more
than 1,18,813 square kilometers of waters comprising territorial sea, exclusive economic zone
extending out to 200 NM across sizable area, and also have undeniable sovereign rights in the
sea bed extending as far as 354 NM from Chittagong coast in the Bay of Bangal with all the
living and non-living resources. To achieve an equitable result, the tribunal awarded
Bangladesh 19,467sq km of area out of total disputed area of 25,602 sq.km (approx.). (BBS,
2018a).
Bangladesh enjoys generally a sub-tropical monsoon climate. While there are six
seasons in a year, three namely - winter, summer and monsoon are prominent. Winter
which is quite pleasant begins in November and ends in February. In Winter there is
not usually much fluctuation in temperature which ranges from minimum of 7°C-13°C
(45°F-55°F) to maximum of 24°C-31°C (75°F-85°F). The maximum temperature
recorded in summer is 37°C (98°F) although in some places this occasionally rises up

2
to 41°C (105°F) or more. Monsoon starts in July and stays up to October. This period
accounts for 80% of the total rainfall. The average annual rainfall varies from 1429 to
4338 millimeters. (BBS, 2018a)
Except the hilly regions in the north-east, south-east and some areas of high land in the
northern part, the country consists of plain and fertile land. A network of rivers exists in the
country of which the Padma, the Jamuna, the Teesta, the Brahmaputra, the Surma, the
Meghna and the Karnaphuli are prominent. All those rivers have 230 tributaries with a total
length of about 24140 kilometers. The alluvial soil is thus continuously being enriched by
heavy silts deposited by rivers during the rainy season. Of the total area of Bangladesh, forest
lands account for almost 21.05% of its geographical surface. The Sundarban is the largest
mangrove forest in the world. It lies at the southern part of the Ganges delta and is spread
across the coastal areas of Bangladesh and West Bengal of India. The section of Sundarban
that belongs to Bangladesh has been listed in the UNESCO world heritage. The Sundarban is
known for its wide range of fauna. Sundarban is the home of the world famous 'Royal Bengal
Tiger'. (BBS, 2018a).
Bangladesh is mainly an agricultural country. Agriculture is the single largest
producing sector of the economy and contributes about 10.98% to the total Gross
Domestic Product (GDP) of the country. This sector also accommodates around
40.6% (in 2016-17) of labour force. GDP growth rate of Bangladesh mainly depends
on the performance of the agriculture sector. Due to natural calamities like flood
cyclone, drought, loss of production in both food and cash crops are almost a regular
phenomenon. Yet in recent years, there has been a substantial increase in food grain
production. Agricultural holding in Bangladesh is generally small but use of modern
machinery and equipment is gradually increasing. Rice, jute, sugarcane, potato,
pulses, wheat, tea and tobacco are the principal crops of Bangladesh. Crop
diversification programme, credit supply, extension work, research and input
distribution policies pursued by the government are yielding positive results. The
country is now on the threshold of attaining self-sufficiency in food grain production
(BBS, 2018a).
Principal seasonal crops and fruits of the country are Paddy, jute, wheat, tobacco,
pulses, oil seeds, spices, vegetables, jack-fruit, banana mango, coconut. Principal

3
exports products are Readymade garments & knitwear, frozen fish, jute & jute goods,
pharmaceutical products, tea, leather products, handicrafts, chemicals. (BBS, 2018b)
1.1.2 Vision 2021 of Bangladesh
Vision 2021 is a perspective plan to build Bangladesh a middle income and
technology based country by 2021. The main perspective plans are:
2010: 100 percent net student enrolment at primary level
2011: Supply of pure drinking water for the entire population
2012: Self-Sufficiency in food
2013: Each house brought under hygienic sanitation
2013: Attain 8 percent annual growth rate and this will be increased to 10 percent in
2017 and sustained
2013: Bangladesh generates 7000 Megawatt of electricity which will be further
increased to 8000 Megawatt in 2015. Steps will be taken to increase power
generation capacity assuming that the demand for power will reach the level of
20,000 Megawatt in 2021
2013: Free tuition up to degree level
2014: Bangladesh attains full literacy
2015: Living accommodation for the entire population
2021: Contribution of agriculture, industry and service sector to GDP will stand at 15,
40 and 45 percent respectively in place of 22, 28 and 50 percent as a percent
2021: Unemployment reduce to 15 percent from the present rate of 40 percent
2021: Labour in agriculture comes down to 30% from 48% at present
2021: Labour in industry is 25% from 16% and in service 45% from 36% at present
2021: Poverty rate comes down to 15% from 45% at present
2021: Bangladesh knows as a country of educated people with skills in information
technology
2021: 85% of the population have standard nutritional food
2021: Poor people ensured a minimum of 2122 kilo calories of food
2021: All kinds of contagious diseases eliminated
2021: Longevity increases to 70 years
2021: Infant mortality comes down to 15 from 54 per thousand at present
2021: Maternal death rate reduced to 1.5% from 3.8%
2021: Use of birth control methods increased to 80% (GED, 2015)

4
1.1.3 Strategy for agriculture under the 7th Five Year Plan (FY2016-FY2020)
In keeping with the stylized
facts of development, the
share of agriculture in
Bangladesh’s GDP has
been on a secular decline
for the past four decades.
This trend is part of the
qualitative transformation
process of Bangladesh’s
Economy (Figure1.1).
While there has been an
accompanying declining trend in agricultural employment along with rising wages,
almost half of the national work force continues to be employed directly or indirectly
in the agriculture sector. Marginal farmers and landless farm workers also constitute a
major part of the population below the poverty line in Bangladesh. As such, the
strategic importance of agriculture in meeting basic food demand and providing
livelihood for a substantial part of the population deserves added and focused
attention. (GED, 2015)
According to Seventh Five Year Plan, the Government set up targeted GDP for the
fiscal year 2016, 2017, 2018, 2019 & 2020 is 7.0, 7.2, 7.4, 7.6 & 8.0 whereas the
contribution of Agriculture sector in GDP will be 3.21, 3.28, 3.34, 3.39 & 3.49
respectively (GED, 2015). However Agriculture sector GDP growth rate (%) of Crops
& Horticulture will be 1.47, 1.42, 1.42, 1.41 & 1.40 respectively (MoA). % of
agriculture budget allocated in the agricultural research is 4.83, 5.55, 6.38, 7.33 &
8.43 as of GDP respectively. (MoA). Exports as of % GDP (Goods & Services) will
be 17.7, 15.6, 15.7, 15.9 & 16.2 (EPB, MoC, 2015).
The major issues and challenges facing Bangladesh agriculture during 7th Five Year
Plan and beyond will be promoting the use of agricultural technology with supportive
policies, reforms, regulations and incentives in place for raising productivity and
profitability; increasing diversification of production in line with consumption
diversification to promote nutrition; increasing private sector participation in the
Figure 1. 1 Trend in Agricultural Value Added as a
share of GDP (%) Source: World Bank, WDI, 2012

5
agriculture and improving agro-processing value chains; reducing instability of
production; increasing resource use efficiency; reducing loss of arable land;
minimizing yield gap; maintaining food security, safety and quality; expanding
irrigation and farm mechanization through appropriate technology; and developing
resilience to climate change impacts (GED, 2015).
1.1.4 Crop sub-sector strategies under the 7th Five Year Plan (FY2016-FY2020)
The development vision for agriculture under the 7th Five Year Plan is to ensure food
and nutritional security, enhancement of sustainable intensification and diversification
of climate resilient agricultural production with increased commercialization, increase
productivity and real income of farm families in rural areas on a sustainable basis,
livelihood improvement through technological innovations and use, strengthening of
research and extension system, developing supply chain extension, value addition of
agricultural products, and linking farming community with markets, both local and
global. Encourage wider women participation in homestead based agricultural
production, post-harvest management, agro/food processing, marketing and decision
making for ensuring women empowerment. Promote farmer’s right through digital
repository by achieving farmer’s indigenous innovations, farmer’s creativity under
intellectual property laws and protect their intellectual properties and establish a
database for indigenous technologies owned by the rural farming community.
1.1.5 Agricultural research under the 7th Five Year Plan (FY2016-FY2020)
The National Agricultural Research System (NARS) institutes generate the demand-
led agricultural technologies (varieties and management practices) and information.
The research will develop and refine technologies that will bridge yield gaps and
promote diversification, sustainable natural resources management: rain water and
river water harvesting for agricultural production, disease and pest management,
development of varieties/species with post-harvest technology of high value
agricultural commodities, mechanization, etc. It will also address climate change
effects by breeding and introducing saline and drought tolerant, short duration
varieties, introduction of high value commodities and low-cost, high-impact post-
harvest technologies as well as research on packaging, harvesting, maturity index,
food processing and market intelligence.

6
1.1.6 Value chain development under the 7th Five Year Plan (FY2016-FY2020)
Value chain development for identifying constraints to marketing supply channel is a
new tool for rationalizing prices of agricultural produce between farm gate and
consumer. MoA has been supporting value chain development of selected vegetables
and fruits through its development projects. In the seventh five year plan the approach
will be applied to other crops such as aromatic rice. The main effort will be to
improve the efficiency of agricultural marketing to reduce market distortions and the
cost of marketing, and to ensure that farmers get proper price for their produce and
consumer gets quality products. For quality control and ensuring traceability,
phytosanitary requirements, Department of Agricultural Marketing (DAM) will need
to be involved and its capacity developed. The seventh plan will improve marketing
services with a view to ensuring fair returns to the growers for their produces and
adequate supply to the consumers at reasonable prices. In this regard, the
establishment of HORTEX, a private board for value chain promotion for high value
commodities, is an important institutional development. In addition, DAM will also
be expected to play its role in value chain promotion and due emphasis on capacity
building of government extension agencies for which necessary steps will be taken. A
sustainable developed value chain will depend on active participation by all actors. So
the role of the private sector in participating in the agriculture value chain is of critical
importance. Strengthening the institutional capacity and reducing financial and
regulatory constraints to address the complex production and marketing constraints
including developing a viable private sector led value chain will be an important
strategic issue to address. For value chain development augmentation of required
technological support services should also be strengthened.
1.1.7 Introductory note on vegetable production and export Scenario in
Bangladesh
Bangladesh, a country of tropical and subtropical climates, produces large volume of
highly nutritious vegetables crops. Vegetables in Bangladesh cover an area of 1008
thousand acre with a total production of 4121 thousand metric ton (BBS, 2018c). The
major vegetable growing areas of Bangladesh are Jessore, Bogra, Comilla,
Chittagong, Khulna, Kushtia, Dhaka, Tangail, Rangpur, Rajshahi and Dinajpur and a
major part of the vegetables produced in this area are transported to the capital or
other cities as soon as possible through different marketing channels (Ahmed, 1992;

7
Hossain, 2000). Although root and tuber crops, namely, potato, sweet potato, aroids
and yams are considered as vegetables in Bangladesh. Depending on growing season
in Bangladesh vegetables are classified as winter and summer vegetables. Among the
winter vegetables, brinjal, pumpkin, cabbage, cauliflower, tomato, bottle gourd,
radish, country bean, palongshak, lalshak and indian spinach are important. Among
summer vegetables, pumpkin, brinjal, teasel gourd, pointed gourd, lady’s finger,
ribbed gourd, snake gourd, bitter goud, yard long bean, cucumber, ash gourd,
amaranths and Indian spinach are important. (BBS, 2018c).
Vegetables play a vital role in human nutrition, especially as sources of vitamins,
minerals, dietary fibre, and antioxidants. Vegetables are highly valued in human diet
mainly for vitamins and minerals. However, the present consumption of fruits and
vegetables in Bangladesh is 256.3 g/day/capita (36.1 g leafy vegetables, 129.9 g non-
leafy vegetables and 70.3 g Potato), which is far below the minimum average
requirement of 400 g/day/capita (FAO/WHO 2003) which indicates a poor dietary
status in Bangladesh. In this regard, the high levels of underweight (33%), stunting
(36%) and wasting (14%) among children less than five years; anemia among infants,
young children, adolescent girls and pregnant women; and poor diet diversification
are of particular concerns (BDHS 2015; BCIP 2010).
The food and nutrition situation in Bangladesh is fragile due to inadequate and
imbalanced diet intake. Consumption of a diversified diet to meet the needs of macro
and micro nutrients needs to be promoted (Bhattacharjee et al., 2007; NFP 2008;
BDHS 2009). A large proportion of Bangladeshi population is food insecure due to
poor diet quality. The usual diet is heavily dependent on rice, and most of the energy
in the diet is contributed by cereals. Out of the total 2210.40 kcal received per capita
per day from all food items in 2016, 1421.70 kcal was contributed by cereals in which
rice alone contributed 1272.30 kcal. The other major calorie contributing food group
is vegetables (91.30 kcal). The average per capita per day intake of protein was 63.80
gram in 2016. The cereals group contributes the most in terms of protein intake and
accounts for 30.62 gram (48 percent) of the total followed by vegetables 3.48 gram
(5.45 percent of the total), among vegetables leafy vegetables amount is 1.12 g, and
other vegetables 2.36 g in 2016 (HIES, 2016).

8
Bangladesh is endowed with a remarkably heterogeneous area, characterized by a
great diversity of agro climatic zones, allowing for production of a variety of
vegetables. Vegetable plays an important role in the economy of Bangladesh by
increasing the income of the rural people. Vegetables cultivation in Bangladesh is
labor intensive and as such it generates lot of employment opportunities for the rural
women and rural youth. Thus, vegetables plays a vital role in the poverty elimination
in our country and is directly linked with the food security, health and happiness of
the people.
Now a days Vegetables are not only used for domestic consumption but also
processed into various products like jam, jelly squash, pickles, sauces etc. A
substantial quantities are exported in fresh and processed form, bringing much-needed
foreign exchange for the country. Vegetables also provide plenty scope for achieving
bio-diversity and diversification to maintain ecological balance and also to create
sustainable agriculture and create an impact on the national economy in the years to
come to achieve the Millennium Development Goal (MDG)/ Sustainable
Development Goal (SDG) by the year 2030.
The need for great utilization of available wastelands against the background of
dwindling water and energy resources has focused attention to dry land, to arid and
semiarid tracts and to horticultural crops which have lesser demands of water and
other inputs besides being 3 to 4 times more remunerative than field crops. It is
estimated that Bangladesh has 8901 thousand acres of cultivable wasteland (BBS,
2018c), which is lying idle can be brought under vegetable crops without curtailing the
area under food crops. The country has abundant sunshine throughout the year and
widely varied agro-climatic conditions, which offers high potential for successful and
profitable commercial vegetables.
Due to tropical and subtropical climates, a variety of fruits and vegetables are grown
in Bangladesh. Bangladesh has achieved a significant growth in exporting vegetables.
Bangladesh is the 3rd highest vegetable producing country in the world. The export
volume of vegetables of Bangladesh was 2937929 kg in the FY 2017-18, whereas it
was 2327242 kg in the FY 2016-17. The export of vegetables rose from 409742
thousand BDT in the FY 2016-17 to 609697 thousand BDT in the FY 2017-18 (BBS,

9
2018c). The country exports vegetables to more than 40 countries, though the
expatriate Bangladeshis are the main consumers of our exported vegetables.
Bangladesh exports vegetables to SAARC country to India rose from 1105788
thousand BDT in the FY 2013-14 to 2312969 thousand BDT in the FY 2017-18; to
Pakistan rose from 657133 thousand BDT in the FY 2016-17 to 9136151 thousand
BDT in the FY 2017-18 (BBS, 2018a). Bangladesh also exporting to other SAARC
countries named Srilanka, Nepal, Maldives and Bhutan. This growing trend in export
suggests that Bangladesh has significant potential to increase exports of vegetables to
international markets. Provided necessary measures are taken to comply with the
market specific quality standards for exporting vegetables and that certifications for
health and food safety are genuine.
Analysis of the trends in exports of vegetables from Bangladesh in recent years
reveals an encouraging sign of export potential for this sector. While Bangladesh
exported vegetables worth US$44.67 million in the FY 2008-09, within 5 years it rose
to US$ 147.54 million in the FY 2013-14. Different types of vegetables are exported
from Bangladesh to more than 40 countries in the world with consumers basically
being limited to expatriate Bangladeshi markets. In the FY 2013-14, our export
market for fresh vegetables comprised Middle Eastern countries with about 46.3%
(Saudi Arabia 22.08%, UAE 7.67%, Kuwait 6.84%, Qatar 6.80%, Bahrain 1.65%,
Oman 1.26%), EU region 25.87% (UK 19.09%, Italy 4.83%, and others 1.95%), East
and South-East Asian countries 15.07% (Malaysia 12.52%, Singapore 2.55%), South
Asian countries (Sri Lanka) 3.67%, and others 9%6 (EPB, 2015)
Total export from Bangladesh during 2015-2016 amounted US Dollar 34257.18
million as against US$ 31208.94 million during 2014-2015 showing an increase of
US dollar 3048.24 million i.e. (+) 9.77%. The principal commodities that registered
increase in the export earnings during the year under review are Petroleum bi
Products 282.99%, Headgear/Cap 130.69%, Wood & Wood Products 67.23%,
Umbrella Waking Sticks 27.27%, Ships, boats & floating structures 24.94%, Printed
Materials 20.00%, Rubber 16.60%, Other Footwear 15.69%, Building Materials
15.38%, Man Made Filaments & Staple Fibres 15.13%, Handicrafts 14.79%,
Computer Services 14.55%, Engineering Products 14.10%, Paper & Paper Products
13.03%, Woven Garments 12.81%, Wigs & Human Hair 11.08%, Chemical Products

10
10.48%, Knitwear 7.47%, Jute & Jute goods 5.88%, Leather & Leather Products
2.69%, Agricultural Products 1.71%, Specialized Textiles 1.62%, Vegetables 1.07%
and Pharmaceuticals 13.04%. (EPB, 2017).
Bangladesh is rich in producing agro-based goods, and has registered substantial
agricultural growth in the last three decades through adoption of good agricultural
practice (GAPs), modernisation in production and post-harvesting procedures, and use
of improved and sustainable technology. Currently, the country is self-sufficient in the
production in cereal foodstuff through simultaneous rise in productivity and farming
area. Among the other agro products, vegetables play a very important role in
supporting the domestic demand for food and ensuring food security. Bangladesh’s
climate (both tropical and sub-tropical) and soil are suitable for a wide range of
vegetables cultivation. Vegetables contribute to 3.12% of the agricultural Gross
Domestic Product and gross value added by vegetables was 49393 million BDT in
Bangladesh in the FY 2017-18 (BBS, 2018a). Total production in vegetables reached
4121 thousand metric tons under vegetable cultivated area 1008 thousand acres in the
FY 2017-18. Total cultivated area of Bitter Gourd, Teasel Gourd, Brinjal (Kharif) and
Brinjal (Rabi) in Bangladesh are 26490, 12352, 45760 and 80618 acres respectively in
the FY 2017-18. Total production of Bitter Gourd, Teasel Gourd, Brinjal (Kharif) and
Brinjal (Rabi) in Bangladesh are 57908, 28648, 160145 and 355862 MT respectively
in the FY 2017-18. Cultivated area of Bitter Gourd, Teasel Gourd, Brinjal (Kharif)
and Brinjal (Rabi) are 446, 1839, 1038 and 1210 acres respectively in the FY 2017-18
in Narsingdi district. Total production of Bitter Gourd, Teasel Gourd, Brinjal (Kharif)
and Brinjal (Rabi) are 931, 7581, 3116 and 9404 MT respectively in Narsingdi district
in the FY 2017-18 (BBS, 2018c).
1.1.8 Introductory note on post-harvest practices in Bangladesh
Reducing post-harvest loses is the main focus of appropriate postharvest management
practices. A global agenda under the United Nations Sustainable Development Goal
(SDG) 12.3 which targets 50% reduction of per capita global food waste at the retail
and consumer levels and food losses along production and supply chains, including
post-harvest losses by 2030. SDG 12.3 recognizes that about one-third of food
produced for human consumption is lost or wasted globally, which amounts to about
1.3 billion tons of food per year worth nearly USD one trillion. These losses account

11
for about one-fourth of water used in agriculture, total cropland area, and total
fertilizer use, and produce about 3.3 billion tons of CO2 emissions yearly. (SDG,
2015)
Unfortunately, a considerable proportion of the harvested produce never reaches the
consumers mainly because of postharvest losses. The estimated postharvest losses of
fruits and vegetables lie in the range of 20-40% (Wills et al., 2004). Postharvest losses
are extremely high in the fruit and vegetable production sectors and are estimated
between 5% and 50 % in the tropics and sub-tropics (Salunkhe and Kadam, 1998).
Poor handling and inadequate storage facilities as well as lack of appropriate
packaging techniques have resulted in the loss of vast quantities and quality of food.
Factors affecting postharvest losses of perishable food crop produce vary widely from
place to place and are dependent on the systems of cultivation, harvesting, field
handling, packaging or packing, transportation, as well as storage or refrigeration and
marketing of the produce and there is the need for the farmer to give maximum
attention to these processes (Mrema and Rolle, 2002). The adoption of good
postharvest practices can extend the useful postharvest life of fruits and vegetables to
the extent that the produce quality and condition at harvest permit. Proper postharvest
practices ensure that the quality of the produce is preserved until it reaches the
consumer and utilized (Olympo and Kumah, 2009).
Ali et al. (2013) revealed that postharvest losses from growers to consumers of
Toamto, Brinjal, Cabbage and Cucumber were 31.09%, 32.03%, 24.94% and
24.28% respectively, where it is only 5-25% in developed countries (Kader, 1992).
Post-harvest loss can be defined as a measurable quantitative and qualitative loss of a
given product at any moment along the post-harvest chain (De lucia and Assemato,
1994). Both qualitative and quantitative losses occur in horticultural commodities
between harvest and consumption, hence minimizing post-harvest losses of already
produced food is more sustainable than increasing production (Kader et al., 2004).
Post-harvest losses include the rotting of produce and damage during storage,
packaging and transportation which leads to consumer rejection. Most losses and
wastes occur in the latter part of the food chain through excessive processing,
packaging and marketing (FAO, 2008).

12
In marketing aspect research in post-harvest activities specifically prevention of losses
at different stakeholder level will provide valuable information and guideline for loss
reducing activities, as a result it increases benefits by the increase of quality and
prices. To maintain vegetable quality at different levels postharvest operations like
harvesting, sorting, grading, packaging, loading, unloading, cooling and storage are
hardly used in Bangladesh (Hassan, 2010).
Over the last two decades significant progress has also been made in the production of
potato and vegetables. The major problem faced by potato and vegetable production is
the volatility in prices and large post-harvest loss, occasionally over 30%. It will be
difficult to sustain the growth of production of these high-value and labour-intensive
crops unless investment is made in the post-harvest management (a 10% reduction of
post-harvest loss would add 10% additional food for the nation), processing and
storage to stagger marketing of the crops throughout the year to match the demand
that remains stable across the season (GED, 2015).
Postharvest practice referred to best practices and simple, low-cost technologies and
innovations to reduce losses, enhance quality and food safety, and increase
profitability of producers or farm enterprise. In Bangladesh Hortex Foundation,
Bangladesh Fruits, Vegetables & Allied Products Exporter’s Association
(BFVAPEA) are working with farmers, value chain actor to apply proper post-harvest
practices to reduce losses and get quality produces for vegetable exporting. In this
study, these practiced was considered as post-harvest practices in Bangladesh. It
involves various steps such as harvesting, field handling, packinghouse operations,
packaging, storage, transport, handling in markets and at home.
1.1.9 Introductory note on vegetable value chain in Bangladesh
Vegetable Value chain denotes from production to consumption, including varieties
with appropriate postharvest practices such as harvesting, packinghouse operations,
packaging, storage, transport, processing, handling in markets and at home, value
addition. Vegetable value chain means chain of activities from input supply (seed,
fertilizer, chemicals) through production, appropriate postharvest activities, marketing
to end consumer through proper channel. The actors of the value chain of vegetables

13
and the incidence of post-harvest practices value chain plays an important role in
export market value chain of vegetables.
Moreover, the extent to which solutions are adopted for the necessary harvesting and
PHL procedures and application of technologies, varies greatly amongst and even
within countries (Prusky, 2011). For a sustainable approach to PHL reduction, a
specific approach has to be adopted within the context of the relevant value chain,
which is dependent on the scale of operation, the intended market and the returns on
investment in which each form of technology is implemented. The adoption of
methods and technologies depend greatly on whether value chain actors can see a
clear, direct or indirect, (financial) advantage (Hodges et al., 2011). Many
development agencies therefore take a multi-sectorial and value chain approach when
recommending strategies that affect scale-appropriate improved practices for reducing
PHLs (Larsen et al., 2009).
Organic vegetables play a significant role in vegetables value chain. Organic products
are products which are produced under requirements of the Organic Foods Production
Act (Diver et al., 1999). According to the USDA (1994), organic production systems
exclude the use of synthetic fertilizers, pesticides including those used in postharvest
handling and growth regulators. Osei-Asare (2009), asserted that there are several
motivating factors for organic production worldwide. There is high demand for
organically produced agricultural produce on the international market, especially in
Europe and the USA; Diver et al. (1999) reported that organically produced
agricultural products attract high premium which is estimated 10% to 300%. Kavin et
al. (2007) also reported that conventional agriculture has negative impact on the
environment and human health as compared to organic production.
Minimizing yield gap is an important issue for Bangladesh to strengthen vegetables
value chain. The difference between farm level yield and yield at research stations of
crops has remained an issue of concern for many years. It is generally recognized that
the actual yield of crops fall short of potential yield by about 30%. Farmers’
acceptance of a technology does not necessarily depend on the objective attributes of
a technology, but on a range of socioeconomic factors associated with adoption of a
technology. Processing industry of horticulture crops including vegetable crops is a

14
very backbone of horticulture industry taking care of gluts and wastes. Processing can
fetch an additional income to the growers and helps in stabilizing the prices with
economic returns. The best indicator of the economic contribution of food processing
to the food system is the value addition. Value addition is the indicator of the
industry’s contribution to GDP (Magray et al., 2017).
In Bangladesh, increasing private sector interest/investments in agriculture value
chain is an important issue. The challenge is to sustain and further develop the
capacity of agriculture to effectively respond to market signals - to ensure that what is
grown can be sold at remunerative prices, both to maximize rural income generating
opportunities and optimize the use of limited natural resources. The small and
marginal farmers need to be supported in producing diversified crop suitable for both
markets and household consumption to improve their nutritional status. They also
need to be supported in selling their products at remunerative prices by developing
linkages with domestic and international markets (GED, 2015).
1.2 Statement of the problem
Vegetables are highly perishable in nature and should be brought to the consuming as
quickly as possible in order to satisfy the market demand. Even the retailers should
sell the produce as soon as possible to avoid qualitative and quantitative losses of
vegetables. Poor post-harvest practices and marketing systems cause huge post-
harvest losses of vegetables during harvesting, storage, transport, wholesaling and
retailing, particularly when the conditions remain unfavorable and at one stage
produce becomes unfit for marketing or human consumption. Farmers are forced to
dispose of all that they produce in return for uneconomical prices especially during
periods of bumper harvest.
There are number of proven recommended simple post-harvest practices in vegetable
production but not all of those are practiced by the farmers properly although they are
intelligent and hard working. As a result a wide yield gap between actual achievement
and achievable potential in the vegetable farming system still exists. Attainment of
highest possible yields in vegetable and thereby maximum profit may be achieved
only when farmers are well equipped with required technological knowledge on post-
harvest practices and needed inputs and other relevant supports and most authentically

15
if knowledge and skills are applied correctly in the field. A systematic research is
needed to find out the effects of using of post-harvest practices of the commercially
important vegetables in Bangladesh for exporting. Identification of technological and
knowledge gaps, adoption of proper post-harvest practices, value addition by the
farmers and value chain actors in the entire value chain of vegetables is also a critical
research question.
It is imperative to commission a longitudinal research study to internalize the
dynamics of proper post-harvest practices and its effects on socio-economic patterns
of farmers in order to strengthen vegetable export market.
In view of the above considerations, the present study would attempt to find out
answers to the following research questions:
1. What are the selected personal, economical, social and professional
characteristics of the farmers?
2. What are the extent of effects of using selected post-harvest practices to
strengthen vegetable export market as perceived by the farmers?
3. What are the comparatively benefited items of effects as perceived by the
farmers by using selected post-harvest practices to strengthen vegetable export
market?
4. What are the comparatively highest use item among all of the use items of
post-harvest practices to strengthen vegetable export market?
5. What are the problems faced by the farmers in vegetable value chain
especially using post-harvest practices to strengthen vegetable export market?
6. What was the contribution of the selected characteristics of the farmers to their
perceived effects of using selected post-harvest practices to strengthen
vegetable export market?
7. What was the effects of the selected characteristics of farmers on their
perceived effects of using selected post-harvest practices to strengthen
vegetable export market?

16
1.3 Objectives of the study
The overall objective of the study is to internalize the effects of use of selected post-
harvest practices to strengthen vegetable export market. However, to give a shape the
research in a manageable and meaningful way, the following specific objectives were
formulated by the researcher:
1. To describe some selected personal, economical, social and professional
characteristics of the farmers
2. To determine and describe the extent of effects of using selected post-harvest
practices to strengthen vegetable export market as perceived by the farmers
3. To compare the item wise effects of using selected post-harvest practices to
strengthen vegetable export market
4. To compare the uses of selected post-harvest practices to strengthen vegetable
export market
5. To compare the severity of the problems faced in vegetable value chain by the
farmers to strengthen vegetable export market and to suggest for mitigating
the problems
6. To explore the contribution of the selected characteristics of farmers to their
perceived effects of using selected post-harvest practices to strengthen
vegetable export market
7. To explore the effects of the selected characteristics of farmers on their
perceived effects of using selected post-harvest practices to strengthen
vegetable export market
1.4 Justification of the study
Post-harvest practices of vegetables is important factor in vegetable value chain for
minimization of postharvest losses, nutritional improvement, food and financial
security and employment generation. To meet the demand of consumers or exporters
it is quite necessary to reduce the postharvest losses as much as possible through
using proper post-harvest practices. Therefore, it is urgent to formulate national policy
to reduce enormous postharvest losses, to produce safe and good quality vegetables,
to develop value chain of vegetables, to increase income through vegetables export
and to elevate the rate of per capita consumption of vegetables of the people of
Bangladesh.

17
Reliable statistical data are meager to assess the effects of use of post-harvest
practices to strengthen vegetable export market of Bangladesh. However, there are
some anecdotal evidences and inadequate reports on effects of use of post-harvest
practices to strengthen vegetable export market. Hence, a systematic research was
needed to estimate the levels of postharvest losses, to measure the effects of use of
post-harvest practices to strengthen vegetable export market those are commercially
important vegetables in Bangladesh.
In the past, production-oriented research has received greater attention than post-
harvest research to strengthen vegetable export market. There is enormous potential
for vegetables for both the domestic and foreign investments if government of
Bangladesh addresses critical requirements like international safety and quality
standards for this industry. From the foregoing discussion, it is clear that emphasis
should be given to formulate national policy to minimize postharvest losses of
vegetable, and the government would take initiatives and allocate resources to
improve the post-harvest practices, and thereby improve the socio-economic status of
the farmers. In addition, reports with adequate details to measure the effects of use of
post-harvest practices of at different levels of vegetable value chain in Bangladesh are
also scarce.
Therefore, this study has been undertaken to assess the effects of use of post-harvest
practices of vegetables in production, marketing and exporting, to identify the
comparative use items of post-harvest practices those are responsible to reduce post-
harvest losses, to identify problems in vegetable value chain and to suggest for
mitigating the problems.
The present attempt to research entitled “Effects of using selected post-harvest
practices to strengthen vegetable export market” is made to disseminate the
outcomes of the research study along with some suitable post-harvest practices to the
farmers in order to minimize post-harvest loss, to increase both domestic and global
market value, maintain quality and safety of vegetables in vegetable value chain and
increase income through export by using post-harvest practices.

18
1.5 Scope of the study
In this study extent of effects of using selected vegetables post-harvest practices were
determined. The findings of the study will be specifically applicable for Belabo,
Raipura and Shibpur upazila under Narsingdi district. However, the findings will also
have implications for other areas of the country having relevance to the socio-cultural
context of the study area.
This would also enable to identify the problems which effects the use of post-harvest
practices in entire vegetable value chain. This important aspect would ultimately help
the extension providers in formulating appropriate technologies of post-harvest
practices and that would be helpful to strengthen vegetable value chain of export
market as well as ensure food safety and security.
GO, Value Chain Actors, NGOs and private extension providers are working for
development programmes. Some of them are working for sustainable development of
agriculture by environment friendly post-harvest practices of vegetables. With the
help of the findings of the research, the concerned authority could expect to select
appropriate strategies for using the post-harvest activities to reduce postharvest losses
of vegetables in Bangladesh.
This study will reveal the effects of using selected vegetables post-harvest practices
among the farmers of selected sample area which also influences the socio-economic
development that shows a scenario of vegetables value chain regarding export market.
Thus, the findings of the study are expected to help the researchers, academicians,
professionals, government policymakers, GO and NGO officials, value chain actors,
development practitioners and other personnel who are directly or indirectly
connected with value chain activities to point in more sophistication in effects of use
of post-harvest practices towards return on investment, creating profit, globalization
of supply and production, improved eco-friendly postharvest practices. The findings
might be supplementing other empirical evidences to different aspects of post-harvest
practices in order to build an adequate conceptualization of vegetable value chain.

19
1.6 Assumptions of the study
An assumption is the supposition that an apparent fact or principle is true in the light
of the available evidence (Goode and Hatt, 1952). The researcher had the following
assumptions in mind while undertaking this study.
1. The respondents selected for the study were competent enough to answer
the queries made by the researcher.
2. The respondents included in the sample were capable of furnishing proper
responses to the questions included in the interview schedule and check list.
3. The researcher who acts as interviewer feels comfortable with study areas
social Environment.
4. The views and opinions provided by the farmers included in the sample
were the representative views and opinions of all farmers of the study area.
5. Data collected by researcher and prejudices that were free from biasness
conformity to the objectives of the study.
6. The items, questions and scales used for measuring the variables were
reasonably adequate to reflect the respondents’ real views and opinions.
7. The data for the study were valid and reliable.
8. The findings of the study were expected to be useful for planning and
implementation of various extension programmes for improving ecological
and sustainable agriculture of the country.
9. The views and opinions expressed by the respondents may have the same
views and opinions of the population of the study areas.
1.7 Limitations of the study
The limitations of the study are stated below-
1. Since the findings were based on the ability of the respondents to recall and
on the verbal opinions expressed by them, the objectivity of the study was
confined to their ability to recall, and also their sincerity and honesty in
providing the needed information.
2. This study was conducted in selected areas of Bangladesh, not the whole
country.

20
3. Factors of the farmers were many and varied, but in the present study only
some factors on personal, economic, social and psychological aspects were
taken into consideration.
4. There were many and vast areas of effects of using post-harvest practices
like cereal crops, cash crops, oil seed crops, spices, etc. But for this study,
information related to selected aspects of using of post-harvest practices of
vegetables were considered.
5. The focus of the study was made mostly on the extent of effects of use of
selected post-harvest practices, its benefits and constraints faced by the
farmers in value addition activities, but it was not possible to investigate
other issues of the problem in depth.
6. Many of the factors of value chain actors and situations were excluded from
the investigation due to the limitations of time, money and other resources.
7. The study has been confined to few areas of Narsingdi district of
Bangladesh and data were collected from a small group of respondents.
8. The researcher had to depend on selected respondents and also selected
service providers for his required information.
9. Characteristics of the respondents were many and varied, but for this study
only few characteristics have been selected.
1.8 Definition of key terms
A concept is an abstract of observed thing, events or phenomenon or in other words, it
is a short hand representation of variety of facts (Wilkinson and Bhandarkar, 1977). A
researcher needs to clarify the meaning and contents of every term that he uses in his
research study. It should clarify the issue as well as explain the fact to the investigator
and readers. Certain terms used throughout the study are defined and interpreted
below for clarity of understanding:
Age: Age referred to the period of time of a respondent from his birth to the time of
interview.
Annual income from vegetable: Annual family income of a respondent generally
refers to the total earning by him and other members of his family from different

21
sources during a year. Annual income from vegetable only includes the earning from
vegetable by the respondent.
Annual family income: Annual income referred to the total annual earnings of all the
family members of a respondent from agriculture, livestock and fisheries and other
accessible sources (business, service, daily working etc.).
Assumption: An assumption is “The supposition that an apparent fact or principle is
true in the light of the available evidence” (Goode and Hatt, 1952).
Credit received: Credit received of beneficiaries refers to the degree to which his
credit requirement was fulfilled by the amount of credit actually received (whether it
was received from institutional or non-institutional sources).
Education: Education referred to the development of desirable Knowledge, skill and
attitude in the individual through reading, writing and other related activities. It was
measured in terms of actual grades, years of schooling or class passed by a respondent
from a formal institute.
Effects: Effects is something that is produced by an agency or cause; result;
consequence. Effect may refer to a result or change of something.
Effects of using selected post-harvest practices: Effects of using selected post-
harvest practices means the outcome of the extent of use selected post-harvest
practices. The effectiveness of using selected post-harvest practices includes how
frequently they are used and how effectively they are used in increasing production,
income, exporting.
Experience in vegetable cultivation: Experience as a general concept comprises
knowledge or skill of something or some event gained through involvement in or
exposure to that thing or event. Experience refers to the nature of the events someone
or something has undergone. Experience is what is happening to us all the time - as
long we exist. However, in this study, it was considered as the year of starting from
first vegetables cultivation till the year of data collection.

22
Experience in exportable vegetable cultivation: In this study, it was considered as
the year of starting from first exportable vegetables cultivation till the year of data
collection.
Exportable vegetable cultivation area: Exportable vegetable cultivation area
referred to the area of land under his/her management only for vegetable cultivation.
The area was estimated in terms of full benefit to farmers or his/her family.
Family agricultural labour: In this study family agricultural labor means family
member engaged in various agricultural activities of exportable vegetable cultivation.
Farmers: The persons who were involved in farming activities are called farmers.
They participated in different farm and community level activities like crops,
livestock, fisheries, other farming activities etc. In this study, vegetable growers were
treated as farmers.
Farming: Farming may be defined as an activity carried out by household or holding
that represent managerial units organized for the economic production of crops,
livestock and fishes.
GO Official: GO (Government Organization) official contact of a respondent referred
to the extent of contact with 4 different GO officials, viz. Sub Assistant Agriculture
Officers (SAAO), Agricultural Extension Officer (AEO), Upazila Agriculture Officer
(UAO) and District or above level Agriculture Officers. In this study, Department of
Agricultural Extension (DAE) has been used as the GO.
Group Communication: Group communication of a respondent referred to the extent
of contact with 4 selected group communication media, viz. Focus group discussion,
Farmer’s field day, method demonstration meeting and result demonstration meeting
Hypothesis: Defined by Goode and Hatt (1952), a proposition this can be put to “a
test to determine its validity”. It may be true or false, it may seem contrary to or in
accord with common sense. However, it leads to an empirical test.

23
Knowledge: Knowledge is those behaviour and test situations which emphasized the
remembering either by recognition or recall of idea, material or phenomenon (Bloom,
1956). In this study postharvest practice knowledge indicated the extent of postharvest
practice knowledge of a respondent at the time of interview as evident from his
responses to a set of questions related to postharvest management logically
scientifically prepared for this purpose. It referred to the amount of understood
information possessed by the value chain actors on various aspects of appropriate
post-harvest practices of vegetables.
Mass Media Contact: Mass contact of a respondent referred to the extent of contact
with 7 selected mass communication media, viz. radio, television, daily newspapers,
agricultural leaflet/folder, agricultural booklets/magazines, agricultural film show and
agricultural fair.
Middlemen: It refers to the vegetables collector, Foreya, Arotdar, Bepari,
Wholesaler, and Retailer in this study.
NGO & Foundation/Association Officials: NGO (Non-Government Organization)
& Co-operative officals contact of a respondent referred to the extent of contact with
5 different NGO & Co-operative officials, viz. Unit level Agro based NGO officials,
Upazila/ District Level Agro based NGO officials, Central Agro based NGO
personnel, Unit level Agro based Co-Operative Society/ Association/ Foundation
Officials and Central Agro based Co-Operative Society/ Association/Foundation
Officials In this study, Any Agrobased NGO, Hortex Foundation, Bangladesh Fruits,
Vegetables & Allied Products Exporter’s Association (BFVAPEA) was considered.
Null hypothesis: The hypothesis which we pick for statistical test is null hypothesis
(Ho). In this study the null hypothesis is stated that there is no relationship between
the concerned variables.
Personal Communication Exposure: Personal contact of a respondent referred to
the extent of contact with 6 different types of personal communication exposure, viz.
With Neighbor farmers, With relatives engaged in agricultural production, Farmers’
group leaders, Agricultural input dealers (seed, Fertilizer, Pesticides etc), Use of call

24
center to get agricultural related information, Use of mobile apps to get agricultural
knowledge.
Post-harvest value chain: Postharvest activities are conducted starting at the farm
(harvesting and field handling), packhouse or processing plant, and during transport
and marketing. (Acedo et al., 2016).
Post-harvest practice: Post-harvest practices include harvesting, cooling, curing,
sorting, grading, handling, storage, processing, wrapping, packaging, transport and the
market phase. Post-harvest practice was concerned with maintaining quality from
production in the paddock to the vegetables being placed on a plate for consumption.
Problem faced: Problem means any difficult situation which requires some actions to
minimize the gap between “what ought to be” and “what is”. The term problem faced
referred to different problem faced by the value chain actors in vegetable production,
harvesting and marketing.
Respondents: Randomly selected people considered to be representable of the
population are known as respondents. They are the people from whom a social
research worker usually gets most data required for his research. In this study the
respondents were the value chain actors such as village level vegetable farmers,
Middlemen and Exporter.
Selected post-harvest practices: In this study best practices determined by Hortex
Foundation, Bangladesh Fruits, Vegetables and Allied Products Exporter’s
Association (BFVAPEA) for exporting vegetables from Bangladesh was considered
as selected post-harvest practices.
Statistical test: A body of rules which help to take decision regarding accepting or
rejection of the hypothesis is defined as test. In this study if a null hypothesis is
rejected it is assumed that there is a relationship between the variables.
Training exposure on vegetable post-harvest practices: Training exposure of a
respondent referred to the total number of days that the respondent had undertaken
different types of training on post-harvest management in his entire life from different

25
organizations. The measurement of training included from the day of starting training
on vegetable cultivation and till the day of data collection.
Vegetable Value chain: Vegetable value chain refers chain of activities from input
supply (seed, fertilizer, chemicals) through vegetable production, postharvest
activities, marketing and retail.
Value Chain: The concept of value chain was first developed in 1985 by Michael
Porter. A value chain is a set of activities that a firm operating in a specific industry
performs in order to deliver a valuable product (i.e., good and/or service) for the
market.
Value Chain Actors:
• Input Suppliers: The initial actor in the value chain who supplies input materials
such seeds and seedlings, fertilizer, pesticide to the farmer for vegetable
production.Usually the sub-regional (district) and regional (divisional) level
traders, district nursery associations, and relevant government departments
provide the inputs.
• Primary suppliers: Collectors and Farmers are the primary suppliers of the local
vegetable produces. Most of the vegetables are harvested by farmers, and collector
collected vegetable produces from the farmers.
• Pikers (Local Traders): Pikers are the ones usually stationed in the big markets
near the plant-growing or collecting areas who buy or take the supply from the
collectors and growers.
• Beparies (traders): Beparies buy both from pikers and even directly from local
collectors or growers through collecting agents or Phariahs. These Beparies are
located in relatively important commercial hubs, i.e. in sub-regional (district) and
regional (divisional) marketplaces.
• Wholesalers: Buy primary-processed vegetable produces from Beparies and also
from middlemen (collecting agents). They are stationed at important regional
trade hubs and supply to the exporters and processing house. Retailers and
consumers also get produces from them.
• Exporter: Usually exports good quality vegetables to the foreign country. They
procure vegetables from the wholesale market stationed at the regional

26
(divisional) level. At times they also buy vegetables from Beparies, Retailers and
Farmers. Before exporting they give final shape of produces at their pack house
according to importer demand.
• Importer: Import vegetables from other country from mostly exporter.
• Consumers: The final actor in the vegetable value chain, are mostly dependent on
retailer to purchase fresh uncut vegetable.
Variable: A variable is something which varies. More specifically, Variables are
those attributes of objects, events, things and beings which vary and can be measured.
In other words, variables are the characteristics or conditions that can be observed,
manipulated or controlled by the researcher (Ray and Mondal, 2011).
1.9 Organization of the study
The study is organized under the following seven chapters:
Chapter 1 - Introduction: Describes the importance of the topic, key issues,
objectives, scope and limitations of the study.
Chapter 2 - Review of Literature: A brief review and definition of concepts,
economic models and results of the related studies are done.
Chapter 3 - Materials and Methods: Explains the sampling design, method of data
collection and tools of analysis used in the study.
Chapter 4 - Characteristics profile of farmers: A detailed discussion of the
characteristics profile of the farmers of the study is made to draw
specific inferences.
Chapter 5 - Effects of using selected post-harvest practices and related matters: A
detailed discussion of effects of use of selected post-harvest practices
and related matters of the study is made to draw specific inferences.
Chapter 6 - Contribution and Effects: A detailed discussion of the contributions and
effects of selected characteristics of the farmers of the study are made to
draw specific inferences.
Chapter 7 - Summary, Conclusions and Recommendations: A brief summary of
work done, the salient findings and inferences drawn and their
implications for policy are presented.

27
CHAPTER 2
REVIEW OF LITERATURE
An exertion was made in this Chapter to represent a brief review of related research
information which gives a very clear direction to the researcher for selection research
issue by identifying research gap. Review of literature forms a linkage between a past
and present research works related to problem that helps a researcher to draw a
satisfactory conclusion. The researcher made an elaborate search of available
literatures to review the findings of past researches in this respect. However, no study
was found systematic and directly related to the present study. Therefore, an attempt
has been made to review and document closely related literatures in this Chapter
available from books, journals, review papers, concept note, daily newspapers,
magazines, etc. Relevant literatures have been reviewed and illustrated in different
sections as stated below:
2.1 Review of studies relating post-harvest practices
2.1.1 Minimization of post-harvest losses by various technological
adoptions
There are two approaches for reducing postharvest losses of vegetables. The first
approach for loss reduction is to follow scientific postharvest management of
vegetables. Another approach for loss reduction in processing into value added
products. Postharvest technology of vegetable crops envisages development of
appropriate techniques to reduce postharvest losses to prevent spoilage and help to
utilize maximum crops in a nutritious and safe manner.
Magray et al. (2017) stated that varieties with better keeping and processing quality
and lesser handling susceptibility should be bred and selected for different vegetables.
Virtually all postharvest quality characteristics of horticultural crops are genetically
programmed and will naturally vary by cultivar (Kitinoja and Gorny 2009).
According to Robinson and Kolavalli (2010), varietal choice influences yields,
although there are other conditions that may also influence yield. Clottey et al. (2009)
also realized that farmers do not invest in using pure seed but rather re-use seed from

28
the previous crop, often resulting in lower yields and increasing disease persistence.
They attributed this to the fact that there was no incentive in investing in good seed
since the fruit prices are the same irrespective of the variety and seed quality.
2.1.2 Post-harvest management practices
Post-harvest losses can be reduced by adopting breeding technologies for longer shelf
life, improvement of pre-harvest factors and harvesting techniques, proper methods of
handling, marketing, packaging, transportation and storage, development of
appropriate processing technology. Post-harvest starts at field level through
harvesting. Review related to post-harvest practices stated below-
2.1.2.1 Harvesting
Magray et al. (2017) stated that harvesting should be done at proper stage where there
is minimum damage and loss, as rapidly as possible and at minimum cost. Harvesting
should be done at early morning or late evening hours (Sumi, 2014). A temperature of
above 270C during harvesting should be avoided. The products that are to be send to
distant markets are harvested in the evening and transported in the cool hours of night
whereas commodities for local markets are harvested early morning. Harvesting
should not be done immediately after rain or irrigation. Harvesting at optimum stage
of maturity ensures maximum quality and yield. Care must be taken to avoid
mechanical injury to product (Acedo et al., 2016)
2.1.2.2 Postharvest handling
According to Kitinoja and Gorny (2009), postharvest handling of fresh vegetables has
a direct link with its shelf life. They reported that, handling starts right from
harvesting and put estimates of losses in developing countries in the range of 20% to
50% tracing causes of losses to the field, during transport and marketing. As a
remedy, Kitinoja and Gorny (2009) recommend that when handling fresh produce at
its market destination, it is important to avoid rough handling, minimize the number
of handling steps and strictly follow a temperature and relative humidity management.
Stacking of non-uniform containers should also be done with care to prevent collapse
of weaker packages and heavier cartons should always be placed at the bottom of a
stack.
29
2.1.2.3 Cleaning
Magray et al. (2017) stated that the produce is cleaned/washed to remove adhering
dirt, dust, insects, mould and spray residues and to improve appearance. Onion, garlic,
okra and mushrooms are not washed after harvest. Clean produce has higher market
appeal and price than dirty ones. Cleaning reduces microbial contamination, physical
damage and transport cost. Produce can be cleaned by trimming fruit stem of tomato
or eggplant, roots of leaf mustard, leaves and butt end of cauliflower, cabbage or
Chinese kale; in cabbage, retain 3-4 wrapper leaves for protection. Trimming
enhances visual quality, reduces deterioration of produce, facilitates handling
packaging and transport. Wiping tomato, eggplant or cucumber with clean soft cloth.
Washing using clean water to remove adhering soil and other debris. After washing,
the produce should be air-dried before packing. While cleaning, sorting can be done.
Avoid contact of produce with the soil which is a rich source of spoilage and human
pathogens (Rahman et al., 2018; Acedo et al., 2016).
2.1.2.4 Sorting
Sorting of harvested vegetable produce is done to remove diseased, damaged,
misshapen, over mature, insect attacked and rotten vegetable. Disease/insect attacked
should also be discarded to avoid any spread of infection to normal and healthy
vegetable/fruit produce (Magray et al., 2017). In Bangladesh, sorting is practiced for
most of the fruits and vegetables to remove damaged, diseased and insect infested
produce on the basis of visual observation (Hassan, 2010a). However, in the advanced
countries different types of sorters are used. The commonly used sorting equipments
are belt conveyor, push-bar conveyor and roller conveyor (Kitinoja and Kader 2003).
2.1.2.5 Grading
Grading is one of the important postharvest operations. In Bangladesh, grading is
practiced in limited scale based on size. Sumi (2014) stated that grading of vegetables
is poorly practiced in Bangladesh. Products are prepared for market without or
minimum sorting and grading. Some growers and intermediaries were found to
practice grading of their produce only based on visual judgment. There are no
scientific methods of grading of grade standards of fruits and vegetables in
Bangladesh (Sumi, 2014; Hassan, 2010a). In this regard, the introduction of
EUREPGAP (common standards for agricultural farm management practices in the

30
European countries) in the 1990s in Europe would be worth mentioning. Therefore,
emphasis must be given to develop GAP (Good Agricultural Practices) for the
horticultural produce in Bangladesh not only for export but also for domestic market
development in order to ensure quality and safety in the horticultural supply chain.
Sizing rings are used based on the size and shape of commodity to manually grade
horticultural produce (FAO 1989). Automatic grading of fruits is also a common
practice in the developed countries. Automatic rotary cylinder sizer is used to grade
fruits in the developed countries (Reyes 1988). Grading is done when the sorted
defect-free produce is classified into grades or classes of specific weights or sizes
(sizing) and maturity stage. It can be done after sorting or just before packing. Graders
must be skillful and provided with adequate lighting and work breaks. Grading aids
should be used such as grading tables and color pictures of quality grading and defects
(Rahman et al., 2018).
2.1.2.6 Treatment before packing
Rahman et al. (2018) and Acedo et al. (2016) suggested some treatment before
packing of vegetables, these are stated below-
• Sanitizers
- Washing in 100-200 ppm chlorine (mixing 4-8 tablespoons of commercial
bleach, which has 5.25% sodium hypochlorite or NaOCl, per gallon of water)
for 1-3 minutes can reduce microbial load and decay in vegetables. The
produce should be air-dried before packing.
- Calcinated calcium from scallop powder applied as 0.01% solution (0.1 gram
scallop powder per liter of water) as 3-5 minute dip enhanced food safety. It
was developed as a non-chlorine sanitize because of health concern on
chlorine which reacts with organic matter in the produce to form
trihalomethanes, a highly carcinogenic compound.
• Soft rot control
BacteriaI soft rot is the most serious problem in cabbages in the humid tropics.
Applying 10% alum (10g alum/100 ml water), lime paste (mix lime powder
and water at 1:1) or guava leaf extract (mix pure extract and water at 1:1) on
the butt end of cabbage reduced trimming loss due to soft rot to 0-20% from
20-44% without treatment, resulting in net return of 0.09-0.16 USD/kg
produce based on studies in Cambodia, Laos and Vietnam.

31
• Chitosan
Extracted from local shrimp waste in Cambodia, chitosan at 1% (10g/liter
water) as 5-min dip delayed ripening and increased shelf life of tomato by 6
days more and reduced weight loss by 50% lower than that of untreated fruit,
giving a net return of 0.20 USD/kg produce.
2.1.2.7 Curing
Magray et al. (2017) stated that Curing is a process of strengthening and wound
periderm (skin) of root and tuber crops for a specified period under well-defined
conditions of temperature and relative humidity which enhances shelf life of these
crops by forming corky layer which protects against water loss and infections by
decaying organisms. In bulb crops (onion &garlic).Curing is a drying process for
toughening of outer skin and tightening of necks. Potato curing is most effective at
about 200c and 80% relative humidity.
2.1.2.8 Waxing
Magray et al. (2017) stated that Waxing is done mainly to minimize water loss and
reduce shriveling and wilting to enhance therefore storage life. Wax seals off the stem
near the petiole and the pores on the surface of fruits which are the main routes of
transpiration. Waxing on the surface of fruit or vegetable product which are the main
routes of transpiration. Waxing also improves appearance of produce. Paraffin wax,
Carnauba wax and various resins are common types of wax used for preparation of
wax emulsion. Waxes are generally applied by foaming, spraying and brushing of
which foaming is the best, since it leaves a very thin coating. Some of the common
coating materials are semperfresh, prolong and waxol. Vegetables such as tomato,
brinjal, sweet pepper, cucumber, muskmelon, carrot etc. are often waxed with a water
emulsion by dipping or spraying to retard the moisture loss from the product and at
the same time to improve their lustre. This practice of keeping the product sound and
lustrous is generally not in vogue in our country.
2.1.2.9 Precooling
Magray et al. (2017) stated that Pre-cooling is the process of removing field heat from
the harvested commodity, particularly when harvested during hot weather. Pre-
cooling helps in decreasing rate of transpiration and respiration delayed ripening and

32
easing the load on the cooling system of transport or storage chambers. A precooling
method to rapidly remove product heat before cold storage to slow metabolic
processes and reduce heat load in the cool chamber.
There are two simple designs; knockdown hydrocooler and overhead hydrocooler.
The knockdown hydrocooler uses iced water (5oC) for 10-15 min dipping while the
overhead hydrocooler applies the 5oC water with water pump for 15-30 min to bring
down product temperature to 10oC. The produce is then drained of excess water
before keeping in the storage chamber. Crushed ice is commonly used in packages to
cool produce in transit to market. Direct contact of ice can injure the produce. The ice
bottle technique is an innovative way to avoid direct contact of ice with the produce.
The ice bottles (2 pieces per pack of 25 kg vegetable) are wrapped with newsprint and
placed in the package. Temperatures are reduced to 20-25oC from 35-40oC in packs of
produce sealed in the afternoon and transported the following morning (Rahman et al.,
2018; Acedo et al., 2016).
2.1.2.10 Packaging
Magray et al. (2017) stated that Packaging is a fundamental and necessary for
management of highly perishable products. The main role of packaging is to assemble
the produce into convenient units for handling and safeguard the produce during
distribution, storage and marketing. Packaging materials are selected according to
plant characteristics. It improves storage life of produce and provides greater
attraction to the produce. Although packaging of perishables is not quite satisfactory
in Bangladesh but there are ample scopes to introduce and expand the use of
improved packaging to reduce postharvest loss and maintain quality (Rahman et al.,
2018; Hassan, 2010a). Improved packaging such as plastic crates (stackable and
nestable), woven plastic sacks, plastic net bags, and corrugated fibre board cartons
should be used instead of the conventional bamboo made packages, which cause
substantial damage to the produce during handling. The use of plastic crates in
increasing, especially for high value produce. Packages should be strong so as to
withstand repeated postharvest handling. Packages should not be very large or
voluminous. In Bangladesh, the ‘Bepari’ very often use large and extra-large
packages (made of bamboo and jute sacks) with capacity varies from approximately
300-600 kg per package, and there is high risk of damage to the produce during

33
transportation and subsequent handling. The packages should not be overloaded and
the produce should not be held too tightly or too loosely to minimize damage during
transportation and handling (Rahman et al., 2018; Hassan, 2010a). Packages should
have ventilation holes to allow aeration (5% of the surface area per side; Kitinoja and
Kader 2003). Different types of packaging accessories like cups, wraps, foam nets,
liners and cushioning (shredded papers, leaves, vines, etc.) should be used to protect
the produce during transportation and handling (Rahman et al., 2018; Hassan, 2010a).
The packages should have label with farm logo and other relevant information for
value addition and enhanced marketing (Hassan, 2010a).
2.1.2.11 Storage
Magray et al. (2017) stated that Storage of vegetable produce an important for
improving shelf life avoiding market glut and to ensure supply through the year and
increase profit to the producers. The principle aim of storage is to reduce and control
transpiration, respiration and disease infection at the same time maintaining life
processes at the required level. The important method of storage of perishable
horticultural produce include low temperature storage (Hassan et al., 1998; Kader,
2002) modified atmosphere (MA) storage (Hassan and Shipton 2006; Hassan and
Shipton 2006a; Hassan et al., 2009a; Hassan et al., 2009b), controlled atmosphere (CA)
storage (wills et al., 2004), use of heat treatments (wills et al., 1998; Ledger 2004;
Hassan et al., 2004) use of ethylene scavenging chemicals (Jiang et al., 2000; Hofman
et al., 2001; Reid 2002; wills et al., 2004) and use of application of recommended
fungicides (Ogawa and Manji 1984; Ledger, 2004). Temperature management is the
single most effective tool for maintaining postharvest quality by extending the shelf
life of fresh horticultural produce. The optimum storage temperature for okra is 7-
10oC. Exposure of okra pods to undesirable temperatures will result in bleaching,
surface burning, shriveling, excessive softening and desiccation (Cantwell and Trevor,
2002) Temperature also influences the effect of ethylene, reduces oxygen, and
elevates carbon dioxide level; affect pathogen spore germination and growth rate.
Low temperature reduces the adverse effects of pathogens on fresh produce. For
instance, cooling commodities below 5oC immediately after harvest reduces the
incidence of Rhizopus rot (Brackett, 1993). The symptoms of chilling injury include
surface and internal discoloration (browning), pitting, water soaked areas, off-flavor

34
development, and accelerated incidence of surface moulds and decay (Mitchel and
Kader1992).
2.1.2.11.1 Coolbot cold storage
The Coolbot technology uses a device that overrides the air conditioner’s temperature
gauge to lower the temperature from 16oC (lowest in an air conditioned room) to 4oC,
thereby converting an insulated room and air conditioner into a cool room,
substantially reducing the cost of a cool storage environment. Temperatures are
maintained at 11-13oC for tropical vegetables and 5-7oC for subtropical produce; shelf
life markedly increased (Table 2.1). Do not mix these two types of vegetables because
if tropical produce is stored at 5-7oC, they will develop chilling injury while if
subtropical produce is stored at 11-13oC, they will have shortened shelf life. The
Coolbot maintains lower RH than the recommended one often below 50%, rapidly
desiccating vegetables. Providing wet cloth or pan of water, misting with water or
keeping produce in MAP can maintain high RH. (Rahman et al., 2018; Acedo et al.,
2016)
Table 2.1 Shelf life and weight loss of vegetables stored in the Coolbot storage
Vegetable Weight loss, % Shelf life, days
Coolbot Ambient Coolbot Ambient
Tomato 5 10-12 18-24 9-12
Eggplant 2 7 14 4
Leaf mustard 5 13 6 0.5 Source- Results were from AVRDC projects in Horticulture Research Center, BARI, Bangladesh;
Coolbot temperature was maintained at 12-13oC while ambient temperature varied from 22-35oC.
Crop varieties were the commercial ones and samples were at commercial harvest maturity.
2.1.2.11.2 Evaporative cooling storage
Rahman et al. (2018) and Acedo et al. (2016) stated that Cooling by evaporation of
water provided in the vicinity of produce. The decrease in temperature is small,
usually 1-8oC lower than ambient, but RH increases to more than 90%. It is effective
in reducing weight loss. Simple evaporative cooler (EC) structures (also called zero-
energy cool chamber as it does not use electricity). They reduced weight loss and
improved shelf life of vegetables, resulting in high net returns (Table 2.2).

35
Table 2.2 Technical and economic benefits of storage of vegetables in evaporative
coolers
Vegetable
Weight loss,
%
Shelf life,
days
Net return, USD/kg
(partial budget)
Tomato 1-7 (5-23) 12-15 (7-9) 0.24-0.34
Chili 4-6 (12) 6-8 (3-4) 0.28-0.33
Eggplant 1 (6) 4 (2) 0.20
Leaf mustard 3-15 (15-28) 3 (1) 0.14-0.26
Cauliflower 18 (44) 9 (7) 0.50
Bitter gourd 2 (6) 5 (2) 0.25
Cabbage 6-11 (19-22) 14-22 (8-16) 0.19-0.24
Chinese kale 4 (23) 4 (2) 0.22
Cucumber 3 (10) 4 (2) 0.18
Long bean 4 (12) 3 (1) 0.30
Mustard, aromatic 7 (14) 3 (1) 0.52 Source- Results were from AVRDC projects in Horticulture Research Center (HRC), BARI,
Bangladesh; Values in parentheses are responses of produce stored at ambient. The vegetables were
commercial varieties at usual harvest maturity.
2.1.2.12 Post-harvest disease control
Magray et al. (2017) stated that Vegetables suffer significantly due to invasion of
fungi and bacteria causing disease and resulting in huge postharvest losses.
Succulence of vegetables makes them prone to infection by micro-organisms
Mechanical injuries, contamination by diseases vegetables, heat and other
environmental agencies pre-dispose products to diseases. Post-harvest diseases can be
controlled by use fungicides as sprays or dips, incorporated in wax or impregnated in
packaging materials.
2.1.2.13 Sprout inhibition
Magray et al. (2017) stated that Tuber and bulb crops (onion & potato) enter a
dormant stage at maturity, sprouting starts at the end of dormancy or rest period.
Sprouting is a growth resumption process. Sprouting causes huge loss due to
respiratory utilization of substrates. Maleic hydrazide (MH-40), 3-Cholorisopropyly-
N-Phynle Carbamate (CIPC), Methyl ester of a-napthaleneacetic acid (MENA) and
2,3,4,6 tetra nitro benzene (TCNB) are commonly used as sprout inhibitors. Gamma
irradiation at 0.02- 0.15 kGy is widely accepted by many countries for successful
sprout inhibition of onion and potato without affecting other quality attributes.
36
2.1.2.14 Transport
Magray et al. (2017) stated that Transport is an important linkage in postharvest
handling, storage and distribution. Transport of horticultural produce from field to the
distribution markets is done by rail, truck, airplane and ship. Serious losses take place
due to improper handling, careless loading and unloading and use of improper
containers. Transport of produce during cool hours of night, use of ventilated,
insulated evaporative cooled or refrigerated vehicles ensures preservation of quality.
Pallets are used in many developed countries for trading of horticultural produce. It is
also important to introduce mechanical loading and unloading particularly with the
use of fork lift trucks. In advanced countries refrigerated containers known as reefer
containers produce. Sumi (2014) observed that Fruits and vegetables are transported
from the growers field to the local assemble markets by van, rickshaw, and by others.
Majority of the farmers are transported their products by van 65.9% and about 2.3%
by pickup van. Transportation is an important postharvest operation immediately after
harvest. The harvested produces are transported from the farm in two phases. Firstly,
the produces are transported from the place of harvest to packaging house, where the
produce are subjected to different postharvest operations like cleaning, sorting,
grading and different postharvest treatments for shelf life extension. Then the
produces are packaged. Secondly, the packaged produces are transported to different
destinations like distribution center, wholesalers, supermarkets and the retailers.
Refrigerated vehicle should be used for transportation of perishable horticultural
produce to check transport damage during which recommended temperatures and
relative humidity should be maintained. Modified atmosphere packaging should be
employed to ensure safety of the commodities during transport. Initial wrapping of
produce in perforated or non-perforated plastic bags depending on nature of produce
prior to packaging would be used. During transporting vegetables some point needed
to considered such as the transport vehicle should not be overloaded, strong and
durable packages should be used, rough handling during loading and unloading
should be avoided, containers should be aligned properly, vibration damage would be
reduced by using plastic crates, liners and padding. Ventilation should be ensured to
prevent heat generation during transportation. The packages should be loaded in
uniform stacks and braced securely. Workers should not stand upon the produce
during loading and unloading. The entire load should be covered with a silver or light-
colored canvas (Rahman et al., 2018; Acedo et al., 2016; Hassan, 2010a).

37
2.1.2.15 Marketing system
The changing demand in domestic and international markets for high-value product
creates challenges and opportunities. Majority of the horticultural commodities like
fruits and vegetables are produced by small and marginal holders, but due to weak
and fragmented value-chain, only a small percentage of the produce reaches the urban
market (Minten et al., 2010). Appropriate marketing infrastructure is crucial for
efficient marketing of fruits and vegetables. Adequate transportation and product
handling are also important for the trade of agricultural products and important factors
in assuring good prices and poverty alleviation (Khandaker et al., 2009). Investment is
required for improved maintenance of road and port infrastructures. In addition to
infrastructure development, modification of policies and management are also needed
to improve appropriate and timely shipping of perishables (World Bank 2005).
Vegetable market is often suffering from several constraints due to their high
perishable nature, season market and bulky nature. Assembling and subsequent
marketing of the produce is further blocked due to lack of proper storage facilities and
quick transport systems. Very often the products are formed to dispose of their
produce at a very nominal price where there arises seasonal gluts due to these bottle
necks. Another major defect in vegetable marketing is the in involvement of several
intermediaries which dominate the trade and get huge profit. Consequently producer’s
margin in the consumer price becomes very low. It is therefore essential that
organized effort for establishing co-operative system of marketing should be enforced
at village and district levels to control activity of intermediaries and to regulate the
vegetable marketing smoothly and in a streamlined system. Moreover, close co-
ordination among Agricultural Marketing Board, National Horticulture Board and
state department of agriculture/Horticulture should be ensured to formulate an action
plan for regulating marketing of vegetables in a smooth and streamlined way (Magray
et al., 2017).
2.1.3 Effects of post-harvest practices
Post-harvest practices specifically reduce postharvest loss. So, proper use of
postharvest practices can increase market share and competitiveness of smallholders,
stimulate growth of agribusiness industries, such as input suppliers (e.g. packaging,
processing ingredient) and logistics providers (e.g. transport, storage). There create an
opportunity to generate more employment and income opportunities and stimulate the

38
rural economy. Promote gender equality as more women are involved in postharvest
and marketing operations. Moreover, improve human nutrition and health. Reducing
postharvest losses reduces poverty and food insecurity (Rahman et al., 2018; Acedo et
al., 2016).
Losses of horticultural produce are a major problem in the post-harvest chain. They
can be caused by a wide variety of factors, ranging from growing conditions to
handling at retail level. Not only are losses clearly a waste of food, but they also
represent a similar waste of human effort, farm inputs, livelihoods, investments and
scarce resources such as water (World Resource Institute, 1998). Hassan et al. (2011)
observed that post-harvest wastage of 13 selected fruits and vegetables in major
growing areas annually costs the country about Tk. 3,442 crore on retail price.
Findings also showed that the post-harvest loss ranges from 23.6 to 43.5 percent of
the fruits and vegetables that include jackfruit, pineapple, papaya, mango, litchi,
banana, orange, cucumber, cauliflower, tomato, okra, brinjal, and red amaranth.
Reducing food loss and waste through use of post-harvest practices can save money
for farmers, businesses, and households; can feed more people; and can alleviate
pressure on climate, water, and land resources (Acedo et al., 2016).
Sumi (2014) revealed that 48.18% farmers sold their vegetables @7-25Tk./Kg.. It is
observed that the farmers sold his product 9.09% to the direct market, 81.8% to the
middle man and 9.09% sold to the whole sale market. The loss occurs due to
unscientific pre-production and post-harvest management as well as lack of
appropriate processing and marketing facilities that have adverse impacts on farmer
income, consumer prices and nutritional quality of the produce. Sumi (2014) also
stated that traders use full sacks and basket of produce as seats while transporting the
produce to distant markets. In the wholesale markets of city/town, unloading,
reloading and handling are made roughly that cause substantial post-harvest loss.
Retail markets are unpaved, open to dust, rain and sun. Sometimes, produce are
sprinkled with dirty water while on display.
Mutari et al. (2011) conducted a study on the effects of postharvest handling and
storage temperature on the quality and shelf of tomato which revealed that rough
handling of tomatoes can result in the destruction of the fruit cell wall leading to

39
softening and reduced marketability of the produce. Also, high storage temperature
can result in increased respiration (3.8 ml CO2/kg-h) and ethylene production (7.85
μl/kg/h) significantly as well as accelerate ripening (16.80) and weight loss (97.08%).
Therefore these conditions (rough handling and high temperature) accelerate the
metabolic rate of tomatoes and thereby reduce the shelf life of the produce.
Nasrin et al. (2008) conducted a study on shelf life and quality of tomato and
confirmed that tomato treated with chlorine; packed in perforated (0.25%)
polyethylene bag and kept at ambient temperature (20-25 °C) & relative humidity 70-
90%) condition resulted in substantial reduction in decay and weight losses. The same
treatment combination also considerably delayed compositional changes in TSS, total
sugar, reducing sugar, vitamin-C, B-carotene, etc. Under this condition, shelf life of
tomato extended upto 17days as compared to non-treated and kept in ambient
condition without packaging or packed in gunny bag for 7 days only.
2.2 Review of studies relating value chain
2.2.1 Value chain concept
Value chain is a market-oriented approach that can be used to explain and find ways
to overcome the trade barriers faced by the rural poor (Mitchell et al. 2009). A “value
chain” is the collection of activities that a firm performs in order to design, create,
build, and deliver a
valuable product or
service to the market
(Porter, 1985). It
describes the full range
of value-adding activities
that participants
undertake to bring a
product or service
through the different
stages of production (involving procurement of raw materials and other inputs,
assembly, physical transformation, acquisition of required services such as
transportation) to deliver the product to its final consumer (Kaplinsky & Morris,
Figure 2. 1 Value chain concept; Porter (1985)
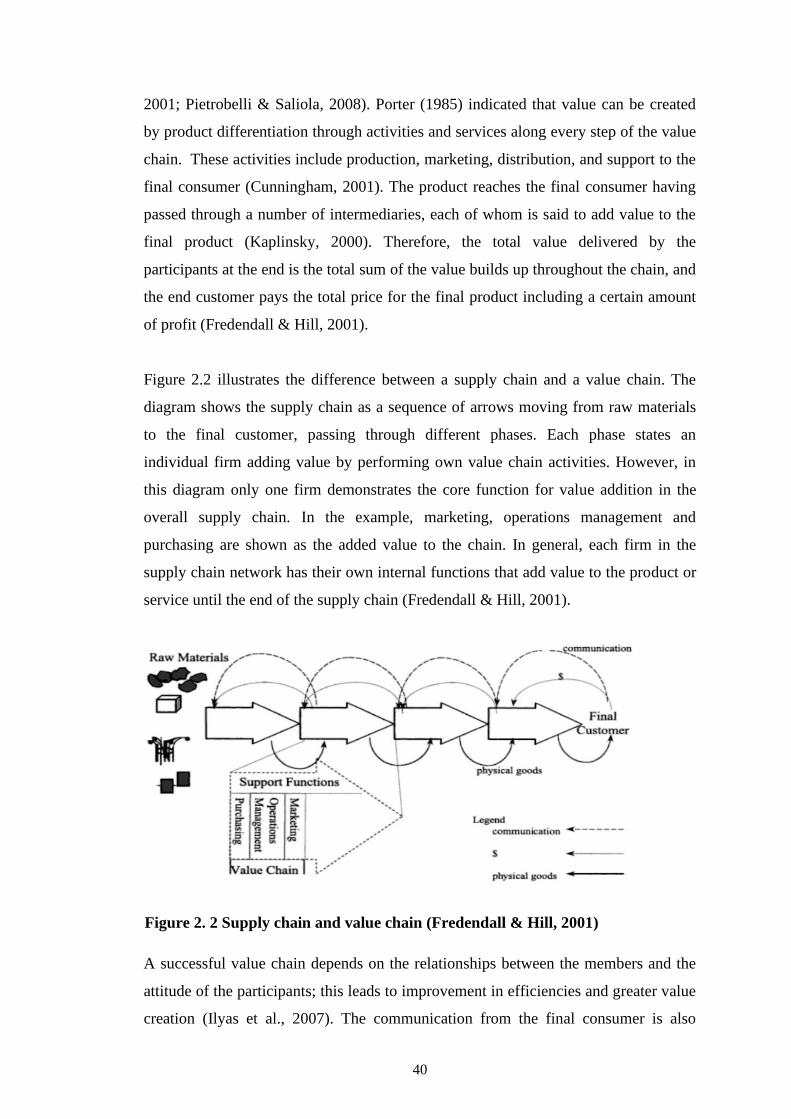
40
2001; Pietrobelli & Saliola, 2008). Porter (1985) indicated that value can be created
by product differentiation through activities and services along every step of the value
chain. These activities include production, marketing, distribution, and support to the
final consumer (Cunningham, 2001). The product reaches the final consumer having
passed through a number of intermediaries, each of whom is said to add value to the
final product (Kaplinsky, 2000). Therefore, the total value delivered by the
participants at the end is the total sum of the value builds up throughout the chain, and
the end customer pays the total price for the final product including a certain amount
of profit (Fredendall & Hill, 2001).
Figure 2.2 illustrates the difference between a supply chain and a value chain. The
diagram shows the supply chain as a sequence of arrows moving from raw materials
to the final customer, passing through different phases. Each phase states an
individual firm adding value by performing own value chain activities. However, in
this diagram only one firm demonstrates the core function for value addition in the
overall supply chain. In the example, marketing, operations management and
purchasing are shown as the added value to the chain. In general, each firm in the
supply chain network has their own internal functions that add value to the product or
service until the end of the supply chain (Fredendall & Hill, 2001).
A successful value chain depends on the relationships between the members and the
attitude of the participants; this leads to improvement in efficiencies and greater value
creation (Ilyas et al., 2007). The communication from the final consumer is also
Figure 2. 2 Supply chain and value chain (Fredendall & Hill, 2001)

41
important for the successful flow of the physical goods throughout the chain
(Fredendall & Hill, 2001). Bammann (2007) stated that there are three important
levels of the value chain. These are a) Value chain participants - participants in the
chain who deal directly with the product (i.e. producers, processors, traders, etc.). b).
Value chain supporters- actors who do not deal directly with the product, but who
provide services which add value to the product (i.e. input suppliers, industry
associations, researchers). C) Value chain influencers- actors or services which have a
big impact or influence on the product (i.e. the regulatory framework, policies, policy
makers, and infrastructure).
2.2.2 Value chain study approaches
Value chain analysis (VCA) normally describes the weak linkages and identifies
many potential upgrading strategies (Anandajayasekeram and Gebremedhin, 2009).
Kaplinsky and Morris (2001) argue that there is no correct way to conduct a value
chain analysis; rather, the approach taken fundamentally depends on the particular
question. The approach suggested by Kaplinsky and Morris (2001); Van den Berg
(2004); Herr and Muzira (2009), Thar (2016); Sarma et al. (2019) in analysing
agricultural commodity has been adopted. This comprises four aspects of the value
chain analysis. These area a) Value chain mapping- VC maps the actors participating
in the value chain (production, distribution, processing, marketing and consumption).
This helps to understand the characteristics of the chain participants and the
relationships among them, including the flow of product through the chain to its
destination of either the domestic or foreign markets. b) Identifying the distribution of
benefits of actors in the chain- VCA defines the margins and profits within the chain
to determine who benefits from participating in the chain and who requires support to
improve performance. This is important in the context of developing countries and
agriculture in particular given that the poor are vulnerable to the process of
globalization. c) Examining the role of upgrading within the chain- VCA examines
the role of upgrading within the chain by identifying the constraints and weaknesses.
Upgrading involves improvement in quality, product design which enable the
producers to gain higher value or through product differentiation. An analysis of the
upgrading process includes an assessment of the constraints that are currently present
for the chain actors. And d) Role of governance in the value chain - VCA also
describes the governance role which supports participants in the value chain.

42
Governance in a value chain refers to the structure of relationships and coordination
mechanism between actors in the value chain. This is important in improving
capabilities and increase value addition in the sector and corrects distributional
distortions.
2.2.3 Value chain actors
Craig (2000) divides the actors of the value chain into two categories: upstream and
downstream members. An upstream member provides the raw materials or finished
goods that are put into a business process. And the downstream members consume the
output of the corporation or company business process.
Sarma et al. (2019) conducted a research on tomato value chain in Bangladesh to
identify value chain actors such as input supplier, producers, traders, processors,
distributors and consumers which was shown in figure 2.3.
Shahidullah (2007) in his study stated that, the upstream value chain members in the
Bangladesh medicinal plant industry are comprised of an input supplier, primary
producers and processors, brokers and traders, and wholesalers, while in the
Figure 2. 3 Linkages and flow of tomato value chain in the study area

43
downstream are the distributors, herbal doctors, herbal dispensaries and consumers.
Manufacturers are in between, performing the core business process to transform
materials into products.
2.2.4 Value addition
This value addition to a product is the firm’s competitive advantage to establishing
the goal to deliver the product with maximum value to the end user for the least
possible total cost to the company, thereby maximizing profit (Porter, 1985). Porter
(1985) distinguished two important value-adding activities of an organization:
primary activities (inbound logistics, operations, outbound logistics, marketing, and
sales), and support activities (strategic planning, human resource management,
technology development, and procurement).
Value addition is one aspect of marketing that deals with practices that change or
transform a primary product into goods that have an additional value. Values adding
activities based on their simplicity and difficulties. The simplest are washing,
cleaning, grading, bulking and storage; these activities are conducted by the control of
farmers. And the complicated are ginning, roasting, refrigerating, milling, cutting,
mixing, dehydration, cooking and packaging. These activities are generally
undertaken by specialist market chain actors or service providers (Muluken, 2014).
2.2.5 Value chain upgrading
Upgrading of value added in products is related to (potential) demands in a market
(Laufenberg et al., 2003). Pietrobelli and Saliola (2008) define the following
upgrading options: entering higher unit value market niches, entering new sectors,
undertaking new productive functions and in all cases enlarging the technological
capabilities of the firms. Trienekens (2011) describes the upgrading of value added
production is various forms; upgrading of products (and packaging), upgrading of
processes, functional upgrading (insourcing production or distribution functions) and
inter-sectorial upgrading (where chain actors introduce value adding processes from
other sectors to offer new products or services: e.g. a farmer who enters into tourism
activities).

44
2.2.6 Value chain approach for agricultural products
The concept of agricultural value chain includes the full range of activities and
participants involved in moving agricultural products from input suppliers to farmers’
fields linking to the next stakeholder and finally to the consumers in order to form a
viable chain (Singh et al., 2013). Food value chains comprise all activities required to
bring farm products to consumers, including agricultural production, processing,
storage, marketing
(including exports),
distribution, and
consumption (Gomez
et al., 2011). Value
addition results from a
wide range of
activities; for a typical
agricultural value
chain; this would involve
production, transporting,
processing, trading,
retailing, and consumption (Anandajaysekeram & Gebremedhin, 2009). Value chains
are also channels for which finance (credit, revenues, and capital) moves from
consumers to producers; technologies, trainings and assistance are disseminated
among producers, traders, processors and transporters; and information on consumer
preference and demand are transmitted from consumers back to producers, processors
and other service providers (Figure 2.4).
It has been argued that linking of farmers to the markets through efficient value chains
would reduce the use of intermediaries in the chain, and strengthen the value adding
activities by better technology and inputs, upgraded infrastructure and processing and
exports (Miller and Jones, 2010; Pabuayon et al., 2009). Farmers involved in the
supply chain functions have less negotiating power and make little money having to
incentive for improving their product and this creates a great deal of risk for the
traders who buy only low-quality produce (Emana and Nigussie, 2011). However,
Faida (2006) stated that if farmers can negotiate a deal with a trader who buys a
Figure 2. 4 Typical agricultural value chain and
associated business development services
(Anandjaysekeram & Gebremedhin, 2009)
45
certain amount of high-quality product and the trader in turn has a contract with the
end users/ consumers, this makes the chain to function smoothly and develops a sense
of benefiting all actors from having a smooth supply of top quality products in a
sustainable manner. This function through which each actor is prepared to invest and
support other actors to maximize the benefit from the chain performance is known as
a value chain.
2.3 Review of studies relating to measurement of effectiveness
Effectiveness of any activities in any aspect has a problem of conceptualization. The
term may be variously perceived depending on one’s orientation, purpose and field of
investigation. Relevant literatures have been reviewed to clarify the concept
effectiveness of agricultural development activities and the factors that are likely to
influence it. Hence review of relevant literature from other functional fields of
management may help develop better understanding about the concept of
effectiveness and its determinants (Hasanullah, 1989).
Effectiveness of AICCs was measured using 4 - point rating scale while each
aforesaid dimension, score of 3, 2, 1 and 0 were assigned to indicate the extent of
effectiveness as ‘highly effective’, ‘moderately effective’, ‘low effective’, and ‘not at
all effective’, respectively. A respondent’s obtained scores of all five aspects were
added to compute his/her total effectiveness score. A score of ‘0’ indicated ‘no
effective’ while ‘15’ indicated ‘highly effective’. Finally, the respondents were
categorized into three categories according to their perceived effectiveness scores
(Khan et al., 2017). The effectiveness of extension services received was measured on
a 3-point Likert scale while each aforesaid dimension, score of 2, 1 and 0 were
assigned to indicate the extent of effectiveness as ‘very effective’, ‘effective’ and ‘not
effective’, respectively (Oluwasusi et al., 2014).
Khatun (2007) stated that effectiveness of agriculture related TV Programmes for
dissemination of agricultural information was the dependent variable of her study. It
was measured on the basis of perception of the farmers regarding the effectiveness of
agriculture related TV Programmes for dissemination of agricultural information to
the farmers. The extent of effectiveness of the programmes was measured by using a
4 point rating scale with four alternative responses of the respondents such as most

46
effective, effective, less effective and not at all effective. Scores were assigned to
these alternative responses as 3 for ‘most effective’, 2 for ‘effective’, 1 for ‘less
effective’ and 0 for ‘not at all effective’. By adding the assigned scores of 11 selected
types of information of a respondent together, the effectiveness score was obtained.
The dependent variable was the effectiveness of extension teaching methods. It was
measured on a four point Likert scale: Very effective (3 points), Effective (2 points),
fairly effective (1 point) and Not effective (0 point). The maximum score points was
48 while the minimum point was zero (Okunade, 2007)
Rahman (2007) stated that a total of 20 aspects of the effective use of extension
teaching methods were identified for assessment. In preparing the scale, the items
were written in such a way that the rating person did not face any difficulty in
understanding the meaning of items and giving their rating on each item properly. The
twenty items of the scale represented twenty major areas of extension teaching
methods of the SAAOs. The extent of the effective use of extension teaching methods
was measured by using a 4 point rating scale, such as very effective, effective, less
effective and not effective and score was assigned to each of the scale 3, 2, 1, 0
respectively.
Effectiveness of mass media in adoption of rice production technologies was the
dependent variable of the study. It was measured on the basis of opinion of the
farmers how effective the different mass media namely radio, television, newspaper,
poster, field day and opinion leader in adoption of rice production technologies
considering five stages of innovation decision process like knowledge, persuasion,
decision, implementation and confirmation stage. In doing so, farmers were asked to
give their opinion according to stage wise extent of effectiveness of mass media. The
extent of effectiveness of mass media was measured by using a 4 point rating scale,
such as very effective, effective, less effective and not effective and score was
assigned to each of the scale 3, 2, 1, 0 respectively (Roy, 2006).
Uddin (2006) stated that “effectiveness of the agricultural development activities of
World Vision” was the dependent variable of this study. A total of sixteen selected
items were constructed to measure the effectiveness of the agricultural development
activities of World Vision as perceived by the World Vision beneficiaries. A five-

47
point Likert scale was used to measure the opinion about effectiveness of agricultural
development activities of the respondent against each item with following responses
namely- 'most effective, more effective, effective, less effective and not at all
effective with corresponding scores of 4, 3, 2, 1 and 0. Effectiveness of the
agricultural development activities of World Vision as perceived by a respondent was
measured by summing up all the scores of all the sixteen items of that respondent. The
score of effectiveness of the agricultural development activities of World Vision as
perceived by the beneficiaries could range from 0 to 64, while 0 indicating no
effectiveness and 64 indicates very high effectiveness.
2.4 Review of studies relating to effectiveness
Khan et al. (2017) determined that more than one-third (37%) of the farmers
perceived that effectiveness of AICC in technology transfer was high while 38% of
the farmers perceived as “moderately effective” and 25% perceived as “low
effective”. Aderinto et al. (2017) conducted a study on Effectiveness of Extension
Service Delivery and Productivity of Cassava Farmers in Southwestern Nigeria.
Result showed that extension agencies were not effectively meeting the aspirations of
cassava farmers. Majority (76.1%) of the respondents noted services being rendered
to them to be on the low divide of effectiveness while 23.9% rated it to be high.
Extension agencies should therefore be more accessible and provide cassava farmers
with effective support services for improved productivity.
Rahman (2015) revealed that training programme on mushroom cultivation was
medium effective among highest proportion (39.8%) of the trained mushroom
farmers, while 32% and 28.2% were found low and high effective respectively. It was
found that training programme on mushroom cultivation was effective to the trained
farmers from medium to very high level. So, necessary steps need to be taken to
enhance the existing activities of mushroom training programme that could improve
the sustainable mushroom production as well as the livelihood of the mushroom
farmers throughout the country. Afroz (2014) observed that result demonstration
program had medium effectiveness (64.40 percent) among the farmers in the transfer
of BRRI dhan-50.

48
Roy (2013) found that about four-fifth of the FFS farmers (91%) perceived FFS for
soil and crop management as medium to high effective in Farmer Field School (FFS)
for soil and crop management in the study area. Khatun (2007) stated that the score
for effectiveness of agriculture related TV programmes in disseminating agricultural
information as perceived by the farmers was ranged from 15 to 32 against the possible
range of 0 to 27. The mean and standard deviation were 24.32 and 2.70 respectively.
An overwhelming majority (85%) of the farmers perceived medium to low
effectiveness and 15% perceived high effectiveness of the agriculture related TV
programmes in disseminating agricultural information. Rahman (2007) revealed that
highest proportion (56 percent) of the respondents had moderately effective use of
extension teaching methods compared to 18 and 26 percent having less effective use
and highly effective use of extension teaching methods respectively. Roy (2006),
reported that 48.18 % respondents belonged to medium effective category while
37.27% highly effective category and 14.55% low effective category. Thus, about
85% respondents opined that mass media had medium to highly effective in adoption
of rice production technology in this study area. Majydyan (1996) determined the
effectiveness of 11 communication media by farmer’s perception on four message
characteristics adequateness, understandability, applicability, land persuasiveness etc.
Tripathy and Pandey (1967) reported that indirect methods were most effective
followed by personal contact, demonstration, group discussion and literature. Radio,
film show and meeting were moderately effective. Tours, exhibits and fairs were less
effective.
2.5 Review of studies relating to farmers characteristics
Socio-economic variables may influence the accessibility to agricultural information
of the farmers (Rehman, 2010). Farmers’ characteristics such as education, farm size,
annual family income, organizational participation, extension contact, awareness on
ICT facilities, access to ICT facilities, knowledge on ICT, and training received on
ICT had significant positive relationship with their perceived effectiveness of AICC
while age and household size had negative and insignificant relationship with
effectiveness of AICC. The influential factors that affecting the effectiveness of AICC
were education, annual family income and knowledge on ICT were confirmed by the
multiple regression models. This model also explained that these three explanatory
variables together explained 81.2% variation in perceived effectiveness of AICC

49
while knowledge on ICT explained 70% variation in perceived effectiveness of AICC.
Lack of operational knowledge of computer, lack of training facilities on ICT, low
awareness among rural farmers were identified as the major constraints of using
AICC facilities. However, extension policy makers should take into consideration
above findings and provides ICT training to the users, developing ICT infrastructure,
adequate maintenance of the center facilities etc. that influence to make AICC
effective and sustainable. (Khan et al., 2017)
Aderinto et al. (2017) in their study observed that most respondents were males
(74.7%), married (97.1%) and members of farmers’ association (71.0%) while 59.6%
had no formal education. Mean age was 47.9±11.79 years, farm size 4.6±2.03/ ha,
family size 6.5±0.46 persons and farming experience 24.7±12.55 years. Majority of
the respondents had low access to extension (4.62±1.24), Service effectiveness rating
was low for extension (13.3±5.16). Respondents considered irregular visits of
extension agents (100.0%) as the most severe constraints to utilization of services.
Majority (80.9%) recorded low productivity. Respondents’ productivity was
influenced by farming experience (β=-.193), family size (β=-0.111), farm size (β =
-0.187), membership of association (β=0.112), and production capacity (β=0.096.)
Rahman (2015) stated that the correlation analysis indicated that age, cosmopoliteness
and extension media contact of the trained mushroom farmers had significant positive
relationships with their effectiveness of training programme on mushroom cultivation.
Fatalism and problems faced by the trained farmers in mushroom cultivation had
significant negative relationships with their effectiveness of training programme on
mushroom cultivation. Education, family size, annual family income, peer group
influence, organizational participation, innovativeness had no significant relationships
with their effectiveness of training programme on mushroom cultivation. Oluwasusi
et al. (2014) conducted a study to determine the effectiveness of extension services
among food crop farmers in Ekiti State, Nigeria. Results reveal that more than half of
the farmers are female (56.6%) and have poor contact with extension services
(54.5%). Significant relationship exists between age, sex, level of education, farming
experience, farmer’s attitude toward extension services, extension services received,
and the effectiveness of extension services. Training and increased incentives for
extension agents, as well as proper monitoring and evaluation of extension budgets,
are pertinent to improving extension service delivery to farmers.

50
2.6 Research gap of the study
There are lots of researches on use of post-harvest practices on various issues. In the
past, production-oriented research has received greater attention than post-harvest
research to strengthen vegetable export market. Most of the research were taken to
reduce post-harvest loss, knowledge on post-harvest practices. Previously no study
was undertaken so far on effects of using selected post-harvest practices to strengthen
vegetable export market. In addition, reports with adequate details to measure the
effects of use of post-harvest practices of at different levels of vegetable value chain
in Bangladesh are also scarce. To the best of the knowledge of the present Researcher,
very little attempts were made to determine effects of using selected post-harvest
practices to strengthen vegetable export market.
2.7 Conceptual framework of the study
In scientific research, selection and measurement of variables constitute an important
task. The hypothesis of a research while constructed properly contains at least two
important elements i.e. “a dependent variable” and “an independent variable”. A
dependent variable is that factor which appears, disappears or varies as the researcher
introduces, removes or varies the independent variables (Townsend, 1953). An
independent variable is that factor which is manipulated by the researcher in his
attempt to ascertain its relationships to an observed phenomenon. In view of the prime
theme of the study, the researcher constructed a conceptual framework which is self-
explanatory and is presented in Figure 2.5.
It is assumed that selected characteristics of the farmers (Independent variables) might
have contribution to their perceived effects of using selected post-harvest practices to
strengthen vegetable export market (Dependent variable).
Government initiatives strengthening post-harvest value chain through Agricultural
Extension Service Providers (GOs, NGOs and Private sectors). Agricultural Extension
Service Providers are servicing the farmers to solve their problems; alternately
farmer’s post-harvest activities might be effective to strengthen vegetable export
market.
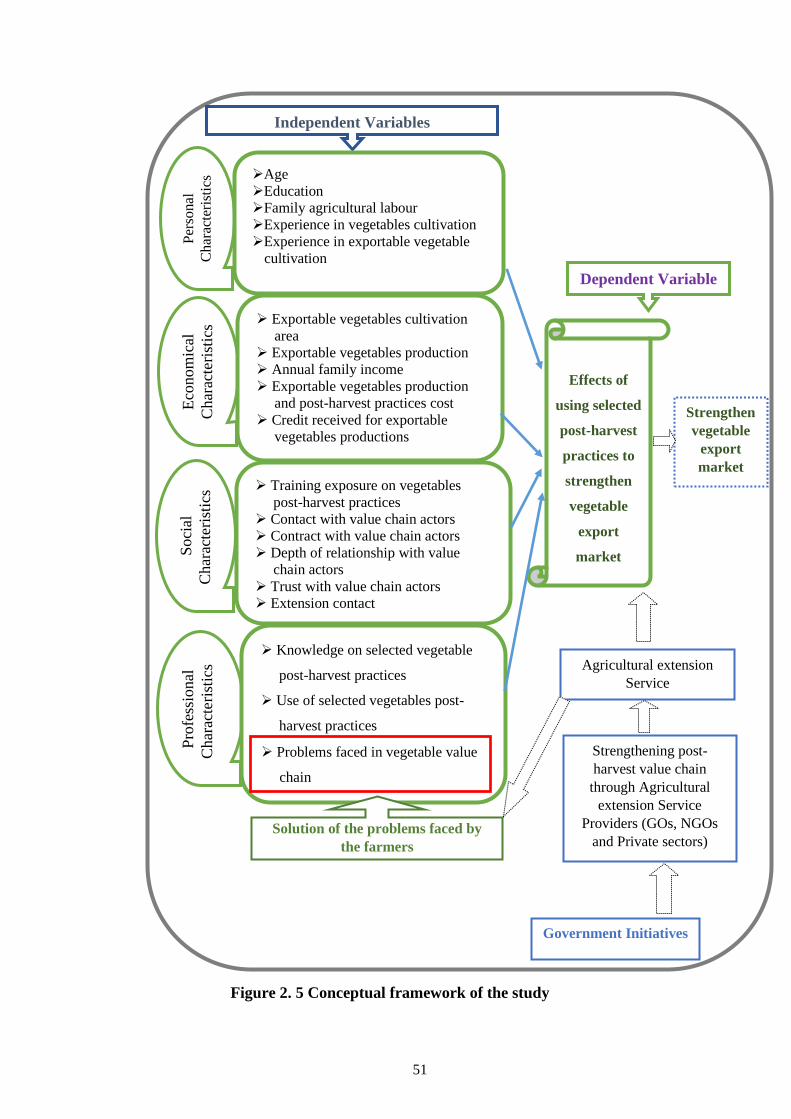
51
Eco
nom
ical
Char
acte
rist
ics
Soci
al
Char
acte
rist
ics
Pro
fess
ional
Char
acte
rist
ics
➢ Exportable vegetables cultivation
area
➢ Exportable vegetables production
➢ Annual family income
➢ Exportable vegetables production
and post-harvest practices cost ➢ Credit received for exportable
vegetables productions
Independent Variables
➢ Training exposure on vegetables
post-harvest practices
➢ Contact with value chain actors
➢ Contract with value chain actors
➢ Depth of relationship with value
chain actors
➢ Trust with value chain actors
➢ Extension contact
➢ Knowledge on selected vegetable
post-harvest practices
➢ Use of selected vegetables post-
harvest practices
Dependent Variable
Per
sonal
Ch
arac
teri
stic
s ➢Age
➢Education
➢Family agricultural labour
➢Experience in vegetables cultivation
➢Experience in exportable vegetable
cultivation
Effects of
using selected
post-harvest
practices to
strengthen
vegetable
export
market
➢ Problems faced in vegetable value
chain
Solution of the problems faced by
the farmers
Agricultural extension
Service
Strengthening post-
harvest value chain
through Agricultural
extension Service
Providers (GOs, NGOs
and Private sectors)
Government Initiatives
Figure 2. 5 Conceptual framework of the study
Strengthen
vegetable
export
market
52
CHAPTER 3
MATERIALS AND METHODS
A researcher should work very carefully in formulating methods and procedures.
Methodology gives clear direction to a researcher about his works and activities
during the whole period of the study. Appropriate procedures for collecting data were
taken by the researcher to collect valid and reliable information. Various methods,
tools and techniques were used during different stages of this research work and
compilation of data. The purpose of this chapter was to describe the setting, methods
and procedures used in conducting this study.
3.1 Locale of the study
Four (4) criteria, such as (a) financing organizational activities through contract
farming (b) program intensity of associations (c) use of selected post-harvest activities
and (d) amount of export vegetables were considered to select Narsingdi district for
the study. Bangladesh Fruits, Vegetables and Allied Products Exporter’s Association
(BFVAPEA) is in actively operating in this district. Three upazilas namely Belabo,
Raipura and Shibpur of Narsingdi district were selected purposively based on the
intensity of BFVAPEA activity. Farmers’ group formed by BFVAPEA are actively
producing vegetables like Bitter Gourd, Brinjal and Teasel Gourd and exporting from
different villages of different unions of the three upazilas under Narsingdi district. On
this consideration these three upazilas of Narsingdi district were selected as the local
of the study.
Map of Narsingdi district and separate maps of Belabo, Raipura and Shibpur upazila
showing BFVAPEA activity in the unions are presented in Figure 3.1, 3.2, 3.3 and 3.4
respectively.

53
Figure 3. 1 Map of Narsingdi district showing the three selected upazilas

54
Figure 3. 2 Map of Belabo upazila showing the study unions

55
Figure 3. 3 Map of Raipura upazila showing the study unions

56
Figure 3. 4 Map of Shibpur upazila showing the study unions

57
3.2 Population of the study
A total of 717 farmers of the selected three upazilas of Narsingdi district are actively
producing and exporting Bitter Gourd, Brinjal and Teasel Gourd with the help of
BFVAPEA. These 717 farmers was considered as the population of the study.
3.3 Sample and sampling procedure of the study
The sample size was chosen with a number of factors including the purpose of the
study, population size, the risk of selecting a bad sample and the allowable sampling
error. There are several methods for determining the sample size but the following
formula developed by Yamane (1967) was used to determine the sample size.
Z2 P (1- P) N
n =
Z2 P (1- P) + N (e)2
Where,
n = sample size
N = population size
e = the level of precision (5%)
z = the value of the standard normal variable given the chosen confidence
level (e.g. z= 1.96 with a CL = 95%)
p = the proportion or degree of variability = 50%.
By putting the values in the above formula, the sample size was determined as
follows:
0.25 (Z2) N
n =
0.25 (Z2) + N (e)2
0.25x1.96x1.96x717
=
0.25x1.96x1.96 + 717x0.05x0.05
688.6068
=
.9604 + 1.7925
688.6068
=
2.7529
= 250.1386 ≈ 250

58
Sample size calculator developed by Creative Research System (1984) was also used
to determine the sample size. By putting a 5% Confidence level, 5 as Confidence
interval and 717 as population, the sample size was obtained as 250.
Thus, 250 respondents constituted the sample of the study. Separate list of farmers for
Bitter Gourd, Brinjal and Teasel Gourd producing and exporting vegetables of
different villages, different unions of each of the three upazilas were collected from
BFVAPEA office. Proportionate random sampling technique was used for selecting
sample from farmers’ group formed by BFVAPEA in different villages of different
unions of three selected upazilas under Narsingdi district as shown in Table 3.1. Ten
percent of the population was selected through proportionate random sampling
procedure to include in the reserve list. A reserve list was maintained to fill in the
gaps in case of any respondent in the original list was missing or absent in the time of
interview. Finally 91, 75 and 84 farmers were included for Bitter Gourd, Brinjal and
Teasel Gourd respectively in the sample.
Table 3.1 Number distribution of the population and sample of farmers and
those included in the reserve list
Vegetables Upazila Union Village Population
(Farmer)
Sample Size
for study
group
Reserve
list
Bitter
Gourd
Belabo
Sallabad Sallabad 20 7 1
Patuli Vabla 20 7 1
Char Ujilaba Baricha 20 7 1
Narayanpur Rahimakandi 17 6 1
Subtotal Belbo 77 27 4
Raipura
Char Subuddhi Charsubuddi 15 5 0
Marjal Char Marjal 12 4 0
Marjal 20 7 1
Daukar Char Daukar Char 16 6 1
Radhanagar Paschim
Radhanagar 10 3 0
Adiabad Adiabad 16 6 1
Subtotal Raipura 89 31 3
Shibpur
Josar Chaitonya 18 6 1
Joynagar Joynagar 20 7 1
Baghaba
Kharakmara 20 7 1
Kundarpara 16 6 1
Brahmondi 20 7 1
Subtotal Shibpur 94 33 5
Total Bitter Gourd farmer 260 91 12
Brinjal Belabo
Sallabad Sallabad 20 7 1
Patuli Vabla 20 7 1
Char Ujilaba Baricha 20 7 1
Subtotal Belbo 60 21 3

59
Vegetables Upazila Union Village Population
(Farmer)
Sample Size
for study
group
Reserve
list
Raipura
Char Subuddhi Charsubuddhi 15 5 0
Marjal Char Marjal 12 4 0
Marjal 20 7 1
Daukar Char Daukar Char 16 6 1
Radhanagar Paschim
Radhanagar 10 3 0
Subtotal Raipura 73 25 2
Shibpur Baghaba
Kundarpara 20 7 1
Brahmondi 17 6 1
Kharakmara 25 9 1
Joynagar Joynagar 20 7 1
Subtotal Shibpur 82 29 3
Total Brinjal farmer 215 75 8
Teasel
Gourd
Belabo
Char Ujilaba Baricha 20 7 1
Narayanpur
Rahimakandi 17 6 1
Baterchar 14 5 0
Uttar
Rahimakandi 12 4 0
Jallabaj 20 7 1
Botibandha 18 6 1
Amlaba Amlaba 20 7 1
Subtotal Belbo 121 42 5
Raipura Adiabad Adiabad 16 6 1
Saherchar 10 3 0
Subtotal Raipura 26 9 1
Shibpur
Josar Chaitonya 18 6 1
Debalertek 20 7 1
Baghaba
Kharakmara 17 6 1
Kundarpara 20 7 1
Brahmondi 20 7 1
Subtotal Shibpur 95 33 6
Total Teasel Gourd farmer 242 84 12
Grand Total 717 250 32
3.4 Data collecting instrument
A draft interview schedule was prepared keeping in mind the objectives of the study.
Direct questions and different scales were kept in the questionnaire to get the desired
information. The principal method employed was the face-to-face personal interview
using the interview schedule for the study. The draft interview schedule was pretested
with 36 farmers by taking 4 farmers for each of 3 vegetables from each of 3 upazilas.
Final interview schedule was prepared after necessary addition, deletion, corrections
and modification based on pre-test results. English version of the interview schedule
is shown in Appendix-I.

60
3.5 Data collection procedure
Data were collected by the researcher himself through face to face interviewing of the
selected sample farmers by using Bengali interview schedule. The data were collected
during the period from August 01, 2019 to November 31, 2019. Researcher has
visited every selected sample respondent with the help of the BFVAPEA personnel
with prior appointment. In case of non-availability of the sample farmers, the
researcher paid make-up visit to their convenient date and time. However, it was not
possible to collect data from 8 farmers in the original sample due to their
unavailability at the time of interview despite several attempts to contact them.
Therefore, the researcher had to collect data from 8 farmers of the reserve list.
3.6 Variables of the study
The variable is a characteristic, which can assume varying, or different values in
successive individual cases. Measurable characteristics of a population that may vary
from element to element either in magnitude or in quality are called variables (Ahmed
et al., 2004). Ezkiel and Fox (1959) defined a variable as any measurable
characteristics which can assume varying or different values in successive individual
cases. The success of a research to a considerable extent depends on the exact
selection of the variables. The variables of the study had been selected after a
thorough searching of literatures and discussions with the Advisory Committee
Members, and relevant experts of both home and abroad. There are two types of
variables in any relationship study, viz. independent variable and dependent variable.
An independent variable is the presumed cause of the dependent variable, the
presumed effect (Kerlinger, 1973). A causal (Independent) variable is that factor
which is manipulated by the researcher in his attempt to ascertain its relationship to an
observed phenomenon. A dependent variable is that factor which appears, disappears
or varies as the researcher introduces, removes or varies the causal variable
(Townsend, 1953). The dependent variable is often called the criterion or predicted
variables, whereas the independent variable is called the treatment, experimental and
antecedent variable (Dalen, 1977).
In the scientific research, the selection and measurement of variable constitute a
significant task. Following this conception, the researcher reviewed literatures to
widen this understanding about the natures and scopes of the variables relevant to this

61
research. At last the researcher had selected 19 Independent (Causal) variables and
one dependent variable. The 19 selected characteristics of the farmers were
considered as independent variables of the study and these were (a) personal
characteristics - age, education, family agricultural labour, experience in vegetables
cultivation, experience in exportable vegetables production, (b) economical
characteristics - exportable vegetables cultivation area, exportable vegetables
production, annual family income, exportable vegetables production and post-harvest
practices cost, credit received for exportable vegetables produces, (c) social characteristics
- training exposure on vegetables post-harvest practices, contact with value chain
actors, contract with value chain actors, depth of relationship with value chain actors,
trust with value chain actors, extension contact and (d) professional characteristics -
knowledge on selected vegetables post-harvest practices, use of selected vegetables
post-harvest practices and problems faced in vegetable value chain. Effects of using
selected post-harvest practices to strengthen vegetable export market constituted the
dependent variable of the study. The variables of the study were operationalized
through direct questions, developing relevant scales by the researcher and scales
developed by others as shown in Table 3.2.
Table 3.2 Summarized operationalization of the variables of the study with
measuring unit
Variables Measuring
unit
Operationalization
Independent variables
Personal characteristics
1. Age Actual years Direct question
2. Education Schooling
years
Direct question
3. Family agricultural labour Number of
family
member
Direct question
4. Experience in vegetables cultivation Experience
in year
Direct question
5. Experience in exportable vegetables
production
Experience
in year
Direct question
Economical characteristics
1. Exportable vegetables cultivation area Hectare Direct question
2. Exportable vegetables production Kg Direct question
3. Annual family income ‘000’ BDT Direct question
4. Exportable vegetables production and
post-harvest practices cost
‘000’ BDT Direct question
5. Credit received for exportable ‘000’ BDT Direct question

62
Variables Measuring
unit
Operationalization
vegetables production
Social characteristics
1. Training exposure on vegetables post-
harvest practices
Number of
days
Direct question
2. Contact with value chain actors Scores Scale developed for this
study
3. Contract with value chain actors Scores Scale developed for this
study
4. Depth of relationship with value chain
actors
Scores Scale developed for this
study
5. Trust with value chain actors Scores Scale developed for this
study
6. Extension contact Scores Scale used by Ali
(2008) and slightly
modified for this study
Professional characteristics
1. Knowledge on selected vegetable post-
harvest practices
Scores
Scale developed by
Coombs (1950), Bloom
(1956), Perry and
Michael (1951), Mehta
(1958) and used by
Singh (1981), Sagar
(1983), Ray and Bora
(1991), Choudhury
(1998), Islam (2000)
and Ali (2008)
2. Use of selected vegetables post-harvest
practices
Scores Scale developed for the
study
3. Problems faced in vegetable value
chain
Scores Scale developed for this
study
Dependent variable
Effects of using selected post-harvest
practices to strengthen vegetable export
market
Scores
Scale developed with
the help of Khan et al.
(2017), Khatun (2007),
Okunade (2007), Roy
(2006) and Majydyan
(1996) with slight
modification
3.7 Measurement of independent variables
It was pertinent to follow a methodological procedure for measuring the selected
variables in order to conduct the study in accordance with the objectives. The
procedures for measuring the independent (causal) variables are described below:

63
3.7.1 Personal characteristics
3.7.1.1 Age
Age of a respondent was measured in terms of years from his/her birth to the time of
interview. A score of one (1) was assigned for each year of age. Question regarding
this variable appears in item no. 1 in the interview schedule (Appendix-I).
3.7.1.2 Education
Education was measured in terms of one’s year of successful schooling. One (1) score
was given for passing each year in an educational institution. Mazumder (2014), Ali
(2008), Moin (2008) and Amin (2004) followed this procedure for measuring
education score. For example, if the farmer passed the H.S.C. examination, his
education score was given as 12; if farmer passed the final examination of class Eight
(VIII), his education scores was given as 8. If the farmer did not know how to read
and write, his education score was given as ‘0’ (zero). A score of 0.5 (half) was given
to that farmer who could sign his/her name only. A score of one (1) was assigned for
those farmer who learnt only reading and writing on simple basis from the adult
learning center (Ali, 2008). Question regarding this variable appears in the item no. 2
in the interview schedule (Appendix-I).
3.7.1.3 Family agricultural labour
Family agricultural labor means the number of family members engaged in various
agricultural activities of exportable vegetable cultivation. Agricultural labour or
worker means a person who is employed in agricultural work for wages on the basis
of daily, monthly or yearly contract or on a contract of doing any specific work
(Bangladesh labour Act, 2006: Act 42 Section 2, subsection 8a). Child means a person
who has not completed his fourteenth (14) year of age (Bangladesh labour Act, 2006,
Act 42, section 2, subsection 63), Adolescent means a person who has completed his
fourteenth(14) year but has not completed his eighteenth (18) year of age (Bangladesh
labour Act, 2006, Act 42 section 2 subsection 8), Adult means a person who has
completed his eighteenth (18) year of age (Bangladesh labour Act, 2006, Act 42,
section 2 subsection 36). A score of 1, 1/3 and 2/3 were assigned for adult, adolescent
and child member who engaged in agricultural farming practices. The scores against
the different age levels of his family members were added together to determine

64
family agricultural labour of the respondent. Questions regarding this variable appears
in the item no. 3 in the interview schedule (Appendix-I).
3.7.1.4 Experience in vegetables cultivation
Vegetables cultivation experience of the respondent was measured by the number of
years a respondent engaged in vegetable cultivation. The measurement included from
the year of starting of first vegetables cultivation till the year of data collection. A
score of one (1) was assigned for each year of experience. Islam (2006) used this type
of measurement. Question regarding this variable appears in the item no. 4 in the
interview schedule (Appendix-I).
3.7.1.5 Experience in exportable vegetables production
Experience in exportable vegetables production of the respondent was measured by
the number of years a respondent engaged in exportable vegetable production. The
measurement included from the year of starting of first exportable vegetables
cultivation till the year of data collection. A score of one (1) was assigned for each
year of experience. Question regarding this variable appears in the item no. 5 in the
interview schedule (Appendix-I).
3.7.2 Economical characteristics
3.7.2.1 Exportable vegetables cultivation area
Exportable vegetables cultivation area was measured by the area of land on which the
farmer cultivated exportable vegetables. It was measured in Hectare. Question
regarding this variable appears in the item no. 6 in the interview schedule (Appendix-
I).
3.7.2.2 Exportable vegetables production
Exportable vegetables production of a farmer was measured by the amount of
vegetable production of the farmer from his/her exportable vegetables cultivated area.
The unit of measurement was in ‘Kg’ Question regarding this variable appears in the
item no. 7 in the interview schedule (Appendix-I).

65
3.7.2.3 Annual family income
Annual family income referred to the total earnings of a farmer and the members of
his/her family from agricultural and non-agricultural sources (business, services, daily
labour etc.) during the whole year. It was measured by the total earning of all the
members of the family. Annual family income was expressed in '000' BDT i.e. One
(1) score was given for BDT 1000 annual family income. For example, a score of
forty five (45) was given to a farmer whose annual income was BDT 45,000.
Questions regarding this variable appears in the item no. 8 in the interview schedule
(Appendix-I).
3.7.2.4 Exportable vegetables production and post-harvest practice cost
Exportable vegetables production and post-harvest practice cost of a farmer was
measured in ‘000’ BDT. One (1) score was given for BDT 1000 cost for exportable
vegetables production and post-harvest practice. This includes vegetables cultivation
cost and post-harvest value chain cost at different level of post-harvest practices. For
example, a score of forty (40) was given to a farmer whose exportable vegetables
production and post-harvest practice cost BDT 40,000. Questions regarding this
variable appears in the item no. 9 in the interview schedule (Appendix-I).
3.7.2.5 Credit received for exportable vegetable production
Credit received from different sources for exportable vegetables production of a
farmer was measured in ‘thousand’ BDT on the basis of total credit received from
different sources to produce exportable vegetables by the farmer. One (1) score was
given for BDT 1000 credit received for exportable vegetable production. For example,
a score of thirty five (35) was given to a respondent whose received credit for exportable
vegetables production was BDT 35,000. Questions regarding this variable appears in the
item no. 10 in the interview schedule (Appendix-I).
3.7.3 Social characteristics
3.7.3.1 Training exposure on vegetables post-harvest practices
Training exposure on vegetables post-harvest practices refers to the extent of farmers’
participation in formal training programs offered by different organizations and
agencies time-to-time on vegetables post-harvest practices. It was considered through
the respondents' total number of days of participation in training program. A score of

66
one (1) was assigned for each day of training experience. A zero (0) score was
assigned for no training exposure. Ali (2008) used this type of measurement.
Questions regarding this variable appears in the item no. 11 in the interview schedule
(Appendix-I).
3.7.3.2 Contact with value chain actors
Contact with value chain actors of a farmer was measured by asking his/her frequency
of contact with eight (8) types of value chain actors. Question regarding this variable
appears in the item no. 12 in the interview schedule (Appendix-I).
A farmer was asked to indicate his frequency of visit against each of the value chain
actors along with 8-point continuum: “Always”, “Once in a day”, “Once in a week”,
“Once in a fortnight”, “Once in a month”, “Once in a quarter”, “Once in a year” and
“No contact” and weights assigned to these responses as 7, 6, 5, 4, 3, 2, 1 & 0
respectively. The total score of a respondent was determined by adding the weights
for responses against all the items. Thus, the possible score of a farmer could range
from 0 to 56, where 0 indicated no contact and 56 indicated highest level of contact.
3.7.3.3 Contract with value chain actors
Contract with value chain actors of a farmer was measured by asking what kind of
contract he/she made with the value chain actors. Score was assigned as 3, 2, 1 and 0
for MoU/Deed, Written contract, Verbal contract and No contract respectively.
Question regarding this variable appears in the item no. 13 in the interview schedule
(Appendix-I).
A farmer was asked to indicate his kind of contract with value chain actors such as
MOU/Deed, Written contract, Verbal contract and No contract. Weightages assigned
to these responses were 3, 2, 1 and 0 respectively. The total score of a farmer was
determined by adding the weights for responses against all the items. Thus, the
possible contract with value chain actors’ score of a farmer could range from 0 to 3,
where 0 indicated no contract and 3 indicated formal MOU/Deed with value chain
actors.

67
3.7.3.4 Depth of relationship with value chain actors
Depth of relationship with value chain actors of a farmer was measured by asking
his/her nature of depth of relationship with eight (8) types of value chain actors.
Question regarding this variable appears in the item no. 14 in the interview schedule
(Appendix-I).
A farmer was asked to indicate his extent of depth of relationship against each of the
items along with a 6-point rating scale: very high, high, substantial, little, very little
and not at all. Weightages were assigned to these responses as 5, 4, 3, 2, 1 and 0
respectively. The weights of all responses with all value chain actors was summated
together to obtain the extent of depth of relationship with value chain actors. Thus, the
depth of relationship score of a farmer could range from 0 to 40 where 0 indicated the
no relationship and 40 indicated the highest level of relationship with value chain
actors.
3.7.3.5 Trust with value chain actors
Trust with value chain actors of a respondent was measured by asking his/her level of
trust with eight (8) types of value chain actors by using 6 point rating scale. Question
regarding this variable appears in the item no. 15 in the interview schedule
(Appendix-I).
A farmer was asked to indicate his level of trust against eight (8) types of value chain
actors by using 6 point continuum: very high, high, substantial, little, very little and
no trust. Weightages were assigned to these responses as 5, 4, 3, 2, 1 and 0
respectively. The weights of all responses was summated together to obtain the level
of trust with value chain actors. Thus, the level of trust score of a respondent could
range from 0 to 40 where 0 indicated the no trust and 40 indicated the highest level of
trust with value chain actors.
3.7.3.6 Extension contact
Extension contact of a respondent was measured by the extent of contact with 26
selected agricultural extension media. A scale was developed arranging the weights as
3, 2, 1 and 0 for the responses for regularly, occasionally, rare and not at all contact
with these agricultural extension related media respectively. Scale developed by Ali

68
(2008) for measuring extension contact was used with slight modified by the present
researcher for measuring extension contact of the farmers. Logical frequencies of
contact was assigned for each type of responses for each item as mentioned in the
item no. 16 of the interview schedule (Appendix-I).
Finally extension contact score of a farmer was computed by summing all the scores
for contact with 26 types of selected extension media by that respondent. Thus,
extension contact score of a farmer could range from 0 to 78 while ‘0’ indicating no
extension contact and ‘78’ indicating highest extension contact.
3.7.4 Professional characteristics
3.7.4.1 Knowledge on selected vegetable post-harvest practices
Knowledge as defined in this study included ‘those behaviour and test situations
which emphasized the remembering either by recognition or recall of ideas, material
or phenomenon’ (Bloom, 1956). This variable indicated the extent of post-harvest
practice knowledge of the respondents at the time of interview as evident from their
responses to a set of questions logically and scientifically prepared for this purpose.
The steps followed in developing the scale for knowledge test for this study are
discussed below:
Collection of items: The content of knowledge test is composed of questions called
items. Items for the test were collected from different sources, such as, literatures;
agricultural scientists of Agronomy, horticulture, soil science, agricultural chemistry,
entomology, plant pathology, agribusiness management, agri-economics, agro-
forestry, environmental science, and agricultural extension education of home and
abroad; extension personnel; NGO personnel; Bangladesh Fruits Vegetables & Allied
Products Exporter’s Association (BFVAPEA), Hortex Foundation, vegetables
exporters, vegetable value chain actors, progressive farmers and researcher’s own
experience. The questions were designed to test the post-harvest practice knowledge
of the farmers. The items were collected and prepared in relation to post-harvest
practices of vegetable to strengthen value chain. Fifty Four (54) items were collected
initially which appeared to be relevant.

69
The selection of items was done on the basis of Bloom’s (1956) revised taxonomy as
devised by Anderson and Krathwohl (2001). The items contained questions on each
of remembering, understanding, applying, analyzing, evaluating and creating about
post-harvest practices. Considering the above mentioned criteria, 36 questions by
taking 6 from each of remembering, understanding, applying, analyzing, evaluating
and creating about post-harvest practices were selected out of initially collected 54
items with the consultation with Advisory Committee Member for administering these
items to the Judges for Judges’ rating and 36 farmers for item analysis.
Judges’ rating: The selected 36 items were sent to 30 experts (Judges) to rate the
items of the scale of knowledge on selected vegetable post-harvest practices. The
Judges were selected from different related disciplines including agricultural
extension, agronomy, horticulture, plant pathology, entomology, soil science and
environmental science of different agricultural universities, research institutes,
extension organizations and non-government organizations. Letter to Judges from the
Chairman of the Advisory Committee of this research appears on Appendix-II. For
determining the appropriateness and relevancy of the items of “knowledge on selected
vegetable post-harvest practices scale”, the Judges were requested to mention their
opinion in 9-point suitability continuum against each of the practice (1 for least
appropriate and 9 for most appropriate). Out of 30 judges, 25 replied. Therefore, the
responses of 25 Judges were retained for selection of items for the scale of knowledge
on selected vegetable post-harvest practices for the study. Based on the ratings of 25
Judges, Average Appropriateness Score (AASk) of each of the item was measured
with the following formula:
ΣSik
AASk =
n
Where,
AASk = Average Appropriateness Score of the ith item of knowledge scale
Sik = Appropriateness score given by the Judges for ith item of knowledge scale
n = Number of Judges = 25
After determining the AASk of each of all the items, it was found that the AASk of all
items was more than 4.5 out of 09 i.e. more than half of the highest possible AASk of
9. Based on this criteria all the 36 items were selected for the scale of knowledge on

70
selected vegetable post-harvest practices for pre-test. Average Appropriateness Score
(AASk) was shown in Appendix-III.
Item analysis: After Judges’ rating, 36 items of knowledge were considered for item
analysis. The item analysis of a knowledge test usually yields two kinds of
information, that is, item difficulty and item discrimination. The index of item
difficulty indicates how difficult an item is, whereas, the index of discrimination
explores the extent to which an item discriminates the well informed farmers from
poorly informed ones.
Similar to the procedure followed by Ali (2008), the items were analyzed on the basis
of pre-test data obtained by administering to 36 farmers. The 36 farmers for
administering the items were randomly selected by taking four (4) from each of three
(3) vegetables from each of three (3) upazilas and were different from the sample
farmers of the present study. Nevertheless these 36 farmers were representative of the
total population on the basis of which the final study was conducted. Each of the 36
items had three alternative choices of answers including one right answer. Each one of
the 36 respondents, to whom the test was administered, was given one (1) score for
right answer and zero (0) score for ‘wrong’ or no answer with respect to each item.
The total number of right answers given by the respondent out of 36 items was the
knowledge score secured by him. The maximum score was obviously 36 which could
be scored when all the 36 items were answered correctly.
Calculation of difficulty index: Sagar (1983), Choudhury (1998), Islam (2000) used
the following formula to calculate difficulty index of an item:
ni
Pi = X 100
Ni
Where,
Pi = Difficulty index in percentage of ith item
ni = Number of farmers given correct answer to ith item
Ni = Total number of farmers to whom ith item was administered, i.e. 36 in the present
study.

71
Actually difficulty index of an item indicates how difficult an item is. But the above
formula is fully opposite to the concept of difficulty index. Actually, the value of Pi
obtained from the above formula indicates how easy an item is. Because it is
measured by the percentage of number of farmers given correct answer to ith item and
total number of farmers to whom ith item was administered. It might be termed as
easiness index (Ali 2008).
Under the above circumstances the researcher of the present study determined
difficulty (Pi) index by the following revised formula developed by Ali (2008).
ni
Pi = X 100
Ni
Where,
Pi = Difficulty index in percentage of ith item
ni = Number of farmers given incorrect answer to ith item
Ni = Total number of farmers to whom ith item was administered, i.e. 36 in the
present study
All parts of the above two formulae are same, only the meaning of ni is different.
However, in the modified formula developed by Ali (2008), the higher was the
difficulty index of an item, the more difficult the item was. Therefore, the difficulty
indices of all the 36 items were calculated by the formula developed by Ali (2008). It
was ensured that very difficult and very easy items were eliminated. The underlying
assumption in the statistics of item difficulty was that the difficulty was linearly
related to the level of an individual’s post-harvest practices knowledge. When a
respondent gave correct answer to an item, it was assumed, as Coombs (1950)
described, that the item was less difficult than his ability to cope with it. The difficulty
indices have been presented in Appendix-IV.
Calculation of discrimination index: The discrimination index can be computed by
calculating the phi-coefficient as formulated by Perry and Michael (1951). However,
Mehta (1958) developed E1/3 method to find out item discrimination emphasizing that
this method was analogous to, and hence, a convenient substitute for phi-coefficient.
The method developed by Mehta (1958) was used by Singh (1981), Sagar (1983), Ray
and Bora (1991), Choudhury (1998), Islam (2000) and Ali (2008).
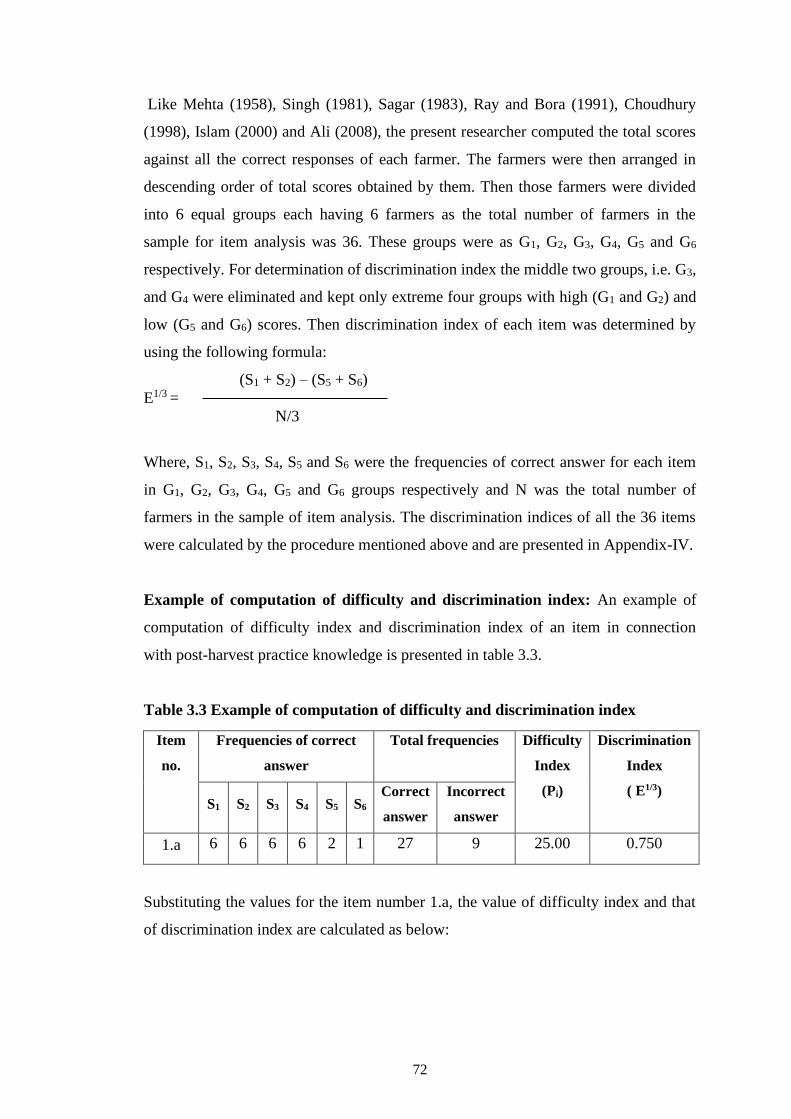
72
Like Mehta (1958), Singh (1981), Sagar (1983), Ray and Bora (1991), Choudhury
(1998), Islam (2000) and Ali (2008), the present researcher computed the total scores
against all the correct responses of each farmer. The farmers were then arranged in
descending order of total scores obtained by them. Then those farmers were divided
into 6 equal groups each having 6 farmers as the total number of farmers in the
sample for item analysis was 36. These groups were as G1, G2, G3, G4, G5 and G6
respectively. For determination of discrimination index the middle two groups, i.e. G3,
and G4 were eliminated and kept only extreme four groups with high (G1 and G2) and
low (G5 and G6) scores. Then discrimination index of each item was determined by
using the following formula:
(S1 + S2) – (S5 + S6)
E1/3 =
N/3
Where, S1, S2, S3, S4, S5 and S6 were the frequencies of correct answer for each item
in G1, G2, G3, G4, G5 and G6 groups respectively and N was the total number of
farmers in the sample of item analysis. The discrimination indices of all the 36 items
were calculated by the procedure mentioned above and are presented in Appendix-IV.
Example of computation of difficulty and discrimination index: An example of
computation of difficulty index and discrimination index of an item in connection
with post-harvest practice knowledge is presented in table 3.3.
Table 3.3 Example of computation of difficulty and discrimination index
Item
no.
Frequencies of correct
answer
Total frequencies Difficulty
Index
(Pi)
Discrimination
Index
( E1/3) S1 S2 S3 S4 S5 S6
Correct
answer
Incorrect
answer
1.a 6 6 6 6 2 1 27 9 25.00 0.750
Substituting the values for the item number 1.a, the value of difficulty index and that
of discrimination index are calculated as below:

73
Difficulty index:
ni
Pi = X 100
Ni
9
= X 100
36
= 25.00
Discrimination index:
(S1 + S2) – (S5 + S6)
E1/3 =
N/3
(6+6) – (2 + 1) =
36/3
12-3 =
8
9 =
12
= 0.750
Final selection of items: Two criteria namely, item difficulty index and item
discrimination index were considered for the selection of items in the final format of
the vegetable post-harvest practices knowledge test.
In the present study items with difficulty index value ranging from 16.67 to 83.33
(Ali, 2008) and discrimination index ranging from 0.125 to 0.875 (Ali, 2008) were
included in the final format of vegetable post-harvest practice knowledge scale. In this
way, 24 items by taking 4 from each of remembering, understanding, applying,
analyzing, evaluating and creating which fulfilled both the criteria and these items
were selected for the final scale of the vegetable post-harvest practice knowledge
(Appendix-IV).
Scoring system: Each item had three (3) alternative responses including one (1) right
answer. The respondents were asked to choose the right answer for each item. One (1)
score was given for right answer and zero (0) for wrong or no answer against each
item. Summation of such scores for all the responses of a farmer was the vegetable

74
post-harvest practice knowledge score of that farmer. Thus, the knowledge score on
selected vegetable post-harvest practice could range from 0 to 24, where ‘0’ indicated
very low level of knowledge and 24 indicated very high level of knowledge. Question
regarding this variable appears in the item no. 17 in the interview schedule
(Appendix-I).
3.7.4.2 Use of selected vegetables post-harvest practices
Vegetables post-harvest practices meant the practices those were used by the farmers
after harvesting of the vegetables. Measurement procedures of this variable have been
done based on the following steps:
Items collection: After searching of relevant literatures primarily 20 items were
selected for measuring the use of selected vegetable post-harvest practices which
might have great impact on effects of selected post-harvest practices to strengthen
vegetable export market. After consultation with Advisory Committee Members, a
total of 15 items were selected due to similarity to send Judges for Judges rating.
Judges’ rating: The selected 15 items were sent to 30 experts (Judges) to rate the
items of the scale of use of selected vegetable post-harvest practices. The Judges were
selected from different related disciplines including agricultural extension, agronomy,
horticulture, plant pathology, entomology, soil science and environmental science of
different agricultural universities, research institutes, extension organizations and non-
government organizations. Letter to Judges from the Chairman of the Advisory
Committee of this research appears on Appendix-II. For determining the
appropriateness and relevancy of the items of “use of selected vegetable post-harvest
practices scale”, the Judges were requested to mention their opinion in 9-point
suitability continuum against each of the practice (1 for least appropriate and 9 for
most appropriate). Out of 30 judges, 25 replied. Therefore, the responses of 25 Judges
were retained for selection of items for the scale of use of selected vegetable post-
harvest practices for the study. Based on the ratings of 25 Judges, Average
Appropriateness Score (AASu) of each of the item was measured with the following
formula:

75
ΣSiu
AASu =
n
Where,
AASu = Average Appropriateness Score of the ith item of use scale
Siu = Appropriateness score given by the Judges for ith item of use scale
n = Number of Judges = 25
After determining the AASu of each of all the items, it was found that the AASu of all
items was more than 4.5 out of 09 i.e. more than half of the highest possible AASu of
9. Based on this criteria all the 15 items were selected for the final scale of use of
selected vegetable post-harvest practices. Average Appropriateness Score (AASu) was
shown in Appendix-V.
Scoring System: Use of selected vegetables post-harvest practices of respondent was
measured by asking 15 selected items related to post harvest practices. A four point
scale was used and the respondents were asked to choose one response among four
alternative responses as regularly, occasionally, rarely and not at all use. Scores were
assigned to the responses as 3. 2. 1 and 0 respectively.
The use of selected vegetable post-harvest practices was therefore, determined by
adding the total scores against all the 15 selected vegetable post-harvest practices.
Thus, the score of use of selected vegetable post-harvest practice scale could range
from 0 to 45, where ‘0’ indicated no use and 30 indicated highest use. Question
regarding this variable appears in the item no. 18 in the interview schedule
(Appendix-I).
Measurement of Use Index (UI): To compare the use of different post-harvest
practices items, Use Index (UI) was computed. The UI for each item was calculated
by using the following formula:
UI = Urex3 + Uocx2 + Urax1 + Unx0
Where,
UI = Use Indes of ith item

76
Ure = Number of respondents use post-harvest practices regularly
Uoc = Number of respondents use post-harvest practices occasionally
Ura = Number of respondents use post-harvest practices rarely
Un = Number of respondents not all use post-harvest practices
Thus, UI of any use of post-harvest practice item could range from 0 to 750 where 0
indicated no use of post-harvest practices and 750 indicated highest use of post-
harvest practices. This process was followed for each item of this variable and it was
done in order to make comparison among the use of post-harvest practice items by the
farmers in vegetable value chain. Rank order was made based on the descending order
of the UI of the items to compare the extent of use of post-harvest practices.
3.7.4.3 Problems faced in vegetable value chain
For measuring problems faced in vegetable value chain, items containing social,
technical, environmental, marketing and psychological problems were selected after
thorough consultation with the Advisory Committee Members, extension experts,
researchers and from other available sources. Measurement procedure of this variable
have been done based on the following steps:
Collection of items: The content of problem faced is composed of questions called
items. Items for the test were collected from different sources, such as, literatures;
agricultural scientists of agronomy, horticulture, soil science, agricultural chemistry,
entomology, plant pathology, agribusiness management, agri-economics, agro-
forestry, environmental science, and agricultural extension education of home and
abroad; extension personnel; NGO personnel; Bangladesh Fruits Vegetables & Allied
Products Exporter’s Association (BFVAPEA), Hortex Foundation, vegetables
exporters, vegetable value chain actors, progressive farmers and researcher’s own
experience. The items were designed to find out problem faced by the farmers during
the time from vegetable production to exporting i.e. the entire value chain. The items
were collected and prepared in relation to post-harvest practices of vegetables to
strengthen vegetable export market. Forty Four (44) items were collected initially
which appeared to be relevant.

77
Judges’ rating: The selected 44 items were sent to 30 experts (Judges) to rate the
items for the scale of problem faced by the farmers in vegetable value chain. The
Judges were selected from different related disciplines including agricultural
extension, agronomy, horticulture, plant pathology, entomology, soil science and
environmental science of different agricultural universities, research institutes,
extension organizations and non-government organizations. Letter to Judges from the
Chairman of the Advisory Committee of this research appears on Appendix-II. For
determining the appropriateness and relevancy of the items of “problem faced in
vegetable value chain scale”, the Judges were requested to mention their opinion in 9-
point suitability continuum against each of the practices (1 for least appropriate and 9
for most appropriate). Out of 30 judges, 25 replied. Therefore, the responses of 25
Judges were retained for selection of items of the scale of problem faced by the
farmers in vegetable value chain. Based on the ratings of 25 Judges, Average
Appropriateness Score (AASp) of each of the item of problem scale was measured
with the following formula:
ΣSip
AASp =
n
Where,
AASp = Average Appropriateness Score of ith item of problem scale
Sip = Appropriateness Score given by the Judges of against ith item
n = Number of Judges = 25
After determining the AASp of each of all the items, it was found that the AASp of
some items were less than 4.50 out of 09 i.e. less than half of the possible AASp of 9. .
AASp less than 5 were eliminated and 26 item was finally selected from 44 items.
Average Appropriateness Score (AASp) was shown in Appendix-VI.
Scoring System: Twenty six (26) items of problems were selected and arranged in
the scale in order to have real feelings on problems faced in vegetable value chain. It
was measured on the basis of opinion of the farmers regarding the problem faced by
them during entire value chain. The nature of responses of the respondents to the
items was ‘severe problem, moderate problem, less problem and no problem and the
78
scores were assigned as 3, 2, 1, 0 respectively. Problems faced in vegetables value
chain score of a respondent was determined by adding up all the scores for all the
responses of the items of that respondent. The possible range of score of problems
faced was 0-78, while 0 indicating no problem and 78 indicating highest problems
faced in post-harvest practices. Question regarding this variable appears in the item
no. 19 in the interview schedule (Appendix-I).
Comparing severity of problems among the items: For comparing severity of
problems among the items of each item was measured by using the following
formula:
PFI = Psx3 + Pmx2 + Plx1 + Pnx0
Where,
PFI = Problem Faced Index of ith item
Ps = Number of respondents faced severe problem
Pm = Number of respondents faced moderate problem
Pl = Number of respondents faced less problem
Pn = Number of respondents faced no problem
Thus, PFI of any problem item could range from 0 to 750 where 0 indicated no
problem and 750 indicated highest problem. This process was followed for each item
of this variable and it was done in order to make comparison among problem items
faced by the farmers in vegetable value chain. Rank order was made based on the
descending order of the PFI of the items to compare the severity of the problems.
3.8 Measurement of dependent variable
Effects of using selected post-harvest practices to strengthen vegetable export market
was the dependent variable of the study. Vegetable post-harvest practices meant the
practices those were used by the farmers after harvesting the vegetables. Measurement
procedures of this variable have been done based on the following steps:
Items collection: After searching of relevant literatures initially 28 items were
selected for measuring effects of post-harvest practices to strengthen vegetable export

79
market. After consultation with Advisory Committee Members, a total of 19 items
were selected for Judges’ rating due to similarity in the items.
Judges’ rating: The selected 19 items were sent to 30 experts (Judges) to rate the
items for the scale of effects of using selected post-harvest practices to strengthen
vegetable export market. The Judges were selected from different related disciplines
including agricultural extension, agronomy, horticulture, plant pathology,
entomology, soil science and environmental science of different agricultural
universities, research institutes, extension organizations and non-government
organizations. Letter to Judges from the Chairman of the Advisory Committee of this
research appears on Appendix-II. For determining the appropriateness and relevancy
of the items of “effects of using selected post-harvest practices to strengthen vegetable
export market scale”, the Judges were requested to mention their opinion in 9-point
suitability continuum against each of the items (1 for least appropriate and 9 for most
appropriate). Out of 30 judges, 25 replied. Therefore, the responses of 25 Judges were
retained for selection of items for the scale of effects of using selected post-harvest
practices to strengthen vegetable export market for the study. Based on the ratings of
25 Judges, Average Appropriateness Score (AASe) of each of the item of effects scale
was measured with the following formula:
ΣSie
AASe=
n
Where,
AASe = Average Appropriateness Score of the ith item of effects scale
Sie = Appropriateness Score given by the Judges for ith item of effects scale
n = Number of Judges = 25
After determining the AASe of each of the items, it was found that the AASe of all
items except one (1) item was more than 4.50 out of 09 i.e. the more than half of the
highest possible AASe of 9. AASe less than 4.5 were eliminated and 18 items were
finally selected from 19 items. Average Appropriateness Score (AASe) was shown in
Appendix-VII.

80
Scoring System: It was measured on the basis of perception of the farmers regarding
the effects of using selected post-harvest practices to strengthen vegetable export
market. After finalization of items, the farmers were asked to give their opinion on the
extent of effects of using selected vegetable post-harvest practices against each
finalized effects item. The extent of effects of using selected vegetable post-harvest
practices were measured by using a four (4) point rating scale with four alternative
responses of the farmer such as highly effective, moderately effective, less effective
and not at all effective. Four (4) point rating scale was also used by Khan et al.
(2017), Khatun (2007), Okunade, (2007), Roy (2006) and Majydyan (1996) to
measure effectiveness. Scores were assigned to these alternative responses as 3 for
‘highly effective’, 2 for ‘moderately effective’, 1 for ‘less effective’ and ‘0’ for ‘not at
all effective’. By adding the scores against all the 18 selected items of a farmers
together, the effectiveness score of him/her was obtained. Thus, the score of
effectiveness of using selected vegetables post-harvest practices could range from 0-
54, where 0 indicates not at all effective and 54 indicates highly effective of using
post-harvest practices to strengthen vegetable export market. Items and question
regarding this variable appears in the item no. 20 in the interview schedule
(Appendix-I).
Measurement of Effects Index (EI): To compare the effects of different items,
Effects Index (EI) was computed. The EI for each item was calculated by using the
following formula:
EI = 3xfhe + 2xfme + 1xfle + 0xfn
Where,
EI = Effects Index (EI) of the ith item
fhe = No. of farmers perceived highly effective
fme = No. of farmers perceived moderately effective
fle = No. of farmers perceived less effective
fn = No. of farmers perceived not at all effective.
Thus, the value of EI of the items could range from 0 to 750, where 0 indicates no
effect and 750 indicates high effect. This process was followed for each item of this
variable and it was done in order to make comparison among the effects items. Rank

81
order was made based on the descending order of the EI of the items to compare the
extent of effects of using vegetable post-harvest practices.
3.9 Validity and reliability of scale
To give due attention to the validity and reliability of the scale used for collecting data
is one of the important tasks of research work. A scale possesses validity when it
actually measures what it claims to measure. A scale is reliable when it can
consistently produces the same results repeatedly when applied to the same sample
(Goode and Hatt, 1952). Enough care was taken to prepare the interview schedule in
general and the scales in particular for this study. The validity of contents of the scales
was judged by obtaining opinions from the experts of the concerned discipline. Based
on the comments and suggestions of the experts, the scales were modified to make it
an acceptable form.
For validity and reliability of the scales, pre-test was done before giving final shape to
the interview schedule. After preparation of draft data collection instrument, pretest
was conducted on 36 farmers from the population but excluded from the sample.
Twelve (12) farmers from three vegetables (by taking 4 from each vegetable) from
one upazila were selected for pre-test by random selection. Thus, 36 farmers were
selected from three upazilas for pre-test. Necessary corrections, additions, alternations
and rearrangements were made in the schedule on the basis of feedback from the pre-
test procedure. After correction, the interview schedule was finalized for the data
collection. However, validity and reliability of the scales used for measuring the
knowledge on selected vegetables post-harvest practices, use of selected vegetables
post-harvest practices, problems faced in vegetables value chain and effects of using
selected vegetables post-harvest practices were examined. Validity and reliability of
these scales were tested both from pre-test data and a portion of final data. However,
validity and reliability of these important scales have been described below:
3.9.1 Validity of knowledge on selected vegetables post-harvest practices scale
In the final selection of items for knowledge on selected vegetables post-harvest
practice scale, care was taken to include items covering the entire universe of relevant
behavioural aspects of the farmers with respect to knowledge on selected vegetables
post-harvest practices. Fifty four (54) items were collected through various sources

82
including related publications and specialists of different related disciplines of home
and abroad. Thirty six (36) items were selected out of these 54 items for Judges’
rating. All of the 36 items were found appropriate after Judges’ rating. Thirty six (36)
items were then pre-tested by administering to 36 farmers of the research population,
but with the exclusion of the sample as Ali (2008). On the basis of difficulty index
and discrimination index, 24 out of 36 items were selected for the final scale.
Aforesaid discussion indicates that the content validity was built in the process of
constructing the scale. Hence, it was assumed that the scores obtained by
administering this test measured vegetables post-harvest knowledge of the
respondents as intended.
Again, validity of knowledge on selected vegetables post-harvest scale was measured
by the relationships between the scores of individual items of vegetables post-harvest
knowledge and the composite vegetables post-harvest knowledge score of 45 (part of
final data) farmers by taking 15 (5 from each vegetable) from each of 3 upazilas of the
study area. The coefficient of correlations between the scores of each of 24 items of
vegetables post-harvest knowledge and the score of composite vegetables post-harvest
knowledge were found to be 0.718**, 0.638**, 0.346*, 0.776**, 0.373*, 0.400**,
0.523**, 0.511**, 0.776**, 0.403**, 0.477**, 0.323*, 0.519**, 0.307*, 0.463**, 0.624**,
0.310*, 0.478**, 0.477**, 0.423**, 0.461**, 0.701**, 0.477** and 0.295* which were
significant at 0.000 to 0.05 level with 43 degrees of freedom. On the basis of the
procedure followed, it can be assumed that the knowledge on selected vegetables
post-harvest practices scale had content validity. Therefore, the scale may be taken as
valid instrument to measure the knowledge on selected vegetable post-harvest
practices of the farmer.
3.9.2 Reliability of knowledge on selected vegetable post-harvest practices scale
The reliability of knowledge on selected vegetable post-harvest practices scale was
measured by split-half method. For this process, final data on knowledge score of 45
farmers by taking 15 (5 from each vegetable) from each of 3 upazilas of the study area
were considered. All the 24 items of the knowledge on selected vegetable post-harvest
practices scale were divided into 2 equal halves. These two sets of items, each having
12 items, one with odd numbered and the other with even numbered items were the
major two components of the scale as used by Ali (2008). The coefficient of

83
correlation between the two sets of score was computed and the value (0.847***) was
found to be strongly significant at 0.000 level with 43 degrees of freedom. The
reliability co-efficient, thus obtained indicated that the ‘internal consistency’ of the
knowledge on selected vegetables post-harvest practices scale developed for the
present study was quite high.
3.9.3 Validity of use of selected vegetables post-harvest practices scale
In collection and selection of items for use of selected vegetables post-harvest
practices scale of this study, care was taken to include the items representing the
universe of content of vegetables post-harvest practices. The content of the use of
selected vegetables post-harvest practices scale was selected based on relevant
literatures and opinions of experts and extension personnel as measures of checks.
Fifteen (15) items were selected with consultation with Advisory Committee
Members from initially collected twenty (20) items. On the basis of Judges’ rating, all
the fifteen (15) items were selected for the final scale. Fifteen (15) items were then
pre-tested by administering to 36 farmers of the research population, but with the
exclusion of the sample. After pre-test all of the fifteen (15) items were selected for
the final scale. Aforesaid discussion indicates that the content validity was built in the
process of constructing the scale. Hence, it was assumed that the scores obtained by
administering this test measured use of selected vegetables post-harvest practices of
the farmer as intended.
Again, validity of use of selected vegetables post-harvest practices scale was
measured by the relationships between the scores of individual items of use of
selected vegetables post-harvest practices and the composite use of selected
vegetables post-harvest practices scale score of 45 farmers (part of final data) by
taking 15 (5 from each vegetable) from each of 3 upazilas of the study area. The
coefficients of correlation between the scores of individual items and the composite
use of selected vegetables post-harvest practices score were found to be 0.755**,
0.399**, 0.374*, 0.480**, 0.376*, 0.313*, 0.600**, 0.611**, 0.638**, 0.318*, 0.688**,
0.652**, 0.390**, 0.633** and 0.301* which were significant at 0.000 to 0.05 level with
43 degrees of freedom. On the basis of the procedure followed, it could be said that
the use of selected vegetables post-harvest practices scale had content validity.

84
3.9.4 Reliability of use of selected vegetables post-harvest practices scale
The reliability of use of selected vegetables post-harvest practices scale was measured
by split-half method. On the basis of final data of 45 farmers by taking 15 ( 5 from
each vegetable) from each of 3 upazilas, all the 15 items of selected vegetables post-
harvest practices scale were divided into 2 equal halves. The scale had two sets of
scores, one with eight (8) odd numbered items and the other with seven (7) even
numbered items. The coefficient of correlation between the two sets of scores was
computed and the value (0.542***) was found to be significant at 0.000 level with the
43 degree of freedom. The reliability co-efficient, thus obtained indicated that the
‘internal consistency’ of use of selected vegetables post-harvest practices scale
developed for the present study was high.
3.9.5 Validity of problems faced in vegetable value chain scale
In the final selection of items for problems faced in vegetable value chain scale, care
was taken to include items covering the entire universe of relevant behavioural
aspects of the farmers with respect to problems faced in vegetable value chain. Items
were collected through various sources including related publications and specialists
of different related disciplines of home and abroad. On the basis of Judges’ rating, 26
out of 44 items were selected for the pre-test. Twenty six (26) items were then pre-
tested by administering to 36 farmers of the research population, but with the
exclusion of the sample. After pre-test all of the twenty six (26) items were selected
for the final scale. Aforesaid discussion indicates that the content validity was built in
the process of constructing the scale. Hence, it was assumed that the scores obtained
by administering this test measured problems faced in vegetable value chain as
intended.
Again, validity of problems faced in vegetable value chain scale was measured by the
relationships between the scores of individual items of problems faced in vegetable
value chain and the composite sore of problems faced in vegetable value chain of 45
farmers (part of final data) by taking 15 (5 from each vegetable) from each of 3
upazilas of the study area. The coefficient of correlations between the scores of 26
individual items of problems faced by the farmer in vegetables value chain and the
score of composite problems faced by the farmer in vegetables value chain were
found to be 0.634**, 0.417**, 0.364*, 0.386**, 0.431**, 0.334*, 0.666**, 0.545**,

85
0.401**, 0.494**, 0.424**, 0.600**, 0.678**, 0.478**, 0.737**, 0.712**, 0.527**, 0.480**,
0.438**, 0.697**, 0.581**, 0.306*, 0.295*, 0.622**, 0.626** and 0.405** which were
significant at 0.000 to 0.05 level with 43 degrees of freedom. On the basis of the
procedure followed, it can be assumed that the problems faced by the farmers in
vegetables value chain scale had content validity. Therefore, the scale may be taken as
valid instrument to measure the problems faced in vegetable value chain.
3.9.6 Reliability of problems faced in vegetable value chain scale
The reliability of problems faced in vegetable value chain scale was measured by
split-half method. The scale was administered to 45 farmers (part of final data) by
taking 15 (5 from each vegetable) from each of 3 upazilas of the study area. All the 26
items of the problems faced in vegetables value chain scale were divided into 2 equal
halves. These two sets of items, each having 13 items, one with odd numbered and the
other with even numbered items, were the major two components of the scale as used
by Ali (2008) .The coefficient of correlation between the two sets of scores was
computed and the value (0.797***) was found to be strongly significant at 0.000 level
with 43 degrees of freedom. The reliability co-efficient, thus obtained indicated that
the ‘internal consistency’ of the problems faced in vegetables value chain scale
developed for the present study was quite high.
3.9.7 Validity of effects of using selected vegetable post-harvest practice scale
In the final selection of items for effects of using selected vegetable post-harvest
practice scale, care was taken to include items covering the entire universe of relevant
behavioural aspects of the farmers with respect to effects of using selected vegetable
post-harvest practices. Items were collected through various sources including related
publications and specialists of different related disciplines of home and abroad.
Nineteen (19) items were selected with consultation with Advisory Committee
Members for Judges’ rating. On the basis of Judges’ rating, 18 out of 19 items were
selected for the pre-test. Eighteen (18) items were then pre-tested by administering to
36 farmers of the research population, but with the exclusion of the sample as Ali
(2008). After pre-test all of the eighteen (18) items were selected for the final scale.
Aforesaid discussion indicates that the content validity was built in the process of
constructing the scale. Hence, it was assumed that the scores obtained by

86
administering this test measured effects of using selected vegetable post-harvest
practices of the farmers as intended.
Again, validity of effects of using selected vegetable post-harvest practice scale was
measured by the relationships between the scores of individual items of effects of
using selected vegetable post-harvest practice and the composite effects of using
selected vegetable post-harvest practice score of 45 (part of final data) farmers by
taking 15 (5 from each vegetable) from each of 3 upazilas of the study area. The
coefficient of correlation between the scores of 18 individual items of effects of using
selected vegetable post-harvest practice and the score of composite effects of using
selected vegetables post-harvest practice were found to be 0.694**, 0.388**, 0.298*,
0.489**, 0.331*, 0.332*, 0.628**, 0.592**, 0.642**, 0.327*, 0.644**, 0.656**, 0.472**,
0.608**, 0.384**, 0.389**, 0.394** and 0.664** which were significant at 0.000 to 0.05
level with 43 degrees of freedom. On the basis of the procedure followed, it can be
assumed that the effects of using selected vegetable post-harvest practice scale had
content validity. Therefore, the scale may be taken as valid instrument to measure the
effects of using selected vegetable post-harvest practice of the farmers.
3.9.8 Reliability of effects of using selected vegetable post-harvest practice scale
The reliability of effects of using selected vegetables post-harvest practices scale was
measured by split-half method. Final data of 45 farmers (part of final data) by taking
15 (5 from each vegetable) from each of 3 upazilas of the study area were considered
for this procedure. All the 18 items of the effects of using selected vegetable post-
harvest practice were divided into 2 equal halves. These two sets of items, each
having 9 items, one with nine (9) odd numbered and the other with nine (9) even
numbered items were the major two components of the scale as used Ali (2008). The
coefficient of correlation between the two sets of scores was computed and the value
(0.693***) was found to be strongly significant at 0.000 level with 43 degrees of
freedom. The reliability co-efficient, thus obtained indicated that the ‘internal
consistency’ of the effects of using selected vegetable post-harvest practices scale
developed for the present study was quite high.

87
3.10 Statement of hypothesis
As defined by Goode and Hatt (1952) “A hypothesis is a proposition which can be put
to a test to determine its validity. It may seem contrary to, or in accord with common
sense. It may prove to be correct or incorrect. In any event, however, it leads to an
empirical test”. According to Kerlinger (1973), a hypothesis is a conjectural statement
of the relation between 2 or more variables. Hypothesis are always in declarative
sentence form and they relate either generally of specifically variables to sentence
form and they relate either generally or specifically variables to variables. Hypothesis
may be broadly divided into two categories, namely, research hypothesis and null
hypothesis.
3.10.1 Research hypothesis
In the light of the objectives of the study and variables selected, the following
research hypotheses were formulated to test them in. The research hypotheses was
stated in positive form, the hypotheses was as follows:
“Each of the nineteen (19) selected characteristics of the respondents have significant
contribution/effect on/to the effects of using of selected post-harvest practices to
strengthen vegetable export market as perceived by them”.
3.10.2 Null hypothesis
The aforesaid research hypothesis was converted into null hypothesis for testing the
conceptual model of the study. The major null hypothesis formulated for testing the
conceptual model of the study is presented below:
“There is no significant contribution/effect of the selected nineteen (19)
characteristics of the farmers to/on the effects of using selected post-harvest practices
to strengthen vegetable export market as perceived by them”.
3.11 Data Processing
3.11.1 Editing
The collected raw data were examined thoroughly to detect errors and omissions. As a
matter of fact the researcher made a careful scrutiny of the completed interview
schedule to make sure that necessary data were entered as complete as possible and
88
well arranged to facilitate coding and tabulation. Very minor mistakes were detected
by doing this, which were corrected promptly.
3.11.2 Coding and tabulation
Having consulted with the research Advisory Committee Members, the researcher
prepared a detailed coding plan. In case of qualitative data, suitable scoring
techniques were followed by putting proper weightage against each of the traits to
transform the data into quantitative forms. These were then tabulated in accordance
with the objective of the study
3.11.3 Categorization of data
Following coding operation, the collected raw data as well as the respondents were
classified into various categories to facilitate the description of the independent and
dependent variables. These categories were developed for each of the variables by
considering the nature of distribution of the data and extensive literature review. The
procedures for categorization have been discussed while describing the variables in
Chapter 4.
3.12 Statistical analysis
IBM SPSS Statistics 24 was used for data analysis. Descriptive statistical measures
including number & percentage distribution, range, rank order, mean, standard
deviation and co-efficient of variance were used for describing both the independent
and dependent variables. Rank order was made whenever necessary. Tables were also
used in presenting data for clarity of understanding.
Initially, Pearson Product Moment correlation was run to determine the relationship of
the selected characteristics of the vegetable farmers with the effects of using selected
post-harvest practices to strengthen vegetable export market. Full model regression
analysis was also done. Due to misleading results from multi-collinearity, stepwise
multiple regression was used to find out the contribution of the independent variables
to the dependent variable. Finally, path analysis was done to find out the direct and
indirect effects of the independent variables separately on the dependent variable.
Five percent (0.05) level of probability was used as the basis for rejection of any null
hypothesis throughout the study. Co-efficient values significant at 0.05 level is

89
indicated by one asterisk (*), and that at 0.01 level by two asterisks (**) and at 0.001
level or above by three asterisks (***). For determining comparative effects of items,
comparative use of post-harvest practices items and severity of the problems, rank
order were made based on the descending order of the Effects Index (EI), Use Index
(UI) and Problems Faced Index (PFI) respectively.

90
CHAPTER 4
CHARACTERISTICS PROFILE OF THE FARMERS
Certain attributes or characteristics form an integral part in the development of human
behaviour. These include the individual’s personal, economical, social and
professional characteristics. It can be postulated that these characteristics influence
decision making relating to an actual behaviour in the individual's life.
Conceptualization and measurement of these characteristics help in understanding and
predicting the human behaviour within certain limits of probability. Difference in
farmers’ characteristics might therefore have considerable influence on farmers’
behavioral change that occurs to farmers using selected vegetables post-harvest
practices. It may also be assumed that these characteristics play significant roles in the
perception of an individual.
The purpose of this Chapter is to describe the 19 selected characteristics of the sample
farmers as was indicated in the objectives of the study as independent variables. These
characteristics of the farmers are described in the following four (4) sections of this
chapter. Procedure followed in measuring the characteristics have been described in
Chapter 3. For describing the characteristics of the farmers, they were classified into
suitable categories according to each of the characteristics. Category wise number and
percentage distribution have been used to describe the characteristics.
4.1 Personal characteristics
A person may possess many personal characteristics. Five personal characteristics of
the respondent farmers namely age, education, family agricultural labour, experience
in vegetables cultivation and experience in exportable vegetables production were
selected for the present study. Salient features including measuring unit, possible and
observed range, Mean, Standard Deviation (SD) and Co-efficient of variance (CV) of
the five (5) selected personal characteristics of the farmers have been presented in
Table 4.1. Five (5) selected personal characteristics have been discussed below in the
sub-sections:

91
Table 4.1 Salient features including measuring unit, possible and observed range,
Mean, Standard Deviation (SD) and Co-efficient of variance (CV) of
the five (5) selected personal characteristics of the farmers
Characteristics
Measuring
unit
Possible
range
Observed
range Mean SD CV%
1. Age Actual
years Unknown 22 - 62 40.91 7.69 18.80
2. Education Schooling
years Unknown 0.50 - 16 7.88 3.89 49.37
3. Family agricultural
labour
Number of
family
members
Unknown 2-8 4.33
1.13
26.10
4. Experience in
vegetables
cultivation
Experience
in year Unknown 1 - 22 11.22 3.35 29.86
5. Experience in
exportable
vegetables
production
Experience
in year Unknown 1 - 12 6.94 2.45 35.30
4.1.1 Age
The observed age of the farmers ranged from 22 to 62 years, the mean being 40.91
with a standard deviation of 7.69 and co-efficient of variation of 18.80% (Table 4.1).
The respondents were classified into following three categories based on their age:
Categories Basis of categorization (Years)
Young aged up to 35
Middle aged >35-50
Old aged >50
Distribution of the farmers according to their age is shown in Table 4.2.
Table 4.2 Distribution of the farmers according to their age
Categories Farmers
Number Percent
Young aged
63 25.20
Middle aged
162 64.80
Old aged
25 10
Total 250 100

92
Data contained in the Table 4.2 indicated the about two-third (64.80%) of the farmers
were middle aged compared to 25.20 percent being young and 10 percent old. Co-
efficient of Variation (18.80%) of age of the respondents indicated that the sample
farmers were homogenous based on their age. Findings again revealed that
overwhelming majority (90 percent) of the farmers were young or middle aged. It was
very logical that BFVAPEA selected young and middle aged farmers as exportable
vegetable producers to strengthen vegetable export market through use of selected
vegetables post-harvest practices. The general notion found from the introduction of
most new technologies both within agriculture and outside of it is that older
generations are the last to adopt them, while the younger generations typically
embrace them more quickly (Dhraief, 2018). However, age of the respondent farmers
was not significantly related (r = 0.123NS at 0.05 level of probability) with their effects
of using selected post-harvest practices to strengthen vegetable export market. The
findings imply that the age of the farmers were not an important factor for exerting
the effects of using selected post-harvest practices to strengthen vegetable export
market.
4.1.2 Education
Schooling years of the farmers ranged from 0.50 to 16.0, the mean being 7.88 with the
standard deviation of 3.89 and co-efficient of variation of 49.37% (Table 4.1). The
sample farmers were classified into following five (5) categories based on their level
of education:
Categories Basis of categorization
(Schooling years)
Can sign only 0.5
Primary education 1 to 5
Secondary education 6 to 10
Higher secondary education 11 to 12
Tertiary education above 12
Distribution of the farmers according to their education is shown in Table 4.3.

93
Table 4.3 Distribution of the farmers according to their education
Categories Farmers
Number Percent
Can sign only 7 2.80
Primary education 83 33.20
Secondary education 93 37.20
Higher secondary education 51 20.40
Tertiary education 16 6.40
Total 250 100
Data presented in Table 4.3 indicated that the highest proportion (37.20%) of the
farmers had secondary level of education, followed by 33.20 percent primary level,
20.40 percent higher secondary level of education, 6.40 percent graduate level of
education and rest 2.80 percent respondents could sign his/her name only. These
finding indicated that about cent percent (97.20%) of the respondents were literate
with primary to tertiary level of education and it was higher level of education than
the national average literacy rate of 72.8% (BBS, 2018a). The reason was that the
sample farmers were selected for post-harvest practices for exportable vegetables on
the basis of relatively educated (above primary level) persons, so as to understand the
relatively complex training where some sort of writing, presenting skill were required.
Co-efficient of Variation of education of the sample farmers (49.37%) indicated that
the sample farmers were homogenous based on their education. However, education
of the sample farmers was not significantly related (r = 0. 005NS at 0.05 level of
probability) with their perceived effects of using selected post-harvest practices to
strengthen vegetable export market. The findings imply that the education of the
farmers were not an important factor for the effects of using selected post-harvest
practices to strengthen vegetable export market.
4.1.3 Family agricultural labour
The observed range of family agricultural labour of the sample farmers ranged from 2
to 8, the mean being 4.33 with the standard deviation of 1.13 and co-efficient of
variation of 49.326.10% (Table 4.1). The sample farmers were classified into
following three categories based on the family member engaged in farm activities:

94
Categories Basis of categorization
(Number of family members)
Small family agricultural labour < Mean - 1SD i.e. < 3.2
Medium family agricultural labour Mean ± 1SD i.e. 3.2 - 5.46
Large family agricultural labour Mean + 1 SD i.e. > 5.46
Distribution of the farmers according to their family agricultural labour is shown in
Table 4.4.
Table 4.4 Distribution of the sample farmers according to family agricultural
labour
Categories Farmers
Number Percent
Small family agricultural labour 49 19.60
Medium family agricultural labour 169 67.60
Large family agricultural labour 32 12.80
Total 250 100
Data presented in Table 4.4 indicated that the two-third (67.60%) had medium
number of family members engaged in agriculture farming, followed by 19.60 percent
having small number of family members and 12.80 percent had large number of
family members engaged in agriculture farming. Findings again revealed that
overwhelming majority (88.20%) of the farmers had small to medium family
members those are engaged in agricultural farming specially in vegetable post-harvest
activities.
Co-efficient of Variation (26.10%) of family agricultural labour of the farmers
indicated that the sample farmers were homogenous based on their number of family
members engaged in agricultural firm activities. However, family agricultural labour
of the sample farmers was not significantly related (r = 0. 073NS at 0.05 level of
probability) with their effects of using selected post-harvest practices to strengthen
vegetable export market. The findings imply that the family agricultural labour of the

95
farmers were not an important factor for the effects of using selected post-harvest
practices to strengthen vegetable export market.
4.1.4 Experience in vegetables cultivation
The observed range of experience in vegetables cultivation score of the farmers was 1
to 22, the mean being 11.22 with the standard deviation of 3.35 and co-efficient of
variation of 29.86% (Table 4.1). The sample farmers were classified into following
three categories based on the experience in vegetables cultivation:
Categories Basis of categorization
(Experience in years)
Short farming experience (< Mean - 1SD i.e. < 7.87)
Medium farming experience (Mean ± 1SD i.e. 7.87 - 14.57)
Long farming experience (> Mean + 1 SD i.e. > 14.57)
Distribution of the farmers according to their experience in vegetables cultivation is
shown in Table 4.5.
Table 4.5 Distribution of the farmers according to experience in vegetables
cultivation
Categories Farmers
Number Percent
Short farming experience
18 7.20
Medium farming experience
193 77.20
Long farming experience
39 15.60
Total 250 100
Data presented in Table 4.5 indicated that the majority (77.20%) of the farmers had
medium farming experience in vegetables cultivation, followed by 15.60 percent
having long farming experience in vegetables cultivation and 7.20 percent had short
farming experience in vegetables cultivation. Findings again revealed that
overwhelming majority (84.40%) of the farmers had short to medium farming
experience in vegetables cultivation.

96
Co-efficient of Variation (29.86%) of experience in vegetables cultivation of the
farmers indicated that the sample farmers were homogenous based on their experience
in vegetables cultivation. However, experience in vegetables cultivation of the sample
farmers was not significantly related (r = 0. 044NS at 0.05 level of probability) with
their perceived effects of using selected post-harvest practices to strengthen vegetable
export market. The findings imply that the experience in vegetables cultivation of the
farmers were not an important factor for the effects of using selected post-harvest
practices to strengthen vegetable export market.
4.1.5 Experience in exportable vegetables cultivation
The observed score of experience in exportable vegetables cultivation of the farmers
ranged from 1 to 12, the mean being 6.94 with the standard deviation of 2.45 and co-
efficient of variation of 35.30% (Table 4.1). The sample farmers were classified into
following three categories based on their experience in exportable vegetables
cultivation:
Categories Basis of categorization
(Experience in years)
Short experience in exportable vegetable cultivation < Mean - 1SD i.e. < 4.49
Medium experience in exportable vegetable cultivation Mean±1SD i.e.4.49 - 9.39
Long experience in exportable vegetable cultivation > Mean + 1 SD i.e. > 9.39
Distribution of the farmers according to their experience in exportable vegetables
cultivation is shown in Table 4.6.
Table 4.6 Distribution of the farmers according to experience in exportable
vegetables cultivation
Categories Farmers
Number Percent
Short experience in exportable vegetable cultivation 41 16.40
Medium experience in exportable vegetable cultivation 170 68.00
Long experience in exportable vegetable cultivation 39 15.60
Total 250 100

97
Data presented in Table 4.6 indicated that two-third proportion (68.00%) had medium
experience in exportable vegetables cultivation, followed by 16.40 percent having
short experience in exportable vegetables cultivation and 15.60 percent had long
experience in exportable vegetables cultivation. Findings again revealed that
overwhelming majority (83.60%) of the farmers had medium to high experience in
exportable vegetables cultivation.
Co-efficient of Variation (35.30%) of experience in exportable vegetables cultivation
of the farmers indicated that the sample farmers were homogenous based on their
experience in exportable vegetables cultivation. However, experience in exportable
vegetables cultivation of the sample farmers was positively associated (r = 0.255**,
significant at 0.000 level) with their perceived effects of using selected post-harvest
practices to strengthen vegetable export market. Generally, experience helps to cope
up any problematic situation. Therefore, the higher experience might be increased the
risk bearing ability of the farmers in vegetable cultivation as well as increase their
knowledge on postharvest practices (Azad, 2013).
4.2 Economical characteristics
An individual farmer may have many economical characteristics. Five (5) economical
characteristics of the farmers namely exportable vegetables cultivation area,
exportable vegetables production, annual family income, exportable vegetables
production and post-harvest practices cost, credit received for exportable vegetables
production were selected for the present study. Salient features including measuring
unit, possible and observed range, Mean, Standard Deviation (SD) and Co-efficient of
variance (CV) of the five (5) selected economical characteristics of the farmers have
been presented in Table 4.7. Categories, number and percent distribution of these five
(5) selected economical characteristics have been discussed below in sub-sections:

98
Table 4.7 Salient features including measuring unit, possible and observed range,
Mean, Standard Deviation (SD) and Co-efficient of variance (CV) of
the five (5) selected economical characteristics of the farmers
Characteristics
Measuring
unit
Possible
range
Observed
range Mean
SD
CV%
1. Exportable
vegetables
cultivation area
Hectare Unknown .08-0.45 0.17 0.07 41.18
2. Exportable
vegetables
production
Kg Unknown 1700 -
9400 3468.40 1353.24 39.02
3. Annual family
income ‘000’ BDT Unknown 80-350 166.43 50.21 30.17
4. Exportable
vegetables
production
and post-
harvest
practices cost
‘000’ BDT Unknown 23-111 45.58 17.27 37.89
5. Credit
received
for exportable
vegetables
production
‘000’ BDT Unknown 11-60 23.68 10.51 44.38
4.2.1 Exportable vegetables cultivation area
The observed range of exportable vegetables cultivation area of the farmers was 0.08
to 0.45 hectares, the mean being 0.17 with the standard deviation of .07 and co-
efficient of variation of 41.18% (Table 4.7). The sample farmers were classified into
following three categories based on their exportable vegetables cultivation area:
Categories Basis of categorization
(Hectare)
Small area < Mean - 1SD i.e. < 0.10
Medium area Mean ± 1SD i.e. 0.10 - 0.24
Large area > Mean + 1 SD i.e. > 0.24
Distribution of the farmers according to their exportable vegetables cultivation area is
shown in Table 4.8.

99
Table 4.8 Distribution of the farmers according to exportable vegetables
cultivation area
Categories Farmers
Number Percent
Small area 9 3.60
Medium area 205 82.00
Large area 36 14.40
Total 250 100
Data presented in Table 4.8 indicated that the highest proportion (82.00%) of the
farmers had medium exportable vegetables cultivation area, followed by 14.40
percent having large exportable vegetables cultivation area and 3.60 percent had small
exportable vegetables cultivation area. Findings again revealed that overwhelming
majority (96.40%) of the farmers had medium to high exportable vegetables
cultivation area.
Co-efficient of Variation (41.18%) of exportable vegetables cultivation area of the
farmers indicated that the sample farmers were homogenous based on their exportable
vegetables cultivation area. However, experience in exportable vegetables cultivation
of the sample farmers was positively associated (r = 0.205**, significant at 0.001
level) with their perceived effects of using selected post-harvest practices to
strengthen vegetable export market. Therefore, it could be said that the choice of
vegetable production regarding the farming practices in the study area are expected to
be considerably influenced by the medium and large land area of the farmers. So, they
need comparatively cheaper technologies and target oriented special extension service
to use post-harvest practices for exportable vegetable production.
4.2.2 Exportable vegetables production
The observed range of exportable vegetables production of the sample farmers was
1700 to 9400 kg, the mean being 3468.40 with the standard deviation of 1353.24 and
co-efficient of variation of 39.02% (Table 4.7). The sample farmers were classified
into following three categories based on the exportable vegetables production:
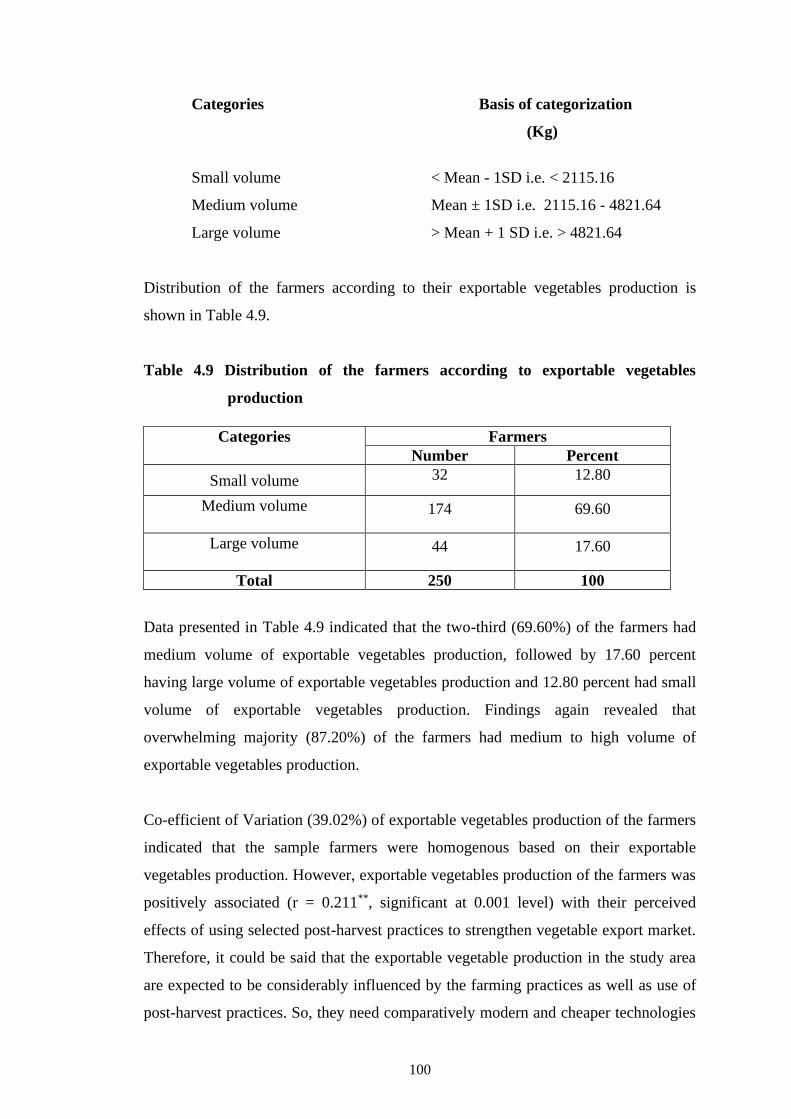
100
Categories Basis of categorization
(Kg)
Small volume < Mean - 1SD i.e. < 2115.16
Medium volume Mean ± 1SD i.e. 2115.16 - 4821.64
Large volume > Mean + 1 SD i.e. > 4821.64
Distribution of the farmers according to their exportable vegetables production is
shown in Table 4.9.
Table 4.9 Distribution of the farmers according to exportable vegetables
production
Categories Farmers
Number Percent
Small volume 32 12.80
Medium volume
174 69.60
Large volume
44 17.60
Total 250 100
Data presented in Table 4.9 indicated that the two-third (69.60%) of the farmers had
medium volume of exportable vegetables production, followed by 17.60 percent
having large volume of exportable vegetables production and 12.80 percent had small
volume of exportable vegetables production. Findings again revealed that
overwhelming majority (87.20%) of the farmers had medium to high volume of
exportable vegetables production.
Co-efficient of Variation (39.02%) of exportable vegetables production of the farmers
indicated that the sample farmers were homogenous based on their exportable
vegetables production. However, exportable vegetables production of the farmers was
positively associated (r = 0.211**, significant at 0.001 level) with their perceived
effects of using selected post-harvest practices to strengthen vegetable export market.
Therefore, it could be said that the exportable vegetable production in the study area
are expected to be considerably influenced by the farming practices as well as use of
post-harvest practices. So, they need comparatively modern and cheaper technologies

101
of vegetables post-harvest practices and target oriented special extension service for
good quality exportable vegetable production to increase export of vegetables.
4.2.3 Annual family income
The observed range of annual family income of the sample farmers was 80 to 350
thousand BDT, the mean being 166.43 with the standard deviation of 50.21 and co-
efficient of variation 30.17% (Table 4.7). The sample farmers were classified into
following three categories based on the annual family income:
Categories Basis of categorization
(‘000’ BDT)
Low income < Mean - 1SD i.e. < 116.22
Medium income Mean ± 1SD i.e. 116.22 - 216.64
High income > Mean + 1 SD i.e. > 216.64
Distribution of the farmers according to their annual family income is shown in Table
4.10.
Table 4.10 Distribution of the farmers according to their annual family income
Categories Farmers
Number Percent
Low income
16 6.40
Medium income
193 77.20
High income 41 16.40
Total 250 100
Data presented in Table 4.10 indicated that the most (77.20%) of the farmers had
medium income, followed by 16.40 percent having high income and 6.40 percent had
low income. Findings again revealed that overwhelming majority (83.60%) of the
farmers had low to medium income.
Co-efficient of Variation (30.17%) of annual family income of the farmers indicated
that the sample farmers were homogenous based on their annual family income.

102
However, annual family income of the sample farmers was positively associated (r =
0.221**, significant at 0.000 level) with their perceived effects of using selected post-
harvest practices to strengthen vegetable export market. Therefore, it could be said
that the annual family income of a farmer is an important indicator of how much s/he
can invest in his farming to produce exportable vegetables. Generally higher income
encourages one’s integrity to achieve better performance and to show his/her
individual better status in the society. The higher income increases the risk bearing
ability of the farmers’ exportable vegetable production. Farmers with low income
generally invest less in their farms. It is therefore, likely that a considerable portion of
farmers may face difficulty in exportable vegetable production.
4.2.4 Exportable vegetables production and post-harvest practices cost
The observed range of exportable vegetables production and post-harvest practices
cost of the farmers was 23 to 111 thousand BDT, the mean being 45.58 with the
standard deviation of 17.27 and co-efficient of variation of 37.89% (Table 4.7). The
sample farmers were classified into following three categories based on exportable
vegetables production and post-harvest practices cost:
Categories Basis of categorization
(‘000’ BDT)
Low cost < Mean - 1SD i.e. < 28.31
Medium cost Mean ± 1SD i.e. 28.31 - 62.85
High cost > Mean + 1 SD i.e. > 62.85
Distribution of the farmers according to their exportable vegetables production and
post-harvest practices cost is shown in Table 4.11.
Table 4.11 Distribution of the farmers according to their exportable vegetables
production and post-harvest practices cost
Categories Farmers
Number Percent
Low cost 41 16.40
Medium cost 167 66.80
High cost 42 16.80
Total 250 100

103
Data presented in Table 4.11 indicated that the two-third (66.80%) of the farmers had
medium cost, followed by 16.80 percent having high cost and 16.40 percent had low
cost. Findings again revealed that overwhelming majority (83.60%) of the farmers
had medium to high cost for exportable vegetable production and post-harvest
practices cost.
Co-efficient of Variation (37.89%) of exportable vegetables production and post-
harvest practices cost of the farmers indicated that the sample farmers were
homogenous based on their exportable vegetables production and post-harvest
practices cost. However, exportable vegetables production and post-harvest practices
cost of the sample farmers was positively associated (r = 0.199**, significant at 0.002
level) with their perceived effects of using selected post-harvest practices to
strengthen vegetable export market.
4.2.5 Credit received for exportable vegetables production
The observed credit received for exportable vegetables produces of the farmers
ranged from 11 to 60 thousand BDT, the mean being 23.68 with the standard
deviation of 10.51 and co-efficient of variation of 44.38% (Table 4.7). The sample
farmers were classified into following three categories based on credit received for
exportable vegetables production:
Categories Basis of categorization
(‘000’ BDT)
Low credit received < Mean - 1SD i.e. < 13.17
Medium credit received Mean ± 1SD i.e. 13.17– 34.19
Large credit received > Mean + 1 SD i.e. > 34.19
Distribution of the farmers according to their credit received for exportable vegetables
production is shown in Table 4.12.

104
Table 4.12 Distribution of the farmers according to their credit received for
exportable vegetables production
Categories Farmers
Number Percent
Low amount 23 9.20
Medium amount 187 74.80
Large amount 40 16.00
Total 250 100
Data presented in Table 4.12 indicated that about three-fourth (74.80%) of the farmers
received medium credit, followed by 16.00 percent high credit and 9.20 percent low
credit. Findings again revealed that overwhelming majority (90.80%) of the farmers
received medium to high amount of credit for exportable vegetable production.
Co-efficient of Variation (44.38%) of credit received for exportable vegetables
production of the farmers indicated that the sample farmers were homogenous based
on their credit received for exportable vegetables production. However, credit
received for exportable vegetables production of the farmers was not significantly
related (r = 0.115NS at 0.05 level of probability) with their perceived effects of using
selected post-harvest practices to strengthen vegetable export market. The findings
imply that the credit received for exportable vegetables production of the farmers
were not an important indicator for effects of using selected post-harvest practices to
strengthen vegetable export market.
4.3 Social Characteristics
An individual farmer may have many social characteristics. Six (6) social
characteristics of the farmers were selected for the present study. These includes -
training exposure on vegetables post-harvest practices, contact with value chain
actors, contract with value chain actors, depth of relationship with value chain actors,
trust with value chain actors and extension contact. Salient features including
measuring unit, possible and observed range, Mean, Standard Deviation (SD) and Co-
efficient of variance (CV) of the six (6) selected social characteristics of the farmers
have been presented in Table 4.13. Categories, number and percent distribution of
these six (6) selected social characteristics have been discussed below in the
subsections:

105
Table 4.13 Salient features including measuring unit, possible and observed
range, Mean, Standard Deviation (SD) and Co-efficient of variance
(CV) of the six (6) selected social characteristics of the farmers
Characteristics
Measuring
unit
Possible
range
Observed
range Mean
SD
CV%
1.Training
exposure on
vegetables
post-harvest
practices
Number of
days
Unknown 1-12 3.62 2.03 56.08
2. Contact with
value chain
actors
Scores 0 -56 14-55 38.71 10.64 27.49
3. Contract with
value chain
actors
Scores 0 - 3 23 2.29 0.45 19.65
4. Depth of
relationship
with value
chain actors
Scores 0 - 40 7-38 29.11 7.15 24.56
5. Trust with
value chain
actors
Scores 0 - 40 8-38 31.19 6.40 20.52
6. Extension
contact Scores 0 -78 9-70 41.18 15.23 36.98
4.3.1 Training exposure on vegetables post-harvest practices
The observed training exposure on vegetables post-harvest practices of the farmers
ranged from 1 to 12 days, the mean being 3.62 with the standard deviation of 2.03 and
co-efficient of variation of 56.08% (Table 4.13). The sample farmers were classified
into following three categories based on their training exposure on vegetables post-
harvest practices:
Categories Basis of categorization
(Number of days)
Low training exposure < Mean - 1SD i.e. < 1.59
Medium training exposure Mean ± 1SD i.e. 1.59 - 5.65
High training exposure > Mean + 1 SD i.e. > 5.65

106
Distribution of the farmers according to their training exposure on vegetables post-
harvest practices is shown in Table 4.14.
Table 4.14 Distribution of the farmers according to their training exposure on
vegetables post-harvest practices
Categories Farmers
Number Percent
Low training exposure 31 12.40
Medium training exposure
172 68.80
High training exposure 47 18.80
Total 250 100
Data presented in Table 4.14 indicated that the two-third (68.80%) of the farmers had
medium training exposure, followed by 18.80 percent having high training exposure
and 12.40 percent had low training exposure on vegetable post-harvest practices.
Findings again revealed that overwhelming majority (87.60%) of the farmers had
medium to high training exposure on vegetable post-harvest practices.
Co-efficient of Variation (56.08%) of training exposure on vegetables post-harvest
practices of the farmers indicated that the sample farmers were heterogeneous based
on their training exposure on vegetable post-harvest practices. However, training on
vegetables post-harvest practices of the sample farmers was positively associated (r =
0.322**, significant at 0.000 level) with their perceived effects of using selected post-
harvest practices to strengthen vegetable export market. It is logical that there is
always a relationship between training exposure and knowledge on post-harvest
practices. Because training received develops the farmers’ knowledge, skill, and
attitude in positive manner. The findings suggested that training exposure might be an
important factor for the respondents to change their knowledge on post-harvest
practices of vegetables.
4.3.2 Contact with value chain actors
The observed score of contact with value chain actors of the farmers ranged from 14
to 55 against the possible range of 0-56, the mean being 38.71 with the standard

107
deviation of 10.64 and co-efficient of variation 27.49% (Table 4.13). The sample
farmers were classified into following three categories based on contact with value
chain actors:
Categories Basis of categorization
(Scores)
Low contact < Mean - 1SD i.e. < 28.07
Medium contact Mean ± 1SD i.e. 28.07 - 49.35
High contact > Mean + 1 SD i.e. > 49.35
Distribution of the farmers according to their contact with value chain actors is shown
in Table 4.15.
Table 4.15 Distribution of the farmers according to their contact with value
chain actors
Categories
Farmers
Number Percent
Low contact 32 12.80
Medium contact 168 67.20
High contact 50 20.00
Total 250 100
Data presented in Table 4.15 indicated that the two-third (67.20%) of the farmers had
medium contact, followed by 20.00 percent having high contact and 12.80 percent
had low contact with the value chain actor. Findings again revealed that
overwhelming majority (87.20%) of the farmers had medium to high contact with
value chain actors.
Co-efficient of Variation (27.49%) of contact with value chain actors of the farmers
indicated that the sample farmers were homogenous based on their contact with value
chain actors. However, contact with value chain actors of the sample farmers was
positively associated (r = 0.275**, significant at 0.000 level) with their perceived
effects of using selected post-harvest practices to strengthen vegetable export market.

108
4.3.3 Contract with value chain actors
The observed score of contract with value chain actors of the farmers ranged from 2
to 3 against the possible range of 0-3, the mean being 2.29 with standard deviation of
0.45 and co-efficient of variation of 19.65% (Table 4.13). The farmers were classified
into following two categories based on contract with value chain actors:
Categories Basis of categorization
(Scores)
Written contract 2
MOU/ Deed 3
Distribution of the farmers according to their contract with value chain actors is
shown in Table 4.16.
Table 4.16 Distribution of the sample farmers according to their contract with
value chain actors
Data presented in Table 4.16 indicated that most (71.20%) of the farmers had written
contract and 28.80 having Memorandum of Understanding (MOU) or formal Deed
with the value chain actors. It means that all the farmers were contracted with the
value chain actors either by written or by MOU or Deed. Co-efficient of Variation
(19.65%) of contract with value chain actors of the farmers indicated that the farmers
were homogenous based on their contract with value chain actors. However, contract
with value chain actors of the farmers was not significantly related (r = 0.034NS at
0.05 level of probability) with their perceived effectiveness of farmer to use of
selected post-harvest practices. The findings imply that the contract with value chain
actors of the farmers were not an important factor for effects of using selected post-
harvest practices to strengthen vegetable export market.
Categories
Farmers
Number Percent
Written contract 178 71.20
MOU/ Deed 72 28.80
Total 250 100

109
4.3.4 Depth of relationship with value chain actors
The observed score of depth of relationship with value chain actors of the farmers
ranged from 7 to 38 against the possible range of 0-40, the mean being 29.11with the
standard deviation of 7.15 and co-efficient of variation 24.56% (Table 4.13). The
farmers were classified into following three categories based on their depth of
relationship with value chain actors:
Categories Basis of categorization
(Scores)
Low relationship < Mean - 1SD i.e. < 21.96
Medium relationship Mean ± 1SD i.e. 21.96 – 36.26
High relationship > Mean + 1 SD i.e. > 36.26
Distribution of the farmers according to their depth of relationship with value chain
actors is shown in Table 4.17.
Table 4.17 Distribution of the farmers according to their depth of relationship
with value chain actors
Data presented in Table 4.17 indicated that majority (71.20%) of the farmers had
medium relationship, followed by 16.40 percent having high relationship and 12.40
percent had low relationship with value chain actor. Findings again revealed that
overwhelming majority (87.60%) of the farmers had medium to high relationship with
value chain actors.
Co-efficient of Variation (24.56%) of depth of relationship with value chain actors of
the farmers (24.56%) indicated that the farmers were homogenous based on their
depth of relationship with value chain actors. However, depth of relationship with
Categories
Farmers
Number Percent
Low relationship 31 12.40
Medium relationship 178 71.20
High relationship 41 16.40
Total 250 100

110
value chain actors of the sample farmers was positively associated (r = 0.321**,
significant at 0.000 level) with their perceived effects of using selected post-harvest
practices to strengthen vegetable export market.
4.3.5 Trust with value chain actors
The observed score of trust with value chain actors of the farmers ranged from 8 to 38
against the possible range of 0-40, the mean being 31.19 with the standard deviation
of 6.40 and co-efficient of variation of 20.52% (Table 4.13). The farmers were
classified into following three categories based on trust with value chain actors:
Categories Basis of categorization
(Scores)
Low trust < Mean - 1SD i.e. < 24.79
Medium trust Mean ± 1SD i.e. 24.79 - 37.59
High trust > Mean + 1 SD i.e. > 37.59
Distribution of the farmers according to their trust with value chain actors is shown in
Table 4.18.
Table 4.18 Distribution of the farmers according to their trust with value chain
actors
Data presented in Table 4.18 indicated that the most (80.00%) of the farmers had
medium trust, followed by 13.20 percent having low trust and 6.80 percent had high
trust with value chain actors. Findings again revealed that overwhelming majority
(86.80%) of the farmers had medium to high trust with value chain actor.
Categories
Farmers
Number Percent
Low trust 33 13.20
Medium trust 200 80.00
High trust 17 06.80
Total 250 100

111
Co-efficient of Variation (20.52%) of trust with value chain actors of the farmers
indicated that the farmers were homogenous based on their trust with value chain
actors. However, trust with value chain actors of the sample farmers was positively
associated (r = 0.420**, significant at 0.000 level) with their perceived effects of using
selected post-harvest practices to strengthen vegetable export market.
4.3.6 Extension contact
The observed score of extension contact of the sample farmers ranged from 9 to 70
against the possible range of 0-78, the mean being 41.18 with the standard deviation
of 15.23 and co-efficient of variation of 36.98% (Table 4.13). The sample farmers
were classified into following three categories based on extension contact:
Categories Basis of categorization
(Scores)
Low extension contact < Mean - 1SD i.e. < 25.95
Medium extension contact Mean ± 1SD i.e. 25.95 - 56.41
High extension contact > Mean + 1 SD i.e. > 56.41
Distribution of the farmers according to their extension contact is shown in Table
4.19.
Table 4.19 Distribution of the farmers according to their extension contact
Categories
Farmers
Number Percent
Low extension contact 79 31.60
Medium extension contact
138 55.20
High extension contact 33 13.20
Total 250 100
Data presented in Table 4.19 indicated that the majority (55.20%) of the farmers had
medium extension contact, followed by 31.60 percent having low extension contact
and 13.20 percent had high extension contact. Findings again revealed that two-third
(68.40%) of the farmers had medium to high extension contact.

112
Co-efficient of Variation (36.98%) of extension contact of the farmers indicated that
the farmers were homogenous based on their extension contact. However, extension
contact of the farmers was positively associated (r = 0.387**, significant at 0.000
level) with their perceived effects of using selected post-harvest practices to
strengthen vegetable export market.
4.4 Professional characteristics
An individual farmer may possess many professional characteristics. A good
professional seeks to continue learning while practicing the profession by doing the
necessary research to handle new situations and problems as they arise. Three
professional characteristics of the sample farmers namely knowledge on selected
vegetable post-harvest practices, use of selected vegetables post-harvest practices and
problems faced in vegetable value chain were selected for the present study. Salient
features including measuring unit, possible and observed range, Mean, Standard
Deviation (SD) and Co-efficient of variance (CV) of the three (3) selected
professional characteristics of the farmers have been presented in Table 4.20.
Categories, number and percent distribution of these three selected professional
characteristics have been discussed below in subsections:
Table 4.20 Salient features including measuring unit, possible and observed
range, Mean, Standard Deviation (SD) and Co-efficient of variance
(CV) of the three (3) selected professional characteristics of the
farmers
Characteristics
Measuring
unit
Possible
range
Observed
range Mean
SD
CV%
1. Knowledge on
selected
vegetable post-
harvest practices
Scores 0 - 24 13-23 20.52 1.46 7.11
2. Use of selected
vegetables post-
harvest practices
Scores 0 - 45 15-42 34.11 6.79 19.91
3. Problems faced
in vegetable
value chain
Scores 0 - 78 18-71 37.61 15.13 40.22

113
4.4.1 Knowledge on selected vegetable post-harvest practices
The observed score of knowledge on selected vegetable post-harvest practices of the
farmers ranged from 13 to 23 against the possible range of 0-24, the mean being 20.52
with the standard deviation of 1.46 and co-efficient of variation of 7.11% (Table
4.20). The farmers were classified into following three categories based on their
knowledge on selected vegetable post-harvest practices:
Categories Basis of categorization
(Scores)
Low knowledge < Mean - 1SD i.e. < 19.06
Medium knowledge Mean ± 1SD i.e. 19.06 - 21.98
High knowledge > Mean + 1 SD i.e. > 21.98
Distribution of the farmers according to their knowledge on selected vegetables post-
harvest practices is shown in Table 4.21.
Table 4.21 Distribution of the farmers according to their knowledge on selected
vegetable post-harvest practices
Categories
Farmers
Number Percent
Low knowledge 37 14.80
Medium knowledge
198 79.20
High knowledge 15 6.00
Total 250 100
Data presented in Table 4.21 indicated that majority (79.20%) of the farmers had
medium knowledge, followed by 14.80 percent having low knowledge and 6.00
percent had high knowledge on selected vegetable post-harvest practices. Findings
again revealed that overwhelming majority (85.20%) of the farmers had medium to
high knowledge on selected vegetable post-harvest practices.
Co-efficient of Variation (7.11%) of knowledge on selected vegetable post-harvest
practices of the farmers indicated that the farmers were homogenous based on their
knowledge on selected vegetable post-harvest practices. However, knowledge on

114
selected vegetables post-harvest practices of the sample farmers was positively
associated (r = 0.398**, significant at 0.000 level) with their perceived effects of using
selected post-harvest practices to strengthen vegetable export market. Ali (2008) also
found a positive relationship between ecological agricultural knowledge and adoption
of ecological agricultural practices.
4.4.2 Use of selected vegetables post-harvest practices
The observed score of use of selected vegetables post-harvest practices of the farmers
ranged from 15 to 42 against the possible range of 0-45, the mean being 34.11 with
the standard deviation of 6.79 and co-efficient of variation of 19.91% (Table 4.20).
The farmers were classified into following three categories based on their use of
selected vegetables post-harvest practices:
Categories Basis of categorization
(Scores)
Low use < Mean - 1SD i.e. < 27.32
Medium use Mean ± 1SD i.e. 27.32 - 40.90
High use > Mean + 1 SD i.e. > 40.90
Distribution of the farmers according to their use of selected vegetables post-harvest
practices is shown in Table 4.22.
Table 4.22 Distribution of the farmers according to their use of selected
vegetables post-harvest practices
Categories
Farmers
Number Percent
Low use 49 19.60
Medium use
161 64.40
High use 40 16.00
Total 250 100
Data presented in Table 4.22 indicated that nearly two-third (64.40%) of the farmers
had medium use, followed by 19.60 percent having low use and 16.00 percent had

115
high use of selected vegetables post-harvest practices. Findings again revealed that
overwhelming majority (80.40%) of the farmers had medium to high use.
Co-efficient of Variation (19.91%) of use of selected vegetables post-harvest practices
of the farmers indicated that the farmers were homogenous based on their use of
selected vegetables post-harvest practices. However, use of selected vegetables post-
harvest practices of the sample farmers was positively associated (r = 0.464**,
significant at 0.000 level) with their perceived effects of using selected post-harvest
practices to strengthen vegetable export market.
Item-wise use of selected post-harvest practices of vegetables are described in the
Chapter 5 to compare among the use items.
4.4.3 Problems faced in vegetable value chain
The observed problem faced in vegetable value chain score of the farmers ranged
from 18 to 71 against the possible ranged 0-78, the mean being 37.61 with the
standard deviation of 15.13 and co-efficient of variation of 40.22% (Table 4.20).
Based on their problem faced in vegetable value chain, the farmers were classified
into following three categories-
Categories Basis of categorization
Low problem < Mean - 1SD i.e. < 22.48
Medium problem Mean ± 1SD i.e. 22.48 - 52.74
High problem > Mean + 1 SD i.e. > 52.74
Distribution of the farmers according to problem faced in vegetable value chain is
shown in Table 4.23.
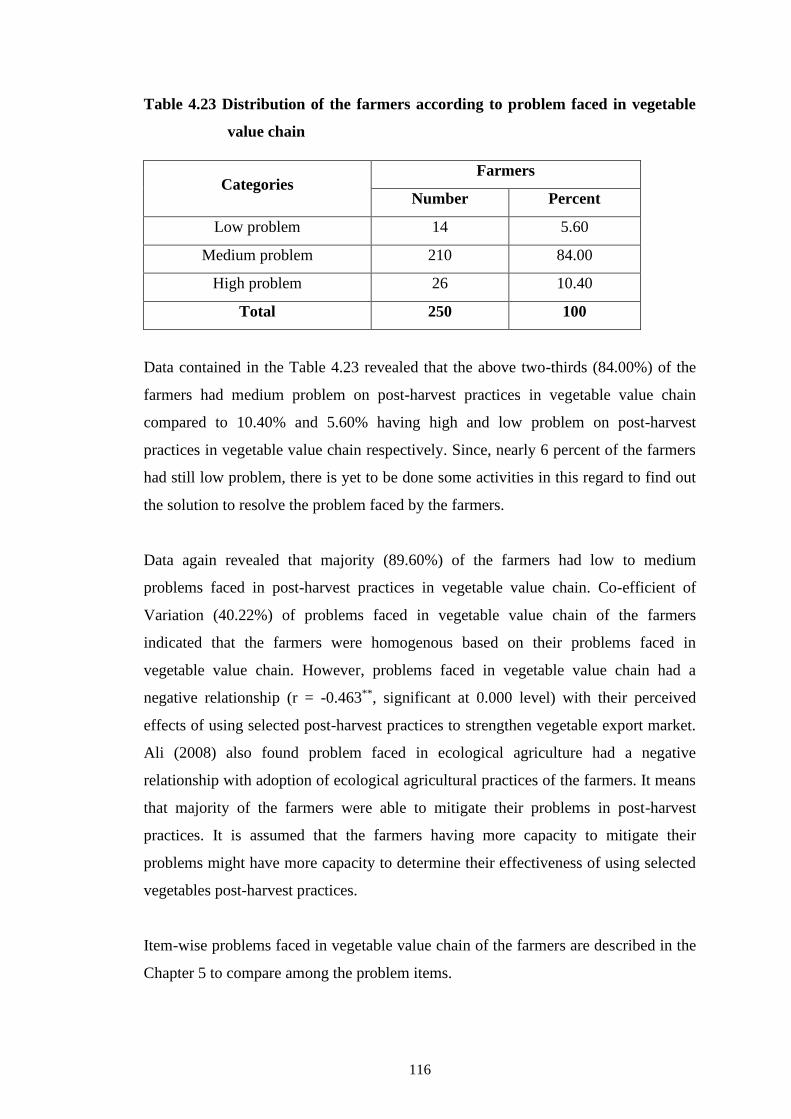
116
Table 4.23 Distribution of the farmers according to problem faced in vegetable
value chain
Categories Farmers
Number Percent
Low problem 14 5.60
Medium problem 210 84.00
High problem 26 10.40
Total 250 100
Data contained in the Table 4.23 revealed that the above two-thirds (84.00%) of the
farmers had medium problem on post-harvest practices in vegetable value chain
compared to 10.40% and 5.60% having high and low problem on post-harvest
practices in vegetable value chain respectively. Since, nearly 6 percent of the farmers
had still low problem, there is yet to be done some activities in this regard to find out
the solution to resolve the problem faced by the farmers.
Data again revealed that majority (89.60%) of the farmers had low to medium
problems faced in post-harvest practices in vegetable value chain. Co-efficient of
Variation (40.22%) of problems faced in vegetable value chain of the farmers
indicated that the farmers were homogenous based on their problems faced in
vegetable value chain. However, problems faced in vegetable value chain had a
negative relationship (r = -0.463**, significant at 0.000 level) with their perceived
effects of using selected post-harvest practices to strengthen vegetable export market.
Ali (2008) also found problem faced in ecological agriculture had a negative
relationship with adoption of ecological agricultural practices of the farmers. It means
that majority of the farmers were able to mitigate their problems in post-harvest
practices. It is assumed that the farmers having more capacity to mitigate their
problems might have more capacity to determine their effectiveness of using selected
vegetables post-harvest practices.
Item-wise problems faced in vegetable value chain of the farmers are described in the
Chapter 5 to compare among the problem items.

117
CHAPTER 5
EFFECTS OF USING SELECTED POST-HARVEST
PRACTICES TO STRENGTHEN VEGETABLE EXPORT
MARKET AND RELATED MATTERS
5.1 Effects of using selected post-harvest practices to strengthen
vegetable export market
Effects of using selected post-harvest practices to strengthen vegetable export market
was the main focus i.e. the dependent variable of the study. Exportable vegetables is
being producing by the farmers through post-harvest value chain at the primary stage
of value chain activities. Effects of using selected post-harvest practices to strengthen
vegetable export market was measured on the basis of the perception of the farmers
on eighteen (18) items. Measurement procedure of effects of using selected post-
harvest practices was described in Chapter 3 of this dissertation. Measuring unit,
possible and observed range, mean, standard deviation (SD) and co-efficient of
variance (CV) of the effects of using selected post-harvest practices as perceived by
the farmers’ are shown in Table 5.1.
Table 5.1 Measuring unit, possible and observed range, mean, standard
deviation (SD) and co-efficient of variance (CV) of the effects of
using selected post-harvest practices as perceived by the farmers
Dependent
Variable
Measuring
unit
Possible
range
Observed
range Mean SD CV %
Effects of using
selected post-
harvest practices
to strengthen
vegetable export
market
Scores 0 -54 29-52 44.67 5.50 12.31
The observed effects of using selected vegetable post-harvest practices score of the
farmers ranged from 29 to 52 against the possible range of 0-54. The mean score was

118
44.67 with the standard deviation 5.50 and Co-efficient variance of 12.31%. Based on
their effects’ scores, the farmers were classified into following three categories:
Categories Basis of categorization
Low effects < Mean - 1SD i.e. < (44.67-5.5) or < 39.17
Medium effects Mean ± 1SD i.e. (44.67-5.5) - (44.67+5.5) or 39.17 - 50.17
High effects > Mean + 1 SD i.e. (44.67+5.5) > 50.17
Distribution of the farmers according to their perceived effects of using selected post-
harvest practices to strengthen vegetable export market is shown in Table 5.2.
Table 5.2 Distribution of the farmers according to their perceived effects of using
selected post-harvest practices to strengthen vegetable export market
Categories Farmers
Number Percent
Low effects 41 16.40
Medium effects 178 71.20
High effects 31 12.40
Total 250 100
Data contained in the Table 5.2 revealed that the above most (71.2%) of the farmers
had medium perception on the effects of using selected vegetable post-harvest
practices compared to 12.40% and 16.40% had high and low perception on effects of
using selected post-harvest practices respectively to strengthen vegetable export
market. Since, nearly 16 percent of the farmers had still perceived low effects, there is
yet to be done much activities in this regard to make the use of selected post-harvest
practices to strengthen vegetable export market more effectively.
However, majority (83.60%) of the farmers perceived that the use of selected post-
harvest practices was medium to high effective to strengthen vegetable export market.
It clearly indicates that adopted post-harvest practices aided to produce good quality
vegetables for exporting. It might be due to various activities done by farmers in the
study area on post-harvest practices such as fresh produce handling practices include

119
harvesting with an intact calyx, using scissors/knifes to cut the fruit from the vine,
harvesting at the appropriate stage, careful handling of produce after harvest, using
soft leaves or old newspapers to cover baskets/plastic carets before loading, gentle
loading for transporting or into appropriate containers, storage of harvested produce in
cool rooms or in the shade, sorting and grading by color and size and packaging with
suitable materials. Concerned GOs, NGOs and Associations also played an important
role to use selected vegetables post-harvest practices by the farmers through various
training on post-harvest practices. Weinberger et al. (2009) stated that more farmers
have adopted fresh produce handling technologies. Farmers who adopted practices for
fresh produce handling usually have changed a range of practices between harvesting
and selling.
5.2 Item wise comparative effects of using post-harvest practices
To compare the item wise effects of using post-harvest practices, Effect Index (EI)
was computed as described in Chapter 3 of this dissertation. The observed Effect
Index (EI) of the items ranged from 506 to 712 against the possible range of 0-750. EI
of the each items with rank order of EI is presented in Table 5.3.
Table 5.3 Effects Index (EI) of using post-harvest practices scores of each items
with rank order
Item
no. Item of effects
Number of farmers perceived
EI
Rank
Order
Highly
effective
(3)
Moderately
effective
(2)
Low
effective
(1)
Not at
all
effective
(0)
Total
1
Reduce
wastage of
vegetables
222 15 5 8 250 701 2
2
Value
addition of
vegetables at
different level
of post-
harvest
practices
213 19 13 5 250 690 3
3
Quality
vegetable
produces
208 26 8 8 250 684 4
4
Increase
market
accessibility
203 28 7 12 250 672 5

120
Item
no. Item of effects
Number of farmers perceived
EI
Rank
Order
Highly
effective
(3)
Moderately
effective
(2)
Low
effective
(1)
Not at
all
effective
(0)
Total
5
Increase
vegetable
export
174 56 7 13 250 641 8
6
Increase
selling price
of produced
vegetable
185 46 11 8 250 658 7
7 Increase net
income 228 10 8 4 250 712 1
8
Free from
contamination
of any
hazardous
objects
196 28 17 9 250 661 6
9
Increase shelf
life of
produces
170 29 32 19 250 600 13
10
Increase
exporter’s
demand for
foreign
market
161 55 25 9 250 618 12
11
Strengthening
good
relationship
with value
chain actors
176 32 31 11 250 623 10
12
Increase
buyer
satisfaction
182 25 25 18 250 621 11
13
Facilitate
good access
to credit
support
127 40 45 38 250 506 18
14
Employment
generation for
selected post-
harvest
practices
170 55 15 10 250 635 9
15
Rapport
building with
government
and other
stakeholders
121 40 73 16 250 516 17
16 Awareness
buildup 170 18 38 24 250 584 14

121
Item
no. Item of effects
Number of farmers perceived
EI
Rank
Order
Highly
effective
(3)
Moderately
effective
(2)
Low
effective
(1)
Not at
all
effective
(0)
Total
towards good
agricultural
practices
17
Considerable
amount of
water used in
washing &
cleaning,
which flow
untreated into
adjacent
water bodies
has minimal
environmental
effects
120 48 69 13 250 525 15
18
Elimination
of
adulteration
& harmful
chemical
during post-
harvest
practices
116 55 62 17 250 520 16
Table 5.3 revealed that on the basis of descending order of EI, it was observed that
“Increase net income” ranked first followed by “Reduce wastage of vegetables”,
“Value addition of vegetables at different level of Post-harvest practices”, “Quality
vegetable produces”, “Increase market accessibility”, “Free from contamination of
any hazardous objects”, “Increase selling price of produced vegetable”, “Increase
vegetable export”, “Employment generation for selected post-harvest practices”,
“Strengthening good relationship with value chain actors”, “Increase buyer
satisfaction”, “Increase exporter’s demand for foreign market”, “Increase shelf life of
produces”, “Awareness buildup towards good agricultural practices”, “Considerable
amount of water used in washing & cleaning which flow untreated into adjacent water
bodies has minimal environmental effects”, “Elimination of adulteration & harmful
chemical during post-harvest practices”, “Rapport building with government and
other stakeholders” and “Facilitate good access to credit support”. Based on
descending rank order of EI, the effect items are described below:

122
Increase net income: Data in the Table 5.3 revealed that “Increase net income” had
the highest EI (712) based on the descending order of EI of the items. Weinberger et
al. (2009) found the similar result. He stated that profit is the main concerned of a
farm. He again reported that 71 percent of the adopters perceived that their farm
profits increased because of higher prices, price differentiation for products of
different grades, and farmers being able to sell higher quantities. Farmers were able to
obtain a 25 percent higher price for tomatoes due to a change in harvesting practices.
Some farmers also commented on a more stable farm income over the year because a
contract arrangement was achieved. On the other hand, farmers are getting various
types of agricultural training on vegetable post-harvest practices from different
Agricultural Extension Service Providers. This also might be the reason for the
highest level of effect of using vegetable post-harvest practices as perceived by the
farmers of the present study.
Reduce wastage of vegetables: “Reduce wastage of vegetables” had the second
highest EI based on descending order of EI of the items. Harvesting techniques are
important for decreasing the losses of vegetables. Harvesting should usually be done
during the cooler time of the early morning to minimize the initial temperature of the
plucked produce and reduce the costs of cooling (Web 1). Weinberger et al. (2009)
stated in his study that two-third (67%) of the farmers reported that post-harvest
practices reduce post-harvest losses of vegetable. Ali et al. (2013) conducted a study
on improvement of postharvest practices. He reported that same postharvest
treatments and packaging techniques were found to be effective for minimizing
postharvest losses. In most cases, plastic crate lining with newspaper was selected as
good package for minimizing physical damage during transportation. Chlorine wash
(tomato, brinjal, and papaya) and/or hot water treatment (mango, papaya) was found
beneficial for reducing diseases or decay and physiological loss in weight during
storage. Wrapping with newspaper was identified as effective practice both for
transportation and storage of papaya. Keeping wrapper leaves surrounded by ‘Head’
was observed as acceptable practice for transporting cabbage for minimizing physical
damage and weight losses. Applying alum or lime paste on stem butt end of cabbage
was found beneficial for minimizing ‘Head blemish’ and disease infestation.
Similarly, in this study, it was found that “reduce wastage of vegetable” had the 2nd

123
highest effect of using selected post-harvest practice to strengthen vegetable export
market.
Value addition of vegetables at different level of post-harvest practices: “Value
addition of vegetables at different level of post-harvest practices” had the third highest
EI score based on descending order of EI of the items. Porter defined the “value
chain” as a representation of a firm's value-adding activities, based on its pricing
strategy and cost structure and highlighting the interdependencies and linkages
between vertically-arrayed actors in the creation of value for a firm and also identified
(1) primary activities, which directly contribute to add value to the production of
goods and services and (2) support activities, which have an indirect effect on the
final value of the product (Van Den Berg et al., 2009). It involves a chain of activities
that are associated with adding value to a product through the production and
distribution processes of each activity (Schmitz, 2005). Primary activities at farm
level by the farmers, practicing various selected post-harvest activities may added
vegetables value. Post-harvest value chain is a high-level model of how businesses
receive raw materials as input, add value to the raw materials through various
processes and sell finished products to customers. In post-harvest value chain
operation activities, value adding and costs are integrated phenomenon. At each stage
in the value chain, the product changes hand through chain actors, transaction cost are
incurred, and generally, some form of value added. Value addition results from
diverse activities including bulking, cleaning, grading and packaging, transporting,
storing and processing (Anandajayasekeram and Gebremedhin, 2009). The various
actors who are involved in the tomato value chain also indicate value addition by the
farmer (43.72%), collectors (9.80%), small traders (3.15%), big traders (18.56%),
wholesaler (3.01%), retailers (6.40%) and consumers (15.36%). The highest value
was added by farmer followed by big traders, consumers, collectors, retailors, small
traders and wholesalers (Sarma, 2019). A post-harvest value chain, therefore,
incorporates productive transformation and value addition at each stage of post-
harvest practices.
Quality vegetable produces: “Quality vegetable produces” had the fourth highest EI
based on descending order of EI of the items. Post-harvest practices enhanced product
quality. Quality of vegetables may be improved by the use of techniques of post-

124
harvest practices from training. Weinberger et al. (2009) stated that two-third (67%)
of the farmers reported that post-harvest practices improved fresh and good quality
vegetables. Ultimately, by proper sorting and grading, the producers can be benefited.
Better post-harvest handling can increase food quality by minimize the loss of
nutrients. Produces are heat up during transport and decay, water loss and shrink are
increased (Web 3). As a result, quality and freshness are lost, which can be improved
by using proper packaging techniques. Liners or cushioning made of paper and foam
can be useful to protect fruit or vegetable from vibration damage during transport
(Web 2).The maximum physical damage (20%) was recorded in Brinjal transported in
open condition (without washing and without packaging) while it was minimum
(1.53%) in both treated and untreated Brinjal but carrying into plastic crates. It was
calculated that the physical damage could be minimized (18.47%) through carrying of
brinjal with plastic crate compared to open condition (Ali et al., 2013). Reducing of
physical damage, improves the quality of vegetables.
Increase market accessibility: “Increase market accessibility” had the fifth highest
EI based on descending rank order of EI of the items. By proper sorting and grading,
the producers can get high price of the produces, as the exporters and consumers are
attracted by high graded produces. On the other hand, high graded produces can be
degraded by contamination of lower graded produces which are infected by diseases,
insects or any other means. Washing is done to remove dirt, latex and microbial
infection. Washed commodity commands a better price than dirty commodity and
attracts the consumers’ mind. Fruits and vegetables growers and traders can be
benefited from washing prior to packing and cold storage. Banana and mangoes are
washed to remove latex and minimize staining. Tomatoes, cucumbers and leafy
greens can be washed with chlorinated water before packing and cooling (Web 1).
The postharvest techniques are economically efficient. Producer’s market share shows
that producers obtain the largest share when they sell out directly to roadside traders
which is about 85.32%. Tomato value chains are creating shared value to enhance
marketing success (Sarma et al., 2019). Small and large scale commercial farmers sell
most of their products to various market intermediaries. The producers generally deal
with traders and wholesalers. In most cases, farmers depend on village level traders
for price information but over the last few years, the situation has slightly changed
due to producing good quality vegetables by using best post-harvest practices, easy

125
access to communication technology and the big farmers generally have access to
market information to some extent.
Free from contamination of any hazardous objects: “Free from contamination of
any hazardous objects” had the sixth highest EI based on descending rank order of EI
among the items. Specially, washing by using clean water removes adhering soil and
other debris. After washing the produce should be air-dried before packing. Use of
sorting table or groundcover/tripal on floor to avoid contact of produce with the soil
which is a rich source of spoilage and human pathogens. Sanitary washing (chlorine
wash), wiping vegetables with soft cloth, these various post-harvest practices are done
to make the produces free from contamination of any hazardous objects (Acedo et al.
2016).
Increase selling price of produced vegetable: “Increase selling price of produced
vegetable” had the seventh highest EI based on descending rank order of EI among
the items. Farmers are contracted with guaranteed price. Depending on the crop, the
harvested produce is sorted and packed on farm and brought to the collection center
(pack house) for quality checking, sorting, treatment, packing, pre-cooling, and cold
storage. Clean produce has higher market appeal and price than dirty ones (Acedo et
al., 2016). In some rural assemble markets, Bepari collectively show artificial
reluctance to buy produce for a while to create panic, which ultimately force the
farmers to sell produce at lower prices. Grower’s organizations and cooperatives
should be encouraged. Often growers do not receive reasonable price of their produce
due to high production, less price and wastage. Various value added products like
flakes, chips, fries, etc. could be produced for domestic market and export (Bhuiyan,
2015). Therefore, efficient vegetable value chain is of paramount importance to
reduce postharvest loss and the risk and uncertainty in timely delivery of quality and
safe produce at reasonable prices to the market or exporter.
Increase vegetable export: “Increase vegetable export” had the eighth highest EI
based on descending rank order of EI among the items. Export chains of vegetables
vary with degree of vertical coordination. Vertically-integrated exporters are exporters
who grow produce on their own farms, arrange shipping to overseas destinations and
even distribute the goods to supermarkets and wholesalers in foreign markets. Other

126
groups of exporters are those who consolidate produce from contract growers directly
and those who consolidate produce procured by brokers who in turn consolidate
produce from farmers in spot market transactions or through farmer groups (Acedo et
al., 2016). Farmers are growing exportable quality vegetables through contract
farming by using selected post-harvest practices for long time, therefore their
perception is effective.
Employment generation for selected post-harvest practices: “Employment
generation for selected post-harvest practices” had the ninth highest EI based on
descending rank order of EI among the items. Weinberger et al. (2009) stated
observed that substantial improvements in income were observed for those who
adopted the improved postharvest technologies, ranging from 25 to 30 percent. Other
beneficial impacts at the community level were also reported, and the most
remarkable among these was employment generation. Many local people are involved
in post-harvest value chain that create employment. Post-harvest activities also
provide employment to family members. Promote gender equality as more women are
involved in postharvest and marketing operations.
Strengthening good relationship with value chain actors: “Strengthening good
relationship with value chain actors” had the tenth highest effect of using selected
post-harvest practices to strengthen vegetable export market based on descending rank
order of EI among the items. Weinberger et al. (2009) stated that the majority of the
respondents reported an improvement in their buyer-seller relationship. Buyers now
frequently visit farmers’ houses to buy more vegetables. Contracted buyer give
training support on post-harvest practices, sometimes give credit facilities for
cultivation, look after their post-harvest activities as well as cultivation. These co-
operations made a strong and trustworthy relationship between farmers-buyers.
Besides this, Government Agricultural Extension Service providing organizations like
Department of Agricultural Extension (DAE), Hortex Foundation, BFVAPEA also
providing agricultural advices related to post-harvest practices for producing
exportable good quality produces as well as vegetables cultivation.
Increase buyer satisfaction: “Increase buyer satisfaction” had the eleventh highest
EI based on descending rank order of EI among the items. Farmers were able to find a
127
larger number of buyers, many farmers reported their buyers are satisfied, and crops
can now be easily sold due to producing good quality and exportable vegetables.
Sorting and grading makes the buyers attracted to buy their products and continuing
contract to produce exportable vegetables.
Increase exporters demand for foreign market: “Increase exporters demand for
foreign market” had the twelfth highest EI based on descending rank order of EI
among the items. Improved post-harvest practices by the farmers lead to greater
demand for their produce from a larger number of buyers. The majority of the
intermediaries and exporters had an explicitly positive attitude towards the post-
harvest technology used by the farmers.
Increase shelf life of produces: “Increase shelf life of produces” had the thirteenth
highest EI based on descending rank order of EI among the items. Shelf life of
vegetables can be prolonged by proper post-harvest technology. Brinjal washed with
chlorine (200 ppm NaoCl) and packed in perforated polyethylene bag (0.5%) had the
maximum shelf life (14 days) while the minimum shelf life (4days) was recorded in
without washed and packaging condition (Ali et al. 2013).
Awareness buildup towards good agricultural practices: “Awareness buildup
towards good agricultural practices” had the fourteenth highest EI based on
descending rank order of EI among the items. Personnel associated with growing and
harvesting might be applied Good Agricultural Practices (GAPs) and protect
harvested produce from contamination. Sanitary procedures in production, harvesting,
packing and shipping to prevent or minimize contamination with human pathogens.
Awareness may be build up through training on organic vegetable production and
post-harvest practices.
Considerable amount of water used in washing & cleaning, which flow untreated
into adjacent water bodies has minimal environmental effects: “Considerable
amount of water used in washing & cleaning, which flow untreated into adjacent
water bodies has minimal environmental effects” had the fifteenth highest EI based on
descending rank order of EI among the items. The challenge is to find measures that
not only help farmers adapt and maintain agricultural productivity and profitability,

128
but also reduce the emissions associated with production. Even if drastic actions were
taken today to reduce Greenhouse gas (GHG) emissions dramatically, little could be
done to address some of the anticipated effects. The consequences of climate change
are long-lasting, increasing the importance of taking forceful action to reduce
emissions (mitigation) that incorporates adaptation measures (Vergara, 2004).
Practices to prevent and control hazards associated to vegetable postharvest chain,
ensuring a safe and wholesome product, while minimizing the negative impact of
those practices on the environment and on workers' health. Farmers used clean water
which flow untreated into adjacent water bodies has minimal environmental effects
and human health.
Elimination of adulteration & harmful chemical during post-harvest practices:
“Elimination of adulteration & harmful chemical during post-harvest practices” had
the sixteenth highest EI based on descending rank order of EI among the items. In
order to minimize postharvest losses, packaging requirements for fruits and
vegetables, and improvement of packaging methods were reported by Wills et al.
(1982). These authors also reviewed the major postharvest diseases of fruits and
vegetables and described the chemical treatments that are being used as postharvest
treatments to minimize the losses. Acedo et al. (2016) stated that insect pests of
vegetables are usually most destructive at the larva stage. Among them, fruit fly is the
most important pest in export trade. Other insect pests include bean pod borer and
moths (e.g. diamond back moth of cabbages). Postharvest management of insect pests
should involve the use of safe or non-chemical treatments such as heat treatment (hot
water dip, vapour heat .treatment), cold sterilization, high carbon dioxide exposure or
irradiation. Chemical control using insecticides might be avoided and if not, might be
used at levels non-toxic to non-target organisms particularly humans.
Rapport building with government and other stakeholders: “Rapport building
with government and other stakeholders” had the seventeenth highest EI based on
descending rank order of EI among the items. Farmers’ ability to maintain
productivity in a changing environment is of course linked to government policies and
programs. Along with general policies to promote agricultural development, policies
that specifically focus on improving agricultural productivity and promoting relevant
research and technology adoption are most likely to be effective (Nelson et al., 2009).

129
Facilitate good access to credit support: “Facilitate good access to credit support”
had the eighteenth highest EI based on descending rank order of EI among the items.
Credit support of Banks are much more complicated. Credit support from NGOs and
others sources is though available but interest rate is so high. So credit facilities is not
available for the farmers. For this reason farmers perception is lower against it
facilitate good access to credit support.
5.3 Item wise use of selected post-harvest practices of vegetables
To compare the use of selected post-harvest practices of vegetables items, Use Index
(UI) was computed. The UI for each item calculation procedure was described in
Chapter 3. The observed UI scores of the items ranged from 387 to 719 against the
possible range of 0-750. UI scores of the each items and rank order is shown in Table
5.4.
Table 5.4 Use Index (UI) scores of the each items with rank order
Sl
no.
Item of
selected post-
harvest
practices
Number of Farmer
UI
score Rank Order
Regularly
(3)
Occasionally
(2)
Rarely
(1)
Not at
all
(0)
Total
1
Harvesting of
vegetable
according to
appropriate
harvesting
maturity
211 16 21 2
250
686 2
2
Harvesting
vegetables at
appropriate
harvesting
time
171 34 31 14 250 612 7
3
Harvesting of
vegetable with
proper care to
minimize
mechanical
injury/
damage
173 36 29 12 250 620 6
4
Sterilized
knife or
instrument for
harvesting
vegetables
177 45 19 9 250 640 5
5 Use hand 88 37 49 76 250 387 15

130
Sl
no.
Item of
selected post-
harvest
practices
Number of Farmer
UI
score Rank Order
Regularly
(3)
Occasionally
(2)
Rarely
(1)
Not at
all
(0)
Total
gloves at
harvesting
time
6
Keeping
harvested
vegetables in
a shady place
or pre-cooling
197 31 16 6 250 669 3
7
Proper
washing of
vegetables
128 43 8 71 250 478 12
8
Wiping or air
drying of
washed
vegetables at
shady place
118 39 9 84 250 441 13
9 Sorting of
vegetables 228 13 9 0 250 719 1
10
Grading of
vegetable
according to
size, shape
and maturity
or graders
during field
handling
185 43 12 10 250 653 4
11
Proper
packing of
vegetables
156 30 39 25 250 567 8
12
Plastic crate
with covering
wet &
sanitized cloth
152 37 36 25 250 566 9
13
Line material
for
recommended
vegetable
149 25 40 36 250 537 10
14
Safe
transportation
on time
136 51 11 52 250 521 11
15
Cold chain for
vegetable
storage
116 31 21 82 250 431 14
Total
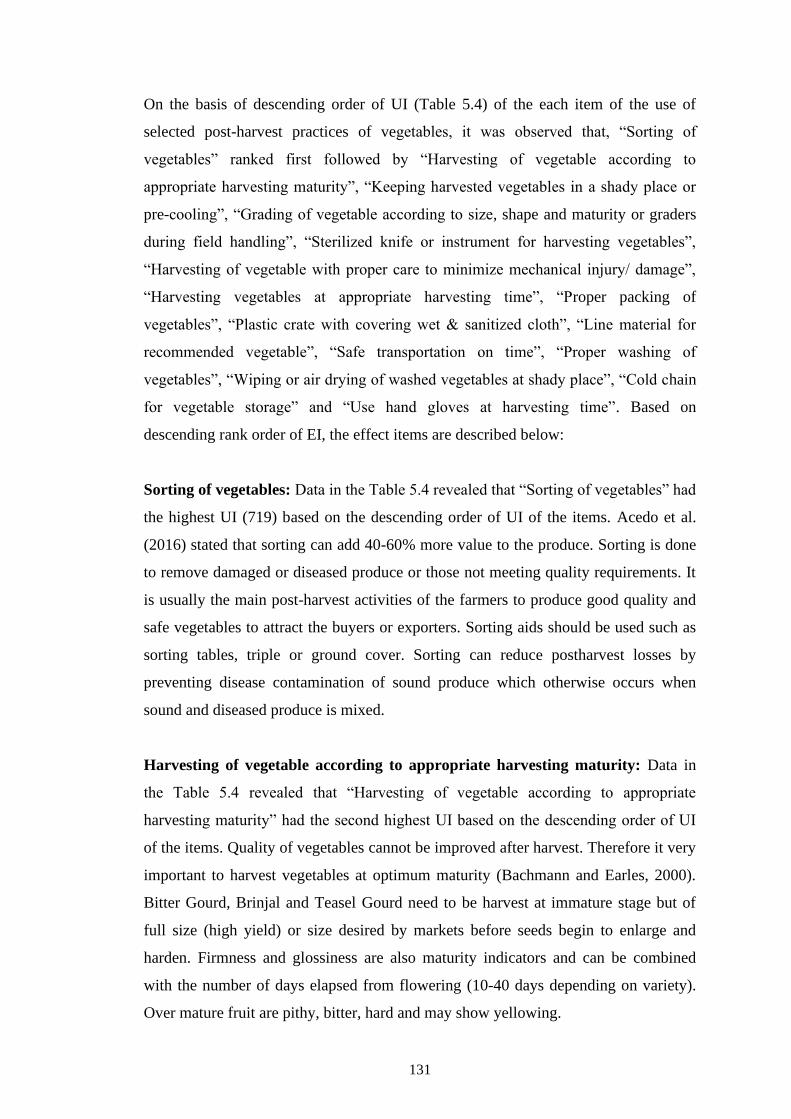
131
On the basis of descending order of UI (Table 5.4) of the each item of the use of
selected post-harvest practices of vegetables, it was observed that, “Sorting of
vegetables” ranked first followed by “Harvesting of vegetable according to
appropriate harvesting maturity”, “Keeping harvested vegetables in a shady place or
pre-cooling”, “Grading of vegetable according to size, shape and maturity or graders
during field handling”, “Sterilized knife or instrument for harvesting vegetables”,
“Harvesting of vegetable with proper care to minimize mechanical injury/ damage”,
“Harvesting vegetables at appropriate harvesting time”, “Proper packing of
vegetables”, “Plastic crate with covering wet & sanitized cloth”, “Line material for
recommended vegetable”, “Safe transportation on time”, “Proper washing of
vegetables”, “Wiping or air drying of washed vegetables at shady place”, “Cold chain
for vegetable storage” and “Use hand gloves at harvesting time”. Based on
descending rank order of EI, the effect items are described below:
Sorting of vegetables: Data in the Table 5.4 revealed that “Sorting of vegetables” had
the highest UI (719) based on the descending order of UI of the items. Acedo et al.
(2016) stated that sorting can add 40-60% more value to the produce. Sorting is done
to remove damaged or diseased produce or those not meeting quality requirements. It
is usually the main post-harvest activities of the farmers to produce good quality and
safe vegetables to attract the buyers or exporters. Sorting aids should be used such as
sorting tables, triple or ground cover. Sorting can reduce postharvest losses by
preventing disease contamination of sound produce which otherwise occurs when
sound and diseased produce is mixed.
Harvesting of vegetable according to appropriate harvesting maturity: Data in
the Table 5.4 revealed that “Harvesting of vegetable according to appropriate
harvesting maturity” had the second highest UI based on the descending order of UI
of the items. Quality of vegetables cannot be improved after harvest. Therefore it very
important to harvest vegetables at optimum maturity (Bachmann and Earles, 2000).
Bitter Gourd, Brinjal and Teasel Gourd need to be harvest at immature stage but of
full size (high yield) or size desired by markets before seeds begin to enlarge and
harden. Firmness and glossiness are also maturity indicators and can be combined
with the number of days elapsed from flowering (10-40 days depending on variety).
Over mature fruit are pithy, bitter, hard and may show yellowing.

132
Keeping harvested vegetables in a shady place or pre-cooling: Data in the Table
5.4 revealed that “Keeping harvested vegetables in a shady place or pre-cooling” had
the third highest UI based on the descending order of UI of the items. Field heat is
usually high and undesirable at harvesting stage of many fruits and vegetables and
should be removed as quickly as possible before any postharvest handling activity
(Bachmann and Earles, 2000). Excessive field heat gives rise to an undesirable
increase in metabolic activity and immediate cooling after harvest is therefore
important (Akbudak et al., 2012). Harvesting vegetables when the sun is up is
practiced since the produce is less brittle and more resistant to damage during
subsequent handling. Therefore, harvested vegetables should be kept under shady
place to reduce heat load and water loss. The vegetables should also be allowed to
pre-cooling before packing and storage in cold storage. High product temperature
accelerates quality deterioration due to increased water loss and respiration.
Precooling minimizes the effect of microbial activity, metabolic activity, respiration
rate, and ethylene production (Shahi et al., 2012), whilst reducing the ripening rate,
water loss, and decay, thereby preserving quality and extending shelf life of harvested
vegetables (Ferreira et al., 1994)
Grading of vegetable according to size, shape and maturity or graders: Data in
the Table 5.4 revealed that “Grading of vegetable according to size, shape and
maturity or graders during field handling” had the fourth highest UI based on the
descending order of UI of the items. Grading is the process of categorizing fruits and
vegetables on the basis of colour, size, stage of maturity, or degree of ripening.
Grading can add 40-60% more value to the produce (Acedo et al., 2016). Grading
facilitates production, packhouse operations and marketing when the quality grades
used are recognized in a value chain or entire industry. Quality grades (or grade
standards) serve as a universal language of trade and driver of technology adoption.
Markets can place orders based on quality grades which will then be used to guide
operations in the pack house and farms. Grading is done when the sorted defect-free
produce is classified into grades or classes of specific weights or sizes (sizing) and
maturity stage. It can be done after sorting or just before packing.

133
Sterilized knife or instrument for harvesting vegetables: Data in the Table 5.4
revealed that “Sterilized knife or instrument for harvesting vegetables” had the fifth
highest UI based on the descending order of UI of the items. Vegetables should be cut
with knife/scissor rather than snapped or twisted to avoid damage. Sterilized knife
should be sharpened to reduce effort and lessen picker’s fatigue.
Harvesting of vegetable with proper care to minimize mechanical injury/
damage: Data in the Table 5.4 revealed that “Harvesting of vegetable with proper
care to minimize mechanical injury/ damage” had the sixth highest UI based on the
descending order of UI of the items. Carefully harvest of vegetables needed to
minimize physical injury and damage of plants and preserve quality of vegetables.
Avoid pulling fruit to prevent removal of stem end and damage of plant and fruit for
subsequent harvest. Pulling fruit from the plant may remove the pedicel, exposing the
stem-end which is the cause for water loss and respiratory gases.
Harvesting vegetables at appropriate harvesting time: Data in the Table 5.4
revealed that “Harvesting vegetables at appropriate harvesting time” had the seventh
highest UI based on the descending order of UI of the items. Harvesting of fruits
should be done in either early or late hours of the day to avoid excessive field heat
generation. Harvesting at cooler times of the day minimizes product heat load and
increases work efficiency of pickers. Harvesting during or just after rain is not
recommended as wet condition (rain water on the leaves or fruit) favors microbial
growth and enhance tissue breakdown. If harvesting cannot be avoided during rainy
days, the produce must be washed and dried properly before packaging.
Proper packing of vegetables: Data in the Table 5.4 revealed that “Proper packing of
vegetables” had the eighth highest UI based on the descending order of UI of the
items. Packaging should be designed to prevent physical damage to produce, and be
easy to handle. Poor packaging is a one of major cause of post-harvest losses. It is
enclosing food produce or product to protect it from mechanical injuries, tampering,
and contamination from physical, chemical, and biological sources (Prasad and
Kochhar, 2014). Package selection depends on the type of produce, distance and
mode of transport, and market. Some common packaging materials used in most
developing countries include wooden crates, cardboard boxes, woven palmbaskets,

134
plastic crates, nylon sacks, jute sacks, and polythene bags (Idah et al., 2007). Most of
the abovementioned packaging materials do not give all the protection needed by the
commodity. Whilst the majority of these packaging materials like the nylon sacks do
not allow good aeration within the packaged commodity causing a build-up of heat
due to respiration, others like the woven basket have rough surfaces and edges which
cause mechanical injuries to the produce. Vegetable containers such as bamboo and
plastic baskets, plastic crates, wooden crates are more advisable. Package should be
done according to its’ capacity. Farmers need to conscious on do not underpack (more
vibration damage) or overpack (more compression damage). Modified Atmosphere
Packaging (MAP) is the sealing of produce in plastic bags to establish an atmosphere
of low oxygen and high carbon dioxide, and humid condition that slow metabolic
processes and water loss. 25 micron-thick (with market label as 001 film) low-density
polyethylene (LDPE), high-density PE (HDPE) or polypropylene (PP) films. Thicker
films (002-004) are not advisable due to increased water condensation inside the bag
that favors rotting. Benefits of MAP are high (Acedo et al., 2016)
Plastic crate with covering wet & sanitized cloth: Data in the Table 5.4 revealed
that “Plastic crate with covering wet & sanitized cloth” had the ninth highest UI based
on the descending order of UI of the items. Refrigerated van is not available during
transporting, in this case farmers may use plastic crate with covering wet & sanitized
cloth to protect the vegetables from direct sun heat. Fresh produce must be properly
protected during transportation in order to minimize mechanical damage, temperature
abuse, taint and contamination by food-borne pathogens.
Line material for recommended vegetable: Data in the Table 5.4 revealed that
“Line material for recommended vegetable” had the tenth highest UI based on the
descending order of UI of the items. Bamboo basket, woven basket have rough
surfaces and edges which cause mechanical injuries to the vegetables. Ali et al. (2013)
found that plastic crate lining with newspaper was selected as good package for
minimizing physical damage during transportation.
Safe transportation on time: Data in the Table 5.4 revealed that “Safe transportation
on time” had the eleventh highest UI based on the descending order of UI of the
items. Transporting harvested vegetables to the market on such bad road network and

135
the lack of proper transportation like refrigerated vans become a big challenge for
both producers and distributors (Abimbola, 2014). This challenge therefore causes
unnecessary delays in getting the produce to the market. Meanwhile, any delay
between harvest and consumption of vegetables can result in losses (Kader, 1986.
Losses of up to about 20% are incurred by producers due to transportation delays
(Babatola et al., 2008). Farmers, therefore make use of any available means of
transport for their produce without considering its appropriateness in order to avoid
delays. Some modes of transportation include human labour, public transport, rented
trucks, busses, pick-up vans and rickshaw etc. Ali et al. (2013) found that the
maximum physical damage (20%) was recorded in brinjal transported in open
condition (without washing and without packaging) while it was minimum (1.53%) in
both treated and untreated brinjal but carrying into plastic crates. It was calculated that
the physical damage could be minimized (18.47%) through carrying of Brinjal with
plastic crate compared to open condition. Lack of hygiene in transport can adversely
affect quality of vegetables. To prevent contamination by foodborne pathogens,
transport systems should follow good sanitation practices, ensure proper temperature
and RH management, and minimize potential damage to the produce.
Proper washing of vegetables: Data in the Table 5.4 revealed that “Proper washing
of vegetables” had the twelfth highest UI based on the descending order of UI of the
items. Washing using clean water to remove adhering soil and other debris. After
washing, the produce should be air-dried before packing. Ali et al. (2013) reported
that washing in 100-200 ppm chlorine (mixing 4-8 tablespoons of commercial bleach,
which has 5.25% sodium hypochlorite or NaOCl, per gallon of water) for 1-3 minutes
can reduce microbial load and decay in Brinjal. The produce should be air-dried
before packing.
Wiping or air drying of washed vegetables at shady place: Data in the Table 5.4
revealed that “Wiping or air drying of washed vegetables at shady place” had the
thirteenth highest UI based on the descending order of UI of the items. Vegetables can
be cleaned by wiping tomato, eggplant or cucumber with clean soft cloth under shady
place. After washing vegetables, it is needed to air-dry under shady place before
packing.

136
Cold chain for vegetable storage: Data in the Table 5.4 revealed that “Cold chain
for vegetable storage” had the fourteenth highest UI based on the descending order of
UI of the items. There is lack of cold-storage at farmer’s field. On the other hand
vegetables are perishable sensitive. To keep vegetables in cold storage is also
expensive as well as there is no crop insurance. Therefore maximum farmers sold
their product to avoid risk and loss.
Use hand gloves at harvesting time: Data in the Table 5.4 revealed that “Use hand
gloves at harvesting time” had the fifteenth highest UI based on the descending order
of UI of the items. Protective clothing, hand gloves should also be worn for pickers
‘protection from plant hairs or trichomes (tomato, eggplant, cucumber, okra) or sap
(chili) that may cause skin burning or allergy. Lack of awareness most of the farmers
don’t interested to wore protective cloth or hand gloves.
5.4 Item wise Comparative severity of the problems faced by the
farmers in vegetable value chain
A problem is a situation preventing something from being achieved. The word comes
from a Greek word meaning an “obstacle” (something that is in your way). Someone
who has a problem must find a way of solving it. The means of solving a problem is
called a “solution”. Problem defined by Goode (1945) is any significant perplexing
and challenging situation, real and artificial, the solution of which requires reflective
“thinking”. Problem faced, therefore, refers to the extent to which individual faces
difficult situations about which something needs to be done. Farmers producing
exportable vegetables often faced problem in vegetable value chain. There are various
problem that faced by the farmers during post-harvest practices, among them only
twenty six (26) problems were considered in this study. Item selection and
measurement procedure of problem faced scale was described in Chapter 3 of this
dissertation.
To compare the problem faced of different selected items, Problem Faced Index (PFI)
was computed. The PFI for each item calculation procedure was described in Chapter
3. The observed PFI scores of the items ranged from 114 to 684 against the possible
range of 0-750. PFI scores of the each items and rank order is shown in Table 5.5.

137
Table 5.5 Problem Faced Index (PFI) scores of the each items with rank order
Items of problem
Extent of problem faced PFI
scores
Rank
order
Severe
Problem
(3)
Moderate
problem
(2)
Less
problem
(1)
No
problem
(0)
Total
A. Social problems
1. Absence of
exportable vegetable
farmers association
and support
19 24 28 179 250 133 24
2. Inadequate extension
service to support
exportable vegetable
production
15 17 40 178 250 119 25
3. Absence of group
based farming
practice
21 25 51 153 250 164 22
4. Difficult to make
communication with
vegetable exporter
23 31 44 152 250 175 21
B. Technical problems
5. Unavailability of
appropriate inputs
for exportable
vegetable production
151 37 30 32 250 557 6
6. Lack of sufficient
space for washing
and drying
vegetables
126 39 49 36 250 505 8
7. Difficult to sorting &
grading according to
exporters
requirement
154 45 18 33 250 570 5
8. Absence of cool
chain management 112 47 46 45 250 476 9
9. Insufficient
packaging materials
to meet up exporters
wish
96 51 11 92 250 401 11
10. Absence of
sufficient laboratory
for quality test both
inputs and
exportable
vegetables
88 39 9 114 250 351 13
C. Environmental problem
11. Lack of weather
information, early
message of weather
forecasting
45 39 48 118 250 261 17

138
Items of problem
Extent of problem faced PFI
scores
Rank
order
Severe
Problem
(3)
Moderate
problem
(2)
Less
problem
(1)
No
problem
(0)
Total
12. Increase Insect &
Disease attack
during postharvest
activities due to
natural hazards
136 35 45 34 250 523 7
D. Marketing problems
13. Lack of market
information to the
farmers such as
prices, flow of the
product
205 16 23 6 250 670 2
14. Lack of knowledge
about the demand in
the market 25 33 45 147 250 186 20
15. Poor linkage in the
marketing channel
from farmgate to
exporters
78 32 18 122 250 316 14
16. Lack of linkage
between farmer and
agro-processing
entrepreneurs
35 36 55 124 250 232 18
17. Lack of fair
competition in the
market price
217 11 11 11 250 684 1
18. Poor and
inadequate roads for
transportation for
marketing
21 22 38 169 250 145 23
19. Lack of proper
transport vehicle to
maintain cool chain
92 43 8 107 250 370 12
20. Lack of storage
facilities 109 25 50 66 250 427 10
21. No formal contract
with value chain
actors
19 12 33 186 250 114 26
22. Uncertainty of
transportation strike 28 34 55 133 250 207 19
23. Undesirable
involvement of
middlemen
61 36 50 103 250 305 15
E. Psychological problems
24. Pressure on time
delivery to
exporters
54 34 45 117 250 275 16
25. Pressure from
Middleman to sell 159 43 32 16 250 595 4

139
Items of problem
Extent of problem faced PFI
scores
Rank
order
Severe
Problem
(3)
Moderate
problem
(2)
Less
problem
(1)
No
problem
(0)
Total
produces at lower
price
26. Depression on sale
of lower graded
vegetables
183 36 20 11 250 641 3
On the basis of descending order of PFI, it was observed that, “Lack of fair
competition in the market price” ranked first followed by “Lack of market
information to the farmers such as prices, flow of the product, “Depression on sale of
lower graded vegetables”, “Pressure from Middlemen to sell produces at lower price”,
“Difficult to sorting & grading according to exporters requirement”, “Unavailability
of appropriate inputs for exportable vegetable production”, “Increase Insect &
Disease attack during postharvest activities due to natural hazards”, “Lack of
sufficient space for washing and drying vegetables”, “Absence of cool chain
management”, “Lack of storage facilities, “Insufficient packaging materials to meet
up exporters wish”, “Lack of proper transport vehicle to maintain cool chain”,
“Absence of sufficient laboratory for quality test both inputs and exportable
vegetables”, “Poor linkage in the marketing channel from farmgate to exporters”,
“Undesirable involvement of middlemen”, “Pressure for on-time delivery to
exporters”, “Lack of weather information, early message of weather forecasting”,
“Lack of linkage between farmer and agro-processing entrepreneurs”, “Uncertainty of
transportation strike”, “Lack of knowledge about the demand in the market”,
“Difficult to make communication with vegetable exporter”, “Absence of group based
farming practice”, “Poor and inadequate roads for transportation for marketing”,
“Absence of exportable vegetable farmers association and support”, “Inadequate
extension service to support exportable vegetable production, and “No formal contract
with value chain actors”.
5.5 Suggestions for solving problems faced by the farmers in
vegetable value chain
To solve the problems of the farmers, they were asked to make three important
suggestions against each problem. Based on the highest citation numbers, three
suggestions of each problem are mentioned in Table 5.6

140
Table 5.6 Suggestions to mitigate the problems faced by the farmers
Sl.
no. Items of problem Suggestions to mitigate the problem
A. Social problems
1
Absence of exportable
vegetable farmers
association and support
1. Arranging motivational campaign for the
Farmers’ group leaders so that they can able to
help other group farmers to produce good quality
vegetables
2. Arrangement of result demonstration and
method demonstration for farmers regarding
post-harvest practices - learning by seeing
3. Arranging focus group discussion with
Farmers’ group leaders so that they can make
them able to share learning and knowledge of
post-harvest practices with others farmer
2
Inadequate extension
service to support
exportable vegetable
production
1. Increase monitoring and evaluation of
government and non-government extension
service providing organizations
2. Arranging more skill based training and
motivations programmes for the individual
extension service providers specially on
exportable vegetable production
3. Involvement of sufficient extension service
providing individual in each organizations to
help farmers to produce good quality and
exportable vegetables
3 Absence of group based
farming practice
1. Taking motivational initiatives by the Extension
service providers towards the farmers that the
group farming help them to reduce cost of
production as well as increase income
2. Creating farmers group leaders from who have
small and medium land for producing exportable
vegetables
3. Providing training, credit facilities, free technical

141
Sl.
no. Items of problem Suggestions to mitigate the problem
support, market information, machineries
support with low cost for group based farming
by the Government agencies as well as private
sectors
4
Difficult to make
communication with
vegetable exporter
1. Creating e-commerce platform to make
communication with buyers/ exporters
2. Making database of exportable vegetables
producing farmers to give internet facilities with
low cost with the help of concerned authority.
3. Establishing B2B relationship between farmers
and buyers/exporters
B. Technical problems
5
Unavailability of
appropriate inputs for
exportable vegetable
production
1. Establishing of farmers’ co-operatives for
distributing agricultural inputs to the farmers for
producing exportable vegetables
2. Strongly monitoring of the agricultural inputs
quality timely by the relevant government
agency
3. Providing sufficient credit to the farmers for
buying agricultural inputs
6
Lack of sufficient space
for washing and drying
vegetables
1. Establish collection point/center at near farm
through farmers’ co-operatives
2. Government initiatives to give land lease to
farmers co-operatives who are producing
exportable vegetables
3. Encourage private sector to establish collection
point at nearby exportable vegetables producers
farm/land
7
Difficult to sorting &
grading according to
exporters requirement
1. Capacity building of farmers through training on
sorting and grading
2. Providing sorting table or ground cover
3. Use of rating scales (e.g. visual quality rating,
color index, and defects rating) with quality and

142
Sl.
no. Items of problem Suggestions to mitigate the problem
color charts; colorimeter or chromameter
(quantitative color); gloss meter; weighing scale;
caliper(for size)
8 Absence of cool chain
management
1. Establishment of shade at farm level with
minimum cost
2. The ice bottles are wrapped with newsprint paper
and placed in the package to cool vegetables in
transit to market
3. Use of Knockdown/overhead hydro cooler
(precooling) method at low cost to rapidly remove
product heat before load in the cool chamber at
cold storage.
9
Insufficient packaging
materials to meet up
exporters wish
1. Government can tie up with the packaging
materials providing company
2. Packing unit can be set up by the farmers’ co-
operative societies which will provide
employment opportunities to the local people
3. Reduce cost of packing materials
10
Absence of sufficient
laboratory for quality
test both inputs and
exportable vegetables
1. Government initiatives to establish quarantine
laboratory for quality test of inputs if possible at
district level
2.Government initiatives to establish quarantine
laboratory for quality test of exportable
vegetables if possible at division level
3. Establishing laboratory for quality test through
Public Private Partnership (PPP)
C. Environmental problem
11
Lack of weather
information, early
message of weather
forecasting
1. Developing weather forecasting through own
satellite by government
2. Delivering free early message to farmers on
weather forecasting
3. Offering internet package at minimum cost to the
farmers

143
Sl.
no. Items of problem Suggestions to mitigate the problem
12
Increase Insect &
Disease attack during
postharvest activities
due to natural hazards
1. Develop disease forecasting facilities to
proper control of pest during post-harvest
activities
2. Provide immediate suggestions and technical
support for pest and disease control while post-
harvest activities going on
3. In case of severe attack during post-harvest
activities, chemicals should be used at levels
non-toxic to non-target organisms particularly
humans
D. Marketing problems
13
Lack of market
information to the
farmers such as prices,
flow of the product
1. Planning vegetables wise group based farming to
overcome access supply in the market
2. Government portal can be developed showing
the daily prices of vegetables
3. Strengthening vegetables value chain to provide
information on production, demand and supply
of vegetables
14
Lack of knowledge
about the demand in
the market
1. Exhibitions and technical fair can be conducted
for global market demand of vegetables
2. Support of research institute, Export Promotion
Bureau to provide global demand of vegetables
3. Creating knowledge hub on global export import
information at least union level
15
Poor linkage in the
marketing channel
from farmgate to
exporters
1. Professional Networking buildup between the
farmers and others value chain actors
2. Strong monitoring system in vegetables value
chain by government at each stage.
3. Establishing semi processing unit through Public
Private Partnership (PPP) near production area
16 Lack of linkage
between farmer and
1. Emphasize on contract farming between the
farmers and private food processing company the

144
Sl.
no. Items of problem Suggestions to mitigate the problem
agro-processing
entrepreneurs
2. Outsourcing of vegetables can be done by the
processing units
3. NGOs can play a vital role as an intermediary
between farmers and agri-entrepreneurs
17
Lack of fair
competition in the
market price
1. Strong monitoring for ensuring fair price of
exportable vegetables
2. Strengthening value chain to get fair price
3. Facilitating mini cold storage for vegetables
nearby market
18
Poor and inadequate
roads for transportation
for marketing
1. Construction of new roads, bridges etc.
2. Rebuild the damage roads, bridges etc.
3. Providing more budgets for increasing
transportation facilities
19
Lack of proper
transport vehicle to
maintain cool chain
1. Provide refrigerated refer van for exportable
vegetables transport in rural areas by Public
Private Partnership (PPP)
2. In non-refrigerated transport, evaporative cooling
and Modified Atmosphere (MA) techniques can
be applied
3. Fuel cost need to decrease for transportation of
exportable vegetable products
20 Lack of storage
facilities
1. Construct storage facilities by private sector or
co-operative societies for
agricultural products specially for vegetables
2. Motivational campaign by GO and private sector
for using storage facilities for getting benefits
3. Need to provide GOs subsidy for establishing
low cost storing facilities at local level
21 No formal contract with
value chain actors
1. Trust build up among the value chain actors
2. Facilitate credit support and crop insurance for
producing exportable vegetables
3. Make win-win situation for the exportable

145
Sl.
no. Items of problem Suggestions to mitigate the problem
vegetable growers
22 Uncertainty of
transportation strike
1. Giving flexibility in case of transporting
exportable vegetables by Transport Federation
during uncertain transport strike
2. Immediate actions to resolve the strike by
government in case of uncertain transport strike
3. Developing and establishing crop insurance for
exportable vegetables for uncertain transport
strike by government
23
Undesirable
involvement of
middlemen
1. Government initiative to decrease the number of
middle men for buying of agricultural inputs and
selling of vegetables products
2. Providing job facilities for the
Middlemen in both public and private sector
3. Development of vegetable value chain activities
for the middlemen
E. Psychological problems
24 Pressure for on- time
delivery to exporters
1. Make business plan of vegetable exporting
2. Maintain crop calendar and seasonality
3. Provide technical support and rapport building
with the farmers for on time cultivation
25
Pressure from
Middleman to sell
produces at lower price
1. Develop digital communication platform
2. Develop market monitoring system
3. Increase group selling by the farmers through
motivational activities
26
Depression on sale of
lower graded
vegetables
1. Make skilled farmers through training on sorting
and grading
2. Ensure selling product in the local market with
fair price
3. Implementation of Good Agricultural Practices
(GAP) to produce good quality vegetables to
reduce lower grade

146
CHAPTER 6
CONTRIBUTION AND EFFECT OF SELECTED CHARACTERISTICS OF
THE FARMERS TO/ON THEIR PERCEIVED EFFECTS OF USING
SELECTED POST-HARVEST PRACTICES TO STRENGTHEN
VEGETABLE EXPORT MARKET
The purpose of this Chapter is to examine the contribution and effect of selected
characteristics of the farmers to/on their perceived effects of using selected post-
harvest practices to strengthen vegetable export market. Effects of using selected
vegetables post-harvest practices is a multivariate phenomenon involving interaction
of many factors. Past studies on effects of using selected vegetables post-harvest
practices have brought to light a good number of characteristics of an individual that
affect the perception behaviour. For this study nineteen (19) characteristics of the
farmers were selected as the independent variables.
Effects of using selected post-harvest practices to strengthen vegetable export
market (Y) was the dependent variable of this study. The procedure followed in
measuring the dependent and independent variables have already been discussed in
Chapter 3. Research and null hypotheses have been stated for testing the
contribution/effect of the selected characteristics of the farmers to/on their perceived
effects of using selected post-harvest practices to strengthen vegetable export market
in Chapter 3. Pearson product moment correlation test was initially run to test the
relationships between each of the selected characteristics of the farmers and their
perceived effects of using selected post-harvest practices to strengthen vegetable
export market. The result of correlation matrix containing inter-correlation among the
variables is shown in Appendix-IX. However, the results of correlation co-efficient of
each of the selected characteristics of the respondent farmers with their perceived
effects of using selected post-harvest practices to strengthen vegetable export
market are shown in Table 6.1.

147
Table 6.1 Results of correlation co-efficient of each of the selected characteristics
of the respondent farmer with their perceived effects of using selected
post-harvest practices to strengthen vegetable export market
Focus variable Sample farmers characteristics
Value of Co-
efficient of
correlation (r )
Effects of using
selected post-
harvest practices
to strengthen
vegetable export
market (Y)
Age (X1) 0.123NS
Education(X2) 0.005 NS
Family agricultural labour (X3) 0.073 NS
Experience in vegetables cultivation (X4) 0.044 NS
Experience in exportable vegetables
production (X5) 0.244**
Exportable vegetables cultivation area (X6) 0.205**
Exportable vegetables production (X7) 0.211**
Annual family income (X8) 0.221**
Exportable vegetables production and
post-harvest practices cost (X9) 0.199**
Credit received for exportable vegetables
production (X10) 0.115 NS
Training exposure on vegetables post-
harvest practices (X11) 0.322**
Contact with value chain actors (X12) 0.275**
Contract with value chain actors (X13) 0.034 NS
Depth of relationship with value chain
actors (X14) 0.321**
Trust with value chain actors (X15) 0.420**
Extension contact (X16) 0.387**
Knowledge on selected vegetable post-
harvest practices (X17) 0.398**
Use of selected vegetables post-harvest
practices (X18) 0.464**
Problems faced in vegetable value chain
(X19) -0.463**
NSNot significant, *Significant at 0.05 Level, **Significant at 0.01 Level
Correlation analysis showed that out of nineteen (19) characteristics of the farmers,
thirteen (13) had significant relationship with their perceived effects of using selected
post-harvest practices to strengthen vegetable export market. The characteristics of
the farmers, Experience in exportable vegetables production (X5), Exportable
vegetables cultivation area (X6), Exportable vegetables production (X7), Annual
family income (X8), Exportable vegetables production and post-harvest practices cost
(X9), Training exposure on vegetables post-harvest practices (X11), Contact with value
chain actors (X12), Depth of relationship with value chain actors (X14), Trust with

148
value chain actors (X15), Extension contact (X16) Knowledge on selected vegetable
post-harvest practices (X17) and Use of selected vegetable post-harvest practices (X18)
of the sample farmers had significant positive relationship with their perceived effects
of using selected post-harvest practices to strengthen vegetable export market. But
Problems faced in vegetable value chain (X19) of the farmers had significant negative
relationship with their perceived effects of using selected post-harvest practices to
strengthen vegetable export market.
6.1 Contribution of the selected characteristics of the farmers to their
perceived effects of using selected post-harvest practices to
strengthen vegetable export market
The independent variables in isolation would not give a comprehensive picture of the
contribution of independent variables to their perceived effects of using selected post-
harvest practices to strengthen vegetable export market (Y). The different
characteristics of the respondents may interact together to make a combined
contribution to the effects of using selected post-harvest practices to strengthen
vegetable export market. Keeping this fact in view linear multiple regression analysis
was used to assess the contribution of the independent variables to the effects of using
selected post-harvest practices to strengthen vegetable export market. Full model
multiple regression analyses was initially run by involving all the independent
variables with the effects of using selected post-harvest practices to strengthen
vegetable export market.
It was observed that the full model regression results were misleading due to the
existence of interrelationships among the independent variables. It was evident from
correlation matrix showing the interrelationships among the independent variables
and existence of contradiction in the sign of correlation co-efficient and regression co-
efficient.
Droper and Smith (1981) suggested running stepwise multiple regression analysis to
insert variables in turn until the regression equation is satisfactory. Therefore, in order
to avoid the misleading results due to the problem of multi-collinearity and to
determine the best explanatory variables, the method of step-wise multiple regression
was employed by involving the following seven (7) sets of independent variables with

149
the effects of using selected post-harvest practices to strengthen vegetable export
market. The objective of the step wise multiple regression models were to find out the
contribution of the variables, which were significant only. Results of these seven (7)
sets of step wise multiple regression analysis in the form of table or equation have
been discussed below:
Set-I
All the selected nineteen (19) independent variables of this study were fitted together
in this set of step wise multiple regression with the effects of using selected post-
harvest practices to strengthen vegetable export market (Y) as the dependent variable.
Table 6.2 revealed the summarized results of step-wise multiple regression analysis
showing the contribution of all the nineteen (19) selected characteristics of the
farmers to their perceived effects of using selected post-harvest practices to strengthen
vegetable export market. It was observed that out of nineteen (19) independent
variables only six (6) variables namely, Use of selected vegetables post-harvest
practices (X18), Problems faced in vegetable value chain (X19), Knowledge on
selected vegetable post-harvest practices (X17), Exportable vegetables production
(X7), Experience in exportable vegetables production (X5) and Extension contact
(X16) were entered into regression equation.

150
Table 6.2 Summary of stepwise multiple regression analysis showing the
contribution of all the 19 independent variables to the effects of
using selected post-harvest practices to strengthen vegetable export
market
Variables
entered
Standardized
partial 'b'
coefficient
Value of 't'
(with
probability
level)
Adjusted
R2
Increase
in R2
Variation
explained
in percent
Use of selected
vegetables post-
harvest
practices (X18)
0.233 3.824
(0.000) 0.213 0.213 21.3
Problems faced
in vegetable
value chain
(X19)
-0.164 -2.002
(0.046) 0.301 0.088 8.80
Knowledge on
selected
vegetable post-
harvest
practices (X17)
0.150 2.534
(0.012) 0.320 0.019 1.90
Exportable
vegetables
production (X7)
0.161 3.094
(0.002) .336 0.016 1.60
Experience in
exportable
vegetables
production (X5)
0.152 2.845
(0.005) 0.351 0.015 1.50
Extension
contact (X16) 0.153
1.979
(0.0449) 0.359 0.008 0.80
Total 0.359 35.9
Multiple R = 0.612
R-square = 0.374
Adjusted R - square = 0.359
F-ratio = 24.242 at 0.000 level of significance
The remaining variables i.e. Age (X1), Education (X2), Family agricultural labour
(X3), Experience in vegetables cultivation (X4), Exportable vegetables cultivation
area (X6), Annual family income (X8), Exportable vegetables production and post-
harvest practices cost (X9), Credit received for exportable vegetables production
(X10), Training exposure on vegetables post-harvest practices (X11), Contact with
value chain actors (X12), Contract with value chain actors (X13), Depth of relationship
with value chain actors (X14) and Trust with value chain actors (X15) were not entered
into the regression equation.

151
Data presented in Table 6.2 indicated that the multiple R, R2 and adjusted R2 in the
step-wise multiple regression analysis were 0.612, 0.374 and 0.359 respectively, and
the corresponding F-ratio of 24.242 was significant at 0.000 level. The regression
equation so obtained is presented below:
Y = 21.876 + 0.233(X18) - 0.164(X19) + 0.150 (X17) +
0.161 (X7) + 0.152 (X5) + 0.153 (X16)
Adjusted R2 = 0.359
F-ratio = 24.242
Constant = 21.876
This indicated that the whole model of nineteen (19) variables explained 35.9 percent
of the total variation in effects of using selected post-harvest practices to strengthen
vegetable export market. But since the standardized regression coefficients (Beta
weight) of six (6) variables formed the equation and were significant, it might be
assumed that whatever contribution was there, it was due to these six (6) variables.
Set-II
Thirteen (13) independent variables (significant in Pearson product moment
correlation) were fitted together in this set of step-wise multiple regression with
effects of using selected post-harvest practices to strengthen vegetable export market
(Y) as the dependent variable. It was observed that out of thirteen (13) independent
variables only six (6) variables namely, Use of selected vegetables post-harvest
practices (X18), Problems faced in vegetable value chain (X19), Knowledge on
selected vegetable post-harvest practices (X17), Exportable vegetables production
(X7), Experience in exportable vegetables production (X5) and Extension contact
(X16) were entered into regression equation. This produce same result as Set-I.
The regression equation also found same as Set-I is presented below:
Y = 21.876 + 0.233(X18) - 0.164(X19) + 0.150 (X17) +
0.161 (X7) + 0.152 (X5) + 0.153 (X16)
Adjusted R2 = 0.359
F-ratio = 24.242
Constant = 21.876
This indicated that the whole model of thirteen (13) variables explained 35.9 percent
of the total variation in effects of using selected post-harvest practices to strengthen
vegetable export market. But since the standardized regression coefficients (Beta

152
weight) of six (6) variables formed the equation and were significant, it might be
assumed that whatever contribution was there, it was due to these six (6) variables.
Set-III
Only selected five (5) personal variables i.e. Age (X1), Education (X2), Family
agricultural labour (X3), Experience in vegetables cultivation (X4), Experience in
exportable vegetables production (X5) under this set were fitted together into step-
wise multiple regression as the independent variables with the effects of using
selected post-harvest practices to strengthen vegetable export market (Y) as the
dependent variable. It was observed that out of 5 independent variables only two (2)
variables namely, Experience in exportable vegetables production (X5) and
Experience in vegetables cultivation (X4) were entered into the regression equation.
The regression equation so obtained is presented below:
Y = 42.728 + 0.436 (X5) - 0.268 (X4) Adjusted R2 = 0.087
F-ratio = 12.871
Constant = 42.728
This indicated that the whole model of five (5) variables explained 8.7 percent of the
total variation in effects of using selected post-harvest practices to strengthen
vegetable export market. But since the standardized regression coefficients (Beta
weight) of two (2) variables formed the equation and were significant, it might be
assumed that whatever contribution was there, it was due to these 2 variables.
Set-IV
Only selected five (5) economical variables i.e. Exportable vegetables cultivation area
(X6), Exportable vegetables production (X7), Annual family income (X8), Exportable
vegetables production and post-harvest practices cost (X9), Credit received for
exportable vegetables production (X10) were fitted together as the independent
variables in this Set-IV of step-wise multiple regression with the effects of using
selected post-harvest practices to strengthen vegetable export market (Y) as the
dependent variable. It was observed that out of five(5) independent variables only 4
variables namely, Annual family income (X8), Credit received for exportable
vegetables production (X10), Exportable vegetables production (X7) and Exportable

153
vegetables production and post-harvest practices cost (X9) were entered into the
regression equation. The regression equation so obtained is presented below:
Y = 35.145+ 0.612 (X8) - 0.764 (X10) + 0.203 (X7) +
0.342 (X9)
Adjusted R2 = 0.145
F-ratio = 11.526
Constant = 35.145
This indicated that the whole model of five (5) variables explained 14.5 percent of the
total variation in effects of using selected post-harvest practices to strengthen
vegetable export market. But since the standardized regression coefficients (Beta
weight) of four (4) variables formed the equation and were significant, it might be
assumed that whatever contribution was there, it was due to these four (4) variables.
Set-V
Only selected 6 social variables i.e. Training exposure on vegetables post-harvest
practices (X11), Contact with value chain actors (X12), Contract with value chain
actors (X13), Depth of relationship with value chain actors (X14), Trust with value
chain actors (X15) and Extension contact (X16) were fitted together as the independent
variables in this Set-V of step-wise multiple regression with the effects of using
selected post-harvest practices to strengthen vegetable export market (Y) as the
dependent variable. It was observed that out of six (6) independent variables only
three (3) variables namely, Trust with value chain actors (X15), Extension contact
(X16) and Depth of relationship with value chain actors (X14) were entered into the
regression equation. The regression equation so obtained is presented below:
Y = 32.073 + 0.661 (X15) + 0.309 (X16) - 0. 434 (X14) Adjusted R2 = 0.249
F-ratio = 28.517
Constant = 32.073
This indicated that the whole model of 6 variables explained 24.9 percent of the total
variation in effects of using selected post-harvest practices to strengthen vegetable
export market. But since the standardized regression coefficients (Beta weight) of
three (3) variables formed the equation and were significant, it might be assumed that
whatever contribution was there, it was due to these three (3) variables.

154
Set-VI
Only selected three (3) professional variables i.e. Knowledge on selected vegetable
post-harvest practices (X17), Use of selected vegetables post-harvest practices (X18)
and Problems faced in vegetable value chain (X19) were fitted together as the
independent variables in this Set-VI of step-wise multiple regression with the effects
of using selected post-harvest practices to strengthen vegetable export market (Y) as
the dependent variable. It was observed that out of three (3) independent variables all
three (3) variables namely, Use of selected vegetables post-harvest practices (X18),
Problems faced in vegetable value chain (X19) and Knowledge on selected vegetable
post-harvest practices (X17) were entered into the regression equation. The regression
equation so obtained is presented below:
Y = 28.154 + 0. 269 (X18) - 0. 293 (X19) + 0. 169 (X17) Adjusted R2 = 0.320
F-ratio = 40.069
Constant = 28.154
This indicated that the whole model of three (3) variables explained 32 percent of the
total variation in effects of using selected post-harvest practices to strengthen
vegetable export market. But since the standardized regression coefficients (Beta
weight) of three (3) variables formed the equation and were significant, it might be
assumed that whatever contribution was there, it was due to these three (3) variables.
Set-VII (Final model)
After running above six sets of stepwise multiple regression analysis, it was found
that twelve (12) individual variables namely, Experience in vegetables cultivation
(X4), Experience in exportable vegetables production (X5), Exportable vegetables
production (X7), Annual family income (X8), Exportable vegetables production and
post-harvest practices cost (X9), Credit received for exportable vegetables production
(X10), Depth of relationship with value chain actors (X14), Trust with value chain
actors (X15), Extension contact (X16), Knowledge on selected vegetable post-harvest
practices (X17), Use of selected vegetables post-harvest practices (X18) and Problems
faced in vegetable value chain (X19) were significant in either one or more sets.
Attempt has been made to run stepwise multiple regression analysis by these twelve
(12) independent variables with the effects of using selected post-harvest practices to

155
strengthen vegetable export market (Y) as the dependent variable. Table 6.3 revealed
the summarized results of step-wise multiple regression analysis showing the
contribution of all the twelve (12) independent variables to the effects of using
selected post-harvest practices to strengthen vegetable export market. It was observed
that out of twelve (12) independent variables only six (6) variables namely, Use of
selected vegetables post-harvest practices (X18) Problems faced in vegetable value
chain (X19), Knowledge on selected vegetable post-harvest practices (X17),
Exportable vegetables production (X7), Experience in exportable vegetables
production (X5) and Extension contact (X16) were entered into regression equation. It
was also found that result of this set of stepwise multiple regression analysis was
exactly same as the result of set-I and set-II. The results of this model is again shown
in Table 6.3 and treated as the final model. The result of full model of stepwise
regression is shown in Appendix-VIII.
Table 6.3 Summary of stepwise multiple regression analysis showing the
contribution of all the twelve (12) independent variables to the
effects of using selected post-harvest practices to strengthen
vegetable export market
Variables
entered
Standardized
partial 'b'
coefficient
Value of 't'
(with
probability
level)
Adjusted
R2
Increase
in R2
Variation
explained
in
percent
Use of selected
vegetables post-harvest
practices (X18)
0.233 3.824
(0.000) 0.213 0.213 21.3
Problems faced in
vegetable value chain
(X19)
-0.164 -2.002
(0.046) 0.301 0.088 8.80
Knowledge on selected
vegetable post-harvest
practices (X17)
0.150 2.534
(0.012) 0.320 0.019 1.90
Exportable vegetables
production (X7) 0.161
3.094
(0.002) .336 0.016 1.60
Experience in
exportable vegetables
production (X5)
0.152 2.845
(0.005) 0.351 0.015 1.50
Extension contact (X16) 0.153
1.979
(0.049) 0.359 0.008 0.80
Total 0.359 35.9

156
Variables
entered
Standardized
partial 'b'
coefficient
Value of 't'
(with
probability
level)
Adjusted
R2
Increase
in R2
Variation
explained
in
percent
Multiple R = 0.612
R-square = 0.374
Adjusted R - square = 0.359
F-ratio = 24.242 at 0.000 level of significance
The remaining variables i.e. Experience in vegetables cultivation (X4), Annual family
income (X8), Exportable vegetables production and post-harvest practices cost (X9),
Credit received for exportable vegetables production (X10), Depth of relationship with
value chain actors (X14) and Trust with value chain actors (X15) were not entered into
the regression equation of set-VII. Another seven variables namely, Age (X1),
Education (X2), Family agricultural labour (X3), Exportable vegetables cultivation
area (X6), Training exposure on vegetables post-harvest practices (X11), Contact with
value chain actors (X12) and Contract with value chain actors (X13) were not entered
into regression equation of set-I and set-II.
Data presented in Table 6.3 indicated that the multiple R, R2 and adjusted R2 in the
step-wise multiple regression analysis were 0.612, 0.374 and 0.359 respectively, and
the corresponding F-ratio of 24.242 was significant at 0.000 level. The regression
equation so obtained is presented below:
Y = 21.876 + 0.233(X18) -0.164(X19) + 0.150 (X17) +
0.161 (X7) + 0.152 (X5) + 0.153 (X16)
Adjusted R2 = 0.359
F-ratio = 24.242
Constant = 21.876
This indicated that the whole model of nineteen (19) variables explained 35.9 percent
of the total variation in effects of using selected post-harvest practices to strengthen
vegetable export market. But since the standardized regression coefficients (Beta
weight) of six (6) variables formed the equation and were significant, it might be
assumed that whatever contribution was there, it was due to these six (6) variables.

157
Results of stepwise multiple regression analysis of this set again indicated that the
Use of selected vegetables post-harvest practices (X18) of the sample farmers was by
far the most important characteristic which strongly and positively influenced their
perceived effects of using selected post-harvest practices to strengthen vegetable
export market. Knowledge on selected vegetable post-harvest practices (X17),
Exportable vegetables production (X7) and Experience in exportable vegetables
production (X5) also had remarkable positive influence on effects of using selected
post-harvest practices to strengthen vegetable export market. Extension contact (X16)
had somewhat positive influence on the effects of using selected post-harvest
practices to strengthen vegetable export market. Problems faced in vegetable value
chain (X19) had negative influence on the effects of using selected post-harvest
practices to strengthen vegetable export market. Since the rest thirteen (13) variables
or characteristics of the farmers did not enter into the regression model, it was
inferred that these thirteen (13) characteristics either had multi-collinearity problem or
had minimum contribution to the total explained variation of 35.9 percent.
Analysis of data presented in different Tables (Table 6.2 and Table 6.3) and
regression equations indicated that in different combinations, standardized partial
regression co-efficient of six (6) independent variables were significant out of
nineteen (19) independent variables with the effects of using selected post-harvest
practices to strengthen vegetable export market. It was observed that regression co-
efficient between some of these six (6) independent variables and effects of using
selected post-harvest practices to strengthen vegetable export market as dependent
variable had different probability levels (0.000 to 0.049) in different sets. It could
logically happen due to the existence of interrelationship among the different
independent variables. Similar observations were experienced by different researchers
like Supe and Singh (1972), Pathak and Mazumdar (1978), Pathak (1981), Hossain
(1987), Karim et al. (1992) and Ali (2008). Result of set-I, set-II and Set-VII was
exactly same and the result of set-VII was treated as the final model which may
otherwise be considered as the best explanatory model.
On the basis of set-VII of stepwise regression analysis, contributions of significant six
(6) independent variables to effects of using selected post-harvest practices to

158
strengthen vegetable export market as the dependent variable are presented below in
order of importance.
Use of selected vegetables post-harvest practices (X18): The co-efficient of
correlation showed significant positive relationship between the use of selected
vegetables post-harvest practices (X18) of the farmers and their effects of using
selected post-harvest practices to strengthen vegetable export market (Appendix-IX).
Step-wise multiple regression analysis indicated that use of selected vegetables post-
harvest practices (X18) of the farmers had strong significant and positive contribution
to their perceived effects of using selected post-harvest practices to strengthen
vegetable export market.
Use of selected vegetables post-harvest practices (X18) was by far found to be the
most important positive contributor to the effects of using selected post-harvest
practices to strengthen vegetable export market. Use of selected vegetables post-
harvest practices (X18) of the farmers increases their positive perception on the effects
of using selected post-harvest practices to strengthen vegetable export market. From
the stepwise multiple regressions, it was concluded that use of selected vegetables
post-harvest practices (X18)of the farmers had first highest positive contribution to
their perceived effects of using selected post-harvest practices to strengthen vegetable
export market. This implies that with the increase of use of selected vegetables post-
harvest practices (X18) of the farmers will increase their positive perception on the
effects of using selected post-harvest practices to strengthen vegetable export market.
Problems faced in vegetable value chain (X19): Pearson product moment correlation
co-efficient revealed that Problems faced in vegetable value chain (X19) by the
farmers had significant but negative correlation with their perceived effects of using
selected post-harvest practices to strengthen vegetable export market (Appendix-IX).
Step-wise multiple regression analysis indicated that Problems faced in vegetable
value chain (X19) of the sample farmers was an important contributor and had
significant but negative contribution to their perceived effects of using selected post-
harvest practices to strengthen vegetable export market

159
Some farmers thought that there were some problems in vegetables post-harvest value
chain in Bangladesh. It is quite logical that the farmers who faced more problems in
vegetables post-harvest value chain were not satisfied on producing and exporting
vegetables in Bangladesh in a larger scale. This might be the reason for problems
faced in vegetable value chain (X19) having the negative contribution to their
perceived effects of using selected post-harvest practices to strengthen vegetable
export market.
Knowledge on selected vegetable post-harvest practices (X17): The co-efficient of
correlation also showed significant positive relationship between knowledge on
selected vegetables post-harvest practices (X17) of the farmers and their perceived
effects of using selected post-harvest practices to strengthen vegetable export market
(Appendix-IX).
Step-wise multiple regression analysis indicated that knowledge on selected vegetable
post-harvest practices (X17) of the farmers had significant and positive contribution to
their perceived effects of using selected post-harvest practices to strengthen vegetable
export market.
Knowledgeable person could understand the merits and demerits of anything easily in
a short time. By the motivational programme and training of BFVAPEA, GOs and
NGOs, the farmers could improve their knowledge on selected vegetable post-harvest
practices. Therefore, farmers having high knowledge on selected vegetable post-
harvest practices perceived high effects of using selected post-harvest practices to
strengthen vegetable export market. This was supported by the studies of Masram
(1999), Asaduzzaman (2002), Islam (2003), Rabbany (2003), Hamidi (2004) and Ali
(2008).
Exportable vegetables production (X7): Pearson product moment correlation co-
efficient revealed that exportable vegetables production (X7) of the farmers had
positive relationship with their perceived effects of using selected post-harvest
practices to strengthen vegetable export market (Appendix-IX).

160
Step-wise multiple regression analysis indicated that exportable vegetables production
(X7) of the farmers was an important significant positive contributor to their perceived
effects of using selected post-harvest practices to strengthen vegetable export market.
Exportable vegetables production (X7) increases the income of sample farmers to sell
good quality exportable vegetables to the buyers. Different agricultural advisory
service providing organizations of Bangladesh are providing various types of training
on good agricultural practices and suitable vegetable post-harvest practices in the
present study area including other areas of Bangladesh to their target people. As a
result, the farmers of Bangladesh are now capable to produce more export quality
vegetables by using selected post-harvest practices. This might be the reason for
exportable vegetables production (X7) of the farmers had positive contribution to their
perceived effects of using selected post-harvest practices to strengthen vegetable
export market.
Experience in exportable vegetables production (X5): Pearson product moment
correlation co-efficient revealed that experience in exportable vegetables production
(X5) of the farmers had positive significant relationship with their perceived effects of
using selected post-harvest practices to strengthen vegetable export market
(Appendix-IX).
Step-wise multiple regression analysis indicated that experience in exportable
vegetables production (X5) of the farmers had strong significant and positive
contribution to their perceived effects of using selected post-harvest practices to
strengthen vegetable export market.
Experienced person could understand the production process of vegetables production
easily in a short time. By the production of exportable vegetables using selected post-
harvest practices could improve their agricultural activities. Therefore, farmers having
high experience in exportable vegetables production could easily produce good
quality vegetables to attract and satisfy the buyers. This might be the reason for
experience in exportable vegetables production (X5) of the farmers had the positive
contribution to their perceived effects of using selected post-harvest practices to
strengthen vegetable export market.

161
Extension contact (X16): Pearson product moment correlation co-efficient revealed
that extension contact (X16) of the farmers had significant positive correlation with
their perceived effects of using selected post-harvest practices to strengthen vegetable
export market (Appendix-IX).
Step-wise multiple regression analysis indicated that extension contact (X16) of the
farmers was an important contributor and had significant but positive contribution to
their perceived effects of using selected post-harvest practices to strengthen vegetable
export market.
Actually mass farmers of the study area as well as Bangladesh were satisfied on
agricultural service providers including GOs and NGOs in Bangladesh. Different
agricultural extension service providing organizations, mass media and individuals are
working for dissemination of agricultural information like vegetables post-harvest
practices to the farmers. Local farmer group leaders, neighboring farmers and input
dealers are also providing necessary information to the farmers. Therefore, it may be
said that the farmers having greater extension contact with the local individual
sources, mass media, concerned GOs officials, NGOs and Associations officials
obviously had higher perceived effects of using selected post-harvest practices to
strengthen vegetable export market. This might be the reason for extension contact
(X16) of the farmers had the positive contribution to their perceived effects of using
selected post-harvest practices to strengthen vegetable export market. Hamidi (2004)
found a significant relationship between the communication exposure of the farmers
and their adoption of IPM practices in rice cultivation. Ali (2008) found a significant
relationship between the NGO contact of the farmers and their adoption of ecological
agricultural practices.
6.2 Direct and Indirect effects of the selected characteristics of the
farmers on their perceived effects of using selected post-harvest
practices to strengthen vegetable export market
In the present study Pearson product moment correlation test, full model linear
multiple regression and stepwise multiple regression were conducted. It is not
possible to find out the direct effects and indirect effects separately by these tests. But,
in path analysis, it is possible to get direct effects and indirect effects separately.

162
Path coefficient is simply a standardized partial regression coefficient and as such
measures the direct influence of one variable upon another and permits the separation
of the correlation coefficient into components of direct and indirect effects (Dewey
and Lu, 1959). This allows the reflection of direct effect of an independent variable
and its indirect effect through other variables on the dependent variable (Sasmal and
Chakrabarty, 1978).
Direct effect of an independent variable on the dependent variable is the standardized
beta co-efficient (value of ‘b’ of regression analysis) of the respective independent
variable. Whereas indirect effect of an independent variable through a channeled
variable is measured by the following formula:
e = Σ b x r
Where,
e = Total indirect effect of an independent variable
b = Direct effect of the Variable through which indirect effect is channeled
r = Correlation co-efficient between respective independent variable and variable
through which indirect effect is channeled.
Path coefficient analysis was employed in order to obtain clear understanding of the
direct and indirect effects of selected independent variables. Path analysis was done
involving the significant variables of step-wise multiple regression analysis. Path
coefficients showing the direct and indirect effects of significant 6 independent
variables of step-wise multiple regression analysis on the farmers’ perception on the
effects of using selected post-harvest practices to strengthen vegetable export market
have been presented in Table 6.4.
Analysis of data furnished in Table 6.3 indicated that among the independent
variables, Use of selected vegetables post-harvest practices (X18) of the farmers had
the highest direct effect (0.233) in the positive direction effect on their perception on
the effects of using selected post-harvest practices to strengthen vegetable export
market. Exportable vegetables production (X7), Extension contact (X16) and
Experience in exportable vegetables production (X5) had appreciable positive direct
effect in the positive direction on farmers’ perception on the effects of using selected

163
post-harvest practices to strengthen vegetable export market and their direct effect
were 0.161, 0.153 and 0.152 respectively. Knowledge on selected vegetables post-
harvest practices (X17) of the farmers had the lowest direct positive effect (0.150) to
their perception on the effects of using selected post-harvest practices to strengthen
vegetable export market. Problems faced in vegetable value chain (X19) had direct
negative effect (-0.164) on farmers' perception on the effects of using selected post-
harvest practices to strengthen vegetable export market.
Here, it may be mentioned that without path co-efficient analysis it is not possible to
know the indirect effects of an independent variable through other variables on the
dependent variable. Therefore, emphasis has been given on the indirect effects which
have been obtained from path co-efficient analysis (Table 6.4).
knowledge on selected vegetable post-harvest practices (X17) had the highest (0.248)
total indirect effect followed by extension contact (X16), use of selected vegetables
post-harvest practices (X18), experience in exportable vegetables production (X5) and
exportable vegetables production (X7) had appreciable total indirect effect while the
problems faced in vegetable value chain (X19) by the farmers had the negative total
indirect effect (-0.299) to their perception on the effects of using selected post-harvest
practices to strengthen vegetable export market.
Table 6.4 Path coefficients showing the direct and indirect effects of 6 significant
independent variables of stepwise multiple regression analysis on the
farmers’ effects of using selected post-harvest practices to strengthen
vegetable export market
Independent
variables
Variables through which indirect
effects are channeled
Indirect
effects
Total
indirect
effect
Direct
effect
Knowledge
on selected
vegetables
post-harvest
practices
(X17)
Use of selected vegetables post-harvest
practices (X18) 0.106
0.248
0.150
Problems faced in vegetables post-
harvest value chain (X19) 0.060
Extension contact (X16) 0.045
Experience in exportable vegetables
production (X5) 0.035
Exportable vegetables production (X7) 0.002

164
Independent
variables
Variables through which indirect
effects are channeled
Indirect
effects
Total
indirect
effect
Direct
effect
Extension
contact (X16)
Problems faced in vegetables post-
harvest value chain (X19) 0.123
0.234 0.153
Use of selected vegetables post-harvest
practices (X18) 0.058
Knowledge on selected vegetables
post-harvest practices (X17) 0.044
Exportable vegetables production (X7) 0.007
Experience in exportable vegetables
production (X5) 0.002
Use of
selected
vegetables
post-harvest
practices
(X18)
Knowledge on selected vegetables
post-harvest practices (X17) 0.068
0.231 0.233
Problems faced in vegetables post-
harvest value chain (X19) 0.066
Extension contact (X16) 0.038
Experience in exportable vegetables
production (X5) 0.033
Exportable vegetables pro 0.025
Experience in
exportable
vegetables
production
(X5)
Use of selected vegetables post-harvest
practices (X18) 0.051
0.091 0.152
Knowledge on selected vegetables
post-harvest practices (X17) 0.035
Problems faced in vegetables post-
harvest value chain (X19) 0.019
Extension contact (X16) 0.002
Exportable vegetables production (X7) -0.016
Exportable
vegetables
production
(X7)
Use of selected vegetables post-harvest
practices (X18) 0.036
0.049 0.161
Problems faced in vegetables post-
harvest value chain (X19) 0.019
Extension contact (X16) 0.007
Knowledge on selected vegetables
post-harvest practices (X17) 0.002
Experience in exportable vegetables
production (X5) -0.015
Problems
faced in
vegetables
post-harvest
value chain
(X19)
Experience in exportable vegetables
production (X5) -0.018
-0.299 -0.164
Exportable vegetables production (X7) -0.019
Knowledge on selected vegetables
post-harvest practices (X17) -0.055
Use of selected vegetables post-harvest
practices (X18) -0.094
Extension contact (X16) -0.114

165
On the basis of path analysis, the independent variables having indirect effects on
effects of using selected post-harvest practices to strengthen vegetable export market
have been presented below in descending order.
Knowledge on selected vegetable post-harvest practices (X17): Path analysis (Table
6.4) showed that knowledge on selected vegetable post-harvest practices (X17) of the
sample farmers had the highest total indirect effect (0.248) and a positive direct effect
of 0.150 on their perceived effects of using selected post-harvest practices to
strengthen vegetable export market.
The indirect effect was mostly channeled positively through use of selected
vegetables post-harvest practices (X18). The indirect effect of knowledge on selected
vegetables post-harvest practices (X17) was somewhat positively channeled through
problems faced in vegetables post-harvest value chain (X19), extension contact (X16)
and experience in exportable vegetables production (X5). There was negligible
indirect effect of knowledge on selected vegetables post-harvest practices (X17) of the
farmers on their perceived effects of using selected post-harvest practices to
strengthen vegetable export market through exportable vegetables production (X7).
It may be inferred that other variables remaining constant, knowledge on selected
vegetables post-harvest practices (X17) had an influence on the effects of using
selected post-harvest practices to strengthen vegetable export market and was a
determinant of the effects of using selected post-harvest practices to strengthen
vegetable export market.
Extension contact (X16): Path analysis (Table 6.4) showed that extension contact
(X16) of the sample farmers had the 2nd highest total indirect effect (0.234) and a
positive direct effect of 0.153 on their perceived effects of using selected post-harvest
practices to strengthen vegetable export market
The indirect effect was mostly channeled positively through problems faced in
vegetable value chain (X19). The indirect effect of extension contact (X16) was
somewhat positively channeled through use of selected vegetables post-harvest
practices (X18) and knowledge on selected vegetables post-harvest practices (X17).
There was negligible indirect effect of extension contact (X16) of the farmers on their
perceived effects of using selected post-harvest practices to strengthen vegetable

166
export market through exportable vegetables production (X7) and experience in
exportable vegetables production (X5).
It may be inferred that other variables remaining constant, extension contact (X16) had
an influence on the effects of using selected post-harvest practices to strengthen
vegetable export market and was a determinant of the effects of using selected post-
harvest practices to strengthen vegetable export market.
Use of selected vegetables post-harvest practices (X18): Path analysis (Table 6.4)
showed that use of selected vegetables post-harvest practices (X18) of the sample
farmers had the 3rd highest total indirect effect (0.231) and a positive direct effect of
0.233 on their perceived effects of using selected post-harvest practices to strengthen
vegetable export market.
The indirect effect was mostly channeled positively through knowledge on selected
vegetable post-harvest practices (X17) and problems faced in vegetable value chain
(X19).
The indirect effect of use of selected vegetables post-harvest practices (X18) of the
farmers on their effects of using selected post-harvest practices to strengthen
vegetable export market was somewhat positively channeled through extension
contact (X16), experience in exportable vegetables production (X5) and exportable
vegetables production (X7).
It may be inferred that other variables remaining constant, use of selected vegetables
post-harvest practices (X18) had an influence on the effects of using selected post-
harvest practices to strengthen vegetable export market and was a determinant of the
effects of using selected post-harvest practices to strengthen vegetable export market.
Experience in exportable vegetables production (X5): Path analysis (Table 6.4)
showed that experience in exportable vegetables production (X5) of the sample
farmers had the 4th total indirect effect (0.091) and a positive direct effect of 0.152 on
their perceived effects of using selected post-harvest practices to strengthen vegetable
export market.

167
The indirect effect was mostly channeled positively through use of selected
vegetables post-harvest practices (X18). The indirect effect of experience in exportable
vegetables production (X5) was somewhat positively channeled through knowledge
on selected vegetable post-harvest practices (X17) and problems faced in vegetable
value chain (X19). There was negligible indirect effect of experience in exportable
vegetables production (X5) of the farmers on their perceived effects of using selected
post-harvest practices to strengthen vegetable export market through extension
contact (X16) and exportable vegetables production (X7).
It may be inferred that other variables remaining constant, experience in exportable
vegetables production (X5) had an influence on the effects of using selected post-
harvest practices to strengthen vegetable export market and was a determinant of the
effects of using selected post-harvest practices to strengthen vegetable export market.
Exportable vegetables production (X7): Path analysis (Table 6.4) showed that
experience in exportable vegetables production (X5) of the sample farmers had the 5th
total indirect effect (0.049) and a positive direct effect of 0.161 on their perceived
effects of using selected post-harvest practices to strengthen vegetable export market.
The indirect effect was mostly channeled positively through use of selected
vegetables post-harvest practices (X18). The indirect effect of exportable vegetables
production (X7) was somewhat positively channeled through problems faced in
vegetable value chain (X19). There was negligible indirect effect of exportable
vegetables production (X7) of the farmers on their perceived effects of using selected
post-harvest practices to strengthen vegetable export market through extension
contact (X16), knowledge on selected vegetable post-harvest practices (X17) and
experience in exportable vegetables production (X5).
It may be inferred that other variables remaining constant, exportable vegetables
production (X7) had an influence on the effects of using selected post-harvest
practices to strengthen vegetable export market and was a determinant of the effects
of using selected post-harvest practices to strengthen vegetable export market.

168
Problems faced in vegetable value chain (X19): Path analysis (Table 6.4) showed
that problems faced in vegetable value chain (X19) of the sample farmers had a total
negative indirect effect (-0.299) and a negative direct effect of -0.164 on their
perceived effects of using selected post-harvest practices to strengthen vegetable
export market.
There were negligible indirect negative effect of problems faced in vegetable value
chain (X19) of the farmers on their effects of using selected post-harvest practices to
strengthen vegetable export market through experience in exportable vegetables
production (X5), exportable vegetables production (X7), knowledge on selected
vegetable post-harvest practices (X17), use of selected vegetables post-harvest
practices (X18) and extension contact (X16).
It may be inferred that other variables remaining constant, problems faced in
vegetable value chain (X19) had an influence on the effects of using selected post-
harvest practices to strengthen vegetable export market and was a determinant of the
effects of using selected post-harvest practices to strengthen vegetable export market.

169
CHAPTER 7
SUMMARY, CONCLUSIONS AND
RECOMMENDATIONS
7.1 Summary
7.1.1 Introduction
Postharvest practices referred to best practices and simple, low-cost technologies and
innovations to reduce losses, enhance quality and food safety, and increase
profitability of producers or farm enterprise. In Bangladesh Hortex Foundation,
Bangladesh Fruits, Vegetables & Allied Products Exporter’s Association
(BFVAPEA) are working with farmers, value chain actor to apply proper post-harvest
practices to reduce losses and get quality produces. In this study, these practiced was
considered as post-harvest practices of vegetables. It involves various steps such as
harvesting, field handling, packinghouse operations (such as pre-cooling, washing,
cleaning, wiping, drying, sorting, grading, treatment), packaging, storage, transport,
handling in markets and at home.
Reduction of post-harvest losses can increase food availability to the growing world
population, decrease the area needed for production, and conserve natural resources.
Strategies for loss prevention include: (1) use of genotypes that have longer post-
harvest-life; (2) use of integrated crop management systems and Good Agricultural
Practices that result in good keeping quality of the commodity; and (3) use of proper
post-harvest handling practices in order to maintain the quality and safety of fresh
produce.
Bangladesh has achieved a significant growth in exporting vegetables. Bangladesh is
the 3rd highest vegetable producing country in the world. The export volume of
vegetables of Bangladesh was 2,937.92 MT in the FY 2017-18 and earned 609.69
million BDT in FY 2017-18 (BBS, 2018c).The country exports vegetables to more
than 40 countries, though the expatriate Bangladeshis are the main consumers of our
170
exported vegetables. The growing trend in export suggests that Bangladesh has
significant potential to increase exports of vegetables to international markets.
7.1.2 Objectives of the study
The following specific objectives were formulated by the researcher for this study:
1. To describe some selected personal, economical, social and professional
characteristics of the farmers
2. To determine and describe the extent of effects of using selected post-
harvest practices to strengthen vegetable export market as perceived by the
farmers
3. To compare the item wise effects of using selected post-harvest practices
to strengthen vegetable export market
4. To compare the uses of selected post-harvest practices to strengthen
vegetable export market
5. To compare the severity of the problems faced by farmers for using
selected post-harvest practices to strengthen vegetable export market entire
vegetable value chain and to suggest for mitigating the problems
6. To explore the contribution of the selected characteristics of farmers to
their perceived effects of using selected post-harvest practices to
strengthen vegetable export market
7. To explore the effects of the selected characteristics of farmers on their
perceived effects of using selected post-harvest practices to strengthen
vegetable export market
7.1.3 Methodology
Three upazilas namely Belabo, Raipura and Shibpur of Narsingdi district were
selected purposively based on the intensity of BFVAPEA activity. A total of 717
farmers of the selected three upazilas of Narsingdi district are actively producing and
exporting Bitter Gourd, Brinjal and Teasel Gourd with the help of BFVAPEA. These
717 farmers was considered as the population of the study.
By using sample size calculation formula and sample size calculator, 250 respondents
founded the sample of the study. Proportionate random sampling technique was used
for selecting sample from farmers’ group formed by BFVAPEA in different villages

171
of different unions of three selected upazilas under Narsingdi district. Ten percent of
the population was selected through proportionate random sampling procedure to
include in the reserve list. Finally 250 farmers were included in the sample by taking
91, 75 and 84 farmers for Bitter Gourd, Brinjal and Teasel Gourd respectively. Data
were collected by the researcher himself through face to face interviewing of the
selected farmers by using Bengali interview schedule. The data were collected during
the period from August 01, 2019 to November 31, 2019.
The 19 selected characteristics of the farmers were considered as independent
variables of the study and these were (a) personal characteristics - age, education,
family agricultural labour, experience in vegetables cultivation, experience in
exportable vegetables production, (b) economical characteristics - exportable
vegetables cultivation area, exportable vegetables production, annual family income,
exportable vegetables production and post-harvest practices cost, credit received for
exportable vegetables produces, (c) social characteristics - training exposure on
vegetables post-harvest practices, contact with value chain actors, contract with value
chain actors, depth of relationship with value chain actors, trust with value chain
actors, extension contact and (d) professional characteristics - knowledge on selected
vegetables post-harvest practices, use of selected vegetables post-harvest practices
and problems faced in vegetable value chain. Effects of using selected post-harvest
practices to strengthen vegetable export market constituted the dependent variable of the
study.
IBM SPSS Statistics 24 was used for data analysis. Descriptive statistical measures
including number & percentage distribution, range, mean, standard deviation and co-
efficient of variance were used for describing both the independent and dependent
variables. Rank order was made whenever necessary. Tables were also used in
presenting data for clarity of understanding. Initially, Pearson Product Moment
correlation and Full model regression analysis was also done. Due to misleading
results from multi-collinearity, stepwise multiple regression was used to find out the
contribution of the independent variables to the dependent variable. Finally, path
analysis was done to find out the direct and indirect effects of the independent
variables separately on the dependent variable. Five percent (0.05) level of probability
was used as the basis for rejection of any null hypothesis throughout the study. Co-

172
efficient values significant at 0.05 level is indicated by one asterisk (*), and that at
0.01 level by two asterisks (**) and at 0.001 level or above by three asterisks (***). For
determining comparative effects of items, comparative use of post-harvest practices
items and severity of the problems, rank order were made based on the descending
order of the Effects Index (EI), Use Index (UI) and Problems Faced Index (PFI)
respectively.
7.1.4 Statement of hypotheses
The following null hypothesis formulated for testing the conceptual model of the
study was:
“There is no significant contribution/effect of the selected nineteen (19)
characteristics of the farmers to/on their perceived effects of using selected post-
harvest practices to strengthen vegetable export market”.
7.1.5 Characteristics profile of the farmers
Personal characteristics
Age: About two-third (64.80%) of the farmers were middle aged compared to 25.20
percent being young and 10 percent old.
Education: Highest proportion (37.20%) of the farmers had secondary level of
education, followed by 33.20 percent primary level, 20.40 percent higher secondary
level of education, 6.40 percent graduate level of education and rest 2.80 percent
respondents could sign his/her name only. These finding indicated that about cent
percent (97.20%) of the respondents were literate with primary to tertiary level of
education.
Family agricultural labour: Two-thirds (67.60%) had medium number of family
members engaged in agriculture farming, followed by 19.60 percent having small
number of family members and 12.80 percent had large number of family members
engaged in agriculture farming.
Experience in vegetables cultivation: Majority (77.20%) of the farmers had medium
farming experience in vegetables cultivation, followed by 15.60 percent having long
farming experience in vegetables cultivation and 7.20 percent had short farming
experience in vegetables cultivation. Findings again revealed that overwhelming

173
majority (84.40%) of the farmers had short to medium farming experience in
vegetables cultivation.
Experience in exportable vegetables cultivation: Two-thirds proportion (68.00%)
had medium experience in exportable vegetables cultivation, followed by 16.40
percent having short experience in exportable vegetables cultivation and 15.60
percent had long experience in exportable vegetables cultivation. Findings again
revealed that overwhelming majority (83.60%) of the farmers had medium to high
experience in exportable vegetables cultivation.
Economical characteristics
Exportable vegetables cultivation area: Highest proportion (82.00%) of the farmers
had medium exportable vegetables cultivation area, followed by 14.40 percent having
large exportable vegetables cultivation area and 3.60 percent had small exportable
vegetables cultivation area. Findings again revealed that overwhelming majority
(96.40 percent) of the farmers had medium to high exportable vegetables cultivation
area.
Exportable vegetables production Two-third (69.60%) of the farmers had medium
volume of exportable vegetables production, followed by 17.60 percent having large
volume of exportable vegetables production and 12.80 percent had small volume of
exportable vegetables production. Findings again revealed that overwhelming
majority (87.20%) of the farmers had medium to high volume of exportable
vegetables production.
Annual family income: The most (77.20%) of the farmers had medium income,
followed by 16.40 percent having high income and 6.40 percent had low income.
Findings again revealed that overwhelming majority (83.60%) of the farmers had low
to medium income.
Exportable vegetables production and post-harvest practices cost: Two-third
(66.80%) of the farmers had medium cost, followed by 16.80 percent having high cost
and 16.40 percent had low cost. Findings again revealed that overwhelming majority
(83.60 percent) of the farmers had medium to high cost for exportable vegetable
production and post-harvest practices cost.

174
Credit received for exportable vegetables production: About three-fourth
(74.80%) of the farmers received medium credit, followed by 16.00 percent high
credit and 9.20 percent low credit. Findings again revealed that overwhelming
majority (90.80%) of the farmers received medium to high amount of credit for
exportable vegetable production.
Social Characteristics
Training exposure on vegetables post-harvest practices: Two-third (68.80%) of the
farmers had medium training exposure, followed by 18.80 percent having high
training exposure and 12.40 percent had low training exposure on vegetable post-
harvest practices. Findings again revealed that overwhelming majority (87.60%) of
the farmers had medium to high training exposure on vegetable post-harvest practices.
Contact with value chain actors: Two-third (67.20%) of the farmers had medium
contact, followed by 20.00 percent having high contact and 12.80 percent had low
contact with the value chain actor. Findings again revealed that overwhelming
majority (87.20%) of the farmers had medium to high contact with value chain actors.
Contract with value chain actors: Most (71.20%) of the farmers had written
contract and 28.80 having Memorandum of Understanding (MOU) or formal Deed
with the value chain actors. It means that all the farmers were contracted with the
value chain actors either by written or by MOU or Deed.
Depth of relationship with value chain actors: Majority (71.20%) of the farmers
had medium relationship, followed by 16.40 percent having high relationship and
12.40 percent had low relationship with value chain actor. Findings again revealed
that overwhelming majority (87.60%) of the farmers had medium to high relationship
with value chain actors.
Trust with value chain actors: Most (80.00%) of the farmers had medium trust,
followed by 13.20 percent having low trust and 6.80 percent had high trust with value
chain actors. Findings again revealed that overwhelming majority (86.80%) of the
farmers had medium to high trust with value chain actor.
Extension contact: Majority (55.20%) of the farmers had medium extension contact,
followed by 31.60 percent having low extension contact and 13.20 percent had high

175
extension contact. Findings again revealed that two-third (68.40%) of the farmers had
medium to high extension contact.
Professional characteristics
Knowledge on selected vegetable post-harvest practices: Majority (79.20%) of the
farmers had medium knowledge, followed by 14.80 percent having low knowledge
and 6.00 percent had high knowledge on selected vegetable post-harvest practices.
Findings again revealed that overwhelming majority (85.20%) of the farmers had
medium to high knowledge on selected vegetable post-harvest practices.
Use of selected vegetables post-harvest practices: Nearly two-thirds (64.40%) of
the farmers had medium use, followed by 19.60 percent having low use and 16.00
percent had high use of selected vegetables post-harvest practices. Findings again
revealed that overwhelming majority (80.40 percent) of the farmers had medium to
high use.
Problems faced in vegetable value chain: Majority (84.00%) of the farmers had
medium problem on post-harvest practices in vegetable value chain compared to
10.40% and 5.60% having high and low problem on post-harvest practices in
vegetable value chain respectively. Data again revealed that majority (89.60%) of the
farmers had low to medium problems faced in post-harvest practices in vegetable
value chain.
7.1.6 Effects of using selected post-harvest practices to strengthen vegetable
export market
Extent of effects of using selected post-harvest practices: Overwhelming majority
(83.60%) of the farmers perceived that the use of selected post-harvest practices was
medium to high effective to strengthen vegetable export market. It clearly indicates
that adopted post-harvest practices aided to produce good quality vegetables for
exporting. It might be due to various post-harvest activities done by farmers in the
study area. Concerned GOs, NGOs and Associations also played an important role by
providing training to the farmers on vegetables post-harvest practices for producing
export quality vegetable.

176
Item wise comparative effects of using post-harvest practices: on the basis of
descending order of EI, it was observed that “Increase net income” ranked first and
“Facilitate good access to credit support” ranked lowest.
7.1.7 Item wise use of selected post-harvest practices of vegetables:
On the basis of descending order of UI, it was observed that “Sorting of vegetables”
ranked first and “Use hand gloves at harvesting time” ranked lowest.
7.1.8 Item wise comparative severity of the problem faced by the farmers in
vegetable value chain
On the basis of descending order of PFI, it was observed that, “Lack of fair
competition in the market price” ranked first and “No formal contract with value
chain actors” ranked lowest.
7.1.9 Contribution of the selected characteristics of the farmers to their
perceived effects of using selected post-harvest practices to strengthen
vegetable export market
Stepwise multiple regression showed that 6 independent variables combinedly
explained 35.9 percent of the total variation. Use of selected vegetables post-harvest
practices (X18) of the sample farmers was by far the most important characteristic
which strongly and positively influenced their perceived effects of using selected
post-harvest practices to strengthen vegetable export market. Knowledge on selected
vegetable post-harvest practices (X17), Exportable vegetables production (X7) and
Experience in exportable vegetables production (X5) also had remarkable positive
influence on effects. Extension contact (X16) had somewhat positive influence on the
effects. Problems faced in vegetable value chain (X19) had negative influence on the
effects of using selected post-harvest practices to strengthen vegetable export market.
Since the rest thirteen (13) variables or characteristics of the farmers did not enter into
the regression model, it was inferred that these thirteen (13) characteristics either had
multi-collinearity problem or had minimum contribution to the total explained
variation of 35.9 percent.

177
7.1.10 Direct and Indirect effects of the selected characteristics of the farmers on
their perceived effects of using selected post-harvest practices to
strengthen vegetable export market
Path coefficients showed the direct and indirect effects of significant variables on
their perceived effects of using selected post-harvest practices to strengthen vegetable
export market. Path analysis showed that knowledge on selected vegetable post-
harvest practices (X17) of the sample farmers had the highest total indirect effect
(0.248) on their perceived effects of using selected post-harvest practices to
strengthen vegetable export market. Extension contact (X16) of the sample farmers
had the 2nd highest total indirect effect (0.234). Use of selected vegetables post-
harvest practices (X18) of the sample farmers had the 3rd highest total indirect effect
(0.231) and a positive direct effect of 0.233 on their perceived effects. Experience in
exportable vegetables production (X5) of the sample farmers had the 4th total indirect
effect (0.091) on their perceived effects. Experience in exportable vegetables
production (X5) of the sample farmers had the 5th total indirect effect (0.049) on their
perceived effects. Problems faced in vegetable value chain (X19) of the sample
farmers had a total negative indirect effect (-0.299) on their perceived effects of using
selected post-harvest practices to strengthen vegetable export market.
7.2 Conclusions
Conclusion is the final decision or judgment, which is placed through contention at
the end or termination of a research work. On the basis of the findings, discussion and
logical interpretation, the following conclusions were drawn:
i. Overwhelming majority (83.60%) of the farmers perceived that the use of
selected post-harvest practices was medium to high effective to strengthen
vegetable export market. It clearly indicates that adopted post-harvest
practices aided to produce good quality vegetables for exporting. Various
activities is being done by the farmers in the study area on post-harvest
practices to strengthen vegetable export market. It is therefore, concluded that
there is scope to work for those who perceived lower effects of using selected
post-harvest practices to strengthen vegetable export market.
ii. The large majority (80.40%) of the farmers had medium to high use of
vegetables post-harvest practices. Findings indicated that use of selected

178
vegetables post-harvest practices of the farmers had strong significant and
positive contribution to their perceived effects of using selected post-harvest
practices to strengthen vegetable export market. It is therefore, concluded that
with the increased use of post-harvest practices, the farmers could increase
their positive perception on the effects of using selected post-harvest
practices to strengthen vegetable export market.
iii. Overwhelming majority (85.20%) of the farmers had medium to high
knowledge on selected vegetable post-harvest practices. Findings indicated
that knowledge on selected vegetable post-harvest practices of the farmers had
significant and positive contribution to their perceived effects of using selected
post-harvest practices to strengthen vegetable export market. Therefore, it may
be concluded that farmers having higher knowledge on selected vegetable
post-harvest practices perceived higher effects of using selected post-harvest
practices to strengthen vegetable export market.
iv. Overwhelming majority (87.20%) of the farmers had medium to high volume
of exportable vegetables production. Findings indicated that exportable
vegetables production of the farmers was an important significant positive
contributor to their perceived effects of using selected post-harvest practices in
strengthening vegetable export market. So, it may be concluded that, the
farmers of Bangladesh are now capable to produce more export quality
vegetables by using selected post-harvest practices. Increase of volume of
export quality vegetables may increase their positive perception on the effects
of using selected post-harvest practices to strengthen vegetable export market.
v. Overwhelming majority (83.60%) of the farmers had medium to high
experience in exportable vegetables production. There existed a positive
significant contribution of the farmers experience in exportable vegetable
production and their perceived effects of using selected post-harvest practices
to produce quality vegetables. Therefore, it may be concluded that the
perceived effects of using selected post-harvest practices to strengthen
vegetable export market was higher to the farmers who are experienced in
exportable vegetable production.

179
vi. Two-thirds (68.40%) of the farmers had medium to high extension contact.
Findings indicated that extension contact of the farmers had significant
positive contribution to their perceived effects of using selected post-harvest
practices to strengthen vegetable export market. So, it may be concluded that
if the farmers come in more contact with extension service providers, mass
media, they could be more aware to the use selected post-harvest practices to
produce export quality vegetables.
vii. Overwhelming majority (89.60%) of the farmers faced low to medium
problems in post-harvest practices in vegetable value chain. Problems faced in
vegetable value chain by the farmers had negative contribution to their
perceived effects of using selected post-harvest practices to strengthen
vegetable export market. It is therefore, logically concluded that mitigation of
problems of farmers can increase their perceived effects of using selected
post-harvest practices to strengthen vegetable export market.
7.3 Recommendations
7.3.1 Recommendations for policy implication
i. Overwhelming majority (83.60%) of the farmers perceived that the use of
selected post-harvest practices was medium to high effective to strengthen
vegetable export market. Since, nearly 16 percent of the farmers had still
perceived low effects, there is yet to be done much activities in this regard
to make the use of selected post-harvest practices to strengthen vegetable
export market more effectively. It may be therefore, recommended that
concerned GOs and extension service providers should take initiatives for
extension activities related to post-harvest practices, market linkage among
value chain actors especially exporters with farmers, so that farmers could
increase export quality vegetables and increase their income by exporting
vegetables. It could be done through use of post-harvest practices in
producing export quality vegetables.
ii. Use of post-harvest practices of the farmers had positive significant
contribution to their perceived effects of using selected post-harvest
practices to strengthen vegetable export market. Therefore, it may be
recommended that the extension service providers should take initiative to

180
promote the use of modern tools for vegetable harvest, determine
appropriate harvesting time and maturity stage of vegetables to reduce post-
harvest losses during transportation, introduce low cost post-harvest
treatment to reduce losses and ensure better quality of vegetables, create
awareness regarding sorting, proper grading and packing of vegetables.
Provide refer van during transporting vegetables at low cost or through
forming farmers group. To meet up demand for good quality vegetables in
both domestic and export markets, concerned GOs need to develop crop
specific cold chains for vegetables.
iii. Knowledge on selected post-harvest practices of the farmers had significant
positive contribution to their perceived effects of using selected post-
harvest practices to strengthen vegetable export market. Knowledgeable
person could understand the benefits of using selected post-harvest
practices easily in a short time and by the training programme. Therefore, it
may be recommended that the concerned authorities (extension service
providers) should arrange training programme on post-harvest technology
for their target people so that they could improve their knowledge on post-
harvest practices to strengthen vegetable export market.
iv. There existed a positive significant contribution of the farmers’ exportable
vegetable production to their perceived effects of using selected post-
harvest practices to strengthen vegetable export market. Production volume
of vegetables is increased when reduce of wastage of vegetables is possible.
To reduce postharvest loss and to maintain quality and safety of fruits and
vegetables both for domestic and export purposes, a comprehensive policy
for postharvest practices of vegetables is urgently needed. So it is
recommended that that concerned GOs need to develop low cost cold chain
management, facilitate infrastructure development such as established pack
house or shady place near farmers field to do post-harvest activities by the
farmers easily.
v. Experience in exportable vegetables production of the farmers had
significant contribution to their perceived effects of using selected post-
harvest practices to strengthen vegetable export market. that So, it is
181
strongly recommended adequate technical support, motivational campaign
and training facilities should be extended to the young and low
experienced farmers so that they could perform better farming activities by
using proper post-harvest practice to produce export quality vegetables.
vi. Extension contact of the farmers had significant positive contribution to
their perceived effects of using selected post-harvest practices to strengthen
vegetable export market. Therefore, it may be recommended that national
and local motivational campaign including training and technical support
should be provided by the concerned extension service providers like
Department of Agricultural Extension (DAE), concerned GOs, NGOs and
private extension providers to strengthen their extension delivery
mechanism in connection with vegetable post-harvest practices in a larger
scale.
viii. Farmers are have been facing various problems in using post-harvest
practices in vegetable value chain. It has negative contribution to their
perceived effects of using selected post-harvest practices to strengthen
vegetable export market. Therefore, it may be recommended that, necessary
steps should be taken by extension service providers to mitigate these
problems so that farmers can improve post-harvest activities which in turn
make their perceived effects of using selected post-harvest practices for
production of export quality vegetables.
7.3.2 Recommendations for future study
On the basis of scope and limitations of the present study and the observations made
by the researcher, the following recommendations have been made for further study:
i. This study was conducted in selected three upazilas namely Belabo, Raipura
and Shibpur of Narsingdi districts of Bangladesh, It is recommended that
such studies should be conducted in other areas of Bangladesh.
ii. Factors of the farmers were many and varied, but in the present study only
19 factors on personal, economical, social and professional aspects were
taken into consideration. Obviously, there are other variables which cause
variations in the effects of using selected post-harvest practices to

182
strengthen vegetable export market. Further research should be conducted
involving other variables.
iii. There were many and vast subject-matter areas of post-harvest but in the
present study, post-harvest practices related to only vegetables was
considered. Further research is needed in connection with effects of using
selected post-harvest practices related to fruits, flower, spices etc.
iv. There were many effects of using selected post-harvest practices to
strengthen vegetable export market, but only 18 effects items were
considered for this study. Further research is needed to determine the effects
of using selected post-harvest practices to strengthen vegetable export
market of other effects items.
v. This study identified the social, economical, psychological, technical and
marketing problems of vegetable value chain. Further research is needed to
identify other problems of vegetable value chain.
vi. This study identified the problems of selected post-harvest practices only.
Further research is needed to identify and solve other problems of post-
harvest practices by promoting GOs, NGOs and private extension providers
separately.
7.4 Message from the study
Use of selected post-harvest practices was effective to strengthen vegetable
export market. To make it more effective, training should be provided to the farmers
related to post-harvest practices. Vegetable-specific guidelines or training manual
should be prepared for production export quality vegetables. Vegetable-specific cool
chain should be developed or established for exporting vegetables. Shady place or
pack house need to establish through concerned GOs or Public Private Partnership
near to farmers’ field to do post-harvest activities by the farmers. This can be
effective to reduce post-harvest loss as well as produce good quality and safe
vegetable to strengthen vegetable export market.

183
REFERENCES
Acedo Jr, A. L., M. A. Rahman., B. Buntong and D. M. Gautam. 2016. Vegetable
Postharvest Training Manual. World Vegetable Center, Taiwan.
Abimbola, O. A. 2014. Post-harvest losses and welfare of tomato farmers in
Ogbomosho, Osun state, Nigeria,” Journal of Stored Products and Postharvest
Research, vol. 5, no. 2, pp. 8–13.
Aderinto, A., A. Agbelemoge and O. M. Dada. 2017. Effectiveness of Extension
Service Delivery and Productivity of Cassava Farmers in Southwestern Nigeria,
The Journal of Agricultural Sciences Vol. 12, No. 1, January 2017. Pp 14-23
http://dx.doi.org/10.4038/jas.v12i1.8202
Afroz, F. 2014. Effectiveness of result demonstration program in the transfer of BRRI
dhan50. M.S. (Ag.Ext.Info.Sys.) Thesis, Department of Agricultural Extension
and Information System. Sher-e-Bangla Agricultural University, Dhaka,
Bangladesh.
Ahmed, A. R., M. A. A. Bhuiya., Z. A. Reza and M. Z. Hossain. 2004. Methods of
Statistics. S. Ahmed & Associates, Manikganj-1800.
Ahmed, D. 1992. Vegetable marketing system for domestic and export markets. In:
Vegetable Production and Marketing: Proceedings of the National Review and
Planning Workshop. ACRDC, Shanhua, Tainan, Taiwain, pp: 170-183.
Akbudak, B., N. Akbudak, V. Seniz, and A. Eris. 2012. Effect of preharvest harpin
and modified atmosphere packaging on quality of cherry tomato cultivars
‘Alona’ and ‘Cluster’. British Food Journal, vol. 114, no. 2, pp. 180–196.
Ali, M. S., M. N. Islam., M. M. Molla and M. Shams-ud-din. 2013. Assessment of
Postharvest Losses and Improvement of Post-harvest Practices of Major Fruits
and Vegetables of Bangladesh. Bangladesh Agriculture Research Council.
Dhaka.
Ali, M. S. 2008. Adoption of Selected Ecological Agricultural Practices by the
Farmers. Ph.D (Ag. Ext. Ed.) Thesis, Department of Agricultural Extension
Education, Bangladesh Agricultural University, Mymensingh.
Amin, M. R. 2004. Participation of Rural Women in Selected Aquaculture Activities.
M.S. (Ag. Ext. Ed.) Thesis, Dept. of Agricultural Extension Education,
Bangladesh Agricultural University, Mymensingh, Bangladesh.
Anandajayasekeram, P. and B. Gebremedhin. 2009. Integrating innovation systems
perspective and value chain analysis in agricultural research for development:
implications and challenges. Improving Productivity and Market Success
(IPMS) of Ethiopian farmers project working paper 16. ILRI (International
Livestock Research Institute), Nairobi, Kenya.

184
Anderson, L. and D. A. Krathwohl. 2001. A Taxonomy for Learning, Teaching and
Assessing: A Revision of Bloom’s Taxonomy of Educational Objectives. New
York: Longman.
Asaduzzaman, M. 2002. Adoption of selected homestead agricultural technologies by
the rural women in Madhupur upazilla under Tangail district. M. S. thesis,
Department of Agricultural Extension Education, Bangladesh Agricultural
University, Mymensingh.
Azad, J. 2013. Farmers’ Knowledge on Postharvest Practices of Vegetables. M.S.
(Ag. Ex. Ed.) Thesis, Dept. of Agricultural Extension & Education System,
Sher-e-Bangla Agricultural University, Dhaka, Bangladesh.
Babatola, L.A., D. O. Ojo and O. I. Lawal. 2008. Effect of storage conditions on
tomato (Lycopersicon esculentum Mili.) quality and shelf life. Journal of
Biological Sciences, vol. 8, no. 2, pp. 490–493.
Bachmann, J and R. Earles. 2000. Postharvest handling of fruits & vegetables.
ATTRA - Sustainable Agriculture Program, P.O. Box 3838, Butte, Montana
59702, United States.
Bammann, H. 2007. Participatory value chain analysis for improved farmer incomes,
employment opportunities and food security. Pacific Economic Bulletin, 22(3),
113-125.
Bangladesh Labour Act. 2006. The Bangladesh Labour Act, 2006. ACT NO. XLII OF
2006. Legislative and Parliamentary Affairs Division of the Ministry of Law,
Justice and Parliamentary Affairs, Government of the People's Republic of
Bangladesh.
BBS. 2018a. Statistical Yearbook Bangladesh (38th Edition). Bangladesh Bureau of
Statistics. Statistics & Informatics Division (SID), Ministry of Planning,
Government of the People's Republic of Bangladesh, www.bbs.gov.bd ISBN-
978-984-475-020-3
BBS. 2018b. Statistical Pocket Book. Bangladesh Bureau of Statistics. Statistics &
Informatics Division (SID), Ministry of Planning, Government of the People's
Republic of Bangladesh, www.bbs.gov.bd ISBN- ISBN-978-984-475-019-7
BBS. 2018c. Yearbook of Agricultural Statistics-2018 (30th Series). Bangladesh
Bureau of Statistics. Statistics & Informatics Division (SID), Ministry of
Planning, Government of the People's Republic of Bangladesh,
www.bbs.gov.bd
BCIP. 2010. Bangladesh Country Investment Plan: Sixth Five Year Plan FY2011 –
FY20 15 Accelerating Growth and Reducing Poverty Strategic Directions and
Policy Framework, General Economics Division, Planning Commission,
Ministry of Planning, The Government of the People’s Republic of Bangladesh,
pp: 130.

185
BDHS. 2015. Bangladesh Demographic and Health Survey 2014. National Institute of
Population Research and Training (NIPORT), Mitra Associates, Dhaka,
Bangladesh and Marco International, Maryland, USA.
BDHS. 2009. Bangladesh Demographic and Health Survey 2007. National Institute of
Population Research and Training (NIPORT), Mitra Associates, Dhaka,
Bangladesh and Marco International, Maryland, USA.
Bhuiyan, M. A. H. 2015. Price Variation in Vegetable Market: A Study on Effective
Supply Chain Management in Bangladesh, Masters in Procurement and Supply
Management Thesis, BRAC Institute of Governance and Development, BRAC
University.
Bloom, B. S. 1956. Taxonomy of Educational Objectives, Handbook I: The Cognitive
Domain. New York: David McKay Co Inc.
Bhattacharjee, L., S. K. Saha and B. K. Nandi. 2007. Food-Based Nutrition Strategies
In Bangladesh: Experience of Integrated Horticulture and Nutrition.
Department of Agricultural Extension and Ministry of Agriculture, GoB &
FAO. RAP Publication 2007/05. p. 27.
Brackett R. E. 1993. Microbiological spoilage and pathogens in minimally processed
refrigerated fruits and vegetables. In: Shewflet R.L and S.E. Prussia (ed.),
(1993). Postharvest handling: A systems approach. Academic Press Inc.
London.
Cantwell M. and S. Trevor. 2002. Recommendations for maintaining postharvest
Quality. Department of Vegetable Crops, University of California, Davis,
CA95616.
Choudhury, I. 1998. A study of farmers’ attitude towards adoption of IPM programme
on paddy in West Bengal. Ph.D. dissertation, Department of Agricultural
Extension, Bidhan Chandra Krishi Viswavidyalaya, West Bengal, India.
Clottey, V. A., N. Karbo and K. Gyasi. 2009. The tomato industry in Northern Ghana:
production constraints and strategies to improve competitiveness. A Report
Article Published by: African Journal of Food, Agriculture, Nutrition and
Development, Vol 9, No 6.
Coombs, C. H. 1950. The Concepts of Reliability and Homogeneity. Journal of
Educational and Psychological Measurement, 10 (1):43-56.
Craig, R. 2000. Value Chain Management-Industry Trend and Event. ENT 2000 (Jan
12). Boucher Communication.
Creative Research System. 1984. Sample size calculator.
Cunningham, D. C. 2001. The distribution and extent of agri-food chain management
research in the public domain. Supply Chain Management: An International
Journal, 6(5), 212-215.

186
Dalen, B. V. D. 1977. Understanding Educational Research. Third Eddition. New
York: McGraw-Hill Book Company, Inc.
De lucia, M. and O. Assemato. 1994. Agricultural Engineering in Development of
Post-harvest Operations and Management of Food Grains.
Dewey, D. R. and K. H. Lu. 1959. A Correlation of and Path Co-efficient Analysis of
Components of Crested Wheat Grass Seed Production. Agronomy Journal,
51:515-518.
Dhraief M. Z., S. Bedhiaf-Romdhania., B. Dhehibib., M. Oueslati-Zlaouia., O. Jebali
and S. B. Youssef. 2018. Factors Affecting the Adoption of Innovative
Technologies by Livestock Farmers in Arid Area of Tunisia. FARA Research
Report. Volume 3 (5): 22.
Diver S., G. Kuepper and H. Born. 1999. Organic Tomatoes Production, NCAT 1999.
Droper, N. K and H. Smith. 1981. Applied Regression Analysis. New York: John
Wiley and Sons Inc.
Emana, B. and M. Nigussie. 2011. Potato value chain analysis and development in
Ethiopia. The case of Tigray and SNNP regions. Consultancy report.
International Potato Centre (CIP) and USAID (United States Agency for
International Development), Addis Ababa.
EPB. 2017. Annual Report. Export Promotion Bureau. Government of the people’s
Republic of Bangladesh.
EPB. 2015. Annual Report. Export Promotion Bureau. Government of the people’s
Republic of Bangladesh.
Ezekiel, M. and K. A. Fox. 1959. Methods of Correlation and Regression Analysis.
Third Edition. New York. John Willey and Sons, Inc.
FAO. 2008. Food and Agriculture Organization. The World Vegetable Centre
Newsletter. www.avrdc.org.
FAO/WHO. 2003. Diet, nutrition and the prevention of chronic diseases. Report of a
Joint FAO/WHO Expert Consultation. WHO Technical Report Series 916.
Geneva, World Health Organization.
FAO. 1989. Prevention of Postharvest Food Losses: Fruits, Vegetables and Root
Crops. A Training Manual. Food and Agricultural Organizations of the United
Nations, Rome. 157p.
Faida, M. 2006. Chain empowerment: Supporting African farmers to develop
markets. Royal Tropical Institute, Amsterdam.
Ferreira, M. D., J. K. Brecht., S. A. Sargent and J. J. Aracena. 1994. Physiological
responses of strawberry to film wrapping and precooling methods. Proceedings
of the Florida State Horticultural Society, vol. 107, pp. 265–269.

187
Fredendall, L. D. and E. Hill. 2001. Basics of supply chain management. The St.
Lucie Press, Boca Raton, Florida, USA.
GED. 2015. Seventh Year Plan, FY2016-2020. Accelerating Growth, Empowering
Citizens. General Economics Division(GED), Bangladesh Planning
Commission, Government of the People’s Republic of Bangladesh, Sher-e-
Bangla Nagar, Dhaka -1207.
Goode, W. J and P. K. Hatt. 1952. Methods in Social Research. McGraw-Hill Book
Company, Inc., New York, USA.
Goode, C. V. 1945. Dictionary of Education. McGraw-Hill Book Company, Inc. New
York.
Gomez, M. I., C. B. Barrett., L. E. Buck., H. De Groote., S. Ferris., H. O. Gao and R.
Y. Yang.. 2011. Research principles for developing country food value chains.
Science, 332(6034), 1154-1155.
Hamidi, M. A. 2004. Adoption of integrated pest management practices in rice
cultivation by the farmers. Ph.D. dissertation, Department of Agricultural
Extension Education, Bangladesh Agricultural University, Mymensingh.
Hassan, M. K., B. L. D. Chowdhury and N. Akhter. 2011. Post-Harvest Loss
Assessment: A Study to Formulate Policy for Loss Reduction of Fruits and
Vegetables and Socioeconomic Uplift of the Stakeholders, Bangladesh
Agricultural University, Mymensingh, Bangladesh.
Hassan, M. K. 2010a. A guide to postharvest handling of fruits and vegetables,
Department of Horticulture Bangladesh Agricultural University, Mymensingh
2202, Bangladesh.
Hassan, M. K. 2010. Final report-postharvest loss assessment: a study to formulate
policy for loss reduction of fruits and brinjal and socio-economic uplift of the
stake holders (Funded by USAID and EC and Jointly Implemented by FAO and
FPMU of MoFDM).
Hassan, M. F., M. K. Hassan., M. F. Mondal and M. A. Islam. 2009a. Effects of
modified atmosphere and low temperature on physico-chemical changes and
shelf life of litchi. Journal of the Bangladesh Society for Agricultural Science
and Technology, 6 (1&2): 173-178.
Hassan, M. F., M. K. Hassan., M. F. Mondal and N. Akhther. 2009b. Shelf life
extension of litchi. Journal of the Bangladesh Society for Agricultural Science
and Technology, 6 (1&2): 179-184.
Hassan, M. K and W. A. Shipton. 2006a. Modified atmosphere packaging to control
postharvest spoilage of organic bananas. Journal of the Bangladesh Society for
Agricultural Science and Technology, 3 (1&2): 157-160.
Hassan, M. K. and W. A. Shipton. 2006. Storage of organic bananas. Journal of the
Bangladesh Society for Agricultural Science and Technology, 3 (1&2): 201-204.

188
Hassan, M. K., W. A. Shipton., R. Coventry and C. Gardiner. 2004. Extension of
banana shelf life. Australasian Plant Pathology (CSIRO Publication), 33(2):
305-308.
Hassan, M. K., M. F. Mondal and M. S. Hoque. 1998. Studies on the storage
behaviour of mango. Bangladesh Journal of Agricultural Sciences, 25(2): 311-
318.
Hasanullah, M. 1989. Performance Determinants of Extension Organization of
Bangladesh. Unpublished Ph.d Thesis, Institute of Business Administration, The
University of Dhaka. Dhaka, Bangladesh.
Herr, M. L and T. J. Muzira. 2009. Value chain development for decent work: A
guide for development practitioners, government and private sector initiatives.
Geneva, Switzerland: International Labour Office.
HIES. 2016. Bangladesh Household Income Expenditure Survey. Bangladesh Bureau
of Statistics. Statistics & Informatics Division (SID), Ministry of Planning,
Government of the People's Republic of Bangladesh, www.bbs.gov.bd ISBN-
ISBN-978-984-34-5983-1 Pp : 43-53.
Hodges, R.J., J.C Buzby and B. Bennett. 2011. Postharvest losses and waste in
developed and less developed countries: opportunities to improve resource use.
The Journal of Agricultural Science, 149(S1), 37-45.
Hofman, P. J., M. Jobin-Decor., G. F. Meiburg., A. J. Macnish and D. C. Joyce. 2001.
Ripening and quality responses of avocado, custard apple, mango and papaya
fruit to 1-methylcyclopropene. Australian Journal of Experimental Agriculture,
41, 567-572.
Hossain, M. D. 2000. A study on marketing of some winter vegetables produced in,
selected areas of Bangladesh. MS thesis. Dept. Hort., BAU, Mymensingh
Bangladesh, pp: 131.
Hossain, M. I. 1987. Regional agricultural productivity differences in Bangladesh.
Ph.D. dissertation, University of Dhaka.
Idah, P. A., E. S. A. Ajisegiri. and M. G. Yisa. 2007. Fruits and vegetables handling
and transportation in Nigeria. AU Journal of Technology, vol. 10, no. 3, pp.
175–183.
Islam, M. A. 2003. Farmers’ adoption of organic manures for maximizing rice
production. M. S. Thesis, Department of Agricultural Extension Education,
Bangladesh Agricultural University, Mymensingh.
Islam, M. S. 2006. Economics of Production and Export of Vegetables in Bangladesh.
PhD Thesis, School of Agricultural and Forest Sciences, University of Wales
Bangor, United Kingdom.

189
Islam, M. S. 2000. Farmers’ perception of the harmful effects of using agro-chemicals
in crop production with regard to environmental pollution. Ph.D. dissertation,
Department of Agricultural Extension Education, Bangladesh Agricultural
University, Mymensingh.
Ilyas, R. M., D. K. Banwet and R. Shankar. 2007. Value Chain Relationship: A
Strategy Matrix. Supply Chain Forum: An International Journal, 8 (1), 56-72.
Jiang, Y and D. C. Joyce. 2000. Effects of 1-methylcyclopropene alone and in
combination with polyethylene bags on the postharvest life of mango fruit.
Annals of Applied Biology, 137, 321-327.
Kader, A. A and R.S. Rolle. 2004. In the Role of Post-harvest Management in
Assuring the Quality and Safety of Horticultural Produce, FAO Food and
Agricultural Organizations of the United Nations, Rome.
Kader, A. A. 2002. Postharvest biology and technology: an overview. In: Postharvest
Technology of Horticultural Crops’ (A.A. Kader, Ed.). University of California
Agriculture and Natural Resources Publication 3311). pp. 39-48.
Kader, A. A. 1992. Post-harvest Technology of Horticultural Crops, (2nd ed.),
Publication No. 3311. Division of Agriculture and Natural Resources,
University of California, 6701, San Pablo Avenue, Oakland, California 94608-
1239, PP. 15-17.
Kader, A. A. 1986. Effects of postharvest handling procedures on tomato quality.
Acta Horticulturae, vol. 190, pp. 209–222.
Kaplinsky, R and M. Morris. 2001. A handbook for value chain research. Vol. 113.
Ottawa: International Development Research Centre.
Kaplinsky, R. 2000. Globalisation and unequalisation: What can be learned from
value chain analysis? Journal of Development Studies, 37(2), 117-146.
Karim, A. S. M. Z. and S. G. Mahboob. 1992. Factors of job performance of the
Subject Matter Officers. Indian Journal of Extension Education. 28(1&2):8-14.
Kavin, M. M., R. L. Steven and S. J. Stephen. 2007. Evidence of varietal adoption to
organic farming systems. Field Crops Research, 102 (2007), 172 – 177.
Kerlinger, F. N. 1973. Foundations of Behavioural Research. 2nd ed. New York:
Holt, Rinehart and Winston, Inc.
Khan, M. S., M. H. Rahman and M. N. Uddin. 2017. Effectiveness of Agricultural
Information and Communication Center in Technology Transfer to the Farmers
in Bangladesh. Asian Journal of Agricultural Extension, Economics &
Sociology, 18(4): 1-11, 2017; Article no.AJAEES.34998, ISSN: 2320-7027.
Khatun, N. 2007. Effectiveness of agriculture related television programmes for
dissemination of agricultural information to the farmers. M.S. (Ag.Ext.Info.Sys.)

190
Thesis, Department of Agricultural Extension and Information System. Sher-e-
Bangla Agricultural University, Dhaka, Bangladesh.
Khandaker, S. R., Z. Bakht and G. B. Koolwal. 2009. The poverty impacts of rural
roads.Economic Development and Cultural Change, 57, 685-772.
Kitinoja, L and J. Gorny. 2009. Storage Practices and Structures. Postharvest
Technology for Fruit & Vegetable Produce Marketers. Chapter 7.Pp 1.1 – 20.6.
Kitinoja, L and A. A Kader. 2003. Small-scale Postharvest Handling Practices-A
Manual for Horticultural Crops (4rd Edition). University of California Davis,
California, USA.
Laufenberg, G., B. Kunz and M. Nystroem. 2003. Transformation of vegetable waste
into value added products; (A) the upgrading concept; (B) practical
implementations. Bioresource Technology, 87(2), 167-198.
Larsen, K., R. Kim and F. Theus. 2009. Agribusiness and innovation systems in
Africa: World Bank-free PDF.
Ledger, S. N. 2004. Control of postharvest diseases of mango. DPI Note. [Online]
(2003). Available:http://www.dpi.qld.gov.au/horticulture/5306.html [2004,
February 04].
Majydyan, R. 1996. Perception on the Effectiveness of Selected Communication
Media Used by the BAUEC Farmers. M.S (Ag. Ext. Ed.).Thesis. Department of
Agricultural Extension Education, Bangladesh Agricultural University,
Mymensingh.
Magray, M. M., K. Hussain., M. Aijaz., P. K. Singh and A. Nabi. 2017. Post-harvest
management of vegetable crops: Introduction Journal of Pharmacognosy and
Phytochemistry. 2017; 6(6): 182-185.
Masram, P. V. 1999. Knowledge and adoption of indigenous agricultural practices by
tribal farmers. Thesis Abstract. Haryana Agricultural University, India.
XXV(4):271.
Mazumder, M. S. U. 2014. Impact of Microfinance Program towards Rural
Livelihood and Empowerment in Bangladesh: A Comparative Study between
the Selected GO and NGO in the department of Agricultural Extension and
Economic, PhD Thesis, Zhejiang University, China.
Mehta, P. 1958. A study of communication of agricultural information and the extent
of distribution occurring from district to village level workers in selected
I.A.D.P. districts. Ph.D. dissertation, The University of Udaipur, Rajasthan,
India
Miller, C and L. Jones. 2010. Agricultural value chain finance: Tools and lessons.
Rome: Food and agriculture organization of the United Nations (FAO).
Practical Action Publishing Ltd., Schumacher Centre for Technology and
Development, Bourton on Dunsmore, Rugby, Warwickshire, CV23 9QZ, UK

191
Minten, B., A. Z. M. S. Alam., U. K. Deb., A. Z. Kabir., D. Laborde., M. Hasanullah,
and K. A. S. Murshed. 2010. Agricultural marketing, price stabilization, value
chains, and global/regional trade. Paper presented for the Bangladesh Food
Security Investment Forum, May 2010.
Mitchell, J., J. Keane and C. Coles. 2009. Trading up: How a value chain approach
can benefit the rural poor. Overseas Development Institute (ODI).
Mitchel F. G. and A. A. Kader. 1992. Post-harvest treatments for insect control. In:
Postharvest Technology of Horticultural Crops (Kader A. A., Ed.). University
of California, USA.
Moin, M. J. 2008. Empowerment of rural women through micro-credit programme
under shakti foundation. M.S. (Ag. Ex.) Thesis, Dept. of Agricultural
Extension & Education System, Sher-e-Bangla Agricultural University,
Dhaka, Bangladesh.
Mrema, C. G and S. R. Rolle. 2002. Status of the postharvest sector and its
contribution to agricultural development and economic growth. 9th JIRCAS
International symposium - Value addition to Agricultural Products, pp 13-20.
Muluken, M. 2014. Value Chain Analysis of Fruits for Debub Bench Woreda, Bench
Maji Zone, SNNPR. MSc Thesis, Mekelle University, Mekelle, Ethiopia.
Mutari, A. and R. Debbie. 2011. The effects of postharvest handling and storage
temperature on the quality and shelf of tomato. African Journal of Food
Science. 2011; 5(7):446-452.
Nasrin, T. A. A., M. M Molla., M. Hossean., A. Alamgir and M. S. Yasmin. 2008.
Effect of postharvest treatments on shelf life and quality of tomato. Bangladesh
J. Agril. Res. 2008; 33(3):579-585.
Nelson, G. C., M. W. Rosegrant, J. Koo et al. (2009). “Climate Change Impact on
Agriculture and Costs of Adaptation.”Food Policy Report. International Food
Policy Research Institute. Washington DC, USA.
NFP. 2008. Safe, Quality Food Supply, Area of Intervention 3.6, The National Food
Policy Plan of Action 2008-2015, Food Planning and Monitoring Unit (FPMU)
Ministry of Food, Government of the People’s Republic of Bangladesh. p. 37.
Ogawa, J. M and B. T. Manji. 1984. Control of postharvest diseases by chemical and
physical means. In: Pathology of Fruits and Vegetables: Postharvest Losses in
Perishable Crop (H.E. Moline, Ed.). US Department of Agriculture Publication
NE-87, USA. pp. 55-66.
Okunade, E. O. 2007. Effectiveness of extension teaching methods in acquiring
knowledge, skill and attitude by women farmers in Osun State. Journal of
Applied Sciences Research, 3(4): 282-286, 2007 © 2007, INSInet Publication.
Olympo, N. S and P. Kumah. 2009. Quality Control of Horticultural Crops, KNUST
IDL Kumasi, Ghana.

192
Oluwasusi, J. O. and Y. O. Akanni. 2014. Effectiveness of Extension Services Among
Food Crop Farmers in Ekiti State, Nigeria, Journal of Agricultural & Food
Information, 15:4, 324-341, DOI: 10.1080/10496505.2014.952175
http://dx.doi.org/10.1080/10496505.2014.952175
Osei-Asare, Y. B. 2009. Status of Organic Agriculture in Ghana: A Survey of
Consumers, Producers and Marketers. An FAO/GOAN/ MOFA Project on
Organic and Fair Trade Export from Africa.
Pabuayon, I. M., R. D. Cabahug., S. V. Castillo and M. D. Mendoza. 2009. Key
Actors, Prices and Value Shares in the Philippine Coconut Market Chains:
Implications for Poverty Reduction. International Society for Southeast Asian
Agricultural Sciences (ISSAAS) Journal, 15(1), 52-62.
Pathak, S. 1981. A multiple regression analysis of factors related with attitude of
farmers. Indian Journal of Extension Education. 17(3&4):73-80.
Pathak, S and A. K. Mazumdar. 1978. Multiple regression analysis of adoption
behaviour of jute farmers. Indian Journal of Extension Education. 14(3&4):45-
50.
Pietrobelli, C and F. Saliola. 2008. Power relationships along the value chain:
multinational firms, global buyers and performance of local suppliers.
Cambridge Journal of Economics, 32(6), 947-962.
Perry, N. C and W. B. Michael. 1951. The estimation of phi-coefficient for an entire
criterion group from a phi-coefficient calculated from the use of the extreme
tails of a normal distribution of criterion scores. Education Psychology
Management. 11:629-39.
Porter, M. E. 1985. Competitive advantage: Creating and sustaining superior
performance. New York: Free Press.
Prasad, P and A. Kochhar. 2014. Active packaging in food industry: a review. Journal
of Environmental Science, Toxicology and Food Technology, vol. 8, no. 5, pp.
1–7.
Prusky, D. 2011. Reduction of the incidence of postharvest quality losses, and future
prospects. Food Security, 3(4), 463-474.
Rabbany, G. 2003. Us Hodges e of integrated pest management practices by the
farmers in rice cultivation. M. S. thesis, Department of Agricultural Extension
Education, Bangladesh Agricultural University, Mymensingh.
Rahman, M. A., M. B. Rahman., M. Q. E. Ghani., M. Sattar and M. K. Saha. 2018.
Training module on improvement of value chain and marketing system of high
value crops through post-harvest management practices, Horticulture Export
Development Foundation, Ministry of agriculture, Dhaka 1207, Bangladesh.
Rahman, M. M. 2007. Effective Use of Extension Teaching Methods By The Sub
Assistant Agriculture Officer (SAAO) of DAE. M.S. (Ag.Ext.Info.Sys.) Thesis,

193
Department of Agricultural Extension and Information System. Sher-e-Bangla
Agricultural University, Dhaka, Bangladesh.
Rahman, S. M. 2015. Effectiveness of training programme on mushroom cultivattion
M.S. (Ag.Ext.Info.Sys.) Thesis, Department of Agricultural Extension and
Information System. Sher-e-Bangla Agricultural University, Dhaka,
Bangladesh.
Rehman, F. 2010. Development of a strategy to enhance the role of print media in the
dissemination of agricultural information among farmers’ in the Punjab,
Pakistan. Available at: http://prr.hec.gov.pk/Thesis/845S.pdf
Reid, M. S. 2002. Ethylene in postharvest technology. In: Postharvest Technology of
Horticultural Crops (A.A. Kader, Ed.). University of California Agriculture and
Natural Resources Publication 3311. pp. 149-162.
Reyes, M. U. 1988. Design, Concept and Operation of ASEAN Packinghouse
Equipment for Fruits and Vegetables. Postrharvest Horticulture Training and
Research Centre, University of Los Banos, College of Agriculture, Laguna, The
Philippines.
Robinson, J. Z. E. and L. S. Kolavalli. 2010. The Case of Tomato in Ghana:
Productivity. Working Paper # 19. Development and Strategy Governance
Division, IFPRI,Accra, Ghana: Ghana Strategy Support Program (GSSP) GSSP.
Pp: 1-9.
Ray, G. L and Mondal, S. 2011. Research Methods in Social Sciences and Extension
Education. Third Revised and Enlarged Edition. Kalyani Publishers, New Delhi,
India.
Ray, G. L. and S. P. Bora. 1991. Management Development for Farmers. New Delhi:
Mittal Publication.
Roy, D. 2013. Effectiveness of Farmer Field School for Soil and Crop Management.
M.S. Thesis. Department of Agricultural Extension Education, Bangladesh
Agricultural University, Mymensingh.
Roy, R. 2006. Effectiveness of mass media in adoption of rice production
technologies. M.S. (Ag.Ext.Info.Sys.) Thesis, Department of Agricultural
Extension and Information System. Sher-e-Bangla Agricultural University,
Dhaka, Bangladesh.
Sagar, R. L. 1983. Study of agro-economics, socio-psychological and extension
communication variables related with the farmers productivity of major field
crop in Haringhata block. Ph.D. dissertation, Department of Agricultural
Extension, Bidhanchandra Krishi Viswavidyalaya, West Bengal, India.
Salunkhe D. K and S. S. Kadam. 1998. Handbook of vegetable science and
technology: production, composition, storage, and processing. New York:
Marcel Dekker.

194
Sasmal, B. C. and K. Chakrabarty. 1978. Correlation and path co-efficient analysis of
yield component in mesta (Hibiscus cannabinus L.). Indian Journal of Heredity.
10(2): 19-26.
Sarma, P. K. and M. H. Ali. 2019. Value Chain Analysis of Tomato: A Case Study in
Jessore District of Bangladesh. International Journal of Science and Research
(IJSR). 8(2): 924-932. 10.21275/ART20194747.
Schmitz, H. 2005. Value chain analysis for policymakers and practitioners.
International Labour Office and Rockefeller Foundation, Geneva, Switzerland.
SDG. 2015. Transforming our World: The 2030 Agenda for Sustainable
Development, A/RES/70/1, United Nations, New York, United States of
America, www.sustainabledevelopment.un.org
Shahi, N.C., U. C. Lohani., K. Chand and A. Singh. 2012. Effect of pre-cooling
treatments on shelf life of tomato in ambient condition. International Journal of
Food, Agriculture and Veterinary Sciences, vol. 2, no. 3, pp. 50–56.
Shahidullah, A. K. M. 2007. The role of medicinal plants in livelihood improvement
and ecological sustainability in Bangladesh: An Application of a Participatory
Approach to Management and Marketing, Master of Natural Resources
Management (M.N.R.M.) Thesis, Faculty of Graduate Studies, Natural
Resources Institute, University of Manitoba, University of Manitoba, 70 Dysart
Road, Winnipeg, Manitoba, Canada, R3T 2N2.
Singh, A. K. 1981. Study of some agro-economic, socio-psychological and extension
communication variables related with the level of fertilizer use of the farmers.
Ph.D. dissertation, Department of Agricultural Extension, Bidhan Chandra
Krishi Viswavidyalaya, Kalyani, West Bengal, India.
Singh, O. P., P. K. Singh., H. P. Singh., R. Singh and K. R. Regmi. 2013. A Value
Chain Analysis of Vegetables: A Case Study of Palpa District, Nepal. Economic
Affairs, 58(2), 135-146.
Sumi, B. J. F. 2014. Study on Quality and Safety Issues in the Horticultural Marketing
Chains to Provide Nutritious Food in Bangladesh. M.Phil Thesis, Institute of
Nutrition and Food Science (INFS), University of Dhaka, Dhaka, Bangladesh.
Supe, S. V and S. N. Singh. 1972. A conceptual variable analysis of rational
behaviour of farmers. Indian Journal of Extension Education. 8(3&4):54-60.
Thar, S. P. 2016. .An exploratory value chain analysis for Burmese pickled tea
(LAPHET). Masters of Agri Commerce in Agribusiness, Institute of Agriculture
and Environment, Massey University, Palmerston North, New Zealand
Townsend, J. C. 1953. Introduction of Experimental Methods: International Student
Edition. New York: McGraw-Hill Book Company, Inc.
Trienekens, J. H. 2011. Agricultural value chains in developing countries: A
framework for analysis. International Food and Agribusiness Management
Review, 14(2), 51-82.

195
Tripathy, S. L. and L. R. Panday. 1967. Comparative Effectiveness of the Extension
Teaching Methods in a C.D. Block. Indian Journal of Extension Education,
16(1&2): 47-49.
Uddin, M. A. N. 2006. Effectiveness of World Vision agricultural development
activities in Gazipur. M.S. (Ag.Ext.Info.Sys.) Thesis, Department of
Agricultural Extension and Information System. Sher-e-Bangla Agricultural
University, Dhaka, Bangladesh.
USDA. 1994. Report and Recommendations on organic Farms (USDA study Team on
Organic Farming US Department of Agriculture, Washington DC, 1994.
Van den Berg, M., M. Boomsma., I. Cucco., L. Cuna., N. Janssen., P. Moustier., L.
Prota., T. Purcell., D. Smith and S.V. Wijk. 2009. Making value chains work
better for the poor: a toolbook for practitioners of value chain analysis. Making
markets work better for the poor (M4P) project, DFID, UK, Agricultural
Development International, Phnom, Penh, Cambodia.
Van den Berg, M. (2004). Making value chains work better for the poor: A toolbook
for practitioners of value chain analysis. Asian Development Bank.
Vergara, W. (2004). Responding to Climate Change: Proposed Action Plan for the
World Bank in Latin America, Latin America and Caribbean Region Sustainable
Development Working Paper 19. The World Bank. Washington, D.C.: WB.
Wilkinson, T. S. and P. L. Bhandarka. 1977. Methodology and Techniques of Social
Research, Bombay: Himalaya Publishing House. 79p.
Web 1: Postharvest training CDRom/Lisa Kitinoja\Postharvest org website
KITINOJA\ Harvesting and preparation for storage, 2008.
Web 2: Postharvest training CDRom/Lisa Kitinoja\Postharvest org website
KITINOJA\ Transport of fruits and vegetables, 2008.
Web 3: Postharvest training CDRom/Lisa Kitinoja\Postharvest org website
KITINOJA\ Storage of horticultural crops, 2008.
Weinberger K., C.A. II. Genova and Al. Jr. Acedo. 2009. Postharvest Training for
Supply Chain Actors in Cambodia, Laos, and Vietnam: Evaluation Report.
Shanhua, Taiwan: AVRDC – The World Vegetable Center.
Wills, R., B. McGlasson., D. Graham and D. Joyce. 2004. Postharvest: Introduction to
the Physiology and handling Fruits, Vegetables and Ornamentals (4th Edition).
University of New South Wales Press Ltd., Sydney 2052, Australia.
Wills, R. B. H., W.B McGlasson., D. Graham., T. H. Lee and E. G. Hall. 1998.
Postharvest: An Introduction to the Physiology and Handling of Fruits and
Vegetables. University of New South Wales Press Ltd., Kensington, Australia.

196
Wills, R. B. H., T. H. Lee., D. Graham., W. B. McGlasson and E. G. Hall. 1982.
Postharvest: An Introduction to the Physiology and Handling of Fruit and
Vegetables. 2nd.Ed. N.S.W. University Press Ltd., Kensington, Australia.
World Bank. 2005. Bangladesh growth and export competitiveness. Report 31394-
BD., Washington D.C.
World Bank. 2012. World Development Indicators 2012 (English). World
Development Indicators. Washington, DC: World Bank.
http://documents.worldbank.org/curated/en/553131468163740875/World-
development-indicators-2012.
World Resources Institute. 1998. Disappearing Food: How Big are Postharvest
Losses? EarthTrends.
Yamane, T. 1967. Elementary Sampling Theory. Prentice-Hall, Inc. Englewood
Cliffs, N.J.

197
APPENDICES
Appendix- I
Department of Agricultural Extension & Information System
Sher-e-Bangla Agricultural University, Dhaka – 1207
Interview schedule for farmer to conduct research on
“EFFECTS OF USING SELECTED POST-HARVEST PRACTICES TO
STRENGTHEN VEGETABLE EXPORT MARKET”
Sample No.
Name of farmer: Mobile phone #
Address:
Village……………………………………Union………………………………………
Thana……………………………………District……………………………………..
(Please provide following information. Your information will be kept confidential and will be
used for research purpose only)
A. Personal characteristics
1. Age
How old are you? ………………………… years.
2. Education
Please put tick mark (√) in the appropriate parenthesis or mention your level of education.
i) Can’t read and write ( )
ii) Can’t read and write but can sign only ( )
iii) I learnt reading and writing from adult learning center ( )
iv) I read upto class …………………………………
3. Family agricultural labor
Please mention the number of your family members engaged in vegetables production as
agricultural labor.
Sl. no. Age range of the family member Number of family member
1 Child (Below 14)
2 Adolescent (14 to 18)\
3 Adult (Above 18)
Total family member
4. Experience in vegetables cultivation
How many years you are producing vegetables? ……................................... (Years)
5. Experience in exportable vegetables production
How many years you are producing exportable vegetables? ......................... (Years)

198
B. Economical characteristics
6. Exportable vegetables cultivation area
Please furnish the following information about your vegetables cultivation area in this
year.
Sl. no. Name of vegetables Cultivation area
Local unit Hectare
1 Brinjal
2 Bitter Gourd
3 Teasle Gourd
Total
7. Exportable vegetables production
Please furnish the following information about your exportable vegetables production in
this year.
Sl. no. Name of vegetables Total production (Kg)
1 Brinjal
2 Bitter Gourd
3 Teasle Gourd
Total
8. Annual family income
Please mention your annual family income from vegetables production and others.
Sl. no. Sources of income Amount (BDT)
1 Brinjal
2 Bitter Gourd
3 Teasle Gourd
4 Income from other agricultural sources
5 Income from non-agricultural sources
Total income
9. Exportable vegetables production and post-harvest practices cost
Please give the following information about your vegetables produces cost in this year.
Sl.
no.
Name of the Items of cost Brinjal
(BDT)
Bitter Gourd
(BDT)
Teasle Gourd
(BDT)
a) Vegetable cultivation cost
1. Land lease
2. Seed and Seedling
3. Land preparation
4. Planting/Transplanting
5. Fertilizers Cow dung
Compost/ Vermi Compost
Khoil
USP
TSP
MP
Gypsum
Zink
Boron

199
Sl.
no.
Name of the Items of cost Brinjal
(BDT)
Bitter Gourd
(BDT)
Teasle Gourd
(BDT)
6. Pheromones, Spraying pesticide
7. Irrigation
8. Intercultural operation
9. Miscellaneous cost
a) Sub-total of vegetable cultivation cost
b) Post-harvest value chain cost
10. Harvesting
11. Washing
12. Drying & pre-cooling
13. Sorting
14. Grading
15. Processing/Treatment
16. Packaging
17. Transportation
18. Quality compliances cost
b) Sub-total of post-harvest value chain cost
Total vegetable produces cost =( a+b)
10. Credit received for exportable vegetables production
Please mention your financial source(s) from where you received credit for vegetables
production from different sources this year.
Sl. no. Source of finance Amount of BDT (‘000’ BDT)
1 Own
2 Relatives
3 Dadon/Mohajon(s)
5 Cooperative(s)
6 NGO(s)
7 Middlemen (Faria, Aratdar,Paiker etc)
8 Exporter(s)
9 Bank(s)
10 Others
Total
C. Social characteristics
11. Training on vegetables post-harvest practices
Did you receive any kind of agricultural training related to vegetable post-harvest
practices? Please put tick mark (√) in the appropriate parenthesis.
Yes ( ) No ( ).
If yes please furnish the following information -
Sl. no. Name of training course Duration
(days)
Conducting organization and
place
1
2
3
4
5
Total

200
12. Contact with value chain actors
Please mention your extent of contact with the following value chain actors.
Sl.
no.
Value chain
actors
Extent of contact
Always
(7)
Once
in a
day
(6)
Once
in a
week
(5)
Once in a
fortnight
(4)
Once
in a
month
(3)
Once in
a
quarter
(2)
Once
in a
year
(1)
No
contact
(0)
1 Agricultural
inputs dealer
2 Faria
3 Paiker/
Bepari
4 Aratdar
5 Wholesaler
6 Retailer
7 Superstore
8 Exporter
13. Contact with value chain actors
Please mention your contract with value chain actors by putting tick (√) in the appropriate
row.
Sl. no. Kinds of contract Answer
1 MOU/Deed
2 Written contract
3 Verbal contract
4 No contract
Total
14. Depth of relationship with value chain actors
Please mention your depth of relationship with the following value chain actors.
Sl.
no.
Value chain
actors
Depth of relationship
Very
high
(5)
High
(4)
Substantial
(3)
Little
(2)
Very
little
(1)
No
(0)
1 Agricultural inputs
dealer
2 Faria
3 Paiker/ Bepari
4 Aratdar
5 Wholesaler
6 Retailer
7 Superstore
8 Exporter

201
15. Trust with value chain actors
Please mention your level of trust with the following value chain actors.
Sl.
no.
Value chain
actors
Level of trust Very
high
(5)
High
(4)
Substantial
(3)
Little
(2)
Very
little
(1)
No
(0)
1 Agricultural inputs
dealer
2 Faria
3 Paiker/ Bepari
4 Aratdar
5 Wholesaler
6 Retailer
7 Superstore
8 Exporter
16. Extension contact
Please give the information about the extent of contact with the following different
communication media.
Sl.
no.
Different communication
media
Extent of extension contact
Regularly
(3)
Occasionally
(2)
Rare
(1)
Not at
all (0)
Personal communication exposure
1 With Neighbor farmers >4 times
/month
3-4 times
/month
1-2 times
/month
No
contact
2 With relatives engaged in
agricultural production
>4 times
/month
3-4 times
/month
1-2 times
/month
No
contact
3 Farmers’ group leaders >4 times
/month
3-4 times
/month
1-2 times
/month
No
contact
4 Agricultural input dealers
(seed, Fertilizer, Pesticides
etc)
>4 times
/quarter
3-4 times
/quarter
1-2 times
/quarter
No
contact
5 Use of call center to get
agricultural related
information
>4 times
/month
3-4 times
/month
1-2 times
/month
No
contact
6 Use of mobile apps to get
agricultural knowledge
>4 times
/month
3-4 times
/month
1-2 times
/month
No
contact
Extension GO officials
7 Sub Assistant Agriculture
Officer (SAAO)
>4 times
/quarter
3-4 times
/quarter
1-2 times
/quarter
No
contact
8 Agricultural Extension
Officer (AEO)
>4 times
/month
3-4 times
/month
1-2 times
/month
No
contact
9 Upazilla Agriculture
Officers (UAO)
>4 times /six
months
3-4 times /six
months
1-2 times
/six months
No
contact
10 District or above Level
Agricultural Officers
>4 times
/year
3-4 times /year 1-2 times
/year
No
contact
NGO/ Co-Operative Society/Association/Foundation officials
11 Unit level Agro based
NGO officials
>4 times
/quarter
3-4 times
/quarter
1-2 times
/quarter
No
contact
12 Upazila/ District Level
Agro based NGO officials
>4 times /six
months
3-4 times /six
months
1-2 times
/six months
No
contact

202
Sl.
no.
Different communication
media
Extent of extension contact
Regularly
(3)
Occasionally
(2)
Rare
(1)
Not at
all (0)
13 Central Agro based NGO
personnel
>4 times
/year
3-4 times /year 1-2 times
/year
No
contact
14 Unit level Agro based Co-
Operative Society/
Association/ Foundation
Officials
>4 times
/quarter
3-4 times
/quarter
1-2 times
/quarter
No
contact
15 Central Agro based Co-
Operative Society/
Association/Foundation
Officials
>4 times /six
months
3-4 times /six
months
1-2 times
/six months
No
contact
Group Communication
16 Focus group discussion
regarding agricultural
issues
>4 times
/year
3-4 times /year 1-2 times
/year
No
contact
17 Farmer’s field day >4 times
/life
3-4 times /life 1-2 times
/life
No
contact
18 Method demonstration of
agriculture
>4 times
/life
3-4 times /life 1-2 times
/life
No
contact
19 Result demonstration of
agriculture
>4 times
/life
3-4 times /life 1-2 times
/life
No
contact
Mass Media
20 Hearing agricultural
program on Radio
>4 times
/week
3-4 times
/week
1-2 times
/week
No
contact
21 Watching agricultural
program on Television
5-6 times
/week
3-4 times
/week
1-2 times
/week
No
contact
22 Agricultural features in
Daily newspapers / web
based news paper
>4 times
/week
3-4 times
/week
1-2 times
/week
No
contact
23 Agricultural issues based
Leaflet/folder
>4 times
/year
3-4 times /year 1-2 times
/year
No
contact
24 Agricultural magazines >4 times
/year
3-4 times /year 1-2 times
/year
No
contact
25 Agricultural Film show >4 times
/life
3-4 times /life 1-2 times
/life
No
contact
26 Agricultural fair >4 times
/life
3-4 times /life 1-2 times
/life
No
contact
D. Professional characteristics
17. Knowledge on selected vegetables post-harvest practices
Please answer the following questions by putting tick (√) mark.
Item
no.
Items of post-harvest knowledge test
Remembering
1 Which is the best time of harvesting?
□At Morning □ At Noon □ At Midnight
2 Which is the better stage to harvest Brinjal, Bitter Gourd and Teasle Gourd?
□ At younger and tender □ at yellowing □both of none
3 Which is the best stage of vegetable harvesting?
□ Optimum Maturity □ Over Maturity □ Both of None
4 Where you keep your harvested vegetable

203
Item
no.
Items of post-harvest knowledge test
□ At shady place □ Open , sunny place □ Both of None
Understanding
5 Why you don’t harvest Brinjal, Bitter Gourd and Teasle Gourd at over mature stage?
□ Over mature fruit are pithy, hard and may show yellowing. □ Over mature fruit are
soft, and never show yellowing □ Both of two
6 Why do you harvest vegetable carefully?
□ To minimize physical injury □ To preserve quality □ Both of two
7 Which activities will add value of your produces?
□ Proper use of post-harvest practices □ Post-harvest practices don’t need □ Both of
none
8 What will you do to produce safe food?
□ Don’t spray pesticide. Insecticide day before harvesting □ Spray pesticide,
insecticide just before harvesting □ Spray pesticide, insecticide day before harvesting
Applying
9 How do you harvest Brinjal, Bitter Gourd and Teasle Gourd?
□ By using sanitized clipper, shear or knife □ Don’t use sanitized clipper, shear or
knife □ Both of the above two
10 How do you remove infected, pest attacked, diseased and damage vegetables?
□ By sorting □ By Transporting □ By marketing
11 How do you grade your vegetables?
□ According to size, shape & color □ According to graders □ Both of the two
12 Which packaging is good while transporting?
□ Bamboo basket □ Plastic/wooden crates with inner cardboard □ Both of above two
Analyzing
13 Why farmers don’t show interest to use selected post-harvest practices?
□ Most of them have no pack house for doing post-harvest activities □ Need extra
time, money, labour □ Both of above two
14 Why washing is needed to get quality produces?
□ To remove adhering soil and other debris by washing □ Washing increases damaged
vegetable produces □ Washing add insect pest
15 Why farmers don’t get better price?
□ Farmers don’t do sorting and grading practices properly □ Farmers do sorting and
grading practices properly □ Both of above two
16 How underpack or over pack effects on quality produces while transporting your
vegetables?
□ Under pack causes more vibration damage □Over pack more compression damage □
Both of above two
Evaluating
17 What is the disadvantages of harvested vegetables keeping in sun or rain
□ Quality improve □ Quality Deteriorate □ Both of none
18 What is the merit of use of lining material for Brinjal and Bitter Gourd?
□ Post-harvest loss will be minimize □ Post-harvest Loss will be increase □ Decrease
market price
19 What is the disadvantaged if there is no pack house near field?
□ cleaning, pre-cooling, sorting, grading, pre-treatments, packing, storage and
dispatch to market activities is difficult to do □ Unsafe food □ Both of two
20 What is the benefit of use of selected post-harvest practices properly?
□ Lower market price □ Unsafe food □ Add value in entire value chain
Creating
21 How you can sanitize Brinjal vegetable
□ No washing □ Washing in 100-200 ppm chlorine for 1-3 minutes □ Washing more
than 200 ppm chlorine for more than 3 minutes

204
Item
no.
Items of post-harvest knowledge test
22 In case of non-refrigerated transport what will you do?
□ Use evaporative cooling system □ Use Modified Atmosphere packing □ Any of them
23 How you will avoid soil contact in packing house/ Under shade?
□ Use ground cover □ Use raised table □ Use any one of them
24 For better market price what will you do?
□ Modern packing □ No Packing □ No post- harvest activities
18. Use of selected vegetables post-harvest practices
Please mention your extent of use of selected post-harvest practices.
Sl.
no.
Item of selected post-harvest practices Extent of use
Regularly
(3)
Occasionally
(2)
Rarely
(1)
Not at all
(0)
1 Harvesting of vegetable according to
appropriate harvesting maturity
2 Harvesting vegetables at appropriate
harvesting time
3 Harvesting of vegetable with proper care
to minimize mechanical injury/ damage
4 Sterilized knife or instrument for
harvesting vegetables
5 Use hand gloves at harvesting time
6 Keeping harvested vegetables in a shady
place or pre-cooling
7 Proper washing of vegetables
8 Wiping or air drying of washed
vegetables at shady place
9 Sorting of vegetables
10 Grading of vegetable according to size,
shape and maturity or graders during
field handling
11 Proper packing of vegetables
12 Plastic crate with covering wet &
sanitized cloth
13 Line material for recommended
vegetable
14 Safe transportation on time
15 Cold chain for vegetable storage
Total
19. Problems faced in vegetable value chain
Please indicate the extent of problems faced by you in vegetable value chain and give
your suggestions to mitigate this problem.
Sl.
no.
Items of problem
Extent of problem faced Suggestions
to mitigate
the problem Severe
Problem
(3)
Moderate
problem
(2)
Less
problem
(1)
No
problem
(0)
A. Social problems
1 Absence of exportable vegetable farmers
association and support
2 Inadequate extension service to support
exportable vegetable production

205
Sl.
no.
Items of problem
Extent of problem faced Suggestions
to mitigate
the problem Severe
Problem
(3)
Moderate
problem
(2)
Less
problem
(1)
No
problem
(0)
3 Absence of group based farming practice
4 Difficult to make communication with
vegetable exporter
B. Technical problems
5 Unavailability of appropriate inputs for
exportable vegetable production
6 Lack of sufficient space for washing and
drying vegetables
7 Difficult to sorting & grading according
to exporters requirement
8 Absence of cool chain management
9 Insufficient packaging materials to meet up
exporters wish
10 Absence of sufficient laboratory for
quality test both inputs and exportable
vegetables
C. Environmental problem
11 Lack of weather information, early
message of weather forecasting
12 Increase Insect & Disease attack during
postharvest activities due to natural
hazards
D. Marketing problems
13 Lack of market information to the farmers
such as prices, flow of the product
14 Lack of knowledge about the demand in
the market
15 Poor linkage in the marketing channel
from farmgate to exporters
16 Lack of linkage between farmer and agro-
processing entrepreneurs
17 Lack of fair competition in the market
price
18 Poor and inadequate roads for
transportation for marketing
19 Lack of proper transport vehicle to
maintain cool chain
20 Lack of storage facilities
21 No formal contract with value chain actors
22 Uncertainty of transportation strike
23 Undesirable involvement of middlemen
E. Psychological problems
24 Pressure on time delivery to exporters
25 Pressure from Middleman to sell produces
at lower price
26 Depression on sale of lower graded
vegetables
20. Effects of using of selected post-harvest practices to strengthen vegetable export
market

206
Please mention the degree of effects of using selected vegetable post-harvest practices to
strengthen value chain of export market as perceived by you.
Sl.
no. Items of effects
Extent of effects
Highly
effective
( 3)
Moderately
effective
( 2)
Low
effective
( 1)
Not at all
effective
( 0)
1 Reduce wastage of vegetables
2 Value addition of vegetables at
different level of Post-harvest
practices
3 Quality vegetable produces
4 Increase market accessibility
5 Increase vegetable export quantity
6 Increase selling price of produced
vegetable
7 Increase net income
8 Free from contamination of any
hazardous objects
9 Increase shelf life of produces
10 Increase exporter’s demand for
export market
11 Strengthening good relationship with
value chain actors
12 Increase buyer satisfaction
13 Facilitate access to credit support
from Bank, NGO
14 Create employment for using
selected post-harvest practices
15 Rapport building with GO officials,
NGO personnel, Association
personnel
16 Capacity buildup towards good
agricultural practices (GAP)
17 Optimum water used in washing &
cleaning, which flow untreated into
adjacent water bodies is environment
friendly post-harvest practices
18 Elimination of adulteration &
harmful chemical during post-
harvest practices
Total
Thank you for your cooperation.
…………………………………………..
Signature of the Interviewer with date

207
Appendix- II
Letter to Judges for Judges’ Rating from Chairman, Advisory Committee of the
concerned PhD student
Department of Agricultural Extension & Information System
Sher-e-Bangla Agricultural University, Dhaka -1207
Tel. +88 02 -44814039
Ref: SAU/AEIS-19/114 Date: 24 March 2019
To
…………………………………………….............
…………………………………………………….
Subject: Determining appropriateness of selected items of four (4) variables
Sir
This is in connection with the study of one of my PhD student, Md. Julfiker Moin, Reg. No- 00993. He
has under taken a research study on “Effects of Using Selected Post-harvest Practices to Strengthen
Vegetable Export Market.”
This study requires suggestions from Judges for selection of items for measuring the following
variables of the interview schedule:
i) Effects of using of selected post-harvest practices to strengthen vegetable export market
ii) Knowledge on selected vegetables post-harvest practices
iii) Use of selected vegetables post-harvest practices
iv) Problems faced in vegetable value chain
I have the pleasure to inform you that you have been selected as one of the Judges for selecting and
rating appropriateness of the items of the above mentioned scales. You are requested to rate the
appropriateness of the items of the above mentioned scales ranging from ‘1 to 9’ where ‘1’ indicated
‘Less Appropriate’ and ‘9’ indicated ‘Most Appropriate’.
Please return these materials back at your earliest convenience after completing the work.
With personals regards
Sincerely yours,
(DR. MD. SEKENDER ALI)
Chairman, Advisory Committee of the concerned student
& Professor, Dept. of Agricultural Extension & Information System
Sher-e-Bangla Agricultural University, Dhaka-1207
Phone- +8801711230183, Email- [email protected]
Enclosed: Items of selected scales

208
Instructions for Judges’ Rating for following four (4) variables
The questions will be used for collecting data from the farmers. The Judges are
requested to just rate the items on the last column by mentioning ‘1 to 9’ where ‘1’
indicated ‘Less Appropriate’ and ‘9’ indicated ‘Most Appropriate’.
i). Effects of using of selected post-harvest practices to strengthen vegetable
export market
Please mention the extent of effects as perceived by you for using of selected post-
harvest practices to strengthen vegetable export market.
Sl.
no. Items of effects
Extent of effects Judges’
Rating
( 1 to 9)
Highly
effective
( 3)
Moderately
effective
( 2)
Low
effective
( 1)
Not at all
effective
( 0)
1 Reduce wastage of vegetables
2 Increase vegetable produces
3 Value addition of vegetables at
different level of Post-harvest practices
4 Quality vegetable produces
5 Increase market accessibility
6 Increase vegetable export
7 Increase selling price of produced
vegetable
8 Increase net income
9 Free from contamination of any
hazardous objects
10 Increase shelf life of produces
11 Increase exporter’s demand for foreign
market
12 Strengthening good relationship with
value chain actors
13 Increase buyer satisfaction
14 Facilitate good access to credit support
15 Employment generation for selected
post-harvest practices
16 Rapport building with government and
other stakeholders
17 Awareness buildup towards good
agricultural practices
18 Considerable amount of water used in
washing & cleaning, which flow
untreated into adjacent water bodies
has minimal environmental effects
19 Elimination of adulteration & harmful
chemical during post-harvest practices
Total

209
ii). Knowledge on selected vegetables post-harvest practices
Please answer the following questions by putting tick (√) mark. Item
No.
Items of post-harvest knowledge test Judges’ Rating
( 1 to 9)
Remembering
1.a Which is the best time for harvesting?
□At Morning □ At Noon □ At Midnight
1.b Which is better stage for harvesting Brinjal, Bitter Gourd?
□ At younger and tender □ at yellowing □both of none
1.c Which is the best stage of vegetable harvesting?
□ Optimum Maturity □ Over Maturity □ Both of None
1.d When do you harvest Brinjal & Bitter Gourd?
□ Within 10-14 days after flowering □ Before 10 days after flowering □ Both
of None
1.e Which is the optimum Temperature & RH of Brinjal storage?
□15°C & 90-95% RH □ 25°C & 70-80% RH □ -4°C 70-80 % RH
1.f Where do you keep your harvested vegetable?
□ At shady place □ Open , sunny place □ Both of None
Understanding
2.a What are the cause(s) of post-harvest losses?
□ Properly done post-harvest practices □ Not properly done post-harvest
practices □ Both of the above
2.b Why you don’t harvest Brinjal and bittergourd at over mature stage?
□ Over mature fruit are pithy, hard and may show yellowing. □ Over mature
fruit are soft, and never show yellowing □ Both of two
2.c Why do you harvest vegetable carefully?
□ To minimize physical injury □ To preserve quality □ Both of two
2.d How can you minimize damages of plant at harvesting time
□ Handpicking fruits with scissors □ Hand picking with knife □ Both of above
two
2.e Which activities will add vegetable production value?
□ Proper use of post-harvest practices □ Post-harvest practices don’t need □
Both of none
2.f What will you do to produce vegetable as safe food?
□ Don’t spray pesticide. Insecticide day before harvesting □ Spray pesticide,
insecticide just before harvesting □ Spray pesticide, insecticide day before
harvesting
Applying
3.a How do you harvest Brinjal and bitter gourd?
□ By using sanitized clipper, shear or knife □ Don’t use sanitized clipper,
shear or knife □ Both of the above two
3.b What you do to protect yourself from hairs or trichomes that may cause skin
burning or allergy?
□ Protective clothing should also be worn □ Don’t need to wore protective
cloths □ Both of the above two
3.c How do you remove infected, pest attacked, diseased and damage vegetables?
□ By sorting □ By Transporting □ By marketing
3.d How do you graded your vegetables?
□ According to size, shape & color □ According to graders □ Both of the two
3.e Which activities will add your vegetable value?
□ Proper use of post-harvest practices □ Post-harvest practices don’t need □
Both of none
3.f Which packaging is good while transporting?
□ Bamboo basket □ Plastic/wooden crates with inner cardboard □ Both of
above two

210
Item
No.
Items of post-harvest knowledge test Judges’ Rating
( 1 to 9)
Analyzing
4.a Why farmers don’t show interest to use selected post-harvest practices?
□ Most of them have no pack house for doing post-harvest activities □ Need
extra time, money, labour □ Both of above two
4.b Why washing is needed to get quality produces?
□ To remove adhering soil and other debris by washing □ Washing increases
damaged vegetable produces □ Washing add insect pest
4.c Why farmers don’t get better price?
□ Farmers don’t do sorting and grading practices properly □ Farmers do
sorting and grading practices properly □ Both of above two
4.d How does underpack or over pack effects on quality produces while
transporting your vegetables?
□ Under pack causes more vibration damage □Over pack more compression
damage □ Both of above two
4.e Why does transport is better two or more vegetables togetherly?
□ Minimize transporting cost □ Increase of transport cost □ Increase good
quality food
4.f How will you minimize losses during transport?
□ Use canopied truck with cover □Wooden separators between layers of
containers □ Both of above two
Evaluating
5.a What is the merit of avoid pulling of fruits from plant?
□ To prevent removal of stem □ To prevent damage of plant □ Both of above
two
5.b What is the disadvantages of harvested vegetables keeping in sun or rain?
□ Quality improve □ Quality Deteriorate □ Both of none
5.c What is the benefit of sorting & grading
□ Better price □ Lower price □ Both of none
5.d What is the merit of use of lining material for Brinjal and Bitter Gourd?
□Post-harvest loss will be minimize □ Post-harvest Loss will be increase □
Decrease market price
5.e What is the disadvantaged if there is no pack house near field?
□ cleaning, pre-cooling, sorting, grading, pre-treatments, packing, storage and
dispatch to market activities is difficult to do □ Unsafe food □ Both of two
5.f What is the benefit of use of selected post-harvest practices properly?
□ Lower market price □ Unsafe food □ Add value in entire value chain
Creating
6.a How you can sanitize Brinjal vegetable
□ No washing □ Washing in 100-200 ppm chlorine for 1-3 minutes □
Washing more than 200 ppm chlorine for more than 3 minutes
6.b In case of non-refrigerated transport what will you do?
□ Use evaporative cooling system □ Use Modified Atmosphere packing □
Any of them
6.c How will you avoid soil contact in packing house/ Under shade?
□ Use ground cover □ Use raised table □ Use any one of them
6.d What will you do for better market price?
□ Modern packing □ No Packing□ No post- harvest activities
6.e How do you reduce weight losses and increase shelf life of vegetables
□ Modified atmosphere packing (MAP) □ Normal packing □None of them
6.f How you satisfy or attract your buyer?
□ By using selected post-harvest practices properly □ No post- harvest
activities □ Any of them

211
iii). Use of selected vegetables post-harvest practices
Please mention your extent of use selected post-harvest practices of vegetables.
Sl.
no.
Item of selected
post-harvest practices
Extent of use Judges’ Rating
( 1 to 9) Regularly
(3)
Occasionally
(2)
Rarely
(1)
Not at all
(0)
1 Harvesting of vegetable
according to appropriate
harvesting maturity
2 Harvesting vegetables at
appropriate harvesting
time of the day
3 Harvesting of vegetable
with proper care to
minimize mechanical
injury/ damage
4 Sterilized knife or
instrument for harvesting
vegetables
5 Use hand gloves at
harvesting time
6 Keeping harvested
vegetables in a shady
place or pre-cooling
7 Proper washing of
vegetables
8 Wiping or air drying of
washed vegetables at
shady place
9 Sorting of vegetables
10 Grading of vegetable
according to size, shape
and maturity or graders
during field handling
11 Proper packing of
vegetables
12 Plastic crate with covering
wet & sanitized cloth
13 Line material for
recommended vegetable
14 Safe transportation on
time
15 Cold chain for vegetable
storage
Total

212
iv). Problems faced in vegetable value chain
Please indicate the extent of problems faced by you in vegetable value chain
process and give your suggestion to mitigate this problem
Sl.
No
Items of problem Extent of problem faced Suggestion
for
mitigate
this
problem
Judges’
Rating
( 1 to 9)
Large
Problem
(3)
Moderate
problem
(2)
Less
problem
(1)
No
problem
(0)
A. Social problems
1 Difficult to form a farmers group on
exportable vegetable produces
2 Absence of exportable vegetable
farmers association and support
3 Inadequate extension service to
support exportable vegetable
production
4 Absence of group based farming
practice
5 Difficult to make communication
with vegetable exporter
6 lack of backward-forward integration
from farmer to consumer
7 Lack of linkage between industry,
Government and Institution
B. Technical problems
8 Unavailability of appropriate inputs
for exportable vegetable production
9 High price of Inputs
10 Difficult to apply proper harvesting
method to minimize physical
damage of vegetable plant and fruit
11 Lack of sufficient space for
washing and drying vegetables
12 Difficult to sorting & grading
according to exporters requirement
13 Absence of cool chain management
14 Insufficient packaging materials to
meet up exporters wish
15 Absence of quality standard book,
materials, handouts etc.
16 Need additional time and labour for
post-harvest practices
17 Absence of laboratory for quality
test both inputs and exportable
vegetables
18 Absence of standard quality
certification agency
C. Environmental problem
19 Lack of weather information, early
message of weather forecasting
20 Unexpected post-harvest losses due
to sudden weather fluctuation
21 Decrease of quality vegetable
production due to natural calamity

213
Sl.
No
Items of problem Extent of problem faced Suggestion
for
mitigate
this
problem
Judges’
Rating
( 1 to 9)
Large
Problem (3)
Moderate
problem (2)
Less
problem (1)
No
problem (0)
at harvesting period
22 Insect & Disease attack during
postharvest activities
D. Marketing problems
23 Poor market system in agriculture
24 Lack of market information to the
farmers such as prices, flow of the
product, food processing unit etc.
25 Lack of knowledge about the
demand in the market
26 Lack of timely information
27 Lack of knowledge about the
intermediaries
28 Poor linkage in the marketing
channel from farmgate to exporters
because of small land sizing
farmers
29 Lack of linkage between farmer and
processing unit because of
unavailability of processing unit
30 Absence of market standard
31 Loosely connected with value chain
actors
32 Poor and inadequate roads for
transportation for marketing
33 Lack of proper transport vehicle to
maintain cool chain
34 Undesirable involvement of
middlemen/politician/police
35 Lack of storage facilities
36 No formal contract with value chain
actors
37 Lack of fair competition in the
market price
38 Transportation Strike
E. Psychological problems
39 Pressure on time delivery to
exporters
40 Criticism from relatives and
neighboring farmers to using
selected post-harvest practices
41 Harass from input dealers to get
input timely
42 Pressure from Middleman to sell
produces at lower price
43 Exporter blame regarding quality
issues though they produced quality
vegetable
44 Depression on sale of lower graded
vegetables

214
Appendix- III
Average Appropriateness Score (AASk) of the ith item of knowledge scale
Sl. No. of
Items
Total Score given by Judges’
(N=25) AASk of the ith item
1.a 191 7.64*
1.b 173 6.92*
1.c 176 7.04*
1.d 126 5.04*
1.e 127 5.08*
1.f 182 7.28*
2.a 128 5.12*
2.b 164 6.56*
2.c 172 6.88*
2.d 127 5.08*
2.e 174 6.96*
2.f 197 7.88*
3.a 176 7.04*
3.b 128 5.12*
3.c 173 6.92*
3.d 183 7.32*
3.e 130 5.20*
3.f 190 7.60*
4.a 198 7.92*
4.b 183 7.32*
4.c 177 7.08*
4.d 192 7.68*
4.e 131 5.24*
4.f 126 5.04*
5.a 129 5.16*
5.b 172 6.88*
5.c 129 5.16*
5.d 166 6.64*
5.e 179 7.16*
5.f 176 7.04*
6.a 184 7.36*
6.b 189 7.56*
6.c 178 7.12*
6.d 155 6.20*
6.e 127 5.08*
6.f 129 5.16*
* Items selected for the Difficulty Indices and Discrimination Indices

215
Appendix - IV
Difficulty Indices and Discrimination Indices of the 36 Items of Post-harvest
Knowledge Test
Sl.
No. of
Items
Frequencies of correct answers
given by each group of farmers
(each group containing 6
farmers)
Total
frequencies of
(N=36)
Difficulty
index (P)
Discrimination
Index (E1/3)
G1 G2 G3 G4 G5 G6
correct
answers
Wrong
answer
1.a 6 6 6 6 2 1 27 9 25.00 ⃰ 0.750 ⃰
1.b 4 4 6 6 2 0 22 14 38.89 ⃰ 0.500 ⃰
1.c 2 2 2 2 1 0 9 27 75.00 ⃰ 0.250
1.d 0 1 1 0 1 0 3 33 91.67 0.000
1.e 6 6 6 6 4 3 31 5 13.89 0.417
1.f 4 4 4 3 3 3 21 15 41.67 ⃰ 0.167 ⃰
2.a 2 1 1 0 0 0 4 32 88.89 0.250
2.b 6 6 4 2 4 3 25 11 30.56 ⃰ 0.417 ⃰
2.c 4 4 5 3 1 1 18 18 50.00 ⃰ 0.500 ⃰
2.d 0 1 0 0 0 0 1 35 97.22 0.083
2.e 3 2 0 0 1 0 6 30 83.33 ⃰ 0.333 ⃰
2.f 4 3 4 6 2 2 21 15 41.67 ⃰ 0.250 ⃰
3.a 4 4 1 1 0 0 10 26 72.22 ⃰ 0.667 ⃰
3.b 3 3 1 2 3 3 15 21 58.33 0.000
3.c 2 1 3 3 1 0 10 26 72.22 ⃰ 0.167 ⃰
3.d 6 5 6 6 4 3 30 6 16.67 ⃰ 0.333 ⃰
3.e 6 6 6 6 6 4 34 2 5.56 0.167
3.f 2 2 4 3 1 0 12 24 66.67 ⃰ 0.250 ⃰
4.a 6 6 4 5 3 4 28 8 22.22 ⃰ 0.417 ⃰
4.b 4 4 2 2 0 0 12 24 66.67 ⃰ 0.667 ⃰
4.c 5 3 4 2 2 0 16 20 55.56 ⃰ 0.500 ⃰
4.d 6 6 4 4 3 2 25 11 30.56 ⃰ 0.583 ⃰
4.e 3 3 3 3 3 3 18 18 50.00 0.000
4.f 6 6 6 4 6 6 34 2 5.56 0.000
5.a 6 6 6 6 4 3 31 5 13.89 0.417
5.b 5 4 0 0 0 0 9 27 75.00 ⃰ 0.750 ⃰
5.c 3 1 0 0 0 0 4 32 88.89 0.333
5.d 4 3 3 3 3 2 18 18 50.00 ⃰ 0.167 ⃰
5.e 4 4 4 4 2 1 19 17 47.22 ⃰ 0.417 ⃰
5.f 6 6 4 5 5 4 30 6 16.67 ⃰ 0.250 ⃰
6.a 6 6 3 3 4 5 27 9 25.00 ⃰ 0.250 ⃰
6.b 5 5 1 2 0 0 13 23 63.89 ⃰ 0.833 ⃰
6.c 5 4 4 4 2 2 21 15 41.67 ⃰ 0.417 ⃰
6.d 4 2 3 3 1 0 13 23 63.89 ⃰ 0.417 ⃰
6.e 6 6 6 6 4 3 31 5 13.89 0.417
6.f 0 1 1 0 1 0 3 33 91.67 0.000
Total 148 137 118 111 79 58
* Items selected for the study

216
Appendix - V
Average Appropriateness Score (AASu) of the ith item of use scale
Sl
No.
Item of selected
post-harvest practices
Total Score given
by Judges’
(N=25)
AASu of the ith
item
1 Harvesting of vegetable according
to appropriate harvesting maturity 213 8.52*
2 Harvesting vegetables at
appropriate harvesting time of the
day
190 7.60*
3 Harvesting of vegetable with proper
care to minimize mechanical injury/
damage
185 7.40*
4 Sterilized knife or instrument for
harvesting vegetables 174 6.96*
5 Use hand gloves at harvesting time 168 6.72*
6 Keeping harvested vegetables in a
shady place or pre-cooling 183 7.32*
7 Proper washing of vegetables 186 7.44*
8 Wiping or air drying of washed
vegetables at shady place 171 6.84*
9 Sorting of vegetables 211 8.44*
10 Grading of vegetable according to
size, shape and maturity or graders
during field handling
209 8.36*
11 Proper packing of vegetables 198 7.92*
12 Plastic crate with covering wet &
sanitized cloth 200 8.00*
13 Line material for recommended
vegetable 178 7.12*
14 Safe transportation on time 196 7.84*
15 Cold chain for vegetable storage 192 7.68*
* Items selected for the study

217
Appendix – VI
Average Appropriateness Score (AASp) of ith item of problem scale
Sl.
no.
Items of problem faced in vegetable value chain Total Score given
by Judges’
(N=25)
AASp of
the ith item
Social Problem
1 Difficult to form a farmers group on exportable
vegetable produces 109 4.36
2 Absence of exportable vegetable farmers
association and support 175 7.00*
3 Inadequate extension service to support exportable
vegetable production 179 7.16*
4 Absence of group based farming practice 233 9.32* 5 Difficult to make communication with vegetable
exporter 158 6.32*
6 lack of backward-forward integration from farmer
to consumer 106 4.24
7 Lack of linkage between industry, Government and
Institution 110 4.40
Technical problems
8 Unavailability of appropriate inputs for exportable
vegetable production 183 7.32*
9 High price of Inputs 107 4.28 10 Difficult to apply proper harvesting method to
minimize physical damage of vegetable plant and
fruit 108 4.32
11 Lack of sufficient space for washing and drying
vegetables 174 6.96*
12
Difficult to sorting & grading according to
exporters requirement 179 7.16*
13 Absence of cool chain management 194 7.76* 14 Insufficient packaging materials to meet up
exporters wish 183 7.32*
15 Absence of quality standard book, materials,
handouts etc. 106 4.24
16 Need additional time and labour for post-harvest
practices 102 4.08
17 Absence of laboratory for quality test both inputs
and exportable vegetables 175 7.00*
18 Absence of standard quality certification agency 105 4.20
Environmental problem
19 Lack of weather information, early message of
weather forecasting 185 7.40*
20 Unexpected post-harvest losses due to sudden
weather fluctuation 98 3.92
21 Decrease of quality vegetable production due to
natural calamity at harvesting period
91 3.64

218
Sl.
no.
Items of problem faced in vegetable value chain Total Score given
by Judges’
(N=25)
AASp of
the ith item
22 Insect & Disease attack during postharvest
activities due to natural hazards 175 7.00*
Marketing problems
23 Poor market system in agriculture 108 4.32 24 Lack of market information to the farmers such as
prices, flow of the product 188 7.52*
25 Lack of knowledge about the demand in the market 172 6.88* 26 Lack of timely information 107 4.28 27 Lack of knowledge about the intermediaries 103 4.12 28 Poor linkage in the marketing channel from
farmgate to exporters 189 7.56*
29 Lack of linkage between farmer and agro-
processing entrepreneurs 173 6.92*
30 Absence of market standard 104 4.16 31 Loosely connected with value chain actors 102 4.08 32 Poor and inadequate roads for transportation for
marketing 191 7.64*
33 Lack of proper transport vehicle to maintain cool
chain 197 7.88*
34 Undesirable involvement of
middlemen/politician/police 153 6.12*
35 Lack of storage facilities 207 8.28* 36 No formal contract with value chain actors 174 6.96*
37 Lack of fair competition in the market price 165 6.60* 38 Uncertainty of transportation strike 139 5.56*
Psychological problems
39 Pressure on time delivery to exporters 164 6.56* 40 Criticism from relatives and neighboring farmers
to using selected post-harvest practices 109 4.36
41 Harass from input dealers to get input timely 108 4.32 42 Pressure from Middleman to sell produces at lower
price 152 6.08*
43 Exporter blame regarding quality issues though
they produced quality vegetable 105 4.20
44 Depression on sale of lower graded vegetables 165 6.60*
* Items selected for the study

219
Appendix – VII
Average Appropriateness Score (AASe) of the ith item of effects scale
Sl.
no.
Items of effects Total Score given
by Judges’
(N=25)
AASe of
the ith
item
1 Reduce wastage of vegetables 198 7.92*
2 Increase vegetable produces 94 3.76
3 Value addition of vegetables at different level
of Post-harvest practices 205 8.20*
4 Quality vegetable produces 175 7.00*
5 Increase market accessibility 189 7.56*
6 Increase vegetable export 155 6.20*
7 Increase selling price of produced vegetable 161 6.44*
8 Increase net income 162 6.48*
9 Free from contamination of any hazardous
objects 174 6.96*
10 Increase shelf life of produces 197 7.88*
11 Increase exporter’s demand for foreign market 173 6.92*
12 Strengthening good relationship with value
chain actors 154 6.16*
13 Increase buyer satisfaction 159 6.36*
14 Facilitate good access to credit support 146 5.84*
15 Employment generation for selected post-
harvest practices 160 6.40*
16 Rapport building with government and other
stakeholders 152 6.08*
17 Awareness buildup towards good agricultural
practices 158 6.32*
18 Considerable amount of water used in washing
& cleaning, which flow untreated into adjacent
water bodies has minimal environmental effects
156 6.24*
19 Elimination of adulteration & harmful chemical
during post-harvest practices 183 7.32*
* Items selected for the study

220
Appendix – VIII
Result of Stepwise Regression
Variables Entered/Removeda
Model Variables Entered Variables
Removed
Method
1 Use of selected
vegetables post-
harvest practices
. Stepwise (Criteria: Probability-of-F-to-enter <= .050,
Probability-of-F-to-remove >= .100).
2 Problems faced
in vegetable
value chain
. Stepwise (Criteria: Probability-of-F-to-enter <= .050,
Probability-of-F-to-remove >= .100).
3 Knowledge on
selected
vegetable post-
harvest practices
. Stepwise (Criteria: Probability-of-F-to-enter <= .050,
Probability-of-F-to-remove >= .100).
4 Exportable
vegetables
production
. Stepwise (Criteria: Probability-of-F-to-enter <= .050,
Probability-of-F-to-remove >= .100).
5 Experience in
exportable
vegetables
production
. Stepwise (Criteria: Probability-of-F-to-enter <= .050,
Probability-of-F-to-remove >= .100).
6 Extension
contact
. Stepwise (Criteria: Probability-of-F-to-enter <= .050,
Probability-of-F-to-remove >= .100).
a. Dependent Variable: Effects of using selected post-harvest practices to strengthen vegetable
export market
Model Summary
Model R R Square Adjusted R Square Std. Error of the Estimate
1 0.464a 0.216 0.213 4.881
2 0.554b 0.307 0.301 4.598
3 0.573c 0.328 0.320 4.536
4 0.589d 0.346 0.336 4.483
5 0.604e 0.364 0.351 4.43
6 0.612f 0.374 0.359 4.404
a. Predictors: (Constant), Use of selected vegetables post-harvest practices
b. Predictors: (Constant), Use of selected vegetables post-harvest practices, Problems faced in vegetable value
chain
c. Predictors: (Constant), Use of selected vegetables post-harvest practices, Problems faced in vegetable value
chain, Knowledge on selected vegetable post-harvest practices
d. Predictors: (Constant), Use of selected vegetables post-harvest practices, Problems faced in vegetable value
chain, Knowledge on selected vegetable post-harvest practices, Exportable vegetables
production
e. Predictors: (Constant), Use of selected vegetables post-harvest practices, Problems faced in vegetable value
chain, Knowledge on selected vegetable post-harvest practices, Exportable vegetables
production, Experience in exportable vegetables production
f. Predictors: (Constant), Use of selected vegetables post-harvest practices, Problems faced in vegetable value
chain, Knowledge on selected vegetable post-harvest practices, Exportable vegetables
production, Experience in exportable vegetables production, Extension contact

221
ANOVAa
Model Sum of
Squares df Mean Square F Sig.
1
Regression 1624.806 1 1624.806 68.197 .000b
Residual 5908.638 248 23.825
Total 7533.444 249
2
Regression 2310.826 2 1155.413 54.644 .000c
Residual 5222.618 247 21.144
Total 7533.444 249
3
Regression 2472.831 3 824.277 40.069 .000d
Residual 5060.613 246 20.572
Total 7533.444 249
4
Regression 2609.681 4 652.42 32.464 .000e
Residual 4923.763 245 20.097
Total 7533.444 249
5
Regression 2744.842 5 548.968 27.972 .000f
Residual 4788.602 244 19.625
Total 7533.444 249
6
Regression 2820.787 6 470.131 24.242 .000g
Residual 4712.657 243 19.394
Total 7533.444 249
a. Dependent Variable: Effects of using selected post-harvest practices to strengthen
vegetable export market
b. Predictors: (Constant), Use of selected vegetables post-harvest practices
c. Predictors: (Constant), Use of selected vegetables post-harvest practices, Problems
faced in vegetable value chain
d. Predictors: (Constant), Use of selected vegetables post-harvest practices, Problems
faced in vegetable value chain, Knowledge on selected
vegetable post-harvest practices
e. Predictors: (Constant), Use of selected vegetables post-harvest practices, Problems
faced in vegetable value chain, Knowledge on selected
vegetable post-harvest practices, Exportable vegetables
production
f. Predictors: (Constant), Use of selected vegetables post-harvest practices, Problems
faced in vegetable value chain, Knowledge on selected
vegetable post-harvest practices, Exportable vegetables
production, Experience in exportable vegetables production
g. Predictors: (Constant), Use of selected vegetables post-harvest practices, Problems
faced in vegetable value chain, Knowledge on selected
vegetable post-harvest practices, Exportable vegetables
production, Experience in exportable vegetables production,
Extension contact

222
Coefficientsa
Model
Unstandardized
Coefficients
Standardized
Coefficients t Sig.
B Std.
Error Beta
1
(Constant) 31.833 1.585 20.089 0.000
Use of selected vegetables post-
harvest practices 0.376 0.046 0.464 8.258 0.000
2
(Constant) 40.017 2.072 19.314 0.000
Use of selected vegetables post-
harvest practices 0.268 0.047 0.331 5.724 0.000
Problems faced in vegetable value
chain -0.120 0.021 -0.330 -5.696 0.000
3
(Constant) 28.154 4.695 5.996 0.000 Use of selected vegetables post-
harvest practices 0.218 0.050 0.269 4.394 0.000
Problems faced in vegetable value
chain -0.107 0.021 -0.293 -5.009 0.000
Knowledge on selected vegetable
post-harvest practices 0.638 0.227 0.169 2.806 0.005
4
(Constant) 25.735 4.733 5.438 0.000
Use of selected vegetables post-
harvest practices 0.200 0.050 0.247 4.033 0.000
Problems faced in vegetable value
chain -0.103 0.021 -0.282 -4.862 0.000
Knowledge on selected vegetable
post-harvest practices 0.684 0.225 0.181 3.037 0.003
Exportable vegetables production 0.001 0.000 0.137 2.610 0.010
5
(Constant) 25.590 4.677 5.471 0.000
Use of selected vegetables post-
harvest practices 0.181 0.049 0.223 3.659 0.000
Problems faced in vegetable value
chain -0.102 0.021 -0.281 -4.903 0.000
Knowledge on selected vegetable
post-harvest practices 0.602 0.225 0.159 2.677 0.008
Exportable vegetables production 0.001 0.000 0.155 2.957 0.003
Experience in exportable
vegetables production 0.318 0.121 0.140 2.624 0.009
6
(Constant) 21.876 5.014 4.363 0.000
Use of selected vegetables post-
harvest practices 0.189 0.049 0.233 3.824 0.000
Problems faced in vegetable value
chain -0.060 0.030 -0.164 -2.002 0.046
Knowledge on selected vegetable
post-harvest practices 0.568 0.224 0.150 2.534 0.012
Exportable vegetables production 0.001 0.000 0.161 3.094 0.002
Experience in exportable
vegetables production 0.345 0.121 0.152 2.845 0.005
Extension contact 0.055 0.028 0.153 1.979 0.049
a. Dependent Variable: Effects of using selected post-harvest practices to strengthen vegetable
export market

223
Excluded Variablesa
Model
Beta In t Sig. Partial
Correlation
Collinearity
Statistics
Tolerance
6 Age .002g 0.024 0.981 0.002 0.627
Education .017g 0.319 0.750 0.021 0.894
Family agricultural labour .028g 0.522 0.602 0.034 0.878
Experience in vegetables
cultivation
-.083g -1.106 0.270 -0.071 0.453
Exportable vegetables
cultivation area
-.045g -0.736 0.463 -0.047 0.702
Annual family income -.060g -0.983 0.326 -0.063 0.696
Exportable vegetables
production and post-
harvest practices cost
-.038g -0.624 0.533 -0.040 0.704
Credit received for
exportable vegetables
production
-.082g -1.428 0.155 -0.091 0.770
Training exposure on
vegetables post-harvest
practices
.046g 0.706 0.481 0.045 0.613
Contact with value chain
actors
-.068g -1.028 0.305 -0.066 0.590
Contract with value chain
actors
-.080g -1.487 0.138 -0.095 0.875
Depth of relationship with
value chain actors
-.083g -1.133 0.258 -0.073 0.483
Trust with value chain
actors
.091g 1.337 0.183 0.086 0.551
a. Dependent Variable: Effects of using selected post-harvest practices to strengthen vegetable
export market
b. Predictors in the Model: (Constant), Use of selected vegetables post-harvest practices
c. Predictors in the Model: (Constant), Use of selected vegetables post-harvest practices, Problems
faced in vegetable value chain
d. Predictors in the Model: (Constant), Use of selected vegetables post-harvest practices, Problems
faced in vegetable value chain, Knowledge on selected
vegetable post-harvest practices
e. Predictors in the Model: (Constant), Use of selected vegetables post-harvest practices, Problems
faced in vegetable value chain, Knowledge on selected
vegetable post-harvest practices, Exportable vegetables
production
f. Predictors in the Model: (Constant), Use of selected vegetables post-harvest practices, Problems
faced in vegetable value chain, Knowledge on selected
vegetable post-harvest practices, Exportable vegetables
production, Experience in exportable vegetables production
g. Predictors in the Model: (Constant), Use of selected vegetables post-harvest practices, Problems
faced in vegetable value chain, Knowledge on selected
vegetable post-harvest practices, Exportable vegetables
production, Experience in exportable vegetables production,
Extension contact

224
Appendix – IX
Inter Correlation Matrix
X1 X2 X3 X4 X5 X6 X7 X8 X9 X10 X11 X12 X13 X14 X15 X16 X17 X18 X19 Y
X1 1 -.709** .762** .761** .603** -0.002 -0.061 -0.008 -0.035 -0.077 0.044 0.069 0.098 0.088 0.101 -0.073 0.110 0.117 -0.046 0.123
X2 -.709** 1 -.566** -.565** -.293** -0.040 0.018 -0.021 0.002 0.005 -0.022 -0.060 -0.088 -0.005 -0.010 0.046 0.041 0.040 -0.056 0.005
X3 .762** -.566** 1 .492** .339** -0.021 -0.070 -0.041 -0.047 -0.092 -0.005 0.022 .220** 0.110 0.110 -0.027 0.005 0.040 -0.009 0.073
X4 .761** -.565** .492** 1 .716** 0.033 -.147* 0.002 0.015 -0.022 0.037 0.008 0.039 -0.021 -0.044 -0.070 0.013 0.029 0.009 0.044
X5 .603** -.293** .339** .716** 1 0.012 -0.098 0.058 0.051 -0.006 0.067 0.090 -0.069 0.097 0.118 0.015 .232** .219** -0.116 .244**
X6 -0.002 -0.040 -0.021 0.033 0.012 1 0.089 .940** .867** .896** .799** .631** .254** .510** .421** .533** .179** .152* -.467** .205**
X7 -0.061 0.018 -0.070 -.147* -0.098 0.089 1 0.082 0.020 0.065 0.070 0.095 0.035 0.086 .155* 0.044 0.014 .156* -0.115 .211**
X8 -0.008 -0.021 -0.041 0.002 0.058 .940** 0.082 1 .864** .920** .757** .674** .265** .559** .472** .520** .269** .177** -.485** .221**
X9 -0.035 0.002 -0.047 0.015 0.051 .867** 0.020 .864** 1 .885** .823** .713** .139* .568** .450** .503** .177** 0.121 -.503** .199**
X10 -0.077 0.005 -0.092 -0.022 -0.006 .896** 0.065 .920** .885** 1 .687** .610** .149* .437** .327** .462** .134* 0.057 -.395** 0.115
X11 0.044 -0.022 -0.005 0.037 0.067 .799** 0.070 .757** .823** .687** 1 .683** .203** .632** .543** .549** .211** .249** -.604** .322**
X12 0.069 -0.060 0.022 0.008 0.090 .631** 0.095 .674** .713** .610** .683** 1 .171** .776** .736** .514** .321** .243** -.626** .275**
X13 0.098 -0.088 .220** 0.039 -0.069 .254** 0.035 .265** .139* .149* .203** .171** 1 .272** .205** .320** .133* 0.052 -.169** 0.034
X14 0.088 -0.005 0.110 -0.021 0.097 .510** 0.086 .559** .568** .437** .632** .776** .272** 1 .891** .538** .406** .319** -.700** .321**
X15 0.101 -0.010 0.110 -0.044 0.118 .421** .155* .472** .450** .327** .543** .736** .205** .891** 1 .471** .448** .370** -.618** .420**
X16 -0.073 0.046 -0.027 -0.070 0.015 .533** 0.044 .520** .503** .462** .549** .514** .320** .538** .471** 1 .291** .250** -.747** .387**
X17 0.110 0.041 0.005 0.013 .232** .179** 0.014 .269** .177** .134* .211** .321** .133* .406** .448** .291** 1 .455** -.364** .398**
X18 0.117 0.040 0.040 0.029 .219** .152* .156* .177** 0.121 0.057 .249** .243** 0.052 .319** .370** .250** .455** 1 -.403** .464**
X19 -0.046 -0.056 -0.009 0.009 -0.116 -.467** -0.115 -.485** -.503** -.395** -.604** -.626** -.169** -.700** -.618** -.747** -.364** -.403** 1 -.463**
Y 0.123 0.005 0.073 0.044 .244** .205** .211** .221** .199** 0.115 .322** .275** 0.034 .321** .420** .387** .398** .464** -.463** 1
** Correlation is significant at the 0.01 level (2-tailed), * Correlation is significant at the 0.05 level (2-tailed).
X1 = Age X11 = Training on vegetables post-harvest practices
X2 = Education X12 = Contact with value chain actors
X3 = Family agricultural labour X13 = Contract with value chain actors
X4 = Experience in vegetables cultivation X14 = Depth of relationship with value chain actors
X5 = Experience in exportable vegetables production X15 = Trust with value chain actors
X6 = Exportable vegetables cultivation area X16 = Extension contact
X7 = Exportable vegetables production X17 = Knowledge on selected vegetables post-harvest practices
X8 = Annual family income X18= Use of selected vegetables post-harvest practices
X9 = Exportable vegetables production and post-harvest practices cost X19= Problems faced in vegetable value chain
X10 = Credit received for exportable vegetables production Y = Effects of using selected post-harvest practices to strengthen vegetable export market