docking and design with autodock - rocce...
TRANSCRIPT

Docking and Design with AutoDock
David S. GoodsellArthur J. Olson
The Scripps Research Institute
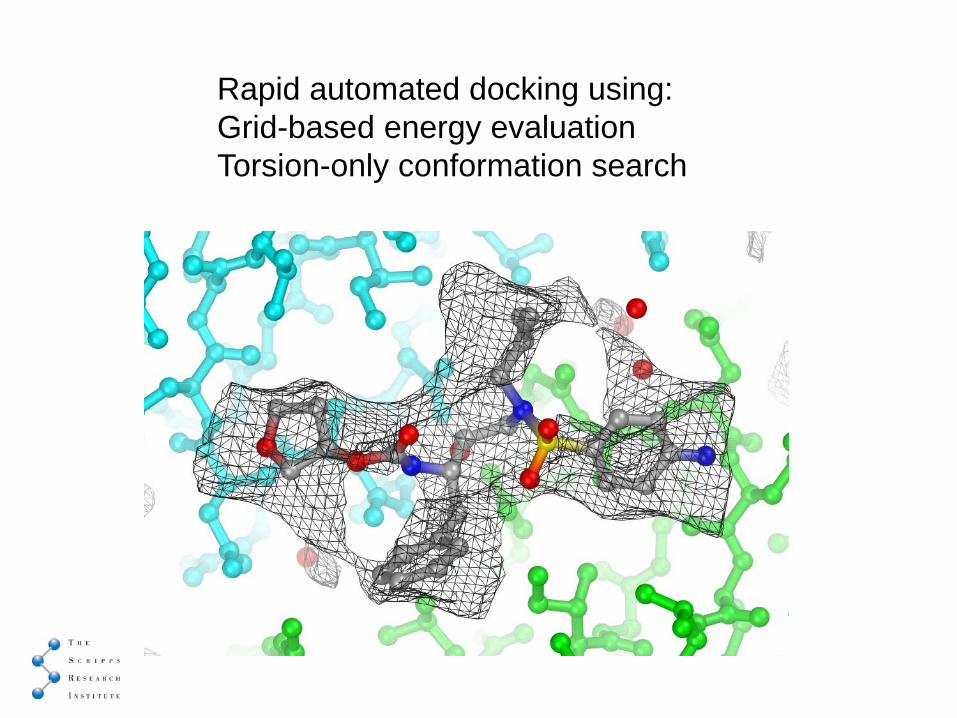
Rapid automated docking using:Grid-based energy evaluationTorsion-only conformation search

AutoDock History• 1990:
– AutoDock is the first software to dock flexible ligands– Freely distributed to academics
• 1992:– AutoDock 2 rewritten in C– User interface and manual
• 1997:– AutoDock 3 collaboration with Rik Belew– Lamarkian GA and empirical free energy force field– AutoDockTools GUI
• 2000:– First docking software to be used in a public distributed
computing project (FightAIDS@Home, Entropia)• 2007:
– AutoDock 4 distributed under open source license
AutoDock 4• Improved Force Field
– Based on comprehensive thermodynamic model that allows incorporation of intramolecular energies into the predicted free energy of binding
– Uses charge-based method for evaluation of desolvation for typical set of atom types
– Calibrated against 188 diverse protein ligand complexes, tested on a set of 100 complexes of ligands with retroviral proteases.
– Improved performance over AutoDock3 forcefield• Enables incorporation of flexible protein side-chains• Implemented in FightAIDS@Home on IBM World
Community Grid (>900,000 processors)• AutoDockTools GUI for setup, running, and analysis

Citations of Docking Software to 2005
AutoDock
Sousa, Fernandes &Ramos (2006) Proteins 65, 15.

Trends in Docking Software UsageAutoDock
20052004
20032001

AutoDock Licenses
• AutoDock 3 (1999-2007) – ~4,000 licenses
• AutoDock 4 (2007-2008) under GPL– ~10,000 click through licenses-- unique IPs

Current Topics for AutoDock
• Protein Flexibility • Coevolution at Atomic Detail• Identification of Optimal Binding Sites• Improved Free Energy Prediction

Addressing Protein Flexibility with the Relaxed Complex Method
•Molecular dynamics is used to sample the conformational flexibility of the protein
•Representative snapshots are used in AutoDock to incorporate the protein flexibility during docking
1) Lin, J.-H.*, Perryman, A.L., Schames, J.R., & McCammon, J.A. J. Am. Chem. Soc., 124: 5632 (2002). 2) Lin, J.-H.*, Perryman, A.L., Schames, J.R., & McCammon, J.A. Biopolymers, 68: 47 (2003).
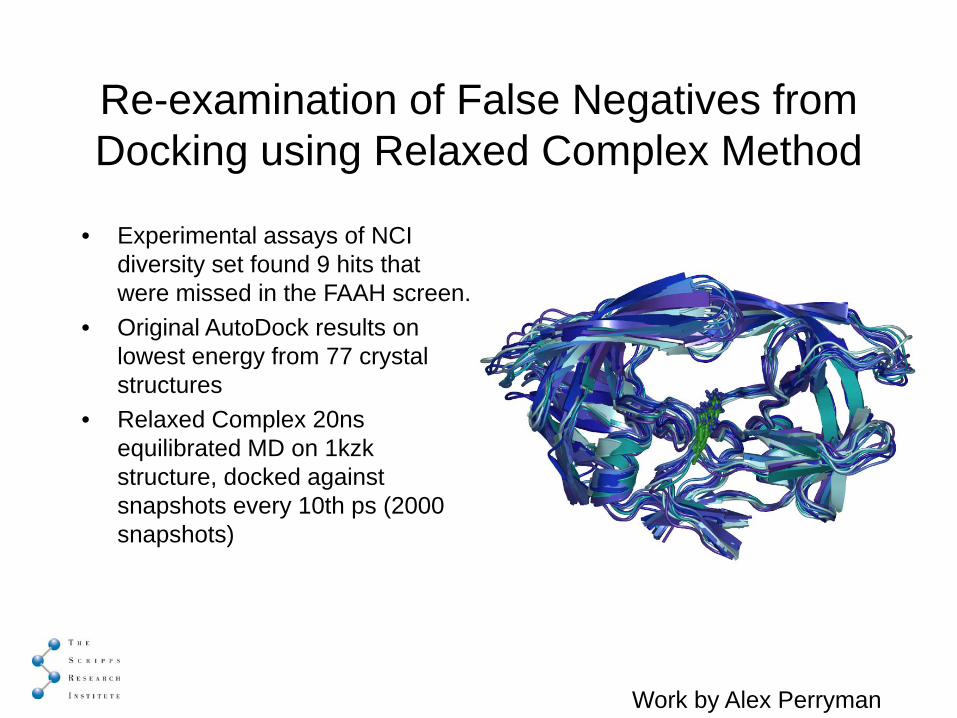
Re-examination of False Negatives from Docking using Relaxed Complex Method
• Experimental assays of NCI diversity set found 9 hits that were missed in the FAAH screen.
• Original AutoDock results on lowest energy from 77 crystal structures
• Relaxed Complex 20ns equilibrated MD on 1kzk structure, docked against snapshots every 10th ps (2000 snapshots)
Work by Alex Perryman
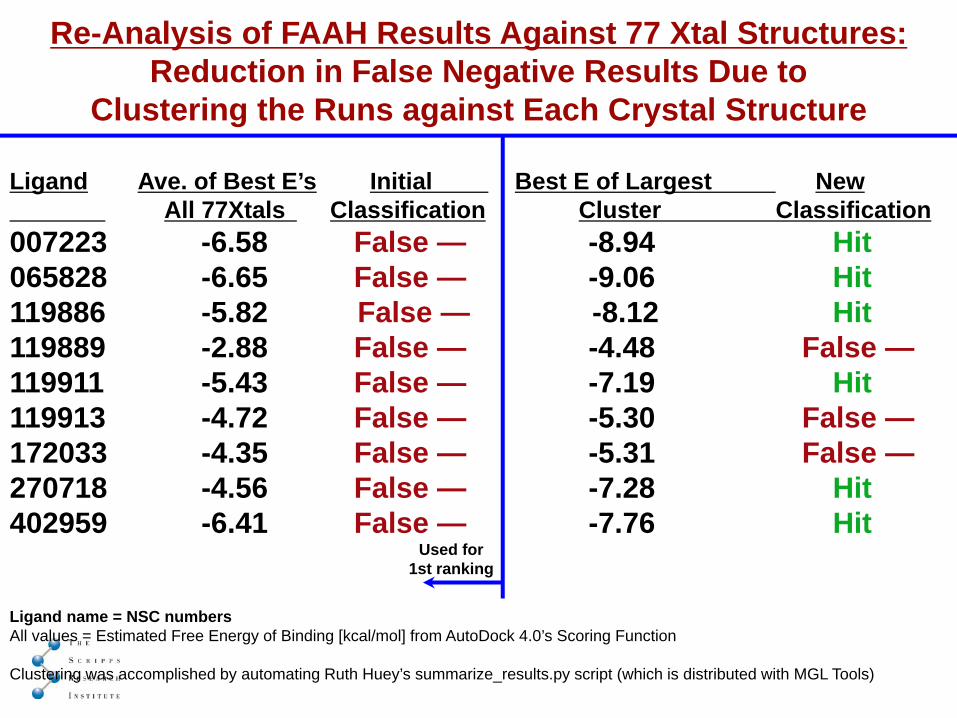
Re-Analysis of FAAH Results Against 77 Xtal Structures:Reduction in False Negative Results Due to
Clustering the Runs against Each Crystal Structure
Ligand Ave. of Best E’s Initial Best E of Largest NewAll 77Xtals Classification Cluster Classification
007223 -6.58 False — -8.94 Hit065828 -6.65 False — -9.06 Hit119886 -5.82 False — -8.12 Hit119889 -2.88 False — -4.48 False —119911 -5.43 False — -7.19 Hit119913 -4.72 False — -5.30 False —172033 -4.35 False — -5.31 False —270718 -4.56 False — -7.28 Hit402959 -6.41 False — -7.76 Hit
Ligand name = NSC numbersAll values = Estimated Free Energy of Binding [kcal/mol] from AutoDock 4.0’s Scoring Function
Clustering was accomplished by automating Ruth Huey’s summarize_results.py script (which is distributed with MGL Tools)
Used for1st ranking
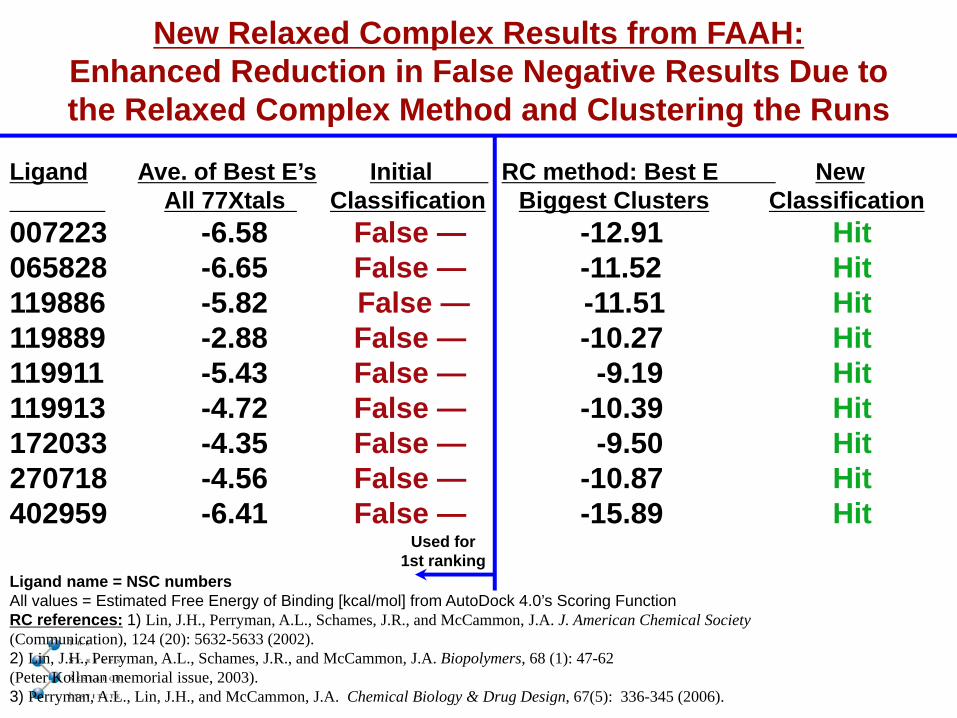
New Relaxed Complex Results from FAAH:Enhanced Reduction in False Negative Results Due tothe Relaxed Complex Method and Clustering the Runs
Ligand Ave. of Best E’s Initial RC method: Best E NewAll 77Xtals Classification Biggest Clusters Classification
007223 -6.58 False — -12.91 Hit065828 -6.65 False — -11.52 Hit119886 -5.82 False — -11.51 Hit119889 -2.88 False — -10.27 Hit119911 -5.43 False — -9.19 Hit119913 -4.72 False — -10.39 Hit172033 -4.35 False — -9.50 Hit270718 -4.56 False — -10.87 Hit402959 -6.41 False — -15.89 Hit
Ligand name = NSC numbersAll values = Estimated Free Energy of Binding [kcal/mol] from AutoDock 4.0’s Scoring FunctionRC references: 1) Lin, J.H., Perryman, A.L., Schames, J.R., and McCammon, J.A. J. American Chemical Society(Communication), 124 (20): 5632-5633 (2002). 2) Lin, J.H., Perryman, A.L., Schames, J.R., and McCammon, J.A. Biopolymers, 68 (1): 47-62 (Peter Kollman memorial issue, 2003). 3) Perryman, A.L., Lin, J.H., and McCammon, J.A. Chemical Biology & Drug Design, 67(5): 336-345 (2006).
Used for1st ranking
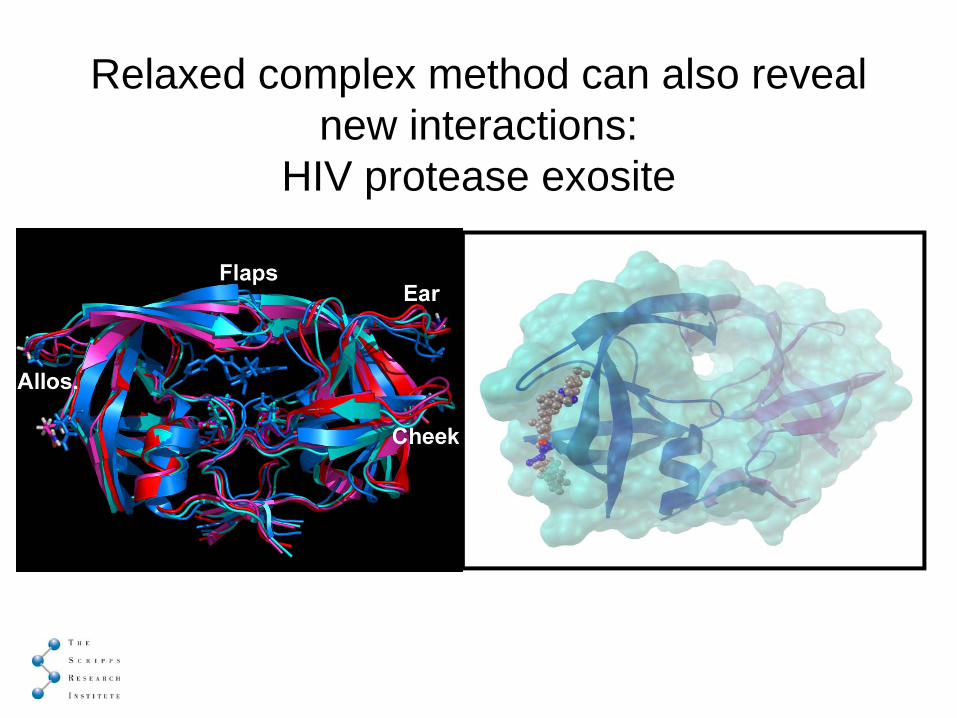
Relaxed complex method can also reveal new interactions:
HIV protease exosite
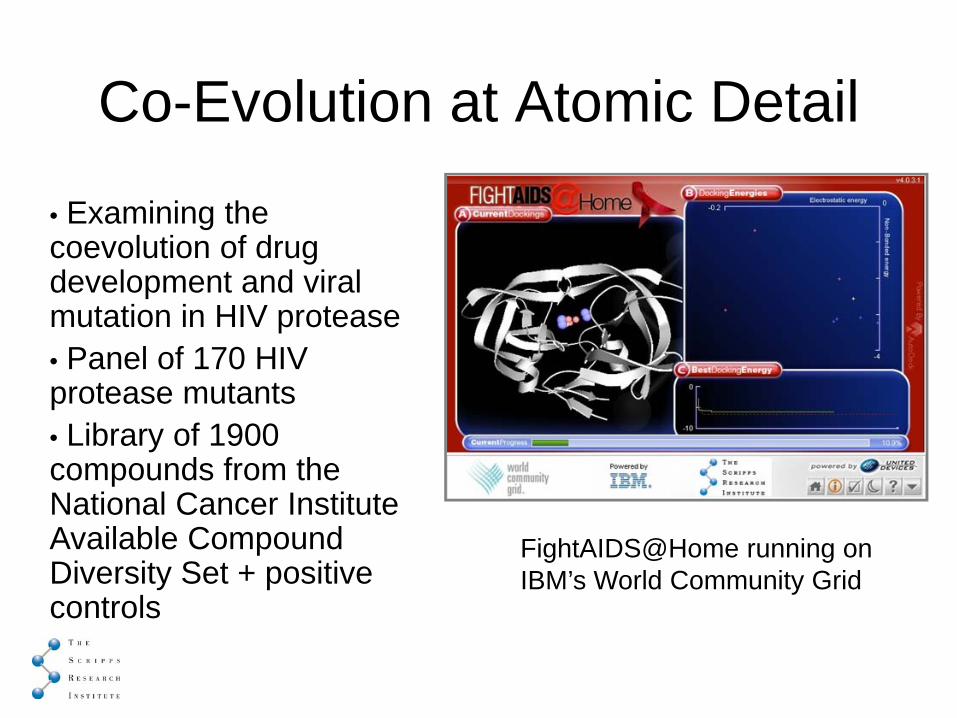
Co-Evolution at Atomic Detail
• Examining the coevolution of drug development and viral mutation in HIV protease• Panel of 170 HIV protease mutants• Library of 1900 compounds from the National Cancer Institute Available Compound Diversity Set + positive controls
FightAIDS@Home running on IBM’s World Community Grid

Raw binding dataLi
gand
s
ProteasesWork by Max Chang and Richard K. Belew

Multi-Dimensional (Sammon) Plotspanning mutants and best representative mutant
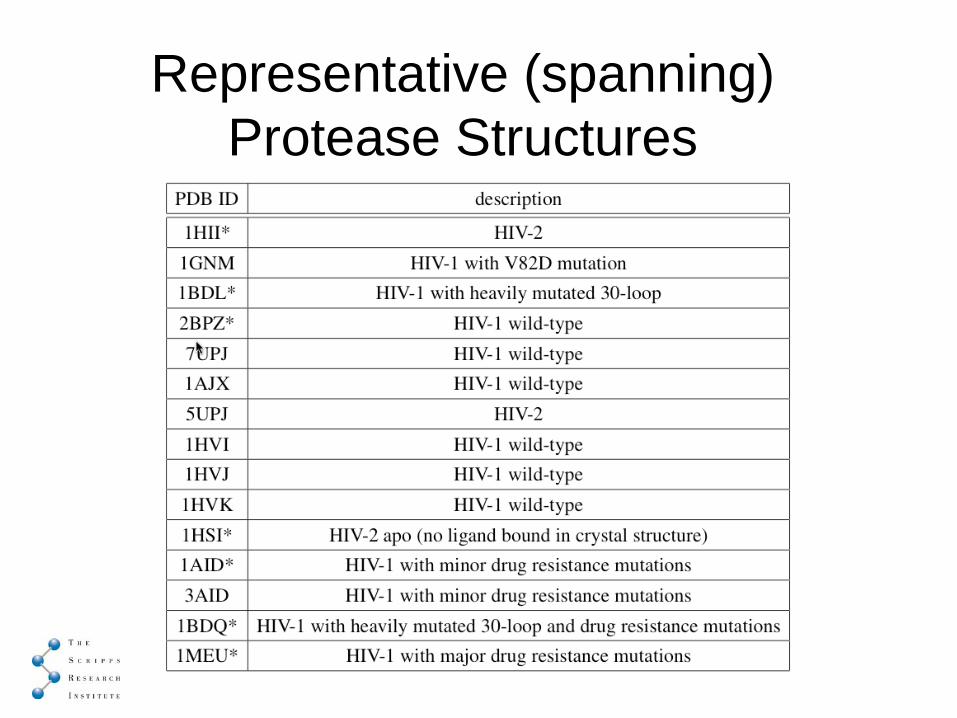
Representative (spanning) Protease Structures
Optimal Binding Site discovery through Affinity Mapping
• Find optimal binding sites in proteins for a given ligand volume
• Uses affinity maps from AutoDock/AutoGrid• Use for finding binding sites, optimal ligand
characteristics, exosites, drug optimization, characterizing proteins of unknown function
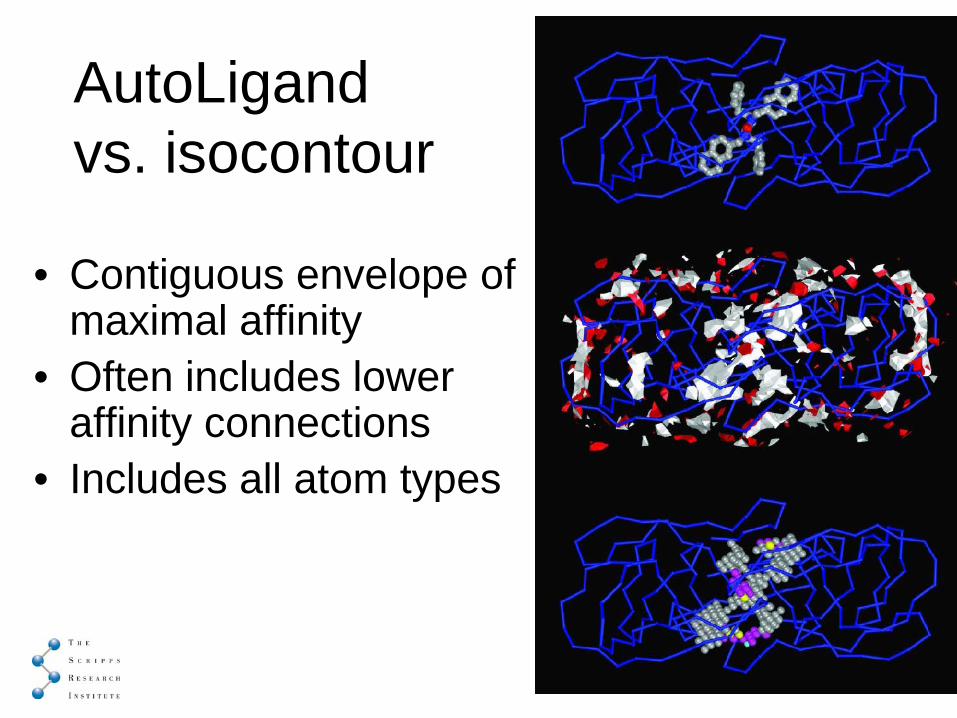
AutoLigand vs. isocontour
• Contiguous envelope of maximal affinity
• Often includes lower affinity connections
• Includes all atom types
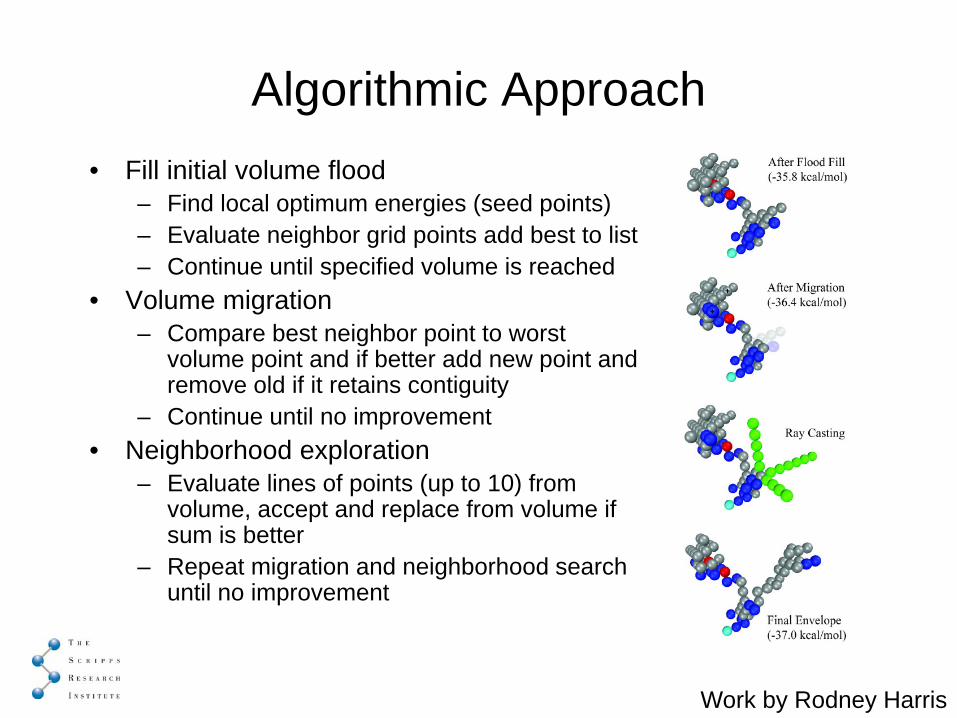
Algorithmic Approach• Fill initial volume flood
– Find local optimum energies (seed points)– Evaluate neighbor grid points add best to list– Continue until specified volume is reached
• Volume migration– Compare best neighbor point to worst
volume point and if better add new point and remove old if it retains contiguity
– Continue until no improvement• Neighborhood exploration
– Evaluate lines of points (up to 10) from volume, accept and replace from volume if sum is better
– Repeat migration and neighborhood search until no improvement
Work by Rodney Harris
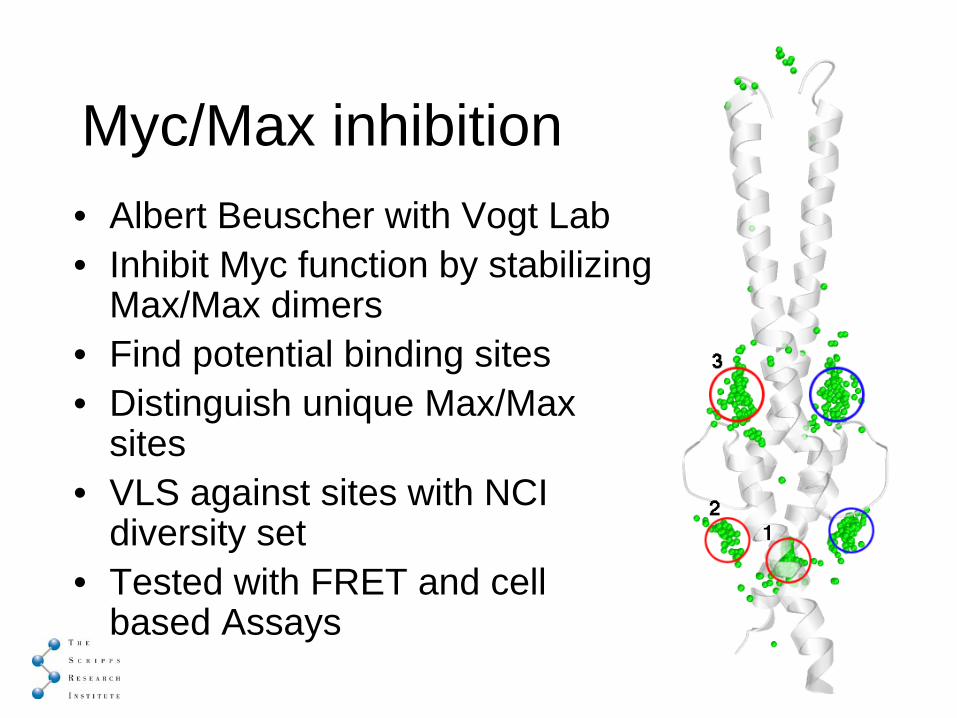
Myc/Max inhibition• Albert Beuscher with Vogt Lab• Inhibit Myc function by stabilizing
Max/Max dimers• Find potential binding sites• Distinguish unique Max/Max
sites• VLS against sites with NCI
diversity set• Tested with FRET and cell
based Assays
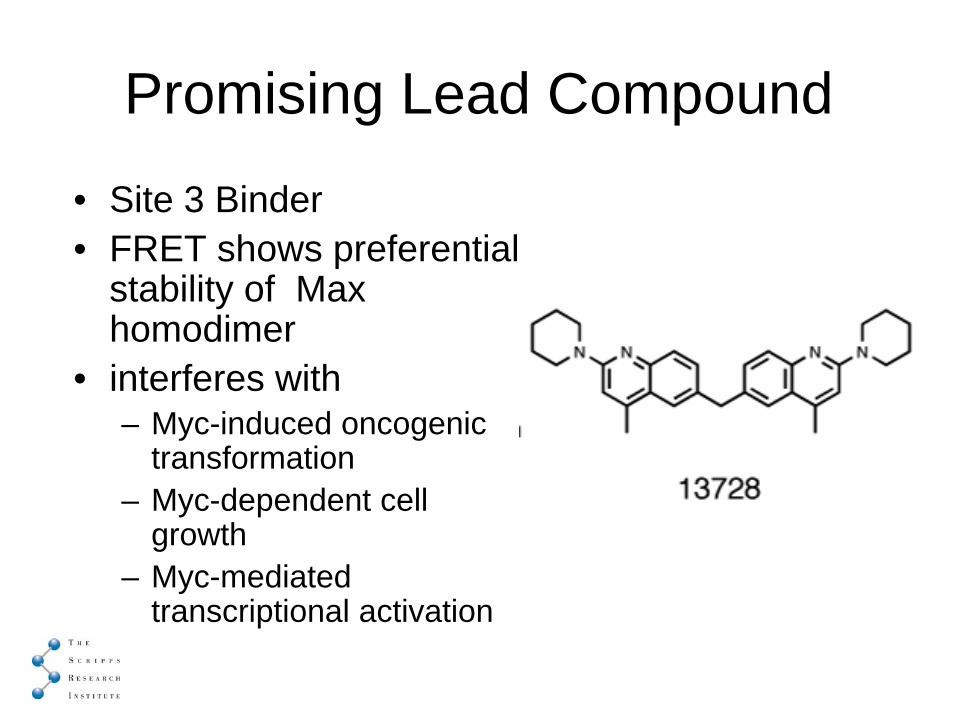
Promising Lead Compound
• Site 3 Binder• FRET shows preferential
stability of Max homodimer
• interferes with – Myc-induced oncogenic
transformation– Myc-dependent cell
growth– Myc-mediated
transcriptional activation

Problem of Ranking Docked Results
• Often find incorrect conformations with slightly more favorable binding energies– Found with low frequency in iterated docking (~1%)– The correct conformations found more frequently (25-100%)– Choosing best energy conformation can give wrong
conformation• Current force field poorly predicts weakly interacting
ligands– Eg. APS reductase (adenosine 5’phosphosulfate reductase)– Experimentally 5’ADP strong, 3’ADP weak– AutoDock predicts both as comparably strong binders

2Å RMSD Clustering for 100 dockings to APS reductase
• 5’AMPΔGobs= -8.07kcal/mol
ΔGAD4= -8.73kcal/mol
n = 61/100• 3’AMP
ΔGobs= -2.27kcal/mol
ΔGAD4= -9.25kcal/mol
n = 1/100
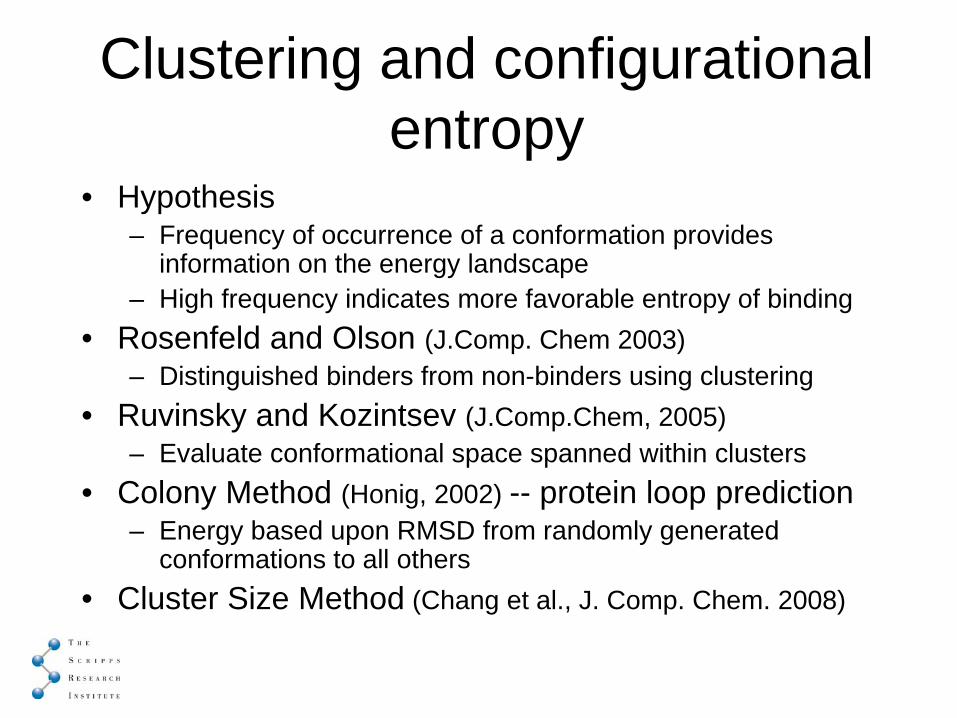
Clustering and configurational entropy
• Hypothesis– Frequency of occurrence of a conformation provides
information on the energy landscape– High frequency indicates more favorable entropy of binding
• Rosenfeld and Olson (J.Comp. Chem 2003)– Distinguished binders from non-binders using clustering
• Ruvinsky and Kozintsev (J.Comp.Chem, 2005)– Evaluate conformational space spanned within clusters
• Colony Method (Honig, 2002) -- protein loop prediction– Energy based upon RMSD from randomly generated
conformations to all others• Cluster Size Method (Chang et al., J. Comp. Chem. 2008)

Local Energy Landscapes
• 5’AMP– shows wide basin– Few bad contacts <0.5Å
• 3’AMP– Narrow basin– Bad contacts <0.25ÅP
redi
cted
Bin
ding
Ene
rgy
RMSD
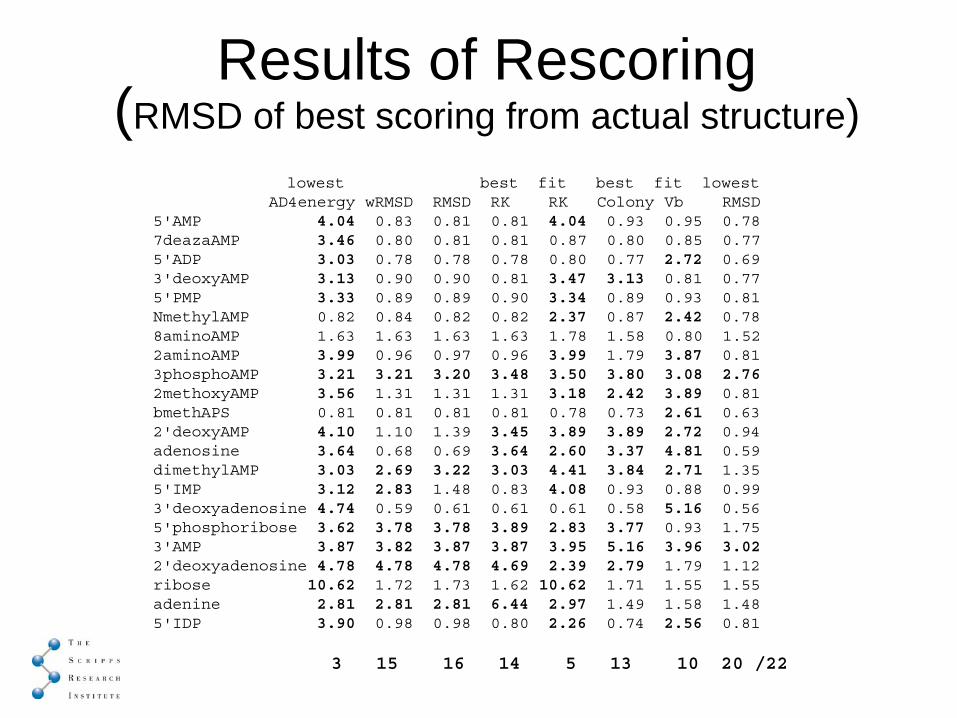
Results of Rescoring(RMSD of best scoring from actual structure)
lowest best fit best fit lowest AD4energy wRMSD RMSD RK RK Colony Vb RMSD
5'AMP 4.04 0.83 0.81 0.81 4.04 0.93 0.95 0.787deazaAMP 3.46 0.80 0.81 0.81 0.87 0.80 0.85 0.775'ADP 3.03 0.78 0.78 0.78 0.80 0.77 2.72 0.693'deoxyAMP 3.13 0.90 0.90 0.81 3.47 3.13 0.81 0.775'PMP 3.33 0.89 0.89 0.90 3.34 0.89 0.93 0.81NmethylAMP 0.82 0.84 0.82 0.82 2.37 0.87 2.42 0.78 8aminoAMP 1.63 1.63 1.63 1.63 1.78 1.58 0.80 1.522aminoAMP 3.99 0.96 0.97 0.96 3.99 1.79 3.87 0.813phosphoAMP 3.21 3.21 3.20 3.48 3.50 3.80 3.08 2.762methoxyAMP 3.56 1.31 1.31 1.31 3.18 2.42 3.89 0.81bmethAPS 0.81 0.81 0.81 0.81 0.78 0.73 2.61 0.632'deoxyAMP 4.10 1.10 1.39 3.45 3.89 3.89 2.72 0.94adenosine 3.64 0.68 0.69 3.64 2.60 3.37 4.81 0.59dimethylAMP 3.03 2.69 3.22 3.03 4.41 3.84 2.71 1.355'IMP 3.12 2.83 1.48 0.83 4.08 0.93 0.88 0.993'deoxyadenosine 4.74 0.59 0.61 0.61 0.61 0.58 5.16 0.565'phosphoribose 3.62 3.78 3.78 3.89 2.83 3.77 0.93 1.753'AMP 3.87 3.82 3.87 3.87 3.95 5.16 3.96 3.022'deoxyadenosine 4.78 4.78 4.78 4.69 2.39 2.79 1.79 1.12ribose 10.62 1.72 1.73 1.62 10.62 1.71 1.55 1.55adenine 2.81 2.81 2.81 6.44 2.97 1.49 1.58 1.48 5'IDP 3.90 0.98 0.98 0.80 2.26 0.74 2.56 0.81
3 15 16 14 5 13 10 20 /22

Acknowledgements
TSRIArthur OlsonGarrett MorrisRuth HueyAlex PerrymanStephano ForliAlex GilletAlbert BeuscherRodney Harris
UCSDRik BelewMax Chang