docketed by the california
TRANSCRIPT
DOCKETED
Docket Number: 07-AFC-05C
Project Title: Ivanpah Solar Electric Generating System (Compliance)
TN #: 202718
Document Title: Ivanpah SEGS Heliostat Positioning Plan Report
Description: N/A
Filer: Karen Mitchell
Organization: Ellison, Schneider & Harris L.L.P.
Submitter Role: Applicant Representative
Submission Date: 7/17/2014 11:01:04 AM
Docketed Date: 7/17/2014

{00244402;1}
Ivanpah Solar Electric Generating System California Energy Commission (07-AFC-5C)
Bureau of Land Management (CACA-48668, 49502, 49503, and 49504)
Condition of Certification TRANS-3
Heliostat Positioning Plan Report
Submitted
July 17, 2014
energyservices an NRG service On behalf of Solar Partners I, II, and VIII LLC
Prepared by: Sandia National Laboratories Clifford K. Ho, Cianan A. Sims, and Joshua M. Christian

SANDIA REPORT SAND2014-15847 Unlimited Release Printed July 2014
Evaluation of Glare at the Ivanpah Solar Electric Generating System
Clifford K. Ho, Cianan A. Sims, and Joshua M. Christian
Prepared by Sandia National Laboratories Albuquerque, New Mexico 87185 and Livermore, California 94550
Sandia National Laboratories is a multi-program laboratory managed and operated by Sandia Corporation, a wholly owned subsidiary of Lockheed Martin Corporation, for the U.S. Department of Energy's National Nuclear Security Administration under contract DE-AC04-94AL85000. Approved for public release; further dissemination unlimited.

2
Issued by Sandia National Laboratories, operated for the United States Department of Energy
by Sandia Corporation.
NOTICE: This report was prepared as an account of work sponsored by an agency of the
United States Government. Neither the United States Government, nor any agency thereof,
nor any of their employees, nor any of their contractors, subcontractors, or their employees,
make any warranty, express or implied, or assume any legal liability or responsibility for the
accuracy, completeness, or usefulness of any information, apparatus, product, or process
disclosed, or represent that its use would not infringe privately owned rights. Reference herein
to any specific commercial product, process, or service by trade name, trademark,
manufacturer, or otherwise, does not necessarily constitute or imply its endorsement,
recommendation, or favoring by the United States Government, any agency thereof, or any of
their contractors or subcontractors. The views and opinions expressed herein do not
necessarily state or reflect those of the United States Government, any agency thereof, or any
of their contractors.
Printed in the United States of America. This report has been reproduced directly from the best
available copy.
Available to DOE and DOE contractors from
U.S. Department of Energy
Office of Scientific and Technical Information
P.O. Box 62
Oak Ridge, TN 37831
Telephone: (865) 576-8401
Facsimile: (865) 576-5728
E-Mail: [email protected]
Online ordering: http://www.osti.gov/bridge
Available to the public from
U.S. Department of Commerce
National Technical Information Service
5285 Port Royal Rd.
Springfield, VA 22161
Telephone: (800) 553-6847
Facsimile: (703) 605-6900
E-Mail: [email protected]
Online order: http://www.ntis.gov/help/ordermethods.asp?loc=7-4-0#online
3
SAND2014-15847
Unlimited Release
Printed July 2014
Evaluation of Glare at the Ivanpah Solar Electric Generating System
Clifford K. Ho,1 Cianan A. Sims,
2 and Joshua M. Christian
1
1Concentrating Solar Technologies Department
Sandia National Laboratories
Albuquerque, NM 87185
(505) 844-2384, [email protected]
Sims Industries
85 Poinciana Dr.
Dayton, OH 45459
Abstract
The Ivanpah Solar Electric Generating System (ISEGS), located on I-15 about 40
miles (60 km) south of Las Vegas, NV, consists of three power towers 459 ft (140 m)
tall and over 170,000 reflective heliostats with a rated capacity of 390 MW. Reports
of glare from the plant have been submitted by pilots and air traffic controllers and
recorded by the Aviation Safety Reporting System and the California Energy
Commission since 2013. Aerial and ground-based surveys of the glare were
conducted in April, 2014, to identify the cause and to quantify the irradiance and
potential ocular impacts of the glare. Results showed that the intense glare viewed
from the airspace above ISEGS was caused by heliostats in standby mode that were
aimed to the side of the receiver. Evaluation of the glare showed that the retinal
irradiance and subtended source angle of the glare from the heliostats in standby were
sufficient to cause significant ocular impact (potential for after-image) up to a
distance of ~6 miles (10 km), but the values were below the threshold for permanent
eye damage. Glare from the receivers had a low potential for after-image at all
ground-based monitoring locations outside of the site boundaries. A Letter to Airmen
has been issued by the Federal Aviation Administration to notify pilots of the
potential glare hazards. Additional measures to mitigate the potential impacts of
glare from ISGES are also presented and discussed.

4
This page intentionally left blank

5
CONTENTS
1. Introduction ........................................................................................................................... 7 1.1. Background ..................................................................................................................... 7 1.2. Objectives ....................................................................................................................... 9
2. Description of Potential Glare Hazards ............................................................................ 10
3. Aerial Glare Surveys ........................................................................................................... 11 3.1. Approach ....................................................................................................................... 11 3.2. Results ........................................................................................................................... 13 3.3. Modeling of Standby Heliostats.................................................................................... 16
4. Ground-Based Glare Surveys ............................................................................................. 19 4.1. Approach ....................................................................................................................... 19 4.2. Results ........................................................................................................................... 22
4.3. Modeling of Receivers .................................................................................................. 24
5. Mitigation Measures ............................................................................................................ 24 5.1. Letter to Airmen ............................................................................................................ 24
5.2. Modification of Heliostat Standby Positions ................................................................ 25
6. Summary and Conclusions ................................................................................................. 25
Acknowledgments ....................................................................................................................... 26
References .................................................................................................................................... 26
Appendix – Letter to Airmen ..................................................................................................... 28
Distribution .................................................................................................................................. 29
FIGURES
Figure 1. Illuminated receivers at ISEGS, Feb. 2014 (source: Wikipedia) ....................................7 Figure 2. Two photos of glare at ISEGS from a jet (US Airways Flight 416) at an altitude
of 30,000 feet (30 – 40 miles away) en route from Reno to Phoenix at
~10:15AM PDT, March 10, 2014. Note the difference in glare between the
receiver and a heliostat in the photo on the right (photos courtesy of Mike
Pasqualetti, ASU). ...........................................................................................................8
Figure 3. Potential ocular impacts of retinal irradiance as a function of subtended source
angle [9]. Note: 1 watt yields approximately 100 lumens of visible light in the
solar spectrum. ...............................................................................................................11 Figure 4. R-44 helicopter rented from Airworks LV for the aerial glare surveys. .......................12

6
Figure 5. Locations of aerial photos that were taken of the glare visible at ISEGS
(located within the circle), April 24, 2014. The “DSC” labels refer to the photo
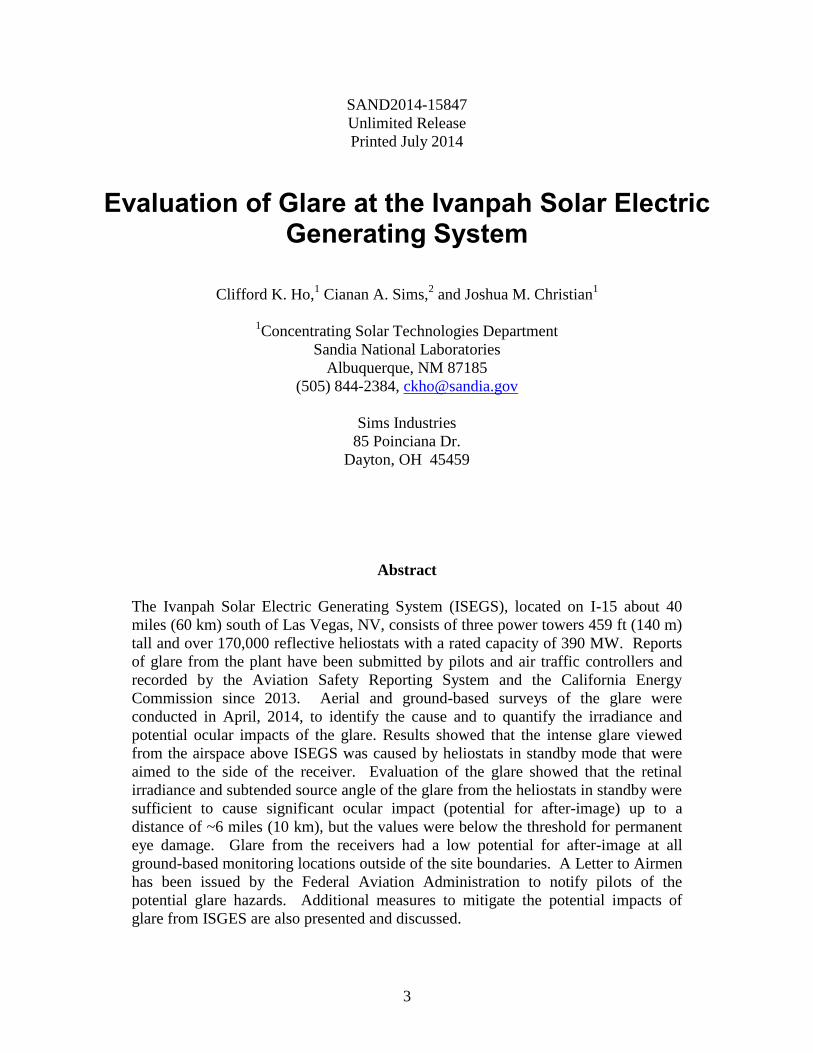
numbers in Table 2. .......................................................................................................12 Figure 6. Photos of observed glare at various locations around ISEGS during aerial
survey, April 24, 2014, 9:15 – 10:30 AM PDT. ............................................................14 Figure 7. Top left: photo of heliostat glare looking northeast at Unit 1, 9:10 AM PDT
(~3 miles away from glare). Top right: filtered image of glare. Bottom:
Additional filtering shows individual heliostats producing glare. ................................15 Figure 8. Photo (left; Ryan Goerl, NRG) and model (middle and right) of illuminance
from heliostats aimed at a standby point near the top of the tower, forming a
toroid of glare in the airspace. .......................................................................................17 Figure 9. Maximum number of standby heliostats that can produce glare as a function of
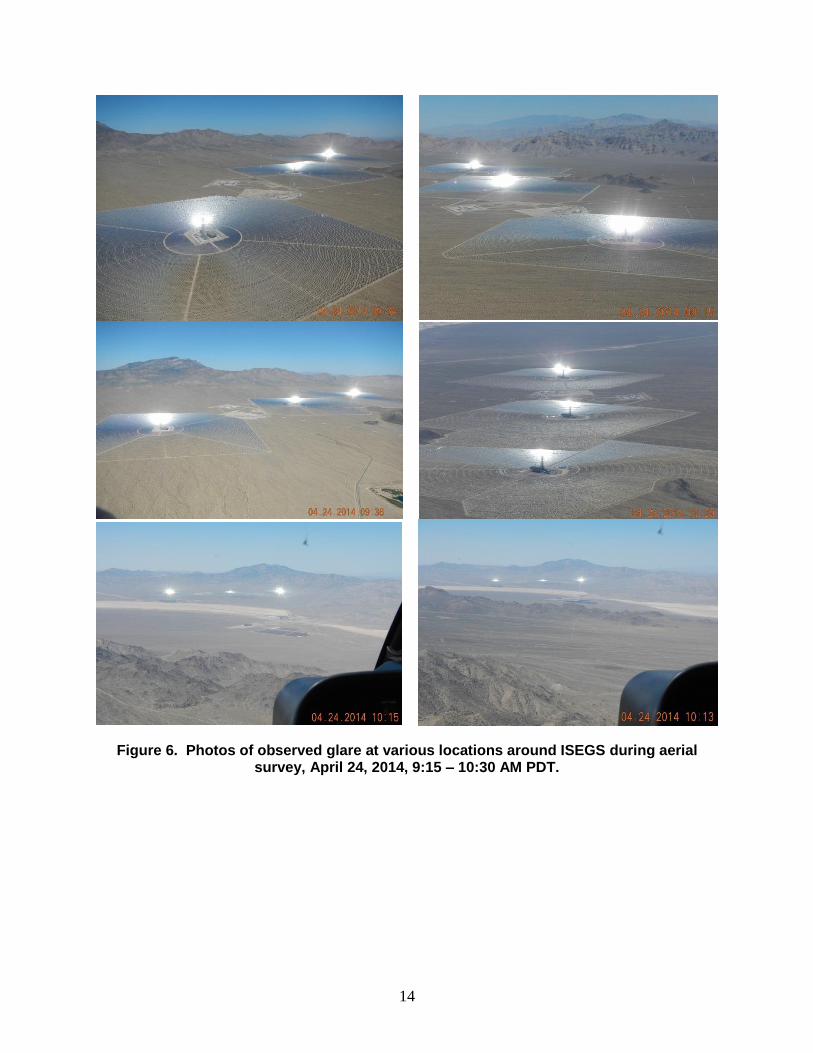
observer distance and distance between the heliostats and aim point. ..........................18 Figure 10. Sandia/DOE is developing a 3D tool that allows the user to “fly” around a
power tower plant to determine the irradiance and potential ocular hazards
from heliostat reflections at any location. .....................................................................19 Figure 11. Locations of ground-based photographs of glare around Unit 1 at ISEGS. ................20
Figure 12. Photograph of illuminated receivers at Units 2 and 3 while heading
southbound along I-15. ..................................................................................................21 Figure 13. Photograph of illuminated receivers at Units 1, 2 and 3 while heading
northbound along I-15. ..................................................................................................21 Figure 14. Photo (left) and measured irradiance profile (right) of unit 1 receiver from I-
15 (~1.5 miles away) at ~1:00 PM PDT, 4/24/14. ........................................................22 Figure 15. Ocular hazard plot of glare from unit 1 receiver at ~1 PM PDT, 4/24/14. The
glare has a “low potential for after-image.” ..................................................................23
Figure 16. Photograph of Unit 3 receiver and “rogue” heliostat from I-15 (~3 miles
away). ............................................................................................................................24
TABLES
Table 1. Glare monitoring requirements identified in the Heliostat Positioning Plan and
the Power Tower Luminance Monitoring Plan.* ............................................................9 Table 2. Processed data from photos of glare at ISEGS (4/24/14). ..............................................16

7
1. INTRODUCTION
1.1. Background
The Ivanpah Solar Electric Generating System (ISEGS) consists of three power towers
generating 392 MW on 14.2 km2 (3500 acres) of public desert land in southern California. Over
170,000 heliostats with 2.6 million square meters of mirrors reflect and concentrate sunlight
toward the receivers at the top of the 140 m (459 ft) towers that produce steam for the power
cycle (Figure 1).
Figure 1. Illuminated receivers at ISEGS, Feb. 2014 (source: Wikipedia)
Reports of glare from pilots and air traffic controllers have been docketed by the California
Energy Commission (CEC) [1]. One pilot stated the following as they departed from Boulder
City airport and climbed southwest over ISEGS, “At its brightest neither the pilot nor co-pilot
could look in that direction due to the intense brightness. From the pilot’s seat of my aircraft the
brightness was like looking into the sun and it filled about 1/3 of the co-pilots front windshield.
In my opinion the reflection from these mirrors was a hazard to flight because for a brief time I
could not scan the sky in that direction to look for other aircraft.” An air-traffic controller stated,
“Daily, during the late morning and early afternoon hours we get complaints from pilots of
aircraft flying from the northeast to the southwest about the brightness of this solar farm.” These
complaints were recorded in August 2013 in NASA’s Aviation Safety Reporting System and
docketed with ISEGS compliance proceedings (07-AFC-05C) on March 10, 2014. The Federal
Aviation Administration (FAA) reported that in May 2014, nearly 12,000 flights were recorded
passing within a 15 nautical mile (28 km) radius of ISEGS [2].
Figure 2 shows images of glare from both the receiver and heliostats at ISEGS viewed from a
commercial jet at an altitude of 30,000 feet, approximately 50 – 65 km (30 – 40 miles) away
from the plant. From the image on the right in Figure 2, it is apparent that reflections from
heliostats can produce more intense glare than reflections from the receiver on top of the tower.

8
Figure 2. Two photos of glare at ISEGS from a jet (US Airways Flight 416) at an altitude of 30,000 feet (30 – 40 miles away) en route from Reno to Phoenix at ~10:15AM PDT,
March 10, 2014. Note the difference in glare between the receiver and a heliostat in the photo on the right (photos courtesy of Mike Pasqualetti, ASU).
The Heliostat Positioning Plan and the Power Tower Luminance Monitoring Plan [3, 4] define
glare and monitoring requirements at ISEGS as agreed upon between the CEC and the
operators/developers of ISEGS (NRG/Brightsource). Both aerial and ground-based surveys of
glare events and their potential impacts are required. Coordination of the evaluations and
meetings with the CEC and other agencies are also required. Table 1 summarizes these
requirements.
Unit 2 Receiver
Unit 3 Heliostat
Glare
Nevada Solar One
ISEGS

9
Table 1. Glare monitoring requirements identified in the Heliostat Positioning Plan and the Power Tower Luminance Monitoring Plan.*
Task Frequency Current Status
Evaluate the intensity of the luminance light reflected from the power tower receiver. Measurements of luminance are required where distractions are reported, at the 4 sides of the power plant boundaries, at the nearest public roads.
Within 90 days following commercial operation; after 5 years of operation,
after major design changes & following legitimate complaints.
Data collected
Luminance evaluations need to be coordinated with 7 agencies. Arrange and facilitate agency meetings and consultations.
Weekly for first 3 months of operation (13 times), monthly thereafter (at
least 24 times) In progress
Procure, test and install stationary camera apparatus and software. Locations of ground-based cameras to be determined in cooperation with agencies.
As soon as practical N/A**
Conduct ground monitoring At least weekly until static cameras
are installed Data collected for one
day at 3 times
Conduct aerial monitoring to determine the potential for impacts to aviation
ASAP, after 5 yrs of operation and after changes to the project that affect
luminance Data collected
Analyze monitoring results Weekly until real-time analysis is
possible, then constant during operations
In progress
Investigate complaints Within 10 days, as needed Done
Investigate identified potentially significant glint and glare events
As needed Done
*Adapted from report by Environmental Planning Group (Matt Trask and John Carrier) for CH2MHILL Engineers, Inc., and NRG.
**Drive-by surveys along I-15 using photos and/or videos are being proposed instead.
1.2. Objectives
The objective of this work was to conduct aerial and ground-based surveys of the glare at ISEGS
to understand the causes, impact, and possible mitigation measures. Models of the specular
(reflections from mirrors) and diffuse (reflections from the receiver) glare are presented and
compared to the empirical results. The causes of the glare are described, and the irradiance and
potential ocular impacts are quantified as a function of distance from the glare source. Measures
to mitigate the impacts of glare are discussed.

10
2. DESCRIPTION OF POTENTIAL GLARE HAZARDS
Impacts of glint and glare on eyesight can include discomfort, disability, veiling effects, after-
image and retinal burn [5-8]. Prolonged exposure to “discomfort glare” may lead to headaches
and other physiological impacts, whereas “disability glare” immediately reduces visual
performance. Disability glare can include after-image effects, flash blindness and veiling, such as
that caused by solar glare on a windshield that might mask pedestrians, vehicles, or aircraft.
Retinal burn can occur with exposure to lasers or concentrated sunlight.
Ho et al. [9] developed irradiance models and summarized the potential impacts to eyesight as a
function of retinal irradiance (the solar flux entering the eye and reaching the retina) and
subtended source angle (size of glare source divided by distance). Figure 3 shows the resulting
“Ocular Hazard Plot” with three regions: (1) potential for permanent eye damage (retinal burn),
(2) potential for temporary after-image, and (3) low potential for temporary after-image. If the
retinal irradiance or subtended angle is sufficiently large, permanent eye damage from retinal
burn may occur (e.g., from concentrating mirrors). Below the retinal burn threshold, a region
exists where a sufficiently high retinal irradiance may cause a temporary after-image, which is
caused by bleaching (oversaturation) of the retinal visual pigments. The size and impact of the
after-image in the field of view depends on the size of the subtended source angle. For a given
retinal irradiance, smaller source angles yield smaller after-images, and the potential impact is
less. Sufficiently low retinal irradiances and/or subtended angles of the glare source have a low
potential for after-image and ocular impacts.
A number of factors can affect both the intensity and perceived impact of glare: direct normal
irradiance (DNI), reflectance, distance, size of the reflecting surfaces, and human factors. The
DNI is the amount of solar irradiance striking a surface perpendicular to the sun’s rays. A typical
clear sunny day may yield a DNI of ~1,000 watts per square meter at solar noon, with lower
values in the mornings and evenings. The DNI provides the starting “strength” of the solar glare
source, which can then be reduced by the reflectance of the mirror or receiver. The reflected light
can be characterized as a combination of specular (mirror-like) and diffuse (scattered)
reflections. Smooth surfaces such as mirrors and smooth glass produce more specular reflections
with greater intensity and tighter beams (larger retinal irradiances and smaller subtended angles
used in Figure 3), while solar receivers produce more diffuse reflections with lower solar
intensities but greater subtended angles. Typically, specular reflections pose a greater risk for
ocular hazards.
The distance between the observer and the glare source can impact both the retinal irradiance and
subtended source angle. Atmospheric attenuation caused by particulates or humidity in the air
will reduce the retinal irradiance with increasing distance.1
In addition, for a fixed size of the
glare source, larger distances will typically yield smaller subtended angles of the glare source.
Finally, human factors such as ocular properties (pupil size, eye focal length, ocular
transmittance) and light sensitivity will affect the retinal irradiance, subtended angle and
1 Without atmospheric attenuation, the retinal irradiance [W/m
2] is independent of distance since the power entering
the eye (numerator) and exposed retinal area (denominator) decrease at the same rate with increasing distance.

11
perceived impact of the glare. Typical ocular properties for daylight adjusted eyes are provided
in Ho et al. [9].
Figure 3. Potential ocular impacts of retinal irradiance as a function of subtended source angle [9]. Note: 1 watt yields approximately 100 lumens of visible light in the solar
spectrum.
3. AERIAL GLARE SURVEYS
3.1. Approach
On April 24, 2014, aerial surveys of the glare at ISEGS were performed via helicopter (R-44
rented from Airworks LV in Las Vegas, NV, Figure 4). A Nikon D90 camera was used with
Tiffen neutral density filters to record images of the glare during the aerial flyovers.
Photographs of the glare were processed using the PHLUX method [10, 11] to quantify the
irradiance and potential ocular impacts as a function of distance from the glare source.

12
Figure 4. R-44 helicopter rented from Airworks LV for the aerial glare surveys.
Figure 5 shows the locations of the aerial photographs that were taken to quantify the glare and
potential ocular impacts at distances ranging from ~1 – 20 miles (1.6 – 32 km). Video of the
glare was also recorded around the entire site (Units 1, 2, and 3).
Figure 5. Locations of aerial photos that were taken of the glare visible at ISEGS (located within the circle), April 24, 2014. The “DSC” labels refer to the photo numbers in Table 2.
~23 miles~3 miles
I-15
To Las Vegas, NV
Unit 1
Unit 2
Unit 3
ISEGS

13
3.2. Results
Figure 6 shows photos of glare observed at various locations around ISEGS taken from the
helicopter. The glare was bright and visible in all radial directions from ISEGS out to distances
greater than 20 miles (32 km) from the site. Filtered images of the glare (Figure 7) reveal that
the source of the intense glare is from heliostats in standby mode in which they are aimed at
points next to the receiver rather than on the receiver itself. The diffuse reflections from the
receiver produce irradiances that are much lower than the specular reflections from the heliostat.
In fact, filtered images of the glare in Figure 7 show that the receiver appears dark relative to the
glare from the heliostats. Figure 7 also shows that the glare from Unit 1 visible from a particular
observation point is caused by multiple heliostats on both sides of the receiver. Typically,
heliostats in standby mode are aimed toward a ring of points around the receiver, with each
heliostat along a radial line aimed toward a single point next to the receiver. The use of two
standby points on either side of the receiver for “pairs” of heliostats along a radial line or zone
from Unit 1 was confirmed during personal communication with Brightsource operators.
Although glare from standby heliostats at Units 2 and 3 was also visible, it was not clear if those
units implemented “pairs” of heliostats aimed toward both sides of the receiver. In all cases, as
the azimuthal position of the heliostats change around the tower, the standby aim points also
revolve around the receiver, creating a ring of aim points (see Section 3.3).
The elevation at which glare was observed ranged from ~5000’ – 8400’ above mean sea level,
depending on the distance from the site. The ground elevation at ISEGS ranges from ~2800’ –
3300’ above mean sea level. At a particular distance, higher elevations will yield glare from
heliostats closer to the tower while lower elevations will yield glare from heliostats further from
the tower. Section 3.3 demonstrates that a toroid of glare is formed in the airspace above ISEGS
from heliostats in standby mode. The region for potential glare is fairly ubiquitous, but regions
where glare might not be observed include high elevations directly above the receiver and low
elevations at distances far from the site. However, because of the presence of the three separate
units, glare will likely be visible in the airspace around ISEGS at all locations whenever the site
is in view and when heliostats are in standby mode.
14
Figure 6. Photos of observed glare at various locations around ISEGS during aerial survey, April 24, 2014, 9:15 – 10:30 AM PDT.

15
Figure 7. Top left: photo of heliostat glare looking northeast at Unit 1, 9:10 AM PDT (~3 miles away from glare). Top right: filtered image of glare. Bottom: Additional filtering
shows individual heliostats producing glare.
Table 2 summarizes the irradiance and ocular impact of the glare at various aerial locations
around ISEGS. The peak retinal irradiance and subtended angle from a single heliostat image
was determined from the photographs of glare using the PHLUX method [10, 11]. The
subtended angle of the entire glare source in the photograph was calculated by assuming the
entire glare from the visible heliostats formed a single contiguous glare source. The total
subtended angle, which is proportional to the square root of the visible glare area, is then
calculated as the product of the subtended angle of the single heliostat image and the square root
of the total number of visible heliostat images in the photograph. The DNI ranged from 790 –
860 W/m2 during the survey, with most of the photos taken at a DNI of 850 W/m
2. Most of the
photos that were quantified using the PHLUX method were taken of the glare from Unit 1 for
consistency. A few photos were taken of Unit 3 and processed in Table 2, but no helicopter
images were quantified of Unit 2. Units 1 and 3 appeared to produce the most amount of glare
during the survey up to distances of ~20 miles (32 km) (see Figure 6).
Results show that the retinal irradiance and subtended source angle of the glare were sufficiently
large to produce ocular impacts (potential for after-image) out to a distance of 6 miles (10 km).
The retinal irradiance is highest (~6 W/cm2) at locations close to the site, but atmospheric
attenuation reduces the irradiance at longer distances. The subtended angle also decreases with
increasing distance, and this reduces the potential ocular impact as shown in the Ocular Hazard
Plot in Figure 3. Section 3.3 presents models that show that as the observer distance increases,

16
the number of visible glare-producing heliostats decreases at any particular location. At
distances greater than ~6 miles (10 km), a low potential for after-image exists from the heliostat
glare as a result of the reduced retinal irradiance and subtended angles. It should be noted that
two of the authors who were in the helicopter qualitatively confirmed these results after
observing the glare. The pilot acknowledged that the glare was very bright, but he also stated
that it did not impair his flying ability since he was aware of the glare and avoided looking in
that direction when flying over ISEGS.
Table 2. Processed data from photos of glare at ISEGS (4/24/14).
Image Tower Unit
Approximate Distance to
Glare (miles)
Peak Retinal Irradiance (W/cm^2)
Total Subtended
Glare Angle* (mrad) Ocular Impact
DSC 26 1 1 6.39 4.13 Potential for Temporary After-Image
DSC 28 1 (left aim
point) 3 5.10 1.60 Potential for Temporary After-Image
DSC 28 1 (right aim
point) 3 2.81 1.90 Potential for Temporary After-Image
DSC 08 3 4 2.12 3.64 Potential for Temporary After-Image
DSC 08 3 4 1.98 4.03 Potential for Temporary After-Image
DSC 30 1 6 2.15 3.47 Potential for Temporary After-Image
DSC 65 1 6 4.25 1.60 Potential for Temporary After-Image
DSC 32 1 7 5.45 1.06 Low Potential for After-Image
DSC 34 1 11 5.29 0.586 Low Potential for After-Image
DSC 41 3 15 1.39 0.760 Low Potential for After-Image
DSC 53 3 23 0.112 0.541 Low Potential for After-Image
*Subtended angle is assumed proportional to the square root of the number (area) of visible heliostats producing glare.
3.3. Modeling of Standby Heliostats
Figure 8 shows a simulation of the illuminated region around the tower when the heliostats are in
a standby mode (i.e., aimed at a ring of locations next to the receiver, creating a large toroid of
illumination in the airspace above the tower). To better understand this illustration, one can
imagine that the heliostat field forms a “wheel” around the base of the tower. Heliostats along
each “spoke” of the wheel are aimed to the same point next to the receiver. Different spokes of
heliostats will have different aim points that form a ring around the receiver. If all the heliostats
are positioned in standby mode in this fashion, a toroid of glare will be formed that is defined by
the radius of the heliostat field (heliostats closest to the tower will define the most vertical rays
of reflected light, and the heliostats furthest from the tower will define the most horizontal rays

17
of reflected light). A band free from glare exists at an elevation near the receiver, and the left
photograph in Figure 8 illustrates similar behavior. The bright spot to the right of the receiver in
the photograph is caused by accumulated particulates in the air above the air cooled condenser,
which draws ambient air through a series of large fans near the base of the tower (the visible
building next to the tower).
Figure 8. Photo (left; Ryan Goerl, NRG) and model (middle and right) of illuminance from heliostats aimed at a standby point near the top of the tower, forming a toroid of glare in
the airspace.
Figure 9 shows the estimated maximum number of heliostats that can produce glare as a function
of heliostat distance to the aim point and observer distance from the heliostat using equations in
Ho et al. [9]. The model assumes specular reflections from standby heliostats aimed at a fixed
position next to the receiver such that the maximum glare spot size can be represented by a
parabolic reflector with a diameter equal to the radius of the heliostat field (distance between the
outer and inner rows of heliostats). The predicted number of visible heliostats was relatively
insensitive to the assumed diameter of the parabolic reflector, but it was more sensitive to the
distance between the heliostat and aim point, as well as the observer location if it was near the
aim point. Assuming a direct normal irradiance of 1000 W/m2, a heliostat reflectance of 0.93,
and typical ocular parameters [9], the model predicts a potential for after-image out to ~6 miles
(~10 km), similar to the aerial surveys. It should be noted that a single 15 m2 heliostat is
predicted to produce a potential for after-image up to a distance of 2.5 miles (~4 km).

18
Figure 9. Maximum number of standby heliostats that can produce glare as a function of observer distance and distance between the heliostats and aim point.
A Tower Illuminance Model (TIM) is being developed at Sandia that will allow simulated
“flyovers” of power towers with prescribed height, diameter, heliostat field size, reflectance, and
other relevant parameters to determine the irradiance and potential ocular impact at any location
in the airspace above the site. Figure 10 shows a screen image of the tool under development.
0.1
1
10
100
1 10 100
Max
Nu
mb
er
of
He
liost
ats
that
can
P
rod
uce
Gla
re
Observer Distance (miles)
Heliostat distance to aim point = 1000 m
Heliostat distance to aim point = 750 m
Heliostat distance to aim point = 250 m
19
Figure 10. Sandia/DOE is developing a 3D tool that allows the user to “fly” around a
power tower plant to determine the irradiance and potential ocular hazards from heliostat reflections at any location.
4. GROUND-BASED GLARE SURVEYS
4.1. Approach
Similar to the aerial surveys, photographs were taken using a D90 camera and Tiffen neutral
density filters from ground-based locations around the site and along I-15. The PHLUX method
[10, 11] was used to quantify the irradiance and potential ocular impacts at various locations. In
addition, videos were taken while driving both southbound and northbound along I-15 (Figure 12
and Figure 13).

20
Figure 11. Locations of ground-based photographs of glare around Unit 1 at ISEGS.

21
Figure 12. Photograph of illuminated receivers at Units 2 and 3 while heading southbound along I-15.
Figure 13. Photograph of illuminated receivers at Units 1, 2 and 3 while heading northbound along I-15.

22
4.2. Results
Figure 14 shows an example of a processed image of the glare from the Unit 1 receiver as
viewed from I-15 approximately 1.5 miles (2.4 km) away. The processed image of the
photograph of the receiver shows bright spots on the white heat shields above and below the
receiver, which is black and less reflective.
Figure 14. Photo (left) and measured irradiance profile (right) of unit 1 receiver from I-15 (~1.5 miles away) at ~1:00 PM PDT, 4/24/14.
The cumulative ocular impact of the reflected light from the entire receiver structure is shown in
Figure 15. The retinal irradiance from the receiver glare was approximately 0.001 W/cm2 (much
lower than the 6 W/cm2 peak retinal irradiance received from standby heliostats), and the
subtended angle of the glare was nearly 20 mrad (much greater than the maximum subtended
angle of 4 mrad from the standby heliostats at a mile away). Figure 15 shows that the combined
effect of the retinal irradiance and subtended angle of the receiver glare is a “low potential for
after-image.” After viewing the glare from the receiver, two of the authors noted that, while
bright, no prolonged after-image was observed. In addition, during the drive-by surveys along I-
15, the driver did not notice any visual impairment, primarily because the glare source was off to
the side and not within the driver’s line of sight.

23
Figure 15. Ocular hazard plot of glare from unit 1 receiver at ~1 PM PDT, 4/24/14. The glare has a “low potential for after-image.”
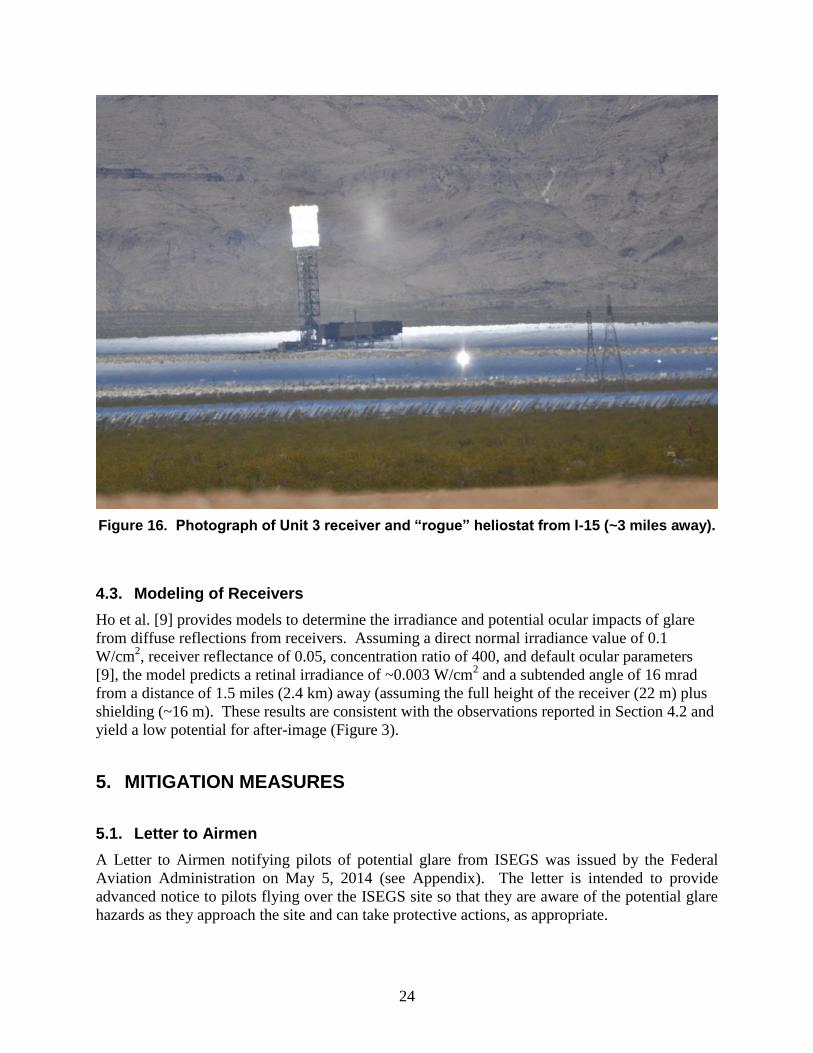
Figure 16 shows a photograph of the Unit 3 receiver viewed from I-15, along with a “rogue”
heliostat that is reflecting the sunlight toward I-15. Occasionally, the authors observed glare
from individual heliostats visible along the highway, and photographs were taken. When
processed, the image of the glare from an individual heliostat had a “low potential for after-
image”, but the retinal irradiance and subtended angle were close to the ocular threshold for
after-image. While these rogue heliostats may pose an ocular impact while stationary, the
authors noted that while driving, the glare was only momentary and off to the side. Therefore,
the ocular impact from individual rogue heliostats was not perceived to be significant.
24
Figure 16. Photograph of Unit 3 receiver and “rogue” heliostat from I-15 (~3 miles away).
4.3. Modeling of Receivers
Ho et al. [9] provides models to determine the irradiance and potential ocular impacts of glare
from diffuse reflections from receivers. Assuming a direct normal irradiance value of 0.1
W/cm2, receiver reflectance of 0.05, concentration ratio of 400, and default ocular parameters
[9], the model predicts a retinal irradiance of ~0.003 W/cm2 and a subtended angle of 16 mrad
from a distance of 1.5 miles (2.4 km) away (assuming the full height of the receiver (22 m) plus
shielding (~16 m). These results are consistent with the observations reported in Section 4.2 and
yield a low potential for after-image (Figure 3).
5. MITIGATION MEASURES
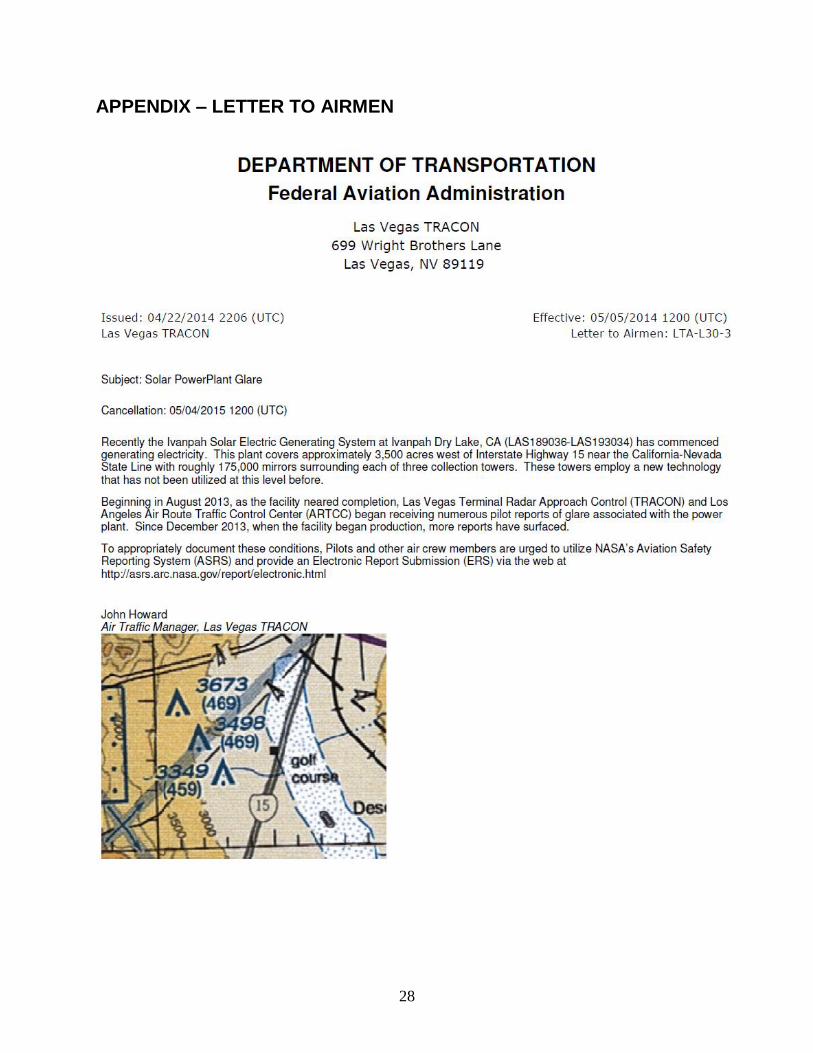
5.1. Letter to Airmen
A Letter to Airmen notifying pilots of potential glare from ISEGS was issued by the Federal
Aviation Administration on May 5, 2014 (see Appendix). The letter is intended to provide
advanced notice to pilots flying over the ISEGS site so that they are aware of the potential glare
hazards as they approach the site and can take protective actions, as appropriate.

25
5.2. Modification of Heliostat Standby Positions
Brightsource and NRG are also investigating new strategies and algorithms for heliostat standby
positions to reduce the irradiance and number of heliostats that can reflect light to an aerial
observer. Some strategies that Sandia has recommended include the following;
Increase the number of aim points near the receiver and have adjacent heliostats point to
different locations so that the number of glare-producing heliostats visible from the
airspace above is minimized at all locations
Position heliostats vertically or in other orientations that minimize glare
Bring heliostats up to standby position at top of receiver sequentially as needed to avoid
having a large number of heliostats reflecting light into the airspace above
Incorporate a glare shield near the receiver that can serve as both the aim point for
heliostats in standby mode and a preheater for the water entering the receiver
6. SUMMARY AND CONCLUSIONS
Aerial and ground-based surveys have been conducted to identify the causes and potential impact
of glare observed at ISEGS. These surveys satisfy, in part, monitoring requirements prescribed
in the Heliostat Positioning Plan and the Power Tower Luminance and Monitoring Plan [3, 4].
Findings from the aerial and ground-based surveys are summarized as follows:
Aerial Surveys
o Heliostats in standby mode can cause glare to aerial observers (pilots)
o Glare from heliostats can cause after-image at far distances (up to 6 miles in our
helicopter surveys)
o Glare was visible from multiple heliostats in standby mode
o Glare from Unit 1 originated from standby heliostats on both sides of the receiver
during the survey on April 24, 2014
o The glare from the illuminated receiver was small compared to the glare from the
standby heliostats
Ground Surveys
o Drive-by surveys at three different times of the day did not reveal any ocular
hazards
o All data from receiver glare showed a low potential for after-image
o Glare from an occasional rogue heliostat was visible from I-15, but it was not
perceived to be a significant ocular hazard
Modeling
o Modeling of both specular reflections from heliostats and diffuse reflections from
the receiver predicted retinal irradiances, subtended angles, and ocular impacts
that were consistent with the results of the aerial and ground surveys

26
Mitigation measures that have been implemented include a Letter to Airmen that was issued on
May 5, 2014, notifying pilots of potential glare at ISEGS. In addition, new strategies for
positioning heliostats in standby mode are being developed and implemented to reduce the
potential impacts of glare.
ACKNOWLEDGMENTS
Sandia National Laboratories is a multi-program laboratory managed and operated by Sandia
Corporation, a wholly owned subsidiary of Lockheed Martin Corporation, for the U.S.
Department of Energy’s National Nuclear Security Administration under contract DE-AC04-
94AL85000.
REFERENCES
[1] California Energy Commission, Letter re Pilot Complaints of Visual Impacts from Ivanpah
Solar Electric Generating System, Docket #07-AFC-05C, TN #201847, March 10, 2014,
http://www.energy.ca.gov/sitingcases/ivanpah/.
[2] California Energy Commission, Email Re: Request for Ivanpah Report, dated June 10,
2014, Docket #09-AFC-07C, TN #202585, June 24, 2014,
http://www.energy.ca.gov/sitingcases/ivanpah/.
[3] CH2MHILL, 2013, Heliostat Positioning Plan for the Ivanpah Solar Electric Generating
System Eastern Mojave Desert San Bernardino County, California, Prepared for Solar
Partners I, LLC; Solar Partners II, LLC; and Solar Partners VIII, LLC, September 2013,
Revision 1.
[4] CH2MHILL, 2013, Power Tower Luminance Monitoring Plan for the Ivanpah Solar
Electric Generating System Eastern Mojave Desert San Bernardino County, California,
Prepared for Solar Partners I, LLC; Solar Partners II, LLC; and Solar Partners VIII, LLC,
September 2013, Revision 1.
[5] Saur, R.L. and S.M. Dobrash, 1969, Duration of Afterimage Disability after Viewing
Simulated Sun Reflections, Applied Optics, 8(9), p. 1799-1801.
[6] Sliney, D.H. and B.C. Freasier, 1973, Evaluation of Optical Radiation Hazards, Applied
Optics, 12(1), p. 1-24.
[7] Nakagawara, V.B., K.J. Wood, and R.W. Montgomery, 2003, Natural Sunlight and Its
Association to Aviation Accidents: Frequency and Prevention, DOT/FAA/AM-03/6, Civil
Aerospace Medical Institute, Federal Aviation Administration, Oklahoma City, OK,
[8] Osterhaus, W.K.E., 2005, Discomfort glare assessment and prevention for daylight
applications in office environments, Solar Energy, 79(2), p. 140-158.
27
[9] Ho, C.K., C.M. Ghanbari, and R.B. Diver, 2011, Methodology to Assess Potential Glint and
Glare Hazards From Concentrating Solar Power Plants: Analytical Models and
Experimental Validation, Journal of Solar Energy Engineering-Transactions of the Asme,
133(3).
[10] Ho, C.K. and S.S. Khalsa, 2012, A Photographic Flux Mapping Method for Concentrating
Solar Collectors and Receivers, Journal of Solar Energy Engineering-Transactions of the
Asme, 134(4).
[11] Ho, C.K., Relieving a Glaring Problem, in Solar Today2013, American Solar Energy
Society: Boulder, CO. p. 28 - 31.
28
APPENDIX – LETTER TO AIRMEN

29
DISTRIBUTION
External
Federal Aviation Administration
FAA Southwest Regional Office
Obstruction Evaluation Service, AJR-32
2601 Meacham Boulevard
Fort Worth, TX 76137-0520
California:
Karen McDonald
(310) 725-6557
Nevada:
Robert Alexander
(718) 553-4546
Brian Armstrong
FAA Western-Pacific Region
Airports Division, AWP-600
P.O. Box 92007
Los Angeles, CA 90009
(310) 725-3600
David B. Kessler, AICP
Project Manager, Southern Nevada Supplemental Airport Environmental Impact Statement
FAA Western-Pacific Region
P.O. Box 92007
Los Angeles, CA 90009
(310) 725-3615
Western-Pacific Airports Division Region/ADO
SECTION 6.0: MONITORING AND RECORDKEEPING
ES062007009SSAC/438842/PANAGON 6-5
U.S. Navy
Terry Hansen
Airspace and Range Encroachment and Sustainment Manager
Marine Corps Installations West

30
Box 555019
MCIWEST-MCB
Camp Pendleton, CA
(760) 763-6405
Caltrans
Darren Cook
Public Information Officer
Caltrans District 8
464 West 4th Street, MS 1229
San Bernardino, CA 92401
(909) 383-6799
Jamal Elsaleh, PE, PMP
Regional Project Manager
Caltrans, District 8
464 West 4th Street, MS 1229
San Bernardino, CA 92401
(909) 556-8852
Jamal.Elsaleh @dot.ca.gov
Moe Bhuyian
Caltrans South Region Transportation Permits Office
655 West 2nd Street
San Bernardino, CA 92404-1400
(909) 383-4637
California Highway Patrol
Captain Larry Maher
California Highway Patrol, Research and Planning Section
P.O. Box 942898
Sacramento, CA 94298-0001
(916) 657-7237
SECTION 6.0: MONITORING AND RECORDKEEPING
6-6 ES062007009SSAC/438842/PANAGON
Jeff P. Talbott, Chief
California Highway Patrol, Inland Division (801)
847 East Brier Drive
San Bernardino, CA 92408-2820
(909) 806-2400

31
Clark County
Rosemary E. Vassiliadis, Director of Aviation
Teresa R. Motley, AICP, Airport Planning Manager
P.O. Box 11005
Las Vegas, NV 89111-1005
(702) 261-5211
Airport Administration: (702) 261-5100 [email protected]
J. Martin
Clark County Public Works
500 South Grand Central Parkway
2nd Floor
Las Vegas, NV 89155
(702) 455-6100
California Energy Commission (CEC)
Mr. Joseph Douglas
Compliance Project Manager
1516 9th Street
Sacramento, CA 95814
Bureau of Land Management
Mike Ahrens
Field Manager
BLM, Needles Field Office
1303 U.S. Hwy 95 S.
Needles, CA 92363
Ph. 760 326 7001
Cell 760 221 8844
Sandia (all electronic copies):
1 MS-1127 Clifford K. Ho, 6123 [email protected]
1 MS-1127 Joshua Christian, 6123 [email protected]
1 MS-1127 Cianan Sims, 6123 [email protected]
1 MS-1127 Subhash Shinde, 6123 [email protected]
1 MS-0899 Technical Library 9536 (electronic copy)
