docker usage patterns - meetup docker paris - november, 10th 2015
TRANSCRIPT

Docker Usage PatternsNo Hype, Just Data
Docker Meetup ParisNov 10, 2015
Benjamin Fernandes Software Engineer — Datadog@LotharSee

About Me
• MS, CS degree from Ecole Centrale ParisFormer chairman at VIA Centrale Réseaux
• Joined Datadog 3 years ago
• Worked on Datadog’s integration with Docker and its ecosystem
Benjamin FernandesSoftware Engineer
Datadog @LotharSee

Quick Overview of Datadog Datadog gathers performance data from all your application and infrastructure components.
• Monitoring for modern applications1. Dynamic Infrastructure2. Containers (Docker, ECS, Mesos, k8s, and more…)3. Microservices
• Time series storage of metrics and events• Trending, alerting and anomaly detection!• We’re hiring! (New York, Paris, Remote)

Monitor Everything Datadog gathers performance data from all your application components.

Why so much Docker?

Avoid Dependency Hell
Who is running Docker today?
Docker Adoption

What about in production?
Docker Adoption

Adopter: the average number of containers running during the month was at least 50% the number of distinct hosts run, or there were at least as many distinct containers as distinct hosts run during the month.
Dabbler: used Docker during the month, but did not reach the “adopter” threshold.
Abandoner: a currently active company that used Docker in the past, but hasn't used it at all in the last month.
Study from 7000 organizations.
Docker Adoption

Turns out you aren’t alone!
Docker Adoption
Source: http://dtdg.co/dckr-adopt

Fact 1: Docker Adoption Up 5x in 1 Year

Docker Adoption Growth We’ve see 5x increase of Docker adoption over the last year.

Fact 2: Docker now runs on 6% of hosts we monitor


Fact 3: Larger Companies Are the Early Adopters!

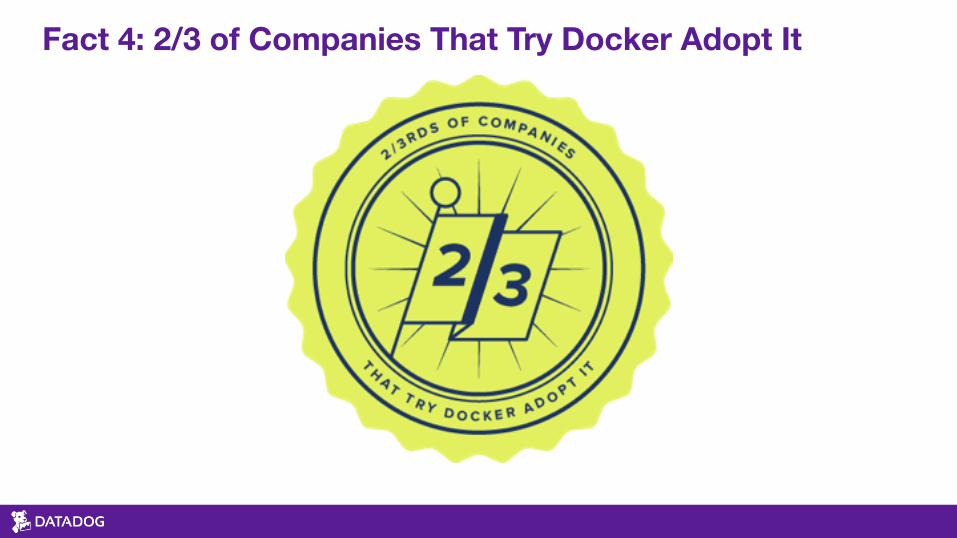
Fact 4: 2/3 of Companies That Try Docker Adopt It


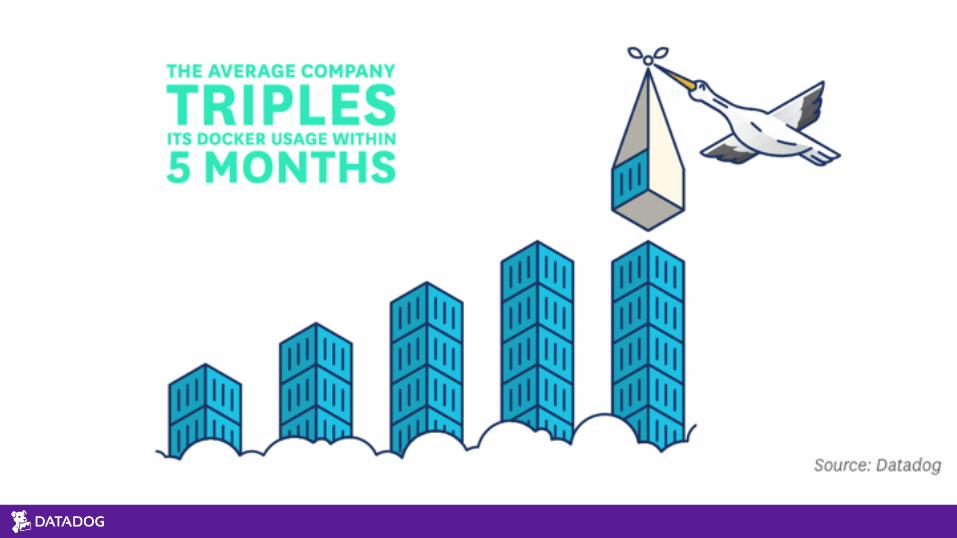
Fact 5: Users 3x the Number of Containers They Use in 5 Months

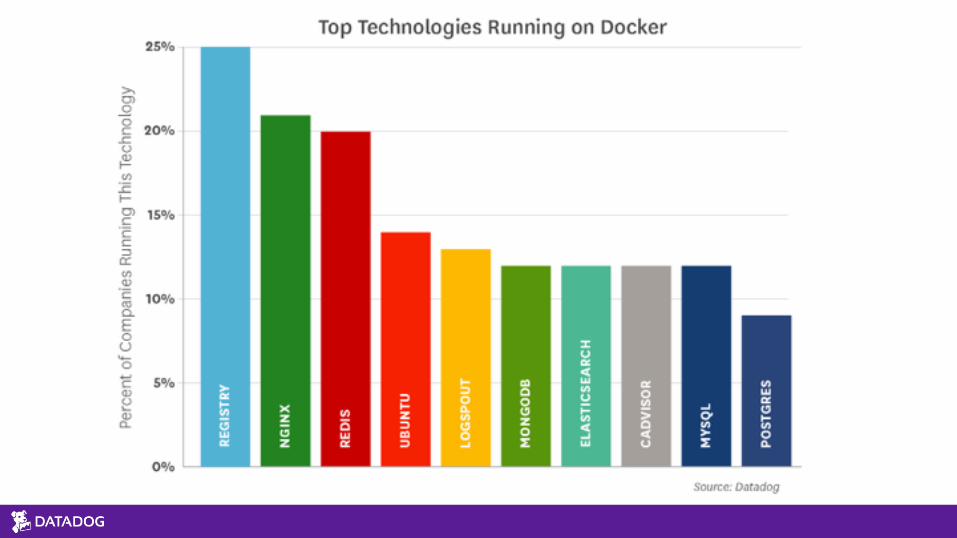
Fact 6: Most Widely Used Images Are Registry, NGINX, and Redis

Fact 7: Docker Hosts Often Run Four Containers at a Time

Fact 8: VMs Live 4x Longer Than Containers


Bonus fact. Thanks The Onion.


Operational Complexity
• Average containers per host: N (N=4, 10/2015)!• N-times as many “hosts” to manage!• Affects!
• provisioning: prep’ing & building containers!• configuration: passing config to containers!• orchestration: deciding where/when containers run!• monitoring: making sure containers run properly
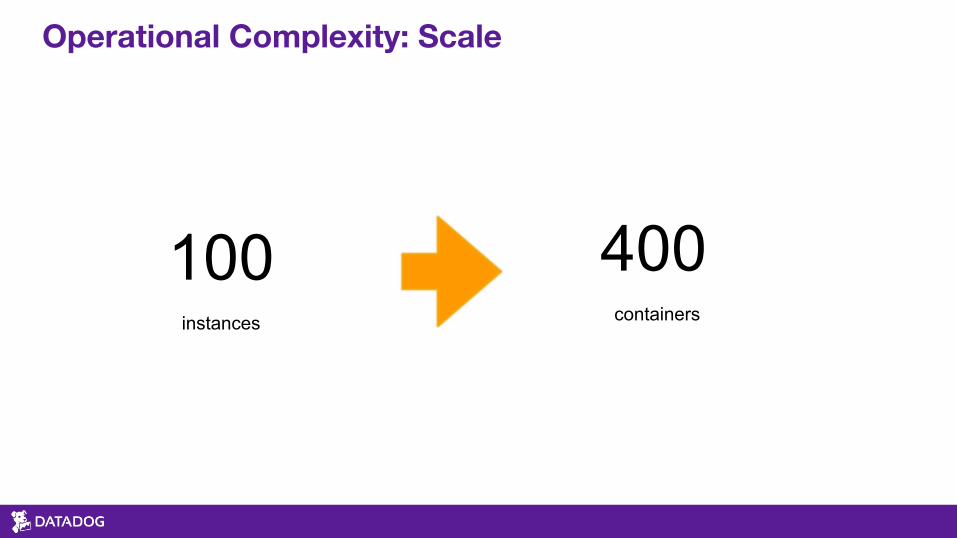
Operational Complexity: Scale
100instances
400containers

Operational Complexity: Scale
160metrics per host
640metrics per host
Assuming 4 containers per host

Operational Complexity: Scale
100instances
64,000metrics
Assuming 4 containers per host

Operational Complexity: Velocity
So what does that mean for monitoring and management?


Monitoring Needs and Pains
• Avoid Static config files tracking dynamic infrastructure.

Monitoring Needs and Pains
• Avoid Static config files tracking dynamic infrastructure. • Avoid a host centric view. Focus on service level.
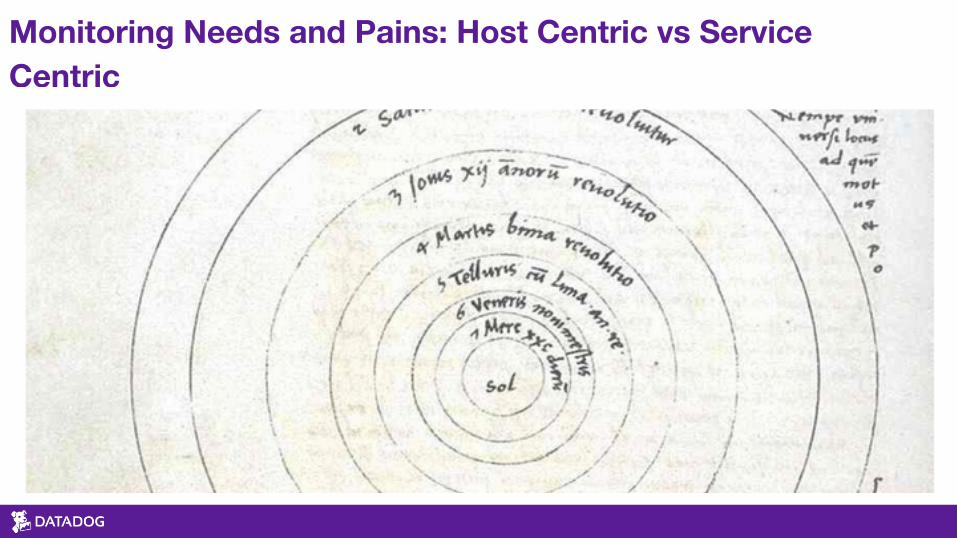
Monitoring Needs and Pains: Host Centric vs Service Centric
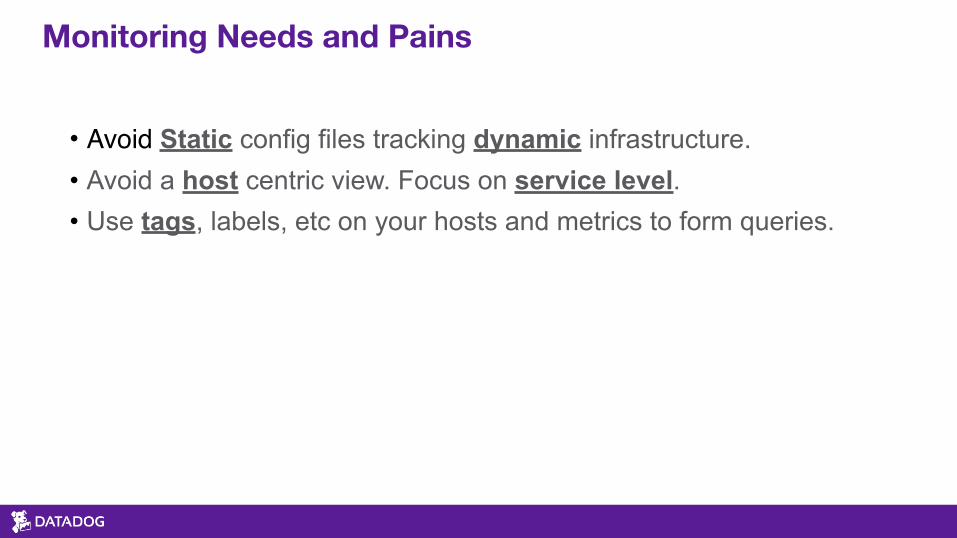
Monitoring Needs and Pains
• Avoid Static config files tracking dynamic infrastructure. • Avoid a host centric view. Focus on service level. • Use tags, labels, etc on your hosts and metrics to form queries.

Monitoring Needs and Pains: Query Based Monitoring
“Show me rate of HTTP 500 responses from nginx” “… in region us-east-1 across all availability zones” “… running my app version 2….”
• Use tags, labels, etc on your hosts and metrics to form queries. • Pull in labels from your infrastructure whether EC2, Docker or your
scheduler. • Ask questions that will ring true regardless of your scale that day.

Monitoring Needs and Pains
• Avoid Static config files tracking dynamic infrastructure. • Avoid a host centric view. Focus on service level. • Use tags, labels, etc on your hosts and metrics to form queries. • Know your underlying tech. In this case Docker and how to pull
metrics from it.

Collecting Docker Metrics

Collecting Docker Metrics: stats
• Continuous live stream of basic CPU, memory, & network metrics.!• At least version 1.5.0 of Docker (released Feb 2015)!!
• docker stats --no-stream $(docker ps -q)

Collecting Docker Metrics: stats api
• Stream of JSON, more detailed

Collecting Docker Metrics: Pseudo Files
• If you want to do it manually!!
• CPU/Mem metrics!• Access via sysfs in /sys/fs/cgroup or /cgroup!• By default do not require root access!
• Network metrics!• /proc/$PID/net/dev!
• Disk IO metrics!• /proc/$PID/io


What to do with that?


Woof!