adelaide - entertainment worlds manuals... · web viewin fact, such expenditures represent the...
TRANSCRIPT

ADELAIDECASINO
GAMING MANUAL

CONTENT OVERVIEW
PREFACE
CHAPTER 1 PLAYER RATING ………………………………………………...11.0 Terminology …………………………………………………………………….3
1.1 Introduction (background) ……………………………………………………. 3
1.2 The Current Adelaide Casino Complimentary Policy ………………………5
1.3 System walkthrough ………………………………………………………….. 6
1.4 Premium player marketing …………………………………………………… 7
1.5 The Adelaide Casino’s Competitors ………………………………………… 7
1.6 Complimentary Policy Profitability ……………………………………………10
1.7 Hard Versus Soft Comps …………………………………………………….. 11
1.8 Rating Efficiency Levels ……………………………………………………… 12
1.9 Conclusion ……………………………………………………………………..12
1.10 A Commentary On Casino Player Rating Systems ……………………….. 13
1.11 Promotional Chips and Tokens ……………………………………………… 28
CHAPTER 2 JUNKET PROGRAM …………………………………………….332.1 Junket Fact Sheet …………………………………………………………….. 35
2.2 Overview of Junkets …………………………………………………………...36
2.3 Extract From Junket Manual ………………………………………………….36
2.4 Cash Chip System Analysis …………………………………………………..49
2.5 Non Negotiable Chip System Non Negotiable Chip Program …………….62
2.6 Premium Player 0.5% (Splinter Policy) ……………………………………...81
2.7 Player Loss ……………………………………………………………………..84
CHAPTER 3 CARD COUNTING ……………………………………………….933.1 Brief Overview ………………………………………………………………….95
3.2 Legalities (Precedents) ………………………………………………………..96
3.3 Counter Measures ……………………………………………………………..97
3.4 Profit Analysis …………………………………………………………………. 99
3.5 Blackjack Simulation Experiment …………………………………………….104
CHAPTER 4 KEY CONCEPTS …………………………………………………1094.1 Sub Optimisation …………….………………………………………………...111
4.2 Hold Percentage ……………………………………………………………….111
4.3 Law of Averages ……………………………………………………………….112

4.4 Money Management ………………………………………………………….. 114
4.5 Psychology Of Gamblers ……………………………………………….……. 115
4.6 Mathematical Expectation …………………………………………………….115
4.7 Standard Deviation (Repeated Trials) ……………………………………….117
4.8 Optimal Betting …………………………………………………………………117
4.9 House Advantage ……………………………………………………………...118
4.10 Throwing Out Ties (Absolute Versus Relative Probability) ………………..119
4.11 Blackjack Win Percentage …………………………………………………… 120
4.12 Blackjack Formula …………………………………………………………….. 121
4.13 Various Numbers of Decks (Blackjack) …………………………………….. 123
4.14 Baiting the Hook ………………………………………………………………. 123
4.15 Baccarat and Chemin De Fer ………………………………………………...124
4.16 Why People Gamble …………………………………………………………..125
4.17 Customers Expectations of Staff ……………………………………………..126
CHAPTER 5 INSPECTOR’S DUTIES …………………………………………1275.1 Inspector Job Specification ……………………………………………….. 129
5.2 Inspectors Manual ………………………………………………………… 131
5.3 Blackjack Game Protection ……………………………………………… 136
5.4 Roulette Game Protection ………………………………………………… 137
5.5 Building Extraordinary Casino Patron Service …………………………… 141
5.6 Casino Supervision – A Basic Guide ……………………………………… 147
5.7 I am Your Guest …………………………………………………………… 148
5.8 Extract from the Pit Boss Training Manual ………………………………. 148
CHAPTER 6 SETTING TABLE MAXIMUM BET LIMITS ……………………1516.1 Background ……………………………………………………………… 153
6.2 Key Principles …………………………………………………………… 153
6.3 Setting proper table limits ……………………………………………….. 154
6.4 Maximum Loss Point ……………………………………………………. 158
6.5 Effect of Variable Bet Distributions ……………………………………… 159
6.6 Non High-End Casino Operation ………………………………………… 162
6.7 Conclusion ……………………………………………………………….. 166
INDEX ………………………………………………………………………………167

PREFACE
The information contained within the following text is intended to provide an interesting insight to the reader on general Casino information and is issued as a basic reference guide.
This has been collated from analyses written by myself and extracts have also been taken from various books and articles.
Whilst a plethora of documentation exists on various Casino games and gaming, very little of this is truly useful. It would seem that generally anyone can write a book on gaming and more particularly on “winning” systems. Texts which I would highly recommend to any Casino staff are as follows:
“The Casino Gamblers’ Guide” by Alan N Wilson “Card Counting for the Casino Executive” by Bill Zender “Playing Blackjack in Atlantic City” by Chambliss and Roginski “The Mathematics of Gambling” by E O Thorp Any works by Peter Griffin Any works by Jim Kilby
Any reading on the subject is obviously worthwhile but I believe these books will assist you in questioning or accepting some of the statements which are made elsewhere.
In closing, I would like to thank Sara Wegener for her painstaking assistance in putting this manual together.
I trust you will find it both interesting and useful as you progress through the Casino industry.
Regards,
Andrew MacDonald

(This page is intentionally left blank)

Chapter 1 Player Rating
“We are in the gambling business not in the business of gambling”

Chapter 1 Player Rating
1.0 Terminology ………………………………………………………………. 3
1.1 Introduction (background) ………………………………………………… 31.1.1 What is player rating? ……………………………………………………... 31.1.2 Why rate players? …………………………………………………………. 31.1.4 How much of a “high rollers” theoretical loss is extended to him/her in
complimentaries? …………………………………………………………. 41.1.5 How do the Casinos generally define “high rollers”? ……………………. 41.1.6 How much revenue is contributed on a yearly basis by rated players? ……41.1.7 Why rebate complimentaries and not cash? ………………………………. 4
1.2 The Current Adelaide Casino Complimentary Policy …………………….. 51.2.1 Formulae and system standards (as at 10.10.1991) ……………………….. 51.2.2 General policy requirements ………………………………………………. 5
1.3 System walkthrough ………………………………………………………. 6
1.4 Premium player marketing ………………………………………………… 7
1.5 The Adelaide Casino’s Competitors ………………………………………. 71.5.1 Wrest Point Casino complimentary policy (extract) Wrest Point .……….. 71.5.2 Wrest Point Casino system standards …………………………………….. 81.5.3 Jupiters Casino Complimentary policy (extract) Jupiters ………………… 81.5.4 Jupiter’s Casino system standards ………………………………………… 81.5.5 Sheraton Breakwater (Townsville) complimentary policy ……………….. 91.5.6 Sheraton Breakwater system standards …………………………………… 10
1.6 Complimentary Policy Profitability ……………………………………….. 101.6.1 System Weaknesses ……………………………………………………….. 10
1.7 Hard Versus Soft Comps …………………………………………………. 11 1.7.1 Definitions ………………………………………………………………… 111.7.2 Implications ……………………………………………………………….. 11
1.8 Rating Efficiency Levels ………………………………………………….. 12
1.9 Conclusion ………………………………………………………………… 12
1.10 A Commentary On Casino Player Rating Systems ……………………….. 131.10.1 Introduction ………………………………………………………………. 131.10.1 Four Most Common Player Rating System Weaknesses ………………… 131.10.2 System Development ……………………………………………………... 181.10.3 Criteria Development ……………………………………………………… 181.10.3 Summary and Conclusions ……………………………………………….. 26
1.11 Promotional Chips and Tokens ………………………………………….. 28

1.0 Terminology
The following Casino terminology/abbreviations are used extensively throughout this report:
Comps. Complimentaries (eg. room, food, beverage etc.) extended to a third party at partial or no cost.
Bottom line Net profit after all costs have been deducted.Bev. BeverageAv. Bet Average betBJ BlackjackAR American RouletteMB Mini BaccaratBA BaccaratB&S Big and SmallPRS Player Rating System – Computerised database used to maintain player
information.VIP Very Important Person Line Credit line/facility
1.1 Introduction (background)
1.1.1 What is player rating?
Player rating is a system by which a player’s worth/value to the profitability of the Casino Operation is approximated.
1.1.2 Why rate players?
Once a player’s value is determined, complimentaries such as room, food and beverage, airfare reimbursement etc. may be offered to that player as an enticement for a return visit to the Casino. This is a valuable marketing tool used to penetrate the premium or “high roller” market both interstate and overseas.
1.1.3 How is a player rated? Various rating systems exist however the systems in Australian Casinos at present rely on gaming personnel to provide the following information on individual players:
buy in
average bet (bet range)
time played
win/loss
game played (decision rates)
location
This source information is collated and utilised to calculate a theoretical win by applying the following formula.
Theoretical win = average bet x time played x hands/hour x game edge.

The game edge is the mathematical expectation based on game odds, probabilities, and distribution of play.
The hands/hour information may be based on average decision rates from gaming surveys of individual games or may be provided by the gaming personnel at time of rating.
1.1.4 How much of a “high rollers” theoretical loss is extended to him/her in complimentaries? This may vary from player to player and Casino to Casino. Other Australian Casinos offer between 25 and 50 percent return based on theoretical win and other conditions.
1.1.5 How do the Casinos generally define “high rollers”?
Some Casinos require a minimum bankroll (deposit) to qualify and/or minimum average bet requirements, these may vary by player’s state or origin and game played etc. In Tasmania for example the minimum bankroll required is $10,000 for Victorian players with an average bet of $150. The Adelaide Casino policy at present is to require a minimum wager amount to qualify. Whilst this may seem low by comparison the complimentaries offered to a player playing the minimum required are also much lower.
Bankroll requirements are generally meaningless when turnover is utilised and comps. provided based of play levels.
1.1.6 How much revenue is contributed on a yearly basis by rated players?
While this is not greatly significant in itself for an operation of this size, given that the general Casino infrastructure would already exist this is an important potential increment to bottom line profit.
1.1.7 Why rebate complimentaries and not cash?
Complimentaries are often “soft” costs to the Casino operator. For example in-house food and beverage complimentaries may really only cost the operator the cost of the ingredients and the preparation time. Therefore the real cost differs from the retail cost of the complimentary. This is also true of room costs if the Casino is part of a hotel/Casino complex. In this case the real cost depends on percentage occupancy and possibly the real cost during off season periods may be as low as the cost of cleaning the room. This means that the Casino operators rebate based on theoretical win can really be non existent until such time as external costs are incurred, as soon as this happens bottom line is affected. The other obvious problem with cash rebates is the fact that generally with high level premiums the players expenses do not meet the complimentary value, however with a cash rebate the maximum would always be paid out. Another problem is the inherent inaccuracy of player rating in this manner (ie totally accurate turnover and game edge information is often not available), therefore costs incurred could be greater than the potential revenue achieved in some cases.
Thus complimentaries such as room, food and beverage may be easier comps. to provide and can be in some cases a cost free marketing tool.
1.2 The Current Adelaide Casino Complimentary Policy
1.2.1 Formulae and system standards (as at 10.10.1994)
The current policy is based on the following formula, decision rates and game edges.

Complimentary value = complimentary % x (theoretical win – tax – staff costs)
Complimentary % = 50% standard
Theoretical win = av. bet x time played x hands/hr x edge
Tax % = 20%
Staff costs = $10 / hour of recorded play
SYSTEM STANDARDS
GAME LOCATION SYSTEM SYSTEM DECISION HOUSE RATE/HR ADVANTAGE
BJ CGA 63 1.30%BJ IR 76 1.30%AR CGA 36 2.70%AR IR 33 2.70%MB CGA 58 1.26%MB IR 53 1.26%BA IR 41 1.26%TWO UP CGA 45 3.13%CRAPS CGA 50 1.50%BIG WHEEL CGA 42 7.69%B&S CGA 46 2.78%KENO CGA 1 23.00%Keno decision rate 1 as turnover figures utilised
CGA = Common Gaming Area
IR = International Room
1.2.2 General policy requirements
COMPLIMENTARY AVERAGE BET REQUIREMENT
2 nights at Hyatt $50 per hand/spin*
Regency Adelaide
* based on 12 hours playing time
Airfare reimbursements are based on the formula provided in 3.1, therefore depending on the cost of the ticket average bet details may vary. The Casino’s Melbourne policies are based on 12 hours play during a visit and 15 hours play for players from other locations.
1.3 System walkthrough
a. An interstate or overseas player having either identified themselves or having been identified by a member of the Casino staff is provided with the general policy details.
b. The players name and other details are taken with a file being opened on that player in the Player Rating System. This file maintains player details and individual transaction details.

c. Prior to a player’s arrival their name, flight/arrival details, accommodation and special requirements (if any) are placed on a VIP list which is distributed to various Casino personnel.
d. On arrival at the Casino the player receives a package containing an identifying rating card and vouchers to allow dining in the Pullman Restaurant (these are now provided only if authorised by the Player Development Manager).
e. The player on arriving at a gaming table is to present their rating card to the table Inspector. This identifies the player to the Inspector and makes him/her aware that the player is to be rated. The inspector then transcribes information from the rating card to a worksheet also noting the time of commencement and initial buy in details.
f. The Inspector’s worksheet is updated for the duration of the player’s play at that table.
g. On the player leaving the table, the Inspector finalises details for that player on his/her worksheet. The following information is then transcribed to a rating sheet:-
Players full name and number Game played Location Buy in Average bet Win/loss Time played Date Inspectors name Pit Boss name
h. This data is then entered into the Casino’s computer system (AS/400 Player Rating System) by another member of staff.
i. Having been entered, the system automatically updates the player’s transaction file for that visit and a complimentary value is calculated and displayed on the player’s visit/totals file.
j. The player’s file is continually updated with gaming transactions for the duration of the stay with the expenses incurred by that player being entered against the complimentary value. Generally speaking all reimbursements are made after the players current comp. value has been referred to.
k. On the player leaving, their comp. value is reviewed with reimbursement of the players expenses made accordingly.
l. Each player’s visit is treated separately however on occasions practical business decisions may be based on previous play levels. Also should the player suffer a substantial “premature” loss without accruing turnover and therefore comp. value, 10% of the loss may be extended to the player in complimentaries.
1.4 Premium player marketing
The Adelaide Casino penetrates the premium player market by the following means:-a. interstate and overseas offices (offices are located in Melbourne and Singapore)b. promotions and tournaments (eg High Stakes, Blackjack)c. special events (Grand Prix)d. telemarketinge. direct marketing

f. advertising (magazines etc)
1.5 The Adelaide Casino’s Competitors
Obviously given that a premium player’s contribution is an important potential increment to bottom line profitability, fierce competition exists between Casinos in an attempt to gain a larger market share. Therefore each Casino tends to offer slightly different policies to entice players as well as offering various combinations of the aforementioned marketing packages.
As far as the Australian premium player market is concerned the main competitors to the Adelaide Casino are Jupiter’s Casino on the Gold Coast and the two Tasmanian Casinos operated by Federal Hotels. The primary reason that these Casinos are competitors is basically proximity to the large Eastern seaboard markets of Melbourne and Sydney. The Tasmanian Casinos success may be due in some degree to player loyalty established through a long association both with the Casino and individual staff members (West Point Casino in Hobart opened in 1972 and held a virtual monopoly until the major Australian Casinos developments of 1985).
The Jupiters Casino on the Gold Coast has only recently moved into the premium player market with their Club Conrad opening in 1989. The success of this operation may rely on proximity to the Sydney market, the resort facilities offered, climate and general Gold Coast facilities. Both operators would also suggest excellence of service plays a role.
In terms of competition for the overseas premium player it is first necessary to establish that due to proximity the Asian market is the most lucrative and has the greatest potential for Australian Casino operators.
The Adelaide Casino’s Australian competitors for this market are Burswood Resort Casino (Perth), Diamond Beach Casino (Darwin) and Jupiter’s Casino (Gold Coast). Due to the immense population base and wealth (albeit of a small percentage) of this area makes this a very competitive market. The proximity and resort facilities provide our competitors with some advantages, however, the Adelaide Casino’s service levels still provide an acceptable market share. Still in dollar terms the local premium market, due to a greater total volume of players, is the Adelaide Casino’s primary market.
1.5.2 Wrest Point Casino complimentary policy (extract) Wrest Point
STATE OF ORIGIN AMOUNT AVE BET
Victoria 10 000 $150NSW, SA & ACT 15 000 $200Queensland 15 000 $250WA & NT 20 000 $300
“To qualify for Premium Player Status, the following conditions must be observed. Playing time per day has to be a minimum of four hours duration but not necessary at one sitting, in order to qualify for one economy airfare and two nights in house accommodation. Upon arrival at the Casino you must exchange cash or bank cheques for cheque credits at the Casino Cash Desk. The amount to be lodged, and the average bet per hand or spin varies depending on the player’s state of origin. The table above should assist you.
Premium players are requested to wear a VIP pin at all times, to enable our staff to provide you with the attention you deserve”.
1.5.3 Wrest Point Casino system standards

Complimentary value (max) = 30% x theoretical win
GAME DECISION RATE EDGE
BJ 80 2.0%AR 60 2.7%BA 40 1.0%
Also 20% payable on substantial loss greater than 3500.
1.5.3 Jupiters Casino Complimentary policy (extract) Jupiters
PLAYER DEPOSIT/LINE MIN. AVE IN HOUSE MAXREIMBURSEMENT BET COMPLIMENTARY AIRFARE
$3 000 $50 Room only 0$5 000 $50 Room only 0
$100 R,F,B 0$ 7 500 $100 R,F,B 0
$150 R,F,B $250$10 000 $125 R,F,B 0
$150 R,F,B $250$175 R,F,B $400
$15 000 $150 R,F,B $250$175 R,F,B $400$200 R,F,B $550
1. Complimentaries are based on playing requirements of four hours per day.
2. Maximum guest trips shall be three nights/four days.
3. In house complimentaries of room, food and beverage are extended to the player and one guest. All other charges are the responsibility of the player and shall be settled on check out.
4. Airfare reimbursements are based on a minimum of 12 hours playing time.
5. A player’s complimentary level may be reduced if his average bet size falls below the expected level as indicated by his deposit/line.
6. A player who loses a significant portion of his deposit/line shall be entitled to the maximum level of complimentaries available to him, regardless of his average bet size.
1.5.4 Jupiter’s Casino system standards
GAME DECISION RATE EDGE__________________________________________________
BJ 60 2.0%AR 60 2.0%BA 45 1.27%CR 40 2.5%TU 35 3.1%BS 45 4.0%

BW 40 4.0%MB 60 1.27%KE 10 27.0%
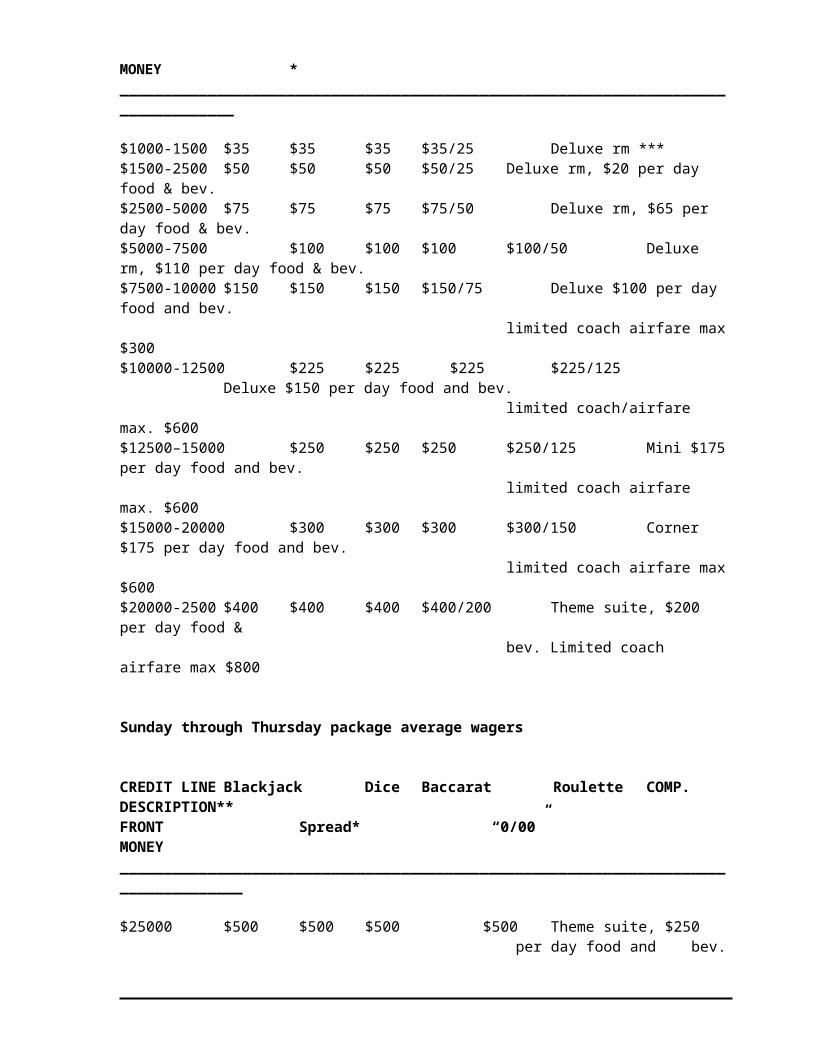
1.5.5 Sheraton Breakwater (Townsville) complimentary policy
A player should begin by establishing a credit line with the Casino, or by depositing front money at the Casino cage commensurate with the playing levels described below.
All complimentary room, food, beverage and airfare reimbursement are based on a minimum of four hours of play per day or multiples thereof. Complimentary privileges are extended for a maximum of four nights (16 hours of play). A minimum of 12 hours of play is required for airfare reimbursements (see 5 to 10 over).
Sunday through Thursday package average wagers
CREDIT LINE BLACK DICE BACC- ROULETTE COMP. DESCRIPTION**FRONT JACK SPREAD ARAT “0”/”00”MONEY *__________________________________________________________________________________
$1000-1500 $35 $35 $35 $35/25 Deluxe rm ***$1500-2500 $50 $50 $50 $50/25 Deluxe rm, $20 per day food & bev.$2500-5000 $75 $75 $75 $75/50 Deluxe rm, $65 per day food & bev.$5000-7500 $100 $100 $100 $100/50 Deluxe rm, $110 per day food & bev.$7500-10000 $150 $150 $150 $150/75 Deluxe $100 per day food and bev.
limited coach airfare max $300$10000-12500 $225 $225 $225 $225/125 Deluxe $150 per day food and bev.
limited coach/airfare max. $600$12500–15000 $250 $250 $250 $250/125 Mini $175 per day food and bev.
limited coach airfare max. $600$15000-20000 $300 $300 $300 $300/150 Corner $175 per day food and bev.
limited coach airfare max $600$20000-2500 $400 $400 $400 $400/200 Theme suite, $200 per day food &
bev. Limited coach airfare max $800
Sunday through Thursday package average wagers
CREDIT LINE Blackjack Dice Baccarat Roulette COMP. DESCRIPTION**FRONT Spread* “0/00”MONEY___________________________________________________________________________________
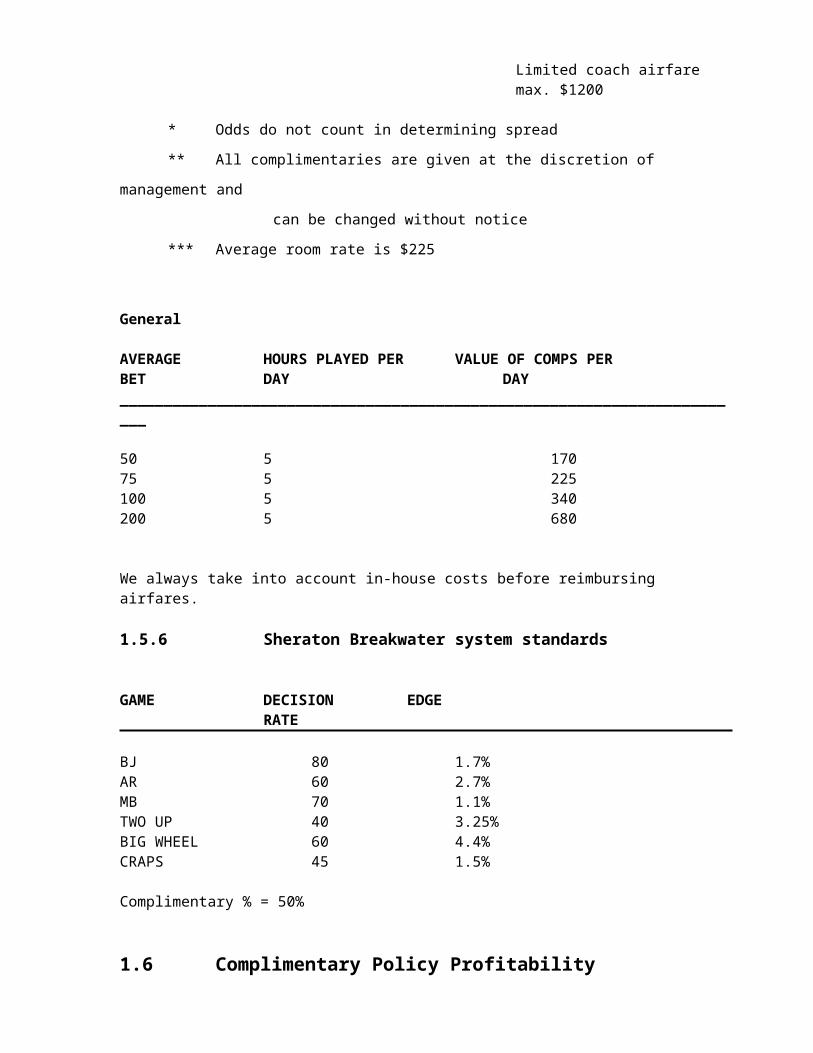
$25000 $500 $500 $500 $500 Theme suite, $250 per day food and bev. Limited coach airfare max. $1200
* Odds do not count in determining spread
** All complimentaries are given at the discretion of management and

can be changed without notice
*** Average room rate is $225
General
AVERAGE HOURS PLAYED PER VALUE OF COMPS PERBET DAY DAY________________________________________________________________________
50 5 17075 5 225100 5 340200 5 680
We always take into account in-house costs before reimbursing airfares.
1.5.6 Sheraton Breakwater system standards
GAME DECISION EDGERATE
BJ 80 1.7%AR 60 2.7%MB 70 1.1%TWO UP 40 3.25%BIG WHEEL 60 4.4%CRAPS 45 1.5%
Complimentary % = 50%
1.6 Complimentary Policy Profitability
The basic rationale behind the Adelaide Casino Complimentary Policy should ensure the profitability of the program. This is because 50% of theoretical win after tax and staff costs is returned to the player, thus theoretically leaving a balance of around 30 – 40% in Casino net profit. The criteria for determining theoretical win is unambiguous as it is based on average bet, time played, hands/hours and game edges etc.
Therefore if these values are determined correctly and the staff/operational cost is also correct the program is ensured of operating at a net profit over time, if other general operating costs are also constrained.
1.6.1 System Weaknesses
The major problem with a system of this type is that whilst overall it is an adequate guide to providing the value of complimentaries which may be reimbursed, it is a system based on standards which are averages. Thus the player who does not meet the average criteria may be disadvantaged or conversely advantaged. For example let us examine the following table of decision rates at the game of Blackjack.

ANALYSIS OF ROUNDS PER HOUR ON BLACKJACK
Cards per 7 decks dealt 6 decks dealt 5 decks dealt 4 decks dealt 3 decks dealt hand ave
1 player 2.6 70 60 50 40 302 player 2.6 47 40 33 27 203 player 2.6 35 30 25 20 154 player 2.6 28 24 20 16 125 player 2.6 23 20 17 13 106 player 2.6 20 17 14 11 97 player 2.6 18 15 13 10 8
shuffle time 2.5 2.5 2.5 2.5 2.5playing time 17.6 15.1 12.6 10.1 7.5total shoe 20.1 17.6 15.1 12.6 10.0
PER HOUR (per player/box)
1 player 209 205 199 191 1792 player 139 137 133 127 1203 player 105 102 100 96 904 player 84 82 80 76 725 player 70 68 66 64 606 player 60 59 57 55 517 player 52 51 50 48 45
This shows the number of variables which exist in determining an average decision rate. The speed of the dealer, the number of boxes played, the player’s decision time, deck penetration etc. may all play a role.
Then we have the situation of variable Blackjack edges depending on skill levels. The combination of these factors may seriously distort comp. value calculations for individual players. Whilst this should average out overall, individual players who are disadvantaged will be left with a negative impression of the Adelaide Casino. This is true for all games where decision rates are variable depending on the volume of play at the time and various bets with different edges are available on the same game. The ultimate complimentary system would be based on absolute knowledge of turnover levels, skill levels and bets placed. No such system for Casino table games currently exists, thus the most appropriate system is an average system with override capabilities.
1.7 Hard Versus Soft Comps
1.7.1 Definitions
a. Hard comps: A complimentary which is extended where the actual cost to the company of the reimbursement is equal to the retail cost due to a payment being made to a non affiliated third party.
b. Soft comp: A complimentary which is extended where the actual cost to the company of the reimbursement is not equal to the retail cost but equals a wholesale cost or partial cost plus labour component. Soft comps may vary from being a 100% soft comp. (no real cost) to a hard comp in situations where 100% utilisation of the facility occurs.

1.7.2 Implications
The real profitability of operating a premium play program can be distorted by the manner in which complimentary costs are handled in accounting terms. If the retail cost of every complimentary is accrued against the program then that process may negatively impact on the program if the provision of some of these soft comps. is a marketing tool.
For example, if a premium player visits this facility and is provided Pullman meals at her/her request at full retail cost against their comp. value then the value of other complimentaries which may be extended will be reduced. This may alter a player’s perception of the Adelaide Casino if their play levels have not altered, yet the perceived level of service has declined by reduced comps. This is more true of the marginal premium player whose average bet level is between $50 to $100 per decision.
The obverse to these scenarios is that during peak periods (Grand Prix etc.) all complimentaries must be considered at retail value.
This duplicity of costs suggests that the optimal scenario would be to offer distinct programs based on seasonality/special events with greater soft comps being offered in the off season as an incentive to attract gaming activity, thus potentially increasing the total complex profit.
1.8 Rating Efficiency Levels
The ability of Gaming personnel to provide reasonably accurate estimates of average bet levels is questionable given the current sampling criteria and method of rating. The sampling criteria for rated players is generally by observation and estimate only with no written record to cross reference. Also the rating is generally completed at the completion of a patron’s playing time and changing bet levels within that time may complicate the issue. Given that an Inspector may be required to individually rate a number of players in a shift, ratings will possibly vary by +/- 10-20%. Other issues that become involved in this analysis would be staff awareness of game speeds and player skill levels.
There may also be a real tendency towards over-estimating average bet levels when progressive betting systems are used. This may be because the larger bets are often viewed more closely even though the actual percentage of these bets is small which when the rating is completed skews the staff members guess-estimate of an average upwards. Another tendency is for the rated players themselves to attempt to increase their rating. This can be done by placing larger bets when the Inspector is watching, making larger than normal bets before leaving the table, missing hands/spins occasionally, making odd wagers which may be rounded up etc.
Some of these scenarios are not important if the patron’s play is not in the marginal range. That is if the patron’s average bet and time played is sufficiently large to ensure full complimentary privileges and a Casino net profit then verifying the average bet will have little effect as comp. expense will not meet comp. value.
It is nevertheless essential that ongoing training of gaming Inspectors occurs to ensure that they are fully aware both of their duties and the implications of those tasks.
1.9 Conclusion
Effective player rating service and control is a paradox of individual elements. The conundrums of soft and hard comps., true bottom line profit, value of marketing expenditure, cost accounting etc., all raise questions which may be answered differently based on a relative perspective.
In essence, however, the only perspective which is of real importance is the premium players. That view will not be distorted by the Adelaide Casino’s own internal problems, rather it is a view focussed

on levels of service. To compete successfully for a market share with Jupiters Casino, Wrest Point Casino and so on, the excellence of service which has been a hallmark at this facility must not be seen to falter.
Petty items such at the general provision of Pullman meals (which is an internal buffet) to Premium Players may be the small attention to detail which gains a player’s return visit. Knowing people’s names, greeting preferred premiums at the airport, ensuring ratings are as accurate as possible, sending these players birthday cards etc, will possibly gain more than attempting to buy their custom. For the Asian market this may mean changing some of our ways of thinking if we are to seriously endeavour to successfully penetrate this rich market.
In conclusion the optimisation of Casino profitability will only occur if management recognises the complex interplay between the service or support functions of the facility and the primary revenue-generating function of the Casino. If this process is successful then the important potential contribution of the premium play segment will be attained.
1.10 A Commentary On Casino Player Rating Systems
By Dennis C. Gomes
1.10.1 Introduction
Each year Nevada Casinos payout millions of dollars in complimentaries for their “premium” or “high line” customers. In fact, such expenditures represent the second largest cost category listed on the income statements of most major Casino operations. The only expense larger than complimentaries is payroll.
Obviously, Casino operators are not incurring such heavy expenditures without the expectations of a significant benefit in return. More specifically, payment of these complimentaries represents a major Casino marketing tool which is intended to increase
Casino profits and simultaneously strengthen the bond between the Casino and its preferred customers. In short, the basic business theory behind this widely utilised marketing device is that the cost of the room, food, beverage and travel expense provided to the “high line” customers is far less than the gaming revenues generated by them.
However, in far too many cases this theory is frustrated by those customers who do not gamble to a sufficient degree to justify the complimentary costs incurred by them. Unfortunately, this undesirable state of affairs is often compounded by failure of the Casino to recognise the existence of the problem. Many major Casino operators do not have systems available that can generate sufficient information to determine whether customers are providing adequate gambling action. In some of these cases, the systems necessary to accomplish this task just don’t exist. However, in most instances the systems do exist but are ineffective because they contain one or more basic flaws. The first section of this article will identify and expand on the four most common and serious of these flaws or weaknesses and the second section will demonstrate the development of a system that is free from such weaknesses.
1.10.2 Four Most Common Player Rating System Weaknesses
1. Lack of correlation between the customer play criteria and the customer rating output
The basic components of any effective player monitoring system are essentially twofold. First, the Casino must establish the amount of gambling action that a customer must provide in order to qualify for the various possible levels of complimentary expenditures. This component shall be referred to as the “player action criteria”. Second, the Casino must be able to precisely and objectively measure whether the customer has, in fact, met the stated play requirements. This quantification component

shall be referred to as the “player rating system”. In more elemental terms, the first component merely specifies the amount of gambling required from customers and the second measures the amount of gambling provided by them.
Since these two system elements are so basic and fundamental, it is difficult to imagine that when combined as components of a player monitoring system, confusion could result. Nevertheless, many Casinos are currently burdened with systems made ineffective because the player rating output is basically incompatible with the player action requirements. The following examples amply illustrate such incompatibility.
COMPS PLAYER ACTION ACTUAL PLAYERAVAILABLE RQMENTS OR CRITERIA RATING RESULTS
EXAMPLE #1
RFB $5 000 line -“must play to line” “B” player
RFB & $300 airfare $10 000 line –“must play to line “A” player
RFB & $600 airfare $20 000 line – “must play to line” “C” player
EXAMPLE # 2
RFB 4 hours per day @$50 bets “Good” player
RFB and $300 Airfare 4 hour per day @ $100 bets “Excellent” player
RFB and $600 airfare 4 hours per day @$150 bets “Average” player
EXAMPLE #3
RFB $5000 line – $10 000 marker“must play to line” issues
RFB and $300 airfare $10000 line – $20 000 marker“must play to line” issues
RFB and $600 airfare $20000 line – $30 000 marker“must play to line” issues
As can be seen, in all of the above examples, the first component or Player Criteria is stated in different terms than the second component of player rating. Given this lack of consistency, it is often difficult to determine, on a consistent basis, whether the customer has or has not qualified for the available complimentaries. For instance, in Example #2, in order for a customer to qualify for RFB and $300 in airfare reimbursement, he would be required to play four (4) hours per day at $100 per hand. However, when the customer’s play is actually quantified in order to determine whether he merits such complimentaries his play is labelled as “excellent”. Because of this immediate lack of connection between the two system components, the pit executive is forced to take an additional and unnecessary step in the rating process. He must determine whether an “excellent” rated player actually meets the play requirements for RFB and $300 in airfare. In reviewing the definition, of an “excellent” rating, he will probably find that the complimentary determination, for an “excellent” rating is dependent on one or more other factors. For example, an “excellent” rating with a low amount of playing time may not qualify, while one with a high amount of time may. This situation may further be complicated by the fact that the “excellent” designation may be the end product of a multitude of factors, some subjective

and other objective in nature, that may bear little direct relationship to the customer’s play criteria. Consequently, because of the lack of correlation between the criteria and the rating results, costly executive time is unnecessarily wasted and inconsistent decision making is fostered in the Casino.
2. Ambiguity of customer action criteria
As indicated, play action criteria are the gambling parameters established by the Casino to determine whether a customer qualifies for receipt of the various available levels of complimentaries. A common problem associated with these criteria is that they are often too vague or ambiguous to function effectively. This condition not only makes it difficult for the customer to know what levels of play are expected of him, but it also makes it impossible for the Casino to determine, on a consistent basis, whether the customer has actually met the criteria.
An example of such vague play criteria would be that of the system referenced earlier that states action criteria in the following terms:-
COMPLIMENTARIES AVAILABLE PLAY CRITERIA
RFB $5000 line –“Must play to line”
RFB and $300 airfare $10 000 line –“Must play to line”
RFB and $600 airfare $20 000 line -“Must play to line”
This particular play criteria has been used extensively over the years and is still utilised in some Casinos. The primary problem, however, is that it is non-specific and as such, tends to generate much confusion and misunderstanding among both customers and Casino personnel. From the customer standpoint, the determination of what “play to line” means is essentially left up to him. If he guesses right, he qualifies for the specified complimentaries and if he guesses wrong, he receives less than he might be expecting. To compound the problem, Casino executives may have diverse understandings of what the phrase means that customers are required to draw marker issues equivalent to their lines. While this interpretation is common, it is, of course, ridiculous. For example, a credit customer with a $20000 line could conceivably play Blackjack for 12 hours at $250 per hand and have marker issues of only $1000 or less. To be more specific, the customer could have won $15,000 dollars on the first $1000 marker during a six hour period and lost the $15000 back to the house during the next six hour period. However, under the referenced Casino executive’s definition of “play to line” this man, who provided 12 hours of play at $250 per hand, would not qualify. Likewise, a credit customer with a $20 000 line and $50 000 in issues might have provided very little good play but would still, under the referenced definition, more than qualify for complimentaries. In other words, the customer could be merely repeatedly drawing markers, playing for small amounts, and then paying the markers at the cage.
Another Casino executive, employed by the same Casino as the first, provided an entirely different and even more ambiguous definition of the “play to line” phrase. He stated that it meant that the customer had to provide gambling action consistent with his credit line. When asked specifically what that meant, he stated that determination of whether a customer’s play was consistent with his line was basically left up to the judgement of each Casino executive who was engaged in rating players. The problem with this interpretation is that is engenders inconsistency because what might be considered “good” gambling action by one Casino executive might be viewed as wholly inadequate by another.
3. Subjective determination of play criteria
Ideally, minimum player betting levels or action criteria should be set sufficiently high to generate enough revenues (on an expected value basis over a theoretically long term period) to cover the complimentaries provided to the customer plus an added profit considered reasonable by the Casino.

Obviously, the fact that a Casino operation establishes specific play criteria indicates that its executives are confident that such requirements will produce sufficient revenues to meet these complimentary and profit costs. However, because of the subjective methods by which most play criteria are derived, they are often set too low and consequently produce net losses after consideration of direct complimentary costs. This is particularly the case at the lower betting levels.
Examples of subjective criteria development are numerous. For instance, a common method of determining play criteria involves the use of drop/win percentages to calculate the expected revenues at each betting level. One such method consists of the multiplication of the customers credit line by the pit drop/win percentage. For example, a $10000 credit card holder would be expected to generate a $2100 in Blackjack revenue ($10000 credit line x 21% - BJ drop/win percentage and a $20000 card holder $4 200 in Blackjack revenue ($20000 credit line x 21% - BJ drop/win percentage). The complimentaries available to players in each of these categories would then be calculated on the basis of the expected win estimates. Thus, complimentary availability would be based on customer credit lines plus the previously referenced stipulation that the customer play to his line.
Another common method of incorporating drop/win percentages to develop customer play criteria is very similar to the first. The difference is that rather than multiply the drop/win percentage by the customer’s credit line, it is multiplied by his marker issues. As a result, marker issues, in the Blackjack pit, of $10000 would be expected to produce $2100 in revenue and issues of $20000 would produce $4200 in revenue. Thus, in this case, the customer play criteria would take the form of marker issue requirements and the complimentaries available at each criteria level would be dependant on the amount of expected revenue calculated from the issues.
Although, at first glance, use of drop/win percentages to derive customer play criteria appears analytical and thus objective, it is, in reality, as subjective as pulling the criteria out of thin air. More specifically, calculation of expected revenues based on customer credit lines bears no mathematical or logical relationship to the actual play provided by the customer. Any Casino executive who has dealt with credit knows that the size of a customers credit line has little bearing on the quality of his play. For example, a wealthy customer with a $100000 credit line may gamble very conservatively whereas a customer with a $7500 credit line may lose his entire line in 10 bets. Differences in the quality of players at each credit line category vary as greatly as do the personalities of the individuals themselves. Consequently, how can a meaningful credit play criteria be developed from expected revenue calculations that are based on meaningless credit line categories? The simple answer is that they cannot.
Likewise, the similar derivation of credit play criteria, based on marker issues, is also without an objective foundation and will result in meaningless parameters. For example, marker issues of $20000 might qualify a customer for full RFB complimentaries and $600 in airfare reimbursement. However, like the previously cited examples of the customer playing under the “play to line” criteria, this customer, in reality, may have merely drawn markers in the pit, played very little and subsequently paid the markers at the cage. Thus, the application of pit win percentages against this customer’s marker issues would produce erroneous expected revenues.
On the other hand, as indicated in a previous example, another customer with only $1000 in marker issues could have provided sufficient pit action to rightfully qualify for maximum RFB complimentaries and airfare. However, because he had only $1000 in marker issues, he probably wouldn’t qualify under the marker issue criteria for even a reduced room rate. Consequently, because of reliance on the subjectively conceived marker issue criteria, one customer who had high marker issues, and actually deserves little consideration, would be provided maximum complimentaries and another customer who was a quality gambler would receive nothing and would probably be lost by the Casino.
In summary, use of drop/win percentages in conjunction with credit lines or marker issues, to develop customer action criteria, has no valid basis. Therefore results are subjective and consequently ineffective.
Another common method utilised to develop customer action criteria is reliance on the experience of Casino personnel to subjectively determine play requirements. For example, one Casino executive may decide that $50 bets for four hours per day are sufficient to generate expected revenues large enough to qualify a customer for RFB complimentaries and airfare reimbursement of $400. The problem is that another Casino executive might feel that $50 bets are not enough and that $100 bets are necessary to qualify for such complimentaries. On the other hand, a third executive might feel that a $50 betting requirement is too stringent and that $25 bets are more than sufficient. Which answer is correct? Each executive feels that his criteria is effective but non can explain the process utilised to derive the numbers. This diversity of opinion is precisely why such wide variation exists from one Casino to another in betting requirements.
Again, like use of drop/win percentages to derive betting requirements, reliance on the opinions of Casino executives for such derivations will result in a purely subjective and therefore probably ineffective set of gambling criteria.
In summary, subjectively derived play criteria are unreliable and often generate unprofitable results. Unfortunately, however, because of the Casino’s inability to measure theoretical Casino win against actual costs, at the various criteria betting levels, this negative situation most often goes undetected. As a result, Casino profits decline and either no one knows why or the declines are erroneously attributed to other factors (ie complimentary abuse, economy etc).
4. Failure to Accurately Record Customer Play
Assuming that an effective set of customer action criteria has been developed and that such criteria are compatible with the player rating output, the system may still be dysfunctional if the pit rating procedure are ill conceived or are not properly enforced.
A prime example of ineffective rating systems are those that rate customers on the basis of their first bets only. Such systems incorporate an implied assumption that the quality of the customer’s gaming activity remains constant throughout his play. In reality, however, player betting patterns vary greatly. Some customers initiate their play with small bets and will later increase or parlay their bets if they are winning. Others begin small and may increase their bets when losing. Consequently, a rating system based on initial betting patterns may produce ratings that are not representative of a customers overall play. As a result, regardless of how well designed the play criteria and how compatible the rating output, the system will not function effectively because actual ratings will not be consistently accurate.
Although not an inherent system weakness, another problem occasionally associated with the rating process is a failure on the part of floor personnel to conscientiously rate customer play. For example, rather than expend the energy to accurately rate a player’s betting action, a lazy floorman might merely record fictitious information that, in his estimation, appears reasonable. Similarly, a dishonest floorman might record fictitious rating information in an effort to assist an outside accomplice in establishing a good record of play preparatory to a large credit fraud.
Both of these problem areas can have serious repercussions to the Casino if not properly handled. However, an effective method of eliminating them is available through the use of eye monitoring procedures. More specifically, it is both feasible and practical to have eye personnel randomly rate customer’s play concurrently with pit personnel. These ratings, along with marker numbers, rating slip numbers (if appropriate) and customer names, can easily be recorded on a report form and later compared to pit ratings. Consequently, the psychological impact on floor personnel of knowing that their ratings are randomly monitored with encourage them to take great care in accurately rating customers.
1.10.3 System Development
As indicated, many of the player rating systems in use today are severely hampered by certain common weaknesses. The purposes of this section of the article will be to demonstrate a method of constructing a player evaluation system that will eliminate these weaknesses and thereby create a system that will:-
1. enable ease of comparison between the customer play criteria and the rating results.
2. embody a set of unambiguous play criteria that are clearly understandable by customers.
3. Incorporate objectively conceived play criteria that will, over the long-term, provide assurance that minimum required play at each betting level will result in an expected minimum profit after direct expenses.
4. Enable accurate and consistent rating of customer play.
Before outlining the system design, however several important points must be clarified. First, the procedures that will be detailed herein should not be considered as constituting a complete system. Rather, they should be regarded merely as guidelines intended to demonstrate the steps necessary in the development of an effective player rating system. Second, it must be kept in mind that such evaluation systems while essential in monitoring the play of those customers that bet at lower and mid levels are not necessary regarding premium players. The reason for this is that the expected revenue from premium players is so large that it does not take a sophisticated rating system to ascertain the degree to which these customers qualify for airfare and complimentaries.Furthermore, the revenue generated by their play is so disproportionately larger than the cost incurred by them that decisions, concerning exactly how much they qualify for, become meaningless. In short, these are the high profit margin customers and as such, do not require close monitoring.
On the other hand, the dollar amount of RFB complimentaries and airfares that are available for lower and mid level players represents a significant portion of the gaming revenues expected from them. Consequently, airfare and RFB decisions can often make the difference between a profit or a loss on their play. In short if these customers are monitored properly their play, after complimentaries and airfare, can produce marginal profits. However, if not monitored or monitored improperly, their play can generate losses that, when combined with other Casino operating data, are virtually undetectable.
1.10.4 Criteria Development
The first step necessary in the development of a player monitoring system is the selection of the parameters that will be utilised in the establishment of customer play requirements or criteria. As indicated earlier, such criteria must be clear, concise, and not subject to diverse interpretation. Such qualifications are readily met by measurements of the size of a player’s average bet and the hours of his play. Consequently, these parameters have been selected as the means of expressing the play criteria for purposes of this system.
The next step is to decide the amount of minimum profit (after direct expenses) that the Casino wishes to make per customer at each criteria betting level. Since this minimum figure is arbitrarily established, it can be set at any amount desired and can be varied for each betting category. However, if set too high, it will cause the gaming criteria to materially exceed the play requirements of competing Casinos. Therefore, reasonableness must be exercised in determining this minimum profit level. In order to facilitate construction of this system, it will be assumed that the minimum desired profit per player is set as follows:
BETTING CATEGORY MINIMUM EXPECTED PROFIT PER PLAYER$25 - $50 $200$75 - $100 $300$125 - $150 $400$175 - $200 $500$250 - $300 $600

The most important and most complex of the steps necessary in the development of the customer play criteria is the determination of the amount of complimentaries and airfares that can be provided to customers at each betting level. Completion of this step actually involves three developmental stages. First and most importantly, the amount of expected revenue that will be derived from customers at each betting category must be calculated. Next, the amount of direct costs, other than complimentaries and airfare, (ie representative commissions, gaming taxes, etc) must be determined and subtracted from expected revenues at each betting level. The resulting balances constitute the amount of funds available for player complimentaries and airfares at each betting level. Finally, a comprehensive set of play criteria can be prepared from the data developed.
Because these three developmental stages are so critical to the subsequent effectiveness of the customer play criteria, the methodology of their construction is outlined in detail following:-
1. Derivation of expected revenues at each betting level
Many executives employed in the gaming industry take the position that it is not possible to determine the outcome of a customer’s gambling activity in advance. While such position is correct regarding an individual customer’s play during a specific gambling occasion, it is not accurate concerning the predictability of the long term results of that same customers play. More specifically, given the size of a customers average bet and the nature of his betting pattern the results of his play over a theoretically extended period of time can be reasonably forecast.
It is precisely this long term concept that must be applied to determine the gaming revenue expected from a specific customer even though his play occurs over a short period of time. The reasons for this is simple. Even though the players losses may deviate from the theoretical on specific occasion, his average loss per visit, over a long term period, will equal the theoretically calculated loss per trip. Likewise, while one member of a large group of gamblers may experience gambling wins or losses on a single occasion, that vary from the theoretically expected result, given a large enough group, the average loss per member of the group will equal the theoretically expected loss per person.
Consequently, when deriving expected theoretical win, at the various betting levels of the customer play criteria, the theoretical or long term basis of calculation should be employed. The first step necessary in the derivation of such theoretical or expected win, for the various betting categories, is the calculation of the house advantage or “edge” for each table game. In order to simplify this example, “edge” calculations will be confined to the two most popular Casino games – Craps and Blackjack.
Calculation of Craps “edge”
There are numerous types of bets available in the game of Craps, each having a different house advantage or “edge”. Consequently, because the play criteria are calculated on the basis of each game’s edge, this multi “edge” aspect of Craps raises an important question relative to establishment of the play criteria. It is desirable to have a multitude of separate play criteria for Craps, each depending on the customers bet selections or is it preferable to have one single set of play criteria for Craps?
Obviously, if a set of play criteria was established for each type of betting “edge” available on the crap table, then, for Craps alone, approximately 21 sets of criteria would be necessary. Such a system would be ridiculously confusing to the player and thus impractical. In addition, under a multi criteria system for Craps, rating of players by pit personnel would become unusually cumbersome and time consuming because of the necessity of specifying not only the amount bet but also the nature of every bet. Consequently, from both the customers standpoint and the Casinos, computation of a multitude of play criteria for Craps is impractical. Thus, expected revenues, at each betting level of the Craps criteria must be calculated on the basis of a single Craps “edge”.
In order to calculate a single “edge” the average “edge” for all Craps bets must be determined. This would prove a simple task if all players made a habit of spreading their dollars evenly among all of the bets available on the layout. In that case, a simple average of the various Craps bet “edges” would

suffice. However, it is well known that Craps players are as varied as 21 players in their skill, style and volume of play. Consequently, the only reasonable method of calculating an average Craps “edge” is to weight each of the bet “edges” in accordance with the estimated or actual average of the betting volumes placed on each type of bet.
These average volumes or mix of bets can either be estimated by experienced personnel or can be determined by recording and averaging the actual mix of Craps bets over a given period of time. Both methods are demonstrated below:-
Imperical Determination
Discussion with various experienced Casino personnel resulted in the following as an estimate of the average long-term mix of Craps bets at a particular Casino:
Percent of Total
Pass line – with odds 40%
Come bets – with odds 30%
Place bets 20%
Don’t pass; Don’t come – lay odds 5%
Proposition bets & one roll bets 5%
100%
Based on this estimated average mix of bets at the crap table, the average Craps edge can be computed as follows:-
(A) (B) (A) & (B)
Type of wager (2) Edge Weight Weighted average Craps edge
Pass line/odds .85% 40% .340%Come bets/odds .85% 30% .255%Place bets 3.43% (1) 20% .690%Don’t pass & dot come/lay odds .69% 5% .035%Propositioned one roll bets 13.5% 5% .675%
TOTAL 100% 1.995% average Craps
(1) This percentage consists of the average “edge” for all place bets excluding four and ten. In the case of four and ten, the “edge” for a buy on four and ten was substituted in the calculation.’
(2) Field bets and big 6 and 8 bets were not calculated into the mix as their volume was considered by experienced personnel to be negligible.
Sample determination of average Craps edge
An alternative and more reliable method of estimating the average Craps “edge” is to observed and record the actual mix of bets on the crap table during a selected representative period of time. The actual mix recorded during this test period could then be used to calculate a sample Craps “edge”. Such “edge” would be considered as representative of Craps play in general and would serve as the average Craps “edge” for purposes of deriving the Craps play criteria.

This sampling procedure was utilised at a major Strip Casino during a randomly selected period of heavy Craps play and resulted in the following derivation of the average Craps edge.
TYPE OF WAGER AMOUNT % OF HOUSE EXPECTEDWAGERED TOTAL EDGE WINDURING SAMPLEPERIOD
Pass/line odds 120 895 45% 0.85% 1 027Come bets/odds 89 680 34% 0.85% 762Place bets 35 290 14% 3.43% 1 210Don’t pass and don’t 2 985 1% 0.69% 21Come/lay oddsProposition and one 15 165 6% 13.5% 2 047roll betsTOTAL 264015 100% 5 067
Expected win $5 067 = 1.92% average Craps edge
Amount wagered $264 015
As can be seen, both the empirical or “experience” based method and the sampling technique of calculating the average Craps “edge” resulted in similar finds of 1.99% and 1.92% respectively. For purposes of deriving the Craps play criteria, these “edges” will be rounded to 2%.
Calculation of Blackjack “edge”
As illustrated above, one of the difficulties in calculating the average “edge” for the game of Craps is that there are approximately 21 different bets available on the layout, many of which carry different house advantages. Consequently this necessitates the determination of an average mix of bets in order to mathematically derive the average Craps “edge”.
This multi-edge problem is even more severe when considered with respect to the game of Blackjack. For example, if a customer is a perfect basic strategy player, the house “edge”, regarding his play, is reduced to approximately .6% on a six deck shoe. On the other hand, the house “edge” derived from the play of a customer who knows nothing about play strategy can rise to above 6%. Obviously, then the house “edge” in 21 can vary as widely as the customers ability to play the game. Consequently, the number of separate resultant “edges” in 21 are unlimited. Thus, because of this multi-variate aspect in the quality of Blackjack customers play, it is virtually impossible to estimate an average mix, by skill levels, of Blackjack betting volumes. Therefore, since each skill level generates a separate house “edge”, it is not feasible to calculate an average “edge” for Blackjack in the same manner as was accomplished for Craps. However, an alternative method utilising the Craps “edge”, is available for calculation of an average Blackjack “edge”. More specifically, once the craps “edge”, is available for calculation of an average Blackjack “edge”. More specifically, once the raps “edge” has been determined it can be utilised as part of a mathematical proportion to accurately calculate the actual average Blackjack “edge”. The logic underlying the proportion is as follows:
If it is assumed that:-
A. The same number of hands are dealt per hour in Blackjack as in Craps andB. The drop/win percentage is the same in Blackjack as in Craps
then the house “edge” in Blackjack would be the same as the house “edge” in Craps. Thus, based on these relationships, given historical data regarding average number of hands dealt per hour and the actual drop/win percentages for Craps and Blackjack, the actual average Blackjack “edge” for the Casino can be calculated as follows:
Historical dataCRAPS Blackjack
Drop/win percentage for the mostrecent 12 month period 19% 21%
Average number of hands dealt perhour (per survey results) 50* 65
Proportion
The Craps drop/win percentage of 19% and the number of Craps hands dealt per hour of 50 is to the average Craps “edge” of 2% what the Blackjack drop/win percentage of 21% and the number of Blackjack hands dealt per hour of 65 is to the average Blackjack “edge” which is unknown.
Proportion equation
19% (or .0038) is to 2% what 21% (or .00323) is to X %50 65
.0038 = .00323
.02 X
.0038X = .00065
X =.017
X =1.7%
therefore, the average Blackjack edge” is 1.7%.
Calculation of expected revenues for Craps and Blackjack at betting levels ranging from $25 to $300
Once the average house “edge” for Craps and Blackjack are known, the amount of expected revenue per hour can be determined for each betting category by use of the following formula:
Average bet per hand X average hands (decision in Craps) per hour X average house “edge” = Average expected revenue per hour
Assuming that the criteria are to be stated in terms of an average three day stay, this hourly revenue rate can then be converted to expected revenues for 12 hours.
* For Craps this represents decisions per hour of play (three days at an average of four hours per day).
The tables below provide the results of these calculations, for Craps and for Blackjack:
CRAPS 12 HRS EXPCTD CAS. WIN PER EXPCTD CAS. WIN FORPLAYERS AVG BET HR @ 50 DECISIONS/HR & 12 HRS OR AN AVG OF 4
AVG CRAPS “EDGE” OF 2% PER DAY FOR 3 DAYS
$25 $25 $300$50 $50 $600$75 $75 $900$100 $100 $1200

$125 $125 $1500$150 $150 $1800$175 $175 $2100$200 $200 $2400$250 $250 $3000$300 $300 $3600
BLACKJACK 12 HRS EXPCTD CAS. WIN PER EXPCTD CAS. WIN OR ANPLAYERS AVG BET HR @ 65 HANDS/HR & AN AVG OF 4 HRS PER DAY
AVG. BJ “EDGE” OF 1.7% FOR 3 DAYS
$25 $28 $336$50 $55 $660$75 $83 $996$100 $110 $1320$125 $138 $1656$150 $166 $1992$175 $193 $2316$200 $221 $2652$250 $276 $3312$300 $331 $3972
As can be seen from a comparison of the expected revenue tables for Craps and Blackjack, the amounts earned, from both games over a three day period of four hours of play per day, are fairly similar. Thus, if management so desires the two tables can be combined permitting subsequent development of one play criteria for both games as opposed to a separate set each for Craps and Blackjack. This would have the effect of streamlining the play criteria thereby facilitating ease of customer understanding. For the purposes of this article, the two tables have been combined as follows:
Combined Expected revenue tables – Craps and Blackjack
PLAYERS AVG HTS CRAPS & BLACKJACK EXPCTD CAS. WIN 12 ORBET AVERAGE CASINO WIN AVG OF 4 HRS PER DAY
PER HOUR FOR 3 DAYS
$25 $26 $312$50 $52 $624$75 $79 $948$100 $105 $1260$125 $131 $1572$150 $158 $1896$175 $184 $2208$200 $210 $2520$250 $263 $3156$300 $315 $3780
2. Determination of expected revenue – balances available for complimentaries and airfare
The final step necessary in the development of the customer play criteria is the calculation of the amount of expected revenue, at each betting level, that will be available for the payment of complimentaries and airfares. This can be accomplished by deducting all non complimentary direct costs (taxes, bad debts etc) plus the pre determined minimum profit, from expected revenues at each betting level. The remaining balances can then be utilised as parameters for the establishment of complimentary and airfare packages available for customers at each betting category. Any balances
remaining after deduction of these complimentary allocations can be added back to profits. The following table illustrates the procedures necessary to determine the amount of expected revenues, at each betting category, that are available for complimentaries and airfares.
DEDUCT DIRECT NON COMPLIMENTARY EXPENSES
MIN REQD EXPECTED BAD REP GAMING MIN BALANCESBET($) HOURS WIN DEBTS(1) COMM(2) TAX(3) PROFIT(4) AVAIL FOR
COMPS &AIRFARES
25 12 312 19 -- 20 200 7550 12 624 37 50 39 200 29875 12 948 57 100 60 300 431100 12 1260 76 125 80 300 679125 12 1572 94 150 100 400 828150 12 1896 114 150 120 400 1112175 12 2208 132 200 140 500 1236200 12 2520 151 250 160 500 1459250 12 3156 189 300 200 600 1869300 12 3780 227 350 240 600 2363
Footnotes:-
(1) Expresses as a percentage of credit play win.
(2) This expense would not apply if customers were not sent to the Casino by a commissioned outside representative of the Casino.
(3) Based on 6-1/2% gaming tax rate on gross income.
(4) This represents an arbitrarily established minimum profit and as such can be set at any level that management desires.
3. Preparation of customer play criteria
Once the balances available for complimentaries and airfares, at each betting level, have been determined as illustrated above, the necessary allocation of gratuities can then be accomplished as shown below:-
Complimentary and Airfare Allocation (1)
MIN COMP ROOM F & B A/FARE TOTAL EXPCTD PROFIT/VALUE BALNC OR (3) PERSON REMAIN REV BET
(DEFICIT)(2) ING
25 73 *CR90 -- -- 90 (17) 18350 298 200 -- -- 200 98 29875 431 200 250 -- 450 (19) 281100 679 200 250 200 650 29 329125 828 200 250 350 800 28 428150 1112 200 250 450 900 212 612175 1236 200 250
Footnotes:-

(1) Room costs are shown at retail value. This means that if the hotel is running at capacity, the room complimentary costs shown would be a true reflection of lost cash and thus an accurate depiction of cost. However, if the hotel is not operating at capacity, the true cost of the room complimentary would be the actual cost of providing the room (maid costs, front desk cost, etc) and thus would result in actual profits being higher than indicated above.
(2) Represents average rack rate for three nights.
(3) Represents average food and beverage consumption for 3 days per complimentary customer.
** Represents “Casino Rate”
Player Action Criteria
PLAY REQUIREMENTS GRATUITIES(see note below) COMPLIMENTARIES AIRFARE
$25 bets – 4 hours per day Casino room rate none$50 bets – 4 hours per day complimentary room none$75 bets – 4 hours per day complimentary RFB none$100 bets – 4 hours per day complimentary RFB $200$125 bets – 4 hours per day complimentary RFB $350$150 bets – 4 hours per day complimentary RFB $450$175 bets – 4 hours per day complimentary RFB $600$200 bets – 4 hours per day complimentary RFB $800$250 bets – 4 hours per day complimentary RFB $1000$300 bets – 4 hours per day complimentary RFB $1200
Note: These requirements are based on four hours of play per day. Playing time exceeding that amount reduces the average bet requirements and larger average bets reduce the playing time requirements.
For example: 8 hours of play per day at an average bet of $50 is equal to four hours of play at $100 per hand. Likewise, two hours of play per day at $200 per hand is equivalent to four hours of play per day at $100 per hand.
Airfare reimbursements are based on at least 12 hours for playing time at a minimum bet of $100 per hand.
Once the above criteria have been finalised, development of the actual monitoring and rating system is a relatively simple matter. An outline of the steps necessary in such development is presented below:-
1. Develop a credit playing rating slip that will preferably be included as a tear-off stub of the marker and will incorporate space for the following information:-
A. Player nameB. Table numberC. Average betD. Time playedE. ResultF. Amount walked withG. Rated byH. CommentsI. Marker number
2. Develop a cash player rating slip that includes all but items F and I above.

3. Establish either through manual or electronic data processing means, a method of accumulating and summarising the rating information on a daily basis. This information must be available on a timely basis in order to insure its usage for RFB and airfare decisions.
4. Develop a rating information reporting format that simplifies comparison of the rating results with the play criteria. For example, in addition to stating rating results in terms of actual average bets and time played, such information can also be stated in terms of the average bet for the required hours of play. More specifically, since the criteria playing time requirements are stated in terms of 12 hours (four hours per day for three days) a players actual bets can be adjusted to reflect equivalent dollars amount for the required playing time. For example, if a customer bets $300 per hand for eight hours of play over a three day stay, then his average bet could be restated to $200 per hand for 12 hours ($300 x 8/12 = $200). This simple conversion of actual bets to bets stated in terms of the required playing time enables an easier comparison of rating results with criteria requirements.
1.10.3 Summary and Conclusions
In summary, implementation of a player rating system similar to that illustrated herein will insure against the weaknesses inherent in many of the rating systems being utilised in the gambling industry today. In addition, such A system will provide management with a relatively precise method of measuring the revenue producing potential of players at each betting level. Consequently, Casino executives will then be able to determine in advance the exact amount of such revenues that can be expended for complimentaries, airfares, and other costs (ie special event costs).
In addition to the above, many subsidiary benefits will accrue to those Casinos that utilise player evaluation systems that have similar characteristics to the system illustrated. The following are examples of a few of such benefits:-
1. The actual win generated by a particular junket or other Casino groups (ie special event guest) may fluctuate significantly from trip to trip. Therefore, a meaningful evaluation of each trips outcome is only possible if expected or theoretical revenues, rather than actual revenues, are considered when calculating the profit produced by the group. A player rating system having the properties of the system recommended herein will automatically provide comparisons of this nature.
2. Monthly Casino host evaluations can be made more useful and equitable by basing them on the expected or theoretical win produced by the hosts players. Since the concept of expected win takes into consideration “action” only and does not consider the player’s actual win or loss, it will naturally generate a more comparable and meaningful basis for measuring Casino host performance. In addition, when coupled with cost data, it will provide a vehicle for calculating, on a monthly basis, the long-term net profit produced by each host.
3. Casino customers can be categorised by the size of their average bets (adjusted by required playing time) instead of the size of their credit lines. This permits a more valid determination of customer quality for purposes of “special event” invitation selection.
4. Given knowledge of the betting levels of “special event” invitees, the revenue expected from such events can be more accurately forecast. This enables preparation of a more meaningful projection of the expected profits to be produced by the proposal event.
In summary, the system detailed herein is intended to serve as an example of a possible alternative to the traditional methods of monitoring and evaluating Casino customers. However, it must be stressed that the system advocated is not a panacea and, if not properly implemented, can be as ineffective as many existing evaluation methodologies. For this reason, the following and final paragraphs of this

article will serve to communicate various admonitions to operators contemplating installation of systems modelled after that suggested in this article.
1. Although previously stated, it is important to reiterate that the system described herein is not necessary for the monitoring of premium quality players. Such customers produce profits regardless of the level of their complimentary privileges and airfares (assuming that such expenditures are kept within reasonable limits) and thus, do not require exact evaluation. Furthermore, since the individual action generated by these players is significant they can be easily monitored, on an informal basis, by pit personnel.
However, the lower to intermediate betting level players, who generally account for the numerical majority of a Casino’s customer mix, will produce only marginal profits. Consequently completion of an accurate and quantifiable determination of the playing quality of such customers, before complimentary and airfare decisions are made, can often make the difference between a profit and a loss relative to their play.
2. The values assigned for “edge” determination purposes, to the variables of “Craps betting mix” and “the number of hands dealt per hour” were not intended to be representative of any specific Casino or category of Casino in general. Consequently, any operator wishing to implement the system illustrated must determine the value of these variables through independent observation within his specific Casino operation. Reliance on the variable amounts utilised herein could result in a defective system.
3. Once the play criteria have been established there is a danger that Casino executives may make RFB and airfare decisions strictly in accordance with the betting and time parameters specified by the criteria. In other words, in the absence of instructions to the contrary, Casino executives may tend to become “programmed” by the system and consequently may make decisions that are consistent with such system and contrary to good judgement. A typical example would be the situation wherein a customer who has always qualified in the past, is denied airfare because his play did not meet the criteria requirements during his current trip. This certainly represents a situation in which good judgement would dictate that an exception to the system be made and that the customer be granted the airfare. Another example would be that of a customer that loses his entire $7000 line after only one hour of play. Although strictly speaking, such customer would not have met the time and betting requirements, good judgement would mandate that the customer receive full complimentaries and airfare.
In brief, the point being stressed here is that prior to implementation of a player monitoring and rating system, similar to that detailed herein, pit personnel should be instructed that good judgement must always take precedence over system requirements.
4. Some readers, upon reviewing the system detailed, may conclude that the “expected Casino win” per hour is too low. Their experience may seem to tell them that a $100 Craps bettor will lose much more than $100 per hour and therefore, that the stated criteria are too stringent. However, when analysed closely it can be seen that the real danger is not that the Craps betting requirements are too high, but that in some cases they may be too low.
More specifically, as seen from the calculations presented in this article, the overall “edge” established for Craps was 2% per hand. Although this may seem somewhat low to some, when considered in light of the “edge” inherent in the very common pass line only bets and pass line with odds bets, the 2% does not seem high at all. For example, if a customer makes pass line bets, the house edge will only amount to 1.4%; thus, producing approximately $70 win per hour on $100 bets as opposed to the $100 per hour calculated at the 2% average “edge”. Furthermore, if the customer divides the bet between pass line and single odds, then the house “edge” is reduced to .85% and the $100 bets then only produce approximately $43 per hour.
In essence, the admonition intended here is that the house “edges” utilised in the criteria calculations are based on the average betting mix and may be either too low or occasionally too

high relative to the play of specific individuals. However, relative to large groups of bettors, the average betting mix used should hold true. The negative side effect of this is that the customer that does consistently make the pass line with odds bets will receive more complimentaries and airfare than warranted by his expected revenue.
As indicated earlier in this article, the only way to overcome this problem would be to establish separate Craps criteria for each category of Craps bettors. However, as stated, this approach would not be practical. Furthermore, with respect to Blackjack, the problem would be even more severe since the number of possible “edge” percentages for individual players is almost limitless.
1.11 Promotional Chips and Tokens(and the use thereof)
By Andrew McDonaldSenior Executive Casino Operators – The Adelaide Casino
The issuance of promotional chips and tokens to attract play is a widespread practice within the Casino industry. The objective of this is obviously to increase profits by inducing the public to gamble at that particular facility. Therefore such a mechanic is often externally focussed and packaged with internal retail offers. That is, the promotional chips are utilised to effectively discount the standard retail price of items offered by the facility. These generally include room, food and beverage services where, depending upon occupancy or utilisation levels, the retail cost differs from the marginal cost to the company.
As an example if, and only if, occupancy is low during a particular period then the cost of providing a room to a customer is effectively the cost of cleaning and servicing that room. If occupancy is high, however, the cost, is that of the potentially displaced revenue from a normal sale.
In the Casino industry it is particularly useful to apply this logic during non-peak periods where packaging an attractive offer is used to attract players to gamble.
One highly marketable method by which this can be achieved is to provide package customers with a room at the standard retail rate but include promotional chips to add value to the product. If they were merely cash chips, no incentive exists for the customer to play in the Casino as they could easily cash these out. Thus, the provision of cash chips to discount the room rate may only attract customers interested in a cheap room which would be of little value to the overall operation.
A more effective technique is to utilise match play token or non negotiation chips. Match play tokens require a player to match the value of the token played with an equal or greater value of cash chips. This practice marginally reduces the cost to the company of providing match play tokens. Of greater value, is the fact that this ensures people attracted by the package have a propensity to gamble as they must also place at risk their own money.
To increase the amount of match play tokens which may be provided and thus enhance the market perception of added value, these tokens are often used on a “with exchange” basis. In such circumstances each token can be used once only, that is, if the bet wins the token is removed. Simply speaking, on an even chance game, if the player bets a $5 cash chip and a $5 match play and the bet wins then the player is paid $10 and the match play token removed. A total return to the player of $15 being bet and payout, therefore the match play could be described as having a $2.50 betting value. If this is the case and we wish to discount a room by $50 we could provide the customer with $100 in match play tokens as part of the room package.

If the purchaser of the package doesn’t gamble then they pay full price as match play tokens have no value except in play. Only by gambling the full amount does the customer receive the discounting value. An added advantage of this is that there is no need to rate (record) play for this player as all calculations on discount have been made prior to the sale and thus no requirement exists to monitor how much and how long the player gambles.
Such a simplistic analysis is however fraught with danger and more detailed calculations are required to determine the potential cost to the company of the unrestricted use of match play tokens.
In any game the cost of providing a chip to a player is the probability of the player winning multiplied by the total return to the player (bet plus payout). In the case of match play tokens (with exchange) the cost is the probability of the player winning multiplied by the payout only (ie the bet component is not returned). In an even chance game with a 1.5% house advantage the cost of a token is 49.25% of its face value. As the token must at least be matched with an equivalent cash chip bet, then the cost of the token may be reduced by the potential loss from this required bet, in this example that reduces the 49.25% by 1.5% to 47.75%.
At the Adelaide Casino all tokens at their face dollar value will be treated as drop, therefore a tax implication exists which in Adelaide is 20% of net win. This increases the cost to 58.2% of the value of the tokens provided.
What if, however, the tokens could be utilised on non even payoff games such as Roulette?
In this example, if the player bets only on straight ups the initial cost of the token is 94.59% of its value. The benefits derived from matching the token is 2.7% thus reducing the cost to 91.89%.
After tax the cost is increased to 93.51%.
Details of the above calculations are shown below.
MATCH PLAY TOKENS (with exchange)
Cost assessment
Terms = pw = probability of player winning
R = standard returns (payout + bet)
$ = value of match play token
Match Play Cost = $ pw (r-1)
Example One
For even chance game where pw = 0.4925
Cost = $.0.4925 x (2-1)
= $0.4925 x 1
Example Two
For single zero Roulette where pw = 1/37
Playing straight ups
Cost = $0.027 x (36-1)
= $0.027 x 35

= $0.945945
Benefit due to requirement to match the value of the token with an equal or greater value of cash chip.
Benefit = $ - $ pwr
= $ (1 – pwr)
Therefore sub total cost = $pw (r – 1) - $ (1 – pwr)
= $ (2pw r – pw – 1) or $ {{pw(2r-1)}-1}
Example One expanded
= $0.4925 - $0.015
= $0.4775
Example Two extended
= $0.945945 - $0.027027
= $0.918918
A tax implication exists due to the fact that all tokens (face $ value) will be treated as drop. Tax in South Australia at 20% of net win.
Tax = 20% (1 – Sub Total Cost)
= 0.2 – 0.2 Subtotal Cost
Therefore Grand Total Cost = Sub Total Cost + (0.2 – 0.2. Sub Total Cost)
= 0.8 Sub Total Cost + 0.2
Therefore Grand Total Cost = $ (0.8 (2pwr – pw – 1) + 0.2)
Example One Continued
Grand Total Cost = $(0.8 x 0.4775 + 0.2)
= $0.582
Example Two Continued
Grand Total Cost = $(0.8 x 0.918918 + 0.2)
= $0.9351344
It is important to note this detailed analysis does highlight some areas of concern if the tokens are used on non even payoff games. In such a case the implied cost of the token can rise from 58.2% of the dollar value of the token to 93.5% of the value if played on single numbers on Roulette.
This may potentially cause problems in that the discounting value of the match play when associated with a retail purchase is not then constant, which if the upper value is used, limits the marketability of the product.
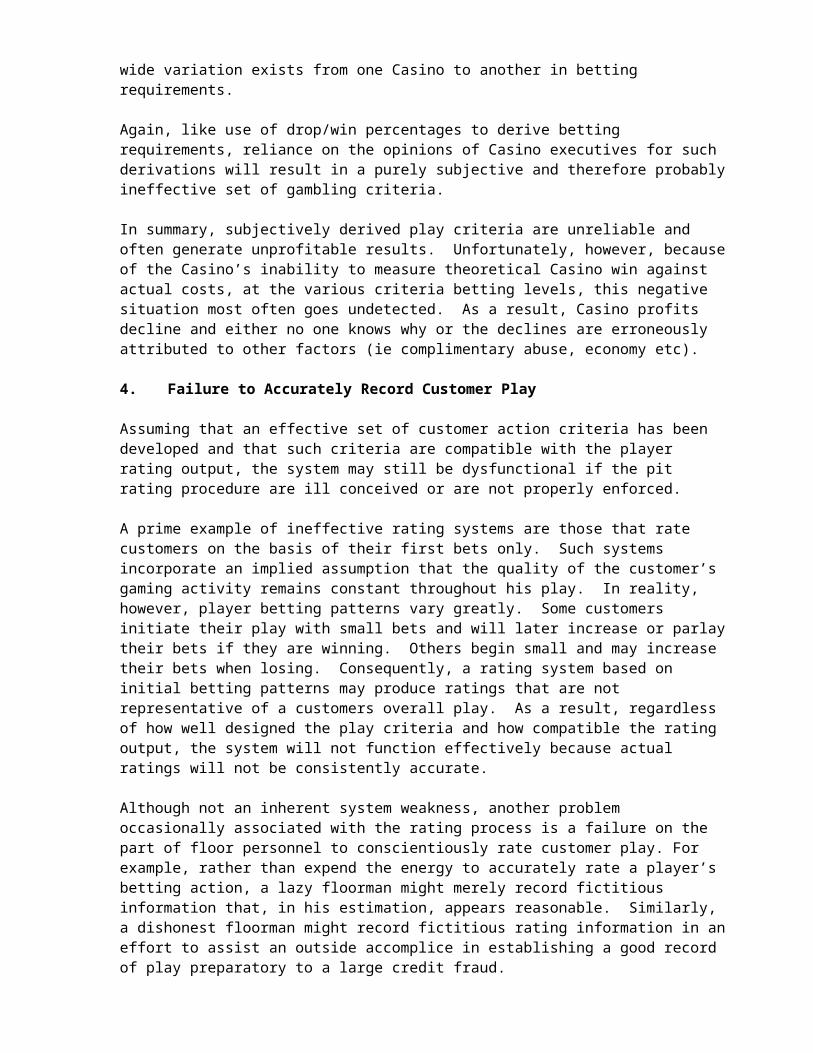
To overcome these concerns it is possible to implement one of the following:-
Restrict usage to even money bets only
Restrict usage to Blackjack and Baccarat
Accept varying percentage cost as commercial risk and assume a weighted 75% cost
element
Pay only even money for the match play component of a bet even if placed on higher
payout bet or,
State on the token that they pay at 50% of the marked value.
The simplest alternative and the one generally adopted is to restrict usage to even money bets only.
Having done this, it is now possible to structure an off peak package which includes match play tokens using a 60% cost element on the value of the tokens provided.
A multitude of options exist to package not only room, food and beverage items but these could be extended to incorporate a travel component.
It must be remembered, however, that the primary objective is to increase profits not just revenue or headcount but PROFIT. Therefore, any package should be structured to attain at minimum play levels a breakeven result after all costs are considered, or preferably a level of profit which does not impinge upon the marketability of the service given that is already impeded by off peak restrictions etc.
An example of a breakeven package is the following:-
One nights accommodation (mid week only)
Cost $300 normal rack rate $270
Includes $300 in match play tokens plus dinner for one in the buffet restaurant.
Cost assessment:-
Revenue = $300
Costs = $180 Match play at 60%
+ $60 room marginal cost
+ $10 marginal meal cost
+ $20 advertising/marketing allocation
+ $20 labour/administration allocation
+ $10 sales commission
Net = 0
The difficulty here is that the advertising and labour allocations are volume based which means that if the package is unsuccessful, the advertising allocation will increase dramatically, whereas the labour allocation may only reduce to zero. It is therefore important to structure the package so that it is appealing to the potential market. To accomplish this it may be necessary to conduct market research prior to advertising the package.
In conclusion, when structuring any promotional package the following should be considered essential elements:-
The objective is to increase profits therefore set the objective.

Conduct detailed analysis and identify all cost elements prior to staging. Minimum breakeven structure. Market research and follow up to identify appeal and/or success. Analyse results and consider whether this is the best way to achieve the result.
If the business cannot be operated in this manner then the Casino may be gambling itself and often it would be better not to do the promotion at all.
As the saying goes
“We are in the gambling business not in the business of gambling”
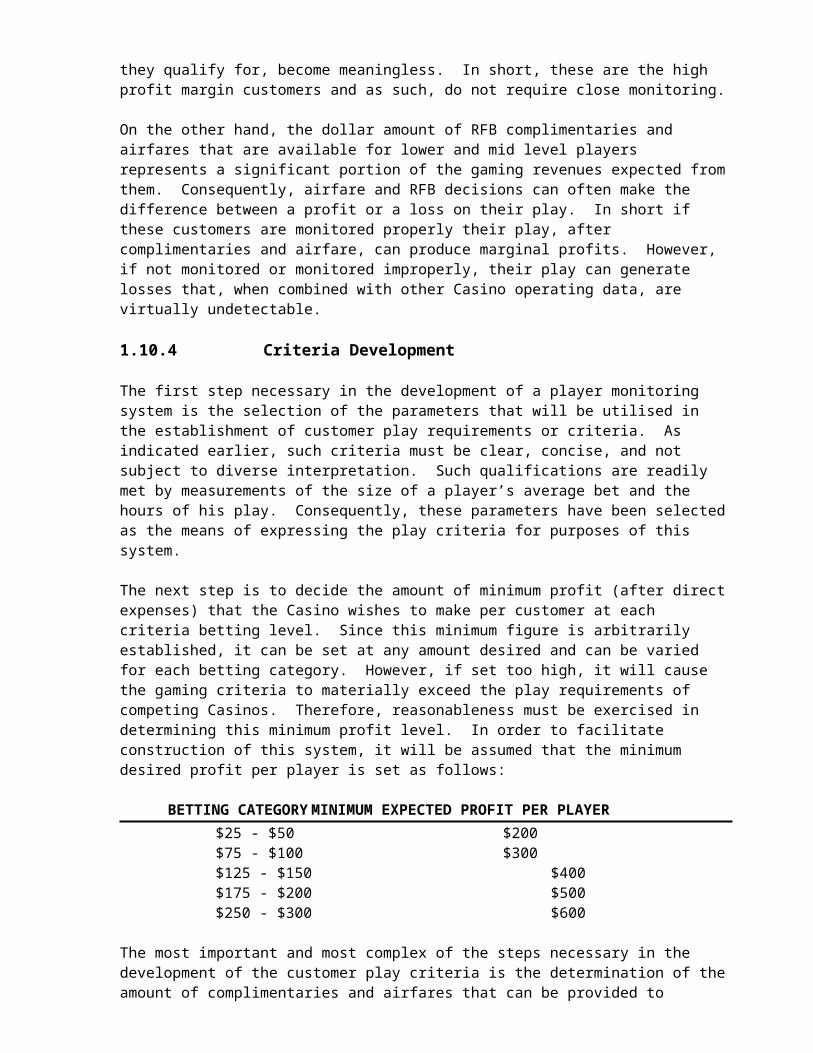
(This page is intentionally left blank)

Chapter 2 Junket Program
“Junkets have the potential to contribute significantly to the Casino’s revenue”

CHAPTER 2 Junket Program
2.1 Junket Fact Sheet ………………………………………………………………… 35
2.2 Overview of Junkets ……………………………………………………………… 36
2.3 Extract From the Adelaide Casino Internal Junket Manual ……………… ……… 362.3.1 The Adelaide Casino Junket Program Rebate and Premium Policy Players………372.3.2 The Adelaide Casino Junket Program Policies …………………………………… 382.3.3 Schedule of Programs …………………………………………………………….. 392.3.4 Rebate Player Program Non-Negotiable and Cash Chip …………………………. 452.3.5 The Adelaide Casino Complimentary Program for Premium Players ……………. 46
2.4 Cash Chip System Analysis ………………………………………………………. 492.4.1 Live Chips ………………………………………………………………………… 492.4.2 Profit Analysis Utilising Baccarat Edge………………………………………….. 522.4.3 Profit Analysis Utilising Budgeted Edge (89/90) ………………………………… 522.4.4 Profit Analysis Utilising Budgeted Edge Based on Initial Program
Assumptions ……………………………………………………………………… 532.4.5 Profit Analysis Utilising Budgeted Edge Based on Initial Program
Assumptions & Average Turnover ……………………………………………… 542.4.6 Casino Net Analysis Utilising Budgeted Edge (90/91). Based on
Varied Program Assumptions Given …………………………………………….. 542.4.7 Casino Net To Commission percentage Comparisons (Initial
Assumptions to “Actual”) For 20 Turns………………………………….………. 562.4.8 Breakdown of Expenses for Various Front Monies Given Frequency
Of Front Monies …………………………………………………………………. 572.4.9 Casino Net Calculations (Revised Expenses) 20 Turns (Edge 1.33%) ………….. 582.4.10 Casino Net Comparisons (Cash Chip to Non Negotiable) at Cash Chip
Breakeven Levels ………………………………………………………………… 592.4.11 Junket Operator’s Expenses Per Person …………………………………………... 592.4.12 Operator’s Costs (Approximate) …………………………………………………. 602.4.13 Casino Net to Operator’s Net Comparison (Revised Expenses)
20 Turns, Edge 1.33 ………………………………………………………………. 602.4.14 Possible Junket Programme Modifications ………………………………………. 612.4.15 Comparison of Required Turns (Existing to Modified) ………………………….. 612.4.16 Conclusion ………………………………………………………………………... 62
2.5 Non Negotiable Chip System …………………………………………………….. 622.5.1 Introduction ………………………………………………………………………. 622.5.2 Games Available …………………………………………………………………..632.5.3 Deposits And Number of Players ………………………………………………… 632.5.4 Commission Structure ……………………………………………………………. 632.5.5 Operators’ Responsibilities ………………………………………………………. 642.5.6 Commission Calculation Example ……………………………………………….. 642.5.7 Revenue Calculations …………………………………………………………….. 652.5.8 Other Information ………………………………………………………………... 652.5.9 Splinter Program ………………………………………………………………….. 652.5.10 Commission Calculations Analysis ………………………………………………. 652.5.11 Revenue Calculations …………………………………………………………….. 772.5.12 Conclusion …………………………………………………………………………81
2.6 Premium Player 0.5% (Splinter Policy) …………………………………………. 812.6.2 Commission Agents Program ……………………………………………………. 822.6.2 Banking Details ………………………………………………………………….. 84
2.7 Player Loss (How to Deal with Actual Loss in the Casino Industry) ……………. 84

2.1 Junket Fact Sheet
Table Limits
Baccarat
Table differential = $100K TO $200KMaximum bet = unlimited
Blackjack
Per player per box maximum = $10K
Roulette
$500 flat on numbers$10K on even chances
Tables Available in International Room
BlackjackRouletteBaccarat
Programs
1. Individual Player.Minimum front money = $100KRebate/commission = 0.5% on turnoverRoom, food and beverage (no airfare)
2. Program Two.Minimum front money = $250KRebate/commission = 0.45% on turnover
= up to 17.5% on loss
3. Program Three.Minimum front money = $1.5MRebate/commission = up to 35.5% on lossRoom, food and beverage + one first class airfare
4. Program 1A.Minimum front money = $400KMinimum players = 3Rebate/commission = 0.6% on turnover
plus 0.05% expense subsidyplus 0.125% bonus on turnover > $30M
5. Commission Agent.Minimum front money = 5KCommission = 0.2% on turnoverRoom, food and beverage and airfare rebate at 0.4% on turnover

2.2 Overview of Junkets
(The following information may be outdated, however, is provided as it analyses the various chip systems available. The previous fact sheet is more up to date although it would be beneficial to check with VIP Services as to the actual policy in operation).
Possibly the first question to answer regarding junkets is, “what is a junket”?
A junket may simply be defined as a group of people (4 or more) from overseas or interstate who come to a Casino for the purpose of gambling and who meet specified criteria set by the Casino.
The criteria set by the Casino are the minimum deposit amount per group or per member, minimum number of players, etc.
Why do they come to a Casino?
Firstly these people are what are referred to as high rollers, people with large amounts of money who enjoy leading the “high life”, this of course includes gambling. Also, the Casino markets to these peoples needs and offers group incentives to an organiser or junket operator, for bringing these people to the Casino.
What sort of incentives are offered?
The junket operator receives a commission based on the level of play of the players they bring in. The commission structures vary from Casino to Casino in an attempt to tap this lucrative market.
Where are the players from?
As far as the Adelaide Casino is concerned the players generally are from Asian countries, especially those countries where Casino gambling is illegal.
When do they come to the Casino?
Junkets arrive all year around, however the predominant time is around Chinese New Year or other Asian festival times such as Hary Raya Puasa, etc.
What games do the players play?
Predominantly these players play the game of Baccarat, however this is a personal preference and some players will play the other Casino games.
How much money is involved?
The minimum front monies per junket at the Adelaide Casino are $400,000. The maximum front monies deposited to date by any one junket was $6,255,000.

What sort of turnover is involved?
Turnover varies from player to player, however turnovers up to $173,000,000 have been recorded in one stay.
Having answered these basic questions let us now look at the programs themselves and the Casino’s policies and thoughts on the junket program.
2.3 Extract from Junket Manual
“Junkets have become an intrinsic part of the Casino’s operation and a marketing tool that has been used to identify and develop good player markets.
Junkets have the potential to contribute significantly to the Casino’s revenue. The volatility of these groups is such that it is important to maintain a continuous flow of play so that the fluctuations that can be experienced are substantially flattened.
There are a number of programs offered by the Casino and they are designed to cater to the needs of the market. The policies are designed to benefit the Casino and it must be remembered that junkets and players come to the Adelaide Casino on our terms and conditions.
These terms and conditions can change, however, before any changes take place, it is important to let the operator or player know of such changes prior to their visit to Adelaide.
The following sections provide details of each program. The programs have been put together using a model based on calculations the Statistics Department of the Adelaide University has provided to us.
All of the calculations for junket play are based on the Baccarat edge of 1.26%. Any play other than Baccarat is a bonus to the program. The American Roulette edge is 2.7% and the Blackjack edge is 1.6% - 2.0%. All the minor Games are usually higher than 2.5% although there are exceptions.
The hold the Casino looks for is approximately 1.35%. This is because junkets do not only play Baccarat. They also play other Games such as Roulette and Blackjack and Big and Small is also popular. By taking into account the edges of these other games this lifts the overall edge.
Although the Baccarat edge is 1.26% our observations over many shoes and with different groups, has indicated that this edge is in fact, higher. An example of this is the tie bet; $100 on the “Tie” is equivalent to $1000 on the “Bank” or the “Player”. Even though the tie bet is not played that often, it still has quite an effect on the game’s edge.
There is a perceived belief that junket players are skilled players. Regardless of this perception, the edge built into all our games will eventually win over, and provided our costs are kept well under control and monitored closely, junket play will be very profitable for the Casino.
One area to monitor closely is Blackjack. Clients who are basic strategy players are not worth bringing in. Most Blackjack strategies are under 1% and can go as low as 0.6%. This type of play is of no benefit to the Casino and must be monitored carefully. There are players the Casino has asked the operators not to bring back.
Blackjack players are definitely a minority and most play that occurs is usually between Baccarat shuffles.
The key to the success of junkets, apart from the commission, is service. This area has the potential to make or break a junket program.

Staff must be made aware when dealing with these people that there are culture differences and what may appear humorous to us may, in fact, be the opposite to these people. “Face” is important to Asian players and any “loss of fact” can be both embarrassing and humiliating to them and must be avoided. Age and respect is held in high regard, and when dealing with Asian players older than oneself, it is important to remember this point.
2.3.1 The Adelaide Casino Junket ProgramRebate Players and Premium Policy Players
It is with pleasure that we forward to you documentation outlining the various incentive programs currently available at the Adelaide Casino.
Mr. Craig Ashton, Director of International Marketing – Asia, is available at our office to answer any enquiries and assist with Visa applications.
In order to ensure that we retain our fine reputation, we also have V.I.P. Hosts in Adelaide whose sole duties are to service the needs of our V.I.P. clients.
Adelaide
Mr. Andrew MacDonaldSenior Executive Casino OperationsTel: 61-8-2184178, Fax: 61-8-2124047
Mr. Craig AshtonDirector International Marketing – AsiaTel: 61-8-218-4292, Mobile 61-8-041-9800-698Fax: 61-8-231-0260
Ms. Christine Giam VIP Services SecretaryTel: 61-8-2184254
Singapore
Ms. Loh Pek LimMarketing AssistantTel: 65-2554850, Mobile: 65-7216797, Fax: 65-2532598
For further enquiries please do not hesitate to contact the numbers listed.

The attached documents consist of the following:-
1. General Conditions2. Program 13. Program 24. Program 35. Individual Rebate Player Program6. Complimentary Program7. Banking Details8. Tables
2.3.2 The Adelaide Casino Junket Program Policies
1. The Casino will provide hotel accommodation for all qualified players, subject to the minimum turnover requirements of the individual programs.
2. All hotel accounts to be settled by the operator/player before the group/player’s department excluding qualifying accommodation cost.
3. The Casino may provided one tour for the group/player during the stay if requested.
4. Cash, bank drafts and travellers cheques are acceptable. However, if a draft is to be used a copy must be forwarded by facsimile 48 hours before arrival, to enable our Finance Department to approve clearance.
5. We also have bank accounts in Hong Kong, Singapore and Adelaide which can be used for deposits. If overseas deposits are made the bank will issue a receipt which should be faxed 48 hours before arrival.
6. All group members names are to be faxed 48 hours before arrival.
7. Rebate may be withheld if all bank drafts and/or bank deposits have not been cleared through our bank account.
8. An operator bringing in a large group may find it difficult to secure his/her clients on the same flight and therefore unable to deposit their funds together. The Casino acknowledges that this situation occurs, so operators may deposit their front monies as their groups arrive, provided that in the case of split arrival all members of the group were in the original schedule of arrival.
9. If this is not the case the additional members must qualify as a new junket group as per these terms and conditions or be placed on the premium or complimentary programs as applicable.
10. A junket will only be deemed to continue if the operator or an authorised representative (who must also be an approved Junket Operator) is present. That is, rebate will only be paid on play where the operator/representative is present with the group. Should the operator/representative arrive subsequent to the junket group’s arrival or depart prior to the groups departure, rebate will only be payable on play during the period where the stays coincide. The Chief Executive may consider allowing the junket to continue without the operator’s presence.
11. Should an operator find his/her group has lost all their front money or can prove an individual has lost his/her front monies, the Chief Executive may consider allowing the operator to deposit further funds to allow his/her client to continue playing.
12. The junket operator/player shall be required to designate which junket program (from the following schedule) they wish to utilise prior to arrival.

13. A minimum deposit of 1.5 million dollars in front money is required to utilise a $100,000 table differential at the game of Baccarat or Mini Baccarat.
2.3.3 Schedule of Programs
Program One (Rebate on turnover and contingency bonus)
1. Front money
Minimum front money per group AUD$400,000.Minimum front monies per qualifying players/room AUD$50,000Maximum front money unlimited.
2. Players
Minimum number of players per group is four
3. Rebate %
i) Cash chip system
a. A rebate of 0.60% on turnover shall be payable to the junket operator.b. All play will be tracked and monitored to give the Casino the required information on
qualification.c. Rebate, shall only be paid on play on the games of Baccarat, Mini Baccarat, Blackjack
and Roulette except where otherwise authorised by the Chief Executive.
ii) Non Negotiable chip system
a. A rebate of 1.20% of the recorded loss of non negotiable chips shall be payable to the junket operator.
b. Non negotiable chips can only be played on the games of Baccarat, Mini Baccarat and Blackjack in the International Room and other such areas as designed. Where players wish to play games not available on the non negotiable system the Chief Executive may authorise that the play of other games with cash chips be recorded as per the cash chip system and rebate paid at 0.6% of turnover.

4. Bonus payments
A bonus rebate shall be payable at 0.05% of cash chip turnover (0.1% non negotiable) for all turnover greater than the negotiated level (as per section 9).
5. Contingency Bonus
Should the group lose, a bonus shall be payable based on the recorded loss of the group. The rebate % on loss shall be payable at the following rates up to a maximum of 4%.
NUMBER OF HANDS AT REBATE ONPLAYERS (group) MAX. LOSS %BET (examples)
10 -100 1.0%500 2.5%1000 3.0%5000 4.0%
The above table details the rebate percentages at each number of hands. Should the groups number of hands fall between two values on the table it shall be the lower value on which the rebate % shall be calculated.
The number of hands at players (group) maximum bet shall be calculated by dividing the total turnover for the visit by the players (group) maximum bet recorded during the visit.
6. Room, Food and Beverage
The Casino will pay all room, food and beverage requirements for the group up to the negotiated level (section 9). Any costs incurred beyond those amounts shall be the responsibility of the junket operator. If the operator so requests he/she may re-negotiate with Casino management the level of complimentaries to be provided. In such instances the bonus/penalty turnover requirements may be altered during the groups stay.
7. Operator’s Airfare
The Casino will reimburse the operator AUD $2000 towards his/her personal travelling expenses.
8. Expense Contribution
An expense contribution may be deductible from commission should the group not reach the pre-negotiated turnover level. The expense contribution shall be calculated at 0.05% of cash chip turnover (0.1% non negotiable) for all turnover less than the negotiated level (as per section 9). A loss of 75% or greater of front money may negate any contribution which may otherwise be required.

Example Actual turnover = $15 million (cash)Required turnover = $ 20 millionCommission = $90,000Expense contribution = $2,500Net = $87,500
All expenses paid pre any bonus payable on group loss and prior to payment of operator’s airfare.
9. Negotiations
Bonus and expense contribution levels shall be set for each individual junket following discussions between the junket operator and Casino management regarding the following:-
i) number of personsii) length of stayiii) room requirementsiv) food and beverage requirementsv) table requirements and hours of operation
Program One (Rebate on turnover and bonus)
1. Front money
Minimum front money per group AUD$400,000.Maximum front money unlimited.
2. Players
Minimum number of players per group is four.
3. Rebate %
i) Cash chip system
a. A rebate of 0.60% on turnover shall be payable to the junket operator, on the games of Baccarat, Mini Baccarat and Blackjack. A rebate of 1.30% on turnover shall be payable on the game of Roulette.
b. All play will be tracked and monitored to give the Casino the required information on qualification.
c. Rebate shall only be paid on play on the games of Baccarat, Mini Baccarat, Blackjack and Roulette except where otherwise authorised by the Chief Executive.
ii) Non Negotiable chip system
a. A rebate of 1.20% of the recorded loss of non negotiable chips shall be payable to the junket operator.
b. Non negotiable chips can only be played on the games of Baccarat, Mini Baccarat and Blackjack in the International Room and other such areas as designated. Where players wish to play games not available on the non negotiable system the Chief Executive may authorise that the play of other games with cash chips be recorded as per the cash chip system and rebate paid at 0.6% of turnover.

4. Expense Subsidy
i) Cash Chip System
An expense subsidy of 0.05% of cash chip turnover shall be payable to the operator.
ii) Non Negotiable Chip System
An expense subsidy of 0.1% on the recorded loss of non negotiable chips shall be payable to the junket operator.
5. Bonus payments
i) Cash Chip System
A bonus of 0.125% of cash chip turnover shall be payable to the operator on all turnover greater than AUD$30 million in a single visit.
ii) Non Negotiable Chip System
A bonus of 0.25% on the recorded loss of non negotiable chips shall be payable to the operator on all recorded losses (turnover) greater than AUD $15 million in a single visit.
6. Expenses
All expenses incurred during a visit shall be the responsibility of the junket operator.
Program Two (Rebate on turnover and loss)
1. Front money
Minimum front money is AUD$250,000 per playerMaximum front money unlimited.
2. Players
Minimum number of players is one.
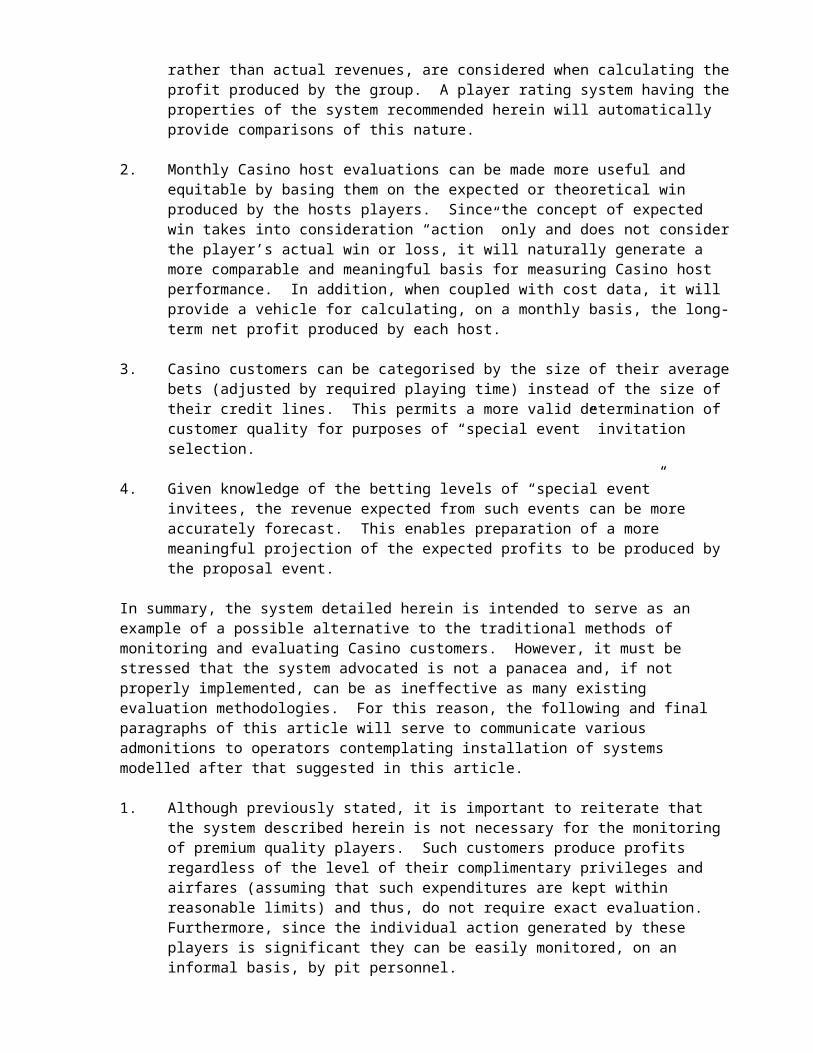
3. Rebate %
i) refer to the following table for full details
NUMBER OF HANDS AT REBATE ON LOSSPLAYERS MAX. %BET (examples)
10 1.5%100 5.0%500 10.0%1000 12.5%5000 17.5%
The above table details the rebate percentages at each number of hands. Should the player/groups number of hands fall between two values on the table it shall be the lower value on which the rebate % shall be calculated.
The number of hands at players maximum bet shall be calculated by dividing the total turnover for the visit by the group/player’s maximum bet recorded during the visit.
Should the number of hands at the player’s maximum bet be less than ten no rebate on loss will be payable.
ii) A commission on turnover shall also be payable at 0.45% for all turnover.
iii) Rebates will only be payable on the total group position, unless an individual player is utilising the program.
iv) The group/player must utilise the designated rebate chips.
4. Games available
Baccarat and Mini Baccarat only.
5. Wagers
Minimum = $2000 on “Player” in units of $100$2000 on “Bank” in units of $2000$200 on “Tie” in units of $100
Maximum = $150,000 - $200,000 subject to Management approval“Player” and “Bank”Tie = one eighth maximum limit
Program Three (Rebate on loss only)
1. Front money
Minimum front money is AUD$1.5 millionMinimum front money per qualifying player/room AUD $500,000Maximum front money unlimited.

2. Players
3. Rebate %
i) refer to the following table for full details
NUMBER OF HANDS AT REBATE ON LOSSPLAYERS MAX. %BET (examples)
10 3.5%100 10.0%500 20.0%1000 25.5%5000 35.5%
The above table details the rebate percentages at each number of hands. Should the player/groups number of hands fall between two values on the table it shall be the lower value on which the rebate % shall be calculated.
Should the number of hands at the player’s maximum bet be less than ten no rebate on loss will be payable.
The number of hands at players maximum bet shall be calculated by dividing the total turnover for the visit by the group/player’s maximum bet recorded during the visit.
ii) Rebates will only be payable on the total group win/loss not individuals win/loss, unless an individual player on the program.
iii) The group/player must utilise the designated rebate chips.
4. Games available
Baccarat and Mini Baccarat only.
5. Wagers
Minimum = $2000 on “Player” in units of $100$2000 on “Bank” in units of $2000$200 on “Tie” in units of $100
Maximum = $100,000 Table Differential“Player” and “Bank”$12,500 “Tie”
6. Airfare
The Casino will provide one (1) first class airfare, Adelaide – destination – Adelaide, to the junket operator/individual player provided the group player turns over at least $30 million dollars or loses 75% of front money.

7. Room, Food and Beverage
The Casino will provide to bonafide players room, food and beverage for the duration of the group’s stay, provided the group/player turns at least one turn of front money per days stay. Room, food and beverage may be allocated on the following basis:-
FRONT ROOM F & BMONEY/PLAYER ALLOWANCE/DAY
$500,000 Exec. Suite 200$750,000 Deluxe Suite 200$1,000,000 + Dip./Pres Suite 300
Program Four (Private Jet)
1. Front money
Minimum front money per group AUD$3 millionMinimum front money per qualifying player AUD $1 millionMaximum front money unlimited.
2. Players
Minimum number of players per group is one.
3. Rebate %
i) Rebate on loss of up to 15% at maximum. Rebate percentage calculated at 1% for each full shoe of Baccarat played. A full show being 70 (non tie) coups. Should the number of shoes fall between two values it shall be the lesser value on which the rebate percentage shall be calculated (Table Four).
ii) Rebates will only be payable on the total group win/loss not individuals win/loss, unless an individual player on the program.
iii) The group/player must utilise the designated rebate chips.
4. Games available
Baccarat and Mini Baccarat only.
5. Wagers
Minimum = $2000 on “Player” in units of $100$2000 on “Bank” in units of $2000$200 on “Tie” in units of $100
Maximum = $200,000 Table Differential “Player” and “Bank”$20,000 “Tie”

6. Airfare
The Casino will provide a private jet to players on this program to facilitate travel to and from the Casino. The Casino shall be responsible for all bookings and payments for the jet.
7. Room, Food and Beverage
The Casino will provide suite accommodation, food, beverage and all incidental payments for the player during the course of their visit.
8. Up Front Commission Payment
A payment of AUD $100,000 will be made to the group/player on arrival in the form of chip purchase vouchers.
9. Cheque Cashing Facilities
Cheque cashing facilities may be provided subject to review and sufficient time allowed for any application to be processed.
10. Availability
This program is only available to established players of high repute with a propensity to turnover a minimum of AUD$60 million cash chip.
NUMBER OF HANDS SHOES REBATE %
70 1 1%140 2 2%210 3 3%280 4 4%350 5 5%420 6 6%490 7 7%560 8 8%630 9 9%700 10 10%770 11 11%840 12 12%910 13 13%980 14 14%1050 15 15%
2.3.4 Rebate Player ProgramNon-Negotiable and Cash Chip
This program is offered to clients of high repute in terms of their betting action.
A minimum bankroll of AUD$100,000 is required to utilise this program.

To qualify for this program the client must turn over their monies a minimum of four times (cash chip system) and two times (non-negotiable system) during their stay.
1. a. All reasonable food and beverage at the Casino’s outlets will be complimentary. Each night the Casino will provide an evening supper in the International Room for the player.
b. If a meal is taken outside the Casino facility at one of the Casino’s preferred restaurants, a complimentary voucher will be extended to the player (value of such to be at Casino Management’s discretion).
c. Total reasonable expenses (including accommodation, food and beverage) are defined so as not to exceed 0.05% of turnover. This condition may be overridden by the Casino Management.
2. All hotel incidental expenses such as telephone, laundry, etc, are to be settled by the player prior to departure.
3. Cash, bank drafts and travellers cheques are acceptable. However, if a draft is to be used a copy must be forwarded by facsimile 48 hours before arrival to enable our Finance Department to approve clearance.
4. We have bank accounts in Hong Kong, Singapore and Adelaide which can be used for deposits. The bank will issue a receipt which should be presented when checking in at the Casino Cash Desk.
5. The rebate may be withheld if all bank drafts and/or bank deposits have not been cleared through our bank account.
6. The Casino will provide transportation – airport-hotel-airport.
7. Terms and conditions may be re-negotiated with the client in accordance with this policy document where the client wishes to stay for greater than a seven (7) day period.
Non negotiable chip system
A rebate of 1% on turnover will be paid to the client, subject to qualification, for all non negotiable chip losses.
Non negotiable chips may only be played on the games of Baccarat, Minim Baccarat and Blackjack in the International Room and other designated areas.
Where players wish to play games not available on the non negotiable system the Chief Executive may authorise that the play of other games with cash chips be recorded as per the cash chip system and rebate paid at 0.5% of turnover.
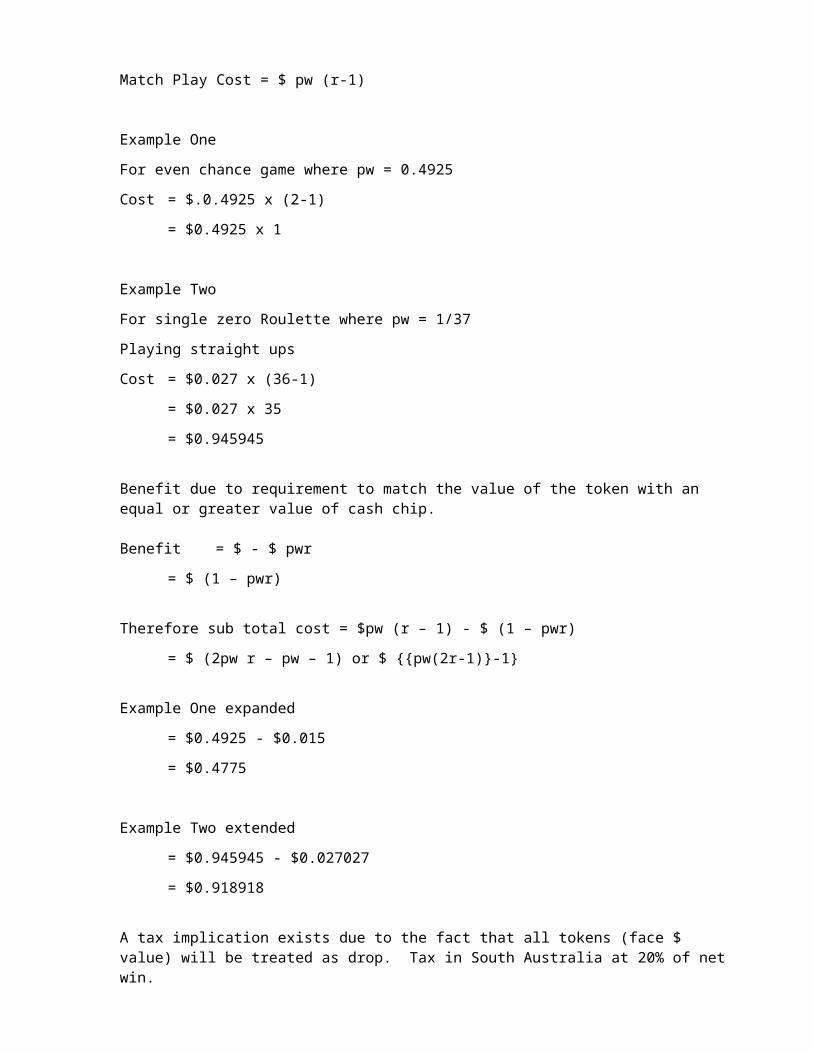
Cash chip system
A rebate of 0.5% of turnover will be paid to the client subject to qualification, on the games of Baccarat, Mini Baccarat and Blackjack. A rebate of 1.1% of turnover shall be payable on the game of Roulette.
Rebate will only be paid on play on the games of Baccarat, Mini Baccarat, Blackjack and Roulette except where otherwise authorised by the Chief Executive.
2.3.5 The Adelaide Casino Complimentary ProgramComplimentary Program for Premium Players
This program is for clients coming to the Adelaide Casino from overseas, wishing to play for complimentary airfare, room, food and beverage costs.
The following bankrolls and levels of play are required to receive the listed complimentaries and rebates.
AUD$ TURNS COMPLIMENTARYBANKROLL REQ’D
20,000 18 3 nights accom Hyatt Regency (Deluxe Room) Airfare rebateAUD $1000 Food & Beverage (Casino) Limousine transfersairport-hotel-airport
50,000 14 3 nights accom Hyatt Regency (Exec Suite) Airfare rebateAUD $2000 Food & Beverage (Casino) Limousine transfers airport-hotel-airport
70,000 13 3 nights accom Hyatt Regency (Exec Suite) Airfare rebateAUD $3000 Food & Beverage (Casino) Limousine transfersairport-hotel-airport
100,000 12 3 nights accom Hyatt Regency (Exec Suite) Airfare rebateAUD$4500 Food & Beverage (Casino) Limousine transfersAirport-hotel-airport
Should a player not reach the required turnover level then all complimentaries and rebates will be reduced proportionately.
Poker play does not attract complimentaries.
In order to ensure that all turnover is recorded, the client will be issued with a VIP identification rating card, which must be shown at each table played to the gaming staff member.
Banking Details
Accounts are provided at the following locations for your convenience:

SINGAPORE Aitco Pty,. Ltd.(Trading as Adelaide Casino)Singapore Dollar Account Number: 141-278036-001Malaysian Ringgit Account Number: 260 350079-186Hong Kong & Shanghai Banking Corp01-01 Collyer QuaySingapore 0104
HONG KONG Aitco Pty. Ltd.(Trading as Adelaide Casino)Hong Kong Dollar Account Number: 567-343827-001Hong Kong & Shanghai Banking Corp.1 Queens RoadCentralHong Kong
ADELAIDE Aitco Pty. Ltd.Trading as Adelaide Casino)Australian Dollar Account Number: 931-556-640State Bank of South Australia97 King William StreetADELAIDE 5000
TABLE ONE
NUMBER OF REBATE % NUMBER OF REBATE %HANDS HANDS
10 - 2500 3.5%50 - 2600 4.0%100 1.0% 2700 4.0%200 1.5% 2800 4.0%300 2.0% 2900 4.0%400 2.0% 3000 4.0%500 2.5% 3100 4.0%600 2.5% 3200 4.0%700 2.5% 3300 4.0%800 2.5% 3400 4.0%900 3.0% 3500 4.0%1000 3.0% 3600 4.0%1100 3.0% 3700 4.0%1200 3.0% 3800 4.0%1300 3.0% 3900 4.0%1400 3.0% 4000 4.0%1500 3.5% 4100 4.0%1600 3.5% 4200 4.0%1700 3.5% 4300 4.0%1800 3.5% 4400 4.0%1900 3.5% 4500 4.0%2000 3.5% 4600 4.0%2100 3.5% 4700 4.0%
2200 3.5% 4800 4.0%2300 3.5% 4900 4.0%2400 3.5% 5000 4.0%
TABLE TWO
NUMBER OF REBATE % NUMBER OF REBATE %HANDS HANDS
10 1.5% 2500 15.5%50 4.0% 2600 16.0%100 5.0% 2700 16.0%200 7.0% 2800 16.0%300 8.0% 2900 16.0%400 9.0% 3000 16.5%500 10.0% 3100 16.5%600 10.5% 3200 16.5%700 11.0% 3300 16.5%800 11.5% 3400 16.5%900 12.0% 3500 16.5%1000 12.5% 3600 17.0%1100 13.0% 3700 17.0%1200 13.0% 3800 17.0%1300 13.5% 3900 17.0%1400 13.5% 4000 17.0%1500 14.0% 4100 17.0%1600 14.0% 4200 17.5%1700 14.5% 4300 17.5%1800 14.5% 4400 17.5%1900 15.0% 4500 17.5%2000 15.0% 4600 17.5%2100 15.0% 4700 17.5%2200 15.5% 4800 17.5%2300 15.5% 4900 17.5%2400 15.5% 5000 17.5%
TABLE THREE
NUMBER OF REBATE % NUMBER OF REBATE %HANDS HANDS
10 3.5% 2500 31.5%50 8.0% 2600 32.0%100 10.5% 2700 32.0%200 14.0% 2800 32.5%300 16.5% 2900 32.5%400 18.5% 3000 33.0%500 20.0% 3100 33.0%600 21.5% 3200 33.0%

700 22.5% 3300 33.5%800 23.5% 3400 33.5%900 24.5% 3500 33.5%1000 25.0% 3600 34.0%1100 26.0% 3700 34.0%1200 26.5% 3800 34.0%1300 27.0% 3900 34.0%1400 27.5% 4000 34.5%1500 28.0% 4100 34.5%1600 28.5% 4200 35.0%1700 29.0% 4300 35.0%1800 29.5% 4400 35.0%1900 30.0% 4500 35.0%2000 30.0% 4600 35.0%2100 30.5% 4700 35.5%2200 31.0% 4800 35.5%2300 31.0% 4900 35.5%2400 31.5% 5000 35.5%
2.4 Cash Chip System Analysis
2.4.1 Live Chips
This program is becoming one of the most popular systems and allows the players the flexibility to play any game they choose. The system itself involves the recording of individual betting transactions made by junket players. This is achieved by having a Casino staff member record the total of all bets made where a result occurs for that wager on a rating/turnover sheet. The information is recorded by the individual game and, in the case of Baccarat and mini Baccarat played in the International Room, this information is collated at the end of every shoe. For other games the information is collated at the end of each shift. Once collated, all information regarding win/loss and turnover for the junket group is entered into the Casino computer system, known as the player rating system (P.R.S.), which collates the information for the total period of the group’s stay. This turnover information is then utilised to calculate the commission payable to the junket operator. The advantage of this system is that actual turnover is being recorded (given reasonable levels of tolerance for human error) and therefore reasonably accurate expected revenue calculations may be derived from this information. Also, all games are available in any location of the Casino. From the junket operator’s point of view this system of calculating commission provides a number of advantages over the non negotiable chip system. Firstly, the operator is not responsible for the continuous changing of cash chips to cheque credits. Secondly, the commission calculation is independent of win/loss. Thirdly, individual’s turnover may be recorded on the rating sheets if desired. This information is useful in determining bona fide players. Fourthly, the system provides an up to date method of calculating commission.
This system is utilised by the Adelaide Casino in the following manner:
GAMES AVAILABLE
Any Casino game may be played in any area of the Casino. Standard chips will be used in the playing of the games available and individual transactions will be recorded by the Casino or his/her agent.

DEPOSITS AND NUMBER OF PLAYERS
The minimum deposit is $400,000. The minimum bankroll for an “individual” is $20,000. “Individual” may also refer to a room booked at the Hyatt as this is considered a standard cost against which expenses may be accounted. For example two persons with individual bankrolls of $10,000 each who share a room still meet the minimum bankroll amount.
COMMISSION STRUCTURE
Commission structure = 9%, 6%, 6% unlimited (that is the 6% figure is used thereafter). This is based on the amount of the actual turnover in relation to the required turnover. The required turnover as shown below is based on the “individual” bankroll (front monies). Commission is calculated as a percentage of front monies, 9% of front monies or a percentage thereof based on the relationship between actual turnover and required turnover for amounts up to and including 100% of required turnover and 6% of front monies or a percentage thereof based on the relationship between actual and required turnovers for amounts in excess of 100% of required turnover.
TURNOVER REQUIREMENTS
FRONT MONEY TURNS REQUIRED TURNOVER
20000 18 36000030000 16 48000040000 15 60000050000 14 70000060000 14 84000070000 13 91000080000 13 104000090000 13 1170000100000 12 1200000200000 12 2400000
COMMISSION CALCULATION EXAMPLE
When the full number of turns, relating to front money is met, the 9% commission is paid. If less than the full amount is reached the commission is reduced accordingly.
Example: Front monies $50,000
Turnover reached = $550,000Required turnover = $700,000Turnover percentage = 550000/700000 x 100
= 78.57%Full commission at 9% = $ 4,500Commission payable = 78.57% x $4,500Commission = $3,536

If the turnover exceeds that required then the following example shows the method for calculating commission:
Example: Front monies $50,000
Turnover reached = $950,000Required turnover = $700,000Turnover percentage = 950000/700000 x 10
= 135.71%Full commission at 9% = 4,500Full commission at 6% = $3,000Commission payable = 100% x $4,500 + 35.71% x $3,000Commission = $5,571
TURNOVER REQUIREMENTS AND COMMISSION AMOUNTS
FRONT TURNS REQUIRED 9% COMM 6% COMM MONEY TURNOVER
20000 18 360000 1800 120030000 16 480000 2700 180040000 15 600000 3600 240050000 14 700000 4500 300060000 14 840000 5400 360070000 13 910000 6300 420080000 13 1040000 7200 480090000 13 1170000 8100 5400100000 12 1200000 9000 6000200000 12 2400000 18000 12000
To calculate the turnover requirements of a group, divide the total front monies by the number of rooms booked for the group. Members in the group relate to rooms we are picking up, not individual members, as rooms are the only external expense incurred by the Casino.
Example: Front monies = $800,000Rooms = 12Front money/rooms = 800,000 / 12
= $66,666Turnover requirement = 13Required turnover = 13 x $800,000
= 10,400,000
Turnover requirements are based, in this case on the individual bankroll of $66,666. As can be seen from the table of turnover requirements this amount needs to be turned over 13 times for full commission. Therefore for the operator to receive the full commission of 9% of the total front money the group are required to turn over $10,4000,000. If this is the case, the commission payable would equal $72,000.

CASINO REVENUE CALCULATION (CASH CHIP)
The following example of a Casino revenue calculation is taken from the internal junket procedure manual, which has not been updated for some time so the example may no longer be valid. Validity of the assumptions of the program was based upon will be examined later in the text in detail.
Front money = $50,000Turnover reached = $700,000House edge = 1.26% (Baccarat edge)Theoretical win = 1.26% x $700,000
= $8,820
Expenses
Gaming tax = 20% x $8,8820= $1,764
Operators commission = $4,500Room = $45Food & Bev internal = $150Wages = $120 based on $8/hr for 15 hrsTotal expenses = $6,579Theoretical win = $8,820Expenses = $6,579Casino net = $2,241
“This calculation is given as an example only of how the Casino is able to estimate the profitability of a junket player. There may be added costs to this depending on the group’s outside activities such as tours and transfer costs which may also need to be included.”
RATING OF PLAYERS
If an operator wishes to rate all his/her players together, this can be done. This is beneficial to the Casino especially if there are a number of junket groups in at one time, as it eases the requirements placed on the raters and thus increases the accuracy of the recorded information. However, if the operator does wish all members of the junket group to be rated individually or some to be rated individually and the others to be rated as a group, this may also be carried out. Where there is the case, the amount of front monies per individual must be determined.
RATING OF CASINO GAMES
The various games offered by the Casino are rated slightly differently according to the nature of the game being played.
BACCARAT AND MINI BACCARAT
All bets placed on “Player, “Banker” or “Tie” are recorded by the rater excepting where a “Tie” occurs in which case bets made on either “Player” or “Banker” are NOT recorded. This is due to the fact that the program has been set up utilising relative probabilities for this game.
BLACKJACK
All original bets are recorded in this case, that is, bets made prior to the initial deal only or insurance bets. Additional wagers to double or split are not recorded so as to offset the recording of bets made where a standoff occurs.

AMERICAN ROULETTE
In the case of Roulette, all wagers are recorded by the rater. This is done by adding the amount of losing bets made by the player to the amount of winning wagers on the table. Calculation of the amount of losing wagers is done by chipping up the losing wagers from the salad.
NB In the case of rating junket action, this must be completed on a turnover tracking sheet by a staff member designated to record junket play.
2.4.2 Profit Analysis (After Tax and Commission Only)Utilising Baccarat Edge
BAC. EDGE TAX FULLCOMMISSION
0.0126 0.2 0.09
FRONT REQ REQ FULL THEO CASINO NET COMM NETMONEY TRANS T/OV COMM NET NET WIN WIN COMM %
% %
20000 18 360000 1800 4536 1829 40.32 39.68 101.6030000 16 480000 2700 6048 2138 35.36 44.64 79.2040000 15 600000 3600 7560 2448 32.38 47.62 68.0050000 14 700000 4500 8820 2556 28.98 51.02 56.8060000 14 840000 5400 10584 3067 28.98 51.02 56.8070000 13 910000 6300 11466 2873 25.05 54.95 45.6080000 13 1040000 7200 13104 3283 25.05 54.95 45.6090000 13 1170000 8100 14742 3694 25.05 54.95 45.60100000 12 1200000 9000 15120 3096 20.48 59.52 34.40200000 12 2400000 18000 30240 6192 20.48 59.52 34.40
2.4.3 Profit Analysis (after tax and commission only)Utilising Budgeted Edge (89/90)
BAC. EDGE TAX FULLCOMMISSION
0.0135 0.2 0.09

FRONT REQ REQ FULL THEO CASINO NET COMM NETMONEY TRNS T/OV COMM NET NET WIN WIN COMM
% % %
20000 18 360000 1800 4860 2088 42.96 37.04 116.0030000 16 480000 2700 6480 2484 38.33 41.67 92.0040000 15 600000 3600 8100 2880 35.56 44.44 80.0050000 14 700000 4500 9450 3060 32.38 47.62 68.0060000 14 840000 5400 11340 3672 32.38 47.62 68.0070000 13 910000 6300 12285 3528 28.72 51.28 56.0080000 13 1040000 7200 14040 4032 28.72 51.28 56.0090000 13 1170000 8100 15795 4536 28.72 51.28 56.00
100000 12 1200000 9000 16200 3960 24.44 55.56 44.00200000 12 2400000 18000 32400 7920 24.44 55.56 44.00
2.4.4 Profit Analysis (after tax, commission and expenses)Utilising Budgeted Edge Based on Initial Program Assumptions
BUD. TAX FULL ACCOMM STAY WAGE/ PLAY/EDGE COMM DAY DAYS HOUR DAY
0.0135 0.2 0.09 100 3 8 5
FRONT REQ REQ FULL THEO CASINO NET COMM NETMONEY TRNS T/OV COMM NET NET WIN WIN COMM
% % %
20000 18 360000 1800 4860 1668 34.32 37.04 92.67 30000 16 480000 2700 6480 2064 31.85 41.67 76.4440000 15 600000 3600 8100 2460 30.37 44.44 68.3350000 14 700000 4500 9450 2640 27.94 47.62 58.6760000 14 840000 5400 11340 3252 28.68 47.62 60.2270000 13 910000 6300 12285 3108 25.30 51.28 49.3380000 13 1040000 7200 14040 3612 25.73 51.28 50.1790000 13 1170000 8100 15795 4116 26.06 51.28 50.81
100000 12 1200000 9000 16200 3540 21.85 55.56 39.33200000 12 2400000 18000 32400 7500 23.15 55.56 41.67
From this information it can be seen that when the junket program was devised, certain basic assumptions were made which provided the junket operator with between approximately forty and sixty percent of the theoretical win in commission if the turnover requirements were met. This was I relative proportion with the policies determined for the premium player market, where the maximum return to players in complimentaries extended was equal to 50% of the net theoretical win. Net theoretical win equalling theoretical win less tax and staff costs, in this case.

Maintaining these initial basic assumptions let us now consider the effect of the average turnover experienced which is approximately twenty times front money, on the Casino revenue.
2.4.5 Profit Analysis (After Tax and Commission and Expenses)Utilising Budgeted Edge Based on Initial Program Assumptions & Average Turnover
BUD. TAX COMM COMM ACCOMM STAY/ WAGE PLAY/EDGE DAY(S) DAY
0.0135 0.2 0.09 0.06 100 3 8 5
FRONT REQ REQ FULL FULL COMMMONEY TRNS T/OV COMM 9% 6%
20000 18 360000 1800 120030000 16 480000 2700 180040000 15 600000 3600 240050000 14 700000 4500 300060000 14 840000 5400 360070000 13 910000 6300 420080000 13 1040000 7200 480090000 13 1170000 8100 5400
100000 12 1200000 9000 6000200000 12 2400000 18000 12000
FRONT ACT ACT FULL THEO CASINO NET/ COMM NETMONEY TRNS T/OV COMM NET NET WIN WIN COMM
% % %
20000 20 400000 1933 5400 2100 38.89 35.80 108.62 30000 20 600000 3150 8100 3360 41.48 38.89 106.6740000 20 800000 4400 10800 4620 42.78 40.74 105.0050000 20 1000000 5786 13500 5880 43.56 42.86 101.6360000 20 1200000 6743 16200 7140 44.07 42.86 102.8470000 20 1400000 8562 18900 8400 44.44 45.30 98.1180000 20 1600000 9785 21600 9660 44.72 45.30 98.7390000 20 1800000 11008 24300 10920 44.94 45.30 99.20
100000 20 2000000 13000 27000 12180 45.11 48.15 93.69200000 20 4000000 26000 54000 24780 45.89 48.15 95.31
This information shows that if the “average” turnover is achieved, the program assumptions provide virtually equal profit margins for the Casino operator and the junket operator. Given the above information, the effect of alterations to the basic assumptions should be analysed.

2.4.6 Casino Net Analysis (After Tax, Commission and Expenses)Utilising Budgeted Edge (90/91)Based on Varied Program Assumptions Given
“AVERAGE” EXPENSES
AVERAGE EXPENSES STAFF COSTS 1421PER ROOM OVERSEAS OFFICE 618
ACCOMMODATION 552FOOD & BEVERAGE 336TRAVEL/AIRFARE 183TOTAL 3110
BUD. TAX COMM COMMEDGE
0.0133 0.2 0.09 0.06
FRONT REQ REQ FULL THEO CASINO NET/ WIN %MONEY TRNS T/OV COMM WIN NET
20000 18 360000 1800 4788 1080 22.5530000 16 480000 2700 6384 703 11.0140000 15 600000 3600 7980 326 4.0950000 14 700000 4500 9310 162 1.7460000 14 840000 5400 11172 427 3.8370000 13 910000 6300 12103 272 2.2580000 13 1040000 7200 13832 755 5.4690000 13 1170000 8100 15561 239 7.96
100000 12 1200000 9000 15960 658 4.12200000 12 2400000 18000 31920 4426 13.87
COMM/WIN % NET COMM % NET/F.M.%
37.59 59.99 5.4042.49 26.04 2.3445.11 9.06 0.8248.34 3.61 0.3248.34 7.91 0.7152.05 4.32 0.3952.05 10.49 0.9452.05 15.29 1.3856.39 7.31 0.6656.39 24.59 2.21

This information displays the adverse effect the changes to the basic assumptions have had. Rapidly increasing costs have severely limited the on-going viability of the junket program at various levels of front monies. From this, let us now look at the effect of the average number of turns on the profitability of the program.
“ACTUAL” EXPENSES AND “AVERAGE” TURNOVER
FRONT REQ REQ FULL THEO CASINO NETMONEY TRNS T/OV COMM WIN NET WIN %
20000 20 400000 1933 5320 -788 -14.8030000 20 600000 3150 7980 124 1.5540000 20 800000 4400 10640 1002 9.4150000 20 1000000 5786 13300 1744 13.1160000 20 1200000 6943 15960 2715 17.0170000 20 1400000 8562 18620 3224 17.3280000 20 1600000 9785 21280 4129 19.4090000 20 1800000 11008 23940 5034 21.03
100000 20 2000000 13000 26600 5170 19.44200000 20 4000000 26000 53200 13450 25.28
COMM/WIN% NET/COMM% NET/F.M.%
36.34 -40.74 -3.9439.47 3.93 0.4141.35 22.77 2.5043.50 30.14 3.4943.50 39.10 4.5245.98 37.66 4.6145.98 42.20 5.1645.98 45.73 5.5948.87 39.77 5.1748.87 51.73 6.72
This data shows that even if the “individual” meets the “average” turnover amount for the “individual’s” front money the relationship between the Casino net and the operator’s commission no longer resembles that on which the program was based. The comparison of this data is displayed below.
2.4.7 Casino Net to Commission Percentage Comparisons (Initial Assumptions to “Actual”) For 20 Turns

FRONT NET/COMM % NET/COMM VARIANCEMONEY INITIAL % ACTUAL INITIAL-ACT
20000 108.62 60.37 168.9930000 106.67 8.63 115.3040000 105.00 13.41 91.5950000 101.63 22.75 78.8860000 102.84 32.71 70.1370000 98.11 32.29 65.8280000 98.73 37.34 61.3990000 99.20 41.27 57.94
100000 93.69 35.86 57.83200000 95.31 49.16 46.15
All this information is of course based on an equal distribution of peripheral costs such as the overseas office costs, and an equal number of turns as an “average” etc. Variations on these assumptions will be examined in detail at a later stage. However, equal distribution of costs does serve to highlight expected program performance if all junkets were to fall into any one of the front money categories. Thus for example, if all junkets were to fall into the $20,000 “individual” front money category, the junket program would no longer be viable. This of course, is not the case, as the $20,000 “individual” front money junket has become infrequent, due to the lack of incentive for operators to bring in groups of this type, because of the low return. Thus the program is protected to some degree by the cost factors which effect the junket operator (airfares and incidentals). Operators will however include a number of smaller bankroll players in a group if the group also comprises of one or two larger players, this is more a “safety in numbers” or “atmosphere stimulating” approach, rather than a true cost based decision. To further analyse the effect of expenses on the junket program peripheral expenses fore the various front monies shall be allocated on the basis of the actual frequency of junket groups at the various levels of front monies.
2.4.8 Breakdown of Expenses for Various Front Monies Given Frequency of Front Monies
FRONT FREQ % AVG ROOMS % TOTAL STAY EXTRAMONEY STAFF
20 – 50K 10 23 25.84% 6 2550 – 100K 30 11 37.08% 6 20100 – 150K 15 8 13.48% 5 15150 – 200K 15 5 8.43% 4 14200 – 250K 15 5 8.43% 4 14 250K+ 15 4 6.74% 3 14
AVERAGE EXPENSES STAFF COSTS 101120 – 50K OVERSEAS OFFICE 239
ACCOMMODATION 690FOOD & BEVERAGE 420TRAVEL/AIRFARE 71TOTAL 2431

AVERAGE EXPENSES STAFF COSTS 169150 – 100K OVERSEAS OFFICE 500
ACCOMMODATION 690FOOD & BEVERAGE 420TRAVEL/AIRFARE 148TOTAL 3449
AVERAGE EXPENSES STAFF COSTS 1453100 – 150K OVERSEAS OFFICE 688
ACCOMMODATION 575FOOD & BEVERAGE 350TRAVEL/AIRFARE 204TOTAL 3269
AVERAGE EXPENSES STAFF COSTS 1736150 – 200K OVERSEAS OFFICE 1100
ACCOMMODATION 460FOOD & BEVERAGE 280TRAVEL/AIRFARE 326TOTAL 3902
AVERAGE EXPENSES STAFF COSTS 1736200 – 250K OVERSEAS OFFICE 1100
ACCOMMODATION 460FOOD & BEVERAGE 280TRAVEL/AIRFARE 326TOTAL 3902
AVERAGE EXPENSES STAFF COSTS 1628250K+ OVERSEAS OFFICE 1375
ACCOMMODATION 345FOOD & BEVERAGE 210TRAVEL/AIRFARE 408TOTAL 3965
2.4.9 Casino Net Calculations (Revised Expenses)20 Turns (Edge 1.33%)
FRONT ACT T/OV FULL COMM THEO WIN CASINO NET NET/F.M.%MONEY
20000 400000 1933 5320 -108 -0.5430000 600000 3150 7980 803 2.68 40000 800000 4400 10640 1681 4.2050000 1000000 5786 13300 2423 4.8560000 1200000 6943 15960 2376 3.9670000 1400000 8562 18620 2885 4.1280000 1600000 9785 21280 3790 4.7490000 1800000 11008 23940 4695 5.22
100000 2000000 13000 26600 5011 5.01200000 4000000 26000 53200 12658 6.33
This information shows the effect of the actual distribution of costs on the profitability of the program at the current time. Monitoring of costs on the above basis will determine program profitability remembering that the operator’s costs will effect levels of front money that are brought into the Casino. Break-even turnover to front money requirements are displayed below:
BREAK-EVEN TURNOVER REQUIREMENTS (REVISED EXPENSES)
FRONT REQ TRNS REQ T/OV FULL THEO CASINOMONEY COMM WIN NET
20000 20.75 415000 1983 5520 130000 16.12 483000 2714 6432 140000 13.10 524000 3144 6969 050000 11.55 577500 3713 7681 160000 13.65 819000 5265 10893 070000 13.16 921200 6352 12252 180000 11.60 928000 6425 12342 090000 10.31 927900 6424 12341 0
100000 10.41 1041000 7808 13845 -1200000 6.21 1242000 9315 16519 -2
Let us now compare the break-even levels for the cash chip system with the Casino net profitability if the non negotiable commission structure is used (detailed analysis of the non negotiable system is carried out in the non negotiable section).
2.4.10 Casino Net Comparisons (Cash Chip for Non Negotiable) at Cash Chip Breakeven Levels
FRONT COMM CASH CASINO NET COMM CASINO NETMONEY CHIP CASH NON NEG NON NEG
20000 1983 1 2675 -69030000 2714 1 3318 -60340000 3144 0 3820 -67650000 3713 1 4388 -67460000 5265 0 5895 -63070000 6352 1 6706 -35480000 6425 0 7040 -61590000 6424 0 7340 -916
100000 7808 -1 8205 -398200000 9315 -2 9315 -2
This data serves to highlight one of the advantages of the cash chip system. As the commission structure is linked to the required turnover, and the required turnover amounts vary in proportion to the front monies, this provides a greater incentive for the junket operator to only bring in players with larger amounts of front money. Approximate information on current levels of expenses incurred by junket operators is shown below:
2.4.11 Junket Operator’s Expenses Per Person
AIRFARES

LOCATION ECONOMY BUSINESS FIRST CLASS
SINGAPORE 870 2600 3240TAIPEI 1945 3470 N/AKUALA LUMPUR 810 1870 2450JAKARTA 1270 2540 3310BANGKOK 1280 2480 3230HONG KONG 1530 3220 3950
INCIDENTALS APPROXIMATE(20K– 50K) (50K–100K) (100K+)
AIRPORT TRANSFERS (NOT ADELAIDE) 100 100 100HOTEL COSTS (OTHER THAN ROOM) 100 150 200DEVELOPMENT COSTS (MIN) 500 750 1000
Junket operators do different deals with different players and these deals vary from operator to operator, therefore it is difficult to provide an accurate assessment of the costs incurred by junket operators. For larger players, the junket operator may also give that player a percentage of the operator’s commission. As an approximately guide, junket operators provide economy airfares for 20K to 50K players, business class airfares for 50K to 100K players and first class airfares for 100K + players. Hotel costs and development costs will also vary according to player’s bankroll amounts. Approximate totals of operator’s costs are shown below.
2.4.12 Operator’s Costs (Approximate)
LOCATION COSTS COSTS COSTS(20-50K) (50-100K) (100K+)
SINGAPORE 1570 3600 4540TAIPEI 2645 4470 N/AKUALA LUMPUR 1510 2870 3750JAKARTA 1970 3540 4610BANGKOK 1980 3480 4530HONG KONG 2230 4220 5250AVERAGE 1984 3697 4536

2.4.13 Casino Net to Operator’s Net Comparison (Revised Expenses) 20 Turns, Edge 1.33
FRONT OP NET CASINO NET OP-CASMONEY
20000 -51 -108 5730000 1166 803 36340000 2416 1681 73550000 3802 2423 137860000 3246 2376 87070000 4865 2885 198080000 6088 3790 229890000 7311 4695 2616
100000 8464 5011 3453200000 21464 12658 8806
This information, combined with the break-even levels may be useful if it is determined that the required turnover levels need to be altered or the program modified in any way. It may be considered pertinent, for example, to ensure that the break-even levels for the junket operator and the Casino are relatively close so as to provide a greater incentive for the junket operator to bring in players of value not only to him or herself but also to the Casino.
2.4.14 Possible Junket Program Modifications
FRONT REQ TRNS REQ T/OV FULL COMM FULL COMMMONEY 9% 6%
20000 21 420000 1800 120030000 19 570000 2700 180040000 16 640000 2600 240050000 15 750000 4500 300060000 14 840000 5400 360070000 14 980000 6300 420080000 13 1040000 7200 480090000 13 1170000 8100 5400
100000 12 1200000 9000 6000200000 12 2400000 18000 12000
FRONT TRANS OP NET CASINO OP-CASMONEY NET
20000 19.13 -344 0 -34530000 13.73 - 33 1 - 3440000 12.12 743 0 74250000 10.48 1160 0 1159

60000 13.65 1568 0 156870000 11.70 1568 0 156880000 11.60 2728 0 272890000 10.31 2727 0 2727
100000 10.41 3272 -1 3272200000 6.21 4779 -2 4781
2.4.15 Comparison of Required Turns (Existing to Modified)
FRONT REQ TURNS REQ TURNSMONEY EXISTING MODIFIED
20000 18 2130000 16 1940000 15 1650000 14 1560000 14 1470000 13 1480000 13 1390000 13 1310000 12 1220000 12 12
If modification to the program was considered necessary then the above modifications could be utilised to meet the specified criteria. However before altering any aspect of the junket program the total impact on the program must be considered. When considering the operator’s profit levels in the above calculations, it must be remembered that the operator’s costs shown are the very minimum costs that he/she would incur in bringing players to Adelaide. The payback of commission to players will severely limit operator’s profits as will the extension of credit players, where this credit on occasion goes unpaid. Bad debt is becoming one of the operator’s biggest areas of expense. The operators have had to extend credit in order to attract clients. This has further limited the viability to the operators of bringing their clients to Adelaide. Therefore before placing any restrictions on operators or reducing in any way their commission levels, it must be remembered that if bringing junkets to Adelaide does not remain a viable prospect for the operators, they will take their custom elsewhere. This would obviously not be the desired result from the Casinos point of view and hence even minor alterations to junket program policy should be given careful consideration.
2.4.16 Conclusion
The cash chip system for calculating commission is an extremely versatile program which can easily be modified to fulfil any criteria set. The system is functional at all levels of front monies and offers a number of advantages over the non negotiable system especially at individual front money levels which are less than $100,000.
The advantages of the system are:

1. All games are available2. Games may be played in any location of the Casino3. Actual turnover is recorded4. Required turnover levels are related to front monies on an external cost allocation (per room
basis)5. Profitability on levels of front money under $100,000 is maintained for lower levels of turnover6. Continuous changing of cash chips to cheque credits is not necessary7. Commission calculations are independent of win/loss8. Individual turnover may be recorded9. Commission calculations are up to date, and10. The program may be modified without altering the commission percentages.
Therefore it may be stated that the cash chip system should be given consideration when setting up any junket program, especially if the 20K to 100K market is to be targeted.
2.5 Non Negotiable Chip System
2.5.1 Introduction
This system is offered to meet the market demands. Many junket operators and players who go to Macau use this system and feel comfortable with it. In fact, operators have used this system for many years. This is because the system offers a method for both the operator and the Casino to measure turnover and thus calculate commission payable to the operator. It is therefore an independent method and thus calculate commission payable to the operator. It is therefore an independent method of commission calculation which both the operator and Casino may follow.
The system itself is one whereby the junket deposits an amount of money, known as “front monies” and is issued with cheque credits to an amount equal to the front monies clearly marked with the words NON NEGOTIABLE on the front thereof. These non negotiable cheque credits may then be exchanged for non negotiable chips only at the gaming tables. The non negotiable cheque credits issued are listed by the Casino operator on what may be referred to as a cage turnover schedule with returned non negotiable chips and cheque credits being deducted from this schedule total at settlement. Any cash chips which the operator returns to the cage may be converted to further non negotiable cheque credits if required. Cash chips are issued to the junket players at the appropriate game odds when winning non negotiable chip wagers are being paid. When the non negotiable chip wager loses, it is placed in the gaming table float as per a normal wager. Therefore the system is basically a measure of player’s losses of non negotiable chips and/or cheque credits through the play of Casino games. The purpose of this is to calculate a commission amount payable to the junket operator based on the level of play of the players that he or she brings to gamble in the Casino. These are players with large amounts of money from overseas who, without the junket operator, would not have come to the particular Casino. Therefore the commission is an incentive for the operator to bring his or her associates to a particular Casino.

This system is utilised by the Adelaide Casino in the following manner.
2.5.2 Games Available
Gaming is restricted to the International Room on this program and only Baccarat, mini Baccarat and Blackjack can be played.
2.5.3 Deposits and Number of Players
The minimum deposit is $400,000. The minimum per person is $50,000. The minimum number of players is four.
2.5.4 Commission Structure
Commission structure = 2%, 2%, 2%, 1% unlimited based on the number of turns through the cage. The turns through the cage being the number of times the amount of the initial front monies is lost in non negotiable chips. Therefore 1 turn through the case is the equivalent of the group either losing all their front monies or converting the non negotiable chips and cheque credits to cash chips.
The minimum turnover requirements are 4 times (turns), if a group falls under this the commission is reduced to 1.5%, 1.5% or 1.5% times the number of turns through the cage.
Therefore the commission percentage for the non negotiable system equals the number of turns through the cage broken down into units multiplied by the commission percentage structure
For example:
5 turns through the cage = 1 turn + 1 turn + 1 turn + 1 turn + 1 turn.
The commission structure where the turns through the cage is greater than or equal to 4 is 2%, 2%, 2%, 1% unlimited (that is the 1% figure is used thereafter).
Therefore for 5 turns the commission percentage = 2% + 2% + 2% + 1% + 1% = 8% or to show this more simply:
The commission percent is equal to the number of turns + 3 if the turns are greater than or equal to 4.
Therefore for 5 turns the commission percentage = (5 + 3)% which is 8%.
Where the turns through the case is less than 4 then the commission structure becomes 1.5%, 1.5%, 1.5%.

For example:
3 turns through the cage = 1 turn + 1 turn + 1 turn
Therefore the commission percentage equals 1.5% + 1.5% + 1.5% = 4.5% or to show this more simply:
The commission percent is equal to the number of turns multiplied by 1.5% if the turns are less than 4.
2.5.5 Operators’ Responsibilities
The operator is responsible for the changing of cash chips for hi/her players.
2.5.6 Commission Calculation Example
Commission is calculated on monies turned over through the cage. The groups are rated as one.
Calculation of commission:
Example: Front monies $1,500,000
Monies turned over and recorded by the cage $21,000,000
Operator has: $600,000 non negotiable chips
$250,000 non negotiable cheque credits
$ 50,000 cash chips
The only concerns in the calculation of the commission are the non negotiable chips, cheque credits and the cage turnover schedule. Cash chips are converted to cash and recorded separately.
All non negotiable chips and cheque credits are deducted from the turnover schedule. Commission is based on the chips that have been lost.
CAGE TURNOVER SCHEDULE = $21,000,000
LESS RETURNED NON NEGS = $850,000 (chips and cheque credits)
HENCE CAGE TURNOVER = $20,150,000
TURNS = CAGE TURNOVER/FRONT MONIES
TURNS = $20,150,000/$1,500,00
TURNS = 13,4333

ADD 3 TO NUMBER OF TURNS = COMMISSION PERCENTAGE (TURNS>=4)
COMMISSION PERCENTAGE = 16.4333%
COMMISSION PAYABLE = commission percentage times front monies
COMMISSION PAYABLE = 16.4333% x $1,5000,000
COMMISSION PAYABLE = $246,500
If the cage turnover is less than 4 times the front monies, the commission is calculated as follows.
Operator has non negotiable chips of $30,000
FRONT MONIES = $1,500,000
CAGE TURNOVER SCHEDULE = $5,580,000
LESS NON NEGS. = $30,000
CAGE TURNOVER = $5,550,000
TURNS = 5,550,000/1,500,000
TURNS = 3.7
COMMISSION PERCENTAGE = turns x 1.5%
COMMISSION PERCENTAGE = 5.55%
COMMISSION PAYABLE = 5.55% x FRONT MONIES
COMMISSION PAYABLE = $83,250
2.5.7 Revenue Calculations
The revenue calculations for this system require the conversion of the known cage turnover (cage turnover) schedule amount, minus returned non negotiable chips and cheque credits) to a theoretical turnover. The theoretical turnover being a calculation of the theoretical total amount wagered on the game given the house edge and the odds payable. It is essential that this amount be correctly approximated for commission payable structures to be calculated and the system to be profitable to the Casino operator. At this point in time revenue calculations have been made on the basis that the amount turned over through the cage needed to have been wagered twice on the tables which as is shown later, is a reasonable approximation of the general theorem for calculating theoretical turnover from cage turnover, given the restriction of the games available for play using the non negotiable system.
2.5.8 Other Information
It is noted in the internal junket procedures manual that this policy has the potential to be exploited by the junket operators trying to bring in lower levels of front monies, as there are no turnover requirements. It is also suggested in this manual that by monitoring play and players, one can keep the situation well under that Casino’s control.

2.5.9 Splinter Program
Also available to players who do not wish to be associated with a junket operator is a splinter program which, on the non negotiable program, pays 1% of cage turnover to the player as commission. This program also offers the player full charges for the duration of their stay to be met by the Casino.
2.5.9 Commission Calculations Analysis
It is extremely important to fully understand exactly how and why the non negotiable chip system operates in regard to commission calculations.
Firstly it is important to recognise the fact that commissions calculated on this system are based on chips that have been LOST not on the basis of the cash chips that are returned to the cage and redeemed to further non negotiable cheque credits. This is because we deduct from the cage turnover schedule the amounts of returned non negotiable chips and cheque credits prior to commission calculations. Due to this fact, initial front monies are recorded on the cage turnover schedule as well as cash chips redeemed for further non negotiable cheque credits.
Consider the following: a junket buys in for $1,000,000 and therefore receives this amount in non negotiable cheque credits, should the group then decide not to play and return these cheque credits then the returned cheque credits are deducted from the cage turnover schedule which would have been credited with the initial front monies of $1,000,000. This of course provides a net cage turnover of zero which in turn relates to a commission payable of zero. The non negotiable cheque credits may then be redeemed for cash, cheque, etc. by the operator.
Therefore Point 1:
The non negotiable commission calculation is based on players’ losses only.
Secondly, it is important to understand the validity of the statement “Once through the cage, equals twice over the tables.”
This statement is ROUGHLY accurate for the non negotiable chip system when considering EVEN CHANCE PLAY ONLY. Consider firstly an unbiased game with an even chance of winning or losing. In this game non negotiable chips are wagered and if the wager wins then these chips are paid in cash chips, if the wager loses then the non negotiable chips are lost. As the number of wagers increases then the percentage of wins and losses will tend toward an even split of 50/50, however even in this case it should be noted that, whilst the percentages should tend toward 50% as the number of trials increases the actual numerical variance may still increase. However, if a large number of trials are considered then the expected result in a non biased even chance game would be to retain 50% of the non negotiable chips wagered and to be paid 50% in cash chips giving a total win/loss tending towards 0%. Therefore, of the total amount of non negotiable chips wagered, one half of these would be paid in cash chips and one half lost.

Therefore Point 2:
“Once through the cage, equals twice over the table” is an approximately valid statement given a large number of trials and an unbiased even chance game or a game where the percent return to the player in non negotiables equals 50%.
Thirdly, compare the cash chip commission system to the non negotiable commission calculation using the above formula that turnover equals cage turns multiplied by two.
COMMISSION COMPARISON – CASH TO NON NEGOTIBLE:
(TURNOVER = CAGE TURNOVER X 2)
CASH CHIP SYSTEM
FRONT REQ REQ. FULL FULL ACT. COMMMONEY TURNS T/OVER COMM COMM T.OVER PAID.
9% 6%
20000 18 360000 1800 1200 360000 180030000 16 480000 2700 1800 480000 270040000 15 600000 3600 2400 600000 360050000 14 700000 4500 3000 700000 450060000 14 840000 5400 3600 840000 540070000 13 910000 6300 4200 910000 630080000 13 1040000 7200 4800 1040000 720090000 13 1170000 8100 5400 1170000 8100
100000 12 1200000 9000 6000 1200000 9000
NON NEGOTIABLE SYSTEM
FRONT REQ REQ CAGE TURNS COMM. COMM.MONEY TURNS T/OVER T/OVER NON NON CASH
CASH CASH NON NEG NEG NEG CHIPCHIP CHIP
20000 18 360000 180000 9.0 2400 180030000 16 480000 240000 8.0 3300 270040000 15 600000 300000 7.5 4200 360050000 14 700000 350000 7.0 5000 450060000 14 840000 420000 7.0 6000 540070000 13 910000 455000 6.5 6650 630080000 13 1040000 520000 6.5 7600 720090000 13 1170000 585000 6.5 8550 8100
100000 12 1200000 600000 6.0 9000 9000

COMMISSION COMPARISON
FRONT ACT COMM. TURNS COMM. VARIANCEMONEY T/OVER. CASH CHIP NON NEG NON NEG
20000 360000 1800 9.00 2400 60030000 480000 2700 8.00 3300 60040000 600000 3600 7.50 4200 60050000 700000 4500 7.00 5000 50060000 840000 5400 7.00 6000 60070000 910000 6300 6.50 6650 35080000 1040000 7200 6.50 7600 40090000 1170000 8100 6.50 8550 450100000 1200000 9000 6.00 9000 0
COMMISSION COMPARISON WHERE CAGE TURNS EQUALS 3
FRONT ACT COMM. TURNS COMM. VARIANCEMONEY T/OVER. CASH CHIP NON NEG NON NEG
20000 120000 600 3.00 900 30030000 1800001013 3.00 1350 33840000 2400001440 3.00 1800 36050000 3000001929 3.00 2250 32160000 3600002314 3.00 2700 38670000 4200002908 3.00 3150 24280000 4800003323 3.00 3600 27790000 5400003738 3.00 4050 312100000 6000004500 3.00 4500 0
COMMISSION COMPARISON WHERE CAGE TURNS EQUAL 4
FRONT ACT COMM. TURNS COMM. VARIANCEMONEY T/OVER. CASH CHIP NON NEG NON NEG
20000 160000 800 4.00 1400 60030000 240000 1350 4.00 2100 75040000 320000 1920 4.00 2800 88050000 400000 2571 4.00 3500 92960000 480000 3086 4.00 4200 111470000 560000 3877 4.00 4900 102380000 640000 4431 4.00 5600 116990000 720000 4985 4.00 6300 1315100000 800000 6000 4.00 7000 1000

COMMISSION COMPARISON WHERE CAGE TURNS EQUALS 5
FRONT ACT COMM. TURNS COMM. VARIANCEMONEY T/OVER. CASH CHIP NON NEG NON NEG
20000 200000 1000 5.00 1600 60030000 300000 1688 5.00 2400 71340000 400000 2400 5.00 3200 80050000 500000 3214 5.00 4000 78660000 600000 3857 5.00 4800 94370000 700000 4846 5.00 5600 75480000 800000 5538 5.00 6400 86290000 900000 6231 5.00 7200 969
100000 1000000 7500 5.00 8000 500
COMMISSION COMPARISON WHERE CAGE TURNS EQUALS 6
FRONT ACT COMM. TURNS COMM. VARIANCEMONEY T/OVER. CASH CHIP NON NEG NON NEG
20000 240000 1200 6.00 1800 60030000 360000 2025 6.00 2700 67540000 480000 2880 6.00 3600 72050000 600000 3857 6.00 4500 64360000 720000 4629 6.00 5400 77170000 840000 5815 6.00 6300 48580000 960000 6646 6.00 7200 55490000 1080000 7477 6.00 8100 623100000 1200000 9000 6.00 9000 0
From this information it can be seen that the two systems become comparatively equal on a commission basis when the front money is greater than or equal to $100,000 and the turns through the cage is greater than or equal to 6. When these criteria are met the commission structure is such that the commission payable from either system is virtually the same. When these criteria are not met the non negotiable commission exceeds that of the cash chip system.
Therefore Point 3 is:
The commission structure of the non negotiable system is such that profitability is reduced when junkets play non negotiables if their front monies is less than $100,000 per person and the turns through the cage are less than 6.
Fourthly, given that Casino games are not unbiased what effect does this have on commission payments and profitability. Given that the non negotiable system is a loss based system, consider the effect of the house edge on the relationship between the cage turnover and the actual turnover. To perform these calculations it is necessary to utilise the theoretical house edge for the various games and consider situations where the initial front monies is non negotiables are reduced to zero, given even chance play.

THEORETICAL TURNOVER TO CAGE TURNOVER COMPARISONS:(FRONT MONIES REDUCED TO ZERO)
GAME HOUSE % RETURN % RETURN % RETURN %LOSS NONEDGE PLAYER CASH NON NEG. NEG
AR 2.7 97.3 48.65 48.65 51.35BJ 1.3 98.7 49.35 49.35 50.65
GAME FRONT WAGER CASH NON NEG.MONEY
AR 20000 20000.00 9730.00 9730.00 9730.00 4733.65 4733.65 4733.65 2302.92 2302.92 2302.92 1120.37 1120.37 1120.37 545.06 545.06 545.06 265.17 265.17 265.17 129.01 129.01 129.01 62.76 62.76 62.76 30.53 30.53 30.53 14.85 14.85 14.85 7.23 7.23 7.23 3.52 3.52 3.52 1.71 1.71 1.71 0.83 0.83 0.83 0.40 0.40 0.40 0.20 0.20 0.20 0.10 0.10
TOTALS 38948.21 18948.30 0.10
THEORETICAL T/OVER TO CAGE T/OVER COMPARISONS:(FRONT MONIES REDUCED TO ZERO)
GAME FRONT WAGER CASH NON NEG.MONEY
BJ 20000 20000.00 9870.00 9870.00 9870.00 4870.85 4870.85 4870.85 2403.76 2403.76 2403.76 1186.26 1186.26 1186.26 585.42 585.42 585.42 288.90 288.90 288.90 142.57 142.57 142.57 70.36 70.36 70.36 34.72 34.72 34.72 17.14 17.14

17.14 8.46 8.46 8.46 4.17 4.17 4.17 2.06 2.06 2.06 1.02 1.02 1.02 0.50 0.50 0.50 0.25 0.25 0.25 0.12 0.12
TOTALS 39486.43 19486.55 0.12
Front monies is non negotiable chips being reduced to zero will equate with the cage turnover equalling the front monies ie 1 turn. The total of non negotiable wagers to achieve this is shown in the first totals column, this would be the theoretical turnover amount.
From this data it can be seen that the relationship between actual turnover and losses of non negotiable chips, that is cage turnover, varies according to the percentage return to the player for the particular game. With the actual turnover being theoretically less than double the initial amount of front monies.
For Roulette this relationship can be expressed as:
Theoretical turnover = {front monies + (18/19 x front monies )} 18/19 being an accurate representation of the return to player in non negotiable/loss of non negotiables.
Where front monies = Cage turnover in this case.
For Blackjack the relationship can be expressed as:
Theoretical turnover = {front monies + 49.35/50.65 x front monies)}
Where front monies = Cage turnover in this case.
This is applicable if, and only if, EVEN CHANCE play is being considered.
The game of Baccarat will be examined later as this game needs to be considered in detail as it is the preferred game of the junket players.
Therefore Point 4 is:
The theoretical turnover is slightly less than twice the amount of front monies when considering even chance play on Roulette and Blackjack.
The effect on probability of this fact can be displayed as below.

COMMISSION COMPARISON ROULETTE
FRONT ACT. COMM CAGE TURNS COMM VARIANCEMONEY T/OVER CASH T/OVER NON NEG NON NEG.
CHIP.
20000 360000 1800 184865 9.24 2449 64930000 480000 2700 246486 8.22 3365 66540000 600000 3600 308108 7.70 4281 68150000 700000 4500 359459 7.19 5095 59560000 840000 5400 431351 7.19 6114 71470000 910000 6300 467297 6.68 6773 47380000 1040000 7200 534054 6.68 7741 54190000 1170000 8100 600811 6.68 8708 608
100000 1200000 9000 616216 6.16 9162 162
COMMISSION COMPARISON BLACKJACK
FRONT ACT. COMM CAGE TURNS COMM VARIANCEMONEY T/OVER CASH T/OVER NON NEG NON NEG.
CHIP.
20000 360000 1800 182340 9.12 2423 62330000 480000 2700 243120 8.10 3331 63140000 600000 3600 303900 7.60 4239 63950000 700000 4500 354550 7.09 6055 65570000 910000 6300 460915 6.58 6709 40980000 1040000 7200 526760 6.58 7668 46890000 1170000 8100 592605 6.58 8626 526
100000 1200000 9000 607800 6.08 9078 78
From this data it can be seen that the theoretical commission payable for non negotiable junkets will exceed that of cash chip junkets when considering even chance play on Blackjack and Roulette.
The comparisons for Baccarat are more complicated due to the percentage return to the player being variable dependant on levels of play on the various wager areas and the 5% commission payable on winning bank bets.
COMMISSION COMPARISON BACCARAT
WAGER HOUSE % RETURN % RETURN % RETURN % LOSS EDGE PLAYER CASH NON NEG. NON NEG
PLAYER 1.36 98.64 49.32 49.32 50.68

WAGER FRONT BET CASH NON NEG.MONEY
PLAYER 20000 20000.00 9864.00 9864.00 9864.00 4864.92 4864.92 4864.92 2399.38 2399.38 2399.38 1183.37 1183.37 1183.37 583.64 583.64 583.64 287.85 287.85 287.85 141.97 141.97 141.97 70.02 70.02 70.02 34.53 34.53 34.53 17.03 17.03 17.03 8.40 8.40 8.40 4.14 4.14 4.14 2.04 2.04 2.04 1.01 1.01 1.00 0.50 0.50 0.50 0.25 0.25 0.25 0.12 0.12
TOTALS 39463.06 19463.18 0.12
COMMISSION COMPARISON BACCARAT
WAGER HOUSE % RETURN % RETURN % RETURN % LOSS NONEDGE PLAYER CASH NON NEG NEG
PLAYER 1.17 98.83 48.15 50.68 49.32
WAGER FRONT BET CASH NON NEG.MONEY
BANKER 20000 20000.00 9630.00 10136.00 10136.00 4880.48 5136.92 5136.92 2473.43 2603.39 2603.39 1253.53 1319.40 1319.40 635.29 668.67 668.67 321.97 338.88 338.88 163.17 171.75 171.75 82.70 87.04 87.04 41.91 44.11 44.11 21.24 22.36 22.36 10.76 11.33 11.33 5.46 5.74 5.74 2.76 2.91 2.91 1.40 1.47 1.47 0.71 0.75 0.75 0.36 0.38 0.38 0.18 0.19

0.19 0.09 0.10
TOTALS 40551.11 19525.36 0.10
Therefore from this information it can be seen that for the game of Baccarat if the player were to wager an even amount on “Player” band “Banker” then the relationship between the cage turnover figure and the theoretical turnover IS in fact 1 to 2. Hence the statement “Once through the case, equal twice over the tablets” is correct for the game of Baccarat if, and only if, an equal amount of play on “Player” and “Banker” occurs.
The relationship between front monies and actual turnover can be expressed as:
theoretical turnover = {front monies + (49.32/50.68 x front monies)} for player.
where front monies equals Cage turnover in this case and;
theoretical turnover = {front monies + 50.68/49.32 x front monies)} for banker.
Where front monies equals cage turnover in this case.
Front monies equals cage turnover in both cases due to the fact that in the examples shown, the initial front monies were reduced to zero. This equates to losing all the non negotiable chips and cheque credits initially issued and therefore equals 1 turn.
Variations in the levels of play on the various wager areas will effect the amount of commission payable when compared to the cash chip system. Commission comparisons are shown below given 100% play on either “Player” or “Banker”.
COMMISSION COMPARISON BACCARAT (100% PLAY ON “PLAYER”)
FRONT ACT. COMM CAGE TURNS COMM VARIANCEMONEY T/OVER CASH T/OVER NON NEG NON NEG
CHIP.
20000 360000 1800 182448 9.12 2424 62430000 480000 2700 243264 8.11 3333 63340000 600000 3600 304080 7.60 4241 64150000 700000 4500 354760 7.10 5048 54860000 840000 5400 425712 7.10 6057 65770000 910000 6300 461188 6.59 6712 41280000 1040000 7200 527072 6.59 7671 47190000 1170000 8100 592956 6.59 8630 530100000 1200000 9000 608160 6.08 9082 82

COMMISSION COMPARISON BACCARAT (100% PLAY ON “BANKER”)
FRONT ACT. COMM CAGE TURNS COMM VARIANCEMONEY T/OVER CASH T/OVER NON NEG NON NEG.
CHIP. NEG
20000 360000 1800 177552 8.88 2376 57630000 480000 2700 236736 7.89 3267 56740000 600000 3600 295920 7.40 4159 55950000 700000 4500 345240 6.90 4952 45260000 840000 5400 414288 6.90 5943 54370000 910000 6300 448812 6.41 6588 28880000 1040000 7200 512928 6.41 7529 32990000 1170000 8100 577044 6.41 8470 370100000 1200000 9000 591840 5.92 8918 -82
The commission saving in comparison 2, for the $100,000 example, is offset by the theoretical win being reduced because of the lesser house edge on “Banker” bets as compared to “Player” bets. However, if the commission payments only, are compared, then it can be seen that there is a commission saving when 100% of wagers are placed on “bank”. Hence it may be stated that for the game of Baccarat the non negotiable chip system commission structure is EQUAL to that of the cash chip commission calculation when the front monies exceed $100,000 and the turns through the cage is greater than or equal to 6 if there is an equal distribution of wagers on “player” and “bank”.
Yet another important comparison can be carried out giving consideration to play on Roulette on bets other than even chance bets. This entails more rapid conversion of non negotiable chips to cash chips than occurs due to even chance play.
ROULETTE (ACCELERATED CONVERSION OF NON NEG. TO CASH CHIPS)
WAGER FRONT BET CASH NON NEGMONEY
STRAIGHT 20000 20000.00 18918.91 540.54UPS 540.54 511.32 14.61
14.61 3.82 0.39 0.39 0.37 0.01 0.01 0.01 0.00
TOTALS 20555.56 19444.44 0.00

WAGER FRONT BET CASH NON NEGMONEY
DOZEN 20000 20000.00 12972.97 6486.49COLUMNS 6486.49 4207.45 2103.73
2103.73 1364.58 682.29 682.29 442.57 221.28 221.28 143.53 71.77 71.77 46.55 23.28 23.28 15.10 7.55 7.55 4.90 2.45 2.45 1.59 0.79 0.79 0.52 0.26 0.26 0.17 0.08 0.08 0.05 0.03 0.03 0.02 0.01 0.01 0.01 0.00
TOTALS 29600.00 19200.00 0.00
From this it can be stated that the relationship between cage turnover and actual turnover varies in direct proportion to the odds payable and the expected return to the player in non negotiable chips.
Previously it was noted that the relationship for Roulette on even chance play only was:
theoretical turnover = {front monies + (18/19 x front monies)}
where front monies equal cage turnover in this case.
The relationship for dozen and column play on Roulette could be shown as:
theoretical turnover = {front monies + (12/25 x front monies)}
where front monies equal cage turnover in this case.
The relationship for straight up play on Roulette could be shown as:
theoretical turnover = {front monies + 1/36 x front monies)}
where front monies equals cage turnover in this case.
From this information it is possible to carry out commission comparisons for Roulette for the various wager types.

COMMISSION COMPARISON ROULETTE (100% PLAY ON STRAIGHT UPS)
FRONT ACT. COMM CAGE TURNS COMM VARIANCEMONEY T/OVER CASH T/OVER NON NEG NON NEG.
CHIP. NEG
20000 360000 1800 350270 17.51 4103 230330000 480000 2700 467027 15.57 5570 287040000 600000 3600 583784 14.59 7038 343850000 700000 4500 681081 13.62 8311 381160000 840000 5400 817297 13.62 9973 457370000 910000 6300 885405 12.65 10954 465480000 1040000 7200 1011892 12.65 12519 531990000 1170000 8100 1138378 12.65 14084 5984100000 1200000 9000 1167568 11.68 14676 5676
COMMISSION COMPARISON ROULETTE (100% PLAY ON DOZENS AND COLUMNS)
FRONT ACT. COMM CAGE TURNS COMM VARIANCEMONEY T/OVER CASH T/OVER NON NEG NON
CHIP. NEG.
20000 360000 1800 243243 12.16 3032 123230000 480000 2700 324324 10.81 4143 144340000 600000 3600 405405 10.14 5254 165450000 700000 4500 472973 9.46 6230 173060000 840000 5400 567568 9.46 7476 207670000 910000 6300 614865 8.78 8249 194980000 1040000 7200 702703 8.78 9427 222790000 1170000 8100 790541 8.78 10605 2505100000 1200000 9000 810811 8.11 11108 2108
From this it can be seen that, on the commission basis as it stands presently, it is more cost effective to rate play on a cash chip basis for Roulette rather than use the non negotiable chip system. This is not to say that the commission structure is not profitable on Roulette, as the greater house edge on Roulette as compared to Baccarat compensates for the extra commission payments. The comparison of the theoretical win after commission for Baccarat and Roulette where the Roulette play is straight ups only and the Baccarat play is an equal proportion of “Player” and “Banker” bets is shown below:
THEORETICAL WIN COMPARISON AFTER COMMISSION FOR BACCARAT AND ROULETTE, NON NEGOTIABLE SYSTEM
FRONT ACT CAGE T/OVER CAGE T/OVERMONEY T/OVER BA AR
20000 360000 180000 35027030000 480000 240000 46702740000 600000 300000 58378450000 700000 350000 68108160000 840000 420000 81729770000 910000 450000 88540580000 1040000 520000 101189290000 1170000 585000 113837810000 1200000 600000 1167568

THEORETICAL WIN COMPARISON AFTER COMMISSION FOR BACCARAT AND ROULETTE, NON NEGOTIABLE SYSTEM CONT.
THEO WIN LESS THEO WIN LESS VARIANCE COMM AR COMM BA
5617 2136 3481 7390 2748 4642 9162 3360 580210589 3820 676912707 4584 812313616 4816 880015561 5504 1005717506 6192 1131417724 6120 11604
THEORETICAL WIN COMPARISONS AFTER COMMISSION FOR ROULETTE, STRAIGHT UP PLAY ONLY (NON NEG AND CASH CHIP SYSTEM)
FRONT ACT CAGE THEO WIN THEO WIN VARIANCEMONEY T/OVER T/OVER LESS COMM LESS COMM
NN CC
20000 360000 350270 5617 7920 230330000 480000 467027 7390 10260 287040000 600000 583784 9162 12600 343850000 700000 681081 10589 14400 381160000 840000 817297 12707 17280 457370000 910000 885405 13616 18270 465480000 1040000 1011892 15561 20880 531990000 1170000 1138378 17506 23490 598410000 1200000 1167568 17724 23400 5676
Therefore the non negotiable chip system is best suited to even chance play, however it is still functional on games such as Roulette due to the high house edge.
Point 5:
Rating cash play on games where payout odds exceed even money is more cost effective than using the non negotiable system to calculate commission.
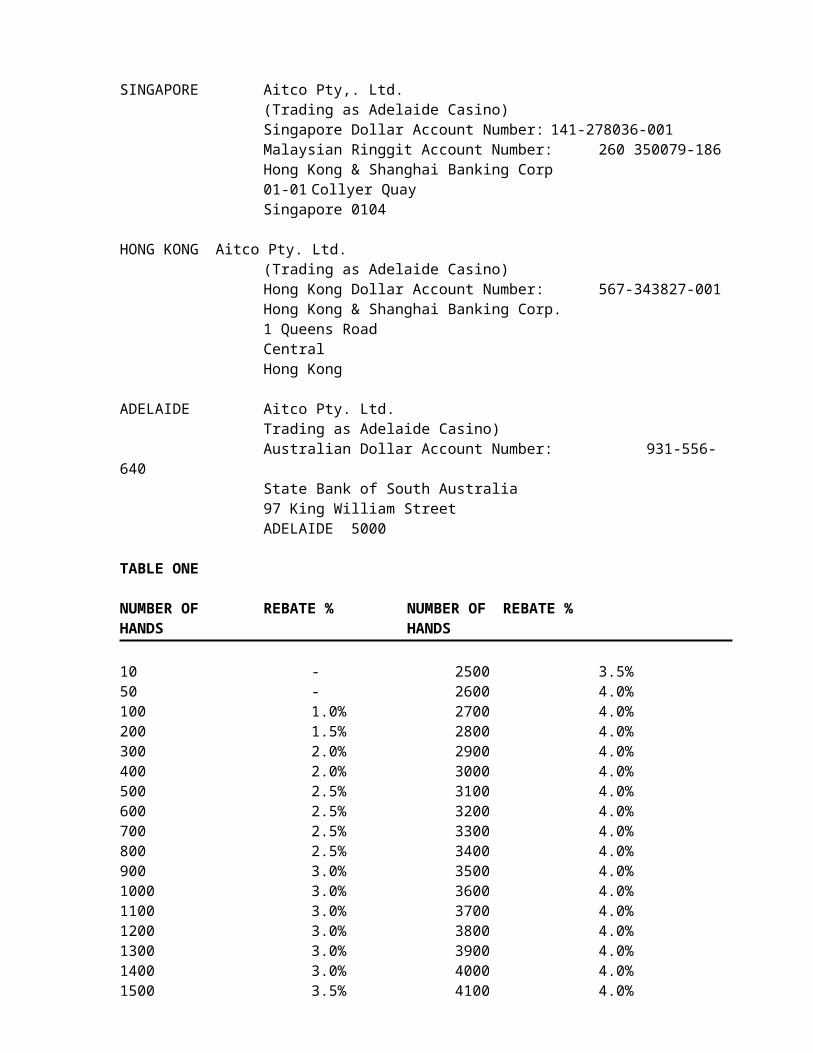
Point 6:
The non negotiable commission calculation can be valid for all Casino games, but is most effective when considering the game of Baccarat when front monies is greater than $100,000, the turns thought the cage is greater than 6, and there is equal play on “player” and “bank” or a greater percentage of play on “bank”.
Point 7:
Rating non negotiable play using raters whilst calculating the commission using the non negotiable commission system is a pointless exercise unless that information is used for other important statistical analysis.
Point 8:
The general theorem for calculating theoretical turnover given only cage turnover is: theoretical turnover equals the cage turnover plus the theoretical return to the player in non negotiable chips divided by the theoretical loss of non negotiable chips multiplied by the cage turnover.
Or
theoretical turnover = {Cage turnover x (theoretical return to player in non negotiables/theoretical loss to the player of non negotiables x cage turnover)}
Where the theoretical percentage loss to the player of non negotiables = 100 – the theoretical percentage return to the player in non negotiables.
The theoretical turnover will equal the cage turnover when the return to the player in non negotiables equals zero. Thus if a player were to wager an amount of non negotiables on one hand and this wager were to lose then that amount would be recorded as turnover on the cage turnover schedule. Conversely if the wager were to win then the cage turnover would equal zero as no loss of non negotiables has occurred. From this it can be seen that where a junket group loses a greater percentage of wagers than the expected or theoretical percentage, then the commission payable will also exceed the expected. Also the reverse is true where a junket group’s win exceeds the expected then the commission will be less than expected. Where the expected commission in both cases is based on actual turnover and not cage turnover.
If winning non negotiable chip wagers were converted to cash chips when paying a winning non negotiable wager, then this would provide an exact measure of turnover. This is cage turnover would equal actual turnover as the return to the player in non negotiables would equal zero in all cases. This is considered impractical in Casino operations due to game protection as well as the speed of the games being reduced.
Point 9:
Cage turnover will equal theoretical turnover when the return to the player in non negotiables equals zero.

2.5.10 Revenue Calculations
When setting up a non negotiable program and commission structure it is imperative to calculate the relationship between theoretical turnover and cage turnover and to perform revenue calculations from this data.
Example:
BACCARAT: (EQUAL PLAY ON “PLAYER” AND “BANK”)
EDGE = 1.26%
THEORETICAL TURNOVER = 2 X CAGE TURNOVER
CASINO TAX = 20% WIN
THEORETICAL WIN = EDGE X TURNOVER
THEORETICAL WIN = 1.26% X (2 X CAGE TURNOVER)
THEORETICAL WIN = 2.52% X CAGE TURNOVER
THEORETICAL WIN (after tax) = 2.52% X CAGE TURNOVER – 20% (WIN)
WIN AFTER TAX = 2.016% X CAGE TURNOVER
WIN AFTER TAX = 2.016% PER TURN
REVENUE CALCULATION COMPARISONS ( 1 – 10 TURNS) FOR VARIOUS GAMES AFTER TAX AND COMMISSION
GAME WAGER EDGE THEO TURN EDGE PER EDGE TAX % CAGE TURN TURN PER TURN
BACCARAT PLAYER 1.36 1.9732 2.6836 2.1468 BANKER 1.17 2.0276 2.3723 1.8978 50/50 PB 1.26 2.0000 2.5200 2.0160
BLACKJACK 1.30 1.9743 2.5666 2.0533ROULETTE EVEN 2.70 1.9470 5.2569 4.2055
CHANCE SRT UPS 2.70 1.0280 2.7756 2.2205 DOZ & COL 2.70 1.4800 3.9960 3.1968
CASINO NET % OF FRONT MONEY AFTER TAX AND COMMISSION BUT PRE EXPENSES FOR VARIOUS CAGE TURNS

TURNS BACC BACC BACC AR AR EVEN AR DOZ & COL “PLAYER” “BANK” BJ50/50 CHANCE STRA-
PB IGHT
1 0.6468 0.3978 0.5160 0.5533 2.7055 0.7205 1.69682 1.2937 0.7957 1.0320 1.1065 5.4110 1.4410 3.39363 1.9405 1.1935 1.5480 1.6598 8.1166 2.1614 5.09044 1.5874 0.5913 1.0640 1.2131 9.8221 1.8819 5.78725 2.7324 1.4892 2.0800 2.2664 13.0276 3.1024 7.98406 3.8810 2.3870 3.0960 3.3196 16.2331 4.3229 10.18087 5.0279 3.2848 4.1120 4.3729 19.4386 5.5434 12.37768 6.1747 4.1827 5.1280 5.4262 22.6442 6.7638 14.57449 7.3216 5.0805 6.1440 6.4794 25.8497 7.9843 16.771210 8.4684 5.9783 7.1600 7.5327 29.0552 9.2048 18.9680
Given this information, which is independent of front monies, it is necessary to calculate average individual expenses as a percentage of front monies. This will then provide information as to what levels of cage turns and front monies are required to ensure the profitability of the program. The “average” expenses are based on actual figures over the period 12 month period for the total junket program, and includes equal allocation of expenses for the Singapore office attributable to junkets. Average expenses have been considered the same in all cases for this analysis so as to assess program viability if groups were to solely bring in these levels of front monies. Also this is possibly a more appropriate method for analysing the non negotiable chip system as turnover requirements are not based on individual front money amounts.
AVERAGE EXPENSES STAFF COSTS = 1421OVERSEAS OFFICE = 618ACCOMMODATION = 552FOOD & BEVERAGE = 336TRAVEL/AIRFARE = 183
TOTAL = 3110
FRONT AVERAGE PERCENTMONEY EXPENSES
20000 3110 15.5530000 3110 10.3740000 3110 7.7850000 3110 6.2260000 3110 5.1870000 3110 4.4480000 3110 3.8990000 3110 3.46100000 3110 3.11200000 3110 1.56
NET CASINO PERCENTAGES FOR THE NON NEGOTIABLE JUNKET PROGRAMME FOR VARIOUS LEVELS OF FRONT MONIES ON A PER ROOM BASIS
FRONT TURNS NET CAS % NET CAS NET CAS NET CASMONEY 50/50 PB % % %
“PLAYER” “BANKER” BLACKJACK

20000 1 -15.04 -14.90 -15.15 -15.002 -14.25 -14.26 -14.76 -14.443 -14.00 -13.61 -14.36 -13.894 -14.49 -13.96 -14.96 -14.345 -13.47 -12.82 -14.06 -13.286 -12.46 -11.67 -13.16 -12.237 -11.44 -10.52 -12.27 -11.188 -10.42 - 9.38 -11.37 -10.139 - 9.41 - 8.23 -10.47 - 9.0710 - 8.39 - 7.08 - 9.57 - 8.02
FRONT TURNS NET CAS % NET CAS NET CAS NET CASMONEY 50/50 PB % % %
“PLAYER” “BANKER” BLACKJACK
50000 1 -5.70 -5.57 -5.82 -5.672 -5.19 -4.93 -5.42 -5.113 -4.67 -4.28 -5.03 -4.594 -5.16 -4.63 -5.63 -5.015 -4.14 -3.49 -4.73 -3.956 -3.12 -2.34 -3.83 -2.907 -2.11 -1.19 -2.94 -1.858 -1.09 -0.05 -2.04 -0.799 -0.08 1.10 -1.14 0.2610 0.94 2.25 -0.24 1.31
FRONT TURNS NET CAS % NET CAS NET CAS NET CASMONEY 50/50 PB % % %
“PLAYER” “BANKER” BLACKJACK
100000 1 -2.59 -2.46 -2.71 -2.562 -2.08 -1.82 -2.31 -2.003 -1.56 -1.17 -1.92 -1.454 -2.05 -1.52 -2.52 -1.905 -1.03 -0.38 -1.62 -0.846 -0.01 0.77 -0.72 0.217 1.00 1.92 0.17 1.268 2.02 3.06 1.17 2.329 3.03 4.21 1.97 3.3710 4.05 5.36 2.87 4.42
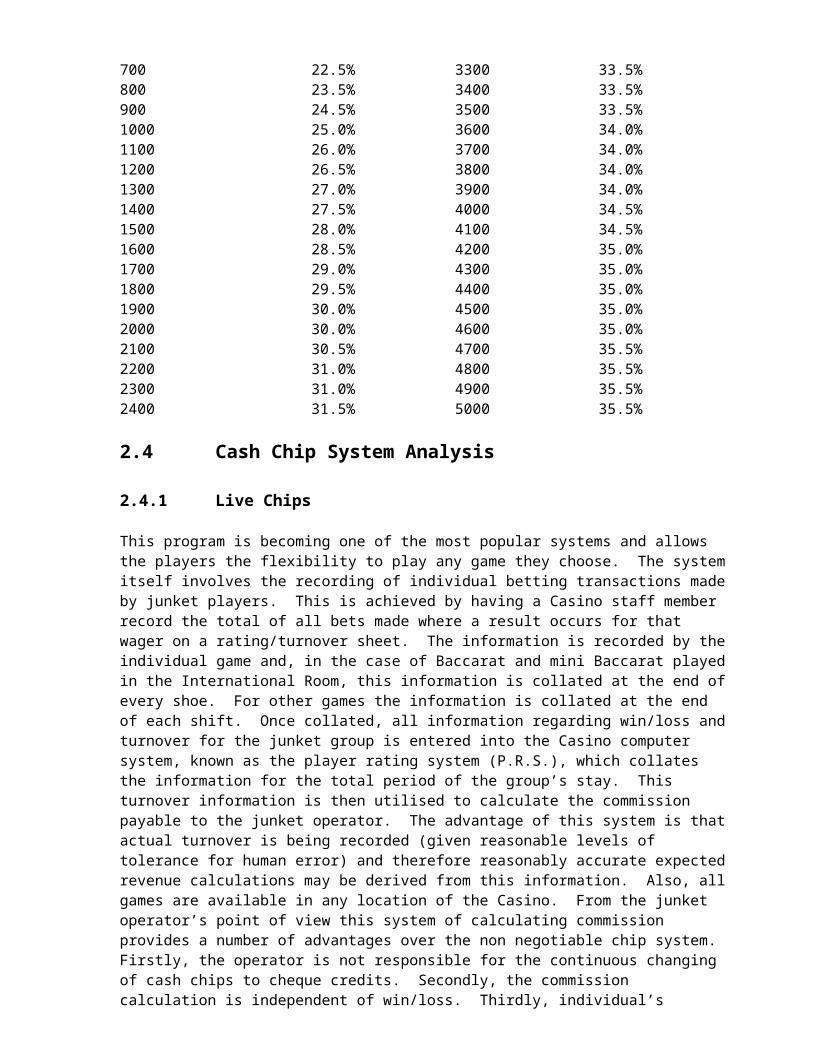
FRONT TURNS NET CAS % NET CAS NET CAS NET CASMONEY 50/50 PB % % %
“PLAYER” “BANKER” BLACKJACK
100000 1 -1.04 -0.91 -1.16 -1.002 -0.52 -0.26 -0.76 -0.453 -0.01 0.39 -0.36 0.104 -0.49 0.03 -0.96 -0.345 0.52 1.18 -0.07 0.716 1.54 2.33 0.83 1.767 2.56 3.47 1.73 2.828 3.57 4.62 2.63 3.879 4.59 5.77 3.53 4.9210 5.60 6.91 4.42 5.98
The breakdown of the percentage of the total market of junket players with various levels of front monies is as follows:
25K – 50K = 20% 50K – 75K = 40%75K – 100K = 30% 100K+ = 10%
From this data it can be seen that with the current levels of tax, commission and expenses on the non negotiable program, the profitability of the program is reduced where front monies are less than $100,000 and the turns through the cage are less than 6.
This also shows that to maintain the profitability of the program, the level of non fixed expenses must be continually monitored and reviews. This is to say that house edge, Government tax and the operators commission percentages are fixed and that expenses vary according to inflation etc. Hence periodic review of expenses will provide an indication as to whether the entry level requirements of the program need to be adjusted or the program altered in such a way as to limit or reduce Casino expenses. When increasing entry level requirements for the total program, consideration must be given to the actual percentage of players who fall into the various categories and whether by increasing the required level of front monies these players would be lost.
Point 10:
Expenses as a percentage of front monies on a per person/room basis need to be continually reviewed to maintain program profitability.
Point 11:
Entry level requirements to the program require adjustment on the basis of Casino net profitability. Such requirements should not deter the total market, but should target the desired market. Alternative should then be provided for the market segment which no longer meets the previous requirements, for example the cash chip system should then be promoted in this case as commission payments are based on front monies.

Point 12:
Non essential expenses to the program should be limited and maximum efficiency promoted as long as this does not decrease the level of service provided.
Point 13:
Staff costs severely limit the profitability of the junket program especially at the lower levels of front monies.
2.5.11 Conclusion
The non negotiable program is one which is best suited to high levels of front monies and Casino games where the percentage return to the player in non negotiables equals 50% or greater, that game being of course Baccarat. For Casino games where this is not true, or the front monies per person do not exceed $100,000, then the cash chip system is a much more viable concern.
When setting up a non negotiable program it is essential that the revenue calculations for the system are computed correctly and that the Casino net percentages are fully understood. The relationship between cage turnover and theoretical turnover for the program requires understanding for the various Casino games offered on the program.
The percentage of expenses to front monies is an essential tool in monitoring the entry requirements to the program, minimum front monies and turn requirements.
Expenses must be kept under control on any junket program but especially the non negotiable program if entry levels are not set correctly.
There is obviously a case for using only the non negotiable system, this being when the junket group wishes to play only Baccarat and their front monies is greater than or equal to $100,000 per person and the Casino operating procedures do not require their play of non negotiable chips to be rated by an additional staff member.
Therefore the non negotiable chip system is an interesting system which is generally misunderstood by Casino operators and thus applied incorrectly. It is a system which MAY have a place in a junket program if, and only if, the correct criteria are set or the junket operator and player will only accept this system and not the cash chip program which is generally more functional at all levels of front monies and on all Casino games.
2.6 Premium Player 0.5% (Splinter Policy)
The following is an extract from the Adelaide Casino Internal Junket Manual:
This program is offered to players with bankrolls of $100,000 or higher who wish to come in by themselves or no longer wish to be associated with a junket operator.
The program can be used with cash chips or non negotiable chips. The cash chip system offers 0.5% commission on turnover, the non negotiable offer 1%.
The non negotiable was introduced as the Casino felt there was a need for this in the market. The majority of players who come in on this program seem to find the cash chip system the easiest to deal with, as the system basically works on 6%. A player with a bankroll of $100,000 needs to turn this over 12 times, $1,200,000.

For example, $1,200,000 x 0.5% = $6,000 or 6% of $100,000 or 0.5% x 12 x $100,000 = (0.5% x 12) x $100,000.
With non negotiable chips the money will represent $600,000 through the cage. This figure can appear misleading to an operator as it would indicate less money needs to be turned over, as has been explained in the “Non negotiable chips” section. This is, in fact, not the case.
For this type of play the Casino will pick up all room, food and beverage costs. All other expenses such as travel expenses will be met by the player.
As with the other chip system, where the player can play will depend on what program the player chooses.
Under certain circumstances, the Casino may accept a player with a bankroll of less than $100,000, however, this would only occur with players who have proven to us their play warrants such considerations. It would not happen with a player visiting the Casino for the first time whose level of play is unknown”.
2.6.1 Commission Agents Program
It is with pleasure that we forward to you documentation outlining the various incentive programs currently available at the Adelaide Casino.
Ms. Loh Pek Lim, Adelaide Casino Marketing Coordinator – Asia, is available at our office to answer any enquiries and assist with Visa applications.
In order to ensure that we retain our fine reputation, we also have V.I.P. Hosts in Adelaide whose sole duties are to service the needs of our V.I.P. clients.
Adelaide
Mr. Andrew MacDonaldSenior Executive Casino OperationsTel: 61-8-218-41781, Fax: 61-8-212-4047
Ms. Christine GiamVIP Services SecretaryTel: 61-8-218-4254
Singapore
Ms. Loh Pek LimMarketing CoordinatorTel: 65-838-5310, Fax: 65-737-9084
For further enquiries please do not hesitate to contact the numbers listed.
1. Prior to any person becoming a Commission Agent of the Adelaide Casino, approval and licensing by the Liquor Licensing Commissioner of South Australia must be obtained by the applicant.
2. The player to the introduced to the Adelaide Casino will have to be an ‘unknown’ and never visited the Casino before.
3. However, if a player is introduced to the Casino by a Commission Agent, this player can make further visits to the Casino and the Commission Agent can continue to earn a commission on

subsequent visits within a period of 1 year of the first visit when these visits are organised by the Commission Agent.
4. Prior to any visit under this scheme taking place the VIP Services Department (which includes the Singapore office) must have the list of players submitted for screening and approval.
5. Each player must have a minimum deposit of $5,000. This will be deposited with the Casino Cage at the commencement of each visit. If a player wishes to add to his front money during his visit this will be allowed.
6. Cash and bank drafts are acceptable, however, if a draft is to be used, a copy must be forwarded by facsimile 48 hours before arrival, to enable our Finance Department to approve clearance.
7. We also have bank accounts in Hong Kong, Singapore and Adelaide which can be used for deposits. If overseas deposits are made the bank will issue a receipt which should be faxed 48 hours before arrival to our Finance Department.
8. All players’ names are to be faxed 48 hours before arrival to the Operations Executive Player Development and VIP Services.
9. Commission may be withheld if bank drafts and bank deposits have not been cleared through our bank account.
10. The following bankrolls and levels of play are required to receive the listed complimentaries and rebates.
Front Money Complimentaries(example for 20 turns)
$5,000 2 nights Accommodation Deluxe Room, Hyatt Regency AdelaideIn house food and beverageAirport transfers
$10,000 2 nights Accommodation Deluxe Room, Hyatt Regency AdelaideFood & Beverage (to the value $250)Airport transfersAirfare Reimbursement (to the value $200)
$20,000 2 nights Accommodation Deluxe Room, Hyatt Regency AdelaideFood & Beverage (to the value $250)Airport transfersAirfare Reimbursement (to the value $1000)
$30,000 2 nights Accommodation Deluxe Room, Hyatt Regency AdelaideFood & Beverage (to the value $250)Airport transfersAirfare Reimbursement (to the value $1800)
$40,000 2 nights Accommodation Deluxe Room, Hyatt Regency AdelaideFood & Beverage (to the value $250)Airport transfersAirfare Reimbursement (to the value $2600)
$50,000 2 nights Accommodation Deluxe Room, Hyatt Regency AdelaideFood & Beverage (to the value $250)Airport transfersAirfare Reimbursement (to the value $3400)

Should a player not reach the required turnover level then all complimentaries and rebates will be reduced proportionately. Complimentaries accrue at a rate of 0.4% of turnover.
11. Commission is payable to the agents on turnover at a rate of 0.2%.
12. Example of agents commissions are:-
FRONT TURNS TURNS NON AGENTMONEY CHIP (TABLE) NEGOTIABLE CHIP COMMISSION
(through the Cashiers Cage)
5,000 20 10 $20010,000 20 10 $40020,000 20 10 $80030,000 20 10 $120040,000 20 10 $160050,000 20 10 $2000
Non-negotiable chips can only be played on the games of Baccarat, Mini-Baccarat and Blackjack in the International Room and other such areas as designated.
The games of Craps and poker will not attract turnover ratings. All play will be tracked and monitored to give the Casino the required information on qualification. Each player will be provided with a rating card which must be shown at the start of play on every new table to ensure that the player is credit with the correct levels of turnover.

13. Commission will be payable to the Commission Agent by cash disbursement if the Agent is present or by cheque or telegraphic transfer to the Agent. This will be carried out at the end of each visit and is conditionally subject to clearance of any bank drafts/deposits.
14. If the Commission Agent is not present at settlement, commission will be calculated on the figures of turnover as recorded by the Adelaide Casino. Such calculations will be considered correct and final.
2.6.2 Banking Details
Accounts are provided at the following locations for your convenience.
SINGAPORE Aitco Pty. Ltd.(Trading as Adelaide Casino)
Singapore Dollar Account Number: 141-278036-001
Malaysian Ringgit Account Number: 260-350079-186
Hong Kong & Shanghai Banking Corp.01-01 Ocean Building10 Collyer QuaySingapore 0104
HONG KONG Aitco Pty. Ltd.(Trading as Adelaide Casino)
Hong Kong Dollar Account Number: 567-343827-001
Hong Kong & Shanghai Banking Corp.
1 Queens RoadCentralHong Kong
ADELAIDE Aitco Pty. Ltd.(Trading as Adelaide Casino)
Australian Dollar Account Number: 931-556-640
State Bank of South Australia97 King William StreetADELAIDE 5000
2.7 Player Loss(How to Deal with Actual Loss in the Casino Industry)
By Andrew MacDonald, Senior Executive Casino Operations
Paper prepared for the Ninth International Conference on Gambling and Risk Taking
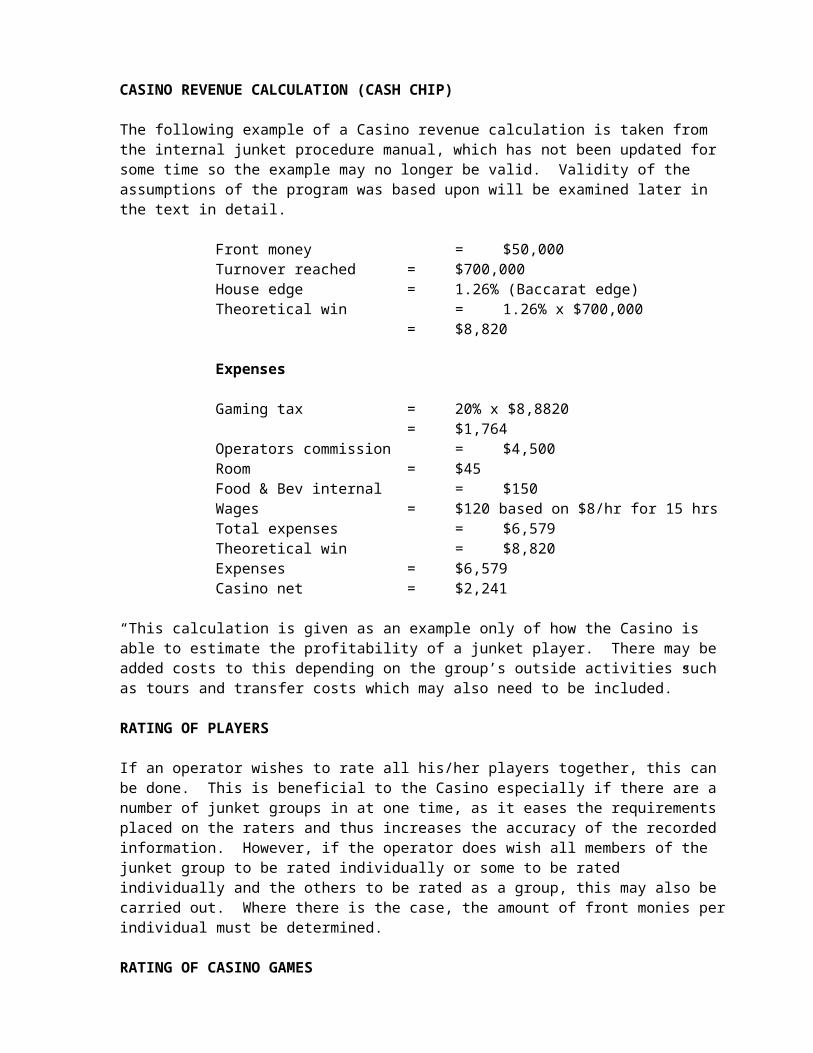
Submitted to Jennifer Crawford, Assistant Conference Coordinator, Institute for the Study of Gambling and Commercial Gaming, University of Nevada, Reno, NV 89557-0016.
Most complimentary and junket programs utilise either theoretical win or turnover upon which to calculate player complimentaries or rebates. In some cases, particularly in the United States, junket programs rebate a percentage of loss to the junket organiser or player.
Dealing with actual loss, however, is a difficult and often misunderstood issue. A common premise is that “so and so is a born loser” or “the money’s in the bank” or “they do it in Vegas (or at Caesars/Hilton etc)” and therefore giving a percentage of loss back to the player is all right.
The problem is that the percentage rebated is often plucked from the air and has no mathematical basis. This then leads to the fact that often no one knows what the theoretical or long term cost of such a policy is to the Casino company.
In most business organisations understanding cost implications are a central premise to operating effectively. Casino Operations should be no different particularly in an area where the rebate is a totally hard cost.
Therefore, what is the cost of rebating a percentage of loss to a player or junket organiser?
Firstly, it is important to recognise that the theoretical loss by a player is a combination of all winning and losing events experienced by a player in a game for a given number of results. Because most Casino games are fundamentally biased against the player, that result is a negative from the player’s perspective. Simply, that result may be calculated by multiplying the house advantage by the number of decisions and the average bet. Rebating a percentage of theoretical loss takes into account therefore both winning and losing situations and provides a long term validity to the policy of rebating a percentage of theoretical loss.
Thus, when theoretical loss is dealt with factors such as average bet, time played, decisions per hour and house advantage are incorporated. However, when actual loss is being dealt with most policies only deal with the amount of the loss. It is critical that other factors such as the number of decisions are incorporated, as criteria are essential to ensure that the policy is valid. This is because it is erroneous to believe that the percentage of actual loss rebated provides the same percentage of theoretical loss. In fact, if a policy rebates a fixed percentage of loss which is something greater than the house advantage, then the theoretical cost to the company will range from approximately the rebate percentage divided by twice the house advantage and would minimise at the rebate percentage. If the rebate on loss percentage were 10% and the house advantage 1.25%, then the theoretical cost of the rebate will range from roughly 400% of theoretical win at maximum, in an even chance game, and minimise at 10%.
The maximum cost would be realised if only one hand were played and then the player settled and were paid the rebate, with the minimum theoretical cost occurring if the player didn’t settle until they had played a very large number of hands. Many would argue that no one would play only one hand and then settle or that of course no rebate would be paid

under such a scenario. The real problem is that without play criteria it is the customer who may be in control of the net outcome. Much like the transition from paying complimentaries as a percentage of drop or credit line to basing these on calculations of theoretical casino win, so to must rebate on loss policies change to mathematically sound business decisions.
When rebating on loss, what must be calculated is the conditional mean of all situations where the player loses. In all cases because we are dealing with biased games that value will exceed or equal the mean of all possible events, both winning and losing, which we refer to as the player’s theoretical loss.
If a rebate on loss policy is to be sound, it is a percentage of the latter which should be utilised to calculate an equivalent rebate on loss percentage for a given number of decisions. That can be accomplished by determining the percentage of theoretical loss relative to the conditional mean of only player losses.
In a simple one hand example on an even money game, if normally the Casino were prepared to pay back 50% of theoretical loss then for each $1 wagered the player would receive 50% of the house advantage multiplied by the number of decisions. If the edge were 1.2% then 0.6% of $1 would be paid back to the player regardless of whether they won or lost. If it were only the player who lost to be rewarded then that player could be provided nearly twice as much, as the net position would be compensated by the winning player receiving nothing. Why slightly less than double? Because the player would lose 50.6% of the time and thus paying 1.186% of actual loss if settlement occurred after a single hand would be the equivalent of paying 50% of theoretical loss for the example cited.
As the number of hands increases so to does the percentage of actual loss which may be rebated until such time as the number of hands played is so large that in virtually every instance the player loses and thus the rebate percentage on actual loss may equal the percentage of theoretical loss. This is due to the fact that in such a case the theoretical loss (mean) and the conditional mean are one and the same. If 50% of theoretical loss were the general policy to be returned, then the maximum rebate on actual loss would also be 50%.
How large a value for the number of hands would this take?
In an even chance game with a 1.2% house advantage the following could be calculated.
One standard deviation = square root (N)
Where N is the number of hands
99.7% of all results fall within three standard deviations of the mean.
Therefore, 99.85% of all results would fall to the right of minus three standard deviations.

If we were to solve for when 0 were –3 standard deviations from the mean we find
3 (N) = mean
mean = N x edge
3 (N) = 1.2% N 3 N--- = --------1.2% (N)
Therefore N = (3/1.2%)²
N = 62,500
Thus, if a player were to play approximately 62,500 hands and then settle it would be appropriate to pay 50% of whatever that player’s actual loss were at the time.
We now know that for one hand it is appropriate to rebate 1.186% of actual player loss, whereas at 62,500 hands, 50% of actual loss may be repaid with both scenarios maintaining a 50% equivalency relative to theoretical loss in an even money game.
To determine points in between these extremes of number of hands, it is necessary to determine the conditional mean for each number of hands. To crudely demonstrate the process of integration the following is provided:-
Number of hands N = 100
Edge = 1.2%
Even money game
The mean = 1.2% x 100= 1.2
1 standard deviation = square root (N)= square root (100)= 10
From basic statistics we know that 34.13% of results occur between the mean and one standard deviation.
13.64% of results occur between one and two standard deviations and
2.23% of results are greater than two standard deviations
From this we may roughly calculate the conditional mean for all player losses.
To do this we take the probability range and multiply this by the mid point result.

34.13% x {(1.2 + (1.2 + 10))/2}
13.64% x {((1.2 + 10) + (1.2 + (2 x 10)))/2}
2.23% x {((1.2 + (2 x 10)) + (1.2 + (3 x 10)))/2}
and sum these which provides the conditional mean greater than the mean and then add the probability of results between 0 and the mean multiplied by that midpoint.
Without referring to normal distribution tables this may be approximated by taking the mean divided by the standard deviation and multiplying this by 34.13%, then multiplying that result by the midpoint of zero and the mean.
= 1.2 / 10 x 34.13% x 1.2/2
Thus the conditional mean = 2.116
+ 2.210
+ 0.584
+ 0.025
= 4.935
This compares to the standard mean (theoretical loss) of 1.2 and thus if a 50% rebate on theoretical loss were desired the rebate on actual loss based upon the above would be:
Rebate on actual loss % = 50% x 1.2 / 4.935= 12.16%
As stated this is a very crude example provided for demonstration purposes only.
To more accurately calculate the percentage to be rebated, it is merely necessary to utilise smaller sections when integrating and refer to normal distribution tables for the probabilities, or to utilise a lesser known statistical function referred to as the “UNLLI” or Unit Normal Linear Loss Integral. This is basically analogous to the sum of all possible values of a standard normal variables positive distances above the number “a”, multiplied by their corresponding probabilities of occurrence.
To put this into practice the following steps may be followed:
1. Find expected loss for the player.
2. Find standard deviation of player result.
3. Calculate z = expected loss/standard deviation.
4. Look up UNLLI table corresponding to z (see table below).
5. Multiply UNLLI value by standard deviation.
6. Add number calculated from point 5 to number calculated from point 1.
7. Take whatever percentage of point 1 is to be returned and divide by the result of point 6.

Example:-
Hands = 750, Edge = 1.25%
Payouts = even money
Theoretical loss equivalency = 50%
1. 750 x 1.25% = 9.375
2. square root (N) 750 = 27.386
3. 9.375 /27.386 = 0.342
4. UNLLI = 0.2508
5. 27.386 x 0.2508 = 6.868
6. 9.375 + 6.868 = 16.243
7. 9.375 x 50% / 16.243 = 28.859%
UNIT NORMAL LINEAR LOSS INTEGRAL
Z .00 .02 .04 .06 .08
0.00 .3989 .3890 .3793 .3697 .36020.10 .3509 .3418 .3329 .3240 .31540.20 .3069 .2986 .2904 .2824 .27450.30 .2668 .2592 .2518 .2445 .23740.40 .2304 .2236 .2170 .2104 .20400.50 .1978 .1917 .1857 .1799 .17420.60 .1687 .1633 .1580 .1528 .14780.70 .1429 .1381 .1335 .1289 .12450.80 .1202 .1160 .1120 .1080 .10420.90 .1004 .0968 .0933 .0899 .08661.00 .0833 .0802 .0772 .0742 .07141.10 .0686 .0660 .0634 .0609 .05851.20 .0561 .0539 .0517 .0496 .04751.30 .0456 .0437 .0418 .0401 .03831.40 .0367 .0351 .0336 .0321 .03071.50 .0293 .0280 .0268 .0256 .02441.60 .0233 .0222 .0212 .0202 .01921.70 .0183 .0174 .0166 .0158 .01501.80 .0143 .0136 .0129 .0122 .01161.90 .0110 .0104 .0099 .0094 .00892.00 .0084 .0080 .0075 .0071 .00672.10 .0063 .0060 .0056 .0053 .00502.20 .0047 .0044 .0042 .0039 .00372.30 .0036 .0034 .0032 .0030 .00282.40 .0027 .0026 .0024 .0023 .00222.50 .0021 .0018 .0017 .0016 .0016
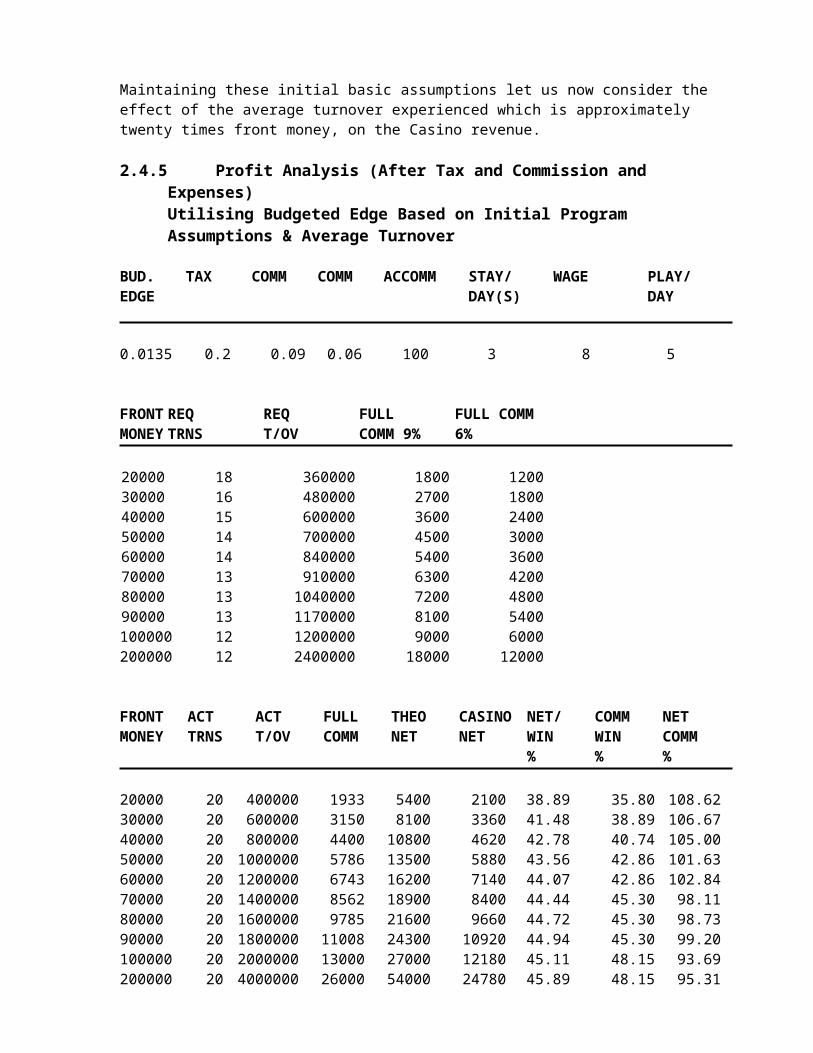
For the game of Baccarat it is then possible to calculate the following table:-
BACCARAT (PLAYER/BANK 50% EQUIVALENT)
HANDS % REBATE ON HANDS % REBATE ONACTUAL LOSS ACTUAL LOSS
____________________________ _______________________________
10 4.78% 1300 34.06%50 9.96% 1400 34.79%100 13.52% 1500 35.48%200 17.96% 1600 35.96%300 21.01% 1700 36.58%400 23.47% 1800 37.01%500 25.39% 1900 37.57%600 27.06% 2000 37.95%700 28.37% 2500 39.89%800 29.54% 3000 41.34%900 30.78% 3500 42.44%1000 31.75% 4000 43.48%1100 32.63% 4500 44.18%1200 33.29% 5000 44.88%
The above table is interesting in that it depicts the percentages of loss which can be paid for various numbers of hands to maintain a 50% rebate on theoretical loss equivalence. From this it can be seen that quite attractive rebates may be paid. A central question which arises, however, is what is the best or simplest manner by which to calculate the number of hands. While a simple method may be to take time played and employ standard decision rates, that is inappropriate due to potentially widely divergent bet levels.
This is important because when dealing with actual loss some bets may be statistically insignificant. To demonstrate using extremes, if we had 1000 hands with bets of $1000 and one hand with a bet of $1,000,000 clearly the player’s final result will be primarily determined by whether they win or lose the $1,000,000 hand. It can be said therefore that the 1000 hands are insignificant. Thus a reasonable method of calculating the number of hands played for the purposes of determining a rebate on loss is to divide the total turnover by the player’s maximum bet. This criteria may be particularly useful when the Casino permits a table differential to be employed which potentially allows an unlimited maximum bet to be placed.
Determining the maximum bet placed is generally a simple proposition if dealing with an individual player. In a junket group situation where members of the same group may for example bet against each other on Baccarat, the bet could be considered to be the difference between the opposing bets, even though the turnover is the sum of the opposing bets.
For other non-even pay off games such as Roulette, the mathematics remains similar, however, because the player wins more when they do win but this occurs less often, the percentage of actual loss which may be rebated is relatively less.

To incorporate this factor into the previously shown formula requires the calculation of the variance for a specific game for one result. In an even money game such as Baccarat (when playing Bank or Player) the variance may be approximated as one and therefore the previously shown formula was valid.
In any game the calculation of variance is accomplished by summing the square of the player wins multiplied by the probability of the returns. The standard deviation then becomes the square root of the number of hands multiplied by the average squared result.
In a game with multiple betting options at the same game with varying payoffs but the same house advantage (eg Roulette) the variance figure utilised when calculating a rebate on loss would necessarily be the maximum figure.
The appropriate numbers for various games are:-
Baccarat = 1 (exact figures 1.00 player, 0.95 bank)
Blackjack = 1.26
Roulette = 34.1 (single number bets on single zero Roulette)
In games with multiple betting options at varying payoffs and house edges it would be appropriate to fully calculate the rebate payable on every option and utilise the variance from the result which returns the least to the player as otherwise any requirements on data collection by staff may be prohibitive.
When performing this calculation the following formula may be used:-
1. Calculate the variance for one play.
2. Find expected loss for the player.
3. Find standard deviation of player result = √ (hands multiplied by variance (refer point 1))
4. Calculate z = expected loss / standard deviation.
5. Look up UNLLI table corresponding to z.
6. Multiply UNLLI value by standard deviation.
7. Add number calculated from point 5 to number calculated from point 2.
8. Take whatever percentage of point 2 is to be returned and divide by the result of point 7.
This then produces the following example of a table of rebate percentages applicable to be paid for the game of Roulette (when playing single numbers on a single zero game) and which maintains a 50% equivalence on theoretical loss.

ROULETTE (SINGLE NUMBER PLAY ON SINGLE ZERO ROULETTE)
HANDS % REBATE ON HANDS % REBATE ONACTUAL LOSS ACTUAL LOSS
____________________________ _____________________________
10 1.79% 1300 17.00%50 3.93% 1400 17.57%100 5.44% 1500 17.97%200 7.52% 1600 18.50%300 9.10% 1700 19.01%400 10.33% 1800 19.35%500 11.39% 1900 19.83%600 12.33% 2000 20.14%700 13.19% 2500 22.00%800 13.98% 3000 23.48%900 14.58% 3500 24.79%1000 15.27% 4000 25.98%1100 15.93% 4500 27.07%1200 16.55% 5000 27.91%
What use is all this information?
Many would argue that this is all too complicated to be of practical application in the Casino industry.
Firstly, it provides a mechanism by which any existing rebate on loss policy can be analysed to assess the long term or theoretical cost to the business.
Secondly, in the high level junket segment it provides a means by which variable percentage rebates on loss can be structured which can be both attractive and may be combined with rebates on turnover or the provision of other complimentaries. Being criteria based any policies so developed would possess a long term validity.
Thirdly, it provides a challenge to incorporate a rebate on loss element into the standard calculation of premium player complimentaries. One of the basic limitations of a theoretical loss based complimentary system is that while fine in theory the players often complain that no consideration is given should they incur a substantial loss. To any player, funds are a limiting factor which if depleted will limit the turnover they can provide which may also mean that what would normally be comped, to add insult to injury they may have to pay for. Some complimentary policies address this in a superficial way but again these are not criteria based.
To say that incorporating the above formula into a player rating system would not be practical because it could not be calculated or would not be understood by the player, is incorrect. Most player rating systems in large Casinos are computerised which would certainly enable any calculation to be undertaken.
Secondly, players already take most things on trust in terms of what complimentaries are provided. For example, the decision rates per hour, house edges, average bet levels and

percentage of theoretical loss returned are generally unknowns from the player’s perspective. Therefore if the objective is to find the most equitable system upon which to base complimentaries, some aspect of player loss should be incorporated, and from a business perspective that should equate to a standard theoretical cost.
Structuring a program of this nature could be achieved by adding a rebate on theoretical loss to a percentage rebate on actual loss, providing either, depending upon which is the greater of the two, or relying solely on one or the other. Of course as in any player rating system success relies heavily on capturing good data initially. To do this it is imperative that the gaming staff performing this function realise its importance.
Finally if referring to UNLLI tables etc. is still considered too complex then the following approximation of a rebate on loss percent calculation may be of use:-
b = a. Y √ (V.N) x 100 --------------------- 0.5Y √ (V.N) + 0.17 Y² + 0.4 V.N
where a = the percentage of theoretical loss equivalent
b = the percentage of actual loss
Y = theoretical loss to the player
N = the number of hands played (turnover/maximum bet)
V = the average squared result for one game
Acknowledgements:-
- Bill Eadington, Judy Cornelius and the staff at U.N.R.
- Peter Griffin: Professor of Mathematics C.S.U.
- Jim Kilby: Professor of Gaming U.N.L.V.

[This page is intentionally left blank]

Chapter 3 Card Counting
“Card counting systems are simple,efficient and effectiveIt is possible for the player utilising a cardcounting system to achieve a netpositive expectation in the game ofBlackjack as it is played in the AdelaideCasino”

Chapter 3 Card Counting
3.1. Brief Overview …………………………………………………………… 95
3.2. Legalities (Precedents) ……………………………………………………96
3.2.1 Nevada ……………………………………………………………………. 963.2.2 New Jersey ………………………………………………………………..973.2.3 Australia …………………………………………………………………..97
3.3 Counter Measures ………………………………………………………… 973.3.1 Comment ………………………………………………………………….98
3.4 Profit Analysis ……………………………………………………………. 993.4.1 Blackjack Formula ………………………………………………………… 993.4.2 Sensitivity Analysis (% Profit) ……………………………………………. 1003.4.3 Comment ………………………………………………………………….. 1023.4.4 Conclusion ………………………………………………………………… 1023.4.5 Bibliography ………………………………………………………………. 103
3.5 Blackjack Simulation Experiment December 1990 ………………………..1043.5.1 Aim ……………………………………………………………………….. 1043.5.2 Method ……………………………………………………………………. 1043.5.3 Simulation …………………………………………………………………. 1053.5.4 Results …………………………………………………………………….. 1053.5.5 Conclusion ………………………………………………………………… 106

3.1. Brief Overview
Blackjack, unlike most other Casino games, is a game which involves varying degrees of skill depending upon an individual player’s competence. This is due in a large part to the fact that the probabilities associated with the game vary whenever a card is removed from the shoe, and that players may vary their play accordingly.
This really is a direct contrast to other Casino games which have a constant in-built house percentage. For example, on Roulette where each spin is an independent event, it is of no concern to the player that, for example, 15 blacks have been spun consecutively, the odds of black being spun again are still 18-19, ie, fractionally less than even money. Therefore, there is no such thing as a good or bad Roulette player, only lucky or unlucky players in the short term. In the long-term, if measured over a considerable period of time, the player should lose 2.70% of his turnover on Roulette. The house percentage on most Casino games is between 1 and 28%, with table games (excepting Blackjack) averaging around 4% and Keno being around 26% on average.
With the use of good basic strategy at Blackjack, however, the house percentage fluctuates, rarely to a large extent, between approximately +3 and –3 percent.
This, of course, means that if a player could determine when the house percentage was negative and only place bets under those circumstances or greater sized bets, then over a long period of time that player would win. The amount won would be determined by the extent of the player’s advantage related to the amount of turnover from that player.
This system of play has been developed and is called “card counting”. The development of card counting was pioneered in America, utilising computers and software development for the simulation and analysis of Blackjack play.
This determined that the house percentage was directly related to the relationship of high cards (10,J,Q,K,A) to low cards (2,3,4,5,6) and that when this relationship showed an increase in the number of high cards in the remaining decks then the house percentage decreased. Such a deck is said to be 10 rich and in favour of the player.
To determine whether a deck is ten rich or not various systems have been developed with varying degrees of complexity and efficiency. A simple yet effective method is the Braun Plus Minus Count. In this count system the cards 10, J, Q, K and Ace are assigned a value of –1 with the cards of low value (2,3,4,5, and 6) being assigned a value of +1. The cards 7,8 and 9 are prescribed no value.
Now to put the system to use, as each card is withdrawn from the shoe a running count is maintained by the player of the high cards to low cards. For example, 10, K, 5, J, 3 is a running count of –1. Obviously this must be related to the number of cards remaining in the shoe, as, if there are a large number of cards remaining this dissipates the effect or advantage to the player. Hence, the calculation of a “true count” is required. This is done by dividing the running count by twice the number of decks remaining in the shoe (depending on the system used). This true count provides the player the advantage of knowing approximately the house percentage or his or her own advantage at any stage.
Knowing merely when to bet is not sufficient however, as this must be related to both a betting strategy and a playing strategy.

Betting strategies are generally related to the true count with a base unit being played on a positive count. This of course varies dependent on the player, with some card counters merely waiting for a high positive true count and then placing as many wagers as they can at the table maximum. This method of play brings attention to the player and many authorities on card counting prefer more subtle betting strategies where the counter would never wager more than 3 times the base unit, or strategies which enable a card counter to play and win without being detected by Casino management. Betting strategies are important and some “counters” work in teams of two or more. One player keeps a true count on the deck whilst another player is concerned with the betting and playing strategies.
The playing strategies, or basic strategy as it is known, is determined by analysing the results of computer simulated Blackjack play over a large number of hands determining what actions provide the player with the best results. The Blackjack program must simulate play as it would occur in the Casino, operating within the confines of the game rules. Therefore, basic strategy within Australia varies from State to State as the rules also vary from State to State. However, generally the tables shown in the Appendix provide an outline of good basic play. This is, of course, by no means foolproof but again relies on percentage plays. This basic strategy may also be varied in relation to the true count with some plays being more advantageous when the true count is at a specific level.
For example, although insurance is generally regarded as a bad bet, having a high house percentage, if the true count is excessively positive, insurance may be a good bet for the player.
Similarly other situations vary in accordance with the count. When to hit, stay, double down or split are all important, and of course make the game more interesting to the player.
Therefore it can be seen that good Blackjack play is a combination of knowing when to bet, how much to bet and the correct method or strategies of play.
To offset the advantages that a good card counter maintains over the house, Casino operators and regulators have included counter measures into the Rules of the Game. The argument behind this policy being that if card counters remain unfettered then the operator would lose money and subsequently Blackjack, as a Casino game, would cease to exist. These counter measures include exclusion of card counters from the Casino, shuffles being initiated by Casino supervisors when a known card counter substantially increased a wager, cutting the deck up to two thirds of the way in from the back of the pack and preclusion or restriction to minimum wagers if the player misses the first or any subsequent round of play prior to the reshuffle of cards. Therefore, even though card counting can be by no means described as cheating, it definitely poses problems to both the operator and regulator from a technical aspect.
Another argument is that there are so few technically proficient card counters that they pose no threat to the game, and that these few provide good publicity for the game.
This argument tends to suggest an aura of complexity on the subject which is not substantiated by the simplicity of the systems themselves.

Most card counting systems are simple, efficient and effective being able to be mastered by anyone with time and patience, and this is the real problem with card counting.
3.2. Legalities (Precedents)
3.2.1 Nevada
“N.R.S. 465.15 “Cheat” means to alter the selection of criteria which determine:
a. The result of a game or,b. The amount or frequency of payment in a game”
“N.R.S. 465.083 Cheating Prohibited. It is unlawful for any person, whether he is an owner or employee of or a player in an establishment, to cheat at any gaming game”.
The Nevada Supreme Court held in 1983 in the case of Sheriff vs Martin declared that counting cards was not cheating in violation of N.R.S. 015.
The court held:
“The attributes of the game – its established physical characteristics and basic rules – determine the probability of the games various possible outcomes. Changing those attributes to affect those probabilities is a criminal act. By way of contrast a card counter – one who uses a point system to keep track of the cards that have been played – does not alter any of the basic characteristics of the game. He merely uses his mental skills to take advantage of the same information that is available to all players”.
3.2.2 New Jersey:
1. “On May 11, 1981, the Appellate Division of the New Jersey State Supreme Court ruled that card counters may not be barred by the Casinos. This was the result of a suit brought by Kenneth Uston. Immediately after this ruling, however, the Casinos obtained a stay pending appeal to the State Supreme court. Thus far no final ruling has been made on this matter….”
(Playing Blackjack in Atlantic City by C. R. Chambliss and TC Roginski C1981.)
2. “Lawsuits
My lawsuit against Resorts International went all the way to the New Jersey Supreme Court who decided in my favour …….”
(The Gambling Times Guide to Blackjack – Chapter Eleven by Ken Uston c1983)
3.2.3 Australia:
No legal undertakings in this regard have been tested to date. However, each State Government regulatory body has an individual broad policy on card counting and allowable counter measures which are written into the rules of the game.

3.3 Counter Measures
To combat the effectiveness of card counting systems, Casino operators in this country and around the world have implemented various counter measures. A brief outline of some of these is listed below:-
(NB the current counter measures employed by the Adelaide Casino are marked with an asterisk)
The listing of some of the other counter measures is not intended to imply support for their use.
*a. Use of more than one deck. Multi deck games increase the starting advantage of the Casino, as well as substantially decreasing the fluctuations in percentage advantage experienced throughout the shoe. The Adelaide Casino utilises eight decks in the play of all Blackjack games.
*b. Lesser deck penetration prior to reshuffling. As card counting systems rely on information relating to changing deck composition, lesser deck penetration reduces the degree of certainty in the short term. Conversion of a running count to a true count by the card counter is done by dividing the running count by twice the number of decks remaining (dependent on the system used). Therefore, the true count is inversely proportional to twice the number of decks remaining in this case. The true count is utilised by the card counter to make betting and playing decisions. As the divisor is increased (decks remaining) the result will obviously decrease. Also fluctuations in advantage are substantially flattened as deck penetration is reduced, as is the percentage advantage experienced reduced. The Adelaide Casino standard policy is that normally the cut card (shuffle marker) is placed one deck in from the end of the stack. If, however, a card counter is playing the cut card is placed up to four decks in from the end of the stack.
*c. Restriction on bet size to the table minimum if a player enters a Blackjack game after the initial round or first two rounds of play have been dealt, or if a subsequent round of play is missed prior to reshuffling. This requirement obliges the card counter to play all hands of a shoe and not just wait till he/she has a positive expectation. This substantially decreases the counters percentage advantage as they then must play minimum bets for most of the shoe at negative expectation (see (d) for Adelaide Casino usage).
*d. Restriction on the number of boxes playable by one player. This requirement reduces the betting potential of the card counter in positive situations to either one or two boxes at the table maximum.
The Adelaide Casino provisions relating to (c) and (d) are:-
1. A player who has not made a wager on either of the first two rounds of play in any shoe may enter the game on a subsequent round of play, but may be restricted by the Casino operator to wagering on a maximum of two boxes, to the minimum limit posted at the table on each box, until the cards are re-shuffled and a new shoe is commenced.

2. A player who after placing a wager on either of the first two rounds of play, declines to place a wager on the third or any subsequent round of play may be restricted by the Casino operator to wagering on a maximum of two boxes, to the minimum limit posted at the table on each box, until the cards are reshuffled and a new shoe is commenced.
e. Exclusion of the player from the premises. Barring techniques vary widely. In Atlantic City at one time the following statement was read to suspected card counters:-
“You are considered to be a professional card counter. You are not allowed to gamble at a Blackjack table in this Casino. If you attempt to do so, you will be considered a disorderly person and be evicted from this Casino. If you subsequently return to the Casino, you will be subject to arrest for trespassing. You may participate in games other than Blackjack offered by the Casino.”
This practice has been discontinued in Atlantic City after Mr. K. Uston’s litigation. Nevadan Casinos have also excluded card counters from the premises as have most European Casinos at one stage or another. Australian Casino operators generally do not exclude card counters from the premises due to State Government regulation.
*f. Restriction on the unit increase allowable by players at a Blackjack table. This stops the card counters from increasing his/her bet from the table minimum to the table maximum in one step. Some Casino operators prohibit a unit increase of more than three times the previous bet. This practice reduces the card counters potential advantage by decreasing the allowable amount to bet in situations where the player has a positive expectation. In Adelaide a recognised player may be restricted to a maximum bet of ten times the table minimum (per box).
g. Reshuffling of the deck when a card counter substantially increases his/her bet. This obviously returns the deck to the Casino’s starting advantage.
h. Continuous automatic shuffling machines within the dealing shoe. These machines return the deck to standard after each round of play. However, they are bulky and the technology does not appear to have been developed sufficiently at this stage.
i. Rule changes which make the game as a whole less attractive. This practice has the effect of increasing the Casino house percentage and thus changes the probability of situations with negative expectations.
j. Preclusion from play at the game of Blackjack. This policy is structured on the basis that a betting transaction at a game is in essence a contract with there being no obligation on either party in entering into such a contract. That is just because the operator offers the game of Blackjack does not mean that the operator must accept bets from any player. Whilst this is true in contract law other questions are raised such as anti discrimination laws, civil liberties and the practice of free trade. The Jupiters Casino in Queensland currently follows this practice.
*k. Second cutting card. This is employed to negate the productivity decrease which occurs if all Blackjack games operate with only one cutting card and substantially reduced deck penetration when card counters are present in the Casino.
3.3.1 Comment
Both positive and negative aspects apply to the counter measures listed and these will be addressed later in the text. As can be seen Casinos view the potential threat of persons utilising card counting systems very seriously. The erosion of bottom line profitability by these players can be substantial which then places the viability of operating Blackjack games at risk.
The development of a universally acceptable counter measure is thus of paramount importance.
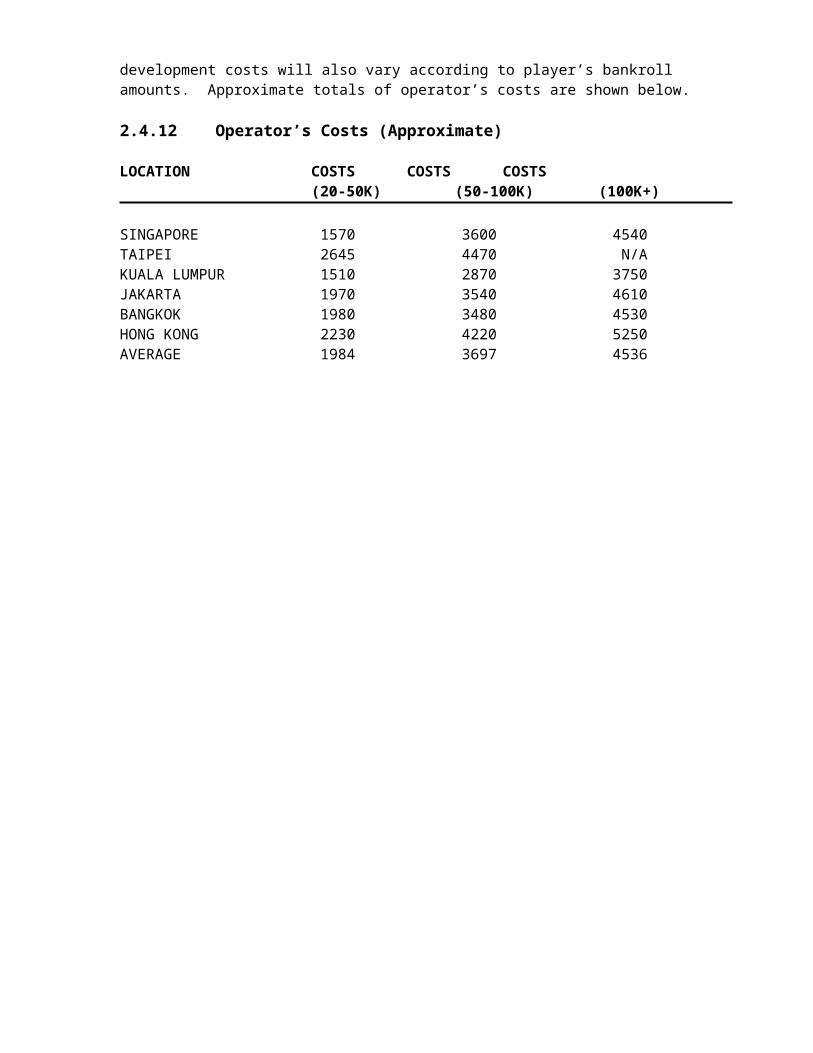
3.4 Profit Analysis
The profit potential of any Blackjack game may be determined by a simple formula, which may be referred to as the “Blackjack Formula”.
The formula is:
% profit = BA + PA + RA + SA
BA = Betting Advantage
PA = Playing Advantage
RA = Rule Advantage
SA = Starting Advantage
The starting advantage is the advantage off the top of the deck. This is also what the long run expectation would be playing basic strategy, employing no count for either betting or playing purposes. There are two factors to take into consideration in determining the starting advantage, the number of decks in play, and the rule variations of the game.
The playing advantage is the percentage of profit which may be realised by altering play from basic strategy. The variables taken into account in computing the playing advantage are, the number of decks in play, the percentage of the cards being dealt out, and the playing efficiency of the system being used.
The betting advantage is dependent on the following four variables:-
1. The number of decks in play
2. The percentage being dealt out
3. The betting spread used and
4. The betting correlation of the system being used.

The betting spread is the ratio of the lowest bet to the highest bet. The betting correlation of a system is the efficiency of that system in determining advantage for betting purposes.
Rule advantage considers the effect of different rule variations. Variables considered are, percent dealt, number of units of high bet, number of decks and sum of effects of rule variations.
The % profit is therefore dependant on a large number of variables. Shown below is a calculation of the % profit for one counting system given set circumstances:-
3.4.1 Blackjack formula
TOTAL NUMBER OF DECKS 8 DECK ADV -0.54
DECKS DEALT OUT 4 RULE ADV -0.064
COUNT SYSTEM USED WONG HALVES PLAY EFF 0.57
MAX UNIT IN SPREAD 10 BET CORR 0.99
STARTING ADVANTAGE -0.6040
PLAYING ADVANTAGE 0.0566
BETTING ADVANTAGE 1.0821
RULE ADVANTAGE -0.0113
% PROFIT 0.5233
A sensitivity analysis of the same system showing % profit with various deck penetration levels and maximum units is as follows:-
3.4.2 Sensitivity Analysis (% Profit)
WONG HALVESMAX UNITS DECKS DEALT OUT
3 4 5 6 7
2 0.45 -0.37 -0.28 -0.17 0.033 0.33 -0.24 -0.11 0.04 0.224 0.22 -0.11 0.03 0.20 0.406 0.02 0.11 0.27 0.47 0.708 0.18 0.32 0.49 0.70 0.9510 0.38 0.52 0.70 0.92 1.1812 0.58 0.73 0.91 1.13 1.3914 0.78 0.93 1.11 1.34 1.6016 0.98 1.13 1.31 1.54 1.8118 1.18 1.32 1.51 1.74 2.0120 1.38 1.52 1.71 1.94 2.21

When reviewing this table it is advisable to be conservative in approximating the value of the maximum unit, this is particularly true in multi-deck games. Due to the diminishing frequency with which progressively higher “true” counts occur, player advantage will be more accurately approximated by valuing the maximu8m unit as the most frequent high unit in relation to the average unit.
The table shown is particularly interesting from the point of view of the effect of deck penetration. Where less decks are dealt out a card counter must increase his/her unit spread to achieve the same percentage profit. In doing so the counter is at greater risk of succumbing to the effects of statistical variance and thus may incur severe losses. If the player does not have enough funds available to sustain such losses then obviously that player no longer poses a threat to the Casino. To be unable to withstand a negative fluctuation of three standard deviations would be neither investing or speculating, but gambling. Standard deviation must always be calculated according to the specific circumstances of average betting unit and number of hands. Displayed below is a calculation of percent gain per hand for an eight deck Blackjack game with Adelaide Casino Rules and a 50% penetration level. Also shown is the expected win and standard deviation given the level of betting shown.
EDGE HANDS BET/ TOTAL TOTAL HANDS BETS BETS /100 HAND BET GAIN PLAYED SQRD SQRD x
NO OFBETS
-4.65% 0.0 0 0 0.00 0-4.15% 0.0 0 0 0.00 0-3.65% 0.0 0 0 0.00 0 0 0-3.15% 0.0 0 0 0.0 0 0 0-2.65% 0.5 25 12.5 -0.33 0.5 62 312.5-2.15% 1.5 25 37. 0.81 1.5 625 937.5-1.65% 6.0 25 150 -2.48 6 625 3750-1.15% 13.0 25 325 -3.74 13 625 8125-0.65% 55.5 25 1387.5 -9.02 55.5 625 34687.5-0.15% 13.0 25 325 -0.49 13625 81250.35% 6.0 500 3000 10.50 6 250000 15000000.85% 3.0 1000 3000 25.50 1 2250000 22500001.35% 1.0 1500 1500 20.25 1 2250000 22500001.85% 0.5 2000 1000 18.50 0.5 4000000 20000002.35% 0.0 0 0 0.00 0 0 02.85% 0.0 0 0 0.00 0 0 03.35% 0.0 0 0 0.00 0 0 03.85% 0.0 0 0 0.000 0 04.35% 0.0 0 0 0.00 0 0 04.85% 0.0 0 0 0.00 0 0 05.35% 0.0 0 0 0.00 0 0 0
TOTALS 10737.5 57.894 100.C 8805937.50
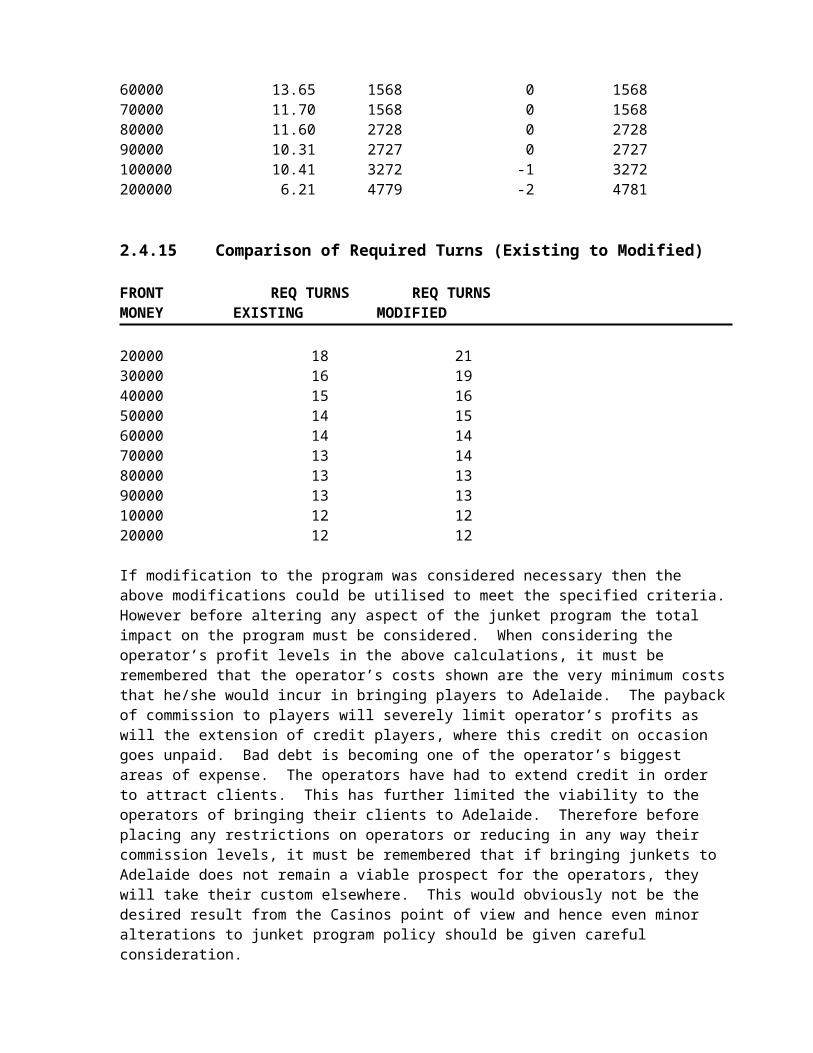
HANDS PLAYED 100
AVERAGE BET/HAND $107.38
UNIT BET EQUALS $1
GAIN/HAND $ 0.5789
% GAIN PER HAND 0.539%
STD DEV/HAND 326.423
STD DEV/960 HANDS 1 = $10,114
2 = $20,228
3 = $30,342
4 = $40,455
EXPECTED WIN 960 HANDS $556
WIN PER HOUR $69.47
HANDS NOT PLAYED 0
TOTAL HANDS 960
BASED UPON 120 hands dealt/hour (2 boxes/player)
TOTAL PLAYING TIME 8 hours
STAND DEV % OCCUR RANGE RANGE FROM TO
1 68.00% ($9,558) $10,6702 95.00% ($19,672) $20,7833 99.70% ($29,786) $30,8974 99.999% ($39,900) $41,011
Whilst the win per hour and percent gain per hand appear favourable, the potential losses that may be incurred short term are severe. Any card counter playing under these conditions and using this betting pattern must be able to sustain a $30,000 loss in one session otherwise they are in fact gambling. Most genuine authorities on card counting do not recommend playing in any eight deck game let alone one which is cut to the 50% level. However, if this is the only game available and the player has a large bankroll then it is still possible for the player in the long term to achieve a reasonable profit. Also, if the card counter can play in a reasonable percentage of games with greater levels of penetration, then a much greater potential gain is achievable (refer sensitivity analysis).
3.4.3 Comment
It is possible for a player utilising a card counting system to achieve a net positive expectation in the game of Blackjack as it is played in the Adelaide Casino. To quantify the potential gain it is necessary to establish the values of specific variables. The most important of which are deck penetration, unit spread and standard deviation. Games with high levels of deck penetration offer the card counter the greatest potential gain and at the same time reduce the bankroll requirement for these players.
3.4.4 Conclusions
Card counting systems are simple, efficient and effective. They may be mastered by anyone with time and patience and provide the competent user with substantial profits under the right conditions.

This trend is substantiated throughout the world in Casinos where card counters may play unfettered. In Tasmania for example the, Wrest Point Casino has had a growing problem with these players since approximately 1980. In that time the number of known or recognised card counters has increased to some 30 players whose winnings total not in the thousands or even hundreds of thousands but in the millions of dollars.
The counter measures available to any Casino are controlled to varying degrees by the Government regulatory body which controls that Casino. Even though these players are obviously also effecting Government revenue by reducing gross revenues, in some jurisdictions this factor is outweighed by the objective of the regulatory body in remaining an arbitrary, unbiased statutory entity. Where this is the case card counters may still play in the Casino but certain restrictions may be placed upon them.
Whilst these counter measures reduce the card counters potential profit they by no means negate the advantage, also the counter measures that must then be used can themselves reduce profitability. For example, when deck penetration is reduced the dealer must then shuffle more often, thus reducing the turnover achieved by other players. This can have a substantial effect if all tables in a Casino or even in a pit are cut to the 50% level if card counters are playing in the Casino. In an eight deck game this increases shuffling time by approximately six minutes per table per operational hour. The magnitude of this increase in non productive time is enormous when viewed in the context of the total number of tables and the operational hours in a week or a year.
Obviously the ultimate countermeasure for the Casino operator is indeed the “ultimate” strategy or system which is available to any potential player in a Casino of a negative expectation game, namely not to play it. Whilst there is no obligation on any person to play any game in a Casino (which are all negative expectation games for the unskilled player) why then must an obligation be placed upon the Casino operator to accept all bets from all players? Whilst some authorities claim that this concept infringes upon civil liberties, anti discrimination laws and the right of free trade the Queensland Casino Control Division has a refreshing point of view on the subject. This control body maintains the following philosophy:
The Government approved Casino legislation on the basis that Casinos would generate millions of dollars in revenue both directly and indirectly. The games of chance which were approved for play were approved on the assumption that they were positive expectation games from the Casino view point and that the individual house percentages were authorised by the Control Division. Therefore, where a player or players may jeopardise the revenue generated by “changing” the expectation of a game the Casino operator need not be obliged to accept wagers at the game from these particular players. In fact the Casinos themselves are not defined as public places and special right of entry by the Police had to be written into the Casino Control Act.

Thus the Queensland Casinos after identifying card counters follow the policy of allowing them to play any other game but Blackjack. At this stage no person who has been restricted in this manner has taken legal action. Crown law advice has suggested that any legal undertakings would be unsuccessful on the basis of contract law.
In Tasmania where the Gaming Commission considers itself to be more objective, the Casinos have gone through what may be described as a war with the card counters. Restrictive measures have come and gone with varying degrees of success. The Gaming Commission has authorised various rule changes and procedures which may be applied to counters. The problem is recognised by the commission in that without the counter measures the Casino operator may not be able to continue to offer the game of Blackjack to the general public.
Perhaps another solution will eventually be the development of a continuous random shuffling device.
Until such time as this occurs the search for an equitable solution which satisfies Casino operators, regulatory bodies and the law will continue.
3.4.5 Bibliography
The Blackjack Formula Arnold Snyder
Beat The 8 Deck Game Arnold Snyder
Million Dollar Blackjack Ken Uston
Playing Blackjack in Atlantic City Chambliss and Roginski
Beat the Dealer E.O. Thorp
The Theory of Blackjack P Griffin
Blackbelt in Blackjack A Snyder
How to Play Winning Blackjack J Braun
Professional Blackjack: S Wong
Playing Blackjack as a Business L Revere
A Book on Casino Blackjack C Ionescu Tulcea
Blackjack Stanley Roberts
The Casino Gamblers Guide Alan N Wilson
Break the Dealer Patterson and Olsen
Turning the Tables on Las Vegas I Anderson
Blackjack: Is there any more to be said? E O Tuck
Siromath report:
The Development and Analysis of Winning
Strategies for the Casino game of Blackjack J Braun

3.5 Blackjack Simulation Experiment December 1990
3.5.1 Aim
To quantify by computer simulation the house edge at the game of Blackjack played under Adelaide Casino rules, where all players utilise basic strategy. To compare this result with a house edge calculated using Arnold Snyder’s “Blackjack Formula”.
3.5.2 Method
John H. Imming’s Blackjack software, “Universal Blackjack Engine Version 4.0” (U.B.E.) was configured to the following settings:-
A. RULES
1. Cards dealt face down (Y/N) set to N
2. Dealer shows burn card (Y/N) set to N
3. Real World pick up (Y/N) set to Y
4. Pickup type 2 (Y/N) set to Y
5. Dealer hits on soft 17 (Y/N) set to N
6. Surrender allowed (Y/N) set to N
7. Early surrender (Y/N) set to N
8. Macao surrender (Y/N) set to N
9. Insurance allowed (Y/N) set to Y
10. Dealer blackjack takes all (Y/N) set to Y
11. No hole card game (Y/N) set to Y
12. Dealer peek on aces only (Y/N) set to N
13. No dealer peek (Y/N) set to Y
14. Split any 2 tens (Y/N) set to Y
15. D.D.N. on any number of cards (Y/N) set to N
16. Over/under (Y/N) set to N
17. Double exposure (Y/N) set to N
18. Double down after split (Y/N) set to Y
19. Only 1 split allowed (Y/N) set to N
20. Cards for split as played (Y/N) set to Y
21. Aces split exactly as others (Y/N) set to N
22. One card for split aces (Y/N) set to N

23. Re-split for Aces (Y/N) set to N
24. Blackjack pays 1 1/2 times (Y/N) set to Y
25. Blackjack pays 60% bonus (Y/N) set to N
26. Blackjack pays double (Y/N) set to N
27. Dealer takes all ties (Y/N) set to N
28. Dealer takes tie 17 (Y/N) set to N
29. Player wins on 5 cards (Y/N) set to N
30. Player wins on 6 cards (Y/N) set to N
31. Player wins on 7 cards (Y/N) set to N
32. D.D.N. on hard 10 + 11 only (Y/N) set to N
33. D.D.N. on hard 9, 10, 11 only (Y/N) set toY
34. Insure blackjacks only (Y/N) set to N
35. Abort all special cases (Y/N) set to Y
36. Abort streak betting (Y/N) set to Y
37. Penetration by round (Y/N) set to N
38. Number of players set to 7
39. Number of decks set to 8
40. Penetration to ? cards (re-deal) set to 52
41. Penetration to ? rounds
42. Delay time (100th sec) set to 1
43. Table limit max. set to 2000
44. Table limit min. set to 2
B. Betting Strategy
Betting strategy was defined as flat betting for all players at a fixed unit.
C. Playing Strategy
The basic strategy as shows in the appendix was entered.
This strategy was confirmed by three difference sources for these rules:
1. E.O. Tuck – “Blackjack – is there anything more to be said?”
2. C. Ionescu Tulcea – “A Book on Casino Blackjack”.
3. Jady Davis – “Blackjack for profit”.
3.5.3 Simulation
The simulation was then allowed to run from approximately 17.30 hours on Friday, December 7th, to 09.30 hours Monday December 10th. In that time 71,543,288 rounds of Blackjack were played.

3.5.4 Results
RESULTS OF BLACKJACK SIMULATION CONDUCTED FROM 7.12.90 – 10.12.90
UTILISING R.W.C.U.B.E. v 4.0
The following results were obtained from a computer simulation of the game of Blackjack:-
NB It had been noted prior to the experiment that player 1 was malfunctioning by negative betting at high negative indices. All other player results may be considered valid.
ROUNDS BET WIN/LOSS WIN/LOSS%
Player 1 71 543 288 150 514 484 -962 174 -0.64%Player 2 71 543 288 157 170 128 -966 129 -0.61%Player 3 71 543 288 157 169 434 -964 045 -0.61%Player 4 71 543 288 157 170 430 -936 456 -0.60%Player 5 71 543 288 157 178 882 -924 008 -0.59%Player 6 71 543 288 157 177 314 -964 353 -0.61%Player 7 71 543 288 157 179 974 -945 521 -0.60%HOUSE 71 543 288 1,093,560,646 6,662,686 0.61%LESS PLAYER 1 943,046,162 5,700,512 0.6045%
“Blackjack Formula” calculation:-
Starting advantage = DA + V
DA = Deck Advantage
v = sum of the effect of the rule variations
Deck advantage for an 8 deck game = -0.54%
v = 0.064%
therefore starting advantage = -0.54% + -0.064= -0.604%
Calculation of v:-
v = sum of – no soft double = -0.091
no hold card = -0.113
double after split = +0.14
= -0.064

In relation to Vegas Strip rules where, dealer stands on soft 17double down on any two cardsno double after splitsplit any pairre split any pair except acessplit aces receive only 1 card eachno surrenderdealer receives hole card
Deck advantage taken from Arnold Snyder’s book “The Blackjack Formula” cross checked with Peter Griffen’s – “The Theory of Blackjack”.
Chambliss and Roginski’s – “Playing Blackjack in Atlantic City”
Values used are for a 6 deck game rather than an 8 deck game, however, these should closely approximate the correct values to within 0.05%. Thus, the house edge for the game of Blackjack using Adelaide Casino rules, playing basic strategy was calculated empirically to be 0.604% +/- 0.05%.
3.5.5 Conclusion
Two entirely separate methods of calculation have provided a very similar result for the value of the house edge at the game of Blackjack where all players use basic strategy.
The simulation method (Monte Carlo method), whilst laborious and subject to statistical variance, was conducted for such a large number of trials as to negate this factor. In all nearly half a billion hands were played providing a value for the house edge of 0.604%. This is the long term expectation at the game of Blackjack given Adelaide Casino rules should all players play perfect basic strategy as per the strategy table shown in the appendix. It would be anticipated however, that less than 10% of all players at the Adelaide Casino would play perfect basic strategy. Studies conducted by Mr. Brian Feetham, former Systems Analyst, concluded that the house edge for the average C.G.A. (common gaming area) player was close to 2.0% due to the various misplays made by Blackjack players. The basic strategy edge is therefore important only from the perspective of a minimum return given a no memory strategy.
For completeness let us also compare the value derived by computer simulation with professor E.O. Tuck’s value for a basic strategy house edge. Professor Tuck of the Adelaide University Applied Mathematics Department in his 1986 NAG’s paper, “Blackjack – is there anything more to be said?”, calculates an edge of 0.785% for Adelaide Casino rules. Whilst this figure may at first appear to differ substantially from the value derived by the experiment detailed, it is in fact very similar when Professor Tuck’s assumptions are examined. Firstly, Tuck’s figure is the win/loss in relation to the amount originally bet, not the total amount bet. This factor increases the edge calculation for the simulation from 0.604% to 0.664%. Secondly, Professor Tuck utilised an infinite deck assumption as being appropriate for an 8 deck game. This is arguably correct, however, according to Griffin in his book “The Theory of Blackjack”, the deck advantage for an infinite deck is 0.65% as opposed to the 0.54% deck advantage for a 6 or 8 deck game.
Taking this into account would reduce Tuck’s edge calculation to approximately 0.675%. As can be seen when compared on an equivalent basis Tuck’s 0.675% edge and the simulated edge of 0.664% are indeed very close showing a variance of only 0.011%.

[This page is intentionally left blank]

Chapter 4 Key Concepts
“…. including …..the Extremely Silly Subject of MoneyManagement”

Chapter 4 Key Concepts
4.1 Sub Optimisation ……………………………………………………….. 111
4.2 Hold Percentage …………………………………………………………. 111
4.3 Law Of Averages …………………………………………………………. 1124.3.1 The Law of Large Numbers ……………………………………… 113
4.4 Money Management ……………………………………………………… 114
4.5 Psychology of Gamblers …………………………………………………. 115
4.6 Mathematical Expectation ……………………………………………….. 115
4.7 Standard Deviation (Repeated Trials) ……………………………………. 117
4.8 Optimal Betting (Money Management In a Positive Expectation Game) … 117
4.9 House Advantage ………………………………………………………….. 118
4.10 Throwing out Ties (Absolute Versus Relative Probability) ………………. 119
4.11 Blackjack Win Percentage ………………………………………………… 120
4.12 Blackjack Formula ………………………………………………………… 121
4.13 Various Numbers of Decks (Blackjack) ………………………………….. 123
4.14 Baiting the Hook ………………………………………………………….. 123
4.15 Baccarat and Chemin De Fer ……………………………………………… 124
4.16 Why People Gamble ………………………………………………………. 1254.16.1 Gamblers Profile ………………………………………………… 1254.16.2 Why ……………………………………………………………… 1254.16.3 Other ……………………………………………………………. 126
4.17 Customers Expectations Of Staff ………………………………………….. 126

4.1 Sub Optimisation
One of the serious organisational problems that has developed in the Casino business in the last few years has been a growing sub optimisation of the overall hotel Casino performance. There have been many reasons advanced for this situation. One of the most significant is that the importance of overall profit performance has become a widely recognised ideal within various training programs as well as traditional educational institutions over the past five to ten years. The result of this “profit focus” is that new managers, usually trained in traditional areas of hotel management such as food and beverage operations, tend to focus on the profitability of their individual departments and fail to recognise the complex interplay between the service or support functions of the hotel and the primary revenue generating function of the Casino.
The use of complex departmental profit and loss statements may have accelerated this process by improperly focusing the attention on the bottom line of the departmental unit rather than the overall hotel Casino operation. Thus the unfortunate situation arises where decisions are made to maximise the departmental profit – or perhaps contribution – while the overall quality of Casino customers is slipping, Casino revenues are decreasing or costs are being increased in the Casino area.
The problem of sub optimisation cannot be avoided simply by the use of one form of financial statement or another, but the use of some types of financial statements that create the illusion of “bottom line responsibility” may have contributed to some undesirable trends in hotel Casino management”
“Casino Accounting and Financial Management”
4.2 Hold Percentage
Mathematicians frequently confuse, and are confused by, Casino personnel in discussions of win rate (or %) for a game like Roulette. The mathematician describes the house advantage as 5.26% for a colour bet in Roulette because for every 38 units wagered the house expected to win a net of 20-18 = 2 units since there are 20 ways for it to win and only 18 ways for the player 2/38 = .0526 = 5.26% is then the expected gain per bet made and is the “mathematical percentage”.
Casino bosses have, however, evolved a different method of describing the performance of, for instance, a Roulette table. They might say that “The PC in Roulette is 20%” or “The Roulette table holds 20%”. This figure is an empirical one necessitated by the type of book-keeping Casinos use to monitor performance and appears greatly at variance with the mathematicians’ 5%. Who’s correct?
Well, a better question is “How is the 20% hold figure in Roulette arrived at?”. To illustrate the Casino point of view we’ll start with the simplest possible example: one Roulette table and only one gambler. Suppose the player buys in for $100 worth of chips and plays for exactly one hour. He may occasionally be ahead or possibly be wiped out within that hour, but lets imagine he terminates his play (either of his own desire or because the Casino closes the table) with $80 worth of chips which he takes to the cashier to be redeemed in money. The pit boss analyses the tables performance by comparing the $100 drop in the cash box with the 80 missing chips in the money tray. The difference,
100-80 = 20, is the amount that this table “held” and the quotient of ‘hold” divided by “drop” or 20/100 = 20%, is the Casino’s hold percentage.
It’s important to realise that hold percentage is an empirical, even to some extent sociological, figure. It varies from day to day, year to year, and especially it varies with the characteristics of the players. The problem is greatly complicated when there are different ways to play a game such as Craps which have difference mathematical percentages and when players, as they frequently do, carry chips from table to table or game to game.
A couple of oversimplified examples may help to illustrate this dependence. First, suppose our previously described solitary gambler has enormous endurance and is determined to play forever or until he loses his entire $100 buy in. Since Roulette is an unfavourable game this latter eventuality is the assured result. However long it takes, when our indefatigable gambler has finally lost all his money and the Casino closes the tables it will be discovered that all of the chips are still there and so too is the hundred dollar bill in the drop box. Hence the Casino won 100% of the drop. A mathematician keeping score would count the, perhaps, 1900 dollars bets the gambler made and report the Casino win rate as 100/1900 = 5.26%.
Now lets introduce another table and another gambler. Mr A buys in for $100 at a table #1, plays for a while, and then walks away a net loser of $20. Mr B buys in at table #2 for just one dollar, wins a dollar, a walks to the cashier a net winner. Now Mr A walks over to table #2 with the 80 chips He bought at table #1. He plays for an hour and only loses two chips at table #2. How will the Casino hold performance look for the two tables? As in the very first example, table #1 will show a 20/100 = 20% win rate. But what about table #2? Mr B took away two chips, the one he bought and the one he won. Mr A left two chips, the ones he lost. Hence the table has as many chips as it started with and concludes it “held” all of the drop (Mr B’s drop incidentally, and he was a winner), or 100%.
As insusceptible as win/drop is to precise mathematical prediction it does nevertheless remain a useful method of description for Casinos. The empirical percentages derive a long term validity because of the large flow of action. Perhaps one exception to this is the game of blackjack where education of the players has probably reduced the Casino hold percentage over the years, although not the profits which continue to grow because of increased volume.
“Gambling Ramblings: Extra Stuff” P Griffin
4.3 Law Of Averages
A general idea that many people hold goes something like this:
The longer a series of chance events goes on, the more likely it is that things will “even up”. For example, the longer you drive a car, the more likely you are to have your share of flat tires. The more children you have, the more likely you will have an equal division of boys and girls (assuming an even number of children). The longer you flip a coin, the more likely the number of heads and tails will equalise.
Actually, the latter two examples are identical, if certain simple assumptions are made. In the case of the coin, we shall suppose that the coin is “fair’, so that on any one flip, head and tail are equally likely. In the case of the children, we shall rule out twins or other multiple births, and shall assume that the parents do not have any tendency to produce

children of one sex as preferred to the other. Of course there is the practical consideration that one can flip a coin a lot more times than a woman can bear a child. So, it is more natural to use the coin for purposes of illustrating large samples. But for small samples, there is something unique about each child, which makes the family a marvellous illustration for stressing certain points.
4.3.1 The Law of Large Numbers
I have never actually seen a statement of a law of averages as such in any book on probability or statistics. However, I have seen references to a law of large numbers, which in rather loose language could be expressed this way: the greater the number of trials, the smaller will be percentage fluctuations away from the expected (or average) number of successes, but the larger will be the absolute fluctuations. Note carefully that this deals with fluctuations about the expected number of successes, and not with the expected number itself.
Let’s see how this applies to our example of children in the family (or to the flipping of a coin). We shall consider the various boy-girl combinations that can occur in successively larger families, starting with two children, and ranging on up through 4, 6, 8, 10, 100, 10,000 and 1,000,000. In the last three cases, we shall, of course, switch over mentally from children to coins. We shall find these examples very instructive.
At each birth, there are two possibilities for the sex of the child, B (boy) or G (girl). In a two child family, therefore, there are 2x2 = 4 possible orders in which the two children are born. There are indicated in the following Table.
DISTRIBUTION OF BOY-GIRL BIRTHS IN TWO-CHILD FAMILY
BOTH BOYS EQUAL DIVISION BOTH GIRLS
B-B B-G/G-B G-GChance 1/4 2/4 1/4
As A %25% 50% 25%
Now we move on to the four child family. There are 2x2x2x2 = 16 possible orders. (A more compact way to represent this is 2-4 which means 2 to the power 4, or the produce of four 2s.) These 16 possibilities tabulate as in the following Table.
DISTRIBUTION OF B-G IN FOUR CHILD FAMILY
4B 3B and 1G 2B and 2G 1B and 3G 4G
B-B-B-B B-B-B-G B-B-G-G B-G-G-G G-G-G-GB-B-G-B B-G-B-G G-B-G-GB-G-B-G B-G-G-B G-G-B-GG-B-B-B G-B-B-G G-G-G-B
G-B-G-BG-G-B-B
1/16 4/16 6/16 4/16 1/166 % 25% 37 25% 6

Notice that in the four child family, there is less chance of an exactly equal boy-girl split than in the two-child family. It is 37 percent versus 50 percent.
The next case is that of the six child family. There are 26 = 64 combinations. These are simple enough to write down, but they are too numerous to spend the space on here. However, we can at least make a tabulation of the relative numbers involved
THE SIX CHILD FAMILY
6B 0G 5B1G 4B2G 3B3G 2B4G 1B5G 0B6G
6/64 15/64 20/64 15/64 6/64 1/64
We see that the chance of an exactly equal boy-girl split is again less than in the previous case. Hence we have 20/64 or about 31 percent.
As we move on to larger families, the numbers tend to pyramid. The information for all cases up through ten children is now summarised compactly in the following Table.
DISTRIBUTION IN TEN-CHILD FAMILY
CHILDREN DISTRIBUTION OF COMBINATIONS TOTAL COMBINATIONS
2 1-2-1 44 1-4-6-4-1 166 1-6-15-20-15-6-1 648 1-8-28-56-70-56-28-8-1 25610 1-10-45-120-210-252-210-120-45-10-1 1024
In each case, the center entry in the pyramid, divided by the corresponding number of total combinations indicated in the right hand column, gives the chance of an exactly equal boy-girl split. In the ten child family, this chance is 252/1024, or about 25 percent. As our sample gets bigger, it is quite clear that the probability of an exactly even split gets progressively smaller.
Now lets get back to the law of averages, this notion that the more trials we have, the more likely it is that things will “even up”. We have just convinced ourselves that the larger the sample, the less likely is an exactly even split.
“The Casino Gamblers Guide” Allan N Wilson
4.4 Money Management
“The Extremely Silly Subject of Money Management”

I see it in print all the time. “What’s that?” you ask. Its those silly words “money management”. I’m sure you have read it too. If you don’t have good money management then you can’t win and should expect to go broke. Also, money management will allow you to beat all sorts of games like Roulette, Craps, slot machines, and many pseudo authorities will tell you that this is the most important aspect of gambling. The reader shall see that I don’t exactly agree with this. In fact, nothing could be further from the truth. Now I’m not the first to say this, but, “I hate money management”. I hate it because it is a bunch of junk.
The theme of money management seems to be constantly on the mind of the losers. Now here is an absolute truth. If you are a loser, and you keep gambling, you will lose it all no matter how you handle your money. Anyone who tells you otherwise is just plain wrong. If this was not absolutely correct, there would not be so many large Casinos in Nevada, New Jersey, and throughout the world.
One well known gambling book, that I read, recommends in its large money management section to only play those games where the house has no more than a small advantage. This author “smartly” rules out games like Roulette and keno. But if you only play games like Craps and baccarat, and play them long enough, you are assured of losing. So why play them at all?
One possible reason to play the low house percentage game is that these bets really don’t cost very much and you can maximise your time at the “very exciting gaming tables”. Is this really true? Well suppose you compare baccarat to keno, where do you lose your money faster. At baccarat, the house has an edge of just over 1 percent, while at keno it is approximately 30 percent. The problem is that you can get more bets down at the baccarat table, in a specified period of time, than you can sitting in a keno lounge. It seems to me that you might actually be better of playing keno, even though the house edge in this game is “astronomical”.
“Gambling Theory and Other Topics” M Malmuth
“Throughout this whole chapter we have continually rephrased, reiterated, and re-emphasised a salient point: When the odds are against you in each single play in a game, there is no system whatsoever by which this game can consistently be beaten”
“The Casino Gamblers Guide” Allan N Wilson
4.5 Psychology of Gamblers
1. Negative Recency – This refers to the belief people have that because an event has not happened for a while then it is more likely to happen now…..what people feel creates psychological pressure in them and people who may not have bet…..will do so.
2. Utility – This means the attraction of winning a lot for a little…This attraction may incline you to put money into these forms of gambling rather than those that would have a better chance of return, albeit a smaller one, in other forms of betting.

3. Skill – One of the marketing “skills” in promoting gambling games is to make the game seem more skilful than it actually is. Strickland in 1966 found that people bet less in a dice throwing and gambling situation if they had already thrown the dice, but, of course, did not know the result. They would bet more if they could bet before throwing the dice…..
This “myth of skill” is tremendously important. …the average punter believes they are more skilful than they really are, and this can influence them to bet more than is wise. If your ego really gets caught up, it can be difficult to stop betting….
4. Subjective and Objective Probability - ..As far back as 1948 Preston and Baretta noted that longer priced choices in a gambling situation were selected more often than they should be, with shorter priced choices being selected less often. A number of studies (Synder, Griffith) at the racetrack confirm this. In other words we assess the chances of a 10/1 chance as being better than they actually are. That 10/1 shot should really be 15/1 or 20/1. Conversely the 6/4 chance is psychologically disliked because of the short price, but it really should be 5/4 or shorter.
5. Superstition - …many otherwise logical people can become quite influenced by their superstitions, and they can even cloud their judgement making them bet more than logic suggests is wise. And occasionally such bets come off – meaning the superstitions are REINFORCED and likely to remain with a vengeance.
6. Risky Shift and Cautious Shift – Some studies have shown that when groups get together and make a choice in a gambling situation that the group is more cautious than the individual in their choice, and other studies have shown the groups to be less cautious. It seems likely that the size of the bet is the factor – when the group is betting much more than the individual members themselves would, they will be more cautious.
“The Guide to Good Gambling” Clive Allcock and Mark Dickerson
4.11 Blackjack Win Percentage
Let’s suggest, that in our attempt to determine some H/A value for twenty one, we start with the understanding that one hand will be dealt from a freshly shuffled deck (single) and that the player will use the exact same strategy that the house uses. In this case, the player will “mimic” the house, hitting all 16’s and standing on all 17’s, unable to split or double down.
What if the Player “mimics” the dealer?
* The Dealer will bust 28% of the time.
Mathematically, it can be determined that the dealer will bust out approximately 28% of the time. Of course, if the player “mimics” the dealer he will also bust out 28% of the time. But the most important fact regarding why the game of twenty-one wins for the house is:-
* The player will bust before the dealer 28% of 28% or about 8% of the time.

This is the reason why the Casino has an edge over the player because if the players busts out first, the dealer’s hand does not have any effect on the final outcome. Does this mean that the house has an 8% H/A over the “mimic” player? We have to add one more ingredient:-
* The player gets a bonus for blackjacks
The blackjack bonus, which occurs approximately once every 21 hands, pays three units for ever two units wagered, altering the H/A by about 2.5%. This lead us to our final result of 5.5%.
* A “mimic” player’s house advantage is 5.5%.
But how many of you have seen someone who actually mimics the dealer? Not very many. So, this leaves room for speculation that a “truer” house advantage in twenty one could be more or less than our calculations.
The next question we must ask is, “can a player improve the “mimic” strategy and lessen the house advantage?” Let’s examine four different changes the player can make and note the gains made over the “mimic” player.
What effect will the player have by changing his strategy?
Proper standing with a stiff vs stiff 3.2% gain
(playing holding a total of 12-16 vs the upcard of 2-6)
Double Down properly 1.6% gain
Hitting soft hands properly .3% gain
Splitting Proper combinations .4% gain
5.5% gain overall
By using a proper or BASIC STRATEGY, the player can gain 5.5% over the “mimic” strategy and actually reduce the houses advantage to nothing. How can this be? These calculations indicate that the correct house advantage in twenty-one is zero. If this is true, how have the Casinos been making money on twenty-one all this time? First, not many players know the correct strategies for playing twenty-one. Below is a list of approximate house advantages for the different styles of players:-
Blackjack players parameters – The worst and the best
Worst 15% H/AMimic 5.5% H/AAverage 1.4% H/ABasic strategy Even (0% H/A)

The “worst” player is arrived at by Peter Griffin in his book, The Theory of Blackjack. Griffin states that the “worlds worst player …” by violating a list of rules including always insuring, standing on all stiffs against the dealer showing a high card, hitting on all stiffs against the dealer showing a small card, never doubling down, splitting incorrectly and failing to hit any soft hand,” … seems unlikely that any but the deliberately destructive could give the house more than a 15% edge”.
The “average” player has been determined by Griffin in his presentation at the 7 th Gambling Conference held in Reno, Nevada, August 1987. His paper, Mathematical Expectation for the Public’s Play in Casino Blackjack concluded that the average player’s H/A is 1.41%.
“Card Counting For The Casino Executive” – Bill Zender
Griffin actually concluded the average players disadvantage as being 1.41% greater than the basic strategy edge.
4.12 Blackjack Formula
BA + PA + RA + SA = % PROFIT
BA = Betting AdvantagePA = Playing AdvantageRA = Rule AdvantageSA = Starting Advantage
SA = DA + v
h = number of units of high betn = number of decksc = percent dealt outx = number of extra playersBC = betting correlationPE = playing efficiencyv = sum of effects of rule variationsDA = deck advantage
STARTING ADVANTAGE BY NUMBER OF DECKSDECKS DECK
ADVANTAGE
1 +.022 - .313 - .434 - .485 - .526 - .548 - .58
EFFECT OF RULE VARIATIONS BY # OF DECKS
DECKSVARIATION 1 2 3 4 5 6

(1) NO DBL ON 11 -.820 -.775 -.760 -.753 -.748 -.745(2) NO DBL ON 10 -.510 -.480 -.470 -.465 -.462 -.460(3) NO DBL ON 9 -.130 -.103 -.094 -.090 -.087 -.085(4) NO DBL 8,7,6 .000 .000 .000 .000 .000 .000(5) NO SOFT DBL -.130 -.107 -.099 -.095 -.092 -.091(6) HITS SOFT 17 -.190 -.205 -.210 -.213 -.214 -.215(7) NO RESPLITTING NON – ACES -.014 -.027 -.031 -.033 -.034 -.035(8) NO SPLITTING ACES -.160 -.170 -.173 -.175 -.176 -.174(9) NO SPLITTING NON – ACES -.210 -.230 -.237 -.240 -.242 -.243(10) NO HOLE CARD -.100 -.108 -.110 -.111 -.112 -.113(11) DBL AFTER SPLITS +.140 +.140 +.140 +.140 +.140 +.140(12) DBL ANY # CARDS +.240 +.232 +.230 +.229 +.228 +.227(13) DBL ON 11 AFTER SPLIT +.070 +.070 +.070 +.070 +.070 +.070(14) DBL ON 14 AFTER SPLIT +.050 +.050 +.050 +.050 +.050 +.050(15) RE-SPLIT ACES +.030 +.055 +.063 +.067 +.070 +.072(16) DRAW TO SPLIT ACES +.140 +.140 +.140 +.140 +.140 +.140(17) SURRENDER +.024 +.054 +.065 +.070 +.073 +.075(18) SURRENDER (HITS SOFT 17) +.030 +.065 +.077 +.082 +.086 +.088(19) EARLY SURENDR +.630 +.630 +.630 +.630 +.630 +.630(20) EARLY SURENDR (HITS SOFT 17) +.730 +.730 +.730 +.730 +.730 +.730(21) 2 TO 1 BJ PAYOFF +2.320 +2.285 +2.273 +2.267 +2.264 +2.262
SYSTEM COMPARISONS
SYSTEM 2 3 4 5 6 7 8 9 X A
Wong’s halves +1.5 +1 +1 +1.5 +1 +1.5 0 -1.5 -1 -1 Revere Point Count +1 +2 +2 +2 +2 +1 0 0 -2 -2Dubner/Hi – Lo +1 +1 +1 +1 +1 0 0 0 -1 -1Ian Anderson +1 +1 +1 +2 +1 +1 0 -1 -1 -2Revere Advanced (’73) +2 +2 +3 +4 +2 +1 0 -2 -3 0 Uston Point Count +1 +2 +2 +3 +2 +2 +1 -1 -3 0Hi-Opt II +1 +1 +2 +2 +1 +1 0 0 -2 0Revere Advanced +/- +1 +1 +1 +1 +1 0 0 -1 -1 0Einstein/ Hi-Opt 1 0 +1 +1 +1 +1 0 0 0 -1 0Canfield Expert 0 +1 +1 +1 +1 +1 0 -1 -1 0Gordon +1 +1 +1 +1 0 0 0 0 -1 0Ten Count +1 +1 +1 +1 +1 +1 +1 +1 -2.5 +1
“The Blackjack Formula” Arnold Snyder

4.13 Various Numbers of Decks (Blackjack)
Of vastly greater importance than uncommon bonus hands are the effects which arise from using various numbers of decks. As we have already stated, a single-deck game is significantly more advantageous to the player than is a multiple-deck game which uses the same rules. But why is this so? There are several reasons. Let us compare a single-deck game with the eight deck shoe game which now prevails in Atlantic City. In a single deck game the likelihood of a player being dealt a blackjack 1/20.72. In an eight deck game it is 1/21.07. What is greatly increased in the latter case, however, is the probability that both the dealer and the player will have blackjack in the same round. In the single deck game this is 1/27.22, but in the eight deck game this is increased to 1/21.71. If you have blackjack and the dealer doesn’t, you are paid off at 1.5 times your original wager. But if the dealer also has blackjack, it is a stand off and you win no money. Since blackjack pushes are 20% more likely in the eight deck case than with single decks, it is clear that your earning potential will be reduced when multiple decks are used.
Another significant adverse factor in a multiple deck game is the fact that the player’s expectations for most doubling situations are significantly reduced from what they are in the single deck case. A good hand suitable for doubling such as 10 or 11 usually consists of two relatively low and undesirable cards. Their removal from the deck increases the likelihood of getting a good hit. Consider the case of doubling on 11 in a situation in which the dealer’s up card is other than ten or ace. In the single deck case the probability of reaching 21 is 16/49 or 0.3265. In the eight deck case this is reduced to 128/413 or 0.3099. Thus a player in the latter game is 5% less likely to reach 21 by doubling on 11 than he is if he is playing a single deck game.
“Fundaments of Blackjack” Chambliss and Roginski.
4.14 Baiting the Hook
Casinos use a variety of ingenious techniques to encourage people to gamble longer, more frequently, and for higher stakes. You will never see a clock on the wall in any gambling Casino. Management doesn’t want you leaving the table to run off to some appointment, or worrying that you have squandered too much of the day gambling, or feeling that you should pack it in because its getting near bedtime. Coupled with the lack of windows in the Casinos, the absence of clocks helps create an unreal, timeless atmosphere removed from everyday reality, one in which it is only too easy to follow the path of least resistance and keep gambling until your money runs out. This atmosphere is strengthened by the ever present cocktail waitresses serving free drinks. Alcohol has never been noted for promoting a responsible attitude toward either time or money.
It has been said that the most brilliant invention in the history of Casino gambling is the use of chips instead of money for betting. When betting those clay and plastic chips it is easy to forget they represent real money. If betting currency, it is likely that a player would consider more carefully before risking a weeks wages on one roll of the dice. The use of chips is one more element contributing to the unreal feeling that so much of the Las Vegas experience has – the atmosphere that prompts one to act without weighing the real life consequences.

Chips are also used to encourage players to up their bets. When a player is winning substantially, the dealer will start paying him off in higher denomination chips. For example, if a player bets two five dollar chips on a blackjack hand and gets a natural, the dealer may collect the bet and give him a twenty five dollar chip in return. This practice is known as coloring up. The dealer follows this practice partially to keep his stock of chips from getting too depleted in any one denomination. However, the procedure serves a more subtle purpose. Before long, the winning player who had been betting five dollar chips may find that all his money has been converted to twenty five dollar chips. As we have seen, it is generally a good strategy to increase ones bets when winning. However, make sure you are doing it because you want to and not because you have been subtly pressured into it by the house. Remember, you can always ask the dealer to change your chips back to a lower denomination.
No detail is too small for the Casinos to consider in their endless quest to win your money. Even the placement of slot machines is carefully thought out. There are always rows of slots within easy reach of the long lines that form as people wait to enter the showroom. If the waiting gets boring, the machines are there to provide a little diversion. Similarly, in many Casino coffee shops, if one wants to go to the rest room, he must leave the restaurant and wander through a long maze of slot machines to get there. If the last time you were having a snack in a Casino coffee shop, your girlfriend excuses herself to go to the ladies room and took forty five minutes to get back, now you know why.
Of the many strategies both blatant and subtle that Casinos use to encourage you to gamble, none is more complex than the granting of complimentary items to players. To get your business, a Casino may be willing to give you not only free drinks, but free food, free lodging, free transportation, free shows, free gifts, and even free money in the sense that Casino credit to players is interest free.
“Darwin Ortiz on Casino Gambling”
4.15 Baccarat and Chemin De Fer
The rules may look involved, but they stem from simple considerations. It is reasonable for the player to want to draw if he has a greater chance of raising his total than of lowering it. Consider an initial total of 7, for example. Two draw cards will improve this hand (ace and 2) four cards will leave it unchanged (10,J,Q,K) and seven cards will make it worse (3 through 9). Clearly, the player should stand on 7. A similar argument applies to 6, where the odds of improvements/no change/deprovement are in the radio 3:4:6.
For a total of 5, these odds would appear to be 4:4:5, suggesting that the player stand. However, gross odds no longer serve to tell the story. It must now be borne in mind that the banker definitely does not have a two card total of 8 or 9 (for, if he had, he would already have turned those hands over), and this fact exerts a strong compensation. So, in baccarat, the player is required to draw to 5. In Chemin de Fer, this draw is optional and leads to various interesting strategies. When the players hand is worth 4 or less, in either game, he is more likely to do better, and therefore draws in all these cases.

To sum up, the player stands on 6 or 7, and draws on 5 or less. Now, if the banker were to follow the identical rules, the game would be “symmetrical” and neither side would have an advantage. To provide an edge for the banker, certain alterations are made so that the bankers choice depends on the players draw card. As we have seen, the mere fact that the player has drawn gives a clue to the players original two card total, and hence an indication of his final total. Accordingly, it is easy to work out, for any given case, whether it is to the bankers advantage to draw or to stand.
Take for example the case where the bankers two card total is 3, and the player has drawn an 8. With a low total like 3, it might seem reasonable to expect the banker to draw. But it turns out that the banker is better off if he stands. If he draws, he has a 6.3 percent advantage, but if he stands, he has a 6.7 percent edge. Supporting calculations are shown in Table 13-2. The crux of the explanation lies in the fact that, in just standing pat on his 3, the banker will beat the player more often than not. The bankers hand requires improvement only when the players total is 8 or 9, but the banker must then draw 5 or 6 to accomplish any good. Since the chance of so doing is relatively slight, the possible gain is overcome by the chance of the banker getting a worse hand than he had to begin with, and thereby losing to a player total that he would otherwise have beaten.
On the other hand, where the banker’s total is 3, and the player has drawn anything but 8, the banker is better off if he draws. In all such cases he has a greater advantage, or at least a lesser disadvantage (money wise, this amounts to the same thing).
Rules for Baccarat
PLAYER
Value Held Action1-2-3-4-5-10 Draws a card6-7 Stands8-9 Turns cards over
BANKER
Value Held Draws when giving Does not draw when giving3 1-2-3-4-5-6-7-9-10 *84 2-3-4-5-6-7 *1-8-9-105 4-5-6-7 *1-2-3-8-9-106 *6-7 1-2-3-4-5-8-9-107 Stands8-9 Turns cards over 10-1-2 Draws a card
Picture cards and 10s count zero
Note: * = show departures from the “symmetrical” game.

In baccarat, the play in all situations is clearly spelled out by the rules. There are no options for either player or banker. In Chemin de Fer, however, certain options exist. These relatively minor variations constitute the only difference in the playing of the hands in the two games. The options will be mentioned later.
“The Casino Gamblers Guide” Allan N Wilson
4.16 Why People Gamble
4.16.1 Gamblers Profile
1. High energy
2. Susceptible to boredom
3. Superstitious
4. Fatalist
5. Impulsive
6. Egotist – group centred
7. Pleasure seekers (novelty, adventure)
4.16.2 Why 1. Ego, power, illusion of control
2. Grandiose risk taking
3. Escapism – relief from mundane, humdrum of daily life
4. Challenge – winning, action
5. Adrenaline high
6. Risky
7. “Fun”
8. Personal recognition and reward
9. Something to look forward to. Special event
10. Winning
4.16.3 Other1. Gambling as a factor from early childhood
2. Social contact (informal)
3. Positive reinforcement by remembrance of winnings and exaggerations thereof
4. Energy

5. Adult play with consequences
6. Benefits are often a complex set of intangibles
7. Return to childhood or high levels of energy
4.17 Customers Expectations Of Staff 1. To be greeted
2. Acknowledgement via eye contact
3. Friendly attitude, cheerful, polite, respectful
4. Skilled professional approach to tasks
5. Impartiality in disputes
6. Empathy
7. Acknowledgement of patrons by incoming/outgoing staff
8. Sound knowledge of what the Casino can offer
9. Prompt service
10. Consistency
11. Patient, approachable staff who will answer politely customers questions
12. Recognition for repeat visitors
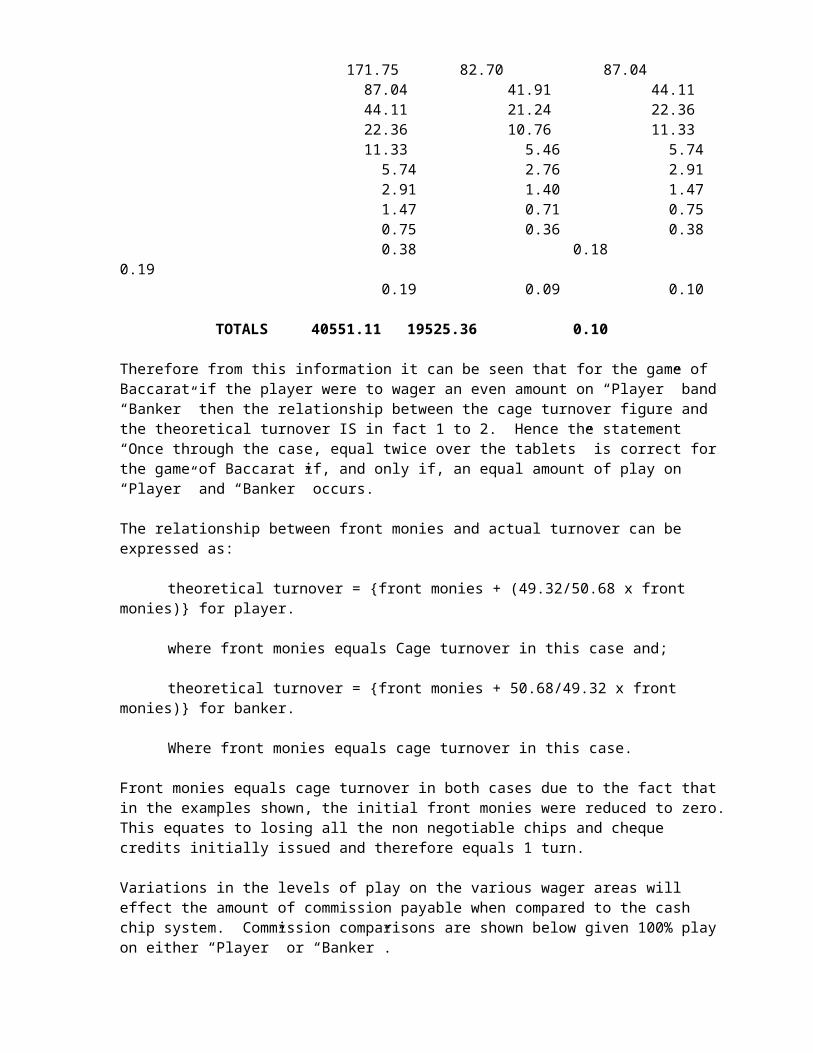
Chapter 5 Inspector’s Duties
“For every complaint received, the average company in fact has 26patrons with problems”
“Perfection is not attainable. But if we chase perfection, we can catch excellence.”

Chapter 5 Inspector’s Duties
5.1 Inspector Job Specification ……………………………………………….. 1295.1.1 Inspector in The Work Environment ………………………………………. 1295.1.2 Game Supervision ………………………………………………………… 1295.1.3 Personnel ………………………………………………………………….. 1305.1.4 Patrons …………………………………………………………………….. 1305.1.5 Inter Department Co-operation ……………………………………………. 1315.1.6 Documentation …………………………………………………………….. 1315.1.7 Reminders …………………………………………………………………. 131
5.2 Inspectors Manual …………………………………………………………. 1315.2.1 General …………………………………………………………………….. 1315.2.2 Points Of Game Protection ………………………………………………… 1325.2.3 Complaints ………………………………………………………………… 134
5.3 Blackjack Game Protection ……………………………………………….. 1365.3.1 General ……………………………………………………………………. 1365.3.2 Common Errors in Blackjack ……………………………………………... 137
5.4 Roulette Game Protection ………………………………………………… 1375.4.1 General ……………………………………………………………………. 1385.4.2 Specific Cheat Moves …………………………………………………….. 140
5.5 Building Extraordinary Casino Patron Service …………………………… 1415.5.1 The Competitive Edge ……………………………………………………. 1415.5.2 Startling Statistics …………………………………………………………. 1415.5.3 Player Contact …………………………………………………………….. 1425.5.4 Building Rapport ………………………………………………………….. 1445.5.5 Six Rules for Saying “Thank You” ……………………………………….. 1455.5.6 The Patron’s Top Ten …………………………………………………….. 1465.5.7 Casino Patrons ……………………………………………………………. 146
5.6 Casino Supervision – A Basic Guide …………………………………….. 147
5.7 I am Your Guest ………………………………………………………….. 148
5.8 Extract from the Pit Boss Training Manual ………………………………. 148

5.1 Inspector Job Specification
An Inspector’s position is one of responsibility.
A position that encompasses game security, public and employee relations, supervision of dealers, accurate reporting of financial aspects (game and player info).
As an Inspector you will have to use your past experience as a dealer to assist in the making of decisions and judgement calls that ensure the smooth operation of the game.
You are required to pass on all relevant information to your Pit Boss or Acting Pit Boss and to make sure it is accurate and concise, as that same information may be used to make on the spot decisions or relayed to upper management levels.
Professionalism, accuracy and decisiveness are the requirements to ensure the Adelaide Casino’s integrity.
5.1.1 Inspector in the Work Environment
1. Check equipment to be sure it is ours and report any need of repair/replacement.
2. Make yourself aware of limits on assigned tables, when starting shift or returning from breaks.
3. Communicate needs to Pit Boss/Acting Pit Boss.
a. Fills and credits – required/arrivingb. Evaluate the play and if required, request higher denominations.c. On change of shifts make sure floats are adequately filled but do not wait till you are
about to finish, as this is the busiest time for cage and security as well as pit.d. Do not order fills unless necessary.
4. In any emergency situation inform Pit Boss or Acting Pit Boss.
5. Always know the status of the table
a. Fills, credits.b. Win/loss (table and player).c. Be aware of the drop.d. Any large changes in win/loss or drop, inform Pit Boss or Acting Pit Boss immediately.
6. The Pit Boss or Acting Pit Boss must be notified immediately of any irregularities.
5.1.2 Game Supervision
As an Inspector your responsibilities and duties are varied and you must have a professional approach to ensure each game runs smoothly.
1. Communicate with Pit Boss or Acting Pit Boss.

2. Knowledge of and protection against possible cheat situations is essential.
a. Instruct dealers in procedures and follow up with positive reinforcement.b. Be aware of suspicious activity.c. Avoid distraction (conversation to a minimum).d. Do not leave games unprotected, if assistance is needed call Acting Pit Boss or Pit Boss
immediately.e. Be alert.f. Do not stay at one table longer than necessary.g. Find best observation position.h. Focus attention where most needed without jeopardising other games.i. You must not leave your assigned work area. Relay any message to Acting Pit Boss or
Pit Boss.
3. Make sure all relevant information is passed on to swing Inspector before leaving on your break.
4. Markers:- Pit Boss must be informed of colour on Roulette marked up to a higher denomination.
5.1.3 Personnel
An Inspector needs a good rapport with the dealers, work on a first name basis and introduce yourself to the ones you don’t know.
1. You need to be able to:-
a. Motivate – praise, reprimand, instil ambition.b. Teach – aspects of job, the “why” of instructions (lessons), speed and accuracy.c. Set examples – patron and personnel relations.d. Inform – instruct, with explanation, changes in policies and procedures.e. Listen – to what people have to say. Be approachable, be understanding.
2. You are required to be accountable for your own work as well as evaluating others. It is important to reward good work (Thank You’s, Recommendations) and encourage both the top and bottom performers. Always be prepared to help and develop those who need it.
3. All the above can help create a comfortable working environment which in turn will lead to a better quality of work by us all.
5.1.4 Patrons
They are our main asset, so we must provide them with good, efficient, friendly service.
1. Patron requests:-
a. Drinks – served to tables?b. Information – we must be aware not only of the Casino operation but also of the facility
and all it offers.

c. Comps. – Accuracy is very important. Relay information to the Pit Boss or Acting Pit Boss with recommendation.
2. Patron complaints:-
a. Gather the facts.b. Diplomacy.c. Make decisions consistent with policies and procedures and within bounds of authority.d. Once you make a decision act on it.e. Know the limits of your authority and when to ask for assistance.f. Control emotion.g. Relay facts to superiors.
3. Creating repeat and new business:-
a. Greet and acknowledge.b. Introduce yourself and the Pit Boss/Acting Pit Boss.c. Gather information ie names, new patron or not.d. Monitor and rate their play – accuracy is paramount.e. Friendliness.f. Observe their patterns of play.g. Offer assistance but not advice.
5.1.5 Inter Department Co-operation
Co-operation is essential with all departments as they are as much involved in service to the patrons as are we.
1. Don’t give orders, ask for cooperation.2. Know the people who may have access to gaming tables (waitress, bar usefuls etc).
5.1.6 Documentation
In this area accuracy is essential, if there is anything you are unsure of, ask for verification. Legibility is also very important.
5.1.7 Reminders
1. Communication: - To Pit Boss/Acting Pit Boss
a. Large buy-in or wagers.b. Personnel problems or commendation.c. Suggested limit increases/decreases.d. Any large win/losse. Any large change in win/loss.
2. Patron service – essential.
3. To dealers be open and approachable.
4. Know limits of authority.
5. Responsibility for games and personnel assigned to you.

6. Conduct yourself in a manner consistent with policies.
7. Be professional in appearance and attitude to both staff and patrons.
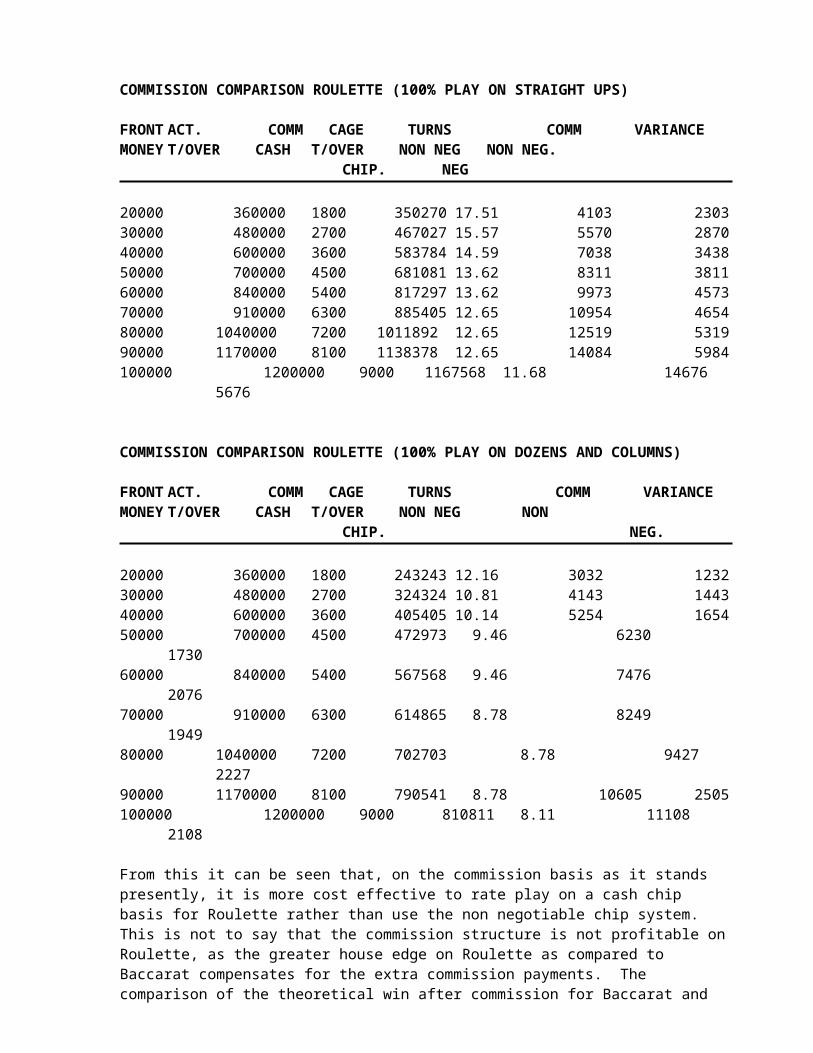
5.2 Inspectors Manual
5.2.1 General
In the Casino industry Inspectors and Dealers have a very important role to play in the promotion of the Casino in which they work. Attitudes as presented to the general public are extremely relevant to the creation of harmony and satisfaction which will benefit the Casino by increasing the numbers of satisfied patrons.
Professional appearance promotes professional behaviour. Clothes certainly don’t make the man or woman, but visual impressions are very important in presenting a professional image of your capability.
An Inspector must remain emotionally stable at all times, they must never lose their temper, they must remain calm and composed whether a table is losing or winning, and they must appear to be confident.
Tact and diplomacy must be exercised at all times even in the face of offensive or abusive behaviour. Inspectors must impress upon their dealers that a Casino’s reputation depends largely upon the attitudes of its dealing staff.
The prime concern of an Inspector is the smooth running of the game. To achieve this, their relationship with the dealers must be amicable, and they should try to instil in their dealers a sense of professional pride. Bored dealers make boring games which make for bored players.
A Casino Inspector should be aware that whenever people and money come together, the temptation to steal becomes overwhelming for many. All sorts of clever and sophisticated schemes have been devised to defraud Casinos. One of the main functions of an Inspector is to look for cheats and detect them before they do too much damage.
Remember, a Casino derives its profits from only a very small win percentage, but on a great volume. When a thief steals money through some kind of ploy, then the volume has to be even greater to make up for the loss. Many Casinos throughout the world have gone “bust” because management was not aware of the many thefts occurring.
Each Casino sets up elaborate surveillance and security systems. In spite of these, Casinos still get ripped off daily. Cheating schemes vary from the very simple to the ingenious.
The protection of any game against cheating by the players depends on the vigilance of this personnel running that game. The following suggestions will increase your knowledge in this important area:-
There are three main elements in game protection; the following of set procedures on the game; basic knowledge of cheat moves that the Dealer/Inspector can guard against; and knowledge of the more sophisticated moves that the Inspector and Pit Bosses can be aware of.

The purpose of procedural rules is to protect the Casino’s edge from those who would cheat or otherwise steal from the game. At the same time, Casino personnel should be flexible enough to allow for honest mistakes due to the lack of game knowledge.
A profitable Casino seeks always to maintain an atmosphere in which the honest players know that the games are being run fairly.
5.2.2 Points of Game Protection
The alert, informed Inspector should:-
know and memorise the bankrolls at all times. Have a good knowledge of where the money has gone and game shortage.
determine, by observations, the betting and winning system of all players. continuously observe games. pay close and particular attention to players and dealers on each game.
Dealer behaviour – all games
Watch for any departure from regular dealing procedure. Beware of nervous dealers on a small game. Watch for eye movements or smiles between dealer or player. Is the dealer watching your eyes, is he nervous of your presence, if so why?
Strategy – all games
Continually scan the layouts. Listen . While watching one table listen to transactions on other tables. Be constantly alert. Develop roving eyes. Keep moving at all times. When it is necessary to pass information on, do not look at the person
you’re talking to, keep watching the games. Watch the players playing styles. You can resolve most disputes if you are aware of your patrons’
betting patterns. Be aware of all patrons at your table and know what denomination chips they are playing. Keep note of how much a large stake player is in for. Be aware of each dealer’s composure when confronted with an argumentative or belligerent patron. Make sure that dealers understand the correct pacing of a game, that it must satisfy the players and
the house. Try to instil in the dealers a sense of professional pride. Always know and use the dealer’s name. Also, get to know the other employees in the pit.

If any part of a dispute involves a dealer’s mistake, the player has the benefit of the doubt, within the rules and regulations. If in doubt, call your Pit Boss.
Develop an awareness for agitated or nervous people – potential cheats often broadcast their guilt. Avoid the appearance of being tied up on a game. If you are involved in resolving a dispute on one
table, do not turn your back on the other tables. Stand at an angle slightly facing the other tables. The tables you are not watching are the insecure ones and are potentially dangerous.
Do not allow a disturbance at one end of the table to consume your attention. The other end may, in fact, be the location of the real trouble.
Never let a player become aware that he is being watched. If he is not a thief, he will be offended and get annoyed. If he is a thief, he will merely leave your tables.
Watch for spilled drinks. They can mark cards, contaminate chips, ruin a layout and close a game. Be aware of the appearance of a high roller on one of your games. Is a fill necessary to
accommodate his action? Notify the Pit Boss of an excess of chips as soon as they become a hindrance. Ensure that all fills and credits are checked thoroughly before being signed for. Ensure that all signatures, dates and amounts are correct on all accounting slips. Keep a notebook handy to jot down the names of your best patrons. Always have pen and paper handy. When your relief comes in, give them the run down of play, eg good players and their style of play,
trouble makers, etc. Memorise the tables banks – are there any 5’s, 25’s, 100’s, unaccounted for, particularly on an
empty game. Practice tact and diplomacy at all times. An Inspector must never lose his or her temper. Never discuss a player within his hearing range or point at a player. Dead games require as much security as live games. Beware of two friends playing together. Watch for eye movements or smiles between player and dealer. Be careful of players who can shuffle chips. Watch for players sitting next to big players. Watch the player’s eyes. Is the player watching you? If so, why? Is the player putting chips in his pocket? Watch players with high denomination chips who are only playing small amounts. Be suspicious of overly friendly players.
5.2.3 Complaints
Prevention
Remember that most disputes can be prevented by your own efficiency in monitoring the game. If you have noticed a mistake made by the dealer, intervene and correct the error immediately, especially a short payment. Prompt and efficient action taken by the Inspector instils confidence and respect from the player. If they are aware that you are thoroughly on top of your job, they are far more likely to abide by your decision should a dispute be settled against their favour.

Remember that players are far more involved in the actual game than you are, and if one mistake goes unnoticed by the Inspector, your position in maintaining security and authority over the game is weakened considerably. Those players prone to occasional cheating are far more likely to become aggressive if they have noticed that you have been unobservant.
You are there to protect the clientele as well as the house. You should seek to gain respect and promote goodwill towards your players.
Handling
Hear the complaint from the patron. Hear the dealers version. Decide whether the complaint can be handled without further disruption to the game. While keeping the communication between yourself and the patron on a calm level, allow the patron
to fully vent his feelings. Be sympathetic, try to find feelings with which you can identify and tell him that you understand. Hurt feelings breed aggression and merely extend the dispute.
While the patron is talking, assess the situation. Is he a regular patron? How much money has he dropped? How much does he still have? How many chips does he have in front of him? Has he lost a great deal? Lost all his chips? Is the player genuinely angry? Does the player believe he is right? Is he sure? Is there any hesitation? Is his anger spontaneous? Has he caused trouble before? What sort of character is he? Generally, a persons personality will reveal itself in conversation, listen politely.
Decide on what course of action to take. If it is within your power and you are confident that you know how to remedy the situation act affirmatively. If you are uncertain, refer the matter directly to your supervisor. Do not delay or protract the situation longer than is necessary.
Bear in mind that a complaint should be considered an opportunity to promote goodwill towards your clientele. It is the time to be most gracious, polite and understanding. Don’t be defensive, this breeds, an overbearing attitude which will alienate and further aggravate a patron. You don’t have to win every beef, think about the long term results.
Explain to the dealer when the patron was paid. Do this when the dealer goes on a break. Never discuss a player or situation on the game in front of players.
Points to note
1. Recognise at all times and under all circumstances that you are dealing with people and not machines – people with (real or imagined) emotions, purposes, prejudices, sympathies, feelings and ideals both on and off the job.
Communicate the message that you respect your people. Always greet your Casino associates with a smile. Use “please” and “thank you”
generously. Never underestimate the value of sincere courtesy on the job to both those above and below
you.

2. Recognise that there are two sides to every situation and that you do not know the whole story until you have heard both sides. In every situation keep your mind open until all the facts are out.
3. Recognise the importance of proper time and place for dealing with people. Pick the most favourable time and the most favourable place for giving employees good news or bad news, for giving them criticism or a pat on the back, for granting a request or denying one.
4. Do not unnecessarily contribute to employee dissatisfaction when it is caused by your own carelessness, sharp tongue, bad temper, poor planning or lack of fairness.
5. Remember that when you are on the job, you live in a glass house. People see more than you realise, and measure you more by your actions than by your words. Set an example – a very good one.
6. Be genuinely interested in your staff’s welfare.
7. Smile …… it can be your best ally.
8. A person’s name is the most important word to him or her. Learn to remember names.
9. Be willing to accept responsibility for your own mistakes. People like a person who is big enough to admit when he is wrong and if they cannot like him, they at least respect him.
Show that you trust the people who work for you. Employees are less inclined to hide their own errors if they know the boss is not perfect.
Be personal. Showing your employee that you can be human in many personal situations indicates that you can be trusted.
10. Recognise that credibility is a major key to your influence on staff. Establishing the kind of credibility that wins the trust of others is based on honesty.
Managers who are always “selling” people, even to the point of shading the truth, diminish the credibility.
Do you level with them as often as possible. Are you alert to their problems? Do you stick up for them when necessary? Do you advance their causes? Do you avoid recriminations?
11. Know the true executive qualities that build and maintain employee respect.
CONFIDENCE. People have to believe that you can do your job. They have to be confident that you know what is going on.

TRUST. Employees have to know that you will not exploit them or take advantage of their subordinate position. Manipulation is a way in which trust is often violated.
FAIRNESS. Employees want to have their achievements recognised and rewarded. They want to feel confident that you will treat them fairly.
Conclusion:
Even “tough” bosses can come across as supportive if your answers to the preceding questions are mainly “yes”.
5.3 Blackjack Game Protection
5.3.1 General
Verify change for mistakes or counterfeit money. Be especially aware of the original bet when players are splitting, doubling, insuring. A blackjack payout is always a mistake-prone bet. Any unusual or heavy play must be brought to the attention of the Pit Boss. Do not allow the players to touch the cards. Check the discard holder. Make sure that nothing is obscuring it from your view. Do not
allow patrons to play with anything next to the discard holder. The cards in the shoe and the cards in the discard rack must equal the total. Be aware of your table banks at all times. Be aware of its needs and deficiencies, the type
of patron who is playing, how he plays, will the table bank be adequate, pass all patron and bankroll information onto the incoming Inspector?
The best way to distract a card counter is to talk to him, draw him into a conversation. How does he react? Does he look startled, as though you’ve broken his concentration?
Do not allow waitresses to serve during a hand – this blocks your vision and disrupts the game.
Ensure that all cards are dealt correctly and kept in the proper order on the pick up. Ensure that all dealers announce all necessary transactions. Ensure that dealers follow correct procedure at all times. Keep a continuous eye on the shoe. Be aware of habitual late bettors. The game is vulnerable during the shuffle, so do not take the shuffle lightly. Watch cards
closely during the entire procedure. This is also a good time to see how the game stands. Know how to compare your opener, fill and credits against drop. Is the game winning or losing?
Watch the positions of the player’s hands – there should be a gap between their hands and the box.
Does a player habitually touch the cards when he is splitting even when told not to? Watch a player whose eyes follow every card.

Watch for anyone varying their bets considerably. Watch for fast hand movements when a bet is being doubled, insured or split. Watch the
original stake. Watch for anyone or anything obscuring the discard holder. Watch for players watching you. Watch the tray, is it neat or are the chips often left in a “dirty stack”?
Be looking for something at all times. Look inside and outside the pit. Avoid developing any obvious habits in working the pits. Cheats look for patterns of behaviour that are predictable.
(a) Never turn your back on a game. Know your equipment.
(b) Continually check dealers for procedure adherence.
(c) Watch the floats.
(d) Be alert to any quick motion or unusual moves. People are creatures of habit.
(e) Make sure players signify a card, ie the dealer is not playing the hand.
(f) Watch how the player draws against a dealers card.
(g) Be very cautious when players or dealers send you on errands.
Do not think of inexperience as a handicap. In some cases it is best not to know – you are completely unbiased and stand a good chance of catching a cheat even though you do not know the moves.
5.3.2 Common Errors in Blackjack
Picking up cards before paying. Failure to cut the deck after shuffle. Looking around the Casino while the game is in progress. Giving double card before additional money was put in box. Allowing patrons to cap chips on double. Not calling stand-offs. Puts change in box. Turning away from the game with cards in play. Not calling the Inspector when a situation arises. Allowing a player to hold currency in his hand until change was given. Dealing to an empty box. Burning cards without Inspector’s consent. Paying off backwards one hand against another when a player plays two hands. Not asking for insurance when having an ace. Not turning double cards perpendicular to patrons’ hands. Not calling out change and getting an approval from the Inspector.

Failure to check limit bets by cutting them down to make sure it doesn’t exceed limit. Picking up money with the same hand as cards. Over-shuffling. Not heeling mixed denomination bets. No name tags.
5.4 Roulette Game Protection
Inspectors on Roulette are required to have learned all the dealers game procedures, all the typical cheat moves and, in addition, must be very well acquainted with all the following procedures and strategy.
The attitude of the Inspector is most important as a game protection technique. You should always give the impression that you are totally in control of all your games and that you know exactly what is happening on them. This can be achieved by saying very little, but by standing at all times so that players and would-be cheats can see your face and eyes.
The following rules are intended as a guide to your behaviour at the tables, and contain some examples of specific moves by players to watch for.
5.4.1 General
Keep moving at all times and watch the layouts continuously. While watching one table, listen to the action on the other(s). Be aware of the dealers, their attitudes to the players, their control of the game(s), their
procedures for dealing and most important, are they calling everything to you that they should?
Be aware of the players, their playing styles, what value they are playing at, how much they are in for, their attitudes. Are they nervous? Are they trying not to be seen? Are they watching your progress?
In any dispute, do not allow yourself to be totally engrossed in this area. There may be trouble elsewhere.
Establish communication with the dealers. Learn their names, and ensure they know yours. If they feel they can relate to you, your task of supervising the game will be easier and more effective.
Check all fills and credits carefully, and make sure all signatures and license numbers have been correctly filled in.
Communicate with your relief Inspector everything he needs to know about the action on your table(s), and about what might take place (trouble makers, request for fills to come, players’ progress, etc).
Watch slow games (one player) and dead games. Both require your full attention as well as do heavier games for total security of the operation.

A suspected cheat move may be no more than a patron making a genuine mistake through tiredness or lack of knowledge. A big player making suspected cheat moves needs very careful handling. He may respond to humour (“bit early for the next spin, Sir”), or he may be abusing his action by openly claiming non existent bets in front of other players. Detailed explanation, based on thorough and certain knowledge of the procedures, will always be the best approach, but in this situation you may well be overruled by the Pit Boss if your decision has to be against him.
Dealers and Inspector are to agree all payouts. If two different figures are obtained, the Inspector should talk to the dealer so that an agreement is reached. A dealer should never be in the position of being told what to pay, as this is a security risk.
Are there players who make it a habit to hover over the layout when the ball is about to drop?
Look for players who stand behind seated players. They could be part of a team, or trying to seal chips from the layout or other players.
Watch for players who drop a large quantity of colour chips on the winning number. He may have placed a high value cash chip beneath them.
Watch for players betting across winning bets. Watch for people with score cards, pieces of paper or cigarette packs near the columns
and even chances. Watch for players leaving the table with colour chips. Watch for people who knock chips over on the layout as the ball drops, a clever means
of distraction to cheat on the columns. Watch for any kind of distraction or dispute on one end of the table that may be
intended to distract the dealer’s and Inspector’s attention from the other end of the table where a cheat move may be taking place.
Watch for correct handling of the chips by the dealer. Never let a dealer obscure the payout, either in its being made or passed out.
Watch dealers who consistently “accidentally” knock chips off the winning number and confidently replace them. They may be replacing more than those they swept off.
Watch carefully a dealer who frequently “accidentally” pays losing bets on the even chance.
Constantly be aware of the colour values. Have they been changed? Who now has the colour? Why didn’t the dealer announce the transaction?
Verify the correct number is being paid off. Your ears must be tuned in to the dropping of the ball. Instantly watch the layout and
winning bets. Try to memorise the winning bets before the dealer clears the layout. Always check the wheel and the number cleared. Dealers hardly ever realise until it is
pointed out to them that they have cleared the wrong number. Make sure the dealer announces all transactions. While scanning the pit, look for such things as:-
a. Chips on the floor.b. Is anyone watching you, particularly your eyes?c. How many colour chips and cash chips does the player have in front of him?
Approximately how many does he lay on every spin?

Keep up the pace of the games. Competent, personable dealers who help people place their bets, create atmosphere that will generate more action.
Check the colour values constantly. Have they changed since you last looked? If so, why? Did the dealer announce it? Is it the same player playing the colour?
Make sure that all dealers know and adhere to the correct order of payout. It is impossible to adequately monitor several games if the dealers are randomly paying the bets.
When more than one patron is playing cash chips try to become familiar with their bets. There are more disputes over cash chips than anything else.
When the ball is spinning, check for cash chips on the layout and try to identify the players. Check for cash chips under colour chips on the layout. Check that the cash chips are still on the layout when the ball drops. Some people steal
cash chips when they are placing colour. Beware of high denomination cash chips beneath a solitary colour chip, particularly if it
happens more than once. Disputes must be settled quickly as possible. Lost spins are lost percentage. More money
an be lost in the lost spins than the amount involved. Never let the payout go out unless you are absolutely certain it is correct. Make sure the dealer and chipper do not converse unless it is directly related to the game. Watch particularly those tables without a chipper. Watch especially one dealer dealing to one player. This is a very high risk situation and
should be observed accordingly. Just because there appears to be little action does not mean it is not worthy of the Inspector’s attention.
Disputes over cash chips should be handled with discretion. Assess the situation. Who are the players involved? Are you familiar with their bets? Their personalities? Resolve the dispute as quickly as possible.
Never pay a claimed bet instantly, even though you may have made the decision to do so. Always hear both sides of an argument. Without protracting the dispute, give the appearance of considering the outcome – you do not want such claims to become a common occurrence.
In the event of a wrongly-cleared number, and you are in the vicinity of the table and you have an approximate idea of the original bet, act affirmatively. Assess the average stake of each player and place the bets yourself. Most players do not remember their actual bets.
Never permit a player to abuse a dealer or conversely allow a dealer to abuse a patron. Study the layouts when the ball is spinning. Check for bets exceeding the maximums.
Check for complicated bets. Check that all colours are marked. Make sure that “no more bets” is called before the ball drops, not when it drops.

5.4.2 Specific Cheat Moves
1. Player gives large complicated bet to the dealer as the ball is slowing – he will attempt to place it but very likely will lose concentration of the areas of the table to be watched (columns, outside chances). This is where the Inspector can ensure complete table security by watching the table closely for any large bets or alterations.
2. Watch for players who apparently, by mistake, bet on the winning area. The dealer may not realise that the $25 chips under the stack of colour was also a late bet.
3. Note cash chips on the layout for several reasons.
a. So that two players do not claim one bet (they cannot both be paid – also one of them should have been given a colour).
b. So that any additional chips after a distraction are obvious (take them off – chances are a cheat will not have the nerve to claim it).
c. So that if a big player’s value chip has been removed by another player – or even moved by mistake – the situation can be handled.
4. Watch for players not following normal behaviour patterns who are standing behind other players, hiding in badly-lit area just off the table, watching the game rather than playing, watching your movements.
5. If there is some kind of distraction or dispute, see if the dealer can handle it. Keep your attention over the whole area of your responsibility – the plan may be to get you involved so that cheating can take place elsewhere. If the dealer cannot resolve the problem, be sure everything is under control before attending to the matter.
6. Paying a claimed bet without considering the case at all may appear magnanimous but will lead to further claims, and investigation of your own inspecting technique and motivation by the Pit Boss. Hear the player’s story and the dealer’s. Consult the chipper but without protracting the dispute make your decision known (you may have done it already), and inform your Pit Boss.
5.5 Building Extraordinary Casino Patron Service
5.5.1 The Competitive Edge
Large and small hotel Casinos alike have begun to realise that trying to compete solely on marketing strategies and give-away programs is not good business. Competing on the basis of Casino differentiation is becoming increasingly difficult. What builds a solid patron base is the ability to make the guest feel comfortable and eager to return. That can only be accomplished by every employee having an attitude that the patron is supremely important and being committed to make that patron feel as comfortable as possible. Every bartender, maid, cashier, Casino dealer or any other patron contact employee, must create an environment in which each decision and action is designed to make the patrons’

experience better than it would have been, had the guest been dealing with the competition. The Casino hotel must focus on the quality of the patrons experience at every level in the organisation.
SERVICE is not A competitive edge, it is becoming THE competitive edge.
“I found that when I took care of patrons extremely well, and made them a focal point, profit inevitably flowed from that”Stanley Marcus
“Perfection is not attainable. But if we chase perfection, we can catch excellence”Vince Lambardi
5.5.2 Startling Statistics
Why patrons stop doing business with a particular hotel or establishment:-1% die3% move away5% develop other friendships9% leave for competitive reasons14% are dissatisfied with the product68% quit because of an attitude of indifference toward the patron by an employee (Source Michael LeBoeuf’s How to Win Customers and Keep them for Life).
The average business never hears from 96% of its unhappy patrons. (But 90% or more of them will not visit or buy from that business again)
For every complaint received, the average company in fact has 26 patrons with problems.
Complainers are more likely than non-complainers to do business again with the company that upset them, even if the problem was not satisfactorily resolved.
Of the patrons who register a complaint, between 54% and 70% will do business with you again if you resolved their complaint. That figure jumps to a staggering 95% if the patron feels the problem was resolved quickly.
The average patron who has had a problem with a hotel tells 9 or 10 people about it. One in five, or 13% of people who have had a problem with an organisation recount the incident to more than 20 people.
Patrons who have complained to an organisation and had their complaints satisfactorily resolved tell an average of 5 people about the treatment they received. (Source: A survey conducted by Technical Assistance Research Programs, Inc., located in Washington D.C.)
A study by Cambridge Reports, a Massachusetts’s based research firm, found that 44% of the 1,500 patrons surveyed chose “ease of doing business with” as the principle reason for choosing a financial institution. “Quality of personal service” was the second most important reason at 28%. In other words, being easy to do business with, being treated well and having a choice of products outranked location, interest rates, and other “traditional wisdom” factors that we’d predict as reasons people would choose a bank. Heres the bottom line –

Those organisations gaining most in market share were those rated highest in service quality by their patrons.
Why bother keeping a grocery store patron happy?
Because over a ten year period, that patron will do $50,000 worth of business with you. Here’s how that figure is calculated. The average grocery store patron spends $100 a week at that store. Given 50 weeks a year, to allow 2 weeks vacation, that’s $5,000 per year, over a ten year period, that adds up to $50,000.(Tom Peters, Thriving on Chaos)
The influence of each patron contact person
If a patron frequents a good restaurant twice a month for a six-person business dinner she is worth $75,000 to that restaurant over the course of 10 years, and that’s just the beginning. A repeat patron is any firms principal vehicle of powerful word-of-mouth advertising. If one happy lifelong patron sells just one other patron to you, she is worth $150,000. Now say you are a waiter who waits on 5 tables a night. You are catering 5 x $150,000 or $750,000 worth of potential Business.
Sentences that drive Casino patrons away
1. “I don’t have anything to do with your problem. You’ll have to find a Casino host”2. “I can’t comp that for you. You don’t play enough money”3. “I don’t know. We’ve always done it that way”4. “There’s nothing I can do about it – that’s company policy”5. “That’s not the way we do it here”6. “I can’t help you with that. You’ll have to go back to the pit where you were playing”7. “I just came in – could you check back in about 15 to 20 minutes?”8. “I can’t find the shift boss right now. You’ll have to come back later”
5.5.3 Player Contact
It is terribly important for the Casino player to feel comfortable with the Casino atmosphere and feel welcome in approaching a table game to try his luck. Looks of indifference or aloofness do not encourage players to “belly up” to a game. Dealers and supervisors must try to remove as much of the natural intimidation that players feel from their gaming experience as possible. I have outlined some suggestions below:
Initiating Patron Contact
A. WhenLive Table1. Shift change.2. When new player arrives…..give at least acknowledgement.3. When relieving.4. When leaving table for break, for shift.

B. Dead game1. Be aware of patrons passing by table.2. Respond to eye contact.
C. During shuffle or break in action.
What to say
A. Live game1. A simple “hello”.2. “Good Morning/Afternoon/Evening.3. A simple head or nod of acknowledgement.4. Direct eye contact and a smile go a long way.
B. Dead game1. Make eye contact.2. Reach out with a greeting towards players.
C. During shuffle or break in action1. Make note of hotel/Casino events, activities.2. Make positive statements…..“Hope you are enjoying your visit”
How to say it
A. With sincerityNote: Any greeting or acknowledgement cannot be effective and may even be perceived negatively if not said or executed with sincerity.
Contact with patrons who are losing
A. What to say1. Generally agree with their concerns …see it their way without insulting any other patron.2. Stay in a positive mind set. In Craps, the entire crew must be of a positive mind set.3. Empathise with the player’s problem.4. Provide hope and encourage player.
B. What not to say1. Don’t agree with players when they are criticising fellow players.2. Don’t emit negative body language. Don’t sigh with poor or mistaken play.3. Don’t take sides when players are interacting among themselves.
Disagreements at game
1. Never take the game personally. It is not player against dealer. Don’t feel as though you are in competition.
2. Never feel as though you were made to look bad. Sometimes a patron relations decision needs to be made without regard to whether the dealer was correct or incorrect.

3. Respond honestly when asked about a player disagreement or conflict: either you saw and the player is right you saw and the player is wrong you did not see
5.5.4 Building Rapport
Specific gestures and vocal patterns that build rapport with patrons:
We tend to like people who are like us. One way to build rapport with a patron is to be like them by using the gestures, words, and vocal patterns they use. For example, if the patron talks slowly, you likewise should slow down your talking speed. If the patron doesn’t use many gestures, tone down your own gestures. In short, you are trying to be like them by mirroring their body and voice patterns. Don’t do this to the point of mimicking them, of course, but most of this behaviour will be subtle. The patron won’t be as aware of what your doing, but he’ll instinctively begin to like you and feel comfortable with you.
IF THE PATRON IS: YOUR RESPONSE IS:Friendly CheerfulNatural NaturalAngry ConcernOverburdened SympathyEmergencey Urgency
Smile training
Basic Casino patron service training has really been dealt with lightly over the years. Simple “smiles, thank-you’s and good lucks” are rare in our industry. So often, we have adopted adversarial roles of us, the Casino, versus them, the players. I honestly believe this kind of non-service attitude is really counter-productive in retaining repeat player business. Teaching your dealers, and indeed yourself, the value of “warm fuzzies” that is, smiles and thank-you’s can be the most valuable tools you can use to make each and every player feel warm and welcome, stay longer and come back sooner.
Work miracles with a smile
A real, sincere smile works almost like a “magic switch” that turns on a friendly feeling in the other person instantly. A few pointers are:
1. What a smile says
It can say so many things. Frequently a smile implies ….. I like you – I come as a friend. I assume you are going to like me. I am confident you are a good guy and that you like me. You are worth smiling at.
2. Smile from way down deep

Voice teachers tell their pupils to “breath deep” and let their voices come from “way down deep”. If your smile is going to be a friend-maker, you’ll have to smile “down deep” too – from the heart. A smile that goes no further than the lips is no good.
Learn to smile on the inside. It is your feeling that gets across to our guests subconscious …. not just your facial expression.
3. Let go and smile.
One simple reason many of us do not smile more often – or more sincerely – is the habit we have of always holding in our true feelings. We have been taught not to show the world our feelings. Practice “letting go” …..don’t be ashamed or self-conscious about letting your face say, “Am I glad to see you”.
4. How to use mirror magic
You got it …. a daily practice session in front of the mirror. When was the last time you really looked at your smile in the mirror?
5. Develop a genuine smile
Everyone can recognise a real smile when they see one. Practice the genuine thing. A phoney smile says just that….baloney.
A smile is the million dollar asset in your human relations inventory – use it
SO GOOD TO SEE YOU MAY I HELP YOU? I APPRECIATE THAT. THANK YOU. LET ME FIND OUT FOR YOU ENJOY YOUR STAY……AND GOOD LUCK
“It is not even whether or not the guests desired service can be fulfilled that is most important … what really counts is the attitude with which the guest is treated”
Peter G Demos, Jr
P.S. Take a chance he is friendly. The odds are in your favour.
5.5.5 Six Rules for Saying “Thank You”
Those two little words, “thank you” can be magic words in human relations if they are used correctly. Memorise these six rules. They have been tested and proved.
1. Thanks should be sincereSay it as if you mean it. Put some feeling and life into it. Don’t let it sound routine, but “special”.

2. Say it – don’t mumble itCome right out with it. Don’t act as if you were halfway ashamed for the other person to know you want to thank him.
3. Thank people by namePersonalise your thanks by naming the person thanked. If there are several people in a group to be thanked, don’t just say “thanks everybody”, but name them.
4. Look at the person you are thankingIf he is worth being thanked, he is worth being looked at and noticed.
5. Work at thanking peopleConsciously and deliberately begin to look for things to thank other people for. Don’t just wait until it occurs to you. Do it deliberately until it becomes a habit. Gratitude does not seem to be a natural trait of human nature.
6. Thank people when they least expect itA “thank you” is even more powerful when the other person does not expect it, or necessarily feel that he deserves it. Think back to some time when you got a nice “thank you” from someone where it never occurred to you that any “thanks” were in order and you’ll see what we mean.
5.5.6 The Patron’s Top Ten
Does the Casino Hotel Property …….?
1. Express CARE and CONCERN for patrons.
2. Provide TIMELY (quick) responses to requests.
3. Provide ASSISTANCE without a patron request.
4. Express SINCERE APPRECIATION to the patron.
5. Provide FLEXIBLE, PERSONALISED treatment for each patron.
6. Recover from lapses in service in ways that IMPRESS the patron.
7. EDUCATE the patron.
8. Have PATRON FRIENDLY policies and procedures.
9. Have USER FRIENDLY policies and facilities.
“Our business is serving the entertainment and gaming needs of the public. If we can do that better than other (Casinos), we’ll get the business. If we can’t, we won’t get the business and we don’t deserve to”.
Donald Trump

5.5.7 Casino Patrons
are the most important people who will ever be in the facility. are those special VIP’s who call on the phone. are not interruptions of work …. They are the reason for it. are individuals with names and feelings. are not people I argue with. are the reasons I have a job. are not always right, but they are always ……….
Service Quotes
It takes months to find a patron, seconds to lose one. The goal of patron service is to make people want to do business with us. Patron complaints are the school books from which we learn. Patron service means “doing” what you say you will. Patron service means getting to the cause of patron problems rather than symptoms. Companies give excellent service by rewarding employees for providing it. Patron service is training people how to serve clients in an outstanding fashion. Patron service means “anticipating” patron needs. Patron service means hiring people-sensitive employees. Always exceed the patron’s expectations. Patron service is listening …… and hearing ……what patrons say and don’t say. The best way to evaluate patron service? Ask them. Patron service is “application” of our knowledge and philosophy. Slogans without action
won’t work. A patron that “complains” is doing you a great service. Patron service is awareness of needs, problems, fears and aspirations. Patron service, above all, is an attitude that the patron is our purpose for being. Make it a “joy” for people to do business with you. Ask everyone for service improvement ideas. Patron service is a smile and a pleasant voice. Patron service must be measured. Patron service is a commitment. Patron service makes every client feel like “the most important.” The patron’s evaluation of service is more important than your own. Patron service must be consistent. Tell patrons you appreciate their business. “The patron that doesn’t complain but doesn’t come back is the one that hurts us. Patron service means an organised integrated effort. Everyone in the organisation must serve the patron … or support someone who does. Patron service means that every employee knows that “no one is more important than the
patron”.

Never let a patron problem go unresolved. “Thank” patrons for bringing problems to you. Empathise with patron’s problems. Look your patrons in the eye. Patron service means quick response. The patron is our reason for being here. Always be courteous and polite during each patron contact. Never promise more than we can deliver. Nothing is ever gained by winning an argument and losing a patron. Patron service is patience. Never be “the reason” a patron doesn’t come back.
5.6 Casino Supervision – A Basic Guide
The satisfied patron is our best business strategy. Correct patron service problems immediately. Respect complaints. Patron service is a combination of little things. You never get a second chance to make the good first impression. Nobody ever won an argument with a patron. Hold discussion groups on service. Patron service must be breathing in every employee. Look at your business through your patron’s eyes. Satisfied patrons multiply and come back. Service is not a competitive edge; it is becoming the only competitive edge! 96% of unhappy patrons never complain about rude or discourteous treatment … they
simply don’t come back! It is not even whether or not the guest’s desired service can be fulfilled that is most
important … what really counts is the attitude with which the guest is treated. It is not the Casino who pays wages… it only handles the money. It is our guests who pay
the wages.
5.7 I am Your Guest
I am your guest, satisfy my needs and wants, add personal attention and a friendly touch and I will become a walking advertisement for your Casino. Ignore my wants, show carelessness, inattention and poor manners, and I will simply cease to exist – as far as you are concerned.
I am sophisticated, much more so than I was a few years ago. My needs are more complex. I have grown accustomed to better things, I have more money to spend.
I am an egotist. I am sensitive. I am proud. My ego needs the nourishment of a friendly, personal greeting from you. It is important to me that you appreciate my business. After all, when I come to your Casino my money is feeding you.

I am a perfectionist. I want the best I can get for the money I spend. When I criticise your food, beverage or service – and I will, to anyone who will listen, when I am dissatisfied – then take heed. The source of my discontent lies in something you have failed to do. Find that source and eliminate it, or you will lose my business and that of my friends.
I am fickle. Other Casinos continually beckon to me with offers of “more” for my money. To keep my business, you must offer something better than they. I am your guest now, but you must prove to me again and again that I have made a wise choice in selecting your Casino, your Casino and your services above all others
5.8 Extract from the Pit Boss Training Manual
PersonnelA Pit Boss must set and lead by example:-
1. With a professional and positive attitude.
2. In dealing with the patron.
3. In dealing with staff.A. Must be able to motivate.B. Must encourage not discourage.C. Reward good work (“thank you”).D. Speak to people as you wish to be spoken to.E. Always be approachable.F. When instructing given the reason “why”.G. Be able to discipline (fair but firm).H. Teach the aspects of the job.I. Help employees to improve.
4. A good working relationship is paramount. Listen with understanding, offer advice, and try to develop a promotable talent.
5. If delegating, monitor the work issued.
Patrons
Above all, the main objective is to satisfy patrons, without whom we cannot survive. We must encourage repeat business and create new business, by offering good, efficient and friendly service.
1. HANDLE PATRON REQUEST
A. Comps:- In this area information on patrons must be accurate, so as to utilise its benefits correctly.
B. Drinks:- Light refreshment (alcohol VIP?) served at tables by waitress.C. Information:- Possess a knowledge of the facility and all it offers, as well as the Casino area.

2. PATRON COMPLAINTS
A. Gather the facts.B. Make decisions within the bounds of your authority and consistent with policies and procedures.C. Remember there are two sides to every story.D. Always be prepared to resolve a dispute but know the limit of your authority.E. Remain objective.F. Support your staff when necessary.
THE ARBITRATION OF PATRON COMPLAINTS OR DISCREPANCIES SHOULD BE HANDLED QUICKLY AND COURTEOUSLY.
A. GAMING TABLES
1. All equipment is present.2. Relevant procedures for dealing are adhered to.3. Games are run efficiently.4. Damaged equipment is replaced quickly such as cards.5. Games security.6. Awareness of limits in your pit.
B. PERSONNEL
1. Ensuring that staff are qualified for the position they are given.2. To ensure follow up training of staff when and where it is deemed necessary.3. Motivation of staff.4. Decisiveness where necessary.5. Promoting a climate of enthusiasm and teamwork.
C. GOVERNMENT REGULATIONS
1. Sound knowledge of Government regulations.2. Supervision of all staff to achieve this.3. Ensuring Inspectors instruct dealers on procedures where necessary and that this is followed up
with positive reinforcement.
D. INTER-DEPARTMENT CO-OPERATION
1. Always be polite when asking for assistance.2. Recognising the importance of working as a team.3. A working knowledge of what employees responsibilities are in other departments.
E. PATRON AND EMPLOYEE RELATIONS
1. Motivations of staff through example, information teaching, guidance and the ability to listen.2. Accountable for your own work.

3. Required to evaluate others.4. Patron complaints.5. Creating new business.6. Seeing to patron requests.7. Communication.
To the pit employee, the Pit Boss is a symbol of authority, able to motivate, facilitate and coordinate and importantly a source of knowledge.

Chapter 6 Setting Table Maximum Bet Limits _
Risk and volume dependence in relation to determining maximum betting limits for independent trial, negative expectation table games.

CHAPTER 6 Setting Table Maximum Bet Limits6.1 Background……………………………………………… 153
6.2 Key Principles…………………………………………… 153
6.3 Setting proper table limits……………………………… 154
6.4 Maximum Loss Point…………………………………… 158
6.5 Effect of Variable Bet Distributions…………………… 159
6.6 Non High-End Casino Operation……………………... 162
6.7 Conclusion………………………………………………. 166

BackgroundInteresting theories abound in the Casino industry on how table maximum bet limits should be set.
One expert at a recent World Gaming Congress and Expo seminar in Las Vegas wisely stated that in well-managed Casinos, limit spreads should not exceed a “four times double-up spread in small Casinos and maybe up to a seven time double-up spread in large Casinos”. So what does this mean? A $5 minimum limit table game should not then allow a bet of greater than $80 ($5, $10, $20, $40, $80.) in a small Casino and $640 in a large Casino. To show this more mathematically, if you would like to calculate for other numbers then the formula is:
Maximum = $.2n
where $ = the minimum bet limit and,
n = the number of double ups to which you wish to limit.
For n = 4 then Maximum = 16.$
and n = 7 then Maximum = 128.$
Several questions, however, arise from this hypothesis. Firstly, how does one define a small and large Casino? Secondly, does this mean that many Casinos in Las Vegas such as The Mirage, M.G.M. Grand etc. are poorly managed as they certainly do not appear to follow this sage’s formula? Thirdly, what on earth have bet spreads and double-ups got to do with anything in negative expectation games? Fourthly and finally is there a more logical, mathematically correct and sensible business principle upon which this often confusing and confused issue can be based?
6.1 Key PrinciplesLet’s first establish some key principles.
1. “Money management systems are a bunch of junk!” ref 1 There is no system in a fixed negative expectation game which changes the Casino advantage. Theoretical win equals turnover ref 2 multiplied by edge (notice that in this well known and often used formula there is no mention of decreasing theoretical win by dividing by a “system” factor.).
2. In independent trial games sequences of results have no relationship between each other. The Roulette wheel, dice, coins etc. have no memory and the results are distinct. Sequences or lists of results may be a good road map of where you’ve been but are useless in trying to determine where you’re going. The next result has the same probability as the last.
Particularly with this second key principle in mind, let’s debunk our “expert’s” theory of limiting table maximums by a double-up factor. Consider two table games sitting right next to each other in a small Casino. One, a $5 minimum table and the other, a $25 minimum table, both playing the same independent trial game. On the first we have a minimum bet to maximum bet range of $5 to $80 and on the second $25 to $400. Our intrepid gambler in this well managed “small” Casino starts her double-up system with a $5 bet on Table One. The bet loses and so the system player then bets $10. This also loses and so the bet is increased to $20, loses again. $40, loses again. $80, surely not but loses again and because the Casino is “protected” by its limit spread the player is of course doomed, as a bet of $160 is not permitted on Table One. But, the player then moves to Table Two and starts off with a bet of $160, which loses and then bets $320. The game has no memory, right, so what’s the difference if she finishes the betting sequence on Table Two? Table One was “hot” or on a “streak” you say, but so what? The map shows where you have been, not where you are going. So did the small, “well-managed”__________________________ref 1 Mason Malmuth.ref 2 the term turnover relates to total amount wagered throughout this document.

Casino, with a four time double-up philosophy suddenly become bigger, less “well-managed” or should
someone have barred the player’s action or stuck an indelible sign on her forehead, “$5 to $80 player
only”? Clearly ridiculous, but an often argued point. “The limits are too loose.” “A system player will
take advantage of the spread.” “When they get ahead they are playing with our money and are more
dangerous if you give them higher limits.” “A $5 to $5000 table limit on Baccarat is ridiculous.” The
list goes on and on, with many opting for the conventional wisdom of either sixteen times or one
hundred and twenty eight times the table minimum. Notice also, the cavern here between small and
large, sixteen and one hundred and twenty eight!
6.2 Setting proper table limits
Enough of this, how should table limits be set properly?
Firstly, establish what the capital reserves of the company are. What are the shareholders’ expectations
from the operation? Are they risk-averse and therefore averse to using capital reserves to pay losses or
fixed expenses? What are the longest and shortest periods that you must analyse? Can the shareholders
look to one month but no longer than one year, or can you fix longer term strategies with comfort?
What turnover volumes are experienced or forecast? What does the market expect in maximum betting
limits and what effect will not meeting these have on turnover? What profile of games are on offer, or
are expected to be on offer? What are the fixed and variable expenses associated with the operation?
Many other questions could be asked but essentially these are the most pertinent.
Bottom line safety is often intuitively linked to offering the lesser of two maximum bet limits.
However, this is volume dependent and market driven. For example it may, in fact, be safer to offer a
$250,000 table maximum, in comparison to a $50,000 table maximum. Why, because the market you
are attempting to attract may not respond to your offer under the $50,000 scenario, but if offered
$250,000 as a maximum would generate significantly greater turnover. Based then on the following,
you could calculate at what point this would be true:

Win percentage
Game variance
Variable expense percentages
Fixed expenses
Taxes, fees etc.
As an example consider the following game with equal-sized bets :-
Game: Baccarat
Win percentage: 1.25% ref 3
Variance: 0.97 ref 4
Variable expenses: 0.7% of turnover (indicative example only)
Fixed expenses: $500,000 per annum (example only)
Tax: 13.75% of win (example only)
Fees: 13.5% of after tax and expense profit. (example only)
The expected return of 1.25% is based on a mix where approximately 60% of the bets are placed on
Banker and 40% of the bets are on Player. It is assumed that N hands of equal bet size are played. The
__________________________
ref 3 relative edge at the game of Baccarat based on relative probabilities of 0.5068 (bank) and 0.4932
(player) and a 60:40 mix of bets
ref 4 average sum of squares for the game of Baccarat at a 60:40 mix of Bank and Player bets
standard deviation of a sample is equal to the standard deviation of the population (square root of the
population variance) divided by the square root of the sample size. Therefore the standard deviation of
the expected percentage return is
= (97%) / N
= 98.5% / N
The expected percentage return represents a random variable which is normally distributed with mean
1.25 and standard deviation 98.5 / (N). Then the quantity Z where

Z = (y – 1.25) / s.d.
has approximately the standard normal distribution ie. the probabilities for the Z values are
approximately equal to the areas under the standard normal curve. Therefore the probability that the
return (Y) is negative ie. that the player wins after N equal-bet size games is
Prob (Y 0) = Prob (Z (0 – 1.25) / s.d.)
= Prob (Z -1.25 N/98.5).
Therefore the unfavourable end of the 90% probability interval is obtained by solving for the percentage
return y where -1.645 represents the Z-score or number of standard deviations that y is to the left of the
mean
(y – 1.25) N / 98.5 = -1.645 ref 5
Thus for N hands
Y = N * 0.0125 – N * 1.645 * 0.985/ N
For example if N = 1000 then –38.7 units is the lower limit on loss in terms of a uniform bet size.
Prior to fixed expenses and fees, the following table is produced for the lower end of a 90% probability
interval (1 in 20 chance of the displayed result or worse occurring).
Table 1
Number of Win 90% lower Win net of taxHands N probability limit & commission
1000 12.5 -38.7 -40.4
5500 68.8 -51.4 -82.8
10500 131.3 -30.0 -106.4
15500 193.8 -7.9 -115.4
20500 256.3 24.3 -122.5
25500 318.8 60.1 -126.7
50500 631.3 267.2 -123.0
100500 1256.3 742.7 -62.3
150500 1881.3 1252.8 27.0

The maximum loss point occurs at:
34500 431.3 130.4 -129.1
To calculate the effect of any table maximum bet limit merely requires the multiplication of the limit by
the numbers shown. Fixed expenses and fees can then be included to determine the net profit effect of
__________________________
ref 5 normal distribution table value for a standard deviation that provides a 5% tail at either end of the
distribution
providing the limit as a “poor”, not “worst” case scenario for the shareholders to evaluate. More
extreme cases may also be demonstrated by altering the confidence interval to a 95% level (one chance
in forty of the result or worse occurring) or a 98% confidence interval (one chance in one hundred of the
result or worse occuring.) The determinant in which option to evaluate, is dependent on the
shareholders’ risk-aversion, other income sources, capital reserves, long term strategic planning issues
and the expected period of business.
Mathematics
Hands = N Win percentage = E%
Variance = V Tax = T%
Commission = C% Fixed expenses = F
Fees = M% Bet size = B
90% confidence limit = 1.645 ref 5 (95% = 1.96, 98% = 2.33)
Win = N.E%
Lower confidence limit = (N.E%)-(1.645. (N.V))
Win net of tax and commission = (((N.E%)-(1.645. (N.V))).(1-T%)-(N.C%))
Net Profit = ((((N.E%)-(1.645. (N.V))).(1-T%)-(N.C%))-F).(1-M%).
From the calculation of the maximum loss point (net of tax and commission) it is possible to calculate,
based on the maximum loss net of all costs which the company is prepared to accept, the maximum bet
which could be offered.

From Table 1 (for the specific example provided) we have a maximum loss point of –129.1. If we
consider the maximum the company is prepared to lose as a positive number then:
(129.1B + F).(1-M%) = Maximum Loss
therefore B = ((Max.loss/(1-M%))-F)/129.1
A more general formula for determining maximum bet size is:
B = ((Max.loss/(1-M%))-F)/(Maximum loss point prior to fixed expenses and fees)
Fixed costs would be determined based on annual costs and an evaluation of the period required to
achieve the number of hands at the maximum loss point.
If, as an example, the maximum loss the company were prepared to accept was $10 million and fixed
costs equalled $500,000, then the maximum bet calculated would be $85,695.
It is important to remember that “Maximum loss” actually represents a probability of one in twenty of
this loss or greater occurring. More conservative numbers may be calculated by increasing the
confidence limit.
Of course not all bets occur at the maximum limit and therefore some degree of judgement needs to be
made as to the average bet size or preferably the forecast distribution of bet sizes. Thus $100,000 table
maximum may equate to average bets of $75,000 or a range of bets from $1 to $100,000 with the same
average but a different variance. But these are only estimates and the increased accuracy produced by
estimating bet distributions is easily lost. In most cases, it is more appropriate to keep it simple,
however, for those interested this will be expanded later.
In the above, what has been shown is a thinly-disguised evaluation of how to calculate what table
maximums should be provided for high level junket players. With limited cash reserves and low

turnover volumes, a strategy of offering $250,000 table maximums would be suicidal, or the Casino
would be gambling, if one also includes the other expense considerations. Even if the Casino could
generate 10,500 hands per annum, all at this level, then while turnover would be $2.625 billion, there
would exist a one in twenty chance that prior to fixed expenses and fees, the Casino would lose $26.6
million. Further, the maximum loss point would occur at 34,500 hands or $8.625 billion in turnover,
with a one in twenty chance of losing $32.275 million or more. If a single visit produced 1,000 hands,
then turnover would be $250 million and a one in twenty chance of losing $10.1 million or more would
exist. Clearly, extremes at this level of business exist, which suggest the need for large capital reserves,
and major shareholders who understand the complexity of the issues, and their long term vision of
growth. The other issue, implicit in this calculation is market demand, as while a $250,000 table
maximum does impart high risk, a lesser maximum limit may produce less short-term risk but higher
long-term risk after all costs are included, as well as depriving the company of market penetration and
growth. If, in the above example, hands played were increased to 20,500, yet with a $50,000 table
maximum, only 5,500 hands could be anticipated, then the following ten year scenario is of interest
(after fixed expenses and fees.)
Table 2
90% Probability interval lower limits.
Year $250K max. $50K max.
1 -$26.9M -$4.0M
2 -$28.5M -$5.4M
3 -$25.9M -$6.4M
4 -$21.2M -$7.1M
5 -$15.1M -$7.7M
6 -$8.0M -$8.2M
7 -$0.1M -$8.6M
8 $8.3M -$8.9M
9 $17.2M -$9.2M
10 $26.5M -$9.5M

These cumulative totals demonstrate the volume dependence and demand matching elements of
establishing appropriate limits for a business segment. Incorporating cash reserves and income streams
(positive net cash flows) provides for a determination of whether or not the table maximums have been
appropriately set. If, in the above scenarios, both companies had large cash reserves and net profit
income streams from core business in excess of say $40 million per annum, then offering a $250,00
table limit is clearly the preferred option. On the other hand, if cash reserves are minimal and income
streams from core business is only $4 million to $5 million per annum, then either the $50,000 table
limit or not even entering the market would be preferred. Theoretical profit after all costs is only $0.47
million per annum as opposed to the substantial risk of totally eroding profit. Other factors such as
whether or not the company is publicly listed and the effect of profit fluctuations on market valuation
need also to be considered.
Once determined, however, the maximum limits should drive all other game limits within the Casino,
provided the maximum bet limits were based on these premises and the maximum loss points used, not
the annualised projected figures. A high-limit scenario for the junket segment in conjunction with a
low-limit grind philosophy for the core business is nonsensical. While management may segment
business into grind, premium and junket for internal reporting, it would only sub-optimise the
performance of the entire operation if, on the main gaming tables for example, limits were restricted to
$5 to $200 bet spreads, while in the premium room bets of $250,000 per hand could be made. Of course
this is still market driven, and if the $5 to $200 limit entirely meets market demands and no greater
action could be derived by increasing the maximum limit then so be it, but if the opportunity existed to
increase turnover, then the fact that a $250,000 table limit is provided elsewhere in the Casino should
drive the other maximum bet limits.
While these principles have been established here to act as a guide for setting Baccarat table limits for
junkets, the same methodology can be used for any size or style of Casino operation. Again, it is
necessary to understand the company’s internal position and cash flows, the market demands, fixed and

variable expenses, taxes, fees and game profiles. Armed with this information, it is possible to calculate
the maximum bet levels which the company can reasonably be expected to accept, without sending the
operation bankrupt. This may be more difficult than our “expert’s” strategy of setting limits in relation
to double-up spreads, however, why use something simple if it is basically wrong, illogical and only
enforces incorrect assertions? The only instance where bet spreads should be considered as relating
both the lower and upper values, would be dependent trial games where a player may gain an advantage
(ie. card counting at Blackjack.). In this case, depending on the rules and regulations in place, limiting
bet spreads can negate the overall advantage of the player.
In fixed negative expectation games, however, consideration need only be given to the elements
described previously.
Calculations such as the above should be a pre-requisite from any well-managed Casino’s point of view,
and should obviously be coupled with market research to determine whether the demand exists to reach
the number of hands forecast at the maximum loss point within a reasonable time period.
Expansion of several of the issues raised above is provided for the more interested reader. These issues
relate to the calculation of the maximum loss point, the effect of bet distributions, and how this theory
may actually be applied in a Casino that doesn’t market to high bet limit players.
6.3 Maximum Loss Point
Firstly, the maximum loss point, of the left tail of a probability interval for win net of tax (and
commission if applicable), can be determined by establishing the relevant number of hands that will
minimise the loss. The loss is minimised at the turning point in the curve which can be established by
differentiating the function of the curve. The only variable in the equation for determining win net of
tax is the number of hands. Therefore, by differentiating with respect to the number of hands, it is
possible to calculate that number of hands which will minimise the loss.
Let:

Number of Hands = N
Tax = T%
Commission = C%
Win percentage = E%
Variance of a single game = V
Probability limit = Z (1.645 for 90% limit, 1.96 for 95% limit etc.)
Profit net of tax and commission = P
Then:
P = (E%.N-Z. (N.V)).(1-T%)-N.C%
P = N.(E%.(1-T%)-C%)-Z.(1-T%). (N.V)
dP/dN = E%.(1-T%)-C%-1/2.Z.(1-T%). (V/N)
The turning point occurs where the differential equals zero.
0 = E%.(1-T%)-C%-1/2.Z.(1-T%).(V/N)
Z/2.(1-T%)(V/N) = E%.(1-T%)-C%
(N) = {Z.(1-T%)/(2.(E%.(1-T%)-C%))}.(V)
N = ((Z.(1-T%))/(2.(E%.(1-T%)-C%)))2.V
The following is provided by way of example:-
Game: Baccarat
Win percentage: 1.25% (see ref3)
Variance: 0.97 (see ref4)
Commission: 0.7% of turnover (indicative example only)
Tax: 13.75% of win (example only)
Probability interval: 90% therefore Z = 1.645
Then:
N = ((Z.(1-T%))/(2.(E%.(1-T%)-C%)))2V.
N = ((1.645.(1-13.75%))/(2.(1.25%.(1-13.75%)-0.7%)))2.0.97.
N = 34,136.
and,

P = N.(E%.(1-T%)-C%)-Z.(1-T%).(N.V)
P = 34,136.(1.25%.(1-13.75%)-0.7%)-1.645(1-13.75%).((34,136).(0.97))
P = -129.1
This compares to the result shown in Table 1 on Page 5 of:
The maximum loss point occurs at:
Number of Win 90% confidence Win net of taxhands N lower limit & commission
34500 431.3 130.4 -129.1
Calculation in the above manner represents a more efficient method than tabling a series of results and
establishing the maximum loss point from that listing. As the number of hands required is generally
relatively low this is a technique which is more readily applicable in high limit junket operations.
Otherwise the establishment of the forecast number of hands (decisions) in the minimum period under
consideration should over-ride this where that result is greater than the number of hands at the
maximum loss point.
Secondly, let us consider how to take into consideration the effect of various bet distributions on what
table maximum bet limit can be set with comfort. Clearly, the simple method would be to assume that
all bets occurred at the maximum bet limit and thus adopt whatever maximum limit had been calculated
based on the maximum loss which the shareholders would accept. This, however, would be a highly
conservative approach as it would be extraordinarily rare for all bets to occur at the maximum limit.
Indeed, such an approach, while simple, could lead to the adoption of a table maximum bet limit that
sub-optimised the overall Casino’s performance by inhibiting turnover. To address this the following is
provided:

6.5 Effect of Variable Bet Distributions
Consider how a variation in bet distribution will affect the variance of the expected return to player.
Assume that the average bet size is $100,000 with the following distribution.
Bet size = x Frequency = f x.f (x)2.f
150,000 15% 22,500 3,375,000,000
125,000 20% 25,000 3,125,000,000
100,000 35% 35,000 3,500,000,000
75,000 15% 11,250 843,750,000
50,000 10% 5,000 250,000,000
25,000 5% 1,250 31,250,000
SUM 100% 100,000 11,125,000,000
When the bet size is represented as a relative frequency as illustrated above the standard deviation is as
follows :
Standard deviation = (sum (x2.f) – (sum (x.f))2)
= (11,125,000,000 – 100,0002)
= (11,125,000,000 – 10,000,000,000)
= 33,541
One can assume that the variance of the expected return when all bets are fixed at some value B is
approximately equal to V.N, where V is a constant close to 1 and relates to the variance of the game in
question (ref 4) and N is the number of hands dealt. Then the standard deviation of the expected return
when there is a bet distribution with a mean bet size of B is approximately equal to:
B.(V.N.(1 + (SB/B)2))
Where SB is the standard deviation of the variable bet distribution.

Consider the win W net of tax and variable expenses assuming N hands of equal bet size B
W = [ (NE – 1.645(NV)) (1-T) –NC] B
where N =Number of Hands
E = Expected Win Percentage
V = Variance of Baccarat Hand with Constant Bet Size
T = Tax Rate
C = Commission Rate
Then the win for a variable bet distribution with a mean bet size Bav and a variance of VN (1 + (SB/Bav)2
is
W = [ (NE –1.645NV(1 + (SB/Bav)2 ))(1-T) – NC] Bav
If Bmax is the maximum fixed bet size which will produce an acceptable risk profile then by equating the
win net of tax and variable expenses of N hands at bet size Bmax to N variable bets with a mean Bav it is
possible to determine a limiting factor on the variance of the variable distribution such that the
maximum allowable risk is not exceeded.
Let F be the factor which accounts for the increased variance of the variable bet distribution. Then
solving for F in the following equation
[(NE –1.645(NVF))(1-T – NC] Bav = [(NE –1.645(NV) )(1-T) – NC] Bmax
-1.645(NVF) = [NE –1.645(NV) – NC/(1-T)] Bmax/Bav – NE
+ NC/(1-T)
F = {1/1.645(NV))(NE – NC/(1-T))(1 - Bmax/ Bav)
+ Bmax/ Bav }2
Therefore, provided 1 + (SB/ Bmax)2 = F is less than the right hand side of the above equation, the overall
bet distribution will satisfy the risk constraints.

Thus in relation to the maximum bet size that may be offered, based on the shareholders acceptance of a
loss point, the bet limit represents a bet distribution with mean, x.f (Bav), and variance, SB, where the
mean bet multiplied by one plus the square of the standard deviation of the bet distribution divided by
the mean bet is equal to what may be referred to as the effective bet limit.
Effective Bet Limit = Bav (1 + (SB/ Bmax)2).
The effective bet limit used then to calculate a maximum loss point would be greater than the mean but
less than the maximum bet on offer, if bet sizes had some range. This is an appropriate methodology if
bet sizes and frequencies can be predicted with some degree of accuracy, however, it is vulnerable to a
situation where the bet distribution actually achieved is skewed towards much higher bet levels than
anticipated. Then the shareholders may experience greater fluctuations in profits than desired or losses
which they were not prepared for. The other potential use for this is to determine whether or not based
on known bet distributions the actual results fall with an acceptable range.
As an example of how this information may be used, let us consider the following:
Maximum bet = $85,695 (refer to page 156 example) to incur a maximum potential loss of $10 million
after all costs.
An average bet of $80,000 with the following range and distribution could be applied and still produce a
lesser maximum loss point than the shareholders accepted.
The limiting value F when the average bet size Bav is $80,000 and the maximum bet size Bmax is $85,695
is as follows
F= (1/(1.645(NV))(NE – NC/(1-T))(1 - Bmax/ Bav) + Bmax/ Bav }2
= {1/(1.645(34,500.0.97))(34,500.0.0125-34,500.0.007/(.08625)).
(1-85,695/80,000)=85,695/80,000}2

= 1.07207
Bet size = x Frequency = f x.f (x)2.f
120,000 2.5% 3,000 360,000,000
100,000 35.0% 35,000 3,500,000,000
80,000 32.5% 26,000 2,080,000,000
60,000 22.5% 13,500 810,000,000
40,000 5.0% 2,000 80,000,000
20,000 2.5% 500 10,000,000
SUM 100% 80,000 6,840,000,000
Standard deviation = (sum (x2.f) – (sum (x.f))2)
= (6,840,000,000 –80,0002)
= 20,976.
Effective Bet Limit = Bav . (1 + (SB/ Bav)2).
= 80,000. (1 + (20,976/80,000)2)
= 80,000. (1.06875)
= 85,500.
Note that the actual value of 1 + (SB/ Bav)2 equals 1.06875 for the above distribution which is less than
the allowable maximum calculated at 1.07207.
Therefore the game will behave as if there were 0.933N hands of size $85,000 rather than N hands with
equal bet size $80,000. Based on 0.933N hands of fixed bet size $85,500 there is a one in twenty
chance that the company will lose $9.98M which falls within the acceptable risk profile.
The effective bet limit at $85,500 is less than $85,695 and therefore implies that it should be appropriate
to allow a table maximum bet limit of $120,000 on the assumption that the distribution of bets actually
experienced will reflect the above. Clearly, a reasonably accurate assessment of how the market will

respond to this range of limits is required, however, if this sort of distribution is achieved then there is
only a one in twenty chance that the company will lose $10 million or more based on the assumptions
regarding fixed and variable expenses also being accurate.
It is important to recognise that this must be market driven or historical and cannot be derived a priori.
Of interest is that if a priori determination were attempted, a higher table maximum bet limit could be
provided, but at the cost inevitably of deriving a lower average bet and thus reduced profitability, if the
shareholders’ maximum loss point is not otherwise increased. This would be a direct result of possibly
falsely attempting to increase the bet range and therefore, implicitly, increasing the variance of the bet
distribution.
To finally evaluate how all the above may be applied practically in a Casino operation that does not
market to high-end players, the following is provided.
6.6 Non High-End Casino Operation
To calculate the bet level that may reasonably be offered requires the following in this case :
1. Ignore fixed expenses and project all costs at a variable percentage based on fixed and variable
levels, and represent this in place of a commission percentage. This removes the interdependence that
would otherwise link the level of fixed expenses to the period under consideration.
2. Calculate the number of decisions achieved per day based on the average table hours, and decision
rates per hour per table.
3. Determine the length of the period which is to be evaluated. 1 day, 1 week, 1 month, or 1 year.
4. Estimate the maximum loss that the shareholders will accept for the period under consideration.
5. Calculate the maximum bet on the above basis taking into account bet distributions and market
matching.
As an example of this the following is provided:
Average table operating hours = 25 tables x 18 hours

= 450
Average decisions per hour per table = 50
Total decisions per day = 22,500
Total decisions per week = 157,500
Win net of tax and variables expenses and fees are
W = (((N.E%)-(1.64.(N.V.SB))).(1-T%)-(N.C%)).(1-M%)
For simplicity if the game considered is totally Baccarat with no opposing bets and,
if T =13.75%
N = 157,500
V = 0.97
E% = 1.25%
C% = 0.7%
M% = 13.5%
Consider the scenario where the shareholders were prepared to experience a loss of $350,000 or greater
in any one week with a probability of occurrence of one in twenty. Based on market research and past
experience an assessment can be made regarding probable bet distributions in this operation. The
following three betting scenarios highlight the effect that high limit betting has on the weekly risk
profile.
Bet Distribution 1
Bet size = x Frequency = f x.f x2.f
7000 1.5% 105.00 735,000
2500 2.5% 62.50 156,250
500 10.0% 50.00 25,000
100 26.0% 26.00 2,600
50 35.0% 17.50 875
25 25.0% 6.25 156

SUM 100% 267.25 919,881
Standard deviation = (sum (x2.f) – (sum (x.f))2)
= (919,881 -2672)
= 921.
Equivalent Bet Limit = Bav (1 + (SB/ Bav)2).
= 267.(1 + (921/267)2)
= 3,442
In other words, instead of behaving like N hands with equal bet size $267, this will behave like 0.0777N
hands with equal bet size $3,442. If N = 157,500 which implies that 0.0777N = 12,229 then the win net
of tax etc. is
W =((12,229 x 0.0125 – 1.645(0.97x12,229)) x (1 - 0.1375) – 12,229 x 0.007).(1-0.135)
= -93.7
As the size of the bets are now assumed to be $3,442 instead of $267 this implies a 90% lower
probability limit of
= -93.7 x 3,442
= -$322,365
Bet Distribution 2
Bet size = x Frequency = f x.f x2.f
5000 2% 100.00 500,000
2500 3% 75.00 187,500
500 9.5% 47.50 23,750
100 21.5% 21.50 2,150
50 29.0% 14.50 725
25 35.0% 8.75 281
SUM 100% 267.25 714,344

Standard deviation = (sum (x2.f) – (sum (x.f))2)
= (714,344 -2672)
= 802
Equivalent Bet Limit = Bav (1 + (SB/ Bav)2).
= 267.(1 + (802/267)2)
= 2,673
This behaves like 0.10N hands with equal bet size $2,673 and the win net of tax etc. is
W =((15,748 x 00125 – 1.645.(0.97x15,748).
(1 - 0.1375) – 15,748 x 0.007).(1-.135))x2,673
= -267,725
Bet Distribution 3
Bet size = x Frequency = f x.f x2.f
10000 1% 100.00 1,000,000
5000 2% 100.00 500,000
500 5% 25.00 12,500
100 15% 15.00 1,500
50 32% 16.00 800
25 45% 11.25 281
SUM 100% 267.25 1,515,081
Standard deviation = (sum (x2.f) – (sum (x.f))2)
= (1,515,081 -2672)
=1202
Equivalent Bet Limit = Bav (1 + (SB/ Bav)2).
= 267.(1 + (1202/267)2)
= 5,669

This bet distribution will behave like 0.047N hands with equal bet size $5,669 and the win net of tax
etc. is
W =((7,425 x 00125 – 1.645.(0.97x7,425)).
(1 - 0.1375) – 7,425 x 0.007).(1-0.135))x5,669
=-452,727
Whilst bet distributions 1 and 2 fall within what is deemed as an acceptable level of risk (in this case a
one in twenty chance of losing $350,000) the large variance of the bet sizes in bet distribution 3 cause
the risk to increase to above $450,000.
Therefore if a very high degree of confidence could be placed in the assessment of the bet distribution,
then it would not be inappropriate to offer a $7,000 table maximum bet in this Casino, based on what
the shareholders have indicated that they are prepared to lose on a weekly basis. If, however, a player
or players come into the Casino and bet substantially more than recognised in the market analysis, there
is a real danger of experiencing losses at a much greater level as demonstrated by distribution 3. Thus,
if that is not acceptable at all, then a much more conservative bet range should be provided for, with
maybe a $5,000 table maximum bet being allowed, or if the shareholders were totally intolerant of any
greater loss within the probability allowance, a maximum limit of $3,500 could be provided depending
on a re-assessment in both cases of the bet distribution and frequency of bets. Once established, this
then would form the upper limit available on any of the games with lower limits, stratified if required, to
allow egos and social groupings as the market requires. Of course not all games are the same within the
Casino and different game profiles would exist. However, this would be a reasonable framework for
establishing table maximum limits within the operation, as we have used a “base case style” game with
low house edge and low game variance. This bet limit would then provide the even money bet
maximum for all games with higher pay-off bets being discounted appropriately. Alternatively, it
would be possible to build the entire Casino profile based on an assessment of the individual games on
offer and the markets for each. To establish box or player maximum limits from the calculated table
maximum limits merely requires a division by the number of boxes on offer and the rules pertaining to

the number of players per box. Otherwise what has been calculated is a maximum bet per table per
round, or what is commonly referred to as a table differential.
Another use of this particular information would be to assess daily, weekly, monthly and yearly
performance and determine whether or not the actual results fell within an acceptable range, based on
probabilistic considerations.
From the above example the following may be calculated as the range of Casino win (prior to expenses
and fees) which would be achieved, with a probability of results falling outside these parameters, being
likely to occur on one occasion in twenty :
Win = BavN.E%
Lower probability limit = BavN.E%-1.645. Bav.(V.N.(1 + (SB/B)2))
Lower limit Average Upper limit
Daily -157,897 75,164 308,225
Weekly -90,474 526,128 1,142,770
Monthly 978,393 2,254,922 3,531,451
Yearly 22,844,142 27,284,555 31,724,967
Taking into account taxes, expenses and fees the following net profit forecasts may be presented.
Lower limit Average Upper limit
Daily -154,211 19,668 193,546
Weekly -322,365 137,673 597,712
Monthly -362,342 590,028 1,542,399
Yearly 3,826,519 7,139,345 10,452,170
Clearly this type of information is essential in establishing possible cash flow discrepancies and whether
or not monthly and yearly statements of profit and loss are reasonable. For example, once displayed in

this manner, the shareholders may either accept the risk implied, based on the assumptions made and the
table maximum bet limits offered, or request a review of those limits to establish tighter, more
consistent returns. It should be noted, at this point, that what has been assessed is a situation where all
bets made at a table are non-cancelling. That is, that bets have been made by the players on the table on
the same proposition and not on opposing bets where the Casino essentially takes no risk. At Baccarat,
for example, if one player has $5 on “Player”, and another player has $5 on “Banker”, the Casino either
draws or wins. If “Player” wins, one bet pays the other; but if “Banker” wins, the Casino takes 5%. In
reality the Casino takes a risk only on non-cancelling bets, but must be prepared to accept the risk
associated by allowing non-cancelling bets at the bet limits provided. When assessing actual results, in
relation to the probability of occurrence based on bet distribution information, it is critical that this be
understood.
Another piece of information that may be of use is the calculation of the probability of ruin, from the
Casino’s perspective, if all bets were made at the table maximum and all bets were non-cancelling.
If the table maximum were $7,000 and the Casino had capital of $5,000,000 then the effective number
of units (a) which the Casino possesses is : $5,000,000/$7,000 which equals 714. If the game under
consideration is Baccarat, with a probability of the house winning (p) of 0.50625 and a probability of
losing (q) of 0.49375, then based on the following formularef6 we have :
risk = (q/p)a
risk = (0.49375/0.50625)714
risk = 0.00000002
The Casino is not taking much of a chance of going to ruin, and starting with such a large amount of
capital, in relation to the maximum bet allowed, would steadily get richer if that capital could
accumulate.
ref6 Allan N. Wilson, The Casino Gambler’s Guide: Enlarged edition page 264.

6.7 Conclusion
The above information has hopefully assisted the reader in understanding how table maximum bet limits
can be established on sensible business principles and how knowledge or forecasts of bet distributions
can be put to effective use. Armed with this type of information, it is possible to explain to shareholders
their risk expectation from the Casino’s activities and account for actual results by relating to a
probability of occurrence. I would hope that analysts and managers would use this to their best
advantage and that this article has been of some value.
Dated 30/11/94 14:30
Acknowledgements :
Pryna Ypma for reviewing and providing some of the mathematics.
Peter Burrage for proof reading and correcting the article.
Bill Eadington, Peter Griffin, and Jim Kilby for their support.