doc sample1-solution nc
DESCRIPTION
adTRANSCRIPT

Exam Solution 1
London Business School
MIM2015 – Management Analysis & Systems Gah-Yi Vahn
SAMPLE FINAL EXAM 1
xxx 2015
Time: xxx
LBS Number__________________
Stream_________________
Total Points : 50
Question 1 : 25
Question 2 : 25
Duration: 2 hours
Instructions:
This is a closed-book exam.
The use of a hand-held calculator is allowed, but a graphics calculator is NOT allowed.
The exam paper consists of 2 questions; you are required to answer all questions. Allocate
your time optimally.
For your answers, please use the space provided. If you need more space, please use the
blank page opposite the question.
Make explicit any assumptions underlying your answers, interpret your results and justify
your answers, conclusions and recommendations.
In grading, importance will be attached to the clarity and conciseness of your answers.
Good luck!
EXAM SOLUTION

Exam Solution 2
Question 1 (25 points)
Maureen Laird is the chief financial officer for the Alva Electric Co., a major public utility in the UK. The
company has scheduled the construction of new hydroelectric plants 5, 10, and 20 years from now to meet
the needs of the growing population in the region served by the company.
To cover the construction costs, Maureen needs to invest some of the company’s money now to meet these
future cash-flow needs. Maureen may invest only in three different investment opportunities: A, B, and C. In
order to keep a diversified portfolio, Maureen can invest at most £800 million, £300 million, and £200
million in opportunity A, B, and C respectively. The investment opportunities produce income 5, 10, and 20
years from now, and that income is needed to cover the cash-flow requirements in those years. (Any excess
income above the minimum requirement for each time period will be used to increase dividend payments to
shareholders rather than saving it to help meet the minimum cash-flow requirement in the next time period.)
Table 1.1 shows both the amount of income generated by one million invested in each investment
opportunity and the minimum amount of income needed for each of the future time periods when a new
hydroelectric plant will be constructed.
Table 1.1 Investment income and cash flows required
Year
Income per £million invested Minimum Cash
Flow Required A B C
5 £2 million £2 million £1.8 million £450 million
10 £1.5 million £0.5 million £1 million £250 million
20 £0.3 million £0.5 million £2 million £200 million
Maureen wishes to determine the investment portfolio that will cover the cash-flow requirements while
minimising the total amount invested. For this purpose, she has developed a spreadsheet model. The decision
variables in the model are:
A: amount to be invested in opportunity A now (in £ million),
B: amount to be invested in opportunity B now (in £ million),
C: amount to be invested in opportunity C now (in £ million).
(i) (10 points) Write down an algebraic model for the problem described above (objective, decision
variables, and constraints in algebraic form).
Minimise A + B + C
Subject to
2A + 2B + 1.8C 450
1.5A + 0.5B + C 250
0.3A + 0.5B + 2C 200
A 800
B 300
C 200
A, B, C 0
Below, you will see:
Table 1.2: an Excel model with the optimal solution (obtained using Solver) and the same spreadsheet,
but with the formula’s made visible;

Exam Solution 3
Table 1.3: the Solver pop-up window (with some parts missing);
Table 1.4: the sensitivity analysis report.+
Table 1.2 Excel spreadsheet (in £million) with optimal solution

Exam Solution 4
Table 1.3 Solver pop-up window (with parts missing)
Table 1.4. Sensitivity Analysis Report
Variable Cells
Final Reduced Objective Allowable Allowable
Cell Name Value Cost Coefficient Increase Decrease
$B$10 Investments A 99.4 0 1 0.182 0.013
$C$10 Investments B 63.3 0 1 0.012 0.593
$D$10 Investments C 69.3 0 1 2.67 0.100
Constraints
Final Shadow Constraint Allowable Allowable
Cell Name Value Price R.H. Side Increase Decrease
$E$5 Cash Flows 450 0.482 450 291 77.8
$E$6 Cash Flows 250 0.012 250 60.7 106
$E$7 Cash Flows 200 0.060 200 217 115
Exam Solution 5
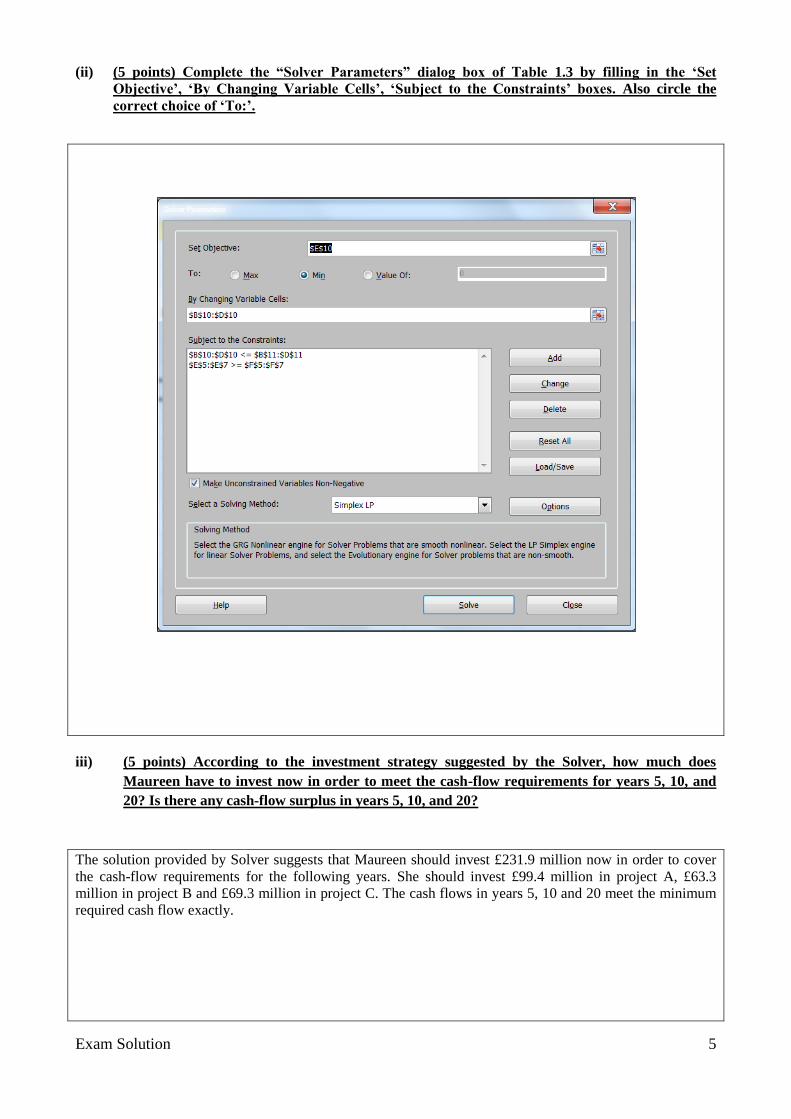
(ii) (5 points) Complete the “Solver Parameters” dialog box of Table 1.3 by filling in the ‘Set
Objective’, ‘By Changing Variable Cells’, ‘Subject to the Constraints’ boxes. Also circle the
correct choice of ‘To:’.
iii) (5 points) According to the investment strategy suggested by the Solver, how much does
Maureen have to invest now in order to meet the cash-flow requirements for years 5, 10, and
20? Is there any cash-flow surplus in years 5, 10, and 20?
The solution provided by Solver suggests that Maureen should invest £231.9 million now in order to cover
the cash-flow requirements for the following years. She should invest £99.4 million in project A, £63.3
million in project B and £69.3 million in project C. The cash flows in years 5, 10 and 20 meet the minimum
required cash flow exactly.

Exam Solution 6
iv) (5 points) In Table 1.4, the shadow price of the value in cell E5 is £0.482 million. Interpret this
value.
The shadow price of the E5 cell denotes the additional investment required now in order to have one more
million available in the 5th year (£451 million instead of £450 million), or alternatively, the reduced
investment needed upfront if in the 5th year, one million less were required (£449 million instead of £450
million).
In other words, if we wanted to have £451 million available in the 5th year, we would have to invest an
additional £0.482 million now. This shadow price holds up to an allowable increase of £291 million more
required in the 5th year. Likewise, if we could do with only £449 million in the 5
th year, we would not need to
invest £0.482 million now. This would be true up to an allowable decrease of £77.8 million.

Exam Solution 7
Question 2 (25 points)
Wildcat Dynamics Co. is an oil exploration company, founded in 1985. The company had been successful in
bringing in wildcat wells in various parts of the United States. By 1999 the company had reasonable
financial reserves of its own, but also occasionally entered into partnership with a group of investors in
Dallas. Hence, the firm usually did not have great difficulty in raising funds for a reasonably good wildcat
prospect.
It was Wildcat Dynamic’s policy to sell off the rights to produce the oil once a well was brought in.
Activities were confined to locating possible sites, arranging for appropriate leases, and contracting for
drilling operations.
In June of 2001, the company was trying to decide whether to drill on a parcel of offshore land in Louisiana.
The lease had been taken out in 1999 but the company had to decide whether or not to drill. The cost of
drilling at the site would be $70 million. This would be all lost if the well were dry. If the well were
successful, the value would depend upon the extent of the reserves uncovered. For simplicity, management
generally considered only two alternatives, described as either a “wet” well or a “soaking” well. The revenue
associated with selling the rights to a wet well is $220 million (i.e. $150 million in excess on the drilling
cost). For a soaking well, revenue is expected to be $670 million (i.e. $600 million above the drilling cost).
William Cooper, the company geologist, was consulted about the chances of actually finding oil. He said that
the chances depended upon whether or not a particular structure laid underneath the proposed drilling site. If
the underlying lime-shale formation rose into a flat dome shape where Wildcat proposed to drill then there
were substantially better chances of finding oil than if no such dome structure existed. Mr. Cooper said that
he estimated that there were roughly 6 chances in 10 of such a dome structure underneath the Wildcat site.
He based this estimate upon experiences of other drillers in the area and his own accumulated knowledge of
geology. Cooper also gave estimates of the probability of finding oil, given the existence of a dome (see also
Table 2.1): If there is a dome, there still is a 60% chance that there is no oil whatsoever. In 25% of the cases,
the well will be “wet”, while there is a 15% chance that it will be “soaking”. If there is no dome structure
underneath the site, chances are much bigger that there is no oil, namely 85%, and only 12.5% of a wet well
and 2.5% of a soaking well.
Dome Structure
Present
No Dome Structure Present
Dry Well 60% 85%
Wet Well 25% 12.5%
Soaking Well 15% 2.5%
Table 2.1 Probability of finding oil
Mr Cooper noted that these estimates represented his best judgement about the results of drilling. He
indicated that another expert might come up with a different set of estimates and that in fact, there were no
such things as “right” probability estimates in this business.
(i) (7 points) Given Cooper’s estimates about the probability of striking oil, should Wildcat go
ahead and drill for oil? (for all questions, ignore tax effects and the time value of money)
The decision tree below shows that the expected profit of this prospect equals $41 million, and that based on
this, Wildcat should go ahead and drill for oil. However, the risk profile below indicates that there is a 70%
chance that Wildcat will lose $70 million. Nevertheless, in oil exploration this is typically the situation that
you will face, i.e. high likelihood of losing money on a prospect, with a small change of making a lot of
profit, in this case up to $600 million (with a probability of 10%).

Exam Solution 8
Risk Profile
0%
20%
40%
60%
80%
100%
-200 -100 0 100 200 300 400 500 600 700
Value
Pro
bab
ilit
y
Drill
Do Not Drill
60% 36%
0 -70
60% Oil
0 85.5
25% 15%
220 150
15% 9%
670 600
TRUE Dome
-70 41
85% 34%
0 -70
40% Oil
0 -25.75
12.5% 5%
220 150
2.5% 1%
670 600
Drill
41
FALSE 0%
0 0
Wildcat
Yes
No
Yes
No
Dry
Wet
Soaking
Dry
Wet
Soaking

Exam Solution 9
Suppose that an oil-detector would be available that could detect whether the underground contained oil or
not (regardless of the presence of a dome structure) without drilling first, and that the detector would be able
to tell perfectly whether the well would be dry, wet or soaking.
(ii) (6 points) How valuable would this detector be for this project?
The expected value of the detector in this project would be $90 million (expected value of perfect
information about oil, EVPI-oil) - $41 million = $49 million.
Also, by using the detector, the risk profile would be radically changed, by completely eliminating the
downside. There is no chance that Wildcat would lose money on this prospect if they would have such a
detector (for free).
FALSE 0
-70 -70
70% Drill
0 0
TRUE 70%
0 0
Oil
90
TRUE 0.2
150 150
20% Drill
0 150
FALSE 0%
0 0
TRUE 0.1
600 600
10% Drill
0 600
FALSE 0%
0 0
Wildcat
Dry
Wet
Soaking
Yes
No
Yes
No
Yes
No
Risk Profile
0%
10%
20%
30%
40%
50%
60%
70%
80%
-100 0 100 200 300 400 500 600 700
Value
Pro
bab
ilit
y

Exam Solution 10
Unfortunately, such a detector does not (yet) exist. However, William Cooper suggested that Wildcat might
consider the possibility of taking a seismic test on the site before drilling. This test would cost $5 million.
The seismic test would give an estimate of the depth of the lime-shade formation, and hence give an
indication of the existence or non-existence of the dome structure.
(iii) (6 points) If you assume that the seismic test can detect the existence of a dome structure without
error, should Wildcat perform the seismic test first?
The decision tree below indicates that the test would increase the expected value of the prospect from $41 to
$46.3 million. The seismic test is therefore worth $10.3 million (expected value of perfect information about
the dome, EVPI-dome), $5.3 million more than its cost.
60% 36%
0 -75
TRUE Oil
-70 80.5
25% 15%
220 145
15% 9%
670 595
60% Drill
0 80.5
FALSE 0
0 -5
TRUE Dome
-5 46.3
85% 0%
0 -75
FALSE Oil
-70 -30.75
13% 0%
220 145
3% 0%
670 595
40% Drill
0 -5
TRUE 0.4
0 -5
Take Seismic Test
46.3
60% 0%
0 -70
60% Oil
0 85.5
25% 0%
220 150
15% 0%
670 600
TRUE Dome
-70 41
85% 0%
0 -70
40% Oil
0 -25.75
12.5% 0%
220 150
2.5% 0%
670 600
FALSE Drill
0 41
FALSE 0%
0 0
Wildcat
Yes
No
Yes
No
Yes
No
Dry
Wet
Soaking
Dry
Wet
Soaking
Yes
No
Yes
No
Dry
Wet
Soaking
Yes
No
Dry
Wet
Soaking

Exam Solution 11
Moreover, the test would also improve the risk profile. When taking the test, the probability of losing money
on the prospect is increased from 70% to 76%, but the probability of losing $70 million or more is reduced to
36%. Also, the upside is only slightly affected by the cost of the test. In conclusion, Wildcat should
definitely perform the seismic test first.
Unfortunately, the seismic test is not perfect. Sometimes intermediate layers of rock reflected the seismic
soundings sufficiently to give the impression of a dome when none is there, and sometimes soundings are
misinterpreted to say that no dome exists when in fact it does.
Cooper gave the following estimates of the reliability of the seismic test based on past experience:
When there was a dome present, the seismic test was positive (a dome was detected) in 90% of the
cases. However, in 10% of the cases the test mistakenly reported that there was no dome structure.
When there was not a dome present, the seismic test reported a dome structure to be present in 20%
of the cases while there was actually none (see Table 2.2).
Dome Structure Present No Dome Structure Present
Dome Detected 90% 20%
No Dome Detected 10% 80%
Table 2.2 Accuracy of seismic test
(iv) (6 points) Should Wildcat perform the seismic test at a cost of $5 million?
Using the Bayes rule (see below), we can derive the probability that the test would yield a positive result,
namely 62% (54% + 8%). Given a positive result, the probability that a dome will be present equals 87.1%
(54%/62%). Given a negative result, the probability that there indeed is no dome equals 84.2% (32%/38%).
Risk Profile
0%
10%
20%
30%
40%
50%
60%
70%
80%
-200 -100 0 100 200 300 400 500 600 700
Value
Pro
bab
ilit
y
1 : Yes
2 : No

Exam Solution 12
The decision tree shows that the expected profit of the prospect with the test (39.11 million) is less than
without it ($41 million). The value of the test is $3.11 million, substantially less than its cost ($5 million).
The risk profile does indicate, however, that the risk is reduced somewhat by the test, making the test more
interesting.
Dome (60%) No Dome (40%)
Positive (90%)
Negative (10%)
Negative (80%)
Positive (20%)
54%
32%
6%
8%
Dome (60%) No Dome (40%)Dome (60%) No Dome (40%)
Positive (90%)
Negative (10%)
Negative (80%)
Positive (20%)
54%
32%
6%
8%

Exam Solution 13
60% 0%
0 -75
87% Oil
0 80.5
25% 0%
220 145
15% 0%
670 595
TRUE Dome
-70 66.15
85% 0%
0 -75
13% Oil
0 -30.75
12.5% 0%
220 145
2.5% 0%
670 595
62% Drill
0 66.15
FALSE 0
0 -5
FALSE Test Results
-5 39.11
60% 0%
0 -75
16% Oil
0 80.5
25% 0%
220 145
15% 0%
670 595
FALSE Dome
-70 -13.18
85% 0%
0 -75
84% Oil
0 -30.75
12.5% 0%
220 145
2.5% 0%
670 595
38% Drill
0 -5.00
TRUE 0
0 -5.00
Take Seismic Test
41.0
Wildcat
Yes
Positive
Negative
Yes
No
Yes
No
Dry
Wet
Soaking
Dry
Wet
Soaking
Yes
No
Yes
No
Dry
Wet
Soaking
Dry
Wet
Soaking
Risk Profile
0%
10%
20%
30%
40%
50%
60%
70%
80%
-200 -100 0 100 200 300 400 500 600 700
Value
Pro
bab
ilit
y
Test
No Test