do sound segments contribute to sounding charismatic
TRANSCRIPT

Do Sound Segments Contribute to SoundingCharismatic? Evidence from a Case Study of SteveJobs’ and Mark Zuckerberg’s Vowel SpacesOliver NiebuhrUniversity of Southern Denmark, Mads Clausen Institute, Alsion 2, DK-6400 Sønderborg, Denmark.
Simon GonzalezCentre of Excellence for the Dynamics of Language, The Australian National University, 13 Ellery Crescent,Canberra ACT 2601.‘
(Received 24 June 2018; accepted 22 November 2018)
The paper presents a case study of two popular US American CEOs. It compares the acoustic vowel space sizesof the more charismatic speaker Steve Jobs and those of the less charismatic speaker Mark Zuckerberg, as part ofan initial acoustic step to examine a traditional claim of rhetoric that clearer speech makes a speaker sound morecharismatic. Analysing about 2,000 long and short vowel tokens from representative keynote speech excerpts of thetwo speakers shows that Jobs’ vowel space is, across various segmental and prosodic context factors, significantlylarger than that of Zuckerberg, whose vowel space is strongly reduced particularly when addressing investors.The differences in vowel-space size are consistent with the claim of rhetoric that a clear articulation is a keycharacteristic of a charismatic speaker. The discussion of the results describes further experimental steps requiredto back up the link between clear pronunciation and speaker charisma.
1. INTRODUCTION
1.1. The Phonetics of Charismatic SpeechSpoken language is not just the exchange of propositions.
On the contrary, it is in the first place a social action, and”this fact both shapes the nature of the activity and its con-sequences.”26 We use speech for expressing our emotionsand sharing them with others, as well as for influencing thethoughts and actions of others. To this extent, charisma as”the art of persuasion”65 through ”emotion-laden leader sig-nalling”1 is indeed a core element of spoken language — andits phonetic essence is surprisingly little understood.
It is against this background that Rosenberg and Hirschbergcalled for an empirical definition of charisma in speech.53
They analysed the acoustic-prosodic characteristics of maleUS politicians and related them to perceived charisma. Theiranalysis led to the conclusion that higher levels of fundamentalfrequency (F0), intensity, and speaking rate, as well as a largerF0 range, make speakers sound more charismatic. These find-ings were consistent with analyses of other political leaders inthe US and in Europe.5, 6, 25, 61, 65 Moreover, the same prosodicstrategy also works for business leaders,42, 43 except that fe-males are more likely to lower rather than raise their F0 level.46
Furthermore, Niebuhr et al. added to the picture that shorterprosodic phrases, larger numbers of emphatic pitch accents,high-energy voices (higher values of %V, spectral emphasis,and HNR1), and more variable speech rhythm (higher VarcoV
1%V is the average proportion of vowel segments in an utterance. It wasintroduced as a rhythm measure, but since vowels are the most energetic partsof an utterance, %V is also highly correlated with the perceived ”volume” and”power” of a voice.50 Spectral emphasis refers to the difference between thetotal acoustic energy of the signal at a given point in time and the energy in thelower frequency region of that signal (0-1.5*f0median, following Traunmullerand Eriksson).66 Thus, spectral emphasis quantifies the loss of energy towards
values) also support a speaker’s charismatic impact.42, 43, 45
While an empirical definition of charismatic prosody iswithin reach (at least for Western Germanic languages and/orthe Western culture), a whole area of speech has hardly beenaddressed so far: sound segments.5 Manuals on rhetoric andleadership have claimed ever since that clear and crisp articu-lation of ”every phrase and word”40 ”is imperative to developcharisma.”7
Basically, this claim makes sense from the perspective ofbasic ethological principles like the Effort Code.21 Accord-ing to the Effort Code, a fundamental behavioural pattern ofall biological organisms, they spend more time and effort onthings and actions that are more important to them. In orderto understand the implications of this basic principle in humaneveryday life, one only needs to think about how elaborate thetable is set when important guests are coming as compared tohow simple the table setting is when one eats alone. If a simpletable setting were used for important guests, the implicit mes-sage would be that the host does not care about his/her actionsand/or that the invited guests are not important to the host. Thesame is true for speech communication. Investing more ef-fort into articulating sound segments would indicate from theEffort Code’s point of view that the conveyed message is im-portant and that the speaker shows appreciation for his/her au-dience. In contrast, mumbling would implicitly signal that thespeaker does not care about his/her message and the audienceas well.
Similarly, the Hypo-Hyper (H&H) theory of Lindblom re-garded a clear, effortful articulation (hyper-speech) as beinglistener-oriented, with, for example, an aim to meet the re-
higher frequencies. Voices with a perceived high ”volume” and ”power” loseless energy towards higher frequencies. HNR stands for harmonics-to-noiseratio and quantifies the ratio (in dB) between the periodic energy and the noiseenergy of a signal at a given point in time.
International Journal of Acoustics and Vibration, Vol. 24, No. 2, 2019 (pp. 343–355) https://doi.org/ijav.2019.24.21531 343
O. Niebuhr, et al.: DO SOUND SEGMENTS CONTRIBUTE TO SOUNDING CHARISMATIC? EVIDENCE FROM A CASE STUDY OF STEVE JOBS’. . .
quirements of a formal situation, making it easier for theaudience to understand the speaker’s message.35 Thus, lessclear and effortful articulation (hypo-speech) occurs when thespeaker places his/her own interests (e.g. being efficient andsaving articulatory energy) above those of the audience (e.g.being intelligible and easy to follow). Obviously, this is theopposite of what charismatic speakers are supposed to do.
The predictions of the Effort Code and the H&H theorymanifested themselves in experimental research on how speechbecomes more effortful in adverse conditions or for largerspeaker-listener distances,12 how speakers produce and per-ceive the expression of surprise,8 and how post-lexical reduc-tion processes among consonants influence a speaker’s per-ceived personality traits. A recent study by Niebuhr foundthat speakers whose utterances were characterized by a largernumber of reduced (e.g., elided, lenited, or assimilated) con-sonant articulations sound less sociable, educated, and sincerein the ears of listeners.44 These personality traits were similarto attributes like ”upright”, ”team-integrating”, and ”charm-ing”, which, in turn, were shown to be correlated with speakercharisma.53, 69 Nevertheless, although such results basicallyargued in favour of the claim that the” clarity of speech andpronunciation is important for perceived charisma and influ-ential delivery”,38 and studies like that of Niebuhr representedno clear, direct evidence for a positive correlation between theclarity of speech pronunciation and the perception of speakercharisma.44
Addressing this gap, the present paper represents a sec-ond step within a line of research that examines the assumedlink between sound segments and their pronunciation on theone hand and perceived speaker charisma on the other. Clar-ity of pronunciation is obviously related to a higher speech-production effort. But, as the latter is hardly objectively mea-surable (an issue already brought up in connection with theHypo-Hyper theory of Lindblom and not solved since then),clarity of pronunciation is defined in our line of research as thelevel of distinctivity in the (acoustic) phonetic implementationof phonological contrasts and, as one countable feature of thisdistinctivity, the frequency of speech-reduction processes suchas those manipulated in the study of Niebuhr above.35, 44
A first step in this line of research was made in the studies ofNiebuhr et al., based on a comparative case study of two popu-lar US American CEOs: Steve Jobs (SJ) and Mark Zuckerberg(MZ).45 The following section explains why SJ and MZ repre-sent an ideal pair of speakers to start with.
1.2. Motivation of the Case StudySJ is well known and often cited for his charismatic
speeches,59 whereas MZ’s public-speaking skills made someresearchers and journalists, e.g., Tobak,64 question the rele-vance of charisma in modern leadership. SJ and MZ are oftennamed as examples of different types of charismatic businessleaders, as in the CNN article by Sutter” when it comes to pre-sentation, Mark Zuckerberg is no Steve Jobs.”63 Gruener alsocompares the two CEOs’ public-speaking performances andconcludes that ”Jobs [...] owns the kind of charisma very fewpeople have — the kind that makes you drop everything you doand listen instantly. Zuckerberg does not have that charisma,not yet, and the presentation skills are rough enough to impactFacebook’s perception in a negative way.”20 Similar impres-sionistic statements were made from many other people whose
professional backgrounds range from bloggers to journalists toexperts in rhetoric.
Recently, a formal perception experiment further elucidatedthese public assessments of the two speakers (see Niebuhr etal.).45 Ninety-eight English-speaking listeners were asked torate the leadership experience, charisma, and charisma-relatedpersonality traits of SJ and MZ based on 30-second keynoteexcerpts. These excerpts were low-pass filtered (0–500 Hz)in order to remove verbal content and speaker identity fromthe stimuli. Low-pass filtered speech is also called ”delexical-ized” speech.55 What remains in a low-pass filtered signal is F0and, for most of the time, 1–2 subsequent harmonics, and, onthis basis, the first formant frequency (F1).2 This is sufficientfor listeners to still perceive all the variable prosodic patternsof intonation, voice quality, loudness, tempo (based on thesyllable-related waxing and waning acoustic-energy alterna-tions), phrasing, and durations of utterances and pauses. Whata low-pass filtered signal lacks is the critical region betweenabout 500–3,000 Hz of the speech signal (the typical telephonetransmission bandwidth, cf. Miet et al.) in which most infor-mation about the types of sound segments and their places ofarticulation are encoded in terms of F1, F2, and F3.39 It alsolacks the amplitudes and frequencies of formants higher thanF3 that ”are greatly related to the anatomy of one’s laryngealcavity [...] and therefore carry some individual specificity.”71
F0 and the spectral frequency information up to 500 Hz areonly related to speaker identity in that they can to some degreeindicate group features like speaker sex, age, and (non)nativelanguage background. However, individual speakers cannot beidentified on this basis.
The 30 second stimuli of SJ and MZ were embedded in alarger set of equally long keynote excerpts of other male En-glish keynote speakers and presented to the 98 listeners in indi-vidually randomized orders. Results showed that the 98 listen-ers gave SJ significantly and substantially higher ratings thanMZ on all scales. Figure 1 summarizes the relevant results ofthe perception experiment.3
The results in Fig. 1 put the informal observations of individ-ual journalists, bloggers, and rhetoric experts on a broader, sys-tematic, and therefore more objective empirical footing. Thatis, that SJ was deemed as more charismatic than MZ did notjust reflect the opinion of individual listeners. Rather, the opin-ion was of a general nature. Additionally, since speaker iden-
2Formant is a technical term in the phonetic sciences for the resonancefrequencies that the pharyngeal, oral, and nasal tubes and cavities impose onall source signals generated in the vocal tract for speech communication. Thevowels and consonants of the world’s languages are particularly shaped by thetwo lowest formant frequencies, F1 and F2. In vowels, F1 can vary from 300Hz to 1000 Hz. It is correlated with the vertical tongue position. The lower F1is, the higher is the vowel, i.e. the more the tongue is raised towards the roofof the mouth (/i/ has a low and /A/ a high F1). F2 can vary from 550 Hz to2500 Hz. F2 values indicate the horizontal tongue position, i.e. the frontnessor backness of a vowel. A vowel with high a F2 value is articulated in thefront of the mouth. A back vowel has a low F2 value (/i/ has a high and /A/a low F2). Lip rounding lowers F2 and F3 as well. Higher formants such asF4 and F5 are more strongly associated with voice qualities than with soundqualities.28
3However, also note that MZ is by no means an uncharismatic speaker. Heis merely less charismatic than SJ in the analysed keynote speeches (whetherhis performance has improved since then is an issue we cannot judge). The re-sults of Niebuhr et al. clearly show that, despite being less charismatic than SJ,MZ still performs significantly better on many acoustic-prosodic dimensionsof perceived speaker charisma than the normal American English speaker whois, for example, asked to produce read monologues in a phonetic speech pro-duction experiment.43
344 International Journal of Acoustics and Vibration, Vol. 24, No. 2, 2019

O. Niebuhr, et al.: DO SOUND SEGMENTS CONTRIBUTE TO SOUNDING CHARISMATIC? EVIDENCE FROM A CASE STUDY OF STEVE JOBS’. . .
Figure 1. Results of the listener ratings (n = 98) on SJ’s and MZ’s charisma-related skills and personality traits. Photographs were taken by Ben Standfield (SJat WWDC07) and by Anthony Quintano (MZ at F8 2018) and are used here in edited forms under flickr CC BY2.0 or CC BY-SA 2.0 licenses.
tity and the content of the speech were removed in the per-ception experiments of Niebuhr et al.45 through the low-passfiltering, and since the visual channel was not available either(cp. Fox Cabane,17 for charisma effects of attire, visual attrac-tiveness, and body language), a significant part of the differentcharismatic impact of the two speakers must be contained inthe speech signal. In fact, the two quotes of Sutter and Gruenerabove explicitly referred to the speech and voice of SJ andMZ, and such references were also made in many other sim-ilar comparative statements.20, 63 The results in Fig. 1 furthercorroborate the conclusions of previous studies that prosodyis probably the most influential feature in charisma perception(see Niebuhr et al. for a summary).44 Interestingly, these pre-vious studies all used original hi-fi speech data, whereas theresults in Fig. 1 were obtained solely with strongly reduced,low-pass filtered speech data. This suggested that there was alot more to discover particularly in the variability and dynam-ics of prosodic parameters that is relevant for speaker charisma.
Taken all together, SJ and MZ represent two persons who areconsistently judged to be very different in perceived charismaboth by public actors like journalists and bloggers, and bynaıve listeners in formal perception experiments. These judg-ment differences can clearly be related to the acoustic featuresin their speech signals. This certainly includes prosody, but, asthe present study shows, probably extends beyond prosody toinclude the segmental domain as well.
SJ and MZ and the speech materials that are available forthem allow keeping a number of things constant that couldhave otherwise become confounders in the analysis. SJ andMZ are male adults and were — at the times when theirspeeches were given — within an age range that is free frombiologically-induced phonetic changes.56 In addition, SJ andMZ both speak the same language (but different regional di-alects, which is irrelevant, however, to the results of thepresent study, see section 4.2) and represent the same cul-ture. Moreover, they are speakers for whom sufficient hi-fispeech material is available for acoustic analysis. This mate-rial was recorded in the same real-life communication situation(keynote speeches in large lecture halls with TV transmissionin front of hundreds of listeners), it follows the same typicalstructure of a product presentation, and it comes from the samebusiness area, i.e. digital, entertainment, and information tech-nology.
The resilient differences in perceived charisma combined
with the extensive control of many known individual andcontextual factors influencing the production and perceptionof charismatic speech make SJ and MZ — or their keynotespeeches, respectively — an ideal case study for the compara-tive acoustic analysis of speaker charisma. Nevertheless, notethat the data we collect and analyse here still represent ”fielddata”. Thus, results obtained from this case study have a highdegree of ecological validity and a high potential for general-ization, but they will also need to be double-checked and fur-ther refined in more controlled lab-speech settings in whichindividual parameters can be singled out and separately variedor manipulated.
1.3. Consonant Realizations of Jobs andZuckerberg
Based on the case-study arguments given above, Niebuhret al. compared the consonant realizations of SJ and MZ inan acoustic analysis of keynote speech samples from the twospeakers.45 These samples were the same from which also thelow-pass filtered stimuli were extracted for the perception ex-periment summarized in Fig. 1.
In particular, Niebuhr et al.45 focused on SJ’s and MZ’sstop consonants, for which there are three pairs of phono-logical contrasts in American English, /p,t,k/ and /b,d,g/.32
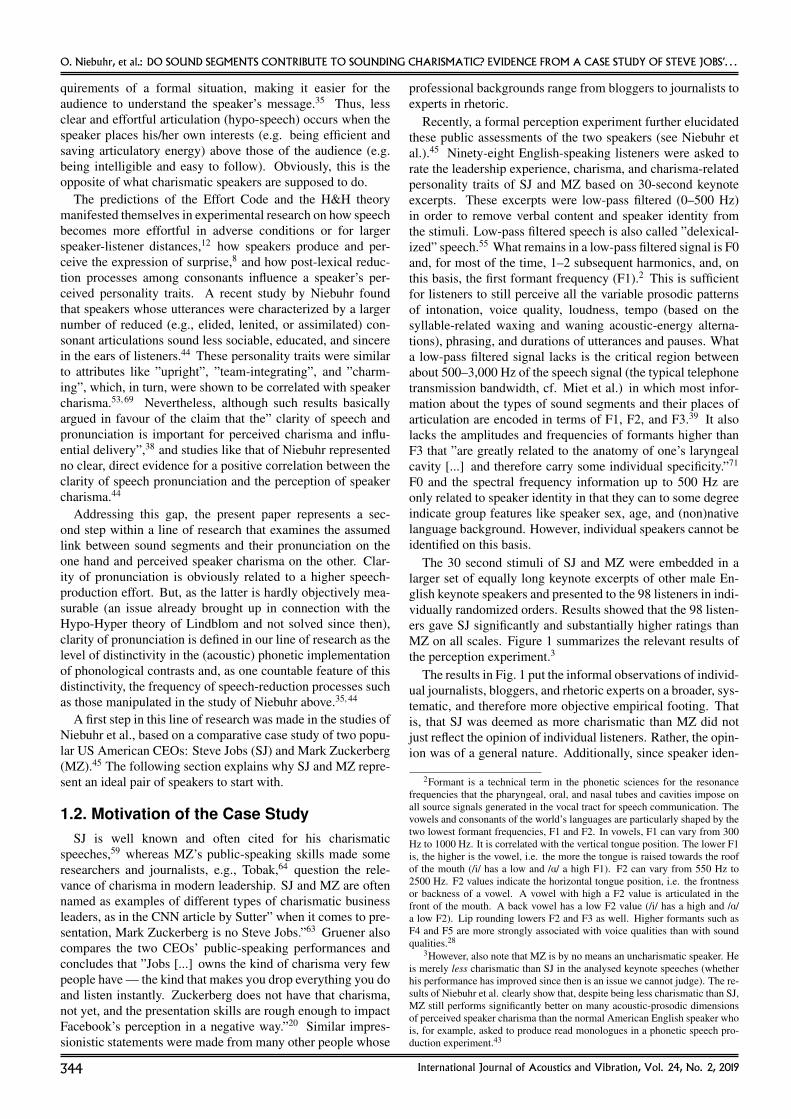
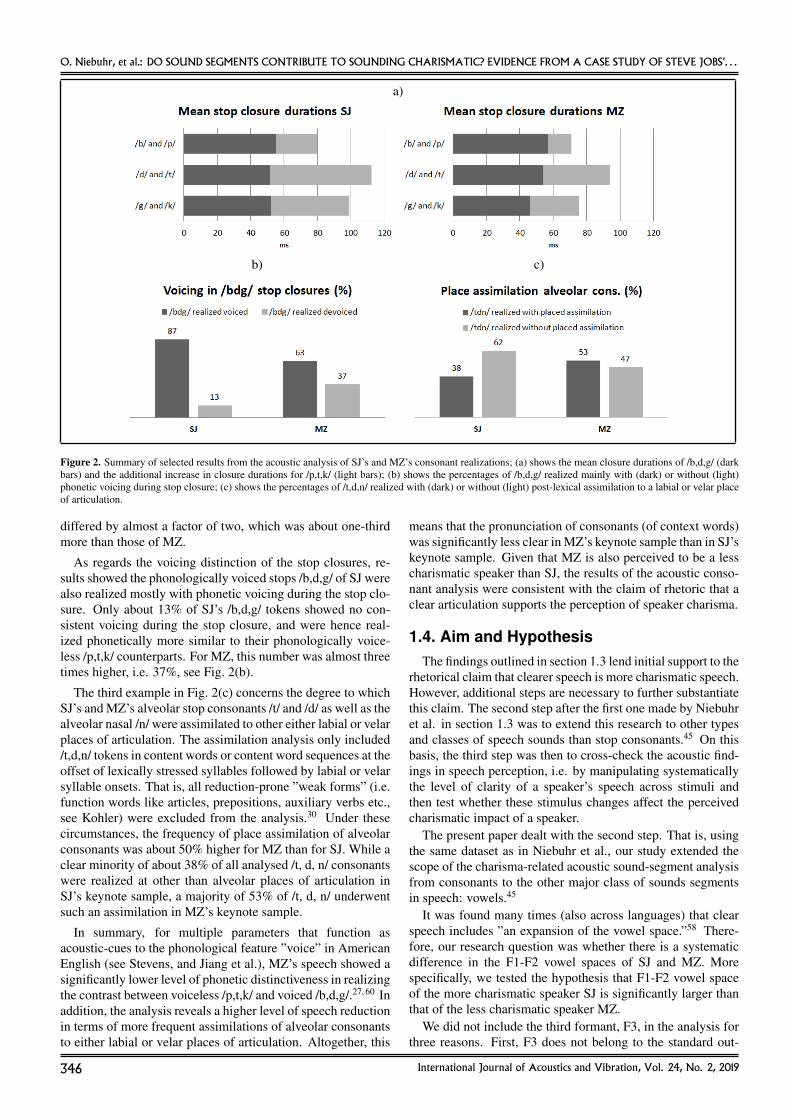
Although only a few hundred (out of several thousand) stopconsonant realizations were acoustically analysed (in manualspectrogram and waveform measurements, carried out by JanaThumm in the course of a funded EU young-researcher mo-bility program4), the results were clear.45 Three examples ofthe overall results, all of which came out statistically signif-icant, are shown in Figs. 2(a)–(c). The first two examplesreferred to the distinctiveness in the phonetic implementationof the phonological voiceless-voiced contrast. Compared tothe keynote sample of SJ, MZ’s sample was characterized bysmaller differences in the closure duration of phonologicallyvoiceless and voiced stops. This applied to all three places ofarticulation, but most strongly to the bilabial one. MZ’s /p/closures were realized on average only 17% longer than his /b/closures, which was a relatively small percentage given thatSJ’s /p/ closures were on average almost 40% longer than his/b/ closures. For /t/ vs. /d/ and /k/ vs. /g/, SJ’s closure durations
4See Niebuhr et al. for further methodological details of the acoustic anal-ysis.45
International Journal of Acoustics and Vibration, Vol. 24, No. 2, 2019 345
O. Niebuhr, et al.: DO SOUND SEGMENTS CONTRIBUTE TO SOUNDING CHARISMATIC? EVIDENCE FROM A CASE STUDY OF STEVE JOBS’. . .
a)
b) c)
Figure 2. Summary of selected results from the acoustic analysis of SJ’s and MZ’s consonant realizations; (a) shows the mean closure durations of /b,d,g/ (darkbars) and the additional increase in closure durations for /p,t,k/ (light bars); (b) shows the percentages of /b,d,g/ realized mainly with (dark) or without (light)phonetic voicing during stop closure; (c) shows the percentages of /t,d,n/ realized with (dark) or without (light) post-lexical assimilation to a labial or velar placeof articulation.
differed by almost a factor of two, which was about one-thirdmore than those of MZ.
As regards the voicing distinction of the stop closures, re-sults showed the phonologically voiced stops /b,d,g/ of SJ werealso realized mostly with phonetic voicing during the stop clo-sure. Only about 13% of SJ’s /b,d,g/ tokens showed no con-sistent voicing during the stop closure, and were hence real-ized phonetically more similar to their phonologically voice-less /p,t,k/ counterparts. For MZ, this number was almost threetimes higher, i.e. 37%, see Fig. 2(b).
The third example in Fig. 2(c) concerns the degree to whichSJ’s and MZ’s alveolar stop consonants /t/ and /d/ as well as thealveolar nasal /n/ were assimilated to other either labial or velarplaces of articulation. The assimilation analysis only included/t,d,n/ tokens in content words or content word sequences at theoffset of lexically stressed syllables followed by labial or velarsyllable onsets. That is, all reduction-prone ”weak forms” (i.e.function words like articles, prepositions, auxiliary verbs etc.,see Kohler) were excluded from the analysis.30 Under thesecircumstances, the frequency of place assimilation of alveolarconsonants was about 50% higher for MZ than for SJ. While aclear minority of about 38% of all analysed /t, d, n/ consonantswere realized at other than alveolar places of articulation inSJ’s keynote sample, a majority of 53% of /t, d, n/ underwentsuch an assimilation in MZ’s keynote sample.
In summary, for multiple parameters that function asacoustic-cues to the phonological feature ”voice” in AmericanEnglish (see Stevens, and Jiang et al.), MZ’s speech showed asignificantly lower level of phonetic distinctiveness in realizingthe contrast between voiceless /p,t,k/ and voiced /b,d,g/.27, 60 Inaddition, the analysis reveals a higher level of speech reductionin terms of more frequent assimilations of alveolar consonantsto either labial or velar places of articulation. Altogether, this
means that the pronunciation of consonants (of context words)was significantly less clear in MZ’s keynote sample than in SJ’skeynote sample. Given that MZ is also perceived to be a lesscharismatic speaker than SJ, the results of the acoustic conso-nant analysis were consistent with the claim of rhetoric that aclear articulation supports the perception of speaker charisma.
1.4. Aim and HypothesisThe findings outlined in section 1.3 lend initial support to the
rhetorical claim that clearer speech is more charismatic speech.However, additional steps are necessary to further substantiatethis claim. The second step after the first one made by Niebuhret al. in section 1.3 was to extend this research to other typesand classes of speech sounds than stop consonants.45 On thisbasis, the third step was then to cross-check the acoustic find-ings in speech perception, i.e. by manipulating systematicallythe level of clarity of a speaker’s speech across stimuli andthen test whether these stimulus changes affect the perceivedcharismatic impact of a speaker.
The present paper dealt with the second step. That is, usingthe same dataset as in Niebuhr et al., our study extended thescope of the charisma-related acoustic sound-segment analysisfrom consonants to the other major class of sounds segmentsin speech: vowels.45
It was found many times (also across languages) that clearspeech includes ”an expansion of the vowel space.”58 There-fore, our research question was whether there is a systematicdifference in the F1-F2 vowel spaces of SJ and MZ. Morespecifically, we tested the hypothesis that F1-F2 vowel spaceof the more charismatic speaker SJ is significantly larger thanthat of the less charismatic speaker MZ.
We did not include the third formant, F3, in the analysis forthree reasons. First, F3 does not belong to the standard out-
346 International Journal of Acoustics and Vibration, Vol. 24, No. 2, 2019

O. Niebuhr, et al.: DO SOUND SEGMENTS CONTRIBUTE TO SOUNDING CHARISMATIC? EVIDENCE FROM A CASE STUDY OF STEVE JOBS’. . .
put of the analysis software we use for this study. Separatemeasurements of F3 frequencies and their later addition to thedataset would have made our procedure inhomogeneous. Sec-ond, although F3 is to a small degree involved in acousticallyseparating American English vowels (in particular /Ç/, /O/, and/U/, see Ghorshi et al.18), it is mainly studied for its critical rolein the production and perception of rhoticity and variants of /r/consonants in English, which is not the subject of the presentstudy.23 Hillenbrand and Gayvert (1987:3) supported the mi-nor role of F3 in acoustically distinguishing American Englishvowels in their conclusion from the results of a large-scale au-tomatic vowel classification: ”The performance is reasonablygood, and you can do everything by measuring just two pa-rameters — F1 and F2.”24 Third, building on the second point,our aim was not to provide a fine-grained description, separa-tion, and classification of American English vowels, but to findout whether SJ speaks clearer and, thus, uses a larger vowelspace than MZ. To that end, it was sufficient to focus on F1and F2 (which was also what was done by e.g., Smilijanic andBradlow58), assuming that what applies to these two formantsequally applies to F3.
2. METHOD
2.1. Speech MaterialThe analysed keynote speeches of SJ and MZ were ob-
tained from YouTube. For Steve Jobs, we used two of hismost well-known and influential speeches: the presentationof the iPhone 4 in 2010 and the presentation of the iPad 2 in2011. Each presentation included the following sections thatoccurred in the same order in both speeches:
(1) Introduction: Welcoming. What has happened since thelast presentation? What kinds of problems arose withproducts and how have they been solved? What updatesare available?
(2) Main part I: Explanation of the company’s developmentand current market position as well as the success andsignificance of the previous product(s); advantages overcompetitors.
(3) Main part II: Presentation of the new product. Its mainnew features and innovations are demonstrated, their ad-vantages for the user are emphasized, sometimes in com-parison to products of competitors.
(4) Main part III: Presentation and demonstration of furtherrelated innovations (e.g., apps); further information isprovided on availability, price, and shipping of the newproduct; accessories for the new product are shown.
(5) Summary and acknowledgments.
Sections (2) and (3) are those that we extracted our speechdata from. The speech in these middle sections was most con-sistent and free from familiarization artifacts or stylistic differ-ences due to opening and closing addresses. Section (2) repre-sents what we refer to as investor-oriented speech. Section (3)is defined as customer-oriented speech. About 11 minutes ofspeech were extracted from each section, 5–6 minutes from theiPhone 4 presentation, and another 5–6 minutes from the iPad 2presentation. The start and end points of the extracted sec-tion were timed such that they coincided with prosodic-phrase
boundaries of syntactically complete sentences. The extractedspeech sections were to form a coherent stretch of speech withas few technical pauses, breaks, and audience-related interrup-tions (e.g., murmurs or applause) as possible. Besides that, thestart point of the extraction was chosen randomly. The distinc-tion between sections (2) and (3) was made as previous stud-ies found prosodic differences between SJ and MZ addressingcustomers and investors.43
MZ’s speech samples were extracted from his keynotes atFacebook’s ”F8” events.54 F8 is Facebook’s annual confer-ence. It is meant to be a forum for highlighting milestones,advertising new features, and announcing the company’s fu-ture plans and growth strategies. That is, MZ’s F8 keynoteshad the typical make-up of a product presentation and werehence similarly structured as those of SJ’s. On this basis, weidentified customer-oriented and investor-oriented sections onMZ’s keynotes that met the same criteria as the sections (2)and (3) in SJ’s keynotes. Then, following the same procedureas for SJ, we extracted 5–6 minutes from these sections in twosuccessive F8 keynotes of MZ, the one from 2014 and the onefrom 2015.
In total, the present analysis is based on about 45 minutes ofspeech, i.e. 22 minutes from each of the two speakers, 11 min-utes of investor-oriented, and 11 minutes of customer-orientedspeech. The speech material was comprehensively annotated— in Praat TextGrid files4 — at the levels of prosodic phrases,words, syllables, and individual sound segments. The data in-clude 692 prosodic phrases of SJ and 532 prosodic phrases ofMZ. For the annotation at the segmental level, we used theforced-alignment software DARLA, as this software is specif-ically trained for American English vowel phonemes.51 Bothsound and TextGrid files are available upon request under thefollowing link: 10.5281/zenodo.1187140.
After applying two data filters to the Praat TextGrid files— a grammatical filter and a segmental-context filter (see sec-tion 2.2) — a total of 1,990 vowels were analysed; 53% or1,048 from SJ and 47% or 942 from MZ. In terms of the au-dience addressed, 46% of the analysed vowels were from thecustomer-oriented speech of the two speakers, and 54% fromthe investor-oriented speech. Note with respect to statisticalprocessing and generalization that all vowel samples includedat least 50 vowels per speaker and about half of the sam-ples consisted of between 104 and 193 vowels. Broken downinto the two sub-samples of customer- and investor-orientedspeech, this meant that no statistically relevant sub-sample wassmaller than 25 vowels per speaker; for most vowels, the sam-ple size varied from 40 to 60 tokens. We considered these sam-ple sizes sufficiently representative and reliable, not least be-cause they were in the same order of magnitude as in otherphonetic studies whose analysed phenomena range from di-alectal vowel differences to coarticulation and the ”segmentalanchoring” of pitch-accent F0 peaks.9, 10, 19, 31
2.2. Acoustic AnalysisOur analysis included the 10 American English vowel
phonemes. They are shown in Table 1 together with exam-ple words and their representations in ARPA and the Interna-tional Phonetic Alphabet (IPA). Table 1 also specifies the sam-ple sizes per speaker and audience condition. We used DARLAfor automatic vowel extraction. Form DARLA’s csv output,vowel durations as well as F1 and F2 formant frequencies were
International Journal of Acoustics and Vibration, Vol. 24, No. 2, 2019 347

O. Niebuhr, et al.: DO SOUND SEGMENTS CONTRIBUTE TO SOUNDING CHARISMATIC? EVIDENCE FROM A CASE STUDY OF STEVE JOBS’. . .
obtained.
The formant frequencies were measured at the temporalmidpoint of each vowel and normalized using the Lobanovmethod.16 Then, they were rescaled to Hz using the vowelpackage in R studio.29 We took DARLA’s csv output as itwas and refrained from conducting manual checks or correc-tions for three reasons. First, DARLA is very effective inautomatically filtering out noisy/ambiguous data based on aselective in-dubio-contra-reo principle. Second, comparativetests of forced-alignment/segmental-labelling software toolswith American English speech material show that DARLA per-forms very well and ”provides a clean, well-separated vowelspace.”47 Third, we used a three-standard-deviation cut-offcriterion per vowel phoneme in order to remove all potentialremaining measurement errors from the DARLA output.
Regarding the two data filters mentioned in section 2.1, thefirst one excluded all vowels in grammatical (function) words,i.e. ”weak forms” (see Kohler), from the analysis.30 Thus, wefocused on content words only, as the difference between con-tent and function words is known to have a considerable effecton vowel reduction, more so than, for example, sentence ac-cent.67 Since we were dealing with field data, we could notextend control over the words any further. For example, wecould not control the frequency of occurrence of the wordswhose target vowels we analysed. Studies like that of Wrightshowed that the frequency of a word is inversely related to howclearly the vowels inside this word are realized.70 The morefrequent a word is, the more reduced its vowels tend to be real-ized. However, this factor only manifested itself as noise in ourdata. A significant bias of this factor would require SJ to sys-tematically use more/less frequent words in his keynotes thanMZ. There were no indications for such a systematic differ-ence in our keynote excerpts. Both SJ and MZ use a product-and company-specific inventory of less frequent words (e.g.,technical terms) in combination with very frequent words withwhich they explain decisive pieces of information in a com-mon language to customers, investors, and the general public.Nevertheless, we included the content words that contained theanalysed vowels as a random factor in our statistical model.One thing we checked in this connection with respect to us-ing field data was that no relevant content word and analysedtarget vowel was overlaid with environmental noises such asapplause, laughter, camera clicking, etc.
The second applied data filter addressed the segmental con-text and excluded all vowel tokens adjacent to nasal conso-nants from the analysis. Nasals cause a co-articulatory nasal-ization of an adjacent vowel, and this changes the vowel’s for-mant pattern and makes automatic formant extraction a veryerror-prone task.9 Specifically, formants of nasalized vowelsare more strongly damped than those of vowels in other co-articulation contexts. Damping increases the bandwidth of aformant, decreases its amplitude, and hence impedes the clearacoustic separation of adjacent formants like F1 and F2, espe-cially in back vowels like [u], [U], and [O].28 That the couplingof the nasal resonator cavities lowers formant frequencies andbrings them closer together adds to the problem of acousticformant separation.14 Moreover, the coupling of the nasal res-onator cavities introduces strong nasal formants at frequenciesthat can easily be mistaken for F1 and F2 of the vowel (e.g.,at 250–300 Hz and 800–1,000 Hz). Simultaneously, the nasalsinuses represent side-tubes that branch off the nasal tube and
create anti-formants in the vowel spectrum (Johnson, 2012).Unlike other co-articulatory effects, nasal co-articulation ex-
tends very far into the adjacent vowel and can indeed affect theentire vowel. For example, Flege found in a speech-productionexperiment that on average 36% of the vowels of his AmericanEnglish speakers were realized fully nasalized in the contextof an adjacent nasal consonant.15 One-third of the speakerseven realized 67–92% of all nasal-adjacent vowels fully nasal-ized. Besides the problems that nasal co-articulation causes forformant measurements, this strong co-articulatory effect wasanother reason why the segmental-context filter of the presentstudy focused on nasals in particular. All other types of co-articulatory effects that are induced by adjacent segments inour target vowels are minimized by taking our formant mea-surements at the temporal midpoints of the vowels. It was re-peatedly found and stressed by Reetz and Jogman52 that for-mant frequencies at the vowel midpoint ”provide the ’purest’representation of a vowel” in the sense that vowel midpointsare ”most stable” against any contextual influences (see Lar-son and Hamlet, with reference to Picket).33, 49
If small coarticulatory influences of neighbouring segmentson the formant measurements at vowel midpoints remained inour data, then these influences only introduced some statis-tical noise to the data (as in the case of the word frequencyabove). We analysed about 1,000 vowels per speaker, and eachvowel condition was represented by about 40–80 tokens (seeTable 1). Sample sizes of this order of magnitude inherentlycover a wide range of segmental contexts. This homogenizedthe compared vowel samples and, across the individual com-parisons, turned potential effects of the segmental context intoa random factor. That is, with respect to the tested hypothe-sis, neither speaker can consistently benefit from a segmentalcontext effect.
Nevertheless, note that we also tested applying more re-strictive filters to our dataset. These filters additionally ex-cluded, for example, all those vowels that occurred in lexi-cally unstressed and secondary stressed syllables, at the ends ofprosodic phrases and/or in the segmental context of other vow-els, liquids and semivowels. However, firstly, these additionalprosodic and segmental filtering criteria substantially reducedour sub-sample sizes and, secondly, as we will discuss and il-lustrate in section 4.1, filtering out these additional contextualvariations turned out to have no relevant effect on the resultspattern with respect to our research question. Therefore, wedecided to present the results of the largest dataset to whichonly the most essential grammatical and segmental-context fil-ters had been applied.
3. RESULTS
The statistical tests are based on Generalized Linear MixedModels (GLMMs). A separate test is run for each of the twomeasured formants, F1 and F2. Thus, formant (F1 or F2) rep-resent the dependent variable. The fixed variables are Vowel(10 conditions), Speaker (2 conditions), and Audience (2 con-ditions). Target word is included as a random factor.
The overall results are similar for F1 and F2. We founda significant main effect only for the fixed factor Vowel (F1:F[9,1969]=739.9, p < 0.001, η2p = .776; F2: F[9,1969] =755.2, p < 0.001, η2p = .778). The other two fixed factors,Speaker and Audience, have no separate significant main ef-fects but yield significant two-way interactions with each other
348 International Journal of Acoustics and Vibration, Vol. 24, No. 2, 2019

O. Niebuhr, et al.: DO SOUND SEGMENTS CONTRIBUTE TO SOUNDING CHARISMATIC? EVIDENCE FROM A CASE STUDY OF STEVE JOBS’. . .
Table 1. The analysed set of American English vowels, their ARPA labels (used in the Darla annotation) and symbols in the International Phonetic Alphabet(IPA). In addition, example words are given and sample sizes are specified (with the right number referring to the customer-oriented and the left to the investor-oriented sub-sample).
ARPA AA AE AH AO EH ER IH IY UH UWIPA A æ 2 O E Ç I i U u
Example LOT TRAP STRUT THOGHT DRESS NURSE KIT FLEECE FOOT GOOSEExample bot bat butt bought bet bird bit beat book bootTokens SJ 33/41 64/69 25/33 41/40 48/80 79/82 39/65 88/89 27/36 29/40
Tokens MZ 33/35 77/74 25/30 37/61 39/45 48/63 32/40 96/97 26/25 26/33
(F1: F[1,1969] = 30.4, p < 0.001, η2p = .016; F2: F[1,1969]= 7.4, p = 0.007, η2p = .004) as well as with the fixed factorVowel, i.e. Vowel*Speaker (F1: F[9,1969] = 7.7, p < 0.001,η2p = .035; F2: F[9,1969] = 10.2, p < 0.001, η2p = .045) andVowel*Audience (F1: F[9,1969] = 2.3, p = 0.013, η2p = .011;F2: F[9,1969] = 3.1, p = 0.001, η2p = .014). The three-wayinteractions are not significant.
The separate significant main effect of Vowel means that theformant frequencies of the 10 vowel phonemes were distinctfrom one another. There are only a few exceptions, i.e. /2/vs. /E/, /Ç/ vs. /U/, and /i/ vs. /u/ in the case of F1, and/æ/ vs. /E/ and /2/ vs. /Ç/ in the case of F2. Both the dis-tinctions and the exceptions to these distinctions fit in wellwith the acoustic F1 and F2 characteristics of American En-glish vowel phonemes and, thus, may be seen as indirect evi-dence for the validity and reliability of the automatic formant-measurement procedure applied here.10, 19, 24, 48 On this ba-sis, the significant interactions are looked at in detail by con-ducting post-hoc t-tests. They compare the formant measure-ments of each vowel phoneme between the two conditions ofSpeaker (section 3.1) and Audience (section 3.2). We use theconservative Bonferroni correction to compensate for multipletesting. Independent-sample and dependent-sample t-tests areconducted for Speaker- and Audience-related comparisons, re-spectively. Only significant outcomes are reported below, withgrand means and p-levels in brackets.
3.1. SpeakerThe overview displays of SJ’s and MZ’s customer-oriented
and investor-oriented vowel spaces in Figs. 3(a)–(b) clearlyshow that SJ used a larger vowel space than MZ. From theperspective of MZ, SJ’s vowel spaces are 6,680 Hz2 or about14% larger in the customer-oriented speech condition, and17,973 Hz2 or almost 50% larger in the investor-orientedspeech condition. In total, i.e. across the two Audience condi-tions, the vowel space produced by SJ was about 12,500 Hz2
or 33% larger than that of MZ. The vowel-space differencesmainly concern the horizontal dimension, i.e. the frontness-backness dimension and its second formant F2. However,some vowel landmarks along the vertical dimension, i.e. thevowel height dimension and its first formant F1, are involvedas well (see footnote 2). In addition, significant formant-frequency differences concern both phonologically long andphonologically short vowels.
Viewing and analysing both panels of Fig. 3(a)–(b) togethershows that the vertical F1 difference in vowel space is primar-ily caused by three vowels and included the full range fromhigh to low vowel qualities. Thus, SJ’s vowel space extendsbeyond that of MZ in both vertical directions. High and midvowels are produced higher, low vowels are produced lower.Specifically, SJ produced lower F1 values than MZ (i.e. higher
(a)
(b)
Figure 3. Vowel spaces (Hz2) in the customer-oriented and investor-orientedkeynote sections of (a) SJ and (b) MZ; n = 1,990. Vowels are represented bytheir ARPA labels, see Table 1.
vowel qualities) for /U/ (333 Hz vs. 355 Hz, p = 0.008) and /O/(355 Hz vs. 390 Hz, p = 0.003), and higher F1 values (i.e. alower vowel quality) for /æ/ (486 Hz vs. 458 Hz, p < 0.001).
The same three vowels, plus the vowel /i/, are also primar-ily responsible for the horizontal F2 difference in vowel space.Again, vowels from both ends of the vowel space, i.e. backand front vowels, are involved and SJ’s vowel space is ex-panded in both directions compared to that of MZ. SJ producedhigher F2 values (i.e. more front vowel qualities) than MZfor /i/ (1,665 Hz vs. 1,630 Hz, p = 0.01) and /æ/ (1,412 Hzvs. 1,312 Hz, p < 0.001), and lower F2 values (i.e. moreback vowel qualities) than MZ for /U/ (1,134 Hz vs. 1,203 Hz,p = 0.007) and /O/ (965 Hz vs. 1,094 Hz, p = 0.03).
International Journal of Acoustics and Vibration, Vol. 24, No. 2, 2019 349

O. Niebuhr, et al.: DO SOUND SEGMENTS CONTRIBUTE TO SOUNDING CHARISMATIC? EVIDENCE FROM A CASE STUDY OF STEVE JOBS’. . .
3.2. AudienceAudience is a significant factor as well. Both SJ and MZ
expand their vowel spaces when addressing customers in theirkeynotes; however, they do so in different ways and to differ-ent degrees, cp. panels (a) and (b) of Figure 3. In the caseof SJ, for example, we found higher F1 values (i.e. lowervowel qualities) for /U/ (348 Hz vs. 322 Hz, p = 0.033), /Ç/(353 Hz vs. 335 Hz, p = 0.004), and /I/ (449 Hz vs. 429 Hz,p = 0.033) in the customer-oriented speech sample. Regard-ing F2, SJ produced higher values (i.e. a more front vowelquality) for /I/ (1,486 Hz vs. 1,408 Hz, p = 0.035) and lowervalues (i.e. a more back vowel quality) for /u/ (1,165 Hz vs.1,271 Hz, p = 0.011) in his customer-oriented speech sample.MZ’s customer-oriented vowels showed lower F1 values (i.e.higher qualities) for /i/ (291 Hz vs. 311 Hz, p < 0.001), /I/(318 Hz vs. 334 Hz, p = 0.003), /u/ (291 Hz vs. 307 Hz,p < 0.001), and /O/ (369 Hz vs. 404 Hz, p = 0.035). The F2values of MZ decreased (i.e. towards more back vowel qual-ities) in his customer-oriented speech for the central vowels/2/ (1,202 Hz vs. 1,235 Hz, p < 0.001) and /Ç/ (1,194 Hzvs. 1,238 Hz, p = 0.033) and the back vowels /A/ (1,048 Hzvs. 1,145 Hz, p = 0.002) and /U/ (1,113 Hz vs. 1,282 Hz,p = 0.023). So, unlike for SJ, the vowel-space expansion in thecustomer-oriented speech of MZ involves both vowel height(high vowels are still higher) and horizontal tongue position(back vowels are further back). In consequence, MZ’s vowelspace expands by about 25.7% (12,703 Hz2) from investor- tocustomer-oriented speech, whereas that of SJ expands by onlyabout 2.7% (1,446 Hz2).
4. DISCUSSION
4.1. Summary and ConclusionsResearch and practice (e.g., manuals) in rhetoric and lead-
ership have stressed for a long time how important it is for acharismatic speaker to have (i) a durable and animated voiceand (ii) a clear and crisp articulation. While previous phoneticstudies provided a large body of supporting evidence for theprosody-related claim (i) and detailed what ”durable” and ”an-imated” means in terms of acoustic-prosodic parameters, thesegment-related claim (ii) has remained largely unaddressedso far. The aim of the present study was to address this knowl-edge gap in a case-study approach by means of a contrastiveacoustic-phonetic analysis of Steve Jobs and Mark Zuckerberg.Given that previous studies showed that a clear articulation isreflected in a larger vowel space (see, for example, Smiljanic& Bradlow58), and given that Steve Jobs proved to be a morecharismatic speaker than Mark Zuckerberg in public opinionas well as in a formal perception experiment, we tested thehypothesis that keynote speech excerpts of Steve Jobs wouldbe characterized by a larger vowel space than those of MarkZuckerberg. Our analysis of the first and second formant fre-quencies of about 2,000 phonologically long and short vow-els supports this hypothesis: The vowel space exploited bySteve Jobs was larger than that of Mark Zuckerberg in both hiscustomer-oriented and his investor-oriented keynote excerpts.As a larger vowel space means at the same time greater acous-tic differences between adjacent vowel phonemes, we can con-clude from our findings that Steve Jobs’ phonological vowelcontrasts were more distinctive at the phonetic level than thoseof Mark Zuckerberg. In other words, Steve Jobs realized larger
differences between neighbouring vowels and may on this ba-sis be regarded as speaking more clearly than Mark Zucker-berg,5 in particular as our significant F1 and F2 differences areabove the just noticeable difference (JND) of 0.37 bark andhence perceptually relevant.37
This conclusion is further corroborated by the fact that it isconsistent with a previous comparison of Jobs’ and Zucker-berg’s consonant realizations by Niebuhr et al.45 The analy-sis of consonants showed, for the same keynote excerpts asin the present study, that Mark Zuckerberg’s speech containssignificantly more place assimilations of alveolar consonantsthan Steve Jobs’ speech and is also less distinct with respect tothe acoustic implementation of the phonological ”voiced” vs.”voiceless” opposition in stop consonants (see Fig. 2(a)–(c)).Jobs’ speech shows greater differences for this opposition interms of closure duration and vocal-fold vibration during theclosure than Zuckerberg’s speech.
In addition, the present finding is consistent with the pre-vious finding on prosody that Steve Jobs and Mark Zucker-berg show a different speech behaviour in the customer- andinvestor-oriented parts of their keynotes. Both speakers arefound here to produce more distinct and peripheral vowel qual-ities — and thus a larger vowel space — when addressing cus-tomers than when addressing investors, Mark Zuckerberg evenmore so than Steve Jobs. This is probably because customersare the primary type of audience for product presentations. Inthe previous study on prosody, however, Mark Zuckerberg wasfound to perform worse when addressing customers than whenaddressing investors.43 The present data on sound segments goin the opposite direction. Mark Zuckerberg’s vowel space islarger, i.e. he performed better for customers, not worse. Thecontrast between the prosodic and segmental findings suggeststhat Mark Zuckerberg applies different charisma-related pho-netic implementation strategies in the two audience conditions.It seems as if he focuses more on intelligibility (the segmentalaspects of his speech) when addressing customers and moreon expressiveness (the prosodic aspects of this speech) whenaddressing investors, see section 4.2. Compared to that, SteveJobs is not only the overall better speaker, but perhaps alsomore homogeneous with respect to his charisma-related pho-netic implementation strategies.
One of our reviewers asks us for the role of experience ingiving charismatic public speeches and if we would just haveto wait for some twenty years until Mark Zuckerberg automati-
5Note for this conclusion that acoustic distinctivity between vowelphonemes is not solely a matter of the size of the vowel space. It must alsobe taken into account how much the acoustic F1-F2 ellipses of the individualvowels in the vowel space overlap. It was reasonable for us to assume thata small vowel space causes a larger overlap of the vowel-specific F1-F2 el-lipses. For this reason, we focused on analysing the size of the vowel space.However, based on the comment of one of our reviewers, we conducted an ad-ditional post-hoc analysis of the acoustic overlap of the F1-F2 vowel ellipses.The results of this additional analysis confirm our assumption that a smallervowel space is closely correlated with a larger overlap of the individual vow-els in terms of their acoustic F1-F2 ellipses. For example, while the realiza-tions of Steve Jobs’ 10 vowels overlap acoustically on average by 288.4 Hz2
across both audience conditions, the average overlap for Mark Zuckerberg is377.8 Hz2. This is considerably and statistically significantly larger than forSteve Jobs (t[19,19] = -1.73, p = 0.042). In addition, while for Steve Jobs noF1-F2 ellipse overlaps more than 50% with that of another vowel in the cus-tomer and the investor condition, there are two F1-F2 ellipses in Mark Zucker-berg’s speech that are virtually completely covered by those of other vowels.This concerns /A/ that acoustically fully overlaps with the larger F1-F2 ellipseof /2/; and, in the investor condition, it additionally concerns /I/, whose F1-F2ellipse is completely covered by those of /Ç/ and /u/.
350 International Journal of Acoustics and Vibration, Vol. 24, No. 2, 2019

O. Niebuhr, et al.: DO SOUND SEGMENTS CONTRIBUTE TO SOUNDING CHARISMATIC? EVIDENCE FROM A CASE STUDY OF STEVE JOBS’. . .
cally performs as well as Steve Jobs. To the best of our knowl-edge, there is no solid empirical data about effects of merepublic-speaking experience on a speaker’s charismatic impact.However, the first author teaches a 10-week MSc course on”Persuasive Communication and Negotiation” at the Univer-sity of Southern Denmark, which is mandatory for all business-engineering students. The students in this course learn how togive charismatic business-idea presentations in front of poten-tial investors (so-called ”investor pitches”). On this basis, hehas some years ago determined how much his course partici-pants improved over the 10 weeks, as compared to a baselinegroup of students who did not take part in the course but wereinstead instructed to practice without any rhetorical trainingand supervision a short-investor pitch presentation to other fel-low students once a week for 10 weeks. Both the test groupand the baseline group consisted of 17 male and female stu-dents. An analysis was done of the two groups in terms ofthe acoustic-prosodic parameters of charismatic speech (e.g.,pitch range and level, speaking rate, etc.). Results show thatboth groups improved over time, the baseline group by about20%, the test group about three times as much, i.e. by about60%; while the test-group’s improvement was fairly linear overtime, the baseline-group’s improvement curve took a clearlyasymptotic shape at about 4 weeks. So, it seems speakersdo become more charismatic by public-speaking experience,but that this improvement mainly concerns early-stage publicspeakers. Thus, we would not expect that time and experiencealone will automatically make Mark Zuckerberg someday per-form as well on stage as Steve Jobs. Steve Jobs was known forrefining and rehearsing his presentations ”endlessly and fastid-iously.”57 We assume that it is this kind of training with anexplicit focus on aspects of rhetoric and charisma that is re-quired for an outstanding charismatic-speaking performance.
Finally, note that the presented differences in the vowel-space sizes of Steve Jobs and Mark Zuckerberg are very un-likely to result from coarticulatory artefacts. It is true that, inorder to get large sub-samples for each vowel, we applied onlyvery basic grammatical and segmental context filters to ourspeech data and, thus, included quite a bit of phonetic variationin the formant measurements of each vowel. However, apply-ing more restrictive context filters to our speech data yieldsresults that are qualitatively identical to those in Figs. 3(a)–(b). Figures 4(a)–(b) show the differences in vowel space be-tween Steve Jobs and Mark Zuckerberg that emerge when fil-ters additionally excluded all those vowels that occurred in lex-ically unstressed and secondary stressed syllables, at the endsof prosodic phrases, and in the segmental context of other vow-els, liquids and semivowels. These restrictive filters reducethe total sample from almost 2,000 to slightly less than 1,000vowel tokens (n = 943) in total.
Yet, again the vowel spaces of Steve Jobs are larger thanthose of Mark Zuckerberg in both audience and customerconditions; and again, this difference is more strongly pro-nounced for investor-oriented than customer-oriented speech;and again, we see that both the F1 and F2 dimensions are in-volved in the vowel-space differences regarding vowel-specificand audience-specific conditions. In a nutshell, we can saythat the main effects and interaction patterns that result fromthe data in Figs. 4(a)–(b) are statistically equivalent to those ofthe data in Figs. 3(a)–(b). The only differences lie in whichvowels contribute to these main effects and interactions and
(a)
(b)
Figure 4. Vowel spaces (Hz2) in the customer-oriented and investor-orientedkeynote sections of (a) SJ and (b) MZ, using a more restrictive phonetic-context filter than in the main analysis of Fig. 3; n = 943. Vowels are repre-sented by their ARPA labels, see Table 1.
how strong these contributions are. Further aspects concern-ing the internal and external validity of the present results arediscussed in the critical reflection below.
4.2. Critical Reflection and OutlookThe differences in vowel-space size between the two speak-
ers can also not be an artefact of different dialects of AmericanEnglish. Although Steve Jobs and Mark Zuckerberg were bornand raised in different regions of the US (San Francisco forSteve Jobs and White Plains for Mark Zuckerberg), the result-ing differences in vocal production would not per se lend SteveJobs a larger vocal space than Mark Zuckerberg.10, 19 In fact,we have not found many of the expectable dialectal differencesbetween Steve Jobs and Mark Zuckerberg, which supports ourauditory impression that neither Steve Jobs nor Mark Zucker-berg are strong dialect speakers. Also, a different vocal tractmorphology (esp. length) or speaker age can be ruled out as ex-planations for our findings, either because they have oppositeeffects than those that were found here (e.g., a general vowelcentralization for older speakers is expected, and we found theopposite for the older speaker Steve Jobs), or because thesefactors have comparable effects on all formants and would,
International Journal of Acoustics and Vibration, Vol. 24, No. 2, 2019 351
O. Niebuhr, et al.: DO SOUND SEGMENTS CONTRIBUTE TO SOUNDING CHARISMATIC? EVIDENCE FROM A CASE STUDY OF STEVE JOBS’. . .
thus, only shift the vowel space as a whole along the F1-F2plane, but not change its size.56 The same applies to the factorof vocal effort, which equally raises formant frequencies (esp.F1) for all vowels.34 Moreover, the major prosodic correlateof vocal effort, the intensity level (dB), is found to be higherfor Mark Zuckerberg than for Steve Jobs.43 So, if vocal effortwere the explanation for our findings, then Mark Zuckerberg’svowel space would have been larger than Steve Jobs’ vowelspace, not smaller. Finally, although Steve Jobs speaks over-all more slowly than Mark Zuckerberg (but still faster than theaverage male American English speaker, see Niebuhr et al.42),his vowels are only marginally — and statistically not signifi-cantly — shorter than those of Mark Zuckerberg (grand means:115 ms vs. 108 ms); and Mark Zuckerberg’s vowels are over-all too long to entail a strong vowel-space compression. Inaddition, unlike the formant frequencies and Hz2 values, MarkZuckerberg’s speaking rates (syl/s) did not differ between thetwo audience conditions.43 For these reasons, the present find-ings can also not simply represent an epiphenomenon of anunderlying speaking-rate difference.
All these points, in combination with the facts that our find-ings remain stable both for more and for less restrictive con-text filters (see Figs. 4(a)–(b) in section 4.1) as well as agreewith previous measurements on consonants, lead us to the con-clusion that Steve Jobs’ speech was indeed characterized by agenerally clearer and ”crisper” articulation than Mark Zucker-berg’s speech. Based on this empirical foundation, we cannow, in a follow-up study, turn to the third step of the researchagenda that we outlined in section 1.3. That is, we can proceedfrom acoustics to perception and test, if systematically manip-ulated variation in the level of articulatory precision and dis-tinctiveness is actually linked to changes in perceived speakercharisma, and if so, how important this segmental articulationfactor is for perceived charisma compared to other prosodicfactors like pitch range and level (Berger et al., 2017), andwhether precise and distinctive sound-segment articulation ismore important for consonants than for vowels or vice versa.
There may also be interactions between prosodic and artic-ulatory factors in charisma perception. For example, as wasnoted above, Steve Jobs’ speaking rate is found to be slowerthan that of Mark Zuckerberg, but still faster than that of theaverage American English speaker. Thus, Steve Jobs managesto be both relatively fast and clear in his keynotes. Being fastis probably similarly beneficial for a speaker’s charismatic im-pact as being clear (see Berger et al. for the positive correlationbetween speaking rate and perceived charisma).3 However,there are natural physiological limits to the extent to whichone can be a fast and clear speaker, and we assume that MarkZuckerberg exceeds this limit in his keynote excerpts. His highspeaking rate of on average more than 6 syl/s simply does notallow him (irrespective of whether or not he actually tried) toreach the same level of articulatory clarity and distinctivenessas Steve Jobs, who produces on average about 1 syllable lessper second. It would be premature, though, to conclude onthis basis and the two speakers’ charisma differences that clearspeech outweighs fast speech. However, the current data sug-gests testing this hypothesis.
In general, reconciling being fast and being clear is proba-bly even harder for male than for female speakers (see Weirichet al.68), which is why follow-up studies will also have to lookfor gender differences in the articulation-charisma link. This
also means extending the scope beyond Steve Jobs and MarkZuckerberg, ideally to a level at which also cultural and situa-tional differences as well as the language-specific phonologiesand their acoustic leeway for less clear articulations come intoplay.
Regarding the leeway for less clear articulations, follow-up studies on charismatic speech will need to take into ac-count that speech reduction is not per se bad. On the con-trary, variation in the degree of speech reduction is to somedegree context-determined (Clopper and Turnbull,11 Ernestusand Smith13) and, on this basis, functional in speech com-munication.41 For example, more or less strongly reducedsounds and syllables act as acoustic cues to turn-yielding andturn-holding, indicate lexical-stress positions and expressivemeanings like irony, distinguish between given and new in-formation, and help listeners predict the phonemic identityof subsequent sound segments. That is, speech communica-tion needs constant variation in the degree of speech reduc-tion, which, in turn, means that clear articulation in charis-matic speaking cannot simply mean producing each and ev-ery word as specified in a pronunciation dictionary, althoughthis is what the Effort Code and the H&H theory would prob-ably assume (and what rhetoric manuals imply with sweepingimperatives like ”speak clearly!”). In fact, the perception ex-periment of Niebuhr showed that such a constant overly-cleararticulation can make a speaker sound arrogant and vain; at-tributes that could hardly be further away from those associatedwith a charismatic speaker but represent key characteristics ofa hubristic (business) speaker, cf. Sundermeier.44, 62
This raises highly relevant questions about what a clear ar-ticulation means in detail for charismatic speakers. Does amore charismatic speaker show the same variation in the de-gree of speech reduction as does a less charismatic speaker,but at a generally higher (clearer) level? Or, given that an in-creased variability (or the avoidance of any kind of monotony)is a key characteristic of charismatic speech (e.g., Strangertand Gustafson61 and Hiroyuki and Rathcke25), does being amore charismatic speaker actually mean exceeding the vari-ation in the degree of speech reduction of less charismaticspeakers, i.e. to be even clearer when they are clear and toreduce even more when they are less clear? Since the speech-reduction level is functional in communication, an exceededvariation in the degree of speech reduction is also what onewould assume, if charismatic speech means a greater acous-tic distinctiveness of phonological contrasts. These questionsare not the first on our research agenda, but they are questionswhose answers will also contribute to elaborating the theoret-ical framework of charismatic speech and the roles and in-terconnections of expressiveness and intelligibility within thisframework. For instance, as was briefly suggested in sec-tion 4.1, the fact that Mark Zuckerberg shows a better prosody-related charisma performance in his investor-oriented keynotesections and a better articulation-related charisma performancein this customer-oriented keynote sections could mean that hischarisma effect was overall similar for both audience groups,but more expressiveness-based in the ears of investors andmore intelligibility-based in the ears of customers. Such anidea could be tested by combining behavioural and physi-ological measurements in perception experiments. For ex-ample, in an eye-tracking setup, reactions times (e.g., basedon phoneme-monitoring tasks) could measure intelligibility,
352 International Journal of Acoustics and Vibration, Vol. 24, No. 2, 2019

O. Niebuhr, et al.: DO SOUND SEGMENTS CONTRIBUTE TO SOUNDING CHARISMATIC? EVIDENCE FROM A CASE STUDY OF STEVE JOBS’. . .
while the eye tracker itself measures expressiveness in the formof pupil dilation. EEG data could even be able to directly mea-sure both intelligibility and expressiveness perception in dif-ferent areas of the listener’s brain.
Examining to what degree the prosodic and segmental char-acteristics of charismatic speech are related to increasing aspeaker’s expressiveness and intelligibility and determining onthis basis how important these two features are for perceivedcharisma is probably one of the major tasks of the phonetic sci-ences in charisma research. It would also allow us someday topredict how charismatic speech has to be adapted to differentenvironmental as well as second-language contexts.
ACKNOWLEDGEMENTS
The authors would like to thank their four anonymous re-viewers for their insightful and constructive ideas and com-ments on earlier drafts of this manuscript. We are also greatlyindebted to J. P. Arenas for his thorough handling of ourmanuscript during the peer-review process. Further thanks adue to Ferran Giones, Plinio Barbosa, Radek Skarnitzl, JanMichalsky, Stephanie Berger, Jana Voße, Ocke-Schwen Bohnand all organizers and participants of the Interspeech specialsession on ”voice attractiveness” (2017) for their inspiring andcommitted discussions on the concept and nature of charis-matic speech and its phonetic ingredients. Finally, we owespecial thanks to Donna Erickson for her careful proof-readingof the resubmitted paper and her great ideas about articulation-related follow-up studies on speaker charisma.
REFERENCES1 Antonakis, J., Bastardoz N., and Jacquart P. Charisma: An
ill-defined and ill-measured gift, Annual Review of Or-ganizational Psychology and Organizational Behaviour,3, 293–319, (2016). https://dx.doi.org/10.1146/annurev-orgpsych-041015-062305
2 Awamleh R., and Gardner, W. L. Perceptions ofleader charisma and effectiveness: The effects of vi-sion content, delivery, and organizational performance,The Leadership Quarterly, 10 (3), 345–373, (1999).https://dx.doi.org/10.1016/s1048-9843(99)00022-3
3 Berger, S., Niebuhr, O., and Peters, B. Winning over anaudience — a perception-based analysis of prosodic fea-tures of charismatic speech, Proc. 43rd Annual Conferenceof the German Acoustical Society (DAGA), Kiel, Germany,(2017).
4 Boersma, P. Praat, a system for doing phoneticsby computer, Glot International, 5, 341–345, (2001).https://dx.doi.org/10.1097/aud.0b013e31821473f7
5 Biadsy, F., Rosenberg A., Carlson R., Hirschberg J., andStrangert E. A cross-cultural comparison of American,Palestinian, and Swedish perception of charismatic speech,Proc. 4th International Conference of Speech Prosody,Campinas, Brazil, (2008).
6 Bosker, H. R. The role of temporal amplitude mod-ulations in the political arena: Hillary Clinton
vs. Donald Trump, Proc. 18th International In-terspeech Conference, Stockholm, Sweden, (2017).https://dx.doi.org/10.21437/interspeech.2017-142
7 Camper Bull, R. Moving from project manage-ment to project leadership: a practical guideto leading groups, CRC, Boca Raton, (2010).https://dx.doi.org/10.1201/9781439826683
8 Chen, A., Gussenhoven, C., and Rietveld, A. Language-specific uses of the Effort Code, Proc. 1st InternationalConference of Speech Prosody, Aix-en-Provence, France,(2002).
9 Cho T., Kim D., and de Jong K. Prosodically-conditioned fine-tuning of coarticulatory vowel nasaliza-tion in English, Journal of Phonetics, 64, 71–89, (2017).https://dx.doi.org/10.1016/j.wocn.2016.12.003
10 Clopper C. G., Pisoni D. B., and de Jong, K. Acous-tic characteristics of the vowel systems of six regionalvarieties of American English, Journal of the Acous-tical Society of America, 118 (3), 1661–1676, (2005).https://dx.doi.org/10.1121/1.2000774
11 Clopper, C. G., and Turnbull, R. Exploring variationin phonetic reduction: Linguistic, social, and cogni-tive factors, in F. Cangemi, M. Clayards, O. Niebuhr,B. Schuppler, and M. Zellers (eds), Rethinking Re-duction: Interdisciplinary Perspectives on Conditions,Mechanisms, and Domains for Phonetic Variation, F.Cangemi, M. Clayards, O. Niebuhr, B. Schuppler, and M.Zellers (eds), de Gruyter, Berlin/Boston, 25–72, (2018).https://dx.doi.org/10.1515/9783110524178-002
12 Eriksson, A., and Traunm’uller, H. Perception of vocal ef-fort and distance from the speaker on the basis of vowelutterances, Perception & Psychophysics, 64 (1), 131–139,(2002). https://dx.doi.org/10.3758/bf03194562
13 Ernestus, M., and Smith, R. Qualitative and quantita-tive aspects of phonetic variation in Dutch ”eigenlijk”,in F. Cangemi, M. Clayards, O. Niebuhr, B. Schup-pler, and M. Zellers (eds), Rethinking Reduction: In-terdisciplinary Perspectives on Conditions, Mechanisms,and Domains for Phonetic Variation, F. Cangemi, M.Clayards, O. Niebuhr, B. Schuppler, and M. Zellers(eds), de Gruyter, Berlin/Boston, 129–163, (2018).https://dx.doi.org/10.1515/9783110524178-005
14 Feng, G., and Castelli, E. Some acoustic features of nasaland nasalized vowels. A target for vowel nasalization, Jour-nal of the Acoustical Society of America, 99 (6), 3694–3706, (1996). https://dx.doi.org/10.1121/1.414967
15 Flege, J. E. Anticipatory and carry-over nasal coarticu-lation in the speech of children and adults, Journal ofSpeech and Hearing Research, 2 (4), 525–536, (1988).https://dx.doi.org/10.1044/jshr.3104.525
16 Flynn, N., and Foulkes, P. Comparing vowel formant nor-malization methods, Proc. 17th International Congress ofPhonetic Sciences, Hong Kong, China, (2011).
International Journal of Acoustics and Vibration, Vol. 24, No. 2, 2019 353
O. Niebuhr, et al.: DO SOUND SEGMENTS CONTRIBUTE TO SOUNDING CHARISMATIC? EVIDENCE FROM A CASE STUDY OF STEVE JOBS’. . .
17 Fox Cabane, O. The charisma myth: How anyone can mas-ter the art and science of personal magnetism, Penguin,New York, (2012).
18 Ghorshi, S. A., Vaseghi, S., and Yan, Q. Comparative analy-sis of formants of British, American and Australian accents,Proc. 7th International Interspeech Conference, Pittsburgh,USA, (2006).
19 Grieve J., Speelman D., and Geeraerts D. A multivariatespatial analysis of vowel formants in American English,Journal of Linguistic Geography, 1 (1), 31–51, (2013).https://dx.doi.org/10.1017/jlg.2013.3
20 Gruener W. On stage, Mark Zuckerberg is noSteve Jobs, Tom’s Guide (2011). Retrieved fromhttp://www.tomsguide.com/us/facebook-skype-video-calling-social-networking,news-11808.html, (AccessedDecember 28, 2018).
21 Gussenhoven, C. Intonation and interpretation: phonet-ics and phonology, Proc. 1st International Conference ofSpeech Prosody, Aix-en-Provence, France, (2002).
22 Gussenhoven C. The phonology of toneand intonation, CUP, Cambridge: (2004).https://dx.doi.org/10.1017/cbo9780511616983
23 Heselwood, B., and Plug, L. The Role of F2 and F3 inthe perception of rhoticity: evidence from listening exper-iments, Proc. 17th International Congress of Phonetic Sci-ences, Hong Kong, China, (2011).
24 Hillenbrand, J., and Gayvert, R. NAIC Technical Se-ries Report, Speaker-Independent Vowel ClassificationBased on Fundamental and Formant Frequencies, (1987).https://dx.doi.org/10.1121/1.2024478
25 Hiroyuki, T., and Rathcke, T. Then, what is charisma?The role of audio-visual prosody in L1 and L2 politicalspeeches, Proc. Phonetik & Phonologie im deutschsprachi-gen Raum, Munich, Germany, (2016).
26 Holtgraves, T. M. Language as social action: social psy-chology and language use, Lawrence Erlbaum, Mahwah,(2001). https://dx.doi.org/10.4324/9781410601773
27 Jiang, J., Chen, M., and Alwan, A. On the perception ofvoicing in syllable-initial plosives in noise, Journal of theAcoustical Society of America, 119 (2), 1092–1105, (2006).https://dx.doi.org/10.1121/1.2149841
28 Johnson, K. Acoustic and Auditory Phonetics, Blackwell,Oxford, (2012). https://dx.doi.org/10.1159/000078663
29 Kendall, T., and Thomas, E. R. Vowels:Vowel manipulation, normalization, and plot-ting in R, (2009). Retrieved from http://cran.r-project.org/web/packages/vowels/index.html, (AccessedAugust 14, 2018).
30 Kohler, K. J. Segmental reduction in connected speech inGerman: phonological facts and phonetic explanations, inSpeech Production and Speech Modelling, W.J. Hardcas-tle, and A. Marchal (eds), Kluwer Academic Publishers,Dordrecht, (1990), 69–92. https://dx.doi.org/10.1007/978-94-009-2037-8 4
31 Ladd D. R., Faulkner D., Faulkner H., and SchepmanA. Constant ‘segmental anchoring‘ of F0 movementsunder changes in speech rate, Journal of the Acousti-cal Society of America, 106 (3), 1543–1554, (1999).https://dx.doi.org/10.1121/1.427151
32 Ladefoged, P. American English, The Handbookof the International Phonetic Association, Cam-bridge University Press, Cambridge, 41–44, (1999).https://dx.doi.org/10.1017/s0952675700003894
33 Larson, P. L., and Hamlet, S. L. Coarticulation effects onthe nasalization of vowels using nasal/voice amplitude ratioinstrumentation, The Cleft Palate Journal, 24 (4), 286–290,(1987).
34 Lienard, J. S. and Di Benedetto, M. G. Effect of vo-cal effort on spectral properties of vowels, Journal of theAcoustical Society of America, 106 (1), 411–422, (1999).https://dx.doi.org/10.1121/1.428140
35 Lindblom B. Explaining phonetic variation: A sketch of theH & H theory, in Speech Production and Perception, W. J.Hardcastle, A. Marchal (eds), Kluwer, Dordrecht, 403–439,(1990). https://dx.doi.org/10.1007/978-94-009-2037-8 16
36 Lisker, L., and Abramson, A. S. A cross-languagestudy of voicing in initial stops: acousticalmeasurements, Word, 20 (3), 384–422, (1964).https://dx.doi.org/10.1080/00437956.1964.11659830
37 Liu C. and Kewley-Port, D. Vowel formant discrimi-nation for high-fidelity speech, Journal of the Acous-tical Society of America, 116 (2), 1224–1233, (2004).https://dx.doi.org/10.1121/1.1768958
38 Louekari L. Charismatic communication style inknowledge-intensive organizations, MA thesis, Schoolof Business, Aalto University, Finland, (2015).
39 Miet, G., Gerrits, A., and Valiere, J. C. Low-band extensionof telephone band speech, Proc. IEEE Int. Conf. on Acous-tics, Speech and Signal Processing, Edinburgh, Scotland,(2000). https://dx.doi.org/10.1109/icassp.2000.862116
40 Mortensen, K. W. The laws of charisma: how to captivate,inspire, and influence for maximum success: how to capti-vate, inspire, and influence for maximum success, Amacom,New York, (2011).
41 Niebuhr, O. Rich reduction: sound-segment residuals andthe encoding of communicative functions along the hypo-hyper scale, Proc. 7th Tutorial & Research Workshop onExperimental Linguistics, St. Petersburg, Russia, (2016).
42 Niebuhr, O., Voße, J., and Brem, A. What makesa charismatic speaker? A computer-based acoustic-prosodic analysis of Steve Jobs tone of voice, Com-puters in Human Behaviour, 64, 366–382, (2016).https://dx.doi.org/10.1016/j.chb.2016.06.059
43 Niebuhr, O., Brem, A., and Novak-Tot, E. Prosodic con-structions of charisma in business speeches — A contrastiveacoustic analysis of Steve Jobs and Mark Zuckerberg, Proc.8th International Conference of Speech Prosody, Boston,USA, (2016).
354 International Journal of Acoustics and Vibration, Vol. 24, No. 2, 2019
O. Niebuhr, et al.: DO SOUND SEGMENTS CONTRIBUTE TO SOUNDING CHARISMATIC? EVIDENCE FROM A CASE STUDY OF STEVE JOBS’. . .
44 Niebuhr, O. Clear speech — mere speech? How seg-mental and prosodic speech reduction shape the im-pression that speakers create on listeners, Proc. 18thInterspeech Conference, Stockholm, Sweden, (2017).https://dx.doi.org/10.21437/interspeech.2017-28
45 Niebuhr O., Thumm J., and Michalsky J. Shapesand timing in charismatic speech - Evidence fromsounds and melodies, Proc. 9th International Con-ference of Speech Prosody, Poznan, Poland, (2018).https://dx.doi.org/10.21437/speechprosody.2018-118
46 Novak-Tot, E., Niebuhr, O., and Chen, A. A gender bias inthe acoustic-melodic features of charismatic speech? Proc.18th Interspeech Conference, Stockholm, Sweden, (2017).https://dx.doi.org/10.21437/interspeech.2017-1349
47 Olsen, R. M., Olsen, M. L., Stanley, J. A., Renwick,M., and Kretzschmar, W. A. Methods for transcrip-tion and forced alignment of a legacy speech corpus,Proc. ASA Meetings on Acoustics, 30 (1), 1–13, (2017).https://dx.doi.org/10.1121/2.0000559
48 Peterson, G, and Barney, H. Control methods usedin a study of the vowels, Journal of the Acous-tical Society of America, 24 (2), 175–184, (1952).https://dx.doi.org/10.1121/1.1906875
49 Pickett, J. M. The Sounds of speech communication: Aprimer of acoustic phonetics and speech perception, Uni-versity Park Press, Baltimore, (1980).
50 Ramus, F., Nespor, M., and Mehler, J. Correlates ofLinguistic Rhythm in the Speech Signal, Cognition,73, 265–292, (1999). https://dx.doi.org/10.1016/s0010-0277(99)00058-x
51 Reddy, S., and Stanford, J. Toward completely au-tomated vowel extraction: introducing DARLA,Linguistics Vanguard, 1 (1), 15–28, (2015).https://dx.doi.org/10.1515/lingvan-2015-0002
52 Reetz, H., and Jongman, A. Phonetics: transcription, pro-duction, acoustics, and perception, Blackwell, Oxford,(2009).
53 Rosenberg A., and Hirschberg, J. Charisma perception fromtext and speech, Speech Communication, 51 (7), 640–655,(2009). https://dx.doi.org/10.1016/j.specom.2008.11.001
54 Rusli, E. M. Facebook to hold developer conference onApril 30, The Wall Street Journal, (2014). Retrieved fromhttp://blogs.wsj.com/digits/2014/03/08/facebook-to-hold-f8-developer-conference-on-april-30/, (Accessed February4, 2016).
55 Samlowski, B., Kern, F., and Trouvain, J. Perceptionof Suspense in Live Football Commentaries from Ger-man and British Perspectives, Proc. 9th InternationalConference of Speech Prosody, Poznan, Poland, (2018).https://dx.doi.org/10.21437/speechprosody.2018-8
56 Schotz S. Perception, analysis, and synthesis of speakerage, PhD thesis, Lund University, Sweden, (2006).
57 Schlender, B. and Tetzeli, R. Becoming Steve Jobs, NewYork, Crown, (2015).
58 Smiljanic R., and Bradlow, A. R. Production and percep-tion of clear speech in Croatian and English, Journal of theAcoustic Society of America, 118 (3), 1677–1688, (2005).https://dx.doi.org/10.1121/1.2000788
59 Sørensen, L. S. How to grow an Apple: did Steve Jobs speakApple to success?, MA thesis, Aarlborg University, Den-mark, (2013).
60 Stevens, K. N. Acoustic phonetics, MIT Press, Cambridge,(1998).
61 Strangert, E. and Gustafson, J. What makes a good speaker?subject ratings, acoustic measurements and perceptual eval-uations, Proc. 9th International Interspeech Conference,Brisbane, Australia, (2008).
62 Sundermeier, J. How does hubris influence the innovationactivities of company founders? Proc. Babson Confer-ence Entrepreneurship Research Conference, Bodø, Nor-way, (2016).
63 Sutter, J. D. When it comes to presentation, MarkZuckerberg is no Steve Jobs, (2011). Retrieved fromhttp://edition.cnn.com, (Accessed December 28, 2018).
64 Tobak, S. Charisma: an obsolete leadershipquality, CBS News, (2012). Retrieved fromhttp://www.cbsnews.com/news/charisma-an-obsolete-leadership-quality/, (Accessed December 28, 2018)
65 Touati, P. Prosodic aspects of political rhetoric, Proc. ESCAWorkshop on Prosody, Lund, Sweden, (1993).
66 Traunmuller, H. and Eriksson, A. Acoustic effects of varia-tion in vocal effort by men, women, and children, Journalof the Acoustical Society of America, 107 (6), 3438–3451,(2000). https://dx.doi.org/10.1121/1.429414
67 van Bergem D. R. Acoustic vowel reduction as afunction of sentence accent, word stress, and wordclass, Speech Communication, 12 (1), 1–23, (1993).https://dx.doi.org/10.1016/0167-6393(93)90015-d
68 Weirich, M., Fuchs, S., Simpson, A., Winkler, R., andPerrier, P. Mumbling: macho or morphology?, Journalof Speech, Language, and Hearing Research, 59, S1587–S1595, (2016). https://dx.doi.org/10.1044/2016 jslhr-s-15-0040
69 Weninger, F., Krajewski, J., Batliner, A., and Schuller,B. The voice of leadership: Models and performancesof automatic analysis in online speeches, IEEE Transac-tions on Affective Computing, 3 (4), 496–508, (2012).https://dx.doi.org/10.1109/t-affc.2012.15
70 Wright, R. Factors of lexical competition in vowelarticulation, in Papers in Laboratory PhonologyVI, Local J., Ogden R., Temple R. (eds), Cam-bridge University Press, Cambridge, 75–86, (2004).https://dx.doi.org/10.1017/cbo9780511486425.005
71 Xu, M., Homae, F., Hashimoto, R., and Hagiwara, H.Acoustic cues for the recognition of self-voice and other-voice, Frontiers in Psychology, 4 (735), 1–7, (2013).https://dx.doi.org/10.3389/fpsyg.2013.00735
International Journal of Acoustics and Vibration, Vol. 24, No. 2, 2019 355