do regulated microfinance institutions achieve better sustainability and outreach? cross-country...
TRANSCRIPT
This article was downloaded by: [University of Nebraska, Lincoln]On: 26 August 2013, At: 04:41Publisher: RoutledgeInforma Ltd Registered in England and Wales Registered Number: 1072954 Registered office: Mortimer House,37-41 Mortimer Street, London W1T 3JH, UK
Applied EconomicsPublication details, including instructions for authors and subscription information:http://www.tandfonline.com/loi/raec20
Do regulated microfinance institutions achieve bettersustainability and outreach? Cross-country evidenceValentina Hartarska a & Denis Nadolnyak ba Department of Agricultural Economics and Rural Sociology, 210 Comer Hall, AuburnUniversity, Auburn, AL 36830, USAb Department of Agricultural and Applied Economics, University of Georgia, Athens, GA30602-6755, Georgia, USAPublished online: 04 Apr 2011.
To cite this article: Valentina Hartarska & Denis Nadolnyak (2007) Do regulated microfinance institutions achieve bettersustainability and outreach? Cross-country evidence, Applied Economics, 39:10, 1207-1222, DOI: 10.1080/00036840500461840
To link to this article: http://dx.doi.org/10.1080/00036840500461840
PLEASE SCROLL DOWN FOR ARTICLE
Taylor & Francis makes every effort to ensure the accuracy of all the information (the “Content”) containedin the publications on our platform. However, Taylor & Francis, our agents, and our licensors make norepresentations or warranties whatsoever as to the accuracy, completeness, or suitability for any purpose of theContent. Any opinions and views expressed in this publication are the opinions and views of the authors, andare not the views of or endorsed by Taylor & Francis. The accuracy of the Content should not be relied upon andshould be independently verified with primary sources of information. Taylor and Francis shall not be liable forany losses, actions, claims, proceedings, demands, costs, expenses, damages, and other liabilities whatsoeveror howsoever caused arising directly or indirectly in connection with, in relation to or arising out of the use ofthe Content.
This article may be used for research, teaching, and private study purposes. Any substantial or systematicreproduction, redistribution, reselling, loan, sub-licensing, systematic supply, or distribution in anyform to anyone is expressly forbidden. Terms & Conditions of access and use can be found at http://www.tandfonline.com/page/terms-and-conditions
Applied Economics, 2007, 39, 1207–1222
Do regulated microfinance
institutions achieve better
sustainability and outreach?
Cross-country evidence
Valentina Hartarska*,a and Denis Nadolnyakb
aDepartment of Agricultural Economics and Rural Sociology, 210 Comer
Hall, Auburn University, Auburn, AL 36830, USAbDepartment of Agricultural and Applied Economics, University of Georgia,
Athens, GA 30602-6755, Georgia, USA
In spite of increasing pressure on microfinance institutions (MFIs)
operating in developing countries to transform into regulated financial
intermediaries, to date, no study has investigated whether regulated MFIs
actually achieve better financial results and reach more poor clients than
nonregulated MFIs. This article explores the impact of regulation on MFI
performance using newly released data for 114 MFIs from 62 countries
in an empirical model where performance is specified as a function of
MFI-specific, regulatory, macroeconomic and institutional variables.
Consistent with recent cross-country evidence on the impact of banking
regulations on bank performance (Barth et al., 2004), this article finds that
regulatory involvement does not directly affect performance either in terms
of operational self-sustainability or outreach. The article also finds that
less leveraged MFIs have better sustainability. The policy implication is
that MFIs’ transformation into regulated financial institutions is may not
lead to improved financial results and outreach. However, the finding that
MFIs collecting savings reach more borrowers suggests that there may be
indirect benefits from regulation, if regulation is the only way for MFIs to
access savings.
I. Introduction
Microfinance institutions (MFIs) provide loans and
other financial services to the entrepreneurial poor in
developing countries. Unlike development banks in
the past, however, MFIs take a market approach to
lending and aim to serve the poor on a sustainable
basis. MFIs use innovative lending technologies, such
as group lending and individual noncollateralized
loans with gradual increase in loan size conditional
on repayment, and charge market-based interest rates
to compensate for the high screening, monitoring and
contract enforcement costs. MFIs are organized as
microfinance banks, NGOs and non-bank financial
institutions. Unlike financial institutions, which are
subject to entry and prudential regulation, MFIs can
be unregulated or regulated, whereby regulation can
be in the form of entry restrictions and/or some
*Corresponding author. E-mail: [email protected]
Applied Economics ISSN 0003–6846 print/ISSN 1466–4283 online � 2007 Taylor & Francis 1207http://www.tandf.co.uk/journalsDOI: 10.1080/00036840500461840
Dow
nloa
ded
by [
Uni
vers
ity o
f N
ebra
ska,
Lin
coln
] at
04:
41 2
6 A
ugus
t 201
3
prudential supervision. This article explores the
differences in performance between regulated and
unregulated MFIs using new data available from theMIXMARKET database with the objective to
establish whether the performance or MFIs is
enhanced by regulatory involvement.Understanding whether and how the performance
of the two types of MFIs differs, is timely and
important because many nonregulated MFIs areconsidering transforming themselves into regulated
financial institutions, mostly because regulated MFIs
are allowed to collect deposits and increase theirloanable funds (Campion and White, 1999). In the
absence of a license to collect deposits, MFIs leverage
donated resources by borrowing from formal finan-cial institutions, large institutional or individual
investors and, in some special circumstances, by
collecting limited savings (Dowla and Alamgir, 2003).The experience of development banks shows,
however, that government involvement may not
always be appropriate. In the 1980s, heavily regulateddevelopment banks employed price (interest rate) and
quantity (targeted credit) controls to achieve social
targets such as redistribution of income in favour ofsmall producers, promotion of technology adoption
and the elimination of moneylenders who charge
‘predatory’ interest rates. Regulator’s involvement inregulating credit, such as India’s Integrated Rural
Development Program (IRDP) and Philippines’s
targeted credit programmes in the early 1980s, notonly failed to achieve its objectives but also under-
mined the development of rural financial markets and
led to adverse income redistribution (Gonzalez-Vega,1977; Adams et al., 1984). More recent evidence
shows that traditional informal credit markets areaffected by the presence of formal MFIs and under-
scores the need to better understand the impact of
regulatory involvement in microfinance on the overallrural credit market (Sarmishta, 2002).
Practitioners also worry about the impact of
regulation on the poverty alleviation mission
(Dichter, 1997). Regulatory involvement may leadto a ‘mission drift’ if demands to fulfill regulatory
requirements (e.g. capital adequacy) divert attention
away from serving the poor (e.g. by shifting the focusfrom serving poor clients to serving wealthier
borrowers to improve capital adequacy ratios) andmay hold back innovation in lending technology that
has been the driving force behind MFIs’ ability to
expand outreach and serve poor clients. Summarystatistics reported by the MicroBanking Bulletin
No. 10 show that regulated MFIs serve wealthier
borrowers.1
Understanding how regulation affects performancematters because the costs of designing and enforcing
regulatory policies to address the specific challenges
of microfinance are substantial. For example, a recentstudy on Ghana shows that the regulation was costly
relative to the potential impact that it might have had
on the financial system (Steel and Andah, 2003).However, some microfinance practitioners argue
that, in some Latin American countries, the benefits
may exceed the costs of regulation (Theodore andLoubiere, 2002). Indeed, the experience of a few
successful MFIs (e.g. Caja de Ahorro y Prestamo Los
Andes in Bolivia, Banco ADEMI in the DominicanRepublic and Finansol in Colombia) has been
well documented but policy recommendations
based on these case studies on Latin Americamay not be universally appropriate because, the
successful transformation may depend on theenabling environment in the individual country
(Cuevas, 1996).The contribution of this article is that it is the first
to adopt a positive approach and study whetherregulated MFIs achieve better outreach and sustain-
ability than nonregulated MFIs, while controlling for
the diverse environments in which these institutionsoperate. The cross-country approach captures the
impact of the environment as studies have found that
the quality of institutions affects economic growth(Assane and Grammy, 2003). Moreover, recent
empirical studies show that, while regulatory power
has no impact on bank performance and valuation,an institutional environment supportive of private
sector supervision of banks has a positive impact(Barth et al., 2004).
In this article, performance in terms of outreach
and operational self-sustainability is specified as a
function of regulatory status, MFI specific factorsand country specific institutional and macroeconomic
factors. The analysis uses panel data and, since
regulatory status is time-invariant and since the fixedeffects model does not permit time-constant explana-
tory variables, the random effects model seems to be
the appropriate technique. However, the unobservedindividual effects are found to be correlated with
some explanatory variables, thus violating theassumptions of the random effects model. To address
this problem, the empirical analysis uses a modifica-
tion of the random effects model proposed byHausman and Taylor (1981).
1 The regulated MFIs’ coefficient of depth of outreach measured by the average outstanding loan balance divided by the GNIper capita is 117%, while the coefficient for nonregulated MFIs is 63.4%.
1208 V. Hartarska and D. Nadolnyak
Dow
nloa
ded
by [
Uni
vers
ity o
f N
ebra
ska,
Lin
coln
] at
04:
41 2
6 A
ugus
t 201
3
The results show that regulatory status has nodirect impact on MFI performance. This result doesnot change even when regulatory power is usedinstead of regulatory status. However, the resultsindicate that outreach is affected by the level ofdeposits (savings), suggesting indirect effect ofregulation on outreach if regulation is the only wayfor MFIs to attract savings.
The rest of the article is organized as follows:Section II provides brief overview of MFI regulationsin practice, Section III describes the conceptualframework, Section IV describes the empiricalmodel, Section V describes the data, Section VIdiscusses the results and Section VII concludes.
II. Brief Overview of MFI Regulations inPractice
Most previous studies discuss the transformation of aparticular MFI into a regulated institution, such asthe transformation of Bolivian PRODEM intoBancoSol (Rhyne, 2001). Some studies focus on theexperience of an individual country or group ofcountries with MFI regulation. A recent survey ofthis case study literature is provided by Arun (2005)and Brau and Woller (2005).
The consensus of normative research and ofmicrofinance practitioners is that deposit-takinginstitutions should be subject to prudential regula-tion, while those that do not collect deposits from thepublic but operate with private donations instead,should not (Chaves and Gonzalez-Vega, 1994).Indeed, a lack of regulation of deposit takingmicrofinance institutions is very costly. InBangladesh, many poor people lost their savingsdue to the incompetence and fraud of little knownunregulated institutions (Wright, 2000). MFIs fallingin between the deposit-taking and donor-funded onlycategories should have some form of tiered regula-tion, with licensing and monitoring linked to thesources of funds and the clients served (Van Greuninget al., 1999; Hardy et al., 2003).
In most countries, typical banking regulations donot cover microfinance activities. Changes in
regulations and laws that accommodate microfinanceactivities usually result from active promotion bylarge microfinance networks such as ACCIONInternational operating mainly in Latin America orwhen the MFI sector becomes more visible and thusdraws the attention of the regulator.
The lack of regulations has had both positive andnegative consequences. Noninvolvement by the reg-ulators makes establishing and operating an MFIeasier. This is exactly what ‘immensely’ helped MFIsin some Latin American Countries in their earlystages and helped create the sector (Christen andRosenberg, 2000). On the other hand, regulatoryambiguity leaves MFI vulnerable to regulatorydiscretion in the interpretation of the legal basisfor lending activity, as in the case of Russia(Safavian, et al. 2000).
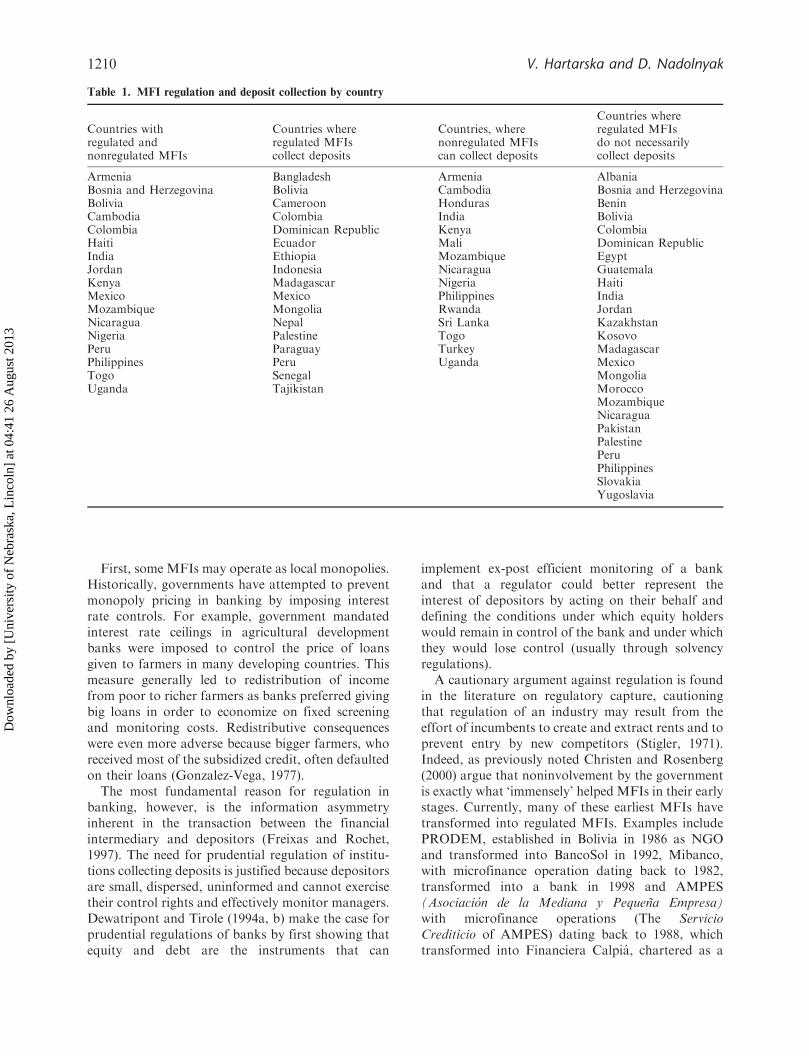
Currently, MFIs can operate as regulated ornonregulated or, in some countries, can choosebetween being regulated and being unregulated.Overall, MFIs can be subject to either mandatoryentry regulation, prudential regulation, or some sortof entry regulation and consequent monitoring (tieredregulation). Table 1 provided four lists of countriesby the state of their MFI regulation – countries whereMFI can be regulated or nonregulated, countrieswhere regulated MFIs collect deposits, countrieswhere unregulated MFIs can collect savings and alist of countries where MFIs are regulated but do notnecessarily collect deposits.
III. Conceptual Framework and EmpiricalSpecifications
The level of government involvement in the govern-ance of financial intermediaries is significant andbanking regulations exist in any country that has abanking sector. From a public policy perspective,regulation is justified by market failure arising fromasymmetric information, market power and negativeexternalities (Freixas and Rochet, 1997). The first twoarguments are most relevant to regulation inmicrofinance.2
2 Financial intermediaries are also subject to externalities. Contagious bank runs occur when the failure of one bank imposes anegative externality on other banks and jeopardizes the safety of the payment system. Some MFIs provide payment facilitiesand may potentially create a negative externality but the relevant empirical question is to what extent a small MFI operatingin a niche market represents a threat to the payment system of a country and is this threat large enough to justify the costs ofregulation. Solvency regulations prevent the impact of negative externality (Diamond and Dybvig, 1983). Solvencyregulations, however, rely on the quality of collateral to classify loan risk. Most MFIs, instead of collateral, use group loansand the promise of larger loan size to motivate repayment. This suggests substantial regulation design cost as regulation ofmicrofinance activity needs to be tailored to the MFIs’ peculiarities. Wright (2000) argues that microfinance has not yetachieved the market penetration necessary to cause systemic risk in the financial system.
Regulation of microfinance institutions 1209
Dow
nloa
ded
by [
Uni
vers
ity o
f N
ebra
ska,
Lin
coln
] at
04:
41 2
6 A
ugus
t 201
3
First, some MFIs may operate as local monopolies.Historically, governments have attempted to preventmonopoly pricing in banking by imposing interestrate controls. For example, government mandatedinterest rate ceilings in agricultural developmentbanks were imposed to control the price of loansgiven to farmers in many developing countries. Thismeasure generally led to redistribution of incomefrom poor to richer farmers as banks preferred givingbig loans in order to economize on fixed screeningand monitoring costs. Redistributive consequenceswere even more adverse because bigger farmers, whoreceived most of the subsidized credit, often defaultedon their loans (Gonzalez-Vega, 1977).
The most fundamental reason for regulation inbanking, however, is the information asymmetryinherent in the transaction between the financialintermediary and depositors (Freixas and Rochet,1997). The need for prudential regulation of institu-tions collecting deposits is justified because depositorsare small, dispersed, uninformed and cannot exercisetheir control rights and effectively monitor managers.Dewatripont and Tirole (1994a, b) make the case forprudential regulations of banks by first showing thatequity and debt are the instruments that can
implement ex-post efficient monitoring of a bankand that a regulator could better represent theinterest of depositors by acting on their behalf anddefining the conditions under which equity holderswould remain in control of the bank and under whichthey would lose control (usually through solvencyregulations).
A cautionary argument against regulation is foundin the literature on regulatory capture, cautioningthat regulation of an industry may result from theeffort of incumbents to create and extract rents and toprevent entry by new competitors (Stigler, 1971).Indeed, as previously noted Christen and Rosenberg(2000) argue that noninvolvement by the governmentis exactly what ‘immensely’ helped MFIs in their earlystages. Currently, many of these earliest MFIs havetransformed into regulated MFIs. Examples includePRODEM, established in Bolivia in 1986 as NGOand transformed into BancoSol in 1992, Mibanco,with microfinance operation dating back to 1982,transformed into a bank in 1998 and AMPES(Asociacion de la Mediana y Pequena Empresa)with microfinance operations (The ServicioCrediticio of AMPES) dating back to 1988, whichtransformed into Financiera Calpia, chartered as a
Table 1. MFI regulation and deposit collection by country
Countries withregulated andnonregulated MFIs
Countries whereregulated MFIscollect deposits
Countries, wherenonregulated MFIscan collect deposits
Countries whereregulated MFIsdo not necessarilycollect deposits
Armenia Bangladesh Armenia AlbaniaBosnia and Herzegovina Bolivia Cambodia Bosnia and HerzegovinaBolivia Cameroon Honduras BeninCambodia Colombia India BoliviaColombia Dominican Republic Kenya ColombiaHaiti Ecuador Mali Dominican RepublicIndia Ethiopia Mozambique EgyptJordan Indonesia Nicaragua GuatemalaKenya Madagascar Nigeria HaitiMexico Mexico Philippines IndiaMozambique Mongolia Rwanda JordanNicaragua Nepal Sri Lanka KazakhstanNigeria Palestine Togo KosovoPeru Paraguay Turkey MadagascarPhilippines Peru Uganda MexicoTogo Senegal MongoliaUganda Tajikistan Morocco
MozambiqueNicaraguaPakistanPalestinePeruPhilippinesSlovakiaYugoslavia
1210 V. Hartarska and D. Nadolnyak
Dow
nloa
ded
by [
Uni
vers
ity o
f N
ebra
ska,
Lin
coln
] at
04:
41 2
6 A
ugus
t 201
3
regulated financial intermediary by the Central Bankin 1995.
The current push for commercialization andregulation of MFIs is not justified by cross-countrystudies but is based on the positive experience oftransformed incumbents. Thus, it ignores potentialpitfalls suggested by the literature on regulatorycapture, namely that established MFI networks maypromote regulation to prevent entry by futurecompetitors or limit their access to donor funds andsocially responsible equity investments. Moreover,although some specific organizations have beensuccessful both prior to and after becoming regulated,recent theoretical work has pointed out that competi-tion has changed the landscape of microfinance andthat donor support only for commercializedand regulated MFIs may be misguided (McIntoshand Widyck, 2005).
Since MFIs are heterogeneous and in most casesmission driven, establishing how regulation andstakeholder control influence their outreach missionis also important. Additional insight of the factorsthat may influence performance of MFIs come froma model that explores the possibility of matchingmanagers and principals in mission-driven organiza-tions such as MFIs, developed by Besley and Ghatak(2004). The authors show that a mission drift canoccur as a result of competition for donations.Donors, therefore, would be willing to support anMFI if they are assured that the original mission willbe maintained. The non profit status of an organiza-tion may reinforce mission credibility. This modelpredicts that managers would perform better inorganizations with large endowments as they areless likely to be forced to adjust their mission toattract donations. The model also predicts thatcompetition among mission-driven organizationsimproves efficiency because it improves matchingbetween donors and managers and thus improvesmanagers’ incentives.
Empirical model
Empirical analysis of bank performance usuallyspecifies performance as a function of bank specificvariables, macroeconomic and institutional factorsand regulatory framework (Barth et al., 2003;Demirguc-Kunt et al., 2004). Following these studiesthe empirical model is:
Pit ¼ constantþ�Ritþ� 0MSitþ� 0Mitþ ciþuit ð1Þ
where Pit is a performance variable for MFI i at timet; Rit captures the impact of regulation; MSit is avector of MFI specific variables; Mit are
macroeconomic country-specific variables, ci is the
MFI’s individual unobserved effect and uit is an error
term.Since the empirical analysis uses panel data, the
first step is to determine what empirical estimation
technique (usually fixed or random effects) is most
appropriate. A major shortcoming of the fixed effect
model is that it cannot accommodate time invariant
variables. The main policy variable of interest is
regulatory status and, although it can change from
nonregulated to regulated, for a span of time it is
fixed. With regulatory status time invariant, a
random effect model seems to be the only choice.
The standard random choice model, however, is
restrictive because it assumes that the explanatory
variables (in this case Rit, MSit and Mit) are
uncorrelated with the unobserved MFI heterogeneity
term ci; that is, it assumes that Eðci=xil, . . . , xiTÞ ¼EðciÞ or CovðxitciÞ ¼ 0. This is a very strong assump-
tion but, fortunately, it can be tested.In microeconometric applications, the unobserved
firm heterogeneity ci means unobserved firm char-
acteristics such as managerial quality or firm struc-
ture. Regulatory status, control rights and the other
explanatory variables, however, may be correlated
with managerial ability. Managers may choose to
work for (un)regulated MFI depending on their
preferences for independence, desire and ability to
implement microfinance innovations. For example,
an independent-minded manager may choose not to
work for a regulated institution as regulatory
requirements may curb his/her ability to innovate.
The significant heterogeneity of MFIs actually
suggests that managerial quality is probably corre-
lated with MFI characteristics including regulatory
status. Empirically, a Hausman test is used to
determine whether this proposition is true and the
test indicates that the random effects model assump-
tions do not hold.A solution to this problem was proposed by
Hausman and Taylor (1981) who studied the impact
of education on wages using panel data in which, for
a short period of time, education is fixed. Using their
framework, Equation (8) can be rewritten as
yit ¼ zi� þ xit�þ ci þ "it ð2Þ
where xit displays some time variation and zi includes
time invariant variables as well as unity (for
convenience). Hausman and Taylor showed that, by
partitioning these variables into endogenous and
exogenous sets (that is correlated and not correlated
with ci) and transforming the regression using
deviations from the mean, one can consistently
estimate the parameters with the GLS technique.
Regulation of microfinance institutions 1211
Dow
nloa
ded
by [
Uni
vers
ity o
f N
ebra
ska,
Lin
coln
] at
04:
41 2
6 A
ugus
t 201
3
This technique requires that the number ofexogenous time-variant variables be at least aslarge as the number of endogenous time-invariantvariables. In addition, there needs to be sufficientcorrelation between the endogenous time-invariantvariables and the instruments obtained in theprocess.
IV. Data
Traditionally, MFIs have been extremely reluctant toreveal performance information even though they usepublic funds, but increased competition for donorfunds has brought about positive changes. Theempirical analysis utilizes data collected by the MIXMARKET information platform (www.mixmarke-t.org). To date, MIX MARKET contains the bestpublicly available cross-country data of individualmicrofinance institutions’ financial indicators.Through this information exchange platform indivi-dual MFI can provide financial and outreach dataand the MIXMARKET ranks these data for qualityusing a 5-star system, where 5 is the most completedata available, while 1 is the least complete dataavailable (usually the number of borrowers and someother outreach indicators but little financialinformation).
At the time of data collection, MIXMARKET had200 listed MFIs. The analysis utilizes only 4- and5-star ranked data – i.e. only data from auditedfinancial statements. There is no qualitative differ-ence between 4- and 5- ranked MFIs except that thosewith a rank of 5 have at least 3 years of financialstatements, while those with rank 4 have <3 years.Credit unions were excluded from the sample as theirgovernance mechanism and regulatory status arequite different. In addition, about 20 MFIs wereexcluded from the analysis due to the lack of data onthe institutional factors that may impact MFIperformance (i.e. lack of data for the instrumentsused to identify the impact of regulation). The panelused for this study consists of 114 MFIs from 62countries.
Table 2 provides information on the number ofobservations per country and how this representationcompares with the estimated population of MFIs inthese countries.3 The estimated population is the sum
of MFIs existing in each of the countries that fall inthe sample obtained from the Microcredit SummitProject, to date the most comprehensive source ofdata on number of MFIs and their outreach.4
Table 3 presents definition of dependent andindependent variables used in the analysis andinformation on the sources of the data for theinstruments. By definition, an MFI has a dualobjective: to cover its costs (self-sufficiency) andreach many poor borrowers (outreach). An MFI’sperformance in terms of self-sufficiency is measuredby operational self-sustainability (OSS), which mea-sures how well an MFI can cover its costs throughoperating revenues. This measure is the most widelyused indicator of financial performance becauseinstitutional diversity and industry accounting prac-tices make it harder to use other measures such asreturn to assets (ROA) or return to equity (ROE).For example, MFIs may not track their ROA andROE or may not make the necessary adjustments(including those for inflation, subsidy and interestrates below market level), which makes thesemeasures unsuitable for an industry-wide study.
The OSS does not account for the level of subsidiesfor operating expenses but measures a manager’sability to run the organization and to cover operatingcosts including possibly attracting soft funds. Thismeasure of performance is appropriate becauseprofits may not be what the providers of financewant. For example, Conning (1999) observes that‘outside lenders surely care about credible and hardbudget pledged cash flows and not about profits’(p. 75). Since panel data are used and since donorsmonitor MFIs’ OSS and can exercise long-termcontrol due to increased competition for donations,this article assumes that the OSS could serve as areasonable approximation of financial performanceof MFI.
Outreach is measured by the log of the number ofactive borrowers, that is, the number of individualsthat currently have an outstanding loan balance withthe MFI. Establishing the effect of regulation onoutreach is important because proponents of thetransformation have argued that regulated MFIscould reach more borrowers when their leverageopportunities improve as a result of regulation.
Table 4 presents the summary statistics of variablesused in the analysis. The time invariant endogenousexplanatory variables are RSTATUS, which is a
3 It is possible that only the best performing MFIs self-selected to report their data and selection bias can exist, although it isreasonable to assume that the regulated and nonregulated groups are proportionally represented.4 The Microcredit Summit Project focuses on outreach indicators such as the number of MFIs operating in a country and theirborrowers’ poverty level and gender distribution. Unfortunately, this project collected no or very limited financial data, suchas MFIs’ self-sufficiency, rendering the data unusable for evaluating the impact of regulation on the MFIs’ performance.
1212 V. Hartarska and D. Nadolnyak
Dow
nloa
ded
by [
Uni
vers
ity o
f N
ebra
ska,
Lin
coln
] at
04:
41 2
6 A
ugus
t 201
3
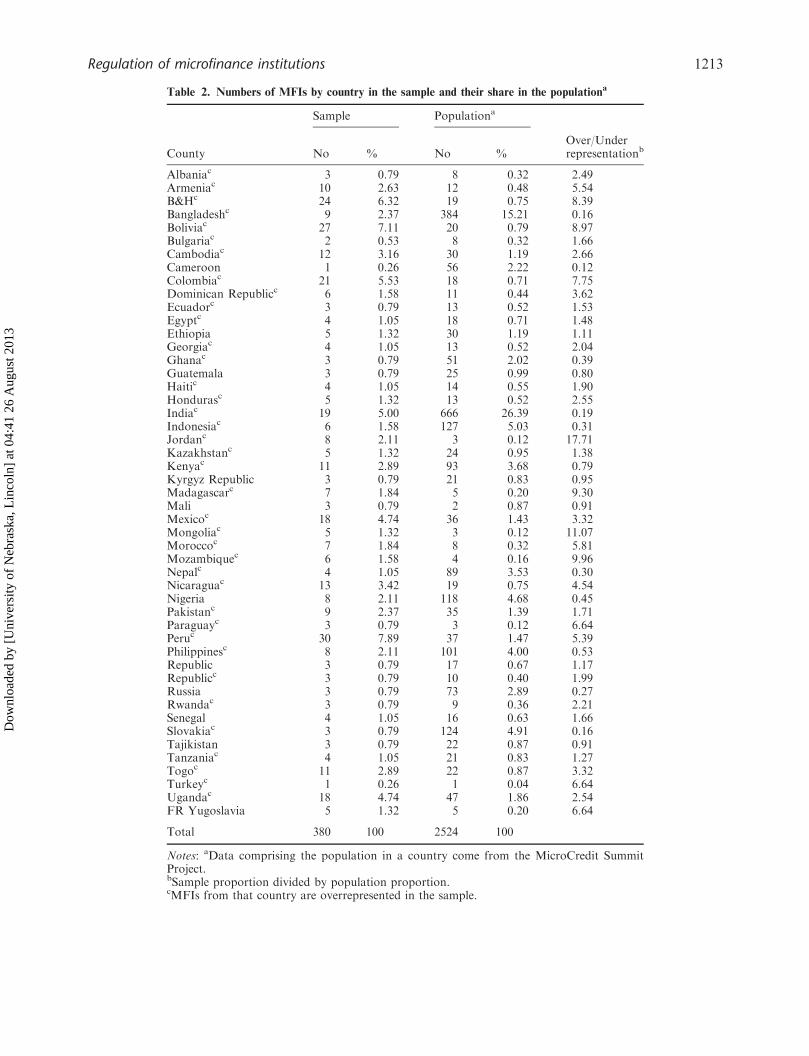
Table 2. Numbers of MFIs by country in the sample and their share in the populationa
Sample Populationa
County No % No %Over/Underrepresentationb
Albaniac 3 0.79 8 0.32 2.49Armeniac 10 2.63 12 0.48 5.54B&Hc 24 6.32 19 0.75 8.39Bangladeshc 9 2.37 384 15.21 0.16Boliviac 27 7.11 20 0.79 8.97Bulgariac 2 0.53 8 0.32 1.66Cambodiac 12 3.16 30 1.19 2.66Cameroon 1 0.26 56 2.22 0.12Colombiac 21 5.53 18 0.71 7.75Dominican Republicc 6 1.58 11 0.44 3.62Ecuadorc 3 0.79 13 0.52 1.53Egyptc 4 1.05 18 0.71 1.48Ethiopia 5 1.32 30 1.19 1.11Georgiac 4 1.05 13 0.52 2.04Ghanac 3 0.79 51 2.02 0.39Guatemala 3 0.79 25 0.99 0.80Haitic 4 1.05 14 0.55 1.90Hondurasc 5 1.32 13 0.52 2.55Indiac 19 5.00 666 26.39 0.19Indonesiac 6 1.58 127 5.03 0.31Jordanc 8 2.11 3 0.12 17.71Kazakhstanc 5 1.32 24 0.95 1.38Kenyac 11 2.89 93 3.68 0.79Kyrgyz Republic 3 0.79 21 0.83 0.95Madagascarc 7 1.84 5 0.20 9.30Mali 3 0.79 2 0.87 0.91Mexicoc 18 4.74 36 1.43 3.32Mongoliac 5 1.32 3 0.12 11.07Moroccoc 7 1.84 8 0.32 5.81Mozambiquec 6 1.58 4 0.16 9.96Nepalc 4 1.05 89 3.53 0.30Nicaraguac 13 3.42 19 0.75 4.54Nigeria 8 2.11 118 4.68 0.45Pakistanc 9 2.37 35 1.39 1.71Paraguayc 3 0.79 3 0.12 6.64Peruc 30 7.89 37 1.47 5.39Philippinesc 8 2.11 101 4.00 0.53Republic 3 0.79 17 0.67 1.17Republicc 3 0.79 10 0.40 1.99Russia 3 0.79 73 2.89 0.27Rwandac 3 0.79 9 0.36 2.21Senegal 4 1.05 16 0.63 1.66Slovakiac 3 0.79 124 4.91 0.16Tajikistan 3 0.79 22 0.87 0.91Tanzaniac 4 1.05 21 0.83 1.27Togoc 11 2.89 22 0.87 3.32Turkeyc 1 0.26 1 0.04 6.64Ugandac 18 4.74 47 1.86 2.54FR Yugoslavia 5 1.32 5 0.20 6.64
Total 380 100 2524 100
Notes: aData comprising the population in a country come from the MicroCredit SummitProject.bSample proportion divided by population proportion.cMFIs from that country are overrepresented in the sample.
Regulation of microfinance institutions 1213
Dow
nloa
ded
by [
Uni
vers
ity o
f N
ebra
ska,
Lin
coln
] at
04:
41 2
6 A
ugus
t 201
3
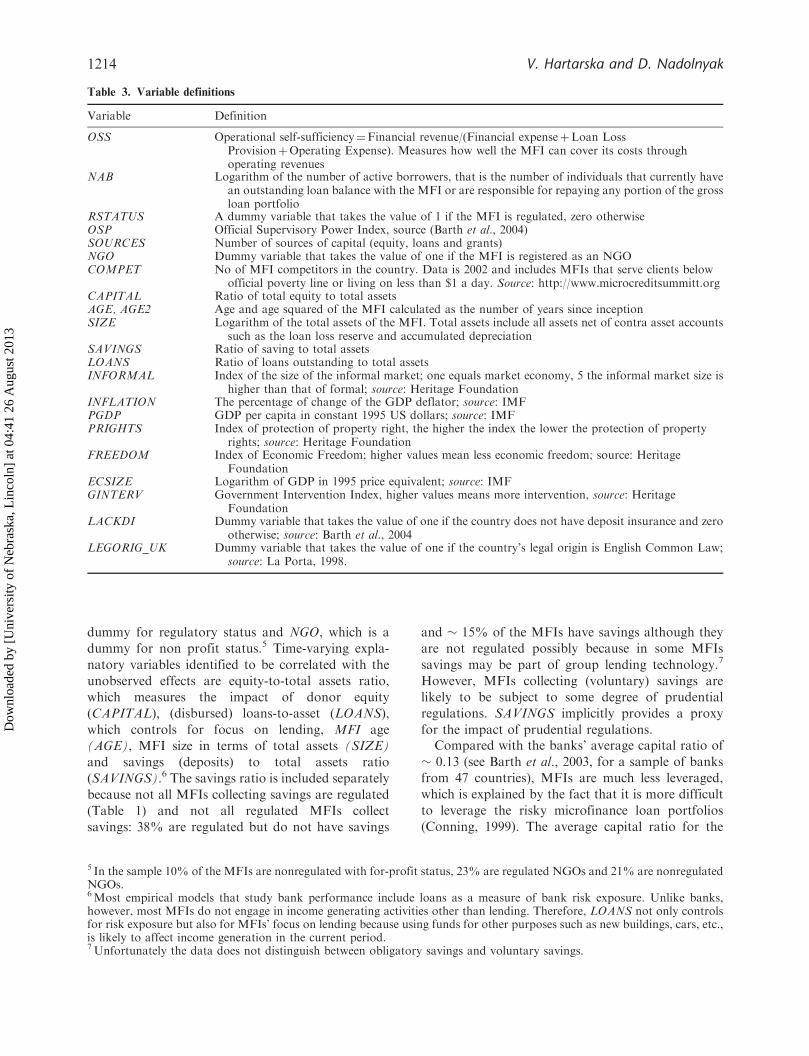
dummy for regulatory status and NGO, which is a
dummy for non profit status.5 Time-varying expla-
natory variables identified to be correlated with the
unobserved effects are equity-to-total assets ratio,
which measures the impact of donor equity
(CAPITAL), (disbursed) loans-to-asset (LOANS),
which controls for focus on lending, MFI age
(AGE), MFI size in terms of total assets (SIZE)
and savings (deposits) to total assets ratio
(SAVINGS).6 The savings ratio is included separately
because not all MFIs collecting savings are regulated
(Table 1) and not all regulated MFIs collect
savings: 38% are regulated but do not have savings
and � 15% of the MFIs have savings although they
are not regulated possibly because in some MFIs
savings may be part of group lending technology.7
However, MFIs collecting (voluntary) savings are
likely to be subject to some degree of prudential
regulations. SAVINGS implicitly provides a proxy
for the impact of prudential regulations.Compared with the banks’ average capital ratio of
� 0.13 (see Barth et al., 2003, for a sample of banks
from 47 countries), MFIs are much less leveraged,
which is explained by the fact that it is more difficult
to leverage the risky microfinance loan portfolios
(Conning, 1999). The average capital ratio for the
Table 3. Variable definitions
Variable Definition
OSS Operational self-sufficiency¼Financial revenue/(Financial expenseþLoan LossProvisionþOperating Expense). Measures how well the MFI can cover its costs throughoperating revenues
NAB Logarithm of the number of active borrowers, that is the number of individuals that currently havean outstanding loan balance with the MFI or are responsible for repaying any portion of the grossloan portfolio
RSTATUS A dummy variable that takes the value of 1 if the MFI is regulated, zero otherwiseOSP Official Supervisory Power Index, source (Barth et al., 2004)SOURCES Number of sources of capital (equity, loans and grants)NGO Dummy variable that takes the value of one if the MFI is registered as an NGOCOMPET No of MFI competitors in the country. Data is 2002 and includes MFIs that serve clients below
official poverty line or living on less than $1 a day. Source: http://www.microcreditsummitt.orgCAPITAL Ratio of total equity to total assetsAGE, AGE2 Age and age squared of the MFI calculated as the number of years since inceptionSIZE Logarithm of the total assets of the MFI. Total assets include all assets net of contra asset accounts
such as the loan loss reserve and accumulated depreciationSAVINGS Ratio of saving to total assetsLOANS Ratio of loans outstanding to total assetsINFORMAL Index of the size of the informal market; one equals market economy, 5 the informal market size is
higher than that of formal; source: Heritage FoundationINFLATION The percentage of change of the GDP deflator; source: IMFPGDP GDP per capita in constant 1995 US dollars; source: IMFPRIGHTS Index of protection of property right, the higher the index the lower the protection of property
rights; source: Heritage FoundationFREEDOM Index of Economic Freedom; higher values mean less economic freedom; source: Heritage
FoundationECSIZE Logarithm of GDP in 1995 price equivalent; source: IMFGINTERV Government Intervention Index, higher values means more intervention, source: Heritage
FoundationLACKDI Dummy variable that takes the value of one if the country does not have deposit insurance and zero
otherwise; source: Barth et al., 2004LEGORIG_UK Dummy variable that takes the value of one if the country’s legal origin is English Common Law;
source: La Porta, 1998.
5 In the sample 10% of the MFIs are nonregulated with for-profit status, 23% are regulated NGOs and 21% are nonregulatedNGOs.6Most empirical models that study bank performance include loans as a measure of bank risk exposure. Unlike banks,however, most MFIs do not engage in income generating activities other than lending. Therefore, LOANS not only controlsfor risk exposure but also for MFIs’ focus on lending because using funds for other purposes such as new buildings, cars, etc.,is likely to affect income generation in the current period.7Unfortunately the data does not distinguish between obligatory savings and voluntary savings.
1214 V. Hartarska and D. Nadolnyak
Dow
nloa
ded
by [
Uni
vers
ity o
f N
ebra
ska,
Lin
coln
] at
04:
41 2
6 A
ugus
t 201
3
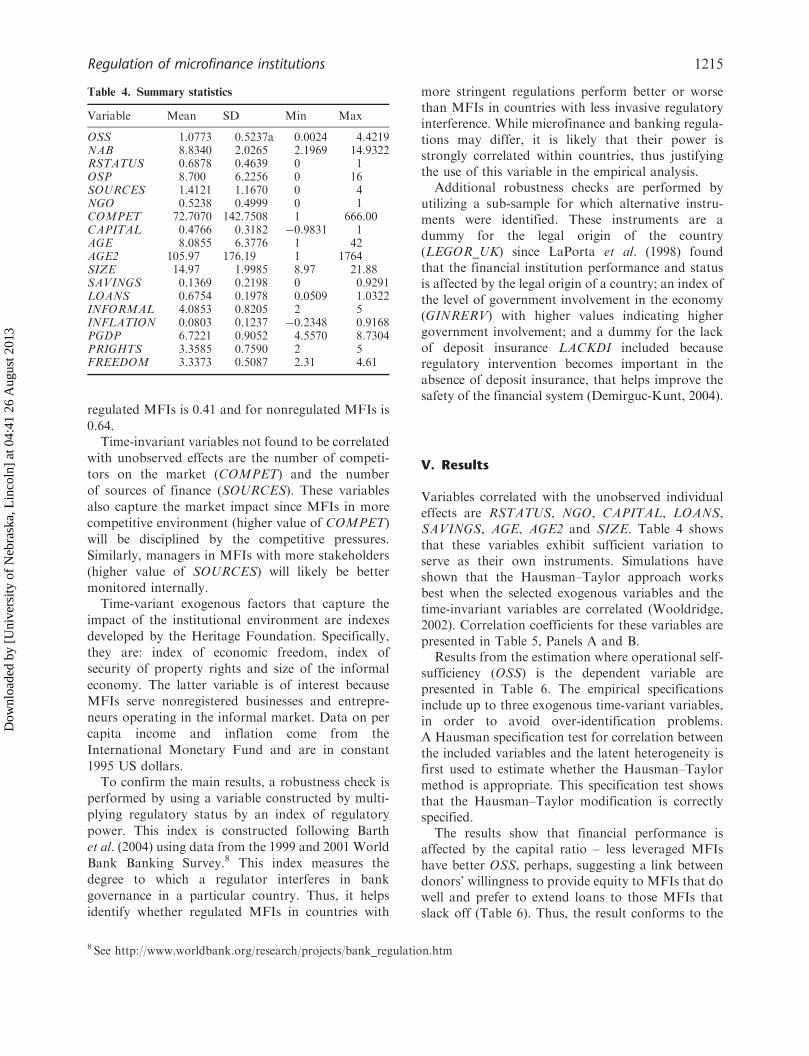
regulated MFIs is 0.41 and for nonregulated MFIs is
0.64.Time-invariant variables not found to be correlated
with unobserved effects are the number of competi-
tors on the market (COMPET) and the number
of sources of finance (SOURCES). These variables
also capture the market impact since MFIs in more
competitive environment (higher value of COMPET)
will be disciplined by the competitive pressures.
Similarly, managers in MFIs with more stakeholders
(higher value of SOURCES) will likely be better
monitored internally.Time-variant exogenous factors that capture the
impact of the institutional environment are indexes
developed by the Heritage Foundation. Specifically,
they are: index of economic freedom, index of
security of property rights and size of the informal
economy. The latter variable is of interest because
MFIs serve nonregistered businesses and entrepre-
neurs operating in the informal market. Data on per
capita income and inflation come from the
International Monetary Fund and are in constant
1995 US dollars.To confirm the main results, a robustness check is
performed by using a variable constructed by multi-
plying regulatory status by an index of regulatory
power. This index is constructed following Barth
et al. (2004) using data from the 1999 and 2001 World
Bank Banking Survey.8 This index measures the
degree to which a regulator interferes in bank
governance in a particular country. Thus, it helps
identify whether regulated MFIs in countries with
more stringent regulations perform better or worsethan MFIs in countries with less invasive regulatoryinterference. While microfinance and banking regula-tions may differ, it is likely that their power isstrongly correlated within countries, thus justifyingthe use of this variable in the empirical analysis.
Additional robustness checks are performed byutilizing a sub-sample for which alternative instru-ments were identified. These instruments are adummy for the legal origin of the country(LEGOR_UK) since LaPorta et al. (1998) foundthat the financial institution performance and statusis affected by the legal origin of a country; an index ofthe level of government involvement in the economy(GINRERV) with higher values indicating highergovernment involvement; and a dummy for the lackof deposit insurance LACKDI included becauseregulatory intervention becomes important in theabsence of deposit insurance, that helps improve thesafety of the financial system (Demirguc-Kunt, 2004).
V. Results
Variables correlated with the unobserved individualeffects are RSTATUS, NGO, CAPITAL, LOANS,SAVINGS, AGE, AGE2 and SIZE. Table 4 showsthat these variables exhibit sufficient variation toserve as their own instruments. Simulations haveshown that the Hausman–Taylor approach worksbest when the selected exogenous variables and thetime-invariant variables are correlated (Wooldridge,2002). Correlation coefficients for these variables arepresented in Table 5, Panels A and B.
Results from the estimation where operational self-sufficiency (OSS) is the dependent variable arepresented in Table 6. The empirical specificationsinclude up to three exogenous time-variant variables,in order to avoid over-identification problems.A Hausman specification test for correlation betweenthe included variables and the latent heterogeneity isfirst used to estimate whether the Hausman–Taylormethod is appropriate. This specification test showsthat the Hausman–Taylor modification is correctlyspecified.
The results show that financial performance isaffected by the capital ratio – less leveraged MFIshave better OSS, perhaps, suggesting a link betweendonors’ willingness to provide equity to MFIs that dowell and prefer to extend loans to those MFIs thatslack off (Table 6). Thus, the result conforms to the
Table 4. Summary statistics
Variable Mean SD Min Max
OSS 1.0773 0.5237a 0.0024 4.4219NAB 8.8340 2.0265 2.1969 14.9322RSTATUS 0.6878 0.4639 0 1OSP 8.700 6.2256 0 16SOURCES 1.4121 1.1670 0 4NGO 0.5238 0.4999 0 1COMPET 72.7070 142.7508 1 666.00CAPITAL 0.4766 0.3182 �0.9831 1AGE 8.0855 6.3776 1 42AGE2 105.97 176.19 1 1764SIZE 14.97 1.9985 8.97 21.88SAVINGS 0.1369 0.2198 0 0.9291LOANS 0.6754 0.1978 0.0509 1.0322INFORMAL 4.0853 0.8205 2 5INFLATION 0.0803 0.1237 �0.2348 0.9168PGDP 6.7221 0.9052 4.5570 8.7304PRIGHTS 3.3585 0.7590 2 5FREEDOM 3.3373 0.5087 2.31 4.61
8 See http://www.worldbank.org/research/projects/bank_regulation.htm
Regulation of microfinance institutions 1215
Dow
nloa
ded
by [
Uni
vers
ity o
f N
ebra
ska,
Lin
coln
] at
04:
41 2
6 A
ugus
t 201
3
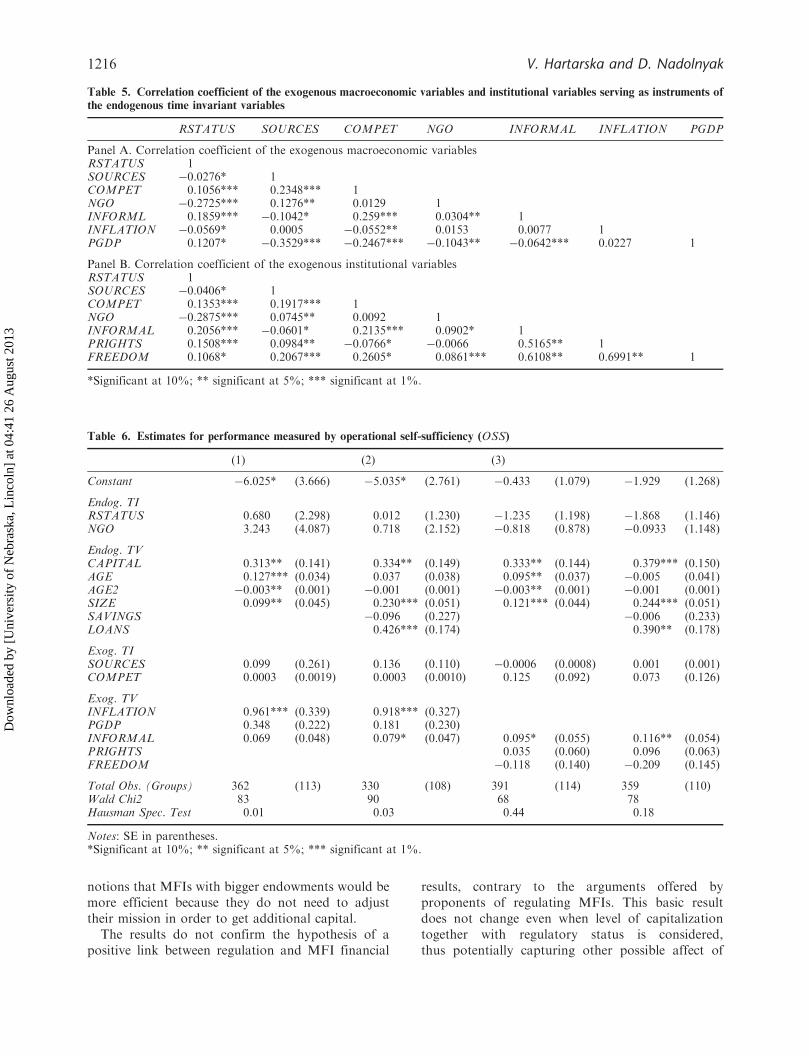
notions that MFIs with bigger endowments would bemore efficient because they do not need to adjusttheir mission in order to get additional capital.
The results do not confirm the hypothesis of apositive link between regulation and MFI financial
results, contrary to the arguments offered byproponents of regulating MFIs. This basic resultdoes not change even when level of capitalizationtogether with regulatory status is considered,thus potentially capturing other possible affect of
Table 6. Estimates for performance measured by operational self-sufficiency (OSS)
(1) (2) (3)
Constant �6.025* (3.666) �5.035* (2.761) �0.433 (1.079) �1.929 (1.268)
Endog. TIRSTATUS 0.680 (2.298) 0.012 (1.230) �1.235 (1.198) �1.868 (1.146)NGO 3.243 (4.087) 0.718 (2.152) �0.818 (0.878) �0.0933 (1.148)
Endog. TVCAPITAL 0.313** (0.141) 0.334** (0.149) 0.333** (0.144) 0.379*** (0.150)AGE 0.127*** (0.034) 0.037 (0.038) 0.095** (0.037) �0.005 (0.041)AGE2 �0.003** (0.001) �0.001 (0.001) �0.003** (0.001) �0.001 (0.001)SIZE 0.099** (0.045) 0.230*** (0.051) 0.121*** (0.044) 0.244*** (0.051)SAVINGS �0.096 (0.227) �0.006 (0.233)LOANS 0.426*** (0.174) 0.390** (0.178)
Exog. TISOURCES 0.099 (0.261) 0.136 (0.110) �0.0006 (0.0008) 0.001 (0.001)COMPET 0.0003 (0.0019) 0.0003 (0.0010) 0.125 (0.092) 0.073 (0.126)
Exog. TVINFLATION 0.961*** (0.339) 0.918*** (0.327)PGDP 0.348 (0.222) 0.181 (0.230)INFORMAL 0.069 (0.048) 0.079* (0.047) 0.095* (0.055) 0.116** (0.054)PRIGHTS 0.035 (0.060) 0.096 (0.063)FREEDOM �0.118 (0.140) �0.209 (0.145)
Total Obs. (Groups) 362 (113) 330 (108) 391 (114) 359 (110)Wald Chi2 83 90 68 78Hausman Spec. Test 0.01 0.03 0.44 0.18
Notes: SE in parentheses.*Significant at 10%; ** significant at 5%; *** significant at 1%.
Table 5. Correlation coefficient of the exogenous macroeconomic variables and institutional variables serving as instruments of
the endogenous time invariant variables
RSTATUS SOURCES COMPET NGO INFORMAL INFLATION PGDP
Panel A. Correlation coefficient of the exogenous macroeconomic variablesRSTATUS 1SOURCES �0.0276* 1COMPET 0.1056*** 0.2348*** 1NGO �0.2725*** 0.1276** 0.0129 1INFORML 0.1859*** �0.1042* 0.259*** 0.0304** 1INFLATION �0.0569* 0.0005 �0.0552** 0.0153 0.0077 1PGDP 0.1207* �0.3529*** �0.2467*** �0.1043** �0.0642*** 0.0227 1
Panel B. Correlation coefficient of the exogenous institutional variablesRSTATUS 1SOURCES �0.0406* 1COMPET 0.1353*** 0.1917*** 1NGO �0.2875*** 0.0745** 0.0092 1INFORMAL 0.2056*** �0.0601* 0.2135*** 0.0902* 1PRIGHTS 0.1508*** 0.0984** �0.0766* �0.0066 0.5165** 1FREEDOM 0.1068* 0.2067*** 0.2605* 0.0861*** 0.6108** 0.6991** 1
*Significant at 10%; ** significant at 5%; *** significant at 1%.
1216 V. Hartarska and D. Nadolnyak
Dow
nloa
ded
by [
Uni
vers
ity o
f N
ebra
ska,
Lin
coln
] at
04:
41 2
6 A
ugus
t 201
3
prudential regulation. Specifically, when instead of
including only a dummy variable for regulation, the
regression includes an interaction term whereby
regulatory status is multiplied by the capital ratio
(or alternatively, regulatory status multiplied by the
capital-ratio’s deviation from the minimum capital
ratio requirement of 0.08). A test of the joint
significance of regulatory status and the interaction
term could not reject the null that the two coefficients
equal zero (Wooldridge, 2002).9
The results also show that the variable NGO is not
significant in the OSS regression, which does not
support the argument of Besley and Ghatack (2004)
that nonprofit status alone can positively affect
performance as donors would be more willing to
support MFIs that are NGOs because the nonprofit
status guarantees permanency of the MFI mission
(Table 6).Across specifications, the MFI size affects sustain-
ability positively, but the magnitude of the effect
is small. SOURCES is positive and significant in
Model 1, indicating that MFIs that use several
funding sources are more sustainable. This variable
implicitly contains information on the use of savings
deposits as a source of capital but the impact of
savings is taken to equal that of any other source.
While the simple specification indicates an increasing
and then decreasing effect of MFI age, this effect
disappears when SAVINGS and LOANS are
included. In these preferred specifications the savings
ratio is insignificant but LOANS is significant. Thus,
even if savings are correlated with prudential regula-
tions (usually imposed on MFIs collecting deposits),
after controlling for regulatory status RSTATUS
(that is entry regulation), MFIs collecting savings
(and thus perhaps subject to prudential regulations)
do not have better (or worse) OSS.Among macroeconomic factors, the inflation coef-
ficient is positive significant. MFIs seem to have
developed sufficient safeguards and perform success-
fully in highly inflationary environments. A similar
positive link between inflation and performance of
banks was found by Demirguc-Kunt and Huizinga
(1999). Per capita income is not significant in the
specifications for OSS. The size of the informal
market has a positive effect on financial performance.
Specifically, all else equal, an MFI operating in a
country with an index of 3, such as South Africa,
would have an 8% lower OSS than an MFI in a
country with an index of 4 such as Mozambique (for
the year 2002). The indexes of economic freedom and
the security of property rights do not seem to affect
OSS. This result is somewhat surprising since many
cross-country studies of financial intermediaries and
firms have found these indexes to be significant.10
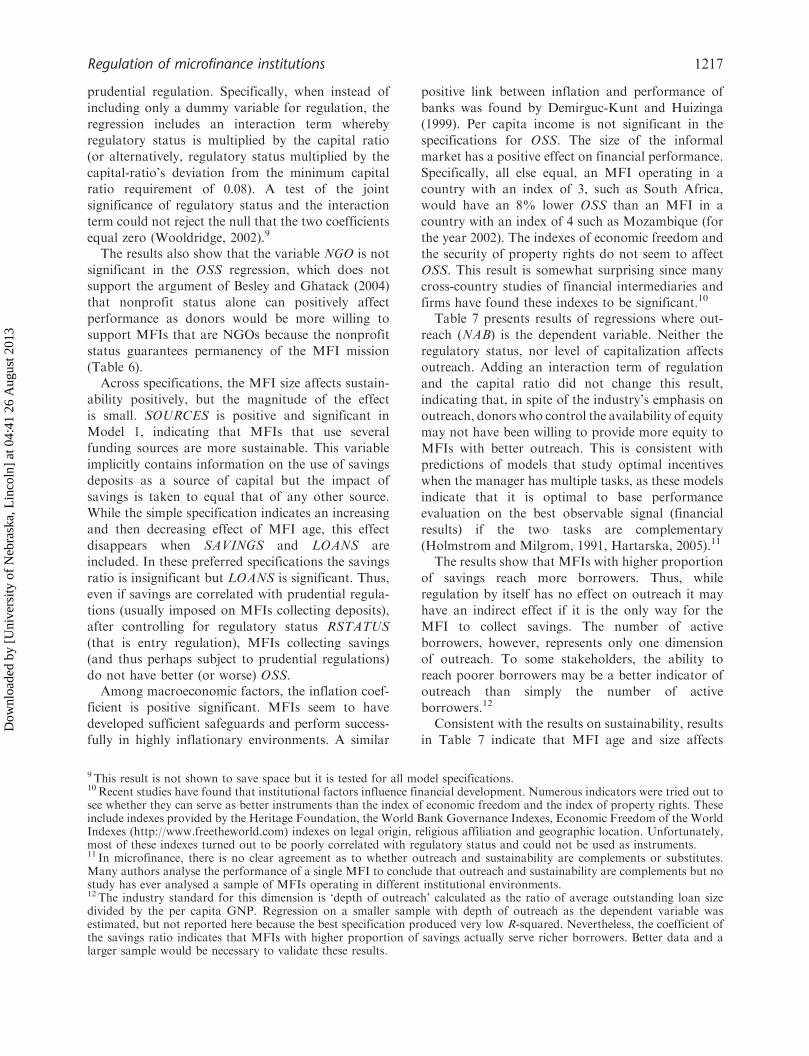
Table 7 presents results of regressions where out-
reach (NAB) is the dependent variable. Neither the
regulatory status, nor level of capitalization affects
outreach. Adding an interaction term of regulation
and the capital ratio did not change this result,
indicating that, in spite of the industry’s emphasis on
outreach, donors who control the availability of equity
may not have been willing to provide more equity to
MFIs with better outreach. This is consistent with
predictions of models that study optimal incentives
when the manager has multiple tasks, as these models
indicate that it is optimal to base performance
evaluation on the best observable signal (financial
results) if the two tasks are complementary
(Holmstrom and Milgrom, 1991, Hartarska, 2005).11
The results show that MFIs with higher proportion
of savings reach more borrowers. Thus, while
regulation by itself has no effect on outreach it may
have an indirect effect if it is the only way for the
MFI to collect savings. The number of active
borrowers, however, represents only one dimension
of outreach. To some stakeholders, the ability to
reach poorer borrowers may be a better indicator of
outreach than simply the number of active
borrowers.12
Consistent with the results on sustainability, results
in Table 7 indicate that MFI age and size affects
9 This result is not shown to save space but it is tested for all model specifications.10Recent studies have found that institutional factors influence financial development. Numerous indicators were tried out tosee whether they can serve as better instruments than the index of economic freedom and the index of property rights. Theseinclude indexes provided by the Heritage Foundation, the World Bank Governance Indexes, Economic Freedom of the WorldIndexes (http://www.freetheworld.com) indexes on legal origin, religious affiliation and geographic location. Unfortunately,most of these indexes turned out to be poorly correlated with regulatory status and could not be used as instruments.11 In microfinance, there is no clear agreement as to whether outreach and sustainability are complements or substitutes.Many authors analyse the performance of a single MFI to conclude that outreach and sustainability are complements but nostudy has ever analysed a sample of MFIs operating in different institutional environments.12 The industry standard for this dimension is ‘depth of outreach’ calculated as the ratio of average outstanding loan sizedivided by the per capita GNP. Regression on a smaller sample with depth of outreach as the dependent variable wasestimated, but not reported here because the best specification produced very low R-squared. Nevertheless, the coefficient ofthe savings ratio indicates that MFIs with higher proportion of savings actually serve richer borrowers. Better data and alarger sample would be necessary to validate these results.
Regulation of microfinance institutions 1217
Dow
nloa
ded
by [
Uni
vers
ity o
f N
ebra
ska,
Lin
coln
] at
04:
41 2
6 A
ugus
t 201
3
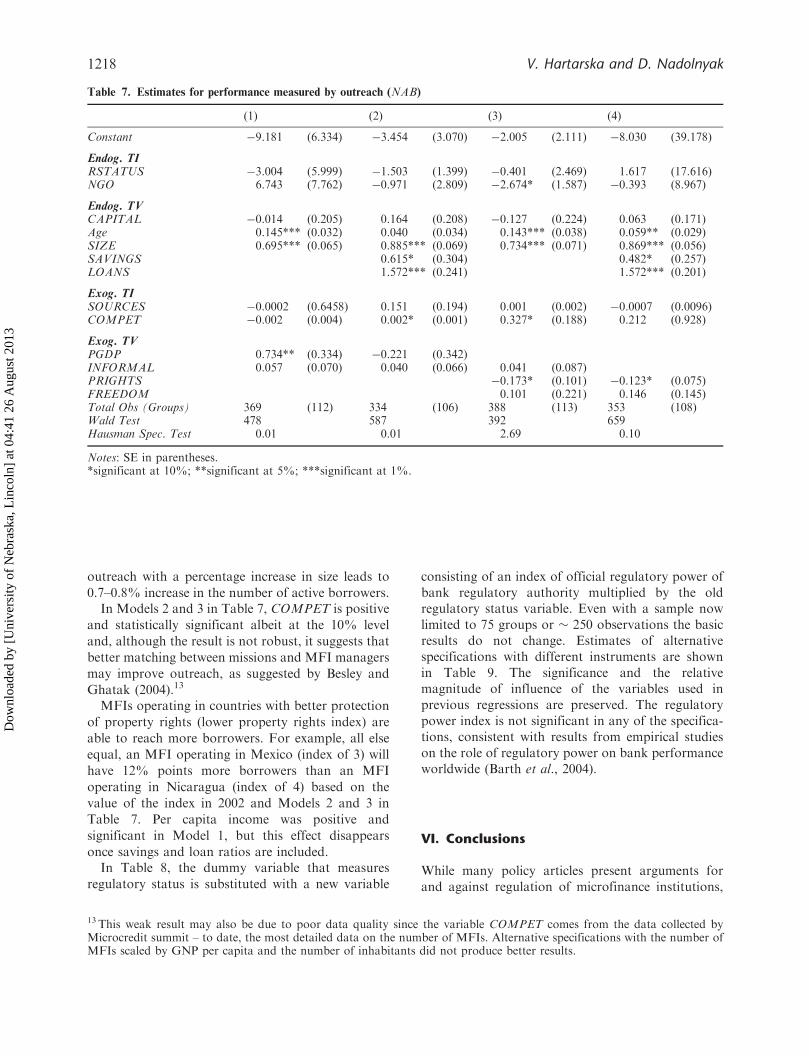
outreach with a percentage increase in size leads to
0.7–0.8% increase in the number of active borrowers.In Models 2 and 3 in Table 7, COMPET is positive
and statistically significant albeit at the 10% level
and, although the result is not robust, it suggests that
better matching between missions and MFI managers
may improve outreach, as suggested by Besley and
Ghatak (2004).13
MFIs operating in countries with better protection
of property rights (lower property rights index) are
able to reach more borrowers. For example, all else
equal, an MFI operating in Mexico (index of 3) will
have 12% points more borrowers than an MFI
operating in Nicaragua (index of 4) based on the
value of the index in 2002 and Models 2 and 3 in
Table 7. Per capita income was positive and
significant in Model 1, but this effect disappears
once savings and loan ratios are included.In Table 8, the dummy variable that measures
regulatory status is substituted with a new variable
consisting of an index of official regulatory power ofbank regulatory authority multiplied by the oldregulatory status variable. Even with a sample nowlimited to 75 groups or � 250 observations the basicresults do not change. Estimates of alternativespecifications with different instruments are shownin Table 9. The significance and the relativemagnitude of influence of the variables used inprevious regressions are preserved. The regulatorypower index is not significant in any of the specifica-tions, consistent with results from empirical studieson the role of regulatory power on bank performanceworldwide (Barth et al., 2004).
VI. Conclusions
While many policy articles present arguments forand against regulation of microfinance institutions,
Table 7. Estimates for performance measured by outreach (NAB)
(1) (2) (3) (4)
Constant �9.181 (6.334) �3.454 (3.070) �2.005 (2.111) �8.030 (39.178)
Endog. TIRSTATUS �3.004 (5.999) �1.503 (1.399) �0.401 (2.469) 1.617 (17.616)NGO 6.743 (7.762) �0.971 (2.809) �2.674* (1.587) �0.393 (8.967)
Endog. TVCAPITAL �0.014 (0.205) 0.164 (0.208) �0.127 (0.224) 0.063 (0.171)Age 0.145*** (0.032) 0.040 (0.034) 0.143*** (0.038) 0.059** (0.029)SIZE 0.695*** (0.065) 0.885*** (0.069) 0.734*** (0.071) 0.869*** (0.056)SAVINGS 0.615* (0.304) 0.482* (0.257)LOANS 1.572*** (0.241) 1.572*** (0.201)
Exog. TISOURCES �0.0002 (0.6458) 0.151 (0.194) 0.001 (0.002) �0.0007 (0.0096)COMPET �0.002 (0.004) 0.002* (0.001) 0.327* (0.188) 0.212 (0.928)
Exog. TVPGDP 0.734** (0.334) �0.221 (0.342)INFORMAL 0.057 (0.070) 0.040 (0.066) 0.041 (0.087)PRIGHTS �0.173* (0.101) �0.123* (0.075)FREEDOM 0.101 (0.221) 0.146 (0.145)Total Obs (Groups) 369 (112) 334 (106) 388 (113) 353 (108)Wald Test 478 587 392 659Hausman Spec. Test 0.01 0.01 2.69 0.10
Notes: SE in parentheses.*significant at 10%; **significant at 5%; ***significant at 1%.
13 This weak result may also be due to poor data quality since the variable COMPET comes from the data collected byMicrocredit summit – to date, the most detailed data on the number of MFIs. Alternative specifications with the number ofMFIs scaled by GNP per capita and the number of inhabitants did not produce better results.
1218 V. Hartarska and D. Nadolnyak
Dow
nloa
ded
by [
Uni
vers
ity o
f N
ebra
ska,
Lin
coln
] at
04:
41 2
6 A
ugus
t 201
3
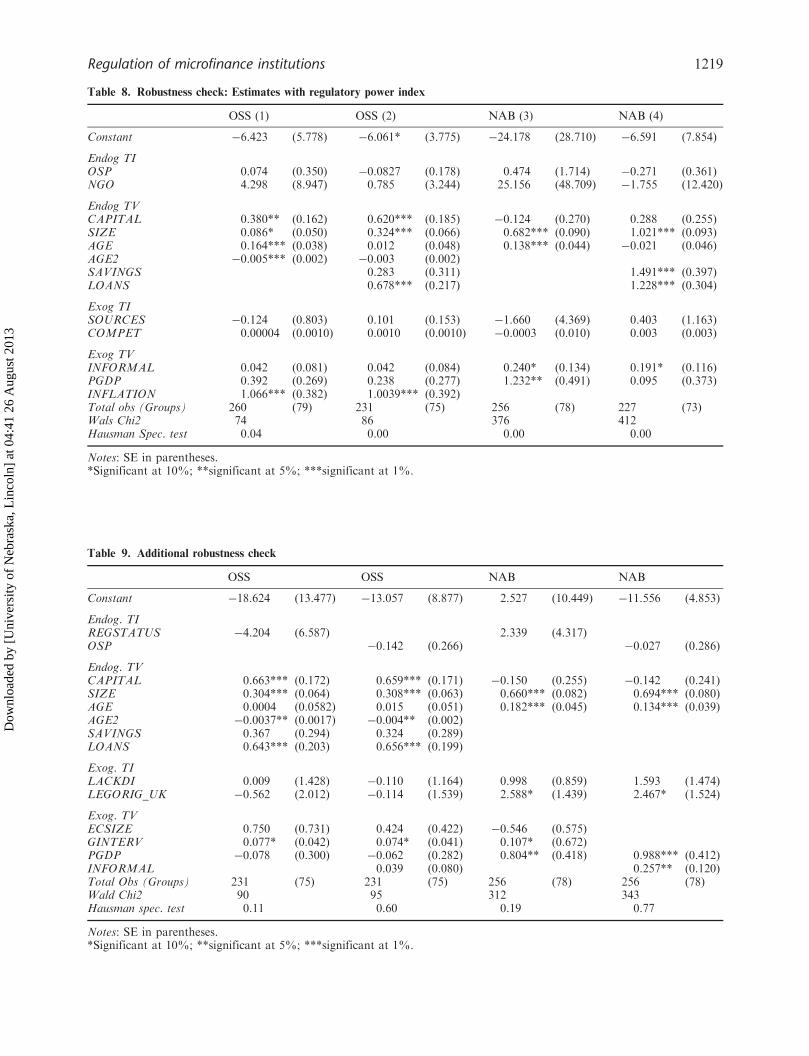
Table 8. Robustness check: Estimates with regulatory power index
OSS (1) OSS (2) NAB (3) NAB (4)
Constant �6.423 (5.778) �6.061* (3.775) �24.178 (28.710) �6.591 (7.854)
Endog TIOSP 0.074 (0.350) �0.0827 (0.178) 0.474 (1.714) �0.271 (0.361)NGO 4.298 (8.947) 0.785 (3.244) 25.156 (48.709) �1.755 (12.420)
Endog TVCAPITAL 0.380** (0.162) 0.620*** (0.185) �0.124 (0.270) 0.288 (0.255)SIZE 0.086* (0.050) 0.324*** (0.066) 0.682*** (0.090) 1.021*** (0.093)AGE 0.164*** (0.038) 0.012 (0.048) 0.138*** (0.044) �0.021 (0.046)AGE2 �0.005*** (0.002) �0.003 (0.002)SAVINGS 0.283 (0.311) 1.491*** (0.397)LOANS 0.678*** (0.217) 1.228*** (0.304)
Exog TISOURCES �0.124 (0.803) 0.101 (0.153) �1.660 (4.369) 0.403 (1.163)COMPET 0.00004 (0.0010) 0.0010 (0.0010) �0.0003 (0.010) 0.003 (0.003)
Exog TVINFORMAL 0.042 (0.081) 0.042 (0.084) 0.240* (0.134) 0.191* (0.116)PGDP 0.392 (0.269) 0.238 (0.277) 1.232** (0.491) 0.095 (0.373)INFLATION 1.066*** (0.382) 1.0039*** (0.392)Total obs (Groups) 260 (79) 231 (75) 256 (78) 227 (73)Wals Chi2 74 86 376 412Hausman Spec. test 0.04 0.00 0.00 0.00
Notes: SE in parentheses.*Significant at 10%; **significant at 5%; ***significant at 1%.
Table 9. Additional robustness check
OSS OSS NAB NAB
Constant �18.624 (13.477) �13.057 (8.877) 2.527 (10.449) �11.556 (4.853)
Endog. TIREGSTATUS �4.204 (6.587) 2.339 (4.317)OSP �0.142 (0.266) �0.027 (0.286)
Endog. TVCAPITAL 0.663*** (0.172) 0.659*** (0.171) �0.150 (0.255) �0.142 (0.241)SIZE 0.304*** (0.064) 0.308*** (0.063) 0.660*** (0.082) 0.694*** (0.080)AGE 0.0004 (0.0582) 0.015 (0.051) 0.182*** (0.045) 0.134*** (0.039)AGE2 �0.0037** (0.0017) �0.004** (0.002)SAVINGS 0.367 (0.294) 0.324 (0.289)LOANS 0.643*** (0.203) 0.656*** (0.199)
Exog. TILACKDI 0.009 (1.428) �0.110 (1.164) 0.998 (0.859) 1.593 (1.474)LEGORIG_UK �0.562 (2.012) �0.114 (1.539) 2.588* (1.439) 2.467* (1.524)
Exog. TVECSIZE 0.750 (0.731) 0.424 (0.422) �0.546 (0.575)GINTERV 0.077* (0.042) 0.074* (0.041) 0.107* (0.672)PGDP �0.078 (0.300) �0.062 (0.282) 0.804** (0.418) 0.988*** (0.412)INFORMAL 0.039 (0.080) 0.257** (0.120)Total Obs (Groups) 231 (75) 231 (75) 256 (78) 256 (78)Wald Chi2 90 95 312 343Hausman spec. test 0.11 0.60 0.19 0.77
Notes: SE in parentheses.*Significant at 10%; **significant at 5%; ***significant at 1%.
Regulation of microfinance institutions 1219
Dow
nloa
ded
by [
Uni
vers
ity o
f N
ebra
ska,
Lin
coln
] at
04:
41 2
6 A
ugus
t 201
3
to date, no study has attempted to empirically
evaluate how the performance of regulated MFIs
differs from that of nonregulated MFIs in terms oftheir two main objectives – cost covering (opera-
tional sustainability) and outreach. This article
evaluates whether regulated MFIs perform better
than nonregulated MFIs.The main findings of this article are that
regulatory involvement does not affect either sustain-
ability or outreach but that better capitalized MFIs
have better sustainability. The policy implications arethat MFIs who transform into regulated financial
institutions are not likely to be more financially
sustainable or reach more poor borrowers than MFIswho remain unregulated. However, the finding that
MFIs collecting savings achieve better outreach
suggests that there may be indirect benefits from
regulation, if regulation is the only way for MFIs toaccess savings. Many microfinance experts have
argued that providing savings strengthens the out-
reach mission. Most of the savings that MFIs attractcome from richer clients who bear the fixed costs,
making possible the provision of savings facilities to
poorer borrowers (Richardson, 2003). This article
strengthens the argument for collecting savings byshowing a positive impact of the level of savings on
outreach.What is, perhaps, surprising is that outreach is not
affected by the level of capitalization and leverage. Toan extent, this finding weakens the argument that
there is a need to increase leverage in order to reach
more poor borrowers, and illustrates that the dualmission of microfinance institutions makes the
control role of donors, investors and regulators
much harder.This article represents the first step towards
understanding the impact of regulation on MFIs’
performance worldwide. Given the importance of
these institutions for the development of financial
services for the poor, more precise data on specificregulatory interventions need to be collected and
carefully analysed in order to identify the impact of
the regulation on MFIs’ performance across theworld.
References
Adams, D., Graham, D. and Von Pischke J. D. (ed.) (1984)Undermining Rural Development with Cheap Credit.Westview Press, Boulder.
Arun, T. G. (2005) Regulating for development: the case ofmicrofinance, The Quarterly Review of Economics andFinance, 45, 346–57.
Assane, D. and Grammy, A. (2003) Institutionalframework and economic development: internationalevidence, Applied Economics, 35, 1811–17.
Grammy, J. and Wooler, G. (2004) Microfinance: acomprehensive review of existing literature, TheJournal of Entrepreneurial Finance and BusinessVentures, 9, 1–26.
Barth, J., Noelle, D., Phumiwasana, T. and Yago, G.(2003) A cross-country analysis of the bank super-visory framework and bank performance, FinancialMarkets, Institutions & Instruments, 12, 67–120.
Barth, J. R., Caprio, G. and Levine, R. (2004) Bankregulation and supervision: what works best?, Journalof Financial Intermediation, 13, 205–48.
Besley, T., and Ghatak, M. (2004) Competition andincentives with motivated agents, Working Paper,London School of Economics.
Brau, J. and Woller, G. (2005) Microfinance: acomprehensive review of the existing literature andan outline for future financial research, Journal ofEntreprenurial Finance and Business Ventures, 9, 1–26.
Campion, A. and White, W. (1999) Institutional metamor-phosis: transformation of microfinance NGOs inregulated financial institutions, Occasional Paper No.3, MicroFinance Network, Washington, DC.
Chaves, R. and Gonzalez-Vega, C. (1994) Principles ofregulation and prudential supervision and their rele-vance for microenterprise finance organizations, in TheNew World of Microenterprise Finance: BuildingHealthy Financial Institutions for the Poor (Eds)M. Otero and E. Rhyne, Kumarian Press, WestHartford, Connecticut, pp. 55–75.
Christen, R. P. and Rosenberg, R. (2000) The Rush toRegulate: Legal Frameworks for Microfinance, CGAPOccassional Paper, Washington DC.
Conning, J. (1999) Outreach, sustainability and leverage inmonitored and peer-monitored lending, Journal ofDevelopment Economics, 60, 51–77.
Cuevas, C. (1996) Enabling environment and microfinanceinstitutions: lessons from latin america, Journal ofInternational Development, 8, 195–209, DC.
Demirguc-Kunt, A. and Huisinga, H. (1999) Determinantsof commercial bank interest margins and profitability:some international evidence, World Bank EconomicReview, 13, 379–408.
Demirguc-Kunt, A., Laeven, L. and Levine, R. (2004)Regulations, market structure, institutions, and thecost of financial intermediation, Journal of MoneyCredit and Banking, 36, 539–622.
Dewatripont, M. and Tirole, J. (1994a) A theory of debtand equity: diversity of securities and manager-share-holder congruence, Quarterly Journal of Economics,139, 1027–54.
Dewatripont, M. and Tirole, J. (1994b) The PrudentialRegulation of Banks, MIT Press, Cambridge,Massachusetts.
Diamond, D. and Dybvig, P. (1983) Bank runs, depositinsurance and liquidity, Journal of Political Economy,91, 401–19.
Dichter, T. W. (1997) Appeasing the Gods of sustainability:the future of international NGOs in microfinance,in NGOs, States and Donors: Too Close for Comfort?(Eds) D Hulme and E. Michael, St. Martin’s Press inassociation with Save the Children, New York.
Freixas, X. and Rochet, J. (1997) Microeconomics ofBanking, MIT Press, Cambridge, Massachusetts.
1220 V. Hartarska and D. Nadolnyak
Dow
nloa
ded
by [
Uni
vers
ity o
f N
ebra
ska,
Lin
coln
] at
04:
41 2
6 A
ugus
t 201
3
Gonzalez-Vega, C. (1977) Interest rate restrictions andincome distribution, American Journal of AgriculturalEconomics, 59, 973–6.
Hardy, D., Holden, P. and Prokopenko, V. (2003)Microfinance institutions and public policy, Journalof Policy Reform, 6, 147–58.
Hartarska, V. (2005) Governance and performance ofmicrofinance institutions in Central and EasternEurope and the Newly Independent States, WorldDevelopment, 33, 1627–43.
Hausman, J. and Taylor, W. (1981) Panel data andunobservable individual effects, Econometrica, 49,1377–98.
Holmstrom, B. and Milgrom, P. (1991) Multitask principal-agent analyses: incentive contracts, asset ownershipand job design, Journal of Law, Economics, &Organization, 7, 24–51.
La Porta, R. (1998) Law and finance, Journal of PoliticalEconomy, 106, 1113–55.
McIntosh, C. and Widyck, B. (2005) Competition andMicrofinance, Journal of Development Economics, 78,271–98.
Rhyne, E. (2001) Mainstreaming Microfinance:How Lending to the Poor Began, Grew and Came ofAge in Bolivia, Kumarian Press, Hartford,Connecticut.
Richardson, D. (2003) Going to the Barricades forMicrosavings Mobilization: a View from the RealCosts from the Trenches, Microbanking Bulletin.
Safavian, M., Graham, D., Gonzalez-Vega, C., andWhelan, D. (2000) The state of microfinance activityand regulation in Russia, Working Paper, The OhioState University.
Sarmishta, P. (2002) Household sectoral choice andeffective demand for rural credit in India, AppliedEconomics, 34, 1743–55.
Steel, W. F., and Andah, D. O. (2003) Rural andmicrofinance regulation in Ghana: implications fordevelopment and performance of the industry, WorldBank Africa Regional Working Paper Series No. 49.
Stigler, G. (1971) The economic theory of regulation, BellJournal of Economics and Management Science, 2,3–21.
Theodore, L. and Loubiere, T. (2002) The experienceof microfinance institutions with regulation and super-vision: perspectives from practitioners and a super-visor, in The Commercialization of Microfinance:Balancing Business and Development (Eds)D. Deborah and R. Elisabeth, Kumarian Press,Bloomfield, CT.
Van Greuning, H., Galardo J., and Randhawa, B. (1999) Aframework for regulating microfinance institutions,The World Bank Policy Research Working Paper No.2061, Washington D.C: The World Bank.
Wooldridge, J. (2002) Econometric Analysis of Cross Sectionand Panel Data,MIT Press, Cambridge,Massachusetts.
Wright, G. (2000) Microfinance systems: Designing qualityfinancial services for the poor, Zed Books, London.
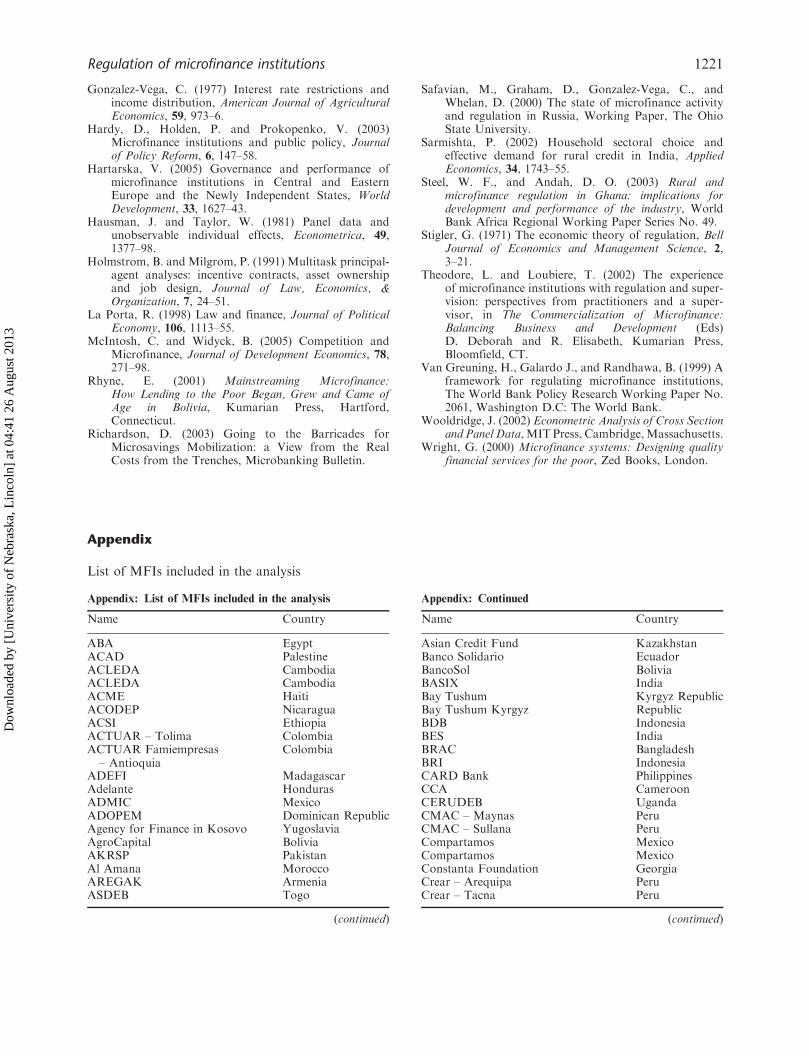
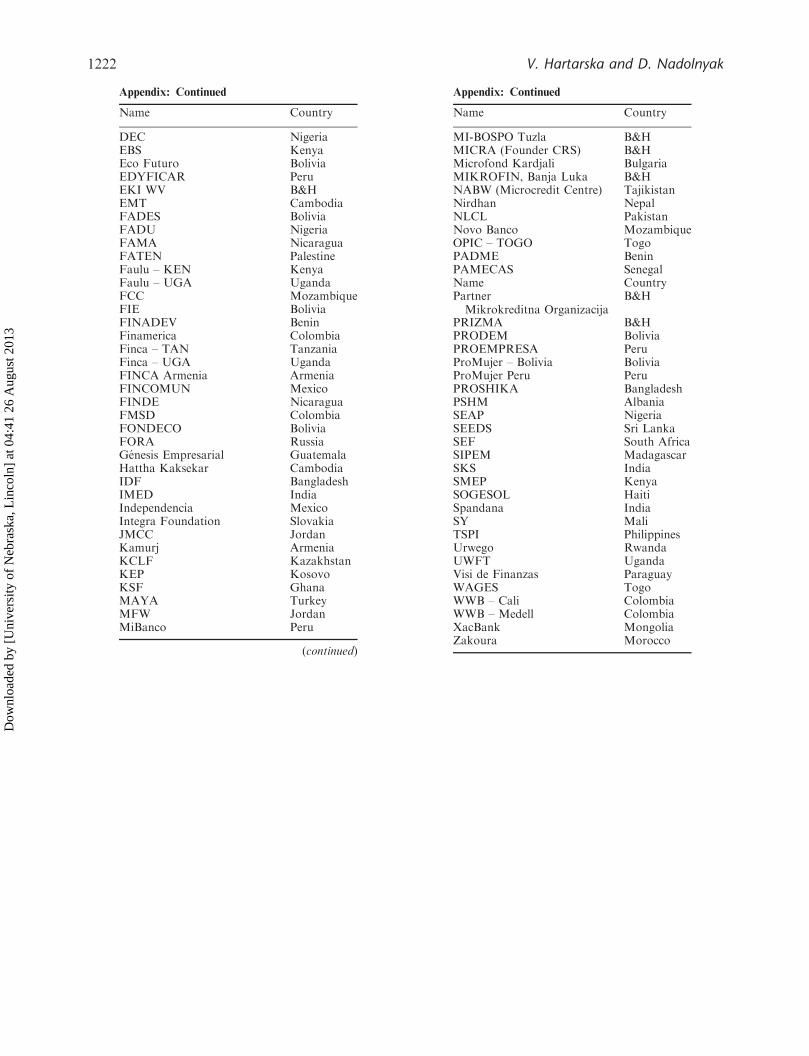
Appendix
List of MFIs included in the analysis
Appendix: Continued
Name Country
Asian Credit Fund KazakhstanBanco Solidario EcuadorBancoSol BoliviaBASIX IndiaBay Tushum Kyrgyz RepublicBay Tushum Kyrgyz RepublicBDB IndonesiaBES IndiaBRAC BangladeshBRI IndonesiaCARD Bank PhilippinesCCA CameroonCERUDEB UgandaCMAC – Maynas PeruCMAC – Sullana PeruCompartamos MexicoCompartamos MexicoConstanta Foundation GeorgiaCrear – Arequipa PeruCrear – Tacna Peru
(continued)
Appendix: List of MFIs included in the analysis
Name Country
ABA EgyptACAD PalestineACLEDA CambodiaACLEDA CambodiaACME HaitiACODEP NicaraguaACSI EthiopiaACTUAR – Tolima ColombiaACTUAR Famiempresas
– AntioquiaColombia
ADEFI MadagascarAdelante HondurasADMIC MexicoADOPEM Dominican RepublicAgency for Finance in Kosovo YugoslaviaAgroCapital BoliviaAKRSP PakistanAl Amana MoroccoAREGAK ArmeniaASDEB Togo
(continued)
Regulation of microfinance institutions 1221
Dow
nloa
ded
by [
Uni
vers
ity o
f N
ebra
ska,
Lin
coln
] at
04:
41 2
6 A
ugus
t 201
3
Appendix: Continued
Name Country
MI-BOSPO Tuzla B&HMICRA (Founder CRS) B&HMicrofond Kardjali BulgariaMIKROFIN, Banja Luka B&HNABW (Microcredit Centre) TajikistanNirdhan NepalNLCL PakistanNovo Banco MozambiqueOPIC – TOGO TogoPADME BeninPAMECAS SenegalName CountryPartnerMikrokreditna Organizacija
B&H
PRIZMA B&HPRODEM BoliviaPROEMPRESA PeruProMujer – Bolivia BoliviaProMujer Peru PeruPROSHIKA BangladeshPSHM AlbaniaSEAP NigeriaSEEDS Sri LankaSEF South AfricaSIPEM MadagascarSKS IndiaSMEP KenyaSOGESOL HaitiSpandana IndiaSY MaliTSPI PhilippinesUrwego RwandaUWFT UgandaVisi de Finanzas ParaguayWAGES TogoWWB – Cali ColombiaWWB – Medell ColombiaXacBank MongoliaZakoura Morocco
Appendix: Continued
Name Country
DEC NigeriaEBS KenyaEco Futuro BoliviaEDYFICAR PeruEKI WV B&HEMT CambodiaFADES BoliviaFADU NigeriaFAMA NicaraguaFATEN PalestineFaulu – KEN KenyaFaulu – UGA UgandaFCC MozambiqueFIE BoliviaFINADEV BeninFinamerica ColombiaFinca – TAN TanzaniaFinca – UGA UgandaFINCA Armenia ArmeniaFINCOMUN MexicoFINDE NicaraguaFMSD ColombiaFONDECO BoliviaFORA RussiaGenesis Empresarial GuatemalaHattha Kaksekar CambodiaIDF BangladeshIMED IndiaIndependencia MexicoIntegra Foundation SlovakiaJMCC JordanKamurj ArmeniaKCLF KazakhstanKEP KosovoKSF GhanaMAYA TurkeyMFW JordanMiBanco Peru
(continued)
1222 V. Hartarska and D. Nadolnyak
Dow
nloa
ded
by [
Uni
vers
ity o
f N
ebra
ska,
Lin
coln
] at
04:
41 2
6 A
ugus
t 201
3