do now: pass out calculators. pick a scientific notation matching activity sheet from the back....
TRANSCRIPT

Do Now:
• Pass out calculators.• Pick a scientific notation matching activity sheet from the back.
• Match the objects in Card Set B with the corresponding paired measurements from Card Set A. You may want to put the objects in size order first to help you.
Learn to identify and graph exponential functions.
Exponential Growth Video: http://www.youtube.com/watch?v=DjlEJNfsOKc

• “a” is the y-value when x is 0
• B is the “multiplier” of the y values

Write a function rule
EXAMPLE 1
Tell whether the table represents an exponential function. If so, write a rule for the function.
x
y
–1 0
1
21
319
13
+1+1+1
3 3 3
a.

Write a function rule
EXAMPLE 1
The y-values are multiplied by 3 for each increase of 1 in x, so the table represents an exponential function of the form y = abx with b = 3.
The value of y when x = 0 is , so a = .13
13
The table represents the exponential function y = 3x.13
Write a function ruleEXAMPLE 1
x
y
–1 0 21
+1+1+1
4141
116
14
14
14
b.
14
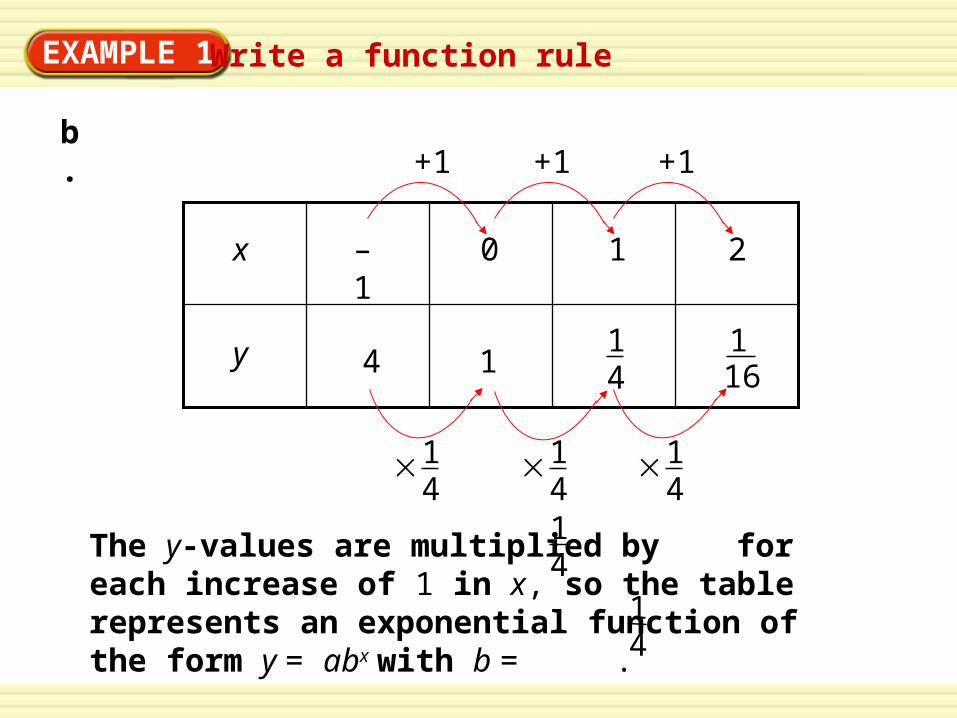
The y-values are multiplied by for each increase of 1 in x, so the table represents an exponential function of the form y = abx with b = .
14

Write a function rule
EXAMPLE 1
The value of y when x = 0 is 1, so a = 1.
14
The table represents the exponential function y = . x

GUIDED PRACTICE for Example 1
Tell whether the table represents an exponential function. If so, write a rule for the function.
1 5
x
y
–1 0 21
125
15
ANSWER yes; y = ( )x15

In the function f(x) = a rx the output gets larger as the input gets larger. In this case, f is called an exponential growth function.

Create a table for the exponential function, and use it to graph the function.
f(x) = 2x
Example 2:a
20
21
2-2
2-1
x y
–2
–1
0
1
2
1 41 2
1
2
4 22

Create a table for the exponential function, and use it to graph the function.
f(x) = 3 2x
Example 2b:
3 20 = 3 1
3 21 = 3 2
3 22 = 3 4
3 2-2 = 3 14
3 2-1 = 3 12
x y
–2
–1
0
1
2
3 43 2
3
6
12

In the function of exponential decay the output gets smaller as x gets larger.
Medicine and Cancer150 mlg of Half Life of 8.036 days
F(x) = arx
EXAMPLE 3 Graph an exponential function
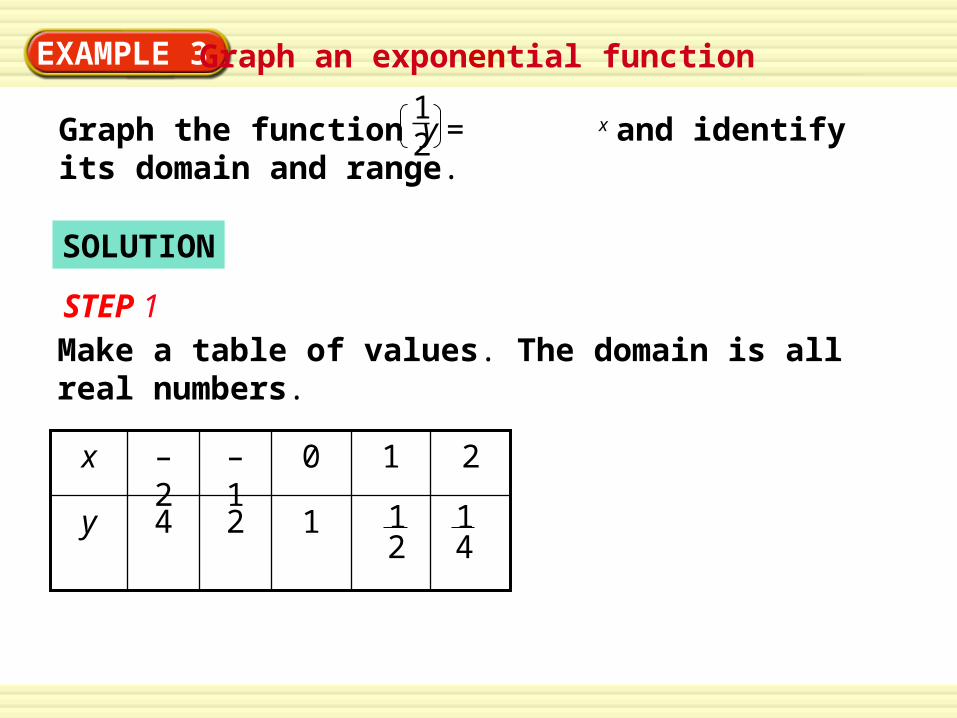
Graph the function y = x and identify its domain and range.
12
SOLUTION
STEP 1Make a table of values. The domain is all real numbers.
124y
210– 1– 2x
12
14

EXAMPLE 3 Graph an exponential function
STEP 2
Plot the points.
STEP 3
Draw a smooth curve through the points. From either the table or the graph, you can see the range is all positive real numbers.

EXAMPLE 4 Compare graphs of exponential functions
Graph the functions y = 3 and y = −
Compare each graph with the graph of y =
12
13
12
12
x x
x

EXAMPLE 4 Compare graphs of exponential functions
SOLUTION
= x12y
13= ∙ xy 1
2–x
0
2
1
–2
–1
y = 3 ∙12 x
4
1
2
1214
12
3
6
3234
13
–
112
–
23
–
16
–
43
–
EXAMPLE 3 Compare graphs of exponential functions
1212
12
12
– – 13
12
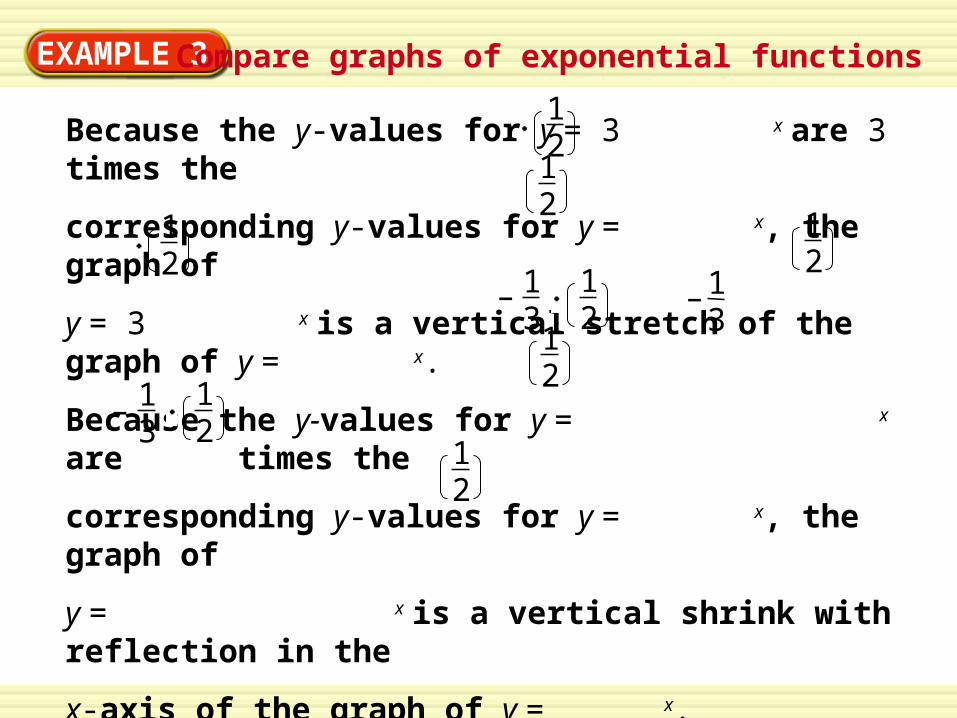
Because the y-values for y = 3 x are 3 times the
corresponding y-values for y = x, the graph of
y = 3 x is a vertical stretch of the graph of y = x.
Because the y-values for y = x are times the
corresponding y-values for y = x, the graph of
y = x is a vertical shrink with reflection in the
x-axis of the graph of y = x.
13
12
13
12
–12

GUIDED PRACTICE for Examples 3 and 4
Graph the function y = (0.4)x and identify its domain and range.
2.
ANSWER
Domain: all real numbersRange: all positive real numbers

GUIDED PRACTICE for Examples 3 and 4
Graph the functions y = 5 (0.4)x. Compare graph with the graph of y = (0.4)x.
3.
ANSWER
The graph is a vertical stretch of y = (0.4)x.

EXAMPLE 5 Classify and write rules for functions
SOLUTION
The graph represents exponential growth (y = abx where b > 1). The y-intercept is 10, so a = 10. Find the value of b by using the point (1, 12) and a = 10.
y = abx Write function.
12 = 10 b1 Substitute.
1.2 = b Solve.
A function rule is y = 10(1.2)x.
Tell whether the graph represents exponential growth or exponential decay. Then write a rule for the function.

EXAMPLE 5 Classify and write rules for functions
The graph represents exponential decay (y = abx where 0 < b < 1).The y-intercept is 8, so a = 8. Find the value of b by using the point (1, 4) and a = 8.
y = abx Write function.
4 = 8 b1 Substitute.
0.5 = b Solve.
A function rule is y = 8(0.5)x.
Tell whether the graph represents exponential growth or exponential decay. Then write a rule for the function.

GUIDED PRACTICE for Example 4
4. The graph of an exponential function passes through the points (0, 10) and (1, 8). Graph the function. Tell whether the graph represents exponential growth or exponential decay. Write a rule for the function.
ANSWER exponential decay; y = 10 (0.8)x