do mothers’ educational levels matter in … · do mothers’ educational levels matter in child...
TRANSCRIPT

1
DO MOTHERS’ EDUCATIONAL LEVELS MATTER IN CHILD MALNUTRITION AND HEALTH OUTCOMES IN GAMBIA AND NIGER?1
A.S. Oyekale (PhD) and T.O. Oyekale
Department of Agricultural Economics, University of Ibadan,
Ibadan, Nigeria. [email protected]
Tel: 002348029468630 Abstract
Despite past policy interventions and supports, malnutrition remains one of
the major problems confronting children in Sub-Sahara Africa (SSA). This study
analyzed the effect of mothers’ educational levels on child malnutrition. Data
from the 2000 End-Decade Multiple Indicator Cluster Survey by the United
Nations International Children Emergency Funds (UNICEF) for Gambia and
Niger were used. Data were analyzed with Foster-Greer-Thorbeck approach and
Probit regression. Results show stunting, wasting and underweight head counts
are higher in Niger rural and urban areas, while stunting, wasting and
underweight head count, depth and severity are higher among children whose
mothers had no secondary education for all the countries. The Probit analysis
reveals that attainment of secondary education by the mothers, urbanization,
presence of pipe water, presence of mother and father at home, polio vaccination,
ever breast fed and access to radio and television significantly reduce the
probability of stunting, wasting and underweight, while infection with diarrhea,
fever and age at first polio vaccine significantly increase it. It was recommended
that to reduce malnutrition and achieve the Millennium Development Goals
(MDGs) in Gambia and Niger, institutional arrangements for catering for
secondary education of girls and ensuring consistency in child health programs
must be strengthened, among others.
1 We are grateful to UNICEF for granting the permission to use the data set.
2
1. Introduction
Hunger and malnutrition remain among the most devastating problems
currently facing the majority of the world’s poor (WHO, 2000). Conventionally,
the nutritional status of under-five children is one of the acceptable indicators of
households’ well-being (Thomas et al, 1990). However, child malnutrition has
worsened significantly over the past few decades in many developing countries
(ACC/SCN, 2000). Without appropriate policy interventions, the hope of
achieving the Millennium Development Goals (MDGs) is bleak. This is because
adequate nutrition is a fundamental requirement for children healthy living and
development (WHO, 2000).
It should be noted that the African traditional role division has largely laid
the responsibility of childcare on women. This begins at conception and
continues until infancy, teenage and adulthood. Therefore, women are key
players in the growth and development of children. However, it is not until
recently that the role of mothers’ education in enhancing the quality of care and
nutritional status of children is being emphasized in empirical research (Smith et
al, 2004).
The generally adopted conceptual framework for understanding the
causes of malnutrition is that proposed by UNICEF (1990; 1998) and Engle et al
(1999). This framework incorporates household food security, care for mother
and children, and healthy environment and service as key factors influencing
malnutrition. As distinct and important as these factors may be, the educational
level of mothers can play a facilitating role of ensuring that they make maximum
impacts. For instance, educated mothers may have better paid jobs thus be able
to earn higher income and take better care of their children, be resident in urban
areas where there are functioning social infrastructures, possess commendable
culture of hygiene needed to protect children from diseases, be more likely to
participate in child health enhancing programs like immunization and child care

3
talks, and be able to benefit maximally from nutrition- and health-related radio
and television programs.
The nutritional status of children can be studied using clinical signs of
malnutrition, biochemical indicators and anthropometrics surveys. However, the
use of anthropometrics measurement has some advantages over other
approaches. This is because they are cheaper and relatively easier to obtain.
Theoretically, the body of a child responds to malnutrition in two ways that can
be measured by anthropometrics survey. First, a reduction in growth over the
long-term results in low height-for-age or stunting. Second, a short-term
response to inadequate food intakes is assessed by weight relative to height
(wasting). The combination of short-term and long-term food shortage and
growth disturbances produces low weight-for-age (underweight) (de Onis, 2000).
Underscoring the role of mothers’ education, Ryan et al (1984) analyzed
the determinants of individual diets and nutritional status in six semi-arid
villages of Southern India using weight-for-age classification suggested by
Gomez et al (1955). They found that educational level of mothers and non-
involvement of the mothers in the rural labour market significantly reduced the
nutritional status of children. Gunasekara (1999) found that the employment
status of mothers, the number of living children, the level of education of the
mother and non-involvement of the mothers in the rural labour market
significantly reduced the incidence of stunting, wasting and underweight among
children in Sri Lanka.
Christiansen and Alderman (2001) measured child malnutrition in
Ethiopia using height-for-age z-score. It was found that gender of the child,
household resources, food prices, maternal education and strengthening of
nutritional knowledge of the community through child growth monitoring or
nutritional education are the key determinants of chronic growth disturbances.
Department of Census and Statistics (DCS) (2003) found that in Sri Lanka,
the key factor explaining stunting, wasting and under-weight in children were

4
age of the child, sector of residence (urban or rural), work status of mother,
access to media by the mother, mother’s educational level, and type of toilet.
Shah (2003) analyzed the prevalence and correlates of stunting among children in
rural Pakistan. Using data from 1878 children that were less than 3 years of age,
their results showed that 26 percent, 55 percent and 15 percent of the children
were wasted, stunted and wasted/stunted respectively. It was further revealed
that mothers who were illiterate and fathers that were earning less than $20 per
month were more likely to have stunted children. Also, Silva (2005) analyzed the
determinants of child malnutrition in Ethiopia. The result showed that child’s
age, mother’s height, household wealth, educational levels of the mothers and
access to good water explain to a large extent the nutritional status of children.
The objectives of the paper are to determine the malnutrition head count,
depth and severity with respect to height-for-age (stunting), weight-for-height
(wasting) and weight-for-age (underweight) and analyze the effect of mothers’
education and other socio-economic factors on child’s health outcomes of
malnutrition (stunting, wasting and under-weight). The research hypotheses are
that maternal education does not significantly reduce the problems of stunting,
wasting and under-weight. In the remaining parts of the paper, section 2
highlights the method of data collection, section 3 presents the results of data
analysis and section 4 presents the policy recommendations.
2. Materials and Method
Sources of data
The study used the data available for several African countries on child’s
anthropometrics information. The data were collected in the 2000 Multiple
Indicator Cluster Survey by the United Nations International Children
Emergency Funds (UNICEF). The requested information is robust in every
respect comprising of child anthropometrics data, disease infection, mother’s

5
socio-economic characteristics, housing condition and participation in different
forms of vaccination programs, among others. The samples in all the countries
were selected in two stages. At the first stage, clusters were selected with
probability proportional to size. After a household listing was obtained for the
selected clusters, systematic samples were drawn. This study focuses on data from
Gambia and Niger (see table 1). Data from Gambia were collected from Banjul,
Kanifing, Brikama, Mansakonko, Kerewan, Kuntaur, Janjabureh and Basse. The
survey in Niger was done in Agadez, Diffa, Dosso, Maradi, Tillaberi, Tahoua,
Zinder_Diffa, and Niamey.
Table 1: Distribution of Samples and Household Members in the Gambia and Niger
Country Gambia Niger Completed Samples 4190 4321 Household members 24213 26256 Women 5271 5664 Children 3509 5080
Analytical Models
Z-Score indices of prevalence of malnutrition
Following Cogill (2003), the z-score was used to carry out the analysis of
child’s malnutrition. This is represented as:
Zij = Xij – µj 1 j
Where i refers to individuals (children) and j = 1….3 with Z1 = z-score height-for-
age nutrition index, Z2 = z-score weight-for-height nutrition index, and Z3 = z-
score weight-for-age nutrition index, Xij = observed value for the ith child, µ =
mean value of the reference population, and = standard deviation of the
reference population. A z-score of -2 standard deviation is the most commonly
adopted cut off for all nutrition indicators. Consequently, children with z-scores

6
below (-2) for stunting (HAZ), underweight (WAZ) and wasting (WHZ) are
considered to be moderately or severely malnourished.
Following Sahn and Stifel (2002), the Foster et al (1984) method was
applied to analysis of child nutritional status. This is specified as:
1
1 ijia
q
i
z yPn z
α
=
− = ∑ ……………. 2
n = number of children in the population
q = number of malnourished children
z = nutrition poverty line (-2 standard deviation)
yij = z score of ith child for jth health outcome
= degree of malnutrition aversion. Conventionally, it measures the incidence or
head count ratio ( is 0), nutrition gap or depth ( is 1) and malnutrition severity
( is 2).
Probit Regression Model
The Probit regression was used to analyze the socio-economic
determinants of child health outcomes. The dependent variables (Yij) were binary
variables with value of 1 if malnourished in respect of stunting, wasting and
underweight (z-score less than –2) and 0 otherwise. Following Zere and McIntyre
(2003), some outliers were excluded based on the recommendation of WHO
(1995). Therefore, weight-for-height z score less than –4 and greater than +5,
height-for-age z-scores less than –5 and greater than +3, weight-for-age z-score
less than –5 and greater than +5 were excluded. The estimated model is stated as:
∑ ∑ ∑ ∑ ∑∑= = = = ==
+++++++=4
1
4
1
5
1
4
1
8
1
6
1 i i i i ijiiiiiiiiii
iiijij vAPVDHMY ϑµθγϕβφ 3
Where:
M1 = Sex (male 1, 0 otherwise)
M2 = Urbanization (urban centers = 1, 0 otherwise)
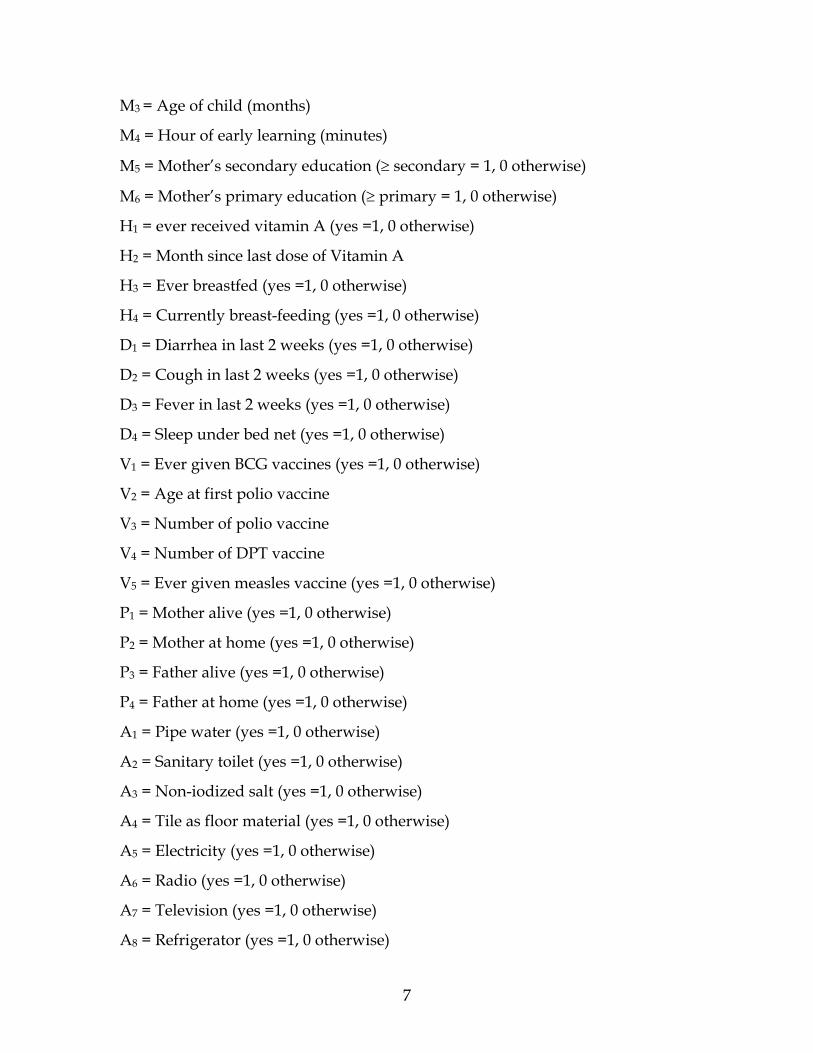
7
M3 = Age of child (months)
M4 = Hour of early learning (minutes)
M5 = Mother’s secondary education (≥ secondary = 1, 0 otherwise)
M6 = Mother’s primary education (≥ primary = 1, 0 otherwise)
H1 = ever received vitamin A (yes =1, 0 otherwise)
H2 = Month since last dose of Vitamin A
H3 = Ever breastfed (yes =1, 0 otherwise)
H4 = Currently breast-feeding (yes =1, 0 otherwise)
D1 = Diarrhea in last 2 weeks (yes =1, 0 otherwise)
D2 = Cough in last 2 weeks (yes =1, 0 otherwise)
D3 = Fever in last 2 weeks (yes =1, 0 otherwise)
D4 = Sleep under bed net (yes =1, 0 otherwise)
V1 = Ever given BCG vaccines (yes =1, 0 otherwise)
V2 = Age at first polio vaccine
V3 = Number of polio vaccine
V4 = Number of DPT vaccine
V5 = Ever given measles vaccine (yes =1, 0 otherwise)
P1 = Mother alive (yes =1, 0 otherwise)
P2 = Mother at home (yes =1, 0 otherwise)
P3 = Father alive (yes =1, 0 otherwise)
P4 = Father at home (yes =1, 0 otherwise)
A1 = Pipe water (yes =1, 0 otherwise)
A2 = Sanitary toilet (yes =1, 0 otherwise)
A3 = Non-iodized salt (yes =1, 0 otherwise)
A4 = Tile as floor material (yes =1, 0 otherwise)
A5 = Electricity (yes =1, 0 otherwise)
A6 = Radio (yes =1, 0 otherwise)
A7 = Television (yes =1, 0 otherwise)
A8 = Refrigerator (yes =1, 0 otherwise)

8
vj = error term
3. Results and Discussions
Socio-Economic Characteristics of Under-Five Children
The descriptive statistics of some of the socio-economic characteristics of
the under-five children are presented in table 2. It reveals that 50.48 percent and
51.55 percent of the children from Gambia and Niger respectively were males
and 33.27 percent and 19.52 percent were from urban centers. The average ages
are 26 months and 29 months for Gambia and Niger respectively. Only 11.76
percent and 79.53 percent of the children in Gambia and Niger respectively have
ever taken food fortified with Vitamin A. while 98.98 percent and 97.62 percent
were ever breast-fed. Percentages of children vaccinated are lower in Gambia
with 8.40 percent, 8.97 percent, 9.95 percent, and 7.88 percent ever had BCG,
polio, DPT and measles vaccination respectively. Furthermore, 99.98 percent and
92.27 percent of the mothers of the children in Gambia and Niger respectively
had at least primary education. However, only 18.61 percent and 18.70 percent of
the mothers in Gambia and Niger respectively had at least secondary education.

9
Table 2: Descriptive Statistics Some of the Variables Used for Probit Regression
Country/Variables Gambia Niger Mean Std deviation Mean Std deviation Sex* 0.5048 0.5000 0.5155 0.4998 Urban/rural* 0.1430 0.3502 0.3771 0.4847 Age of child 26.2696 16.2429 29.2055 17.2371 Hour of early learning 0.6184 3.9580 0.3876 3.3505 Mother’s secondary education* 0.1861 0.2114 0.1870 0.3899 Mother’s primary education* 0.9988 0.3082 0.9227 0.2669 Vitamin A 0.1176 0.3222 0.7953 1.0921 Month since last dose of Vitamin A 0.6531 3.6511 1.8191 4.1040 Ever breast fed* 0.9898 0.1000 0.9762 0.1523 Currently breast feeding* 0.4357 0.4959 0.3779 0.4849 Diarrhea in last 2 weeks* 0.2493 0.4327 0.3632 0.4809 Cough in last 2 weeks* 0.1932 0.3948 0.2422 0.4284 Fever in last 2 weeks* 0.1394 0.3464 0.3755 0.4843 Sleep under bed net* 0.5084 0.5000 0.2209 0.4143 Ever given BCG vaccines* 0.0840 0.2775 0.1812 0.3853 Age at first polio vaccine 0.1592 0.5217 0.3927 0.7648 Number of polio vaccine 0.2174 0.8646 0.6578 1.3981 Number of DPT vaccine 0.1184 0.5717 0.3434 0.9073 Ever given measles vaccine* 0.0788 0.3265 0.2066 0.8094 Mother alive* 0.9454 0.2271 0.9861 0.1169 Mother at home* 0.9046 0.2938 0.9346 0.2471 Father alive* 0.9300 0.2550 0.9821 0.1323 Father at home* 0.8233 0.3814 0.8750 0.3307 Pipe water* 0.6789 0.4670 0.4006 0.4900 Modern toilet* 0.0226 0.1487 0.0347 0.1832 Non-iodized salt* 0.5513 0.4974 0.5471 0.4978 Tile as floor material* 0.0133 0.1147 0.7403 0.4384 Electricity* 0.2130 0.4095 0.1674 0.3734 Radio* 0.7041 0.4565 0.5271 0.4993 Television* 0.1305 0.3369 0.1372 0.3441 Refrigerator* 0.0941 0.2921 0.0105 0.1022
*0-1 dummy estimated variables implying percentage for those indicating 1 (yes).
Malnutrition Head Count, Depth and Severity in Gambia and Niger
Table 3 shows the indices of malnutrition. The values were computed for
the combination of rural and urban areas (all children), rural areas (rural
children) and urban areas (urban children). The table shows that for all the
children, rural children and urban children, stunting, wasting and underweight
head counts are higher in Niger. Malnutrition depth indicates by how much the
malnourished children would be lifted up the z-score in order to escape the

10
Table 3: Malnutrition Head Count, Depth and Severity Indices in Rural and Urban Areas in Gambia and Niger
Malnutrition Variable/ Country Gambia (n = 2474) Niger (n = 4545)
Rural and Urban (All Children) Malnutrition Head Count Stunting (HAZ) 0.2033 0.3529 Wasting (WHZ) 0.0860 0.1269 Under Weight (WAZ) 0.1847 0.3654 Malnutrition Depth Stunting (HAZ) 0.4314 0.4963 Wasting (WHZ) 0.2596 0.2715 Under Weight (WAZ) 0.3107 0.3790 Malnutrition Severity Stunting (HAZ) 0.3193 0.3836 Wasting (WHZ) 0.1152 0.1257 Under Weight (WAZ) 0.1641 0.2311
Rural Areas (Rural Children) Malnutrition Head Count Stunting (HAZ) 0.2089 0.4143 Wasting (WHZ) 0.0858 0.1419 Under Weight (WAZ) 0.1939 0.4118 Malnutrition Depth Stunting (HAZ) 0.4668 0.5204 Wasting (WHZ) 0.2524 0.2874 Under Weight (WAZ) 0.3149 0.4055 Malnutrition Severity Stunting (HAZ) 0.3580 0.4109 Wasting (WHZ) 0.1083 0.1393 Under Weight (WAZ) 0.1701 0.2578
Urban Areas (Urban Children) Malnutrition Head Count Stunting (HAZ) 0.1694 0.2520 Wasting (WHZ) 0.0875 0.1021 Under Weight (WAZ) 0.1299 0.2893 Malnutrition Depth Stunting (HAZ) 0.0302 0.4298 Wasting (WHZ) 0.3026 0.2351 Under Weight (WAZ) 0.2709 0.3159 Malnutrition Severity Stunting (HAZ) 0.0055 0.3085 Wasting (WHZ) 0.1558 0.0947 Under Weight (WAZ) 0.1132 0.1678

11
scourge of malnutrition. The analysis shows except for wasting among urban
children, malnutrition is deeper among all categories of children in Niger.
Malnutrition severity measures the severity intensity of malnutrition among the
affected children. The results also show that except for wasting among urban
children, Niger children are worst severely affected by malnutrition.
Table 4: Malnutrition Head Count, Depth and Severity Indices Among Mothers With Different Educational Levels in Gambia and Niger
Gambia Niger Educational Level ≥ Secondary < Secondary ≥ Secondary < Secondary
Malnutrition Head Count Stunting (HAZ) 0.0689 0.2099 0.2350 0.3799 Wasting (WAZ) 0.0948 0.1891 0.2796 0.3851 Underweight (WHZ) 0.1034 0.0852 0.1034 0.1323 Malnutrition Depth Stunting (HAZ) 0.2918 0.4343 0.4061 0.5091 Wasting (WAZ) 0.1877 0.3135 0.3440 0.3849 Underweight (WHZ) 0.2479 0.2604 0.2335 0.2784 Malnutrition Severity Stunting (HAZ) 0.1676 0.3216 0.2817 0.3981 Wasting (WAZ) 0.0725 0.1667 0.1990 0.2365 Underweight (WHZ) 0.1171 0.1144 0.0953 0.1312 ≥ Primary < Primary ≥ Primary < Primary Stunting (HAZ) 0.0985 0.2157 0.3476 0.2749 Wasting (WAZ) 0.1174 0.1926 0.3624 0.2655 Underweight (WHZ) 0.1098 0.0832 0.1278 0.0772 Malnutrition Depth Stunting (HAZ) 0.3196 0.4385 0.4934 0.5256 Wasting (WAZ) 0.2794 0.3127 0.3801 0.0973 Underweight (WHZ) 0.2858 0.2556 0.2727 0.2558 Malnutrition Severity Stunting (HAZ) 0.2481 0.3230 0.3807 0.4121 Wasting (WAZ) 0.1422 0.1660 0.2319 0.0598 Underweight (WHZ) 0.1385 0.1115 0.1270 0.1087
Table 4 shows the malnutrition head count, depth and severity for
mothers with different levels of education. The results show that stunting,
wasting and underweight head count, depth and severity are higher among
children whose mothers had no secondary education for all the countries.
However, the indices for primary education do not follow a particular trend.

12
Determinant of Child Health Outcomes
Stunting (HAZ)
Table 5 shows the results of Probit analysis of the determinants of stunting
among under five children in selected SSA countries. The statistical significance
of the F- values (p < 0.01) shows that the model produced a good fit for the data.
The discussions shall only focus on the variables that are statistically significant
(at least p < 0.10).
The estimated parameters for child’s sex are statistically insignificant (p >
0.10). This shows that there is no significant difference between male and female
children in Gambia and Niger. Children from urban areas have significantly
lower probability of stunting in all the countries. Smith et al (2004) also found
that stunting is higher in rural areas than urban areas. The parameters of child’s
age show that as the children grow older, the probability of becoming stunted
increases in all the countries. This is because the height of younger kids may not
be seriously affected if the households have food problem due to their
dependence on breast milk.
The parameter for attendance at early learning centers for Gambia shows
that those children attending early learning have significantly higher probability
of stunting, while the opposite applies for Niger. Children on early learning are
always given supplementary formula food if they have not been weaned. In
most cases, weaned children attending these classes eat more than they would
ordinarily do if they were with their parents because acceptance of child’s
attendance is strictly conditioned on provision of required food by the parents.
The parameters of primary education show that in Gambia and Niger,
possession of at least primary education by the mothers significantly reduces the
probability of the children becoming stunting. Also, possession of at least
secondary education reduces stunting in the two countries. A similar finding had
been reported by Smith and Haddad (2000). This observation goes in line with
expectation because educated women are expected to be better than illiterate

13
Table 5: Probit Regression of the Determinants of Stunting (HAZ) Among
Children in Sub-Saharan Africa
Country/Variables Gambia Niger Parameter t-value Parameter t-value Constant 0.188803* 2.999 0.11361*** 1.644 Sex -0.002251 -0.205 0.006224 0.596 Urbanization -0.121471* -7.234 -0.036286** -2.049 Age of child 0.000573** 2.022 0.002447* 4.602 Hour of early learning 0.003104** 2.170 -0.004290* -2.667 Mother’s primary education -0.062898*
-2.665 -0.044178** -2.239
Mother’s secondary education -0.086472*
-2.768 -0.069059** -2.266
Vitamin A -0.100349* -5.088 0.002418 0.498 Month since last dose of Vitamin A 0.002051**
2.180 -0.000640 -0.482
Ever breast fed -0.10021*** -1.809 0.034635*** 1.990 Currently breast feeding -0.011275 -0.622 -0.036463** -1.969 Diarrhea in last 2 weeks 0.009545* 2.735 0.051180* 4.402 Cough in last 2 weeks 0.001667 0.116 -0.000413 -0.032 Fever in last 2 weeks 0.74849* 4.346 0.012775** 2.089 Sleep under bed net -0.074849* -6.764 -0.036386* -2.772 Ever given BCG vaccines 0.044637 0.965 0.009954 0.388 Age at first polio vaccine 0.002732 0.080 -0.007539 -0.265 Number of polio vaccine -0.01895*** -1.655 -0.019246** -2.391 Number of DPT vaccine -0.010922 -0.678 0.003044 0.323 Ever given measles vaccine -0.000755** -2.032 -0.021433* -2.658 Mother alive -0.07563*** -1.647 0.026300 0.472 Mother at home -0.093340* -2.950 -0.009054** -2.310 Father alive 0.07465*** 1.860 -0.034217* -2.726 Father at home -0.090142* -4.584 0.000345 0.017 Pipe water -0.070227* -5.757 -0.020778*** -1.855 Sanitary toilet -0.094301** -2.518 -0.00989** -2.319 Non-iodized salt -0.02077*** -1.864 -0.002984 -0.284 Tile as floor material -0.09276*** -1.928 -0.027845*** -1.642 Electricity 0.0676983* 4.030 -0.044275*** -1.845 Radio -0.040869* -3.217 -0.23967** -2.120 Television -0.102960* -4.017 -0.011490 -0.458 Refrigerator -0.032214 -1.013 -0.005821 -0.210 F- Value 9.35* 9.00*
* - statistically significant at 1 percent level ** - statistically significant at 5 percent level *** - statistically significant at 10 percent level

14
ones in all aspects of child care, food formulation and understanding of the
needs of the child at every stage of growth and development.
Those children who were given vitamin A in Gambia have significantly
lower probability of becoming stunting, while the opposite was observed for
Swaziland. The longer the time that child last took vitamin A, the higher the
probability of becoming stunting in Gambia. In many developing countries,
institutional arrangements for campaigning for fortification of food with vitamin
A are now in place. Educated mothers are likely to be better informed.
The parameters estimated for child ever breastfed show the expected
negative relationship for Gambia. Child being currently breast-feeding
significantly reduces the probability of stunting in Niger. Mothers’ education
may enhance their skills for breastfeeding, especially in the area of milk
extraction for babies use.
The parameters estimated for children having diarrhea in the previous
two weeks before the interview have the expected positive sign for all the
countries. Therefore, illness with diarrhea increases the probability of child
growing stunting. However, infection with cough has no significant effect on the
probability of child becoming stunted. Infection with fever significantly increases
the probability of stunting. In like manner, children that were sleeping under
mosquito nets have significantly lower probability of stunting. The mother with
high education will likely have a hygienic culture that will reduce child infection
with diseases.
The probability of stunting also decreases with increase in the number of
polio vaccines. Vaccination against measles leads to significant reduction in the
probability of stunting. These vaccines are all expected to enhance the health of
children as they guard the body against such sicknesses as diphtheria, polio and
tuberculosis. Most times, educated mothers may be more aware about where
these vaccines can be got.

15
Children whose mothers are alive have significantly lower probability of
stunting in Gambia. Children whose fathers are alive have significantly lower
probability of stunting in Niger, while the opposite applies for Gambia.
However, presence of the fathers at home significantly reduces the probability of
stunting only in Gambia. This implies that mothers play a stronger role in child
health outcomes as the caretaker and decision makers in respect to the nutrition
of the children.
Pipe (safe) water significantly reduces the probability of stunting. This is
expected because with clean water, some diseases that can distort growth and
development in children can be controlled. Presence of sanitary toilet also
significantly reduces the probability of stunting.
Children from homes where the floor materials are made of tiles have
lower probability of stunting. This could possibly associate with better sanitation
and expected high income of the users. However, electricity significantly reduces
the probability of stunting in Niger. However, it significantly increases it in
Gambia. Presence of radio significantly reduces the probability of stunting. Also,
presence of television significantly reduces the probability of stunting in Gambia.
This can be traced to the fact that they are media for educating the parents on
issues that affect their children’s health and information dissemination of
information. The presence of refrigerator does not show statistical significance in
any of the results.
Wasting
The analysis of the determinant of wasting in under-five children in table
6 shows that the male children in Niger have significantly higher probability of
wasting. As children grow older, their probability of wasting significantly
reduces in Niger. The more the hours of early learning, the less the probability of
wasting in Gambia. Possession of at least a primary education significantly
reduces the probability of wasting incidence in Gambia. Also, possession of at

16
Table 6: Probit Regression of the Determinants of Wasting (WHZ) Among
Children in Sub-Saharan Africa
Country/Variables Gambia Niger Parameter t-value Parameter t-value Constant 0.110953** 2.196 0.043876 0.742 Sex 0.001632 0.186 0.030855* 3.455 Urbanization 0.011081 0.823 -0.005992 -0.396 Age of child -0.000052 -0.118 -0.001065** -2.344 Hour of early learning -0.00167*** -1.860 0.000993 0.723 Mother’s primary education -0.03366*** -1.778 0.016108 0.955 Mother’s secondary education -0.022526* -2.815 -0.021965* -2.706 Vitamin A 0.003470 0.219 -0.000912 -0.220 Month since last dose of Vitamin A -0.001585 -1.136 0.001855* 2.634 Ever breast fed -0.032786 -0.738 -0.000901 -0.030 Currently breast feeding -0.007795 -0.536 0.062385* 3.941 Diarrhea in last 2 weeks 0.01022** 1.981 0.038717* 3.895 Cough in last 2 weeks 0.01537*** 1.828 0.012495** 2.129 Fever in last 2 weeks 0.001223** 2.094 0.037970* 3.786 Sleep under bed net -0.005832* -2.657 -0.022007** -1.961 Ever given BCG vaccines -0.003830** -2.103 -0.005607** -2.255 Age at first polio vaccine 0.018551* 2.677 0.042681* 2.753 Number of polio vaccine -0.005158** -2.561 0.003444 0.500 Number of DPT vaccine 0.008593 0.665 0.012900 1.602 Ever given measles vaccine -0.005476** -2.290 -0.001716** -2.249 Mother alive -0.012249** -2.326 0.024832 0.521 Mother at home 0.003065 0.121 0.007674 0.307 Father alive 0.028419 0.882 -0.025026 -0.621 Father at home -0.021821** -2.383 -0.014846 -0.842 Pipe water -0.022683** -2.318 0.000271 0.024 Sanitary toilet -0.000071 -0.696 -0.048304*** -1.819 Non-iodized salt 0.027217* 2.906 0.018943** 2.109 Tile as floor material -0.004470** -2.500 0.019914 1.349 Electricity 0.000556 0.041 0.032687*** 1.893 Radio 0.004710 0.462 -0.006674 -0.691 Television 0.01494*** 1.727 -0.021179* -2.987 Refrigerator -0.04402*** -1.727 0.026119 1.104 F- value 9.03* 8.93*
* - statistically significant at 1 percent level ** - statistically significant at 5 percent level *** - statistically significant at 10 percent level
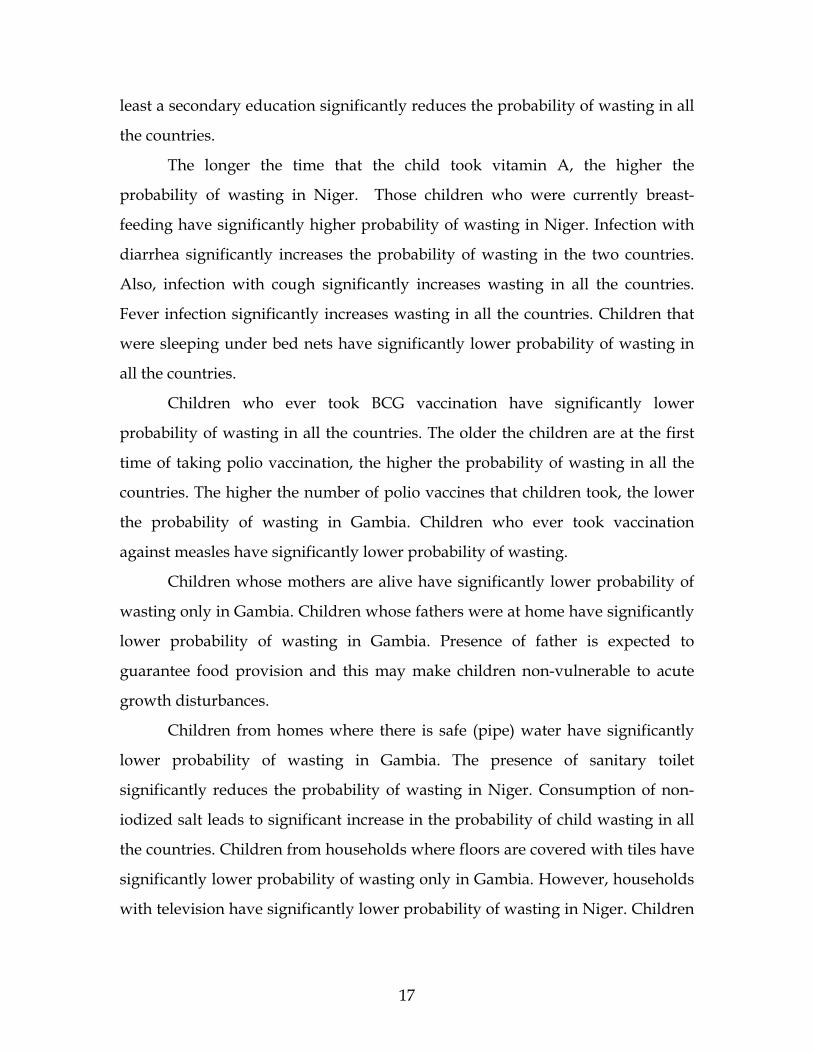
17
least a secondary education significantly reduces the probability of wasting in all
the countries.
The longer the time that the child took vitamin A, the higher the
probability of wasting in Niger. Those children who were currently breast-
feeding have significantly higher probability of wasting in Niger. Infection with
diarrhea significantly increases the probability of wasting in the two countries.
Also, infection with cough significantly increases wasting in all the countries.
Fever infection significantly increases wasting in all the countries. Children that
were sleeping under bed nets have significantly lower probability of wasting in
all the countries.
Children who ever took BCG vaccination have significantly lower
probability of wasting in all the countries. The older the children are at the first
time of taking polio vaccination, the higher the probability of wasting in all the
countries. The higher the number of polio vaccines that children took, the lower
the probability of wasting in Gambia. Children who ever took vaccination
against measles have significantly lower probability of wasting.
Children whose mothers are alive have significantly lower probability of
wasting only in Gambia. Children whose fathers were at home have significantly
lower probability of wasting in Gambia. Presence of father is expected to
guarantee food provision and this may make children non-vulnerable to acute
growth disturbances.
Children from homes where there is safe (pipe) water have significantly
lower probability of wasting in Gambia. The presence of sanitary toilet
significantly reduces the probability of wasting in Niger. Consumption of non-
iodized salt leads to significant increase in the probability of child wasting in all
the countries. Children from households where floors are covered with tiles have
significantly lower probability of wasting only in Gambia. However, households
with television have significantly lower probability of wasting in Niger. Children

18
whose households have refrigerator also have lower probability of wasting in
Gambia.
Underweight
The Probit analysis for determinants of underweight in table 7 shows that
urban children have significantly lower probability of underweight in the two
countries. Also, possession of at least a secondary education by the mothers
significantly reduces the probability of under-five underweight.
Consumption of food fortified with vitamin A significantly reduces the
probability of underweight in Gambia. Also, children that were ever breastfed
have significantly lower probability of underweight in Gambia. Children who
are currently breast-feeding in Niger have significantly lower probability of
underweight.
Infection with diarrhea significantly increases the probability of
underweight in all the countries. This is expected because diarrhea causes a lot of
discomfort and leads to quick weight losses. However, the parameter of cough
infection shows no statistical significance (p > 0.10). Fever infection leads to
significant increase in the probability of underweight in Niger. Sleeping under
bed net significantly reduces the probability of underweight.
Ever received BCG vaccination leads to significant reduction in the
probability of underweight. The older the children are at the first polio vaccine,
the higher the probability of underweight. Increase in the number of polio
vaccines significantly reduces the incidence of underweight. The number of DPT
vaccination significantly reduces the probability of underweight. Also, measles
vaccination leads to significant reduction in probability of underweight in Niger.
The probability of under-five children underweight significantly reduces
when the mothers of the children are alive in Gambia. Also, when the mothers of
the children are at home, the probability of underweight significantly reduces in

19
Table 7: Probit Regression of the Determinants of Underweight (WAZ) Among
Children in Sub-Saharan Africa
Country/Variables Gambia Niger Parameter t-value Parameter t-value Constant 0.301076* 4.293 0.177462** 2.227 Sex 0.002636 0.216 -0.000583 -0.048 Urbanization -0.035544*** -1.901 -0.044414** -2.176 Age of child 0.000126 0.202 0.000462 0.755 Hour of early learning -0.001171 -0.735 -0.003107*** -1.876 Mother’s primary education -0.007167 -0.273 -0.020750 -0.912 Mother’s secondary education -0.041661** -2.085 -0.015022*** -1.865 Vitamin A -0.064549* -2.939 0.007240 1.295 Month since last dose of Vitamin A -0.000188 -0.097 -0.000455 -0.298 Ever breast fed -0.100265*** -1.825 0.040383 1.001 Currently breast feeding 0.000082 0.004 -0.011163*** -2.523 Diarrhea in last 2 weeks 0.014193** 1.981 0.076651* 5.720 Cough in last 2 weeks -0.002139 -0.133 0.008177 0.548 Fever in last 2 weeks -0.062672* -3.465 0.057647* 4.263 Sleep under bed net -0.061165* -4.963 -0.041083* -2.716 Ever given BCG vaccines -0.045319*** -1.879 -0.043743** -2.478 Age at first polio vaccine 0.049352** 2.298 0.031129** 1.948 Number of polio vaccine -0.009074* -2.711 -0.18798** -2.026 Number of DPT vaccine -0.023973** -2.336 -0.000469** -2.046 Ever given measles vaccine -0.012587 -0.481 0.023277** 2.505 Mother alive -0.012634** -2.242 0.040361 0.629 Mother at home -0.039912** -2.133 -0.000666 -0.020 Father alive -0.024982 -0.559 -0.048800 -0.898 Father at home -0.040539*** -1.851 -0.023424** -1.985 Pipe water -0.011813** -1.969 -0.027452*** -1.782 Sanitary toilet -0.047930 1.149 -0.054350 -1.518 Non-iodized salt -0.11935 -0.961 0.0084689*** 1.699 Tile as floor material -0.0074865** -2.140 -0.033993*** -1.707 Electricity -0.004847** -2.259 -0.021274*** -1.769 Radio -0.010301 -0.728 -0.024386*** -1.872 Television -0.063910** -2.239 -0.022884* -2.791 Refrigerator 0.0062582 0.177 -0.003983 -0.125-
* - statistically significant at 1 percent level ** - statistically significant at 5 percent level *** - statistically significant at 10 percent level

20
Gambia. Children whose fathers were at home have significantly lower
probability of underweight.
Children from homes where there is access to pipe (safe) water have
significantly lower probability of underweight. Also, children from homes where
there is access to sanitary toilet have significantly lower probability of
underweight. Consumption of non-iodized salt significantly increases the
probability of underweight in Niger. The parameters of flooring material show
that those children from houses where tiles are the floor material have
significantly lower probability of underweight. Presence of electricity at home
significantly reduces the probability of underweight. Presence of radio
significantly reduces the probability of underweight. Children from households
where television is present also have significantly lower probability of
underweight. This could result from benefits derived from nutrition related
programs and expected affluence/high income of those using the asset. The
parameters of presence of refrigerators have no significant effect on the
probability of underweight.
4. Policy Recommendations
This study presents an analysis of the state of malnutrition and mortality
among children in Gambia and Niger. The policy issues emanating from the
study are hereby discussed:
First, the study shows that stunting is a major problem among the
children. Therefore, efforts to address malnutrition must be consistently pursued
until substantial results are achieved. A situation where there is no continuity in
child welfare programs will not be to the advantage of the intended beneficiaries.
This implies that institutional arrangement must be put in place for ensuring
sustainability of child health programs so that chronic growth disturbances that
ultimately manifest in stunting will be addressed. However, special attention

21
must be channeled towards assisting children in Niger (where wasting and
underweight are higher) given their present food crises.
Second, the analyses reveal that malnutrition health outcomes worst affect
rural areas. The divides in infrastructure and institutional services between
urban and rural areas must have accounted for this. Therefore, improvement in
rural health services will foster prompt clinic attendance and reduce child
mortality. In addition, efforts must be channeled towards empowering rural
people for increased income generation so malnutrition can be reduced.
Assisting African rural people presumes that the understanding of their risk and
vulnerability is well noted. Setting up a kind of conditional cash transfer
programs to cater for their health and children education can help.
Third, stunting becomes more prominent as children grow older. The
need to implement school feeding program to complement the food provided by
the parents can therefore be justified. The needed institution for proper
implementation of this program must be set up.
Fourth, education of mothers reduces the health problems of malnutrition.
However, this study reveals that attainment of primary education by women
may not lead to significant reduction in wasting and underweight, but secondary
education will. There is therefore the need to strengthen educational institutions
in these countries in order to be able to cater for secondary education of girls,
especially those in rural areas. The alternative of adult education can be explored
in order to cater for grown up women who might be interested in education.
Fifth, although mixed results were obtained on the effect of food
fortification with vitamin A on child health outcomes, a general consensus is that
children given vitamin A fortified foods fare better. The need to create awareness
about the benefits of vitamin A fortified food cannot be over-emphasized,
especially in the rural areas. Companies that are producing some food meant for
children must also compulsorily fortify them with vitamin A. This effort will

22
lead to reduction in the incidence of diseases caused by vitamin A deficiency,
and chronic and acute growth disturbances will be reduced.
Sixth, the analysis show that breast fed children generally have lower
incidence of malnutrition health problems. The need to strengthen health related
institutions in order to create awareness and educate women on breast-feeding
should be emphasized. This will help some women to discard some cultural
views that a lazy woman’s baby is the one that sucks breast to satisfaction.
Seventh, this study finds that malnutrition health outcomes are more
prominent among children that had suffered from one form of sickness or the
other. Specifically, diarrhea presents the most serious threat, by significantly
increasing stunting, wasting and underweight among the children. This is
followed by fever. There is need to ensure that health institutions strengthen
their in-house education of mothers on the causes of these diseases. A major step
is to educate them to threat all food items meant for little babies with utmost and
strict hygiene. Available water (especially in the rural areas) may not always be
clean, but women must cultivate the habit of boiling the water meant for children
under-five. Also, ensuring that children are prevented from fever/malaria is a
necessary step. This study finds that children that were sleeping under bed nets
have lower problems of stunting, wasting and underweight in some countries.
This somehow strengthens the fact that private, corporate and public
organizations should assist by providing mosquito nets to children, especially
those in the rural areas where housing quality may not be too good.
Eight, it was found that children who obtained some vaccination (BCG,
polio, DPT and measles) have significantly lower incidence of malnutrition
health outcomes. This results from the concomitant prevention of diseases like
polio, diphtheria and tuberculosis. The need therefore arises to strengthen the
health institutions in SSA, in order to be able to cope with the financial needs of
vaccinating children and pregnant women free of charge. Appropriate
institutional arrangements for taking these services to the rural areas must also
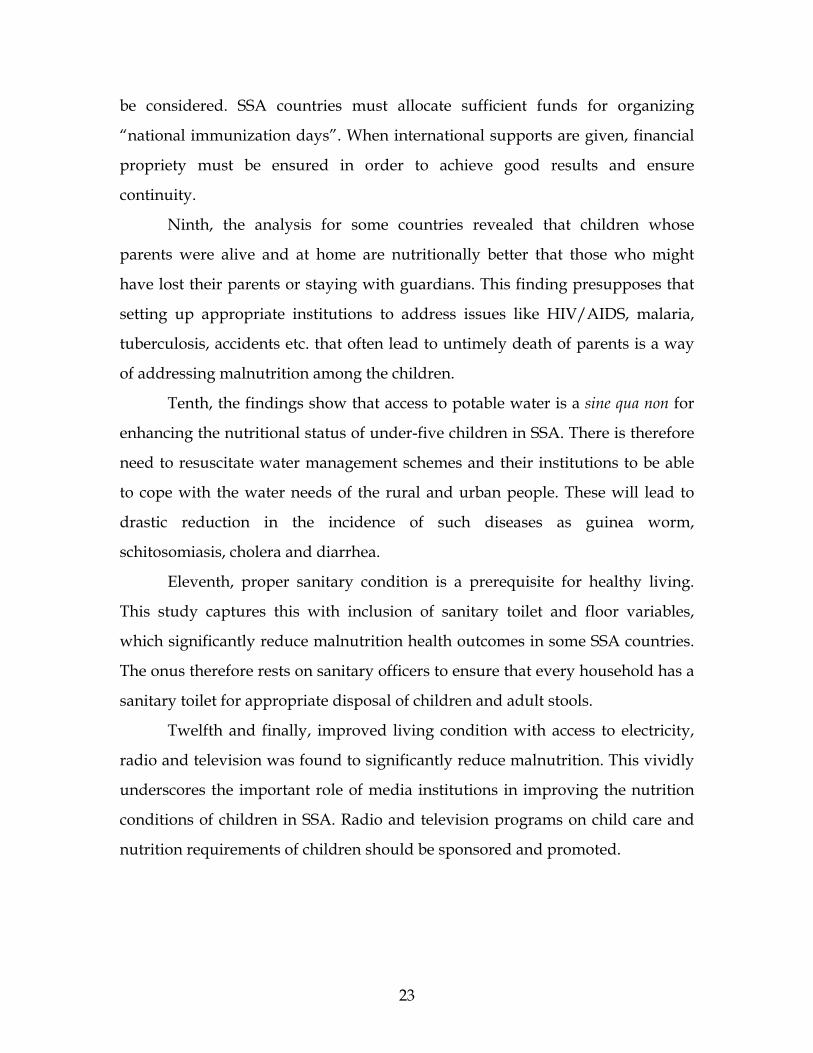
23
be considered. SSA countries must allocate sufficient funds for organizing
“national immunization days”. When international supports are given, financial
propriety must be ensured in order to achieve good results and ensure
continuity.
Ninth, the analysis for some countries revealed that children whose
parents were alive and at home are nutritionally better that those who might
have lost their parents or staying with guardians. This finding presupposes that
setting up appropriate institutions to address issues like HIV/AIDS, malaria,
tuberculosis, accidents etc. that often lead to untimely death of parents is a way
of addressing malnutrition among the children.
Tenth, the findings show that access to potable water is a sine qua non for
enhancing the nutritional status of under-five children in SSA. There is therefore
need to resuscitate water management schemes and their institutions to be able
to cope with the water needs of the rural and urban people. These will lead to
drastic reduction in the incidence of such diseases as guinea worm,
schitosomiasis, cholera and diarrhea.
Eleventh, proper sanitary condition is a prerequisite for healthy living.
This study captures this with inclusion of sanitary toilet and floor variables,
which significantly reduce malnutrition health outcomes in some SSA countries.
The onus therefore rests on sanitary officers to ensure that every household has a
sanitary toilet for appropriate disposal of children and adult stools.
Twelfth and finally, improved living condition with access to electricity,
radio and television was found to significantly reduce malnutrition. This vividly
underscores the important role of media institutions in improving the nutrition
conditions of children in SSA. Radio and television programs on child care and
nutrition requirements of children should be sponsored and promoted.
24
References
ACC/SCN (2000). Nutrition Throughout the Life Cycle, 4th Report on the World Nutrition Situation, Geneva.
de Onis, M. (2000). Measuring nutritional status in relation to mortality Bull
World Health Organ Vol.78 No.10 Geneva 2000. Christiansen, L. and H. Alderman (2001). “Child Malnutrition in Ethiopia: Can
Maternal Knowledge Augment the Role of Income?”African Region Working Paper Series No. 22. Washington DC.: The World Bank.
Department of Census and Statistics (2003). Nutritional Status of Pre-School
Children in Sri Lanka. Concluding Workshop. RETA 6007: Enahancing Social and gender Statistics. 24-27 June 2003, Bangkok, Thailand. http://www.unescap.org/stat/meet/esgs2/esgs2 srilanka.pdf, download
Engle, P. P. Menon and L. Haddad (1999). Care and Nutrition: Concept and
Measurement. World Development 27 (8):1309-1337. Foster, J.E., J. Greer and and E. Thorbecke (1984). A Class of Decomposable
Poverty Measure. Econometrica. 52(1):761-766. Gómez F. et al (1955). Malnutrition in Infancy and Childhood with Special
Reference to Kwashiorkor. Advances in Pediatrics 7:131-136. Gunasekara, H.R. (1999). Nutrition Status of Children in Sri Lanka. Sri Lankan
Journal of Population Studies. 1(12):57-73. Ryan, J.G. et al (1984). The Determinants of Individual Diets and Nutritional
Status in Six Villages of Southern India. Research Bulletin of International Crops Research Institute for Semi Arid Tropics. 7:45-52.
Sahn, D.E and D.C. Stifel (2002). Robust Comparisons of Malnutrition in
Developing Countries. American Journal of Agricultural Economics 84(3):716-735.
Shah, M.S., B.J. Selwyn, S. Luby, A. Merchant and R. Bano (2003). Prevalence and
Correlates of Stunting Among Children in Rural Pakistan. Pediatrics International. 45 (1): 49-
Silva, P (2005). Environmental Factors and Children’s Malnutrition in Ethiopia.
World Bank Policy Research Working Paper 3489, January 2005.

25
Smith, L.C. and L. Haddad (2000). Explaining Child Malnutrition in Developing
Countries: A Cross Country Analysis. International Food Policy Research Institute (IFPRI), Washington, D.C.
Smith, L.C. , M.T. Ruel and A. Ndiaye (2004). Why is Malnutrition Lower in Urban
Than Rural Areas? Evidence from 36 Developing Countries. FCND Discussion paper. IFPRI.
Thomas, D., J. Straus and M.H. Henriques (1990). Child Survival for Age and
Household Characteristics in Brazil. Journal of Development Economics 33:197-234
UNICEF (1990). Strategy for Improved Nutrition of Children and Women in
Developing Countries. New York. UNICEF (1998). The State of the World’s Children 1998. New York. World Health Organization (WHO) (1995). Physical status: the use and
interpretation of anthropometry. Report of a WHO Expert Committee. Geneva, World Health Organization, 1995 (WHO Technical Report Series, No. 854).
World Health Organization (WHO) (2000). Nutrition for Health and
Development (NHD) A global agenda for combating malnutrition World Health Organization, Sustainable Development and Healthy Environments (SDE) Nutrition for Health and Development (NHD).
Zere, E. and D. McIntyre (2003). Inequities in Under-Five Child malnutrition in
South Africa. International Journal for Equity in Health 2:7 www.equityhealthj.com/content/2/1/7