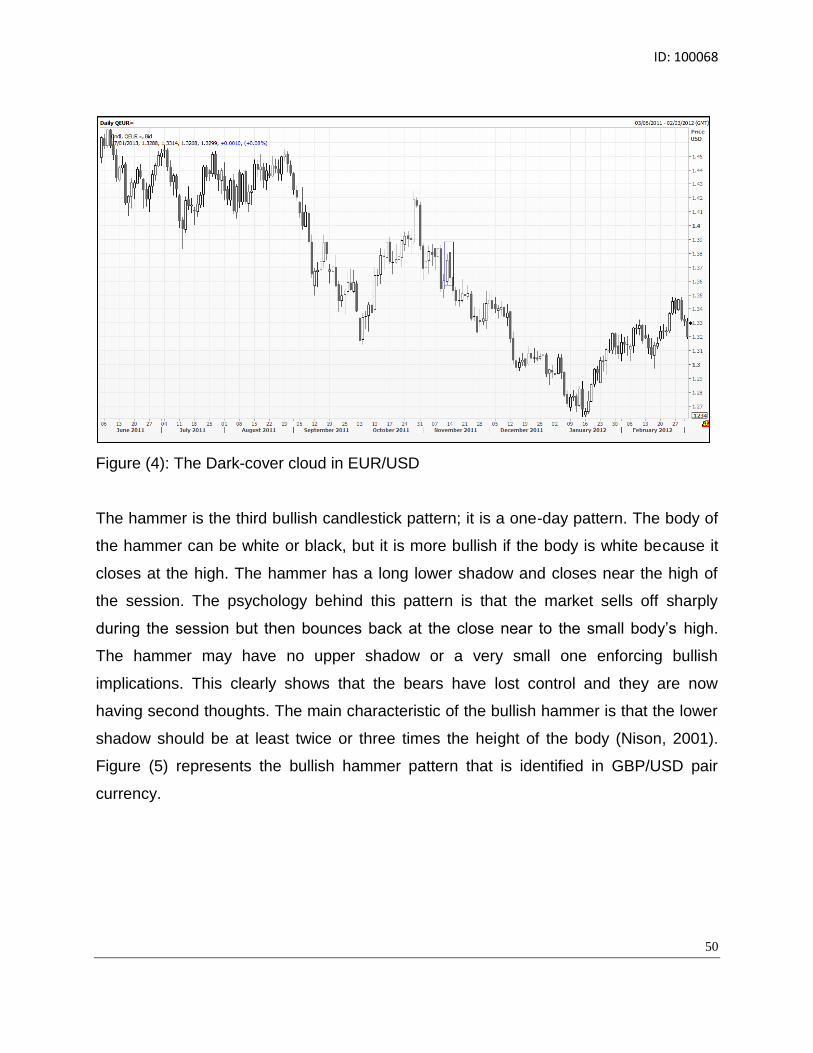
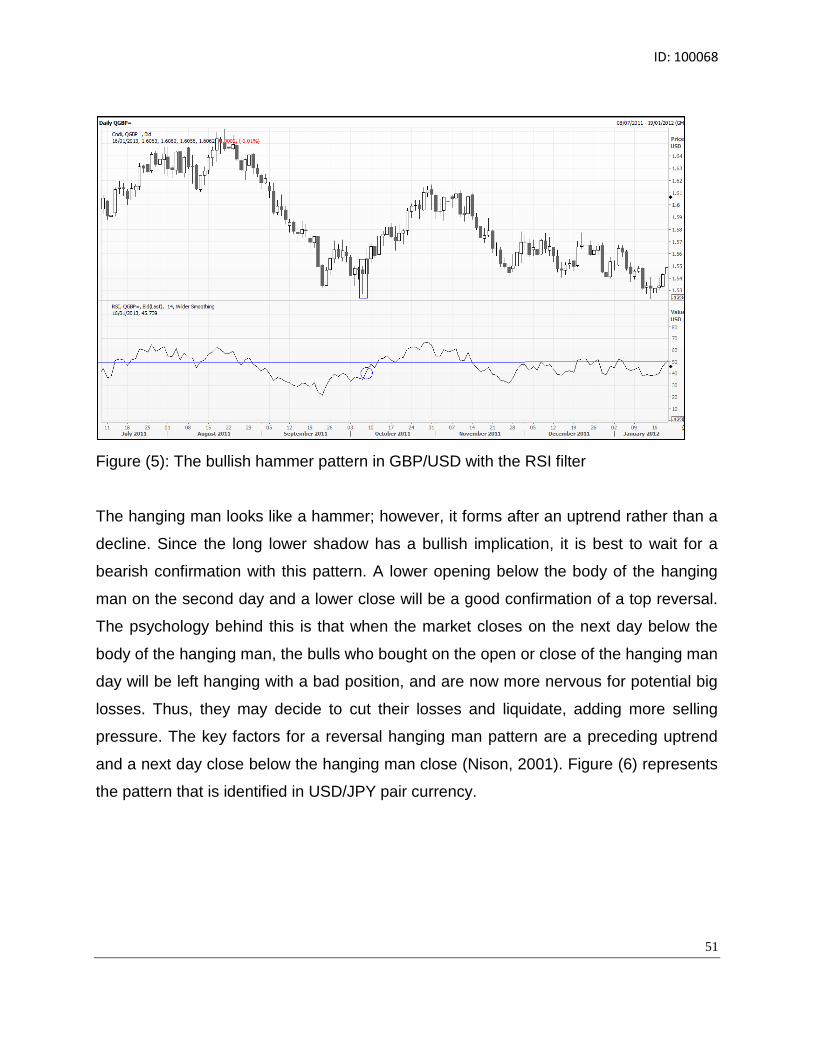
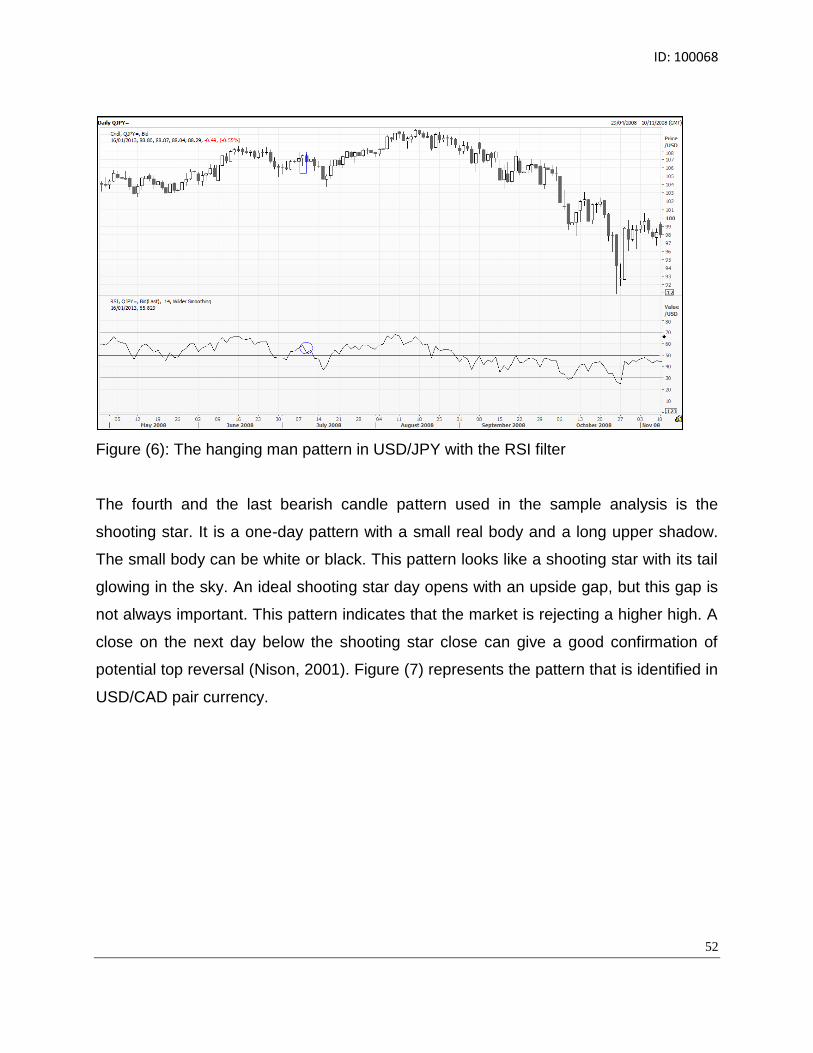
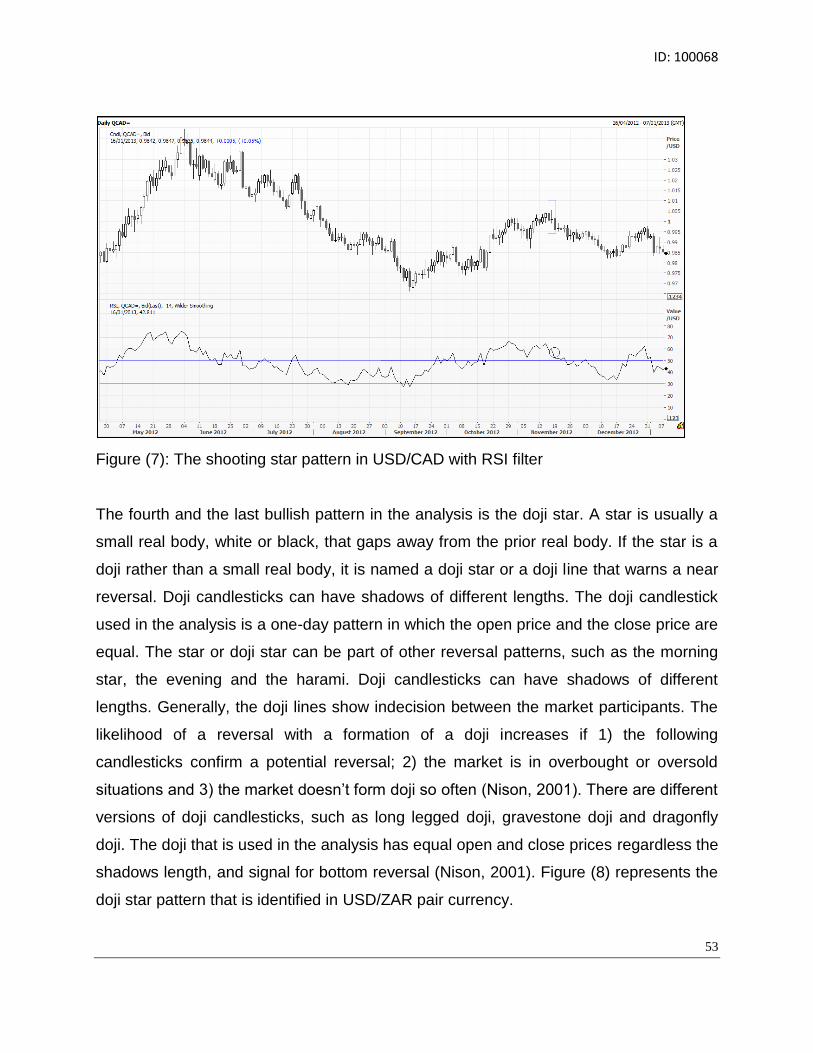
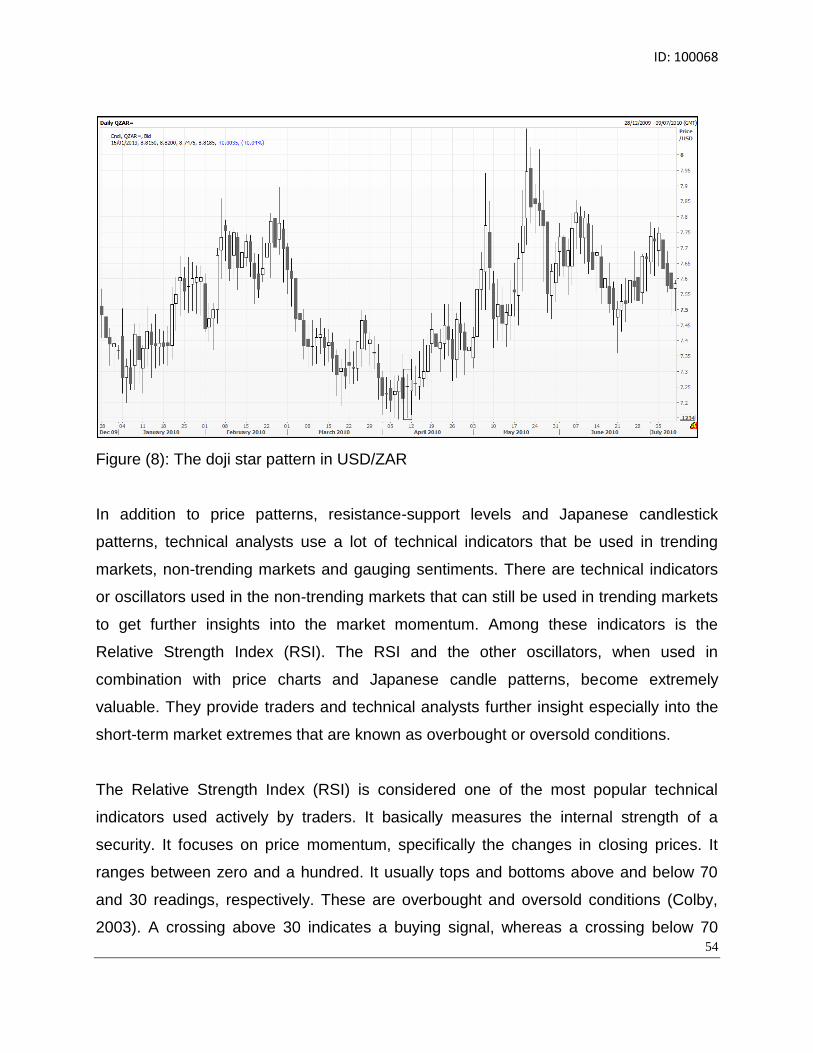
do japanese candlestick patterns help identify profitable
TRANSCRIPT

Do Japanese Candlestick Patterns Help Identify
Profitable Trading Opportunities
An Analysis on Selected Forex Markets
هل تساعد نماذج الشموع اليابانية على إيجاد فرص تداول مربحة
تحليل لأسواق عملات أجنبية مختارة
By
Aisha Ahmed Ameen
100068
Dissertation submitted in partial fulfilment of the requirement
for the degree of MSc in Finance and Banking
Faculty of Business
Dissertation Supervisor
Dr Elango Rengasamy
January 2013
ID 100068
Abstract
Japanese candlestick charts were first introduced to the Western world in 1989
by Steve Nison No one in the West got to know about the Japanese technical
analysis before the first edition of his textbook and no charting packages
included them either prior to the first edition Japanese candlestick patterns have
become very popular since then Japanese candlestick patterns are technical
trading rules that are used to predict price directions based on the relationship
between opening high low and closing prices Currently many market
participants are implementing Japanese candle patterns as part of their robust
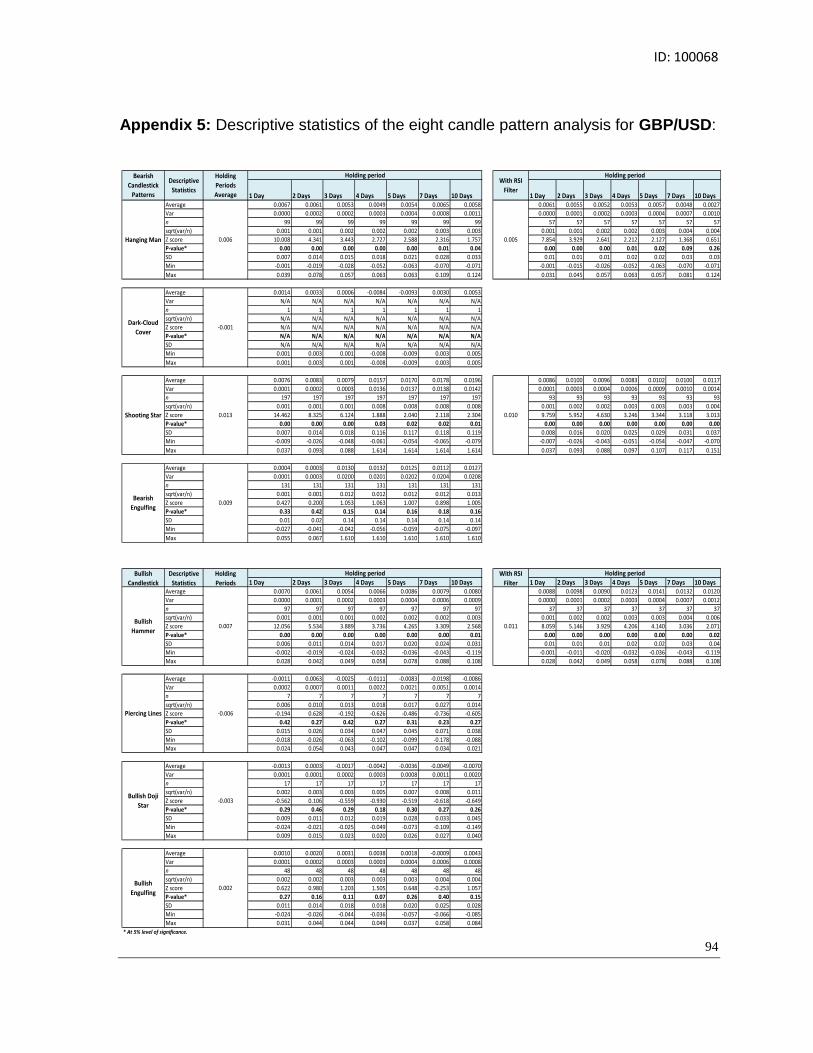
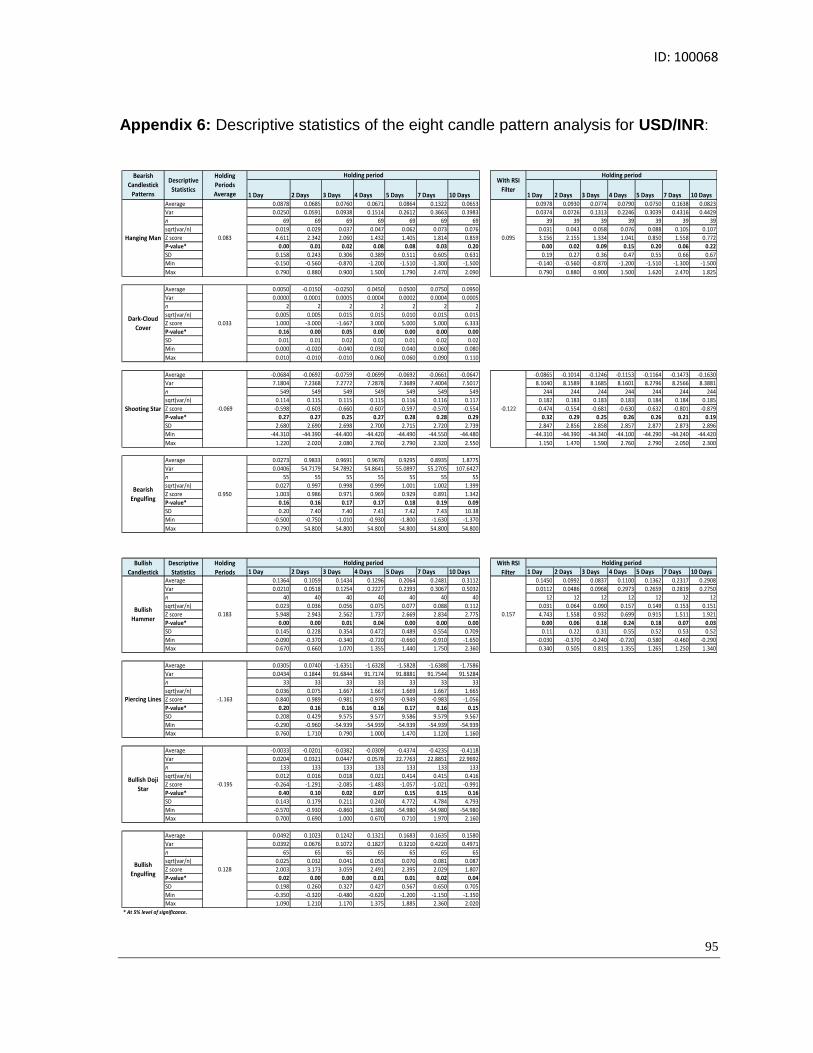
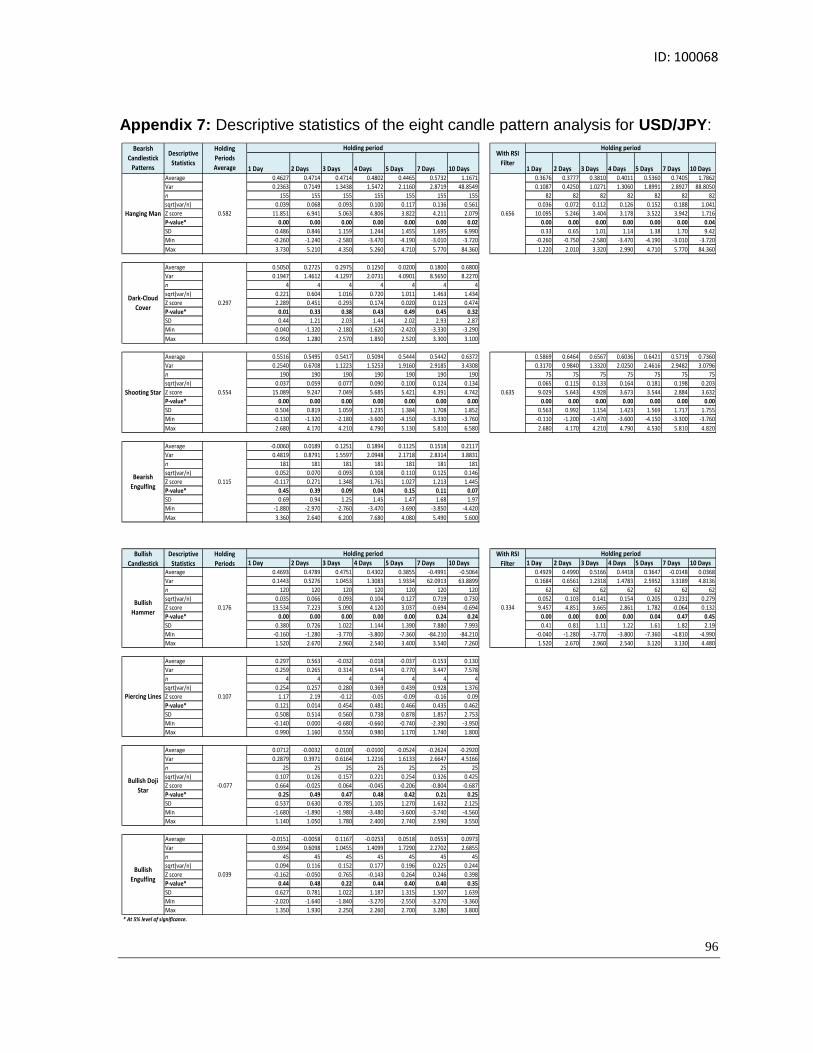
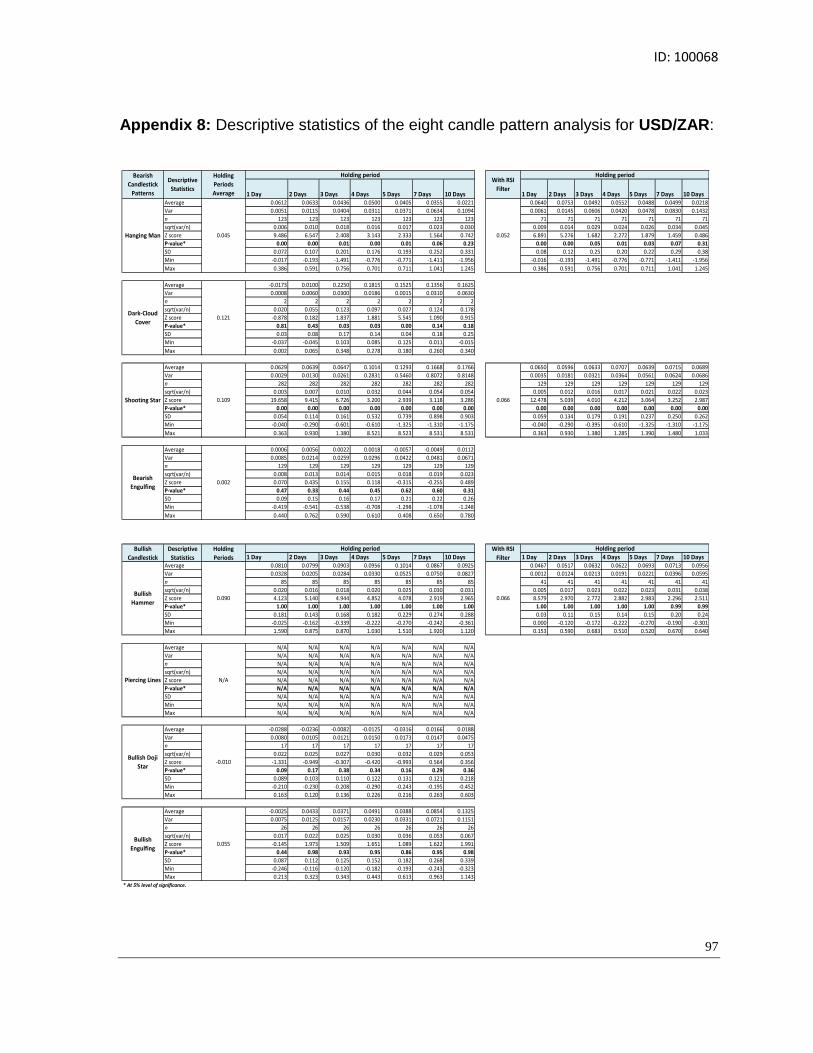
trading systems This research examines the profitability of four bullish and four
bearish Japanese candlestick reversal patterns in seven foreign exchange
currencies which represent both advanced and emerging foreign currency
markets These currencies include AUDUSD USDCAD EURUSD GBPUSD
USDINR USDJPY and USDZAR The sample covers a 12-year span of 3129
observations The statistical z score test is used to test the statistical significance
of the returns at 5 level for seven holding periods The RSI is used with three
candle patterns to further filter the results The findings show strong evidence of
some profitable candlestick reversal patterns in foreign currency markets
ID 100068
Acknowledgments
I take this opportunity to thank all the people who have helped me understand
and obtain the necessary information to conduct and complete this research
I would like to thank Dr Elango Rengasamy my supervisor for encouraging me
and providing ongoing support from day one till the submission date I would also
like to thank Jordan Kotick a technical analyst at Barclays London for providing
me with useful literature reviews and Ali Al Abdouli Learning and Development
Specialist ndash E-learning Solutions at Emirates who helped me understand excel
functions Finally I would like to thank BUiD librarians for assisting me with all my
requirements that I needed throughout the period of my research
ID 100068
1
Table of Contents
Chapter 1 Introduction helliphelliphelliphelliphelliphelliphelliphelliphelliphelliphelliphelliphelliphelliphelliphelliphelliphelliphelliphelliphelliphelliphelliphelliphellip 3
11 Rational of the Research helliphelliphelliphelliphelliphelliphelliphelliphelliphelliphelliphelliphelliphelliphelliphelliphelliphelliphelliphellip 5
12 Research Problems helliphelliphelliphelliphelliphelliphelliphelliphelliphelliphelliphelliphelliphelliphelliphelliphelliphelliphelliphelliphelliphellip 6
13 Objectives of the Research helliphelliphelliphelliphelliphelliphelliphelliphelliphelliphelliphelliphelliphelliphelliphelliphelliphellip 7
14 Null Hypothesis helliphelliphelliphelliphelliphelliphelliphelliphelliphelliphelliphelliphelliphelliphelliphelliphelliphelliphelliphelliphelliphelliphelliphellip 7
15 Limitations of the Research helliphelliphelliphelliphelliphelliphelliphelliphelliphelliphelliphelliphelliphelliphelliphelliphelliphellip 8
Chapter 2 Efficient Market Hypothesis (EMH) helliphelliphelliphelliphelliphelliphelliphelliphelliphelliphelliphelliphelliphelliphellip 10
Chapter 3 Fundamental Analysis Vs Technical Analysis helliphelliphelliphelliphelliphelliphelliphelliphellip 15
31 Subjective Technical Analysis Vs Objective Technical Analysis helliphellip 20
Chapter 4 Literature Review helliphelliphelliphelliphelliphelliphelliphelliphelliphelliphelliphelliphelliphelliphelliphelliphelliphelliphelliphelliphelliphelliphellip 23
41 Explanation of Terms and Concepts helliphelliphelliphelliphelliphelliphelliphelliphelliphelliphelliphelliphelliphellip 24
42 Survey of Literature Reviews helliphelliphelliphelliphelliphelliphelliphelliphelliphelliphelliphelliphelliphelliphelliphelliphellip 25
43 Summary Comments and Criticism helliphelliphelliphelliphelliphelliphelliphelliphelliphelliphelliphelliphelliphellip 37
Chapter 5 Introduction in Technical Trading Ruleshelliphelliphelliphelliphelliphelliphelliphelliphelliphelliphelliphellip 44
Chapter 6 Methodology helliphelliphelliphelliphelliphelliphelliphelliphelliphelliphelliphelliphelliphelliphelliphelliphelliphelliphelliphelliphelliphelliphelliphelliphellip 56
61 Data sample helliphelliphelliphelliphelliphelliphelliphelliphelliphelliphelliphelliphelliphelliphelliphelliphelliphelliphelliphelliphelliphelliphellip 57
62 Analytical tools helliphelliphelliphelliphelliphelliphelliphelliphelliphelliphelliphelliphelliphelliphelliphelliphelliphelliphelliphelliphelliphellip 58
Chapter 7 Discussion of Study Analysis helliphelliphelliphelliphelliphelliphelliphelliphelliphelliphelliphelliphelliphelliphelliphelliphellip 66
Chapter 8 Findings and Recommendations helliphelliphelliphelliphelliphelliphelliphelliphelliphelliphelliphelliphelliphelliphelliphellip 72
Chapter 9 Conclusion helliphelliphelliphelliphelliphelliphelliphelliphelliphelliphelliphelliphelliphelliphelliphelliphelliphelliphelliphelliphelliphelliphelliphelliphellip 77
Bibliography helliphelliphelliphelliphelliphelliphelliphelliphelliphelliphelliphelliphelliphelliphelliphelliphelliphelliphelliphelliphelliphelliphelliphelliphelliphelliphelliphelliphelliphellip 81
Appendices helliphelliphelliphelliphelliphelliphelliphelliphelliphelliphelliphelliphelliphelliphelliphelliphelliphelliphelliphelliphelliphelliphelliphelliphelliphelliphelliphelliphelliphelliphellip 86
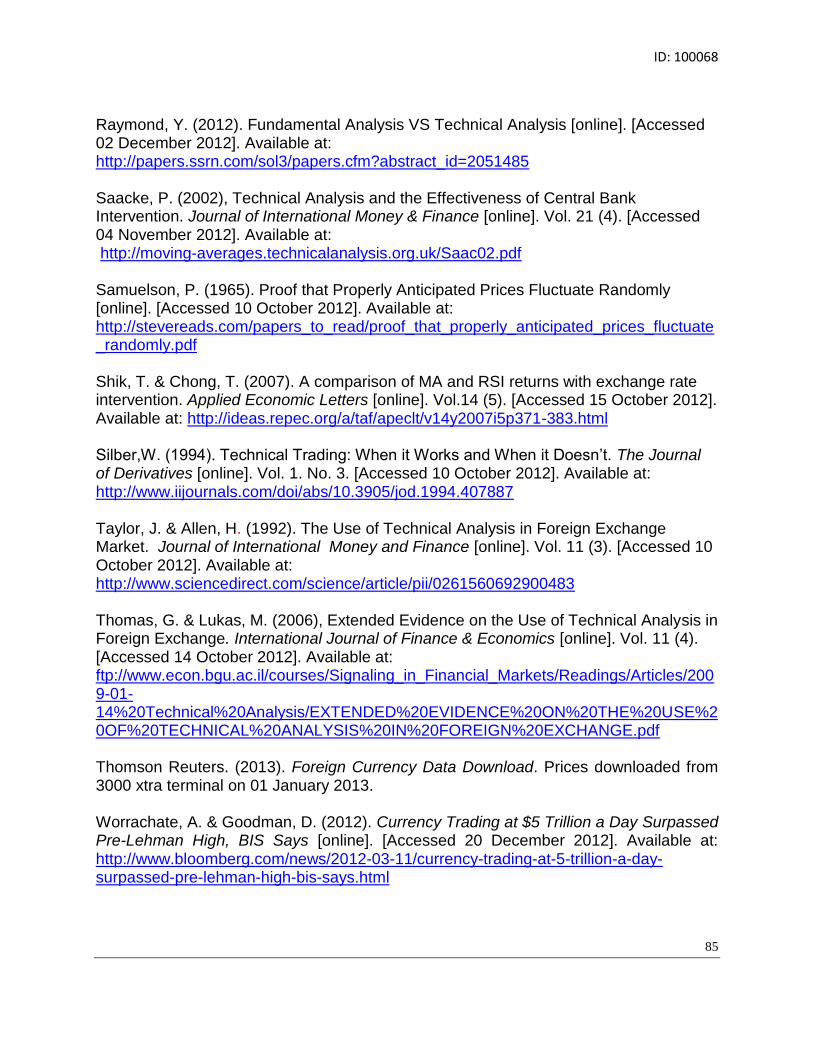
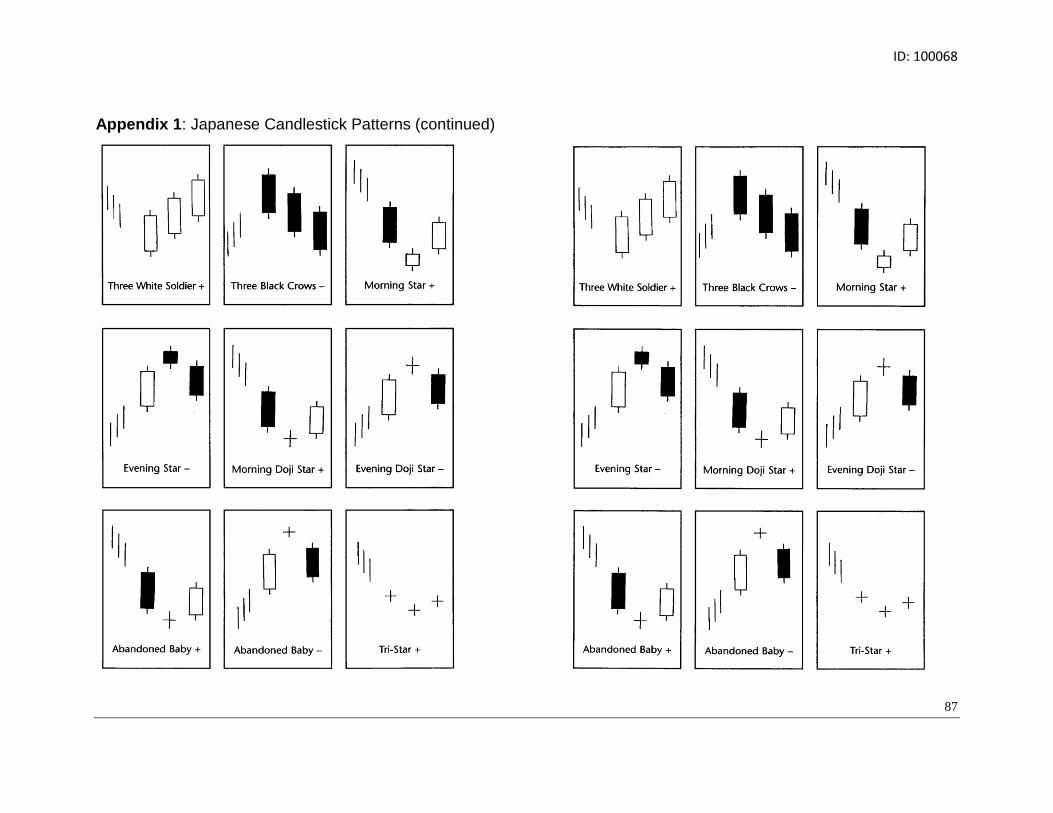
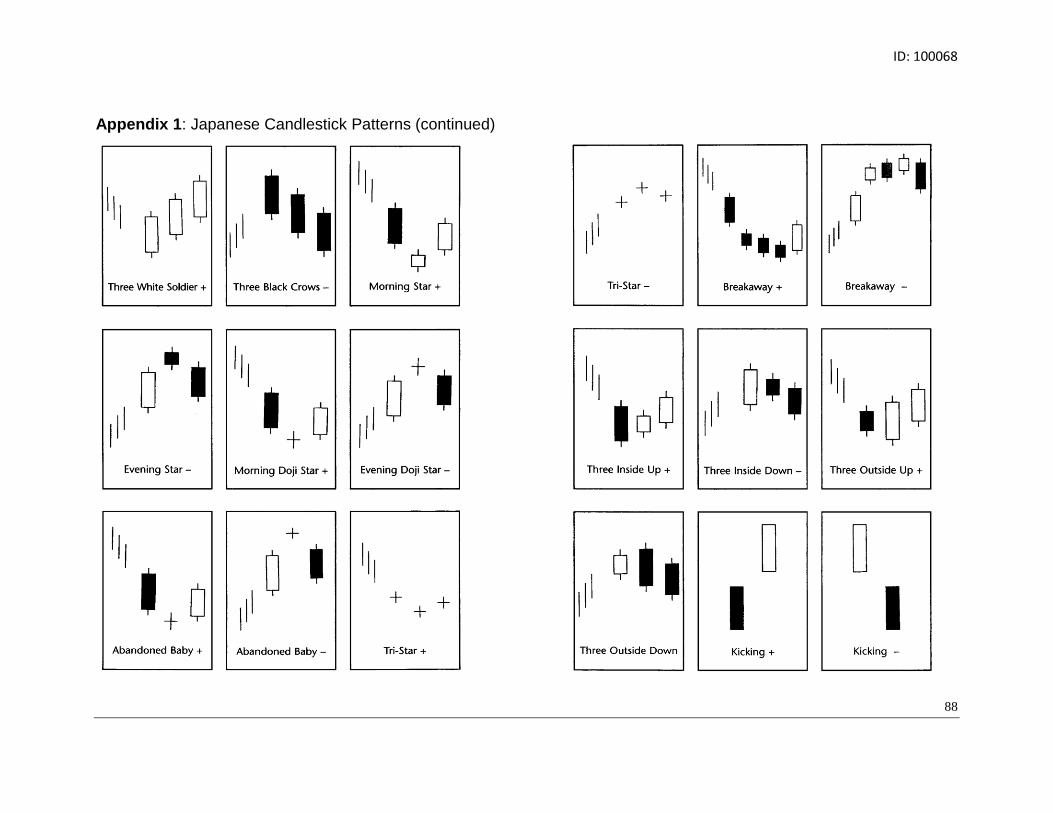
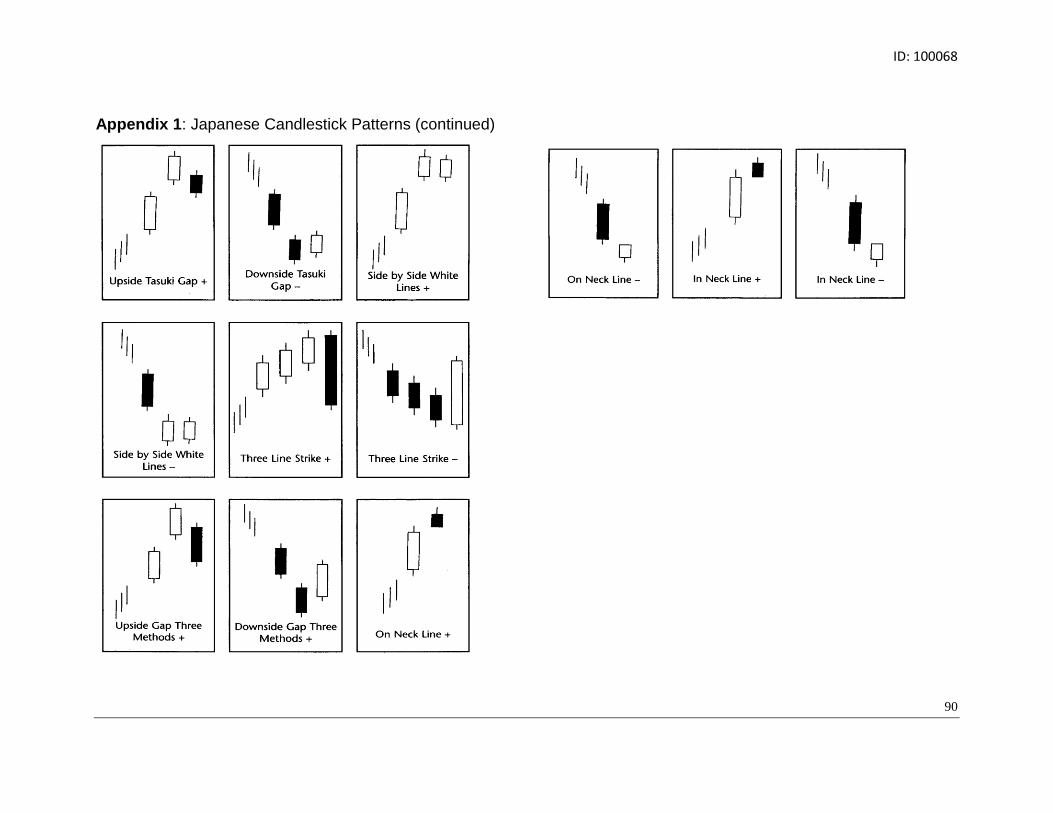
Appendix 1 Japanese Candlestick Patterns helliphelliphelliphelliphelliphelliphelliphelliphelliphelliphelliphelliphelliphelliphelliphelliphellip 86
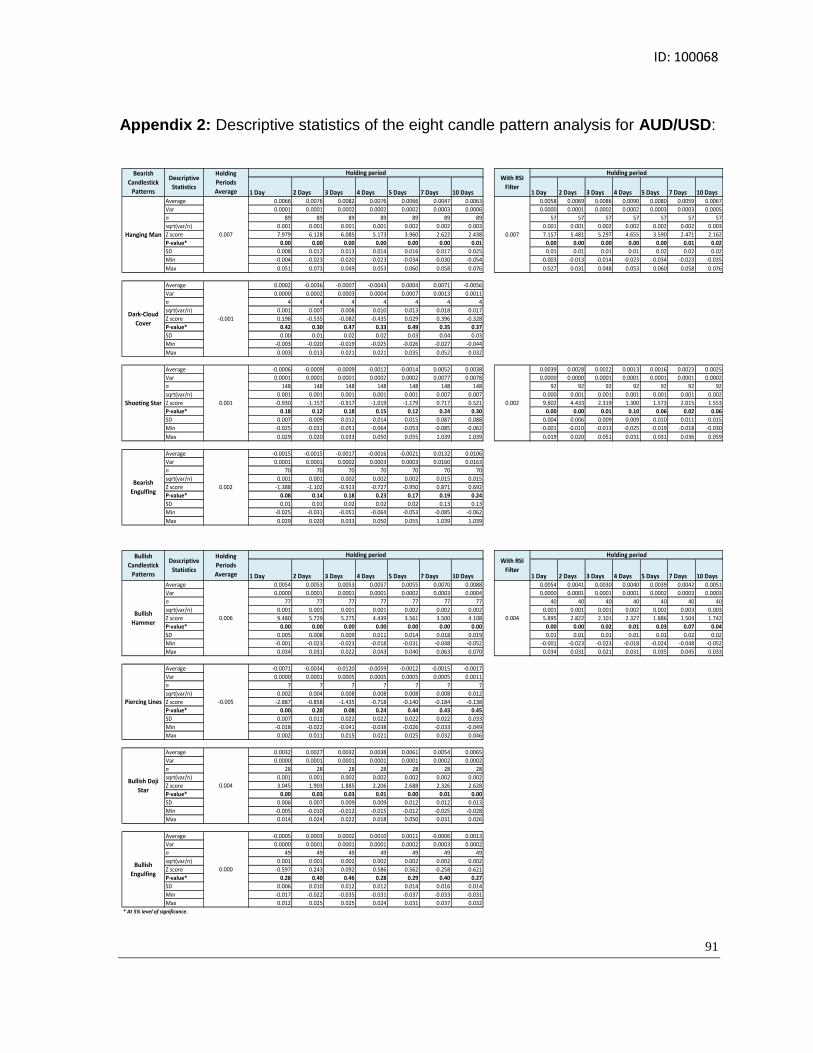
Appendix 2 Descriptive statistics of candle pattern analysis for AUDUSD helliphelliphellip 91
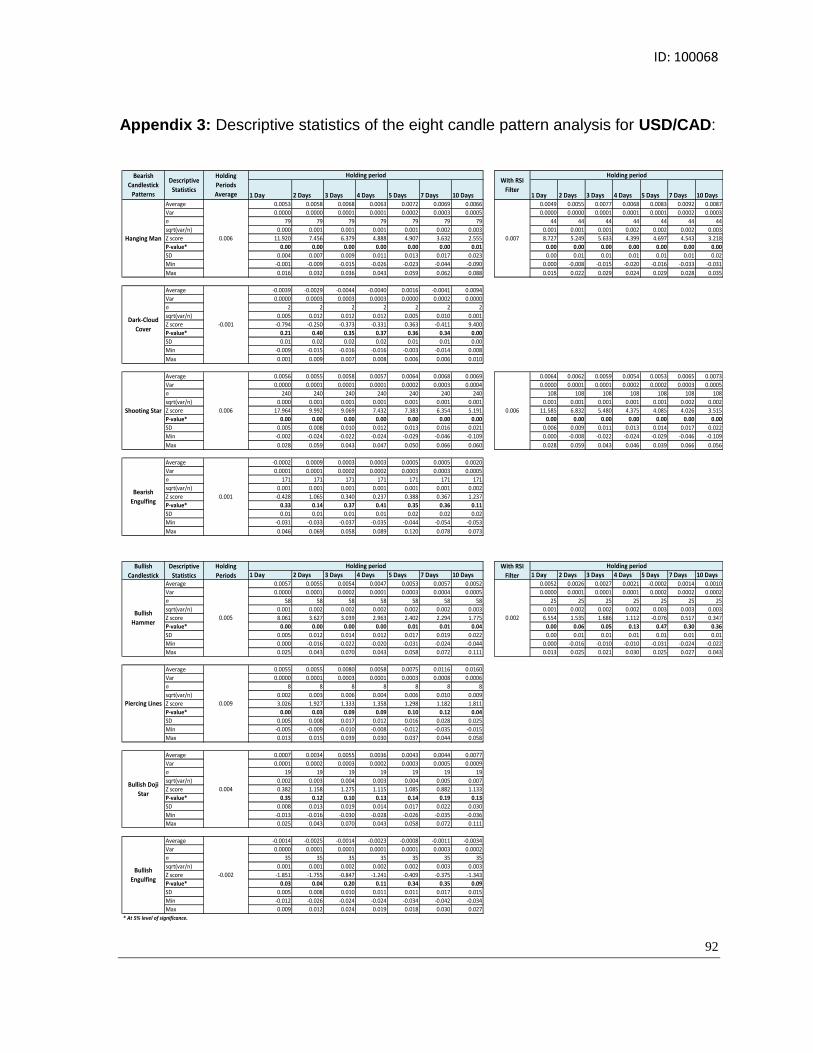
Appendix 3 Descriptive statistics of candle pattern analysis for USDCAD helliphelliphelliphellip 92
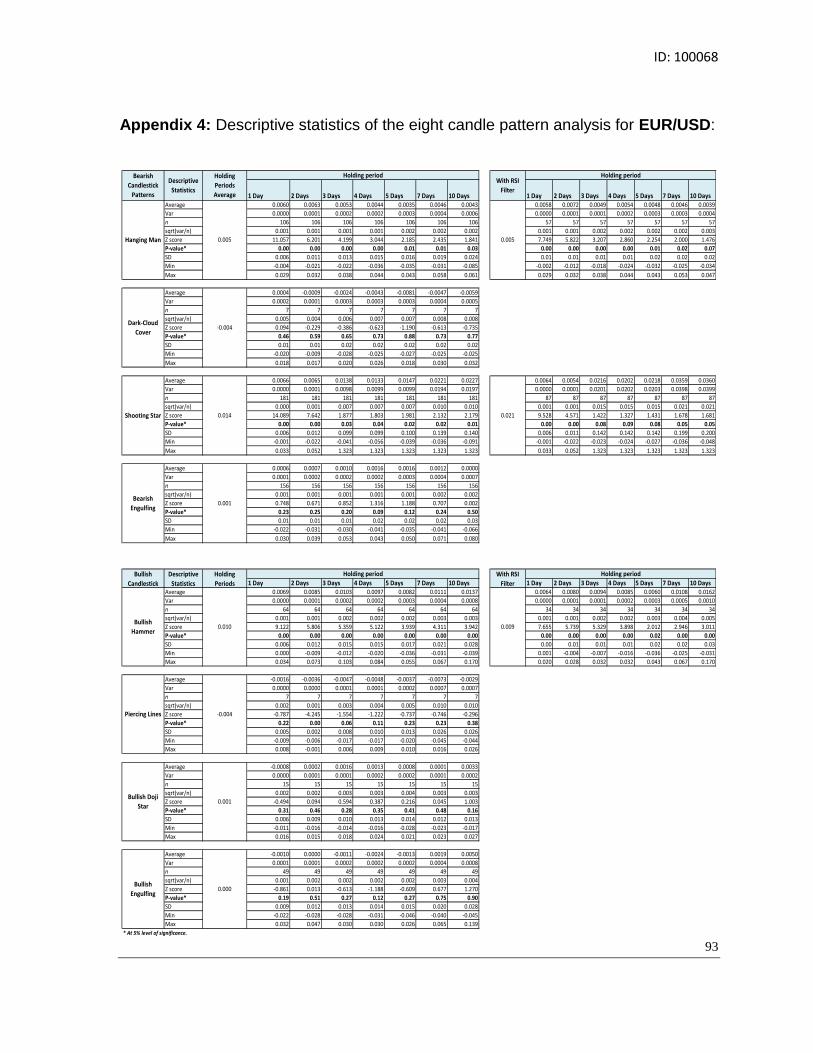
Appendix 4 Descriptive statistics candle pattern analysis for EURUSD helliphelliphelliphellip 93
Appendix 5 Descriptive statistics candle pattern analysis for GBPUSD helliphelliphelliphellip 94
ID 100068
2
Appendix 6 Descriptive statistics candle pattern analysis for USDINR helliphelliphelliphelliphellip 95
Appendix 7 Descriptive statistics candle pattern analysis for USDJPY helliphelliphelliphelliphellip 96
Appendix 8 Descriptive statistics candle pattern analysis for USDZAR helliphelliphelliphellip 97
ID 100068
3
Chapter 1
Introduction
ID 100068
4
Chapter 1 Introduction
Foreign exchange markets have been the main target for most of the market
participants to internationally trade invest and hedge foreign currency risk exposure
The uniqueness of this kind of financial market is mainly due to its high liquidity
leverage and geographical and time zone coverage According to an article published
by Bloomberg and based on information released by the Bank for International
Settlements (BIS) in September 2012 foreign currency trading may have reached $5
trillion a day exceeding the highest level reached prior the collapse of Lehman Brothers
in 2008 Though trading fell to approximately $47 trillion a day in October 2012 and
likely to fall further it is still remains the number-one financial market for all market
participants (Worrachate and Goodman 2012) check
The global financial market place has evolved significantly during the last decade
Investment and hedging strategies have changed accordingly Market participants have
been exploring different strategies that would enable them to generate maximum
returns with minimum risk Investment fund managers and risk managers for example
consult fundamental analysis value investing strategy technical analysis and any other
possible tool they could add to their trading-strategies portfolio
There are various tools that market participants use in foreign exchange markets
especially for spot foreign currency trading This is mainly because a large portion of
investment activity in the foreign exchange market is conducted through spot trading
The spot foreign exchange market has been closely examined to look for profitable
opportunities and find the best investment and trading strategies Both fundamental
analysis and technical analysis have been used to predict price movements though they
differ significantly Fundamental analysts study the cause of the price movements
whereas technical analysts examine the effect (Murphy 1999) Recently many
investment managers and individual traders integrate fundamental and technical
ID 100068
5
analysis in their investing and trading strategies which has been found very rewarding
They use fundamental analysis for long-term investment strategies and use technical
analysis for short-term trading activities According to a survey conducted by Taylor and
Allen (1992) 90 per cent of foreign exchange traders in London use price charts as
technical trading rules for short-term trading
Though technical analysis is used widely some academicians and market followers still
believe that returns are not predictable and that technical analysis cannot be used to
forecast prices Although there is a challenge of turning technical analysis into a
science a lot of studies have been conducted to examine the profitability of technical
trading rules statistically in financial markets Considering the information above this
research attempts to examine the profitability of using technical trading rules to predict
price movements of selected foreign currencies These technical rules are called
Japanese candlestick patterns that were originally used by Munehisa Homma who
made a fortune from trading them in the rice market in 1700s (Nison 2001) Details of
different Japanese candlestick trading patterns are discussed later in the research The
next sections include the rational of the research the research problems the objectives
of the research and the null hypotheses followed the limitations of the research
11 Rational of the Research
Foreign exchange markets are one of the main targets for most of the market
participants as they are considered the largest financial markets in the world Market
participants who access foreign exchange market include traders fund managers
pension fund managers banks corporate and other financial institutions Foreign
exchange markets do not only provide trading and investment opportunities but they
also offer risk managers great opportunities to trade as hedging activities that would
enable them to mitigate the foreign exchange risk exposure resulting from uncertainty in
high price volatility This research is important because it can serve different financial
ID 100068
6
institutions and traders for investment and hedging decision making and academicians
who are looking for tested trading results
This research is also important because it examines major foreign exchange currencies
that represent advanced and emerging economies which provide different trading
opportunities especially after the recent financial meltdown that started in 2007
Emerging markets have become one of the main targets for investors as they have
showed potential for high returns when compared with other advanced economies
Despite the fact that emerging markets may still present a high risk of political
uncertainly local infrastructure issues and illiquidity they still provide good opportunities
for outside investors Emerging markets have been experiencing faster economic
growth measured by their GDP though still partially impacted by the slow global
economic growth resulted from the Euro Zone debt crisis and the US fiscal cliff fears
The foreign exchange currencies include five advanced market currencies and two
emerging market currencies against the US dollar the Australian dollar the British
pound the Canadian dollar the Euro the Japanese yen the South African rand and
Indian rupee respectively There are four main reasons to select these currencies 1)
they are highly liquid 2) they are considered trade commodity and hedging currencies
3) they reflect both advanced and emerging foreign markets 4) they represent different
economies and geographical regions and 5) the data period used in the analysis is long
and very recent All these factors together make this research interesting and attractive
12 Research Problems
Based on the traditional finance research on financial market efficiency technical
trading rules cannot be used to beat the markets and generate excess returns It is
considered that financial markets are efficient and their prices consistently and fully
reflect available information (Fama 1970 Samuelson 1995) However there are a lot
of studies that have been conducted to re-test markets efficiency Some empirical
ID 100068
7
researches find that financial markets including foreign exchange markets are efficient
and that technical trading rules cannot be used to forecast future price movements
supporting the weak form of the Efficient Market Hypothesis (EMH)
On the other hand other empirical studies reject the concept of the first form of the
EMH and find that technical trading rules can be profitable indeed These findings of
successful trading rules have been documented empirically using different sample data
of different financial markets across different time periods and in different regions The
findings show that some financial markets have been found informationally inefficient
The foreign exchange market efficiency has also been examined and strong evidence
of profitable technical trading rules has been found
13 Objectives of the Research
The main objectives of the research are as follow
To statistically examine the predictive power of four bullish and four bearish
Japanese candlestick patterns to forecast price movements or returns in seven
selected foreign exchange currencies
To contribute to the literature by providing an additional research in the field of
technical analysis through examining the profitability of Japanese candlestick
patterns and with results that either support or reject the weak form of the EMH
To raise awareness of profitable trading strategies in major commodity and
emerging market foreign currencies that can provide good trading opportunities
for market participants and can help them make investment and hedging
decisions
14 Null Hypothesis
To test the weak form of the EMH and examine the predictive power of technical trading
ID 100068
8
rules of selected Japanese candle reversal patterns in foreign currencies the following
null hypotheses are tested
1 H0 All Japanese candlestick reversal patterns cannot be used to forecast foreign
currency price movements
Ha Japanese candlestick reversal patterns can be used to forecast
foreign currency price movement
2 H0 Foreign exchange markets are efficient
Ha Foreign exchange markets are inefficient
15 Limitations of the Research
There are two main limitations encountered while working on the methodology The first
one is the inability to include USDCNY in the sample as an emerging market foreign
currency this is due to the missing data of high and low rates from the beginning of the
sample period till the end of August 2005 downloaded from Thomson Reuters This
currency has received a lot of attention recently and many market participants have
shown interest in it through diversifying their portfolios emerging markets have shown
promising profitable opportunities especially after the last financial crisis Euro Zone
debt issue and the US fiscal cliff threat However since this research addresses
emerging market foreign currencies as well USDZAR is selected as a replacement for
the Chinese Yuan Many financial institutions especially airlines and logistics firms have
profits or repatriation in USDZAR adding another reason to include it in the sample
The second limitation is the lack of solid knowledge in programming to transform the
subjectivity of different variations of Japanese candlestick patterns into an objective
software or model that would both identify the patterns and test them statistically This
limitation is partially addressed through using excel formulas and statistical tests and
find the identified ones on real charts to ensure the patterns are properly reflected
ID 100068
9
The rest of the research paper is organized as follows Chapter two introduces the
Efficient Market Hypothesis (EMH) in its three forms Chapter three discusses the
difference between fundamental analysis and technical analysis as well as subjective
technical analysis versus objective technical analysis Chapter four includes an
explanation of terms and concepts and a survey of literature reviews followed by a
summary of reviews comments and criticism Chapter five introduces the technical
trading rules of the Japanese candlestick patterns and the Relative Strength Index
(RSI) Chapter six explains the methodology that includes the sample data and the
analytical tools used to test the null hypotheses Chapter seven includes the discussion
of the study analysis Chapter eight summarizes the findings and recommendations and
finally Chapter nine includes the conclusion followed by bibliography and appendices
ID 100068
10
Chapter 2
Efficient Market
Hypothesis (EMH)
ID 100068
11
Chapter 2 Efficient Market Hypothesis (EMH)
Markets with prices that consistently and fully reflect available information are called
efficient This is the building block of the Efficient Market Hypothesis (EMH) that was
brought up by Fama and was further developed by him in 1970 Fama (1970) divides
the EMH into three forms of market efficiencies depending on relevant information that
stock prices adjust to These subsets include the weak form the semi-strong form and
the strong form
The weak form states that future prices cannot be predicted by examining historical
prices and used to generate excess returns Therefore investment strategies and
decisions cannot be made based on technical analysis This means that security prices
do not have any particular pattern and future price movements are subject to
information that is not part of price series Thus security prices follow a random walk
rather than particular historical patterns and that market participants cannot profit from
market inefficiencies
The semi-strong form discusses the ability of stock prices to adjust efficiently to
information that is available to the public such as different announcements of annual
profits and stock splits It states that stock prices adjust to available new information to
the public very fast and objectively Thus market participants cannot earn excess
returns through trading that kind of information This form states that both fundamental
analysis and technical analysis cannot be used to beat the market and make superior
returns
Finally the strong form of the EMH is concerned with certain individuals or groups that
might have monopolistic access to such private information This form implies that stock
prices represent both public and private information Thus market participants will not
be able to use any kind of information to generate excess returns
ID 100068
12
In brief the EMH implies that the reaction of market participants is random Thus
market prices cannot be exploited to consistently generate any excess returns
particularly when accounting for the transaction costs of spreads and commissions
Market participants can be wrong but the markets are always right
Mixed empirical evidence exists in the literature that either support or reject the EMH
Although the EMH is supported by some academicians and market participants it has
also been disputed by many investors and researchers both empirically and
theoretically One of the important studies in the literature is the research conducted by
Lo and Mackinlay (1989) on the Random Walk Theory They examine the theory using
weekly stock returns for the period from 1962 and 1985 The results strongly reject the
Random Walk model for the whole sample
The EMH has started to lose some weight Interestingly even leading proponents of the
theory have started to divert in their belief in the validity of the random walk concept
Burton Malkiel a famous American economist and the author of ldquoA Random Walk Down
Wall Streetrdquo who has been a big supportive of the EMH has recently pointed out that
some emerging markets like China particularly Shanghai and Shenzhen financial
markets have been found inefficient (Malkiel Mei and Yang 2006)
Some EMH proponents still argue that luck is the main reason behind some successful
traders However being the most successful investor of the 20th century ranked among
the worlds wealthiest people Warren Buffett argued against them and stated that the
number of the large part of successful investors among the best money managers just
dispute the argument above Warren Buffet is among other super-investors who have
managed to beat index funds many times More than twenty seven years ago Buffet
mentioned that there were nine investors who invested in different firms they had made
more profits than what index funds did They were able to beat the market by a big
margin and performed very well even when the market was not attractive (Buffett
1984)
ID 100068
13
The latest finical crisis that started in 2007 has also renewed the criticism of the EMH
Jeremy Grantham one of the highly respected financial strategists and investors stated
that the EMH is responsible for the current financial crisis He said that the belief in the
model has made financial leaders underestimate the dangerous implications of asset
bubbles such as the dot-com and housing bubbles as stock prices were not irrational
after all He was quoted that NASDAQ would correct 75 per cent which does not exist in
an efficient market as this would indicate that growing shares have turned more
valuable (Nocera 2009)
The EMH has become controversial as evidence of substantial and lasting inefficiencies
are observed opening the door to direct and indirect criticism of all the three forms The
history of many financial markets records various cases with fund and other investments
mangers showing outstanding performance and being able to beat the market
consistently Though the weak form states stock price movements are random or
trendless given unchanged fundamental information many researchers have found
evidence that stock markets and other financial markets do trend They have also found
that there is an existence of a correlation between trending and length of the time frame
collecting another evidence to reject the weak form of the hypothesis Other studies
have revealed that market participants can make abnormal returns by trading stock
dividend and other announcements including major economic indicators and central
banks interventions in the foreign exchange markets Moreover there are different
financial anomalies that have been found in the markets and have enabled market
investors to generate excess returns These findings clearly reject the second form of
the EMH Similarly the last form of the EMH can be easily challenged one can argue
that the excess return made through insider trading is a good example that simply
disputes the strong form of the EMH
The key debate about making abnormal returns and beating the market ldquoconsistentlyrdquo
by the proponents of the EMH will always be challenged by the strategies that result in
making excess returns from trading technical trading rules dividend announcement and
ID 100068
14
financial anomalies and executing insider trading EMH proponents do not only have to
justify how the above can simply reject the three forms of the EMH but also explain the
rational of such asset bubbles and their subsequent collapse This research addresses
the weak form of the EMH and examines the predictive power of selected Japanese
candle reversal patterns as technical trading rules
ID 100068
15
Chapter 3
Fundamental Analysis (FA)
Vs Technical Analysis (TA)
ID 100068
16
Chapter (3) Fundamental Analysis (FA) Vs Technical
Analysis (TA)
Fundamental analysis and technical analysis are the two main approaches used by
funds and other finance managers to analyse a security value and monitor risk and
return tradeoffs while managing portfolios There has always been a debate on which
approach is superior to the other one and whether they substitute or complement each
other
Fundamental analysts focus on security market price and its true values In order to
invest in a stock or any other financial security fundamental analysts study the
economic factors of supply and demand which affect the price directions In particular
they assess all the factors that can affect the security market price in order to determine
the intrinsic value of that security (Murphy 1999) Fundamentalists look at the book
value and examine financial statements and use price-to-book ratio Earnings are
another key factor that reflects the income power of a stock using the price-earnings
ratio These two ratios are important for many fundamentalists because they show the
deviation of the shares from asset backing of the security The second ratio of price to
earnings shows the deviation of the shares from the earning power of the stock
(Raymond 12) So if the intrinsic value is below the market price this means that the
security is overpriced and should be liquidated However if the intrinsic value is above
the market the price it means that the security is underpriced and it should be added to
the portfolio
On the other hand technical analysts believe that fundamental factors of securities are
discounted and accounted for in the market price itself Technical analysts study the
market action as they believe that prices move in trends and that history patterns in
financial markets repeat themselves They forecast future market prices through
examining short- intermediate- and long-term trend directions price patterns technical
ID 100068
17
oscillators time cycles inter-market analysis and other technical tools (Murphy 1999)
As for the fundamental analysis the technical analysis has also attracted a lot of
investors practitioners and academicians The recognition of historical price
movements to forecast future directions goes back to a number of editorials written by
Charles Dow published between 1900 and 1902 in Wall Street Journal These
publications have encouraged further research and revisit of existing literature to assess
the profitability of technical analysis and test the validity of the EMH
Nowadays technical analysis is widely used by many big institutional investors and
other market participants in their trading and investing strategies The power of
mathematics of artificial intelligence as well as price pattern identification software has
been growing so drastically (Raymond 2012) The globalization and the integration of
different financial markets worldwide along with the advanced technology have enabled
technical analysts to adjust their trading strategies very rapidly when there are major
movements These speedy tools are not available for the fundamentalists
One could argue against each analysis performance Many big fund managers are
fundamentalists such as Warren Buffet John Templeton Peter Lynch and Liu Yang
They follow value investing and fundamental analysis in their investment decisions
Warren Buffett avoided IT shares prior the IT bubble at the time investors were laughing
at him At that time he acknowledged he should get a ldquoDrdquo grade for his portfolio
performance Another credit that goes for the value investing approach is when John
Templeton went for short positions on IT IPO when other traders were celebrating their
big returns In these cases both fundamental and value investing analysis won at the
end However a lot of fundamental analysts were caught by surprise in the sudden
collapse in some stock markets In 2011 Hong Kong stock market collapsed when the
market PE was not expensive at all at that time That is one of the situations when the
fundamentalists fell in the value trap (Raymond 2012) This brings the importance of
technical analysis in spotting trend changes and potential reversals well ahead
ID 100068
18
A lot of studies have been conducted to examine the ability of fundamental and
technical analyses to assist funds and risk mangers to make correct decisions
Evidence of the profitability of technical analysis is explored in details in the literature
review section Other studies have gone further by examining the ability of integrating
both analyses to optimize and further fine-tune investment and risk management
strategies Bettman Sault and Welch (2006) propose an equity valuation model which
integrates both analysis Their sample includes US listed firms from January 1983 to
December 2002 The results confirm that each analysis performs well when applied
separately However the authors find that the integration of fundamental and technical
analysis produces superior results Thus the finding confirms the nature of both
analyses as complements rather than substitutes Cooper (2011) also provides a simple
framework that integrates both technical and fundamental analyses His paper is
expository in nature and explains the concepts without any mathematical evidence It
addresses the challenges of integrating technical and fundamental analyses in an
optimum manner It opens the door for practitioners and academicians to use the ideas
in their testing models and explore the integration of both analyses in the future
The literature shows evidence of a growing success of using technical and fundamental
analyses as complements in the trading strategy and investment decisions In fact both
analyses forecasting the market attempt to resolve the same issue of determining future
price directions The fundamental analyst examines the cause of the market direction
whereas the technical analyst studies the effect At the start of major market moves
usually fundamental analysts are not able to explain what the market tends to do This
is the market stage when the two approaches fail to agree with each other However at
some stage later the two approaches do come back into sync but not early enough for
the trader to react Another explanation for the discrepancies between the two is that
market price movements tend to lead fundamentals Since the known fundamentals
have already been accounted for in the market prices are currently responding to
unfamiliar fundamentals History records that some of the major bull and bear markets
have started with little or zero perceived change in the fundamentals At the time these
ID 100068
19
changes became familiar the fresh trend is already in place With the passage of time
technical analysts can develop growing confidence in their price chart signals and they
become among the minority who can spot a change in trend directions They know at
some stage that the reasons for that trend reversal will become known to others
Most analysts categorize themselves as either chartists or fundamentalists but in real-
life situations there is an overlap A lot of fundamental analysts have some basics
about chart and trend analysis Similarly many chartists are aware of some important
fundamentals The main challenge is that sometimes price charts and fundamentals
conflict with each other (Murphy 1999)
Last but not least if a trader has a choice between the two approaches the choice
would logically be the technical analysis By default technical analysis includes the
fundamentals If the fundamentals are accounted for in the market price it makes less
sense to study those fundamentals In other words chart analysis has become a
shortcut of fundamental or value investing analysis Given the explanation above it
makes sense that one would depend on technical analysis in trading or investment
decisions It is doubtful that anyone can depend solely on fundamentals ignoring the
timing advantage of the technical analysis (Murphy 1999) The explored literature in the
literature review chapter represents different studies that examine the predictive power
of using technical analysis in financial markets with a focus on foreign currency
markets
Technical analysis is further divided into subjective technical analysis and objective
technical analysis introduced in the next section
ID 100068
20
31 Subjective Analysis Vs Objective Analysis
Technical analysis can be classified into two categories subjective and objective
technical analysis (TA) Subjective TA refers to methods and patterns of analysis that
cannot be clearly defined This leads to the conclusion that technical analysts are open
to personal views and interpretations when they use their technical trading rules This
means that it is possible for different analysts using the same method of same data
sets to have different findings Thus subjective trading rules cannot be tested and they
are exempted from empirical examinations Examples of subjective TA can include
Gann Lines trend channels price chart patterns and divergences (Aronson 2007)
On the other hand objective TA is clearly defined When an objective trading rule is
applied on a market data set its signals are very clear and there is no room for
ambiguity This helps simulating technical methods on different historical data and
identifying their performance level accuracy In other words it allows back testing Thus
any objective method can be repeatable it enables technical analysts and
academicians to re-test previous findings of profitable technical trading rules and
perhaps refute current statistical evidence Examples of objective TA include moving
average crosses (Aronson 2007)
In a nutshell one can distinguish between subjective and objective TA through using
the programmability criterion that is a method is considered objective only if it can be
implemented in a computer programme that can generate clear market positions Any
other technical trading methods that cannot be programmed become subjective by
default Subjective TA can be eliminated either through a shift into objective methods or
rejection (Aronson 2007)
Aronson (2007) classifies TA into four main categories 1) subjective TA 2) objective TA
with unidentified statistical significance 3) objective TA that does not have statistical
ID 100068
21
significance and 3) objective TA of statistical significance The first category refers to
analysis methods that cannot be implemented into a programmed algorithm and be
back tested whereas the other three categories fall under objective methods To
explain further the second category includes the methods that have been tested but
their findings have not been examined for statistical significance The third category is
considered useless even though the values have been back tested and evaluated with
statistical methods they have been found of no value whether individually or when used
in combination with other technical trading rules Most of objective technical trading
rules fall under this category This is due to the complexity and randomness of the
financial markets that make it difficult to predict The fourth and the last category
includes the objective methods that can be back tested and produce statistically and
economically significant results Some individual objective methods are useful however
since financial markets are very complex and random rules will have more value if they
are combined with other trading rules (Aronson 2007)
It has been very challenging not only to move TA to a science which is transforming
subjective TA into objective TA but also to convince analysts who have been very
proud of their technical trading rules of the importance of the statistical significance
tests and results A good example in the literature that attempts to transform subjective
TA into objective TA is done by Chang and Osler (1999) They objectify the price
pattern of head and shoulders after facing a lot of problems Among the main challenge
faced is setting up the pattern parameters as in reality the pattern does depart from the
ideal one The authors decide to define objective rules that could discriminate valid from
invalid head-and-shoulder patterns These objective rules include percentage filters
known as an Alexander filter similar to a zigzag indicator that can identify peaks and
troughs They further develop innovative approaches that could qualify the pattern such
as vertical and horizontal symmetry and the time taken to form the pattern (Aronson
2007)
ID 100068
22
There are a lot of valid attempts that have been observed in the literature The literature
review section provides various studies that attempt to test different trading rules
statistically
ID 100068
23
Chapter 4
Literature Review
ID 100068
24
Chapter (4) Literature Review
This chapter is divided into two main parts explanations of terms and concepts found
later in the literature reviews and a survey of literature reviews
41 Explanation of Terms and Concepts
Bootstrap is a method that derives a sampling distribution of the test statistic
through re-sampling with substitution from an original sample (Aronson 2007)
Data mining is the process of searching for patterns models and predictive rules
in large data (Aronson 2007)
Data mining bias is the expected variation obtained by different experiments
between the observed performance of the best observed performance and its
expected performance (Aronson 2007)
Head and shoulder and double top price patterns are pictures appear on price
charts that can be used to predict price movements
Japanese candlestick patterns are formations that are derived from open high
low and close prices they can be of one-day or more that have reversal and
continuation predictive power
Monte Carlo simulation is a common method used to solve mathematical issues
through random sampling in order to test the statistical significance of back-
tested data (Aronson 2007)
NOVA is a statistical test that tests the difference in mean returns between
multiple groups
ID 100068
25
42 Survey of Literature Reviews
Over the past three decades researchers have provided good evidence that the foreign
exchange markets are inefficient disputing the Random Walk Theory and the EMH
There is trustworthy evidence that simple technical rules or a combination or trading
rules applied by a wide range of market participants have proven to have predictive
power of security prices Thus the reality that simple trading rules generate abnormal
large returns in financial markets indicates a serious challenge to the traditional market
hypotheses To test the predictive power of technical analysis over different time frames
and data samples researchers have examined various financial markets of stocks
foreign exchange bonds and commodities Some findings show strong evidence of
profitable technical trading rules whereas others show poor or no evidence
This section explores different studies that examine the profitability of various technical
trading rules in different financial markets More attention is given to the technical
trading strategies of Japanese candlestick patterns and samples covering foreign
currency markets where possible The literature reviews focus primarily on the
outcomes of applying technical analysis and its predictive value of future price
movements The literature survey is divided into four main streams the first part covers
the studies done in the stock and foreign exchange markets that show evidence of
profitable technical trading rules the second part covers the researches that use
technical analysis in presence of central bank interventions The third part reviews
studies that apply Japanese candlestick trading rules The fourth part includes the
studies that find poor or no evidence of profitable technical trading rules Questionnaire
surveys on the application of technical analysis in trading decisions are also included in
the literature Each part reviews the literature chronologically from the oldest to the most
recent ones to reflect the development that has been made since early 1980s
Examining the profitability of technical analysis in financial markets has started very
early Longworth (1981) uses CADUSD spot and forward rates from July 1970 to
ID 100068
26
October 1976 He finds that forward rates can be predicted using spot reference rates
concluding that markets are inefficient
Brock Lakonishok and LeBaron (1992) examine two simple common trading rules
moving averages and range breakouts in the DJIA from 1897 to 1986 Having applied a
standard statistical analysis of the bootstrap method the results reveal strong evidence
of the technical trading strategies applied The buy signals are found to constantly
produce higher returns than sell signals Also the returns following buy signals are less
volatile compared with the returns generated by sell signals
Levich and Thomas (1994) examine the impact of technical trading strategies in the
foreign exchange market by using futures contracts of a 15-year time span Their data
sample covers the years from 1976 to 1990 After applying bootstrap methodology and
a statistical approach thousands of new exchange rate series are randomly generated
each tested seriesrsquo profitability is examined using a technical analysis approach The
empirical results of profit significance in both original series and randomly generated
series are compared The findings reveal that technical trading systems are significantly
profitable Although some profits declined during the five years of 1986-90 on an
average the profiles are found still positive and significant in some periods Thus these
results provide evidence of profitability and statistical evidence of how technical trading
systems are profitable in the foreign exchange market
Gencay (1997) also finds strong evidence of profitable simple technical trading rules in
daily Dow Jones Industrial Average Index Having examined linear and nonlinear
predictability of stock market return using historical buy and sell signals of the moving
average rules the result shows evidence of nonlinear predictability in the US stock
markets supporting the results found by Brock Lakonishok and LeBaron (1992)
Osler (2000) examines the technical trading rules of support and resistance levels
provided by six foreign exchange trading companies The data sample covers the
ID 100068
27
period from 1996 to 1998 The statistical test of the bootstrap technique is used The
results show that signals are very successful in forecasting trend interruptions or
reversals The findings also show that some companies are more accurate in
indentifying turning points in exchange rate trends Overall the prediction in USDJPY
and GBPUSD rates are more accurate than the prediction in DMUSD Also it is found
that the predictive power of the support-resistance levels tend to last five working days
at least once the levels are published to the public
Osker (2003) examines clustering of foreign currency stop-loss orders as well as take-
profit orders as they are considered main orders when placing trading orders His data
covers 9655 orders with a total of more than $55 billion from August 1 1999 to April
11 2000 His sample covers three foreign currencies USDJPY EURUSD and
GBPUSD He uses the crowded orders to provide an explanation for two common
predictions of technical analysis First trends are likely to reverse directions at support
and resistance areas Second trends are likely to move faster after prices penetrate
such levels He finds that take-profit orders gather at round numbers explaining the first
profit forecasting whereas stop-loss orders concentrate heavily just after round
numbers this explains the reason behind the second forecasting These findings are
obtained based on the closing rates of both orders placed at the famous dealing bank of
National Westminster The order clustering phenomenon is due to different common
reasons round numbers are easy to remember and to place orders at as they are the
first to come to anyonersquos mind The final results show that technical trading rules can be
profitable for market participants
Omrane and Oppens (2004) use other technical trading strategies They examine the
presence of price chart patterns in intra-day EURUSD using both close and high-low
prices They search for 12 chart patterns and study them based on the two criteria of
profitability and predictability Using the statistical methodology of Monte Carlo
simulation to calculate resultsrsquo statistical significance the authors find evidence of chart
ID 100068
28
patterns in the foreign exchange market The results reveal that more than 50 per cent
of the charts that are identified has high predictability
Similarly Shik and Chong (2007) also find technical trading rules profitable in foreign
exchange markets They apply moving averages and Relative Strength Index (RSI)
using daily rates of six foreign currencies They find that the profitability of using moving
averages is obvious even though currencies belong to various economic areas
In their paper Lento and Gradojevic (2007) examine the profitability of technical trading
rules by assessing their ability to outperform the trading strategy of buy and hold The
sample covers SampPTSX 300 Index NASDAQ Composite Index Dow Jones Industrial
Average Index and CADUSD spot exchange rate from May 1995 to December 1994
The trading strategies include moving average cross rules Bollinger Bands filter rules
and breakout rules of trading ranges After accounting for the transaction costs excess
returns are generated by moving average cross-over rules and trading range break-out
rules for the SampPTSX 300 Index NASDAQ Composite Index and the CADUSD spot
exchange rate Filter rules also earn excess returns when applied on the CADUSD spot
exchange rate The bootstrap methodology is used to determine the statistical
significance of the results The profitability of the technical trading rules is further
enhanced with a combined signal approach The results show that a combined single
strategy does outperform the buy-and-hold trading strategy even after accounting for
transaction costs
Park and Scott (2007) re-visit the historical testing measures of the profitability of
technical analysis in the empirical literature both early (1960ndash1987) and modern (1988ndash
2004) Early studies show that technical trading rules are profitable in foreign exchange
markets and futures markets only but not in the stock markets Modern studies
however reveal that technical trading rules constantly generate economic profits in
different markets It is worth to mention that although strong evidence of the profitability
of technical analysis is found in early studies many empirical researches faced a lot of
ID 100068
29
problems in their tests such as data snooping selection of trading strategies and
estimation of transaction cost Early studies are characterized with different limitations in
their tests application of very few trading strategies ignorance of trading rules risk and
statistical significance of returns absence of parameter optimization out-of-sample
verification and less attention to data snooping problems On the other hand modern
studies show an overall improvement earlier limitations encountered in the early
studies have been reduced the number of trading rules used for testing has been
increased risk of trading strategies has been given high attention both conventional
statistical tests and sophisticated bootstrap methods have been applied with an
emphasis on trading rule optimization as well as out-of-sample verification Also other
empirical factors such as order flows clustering interventions of central banks and
unstable market inefficiencies have been introduced as an explanation of technical
trading returns Final results of the study reveal that out of total modern studies of 95
56 studies find technical analysis profitable in trading 20 show negative results and 19
find mixed results
Though difficult to explain how technical trading strategies of price patterns might be
profitable Friesen Weller and Dunham (2007) provide a modal that shows evidence of
how such price pattern trading rules can be profitable in the US stock markets The data
covers a six-year period from January 1999 to December 2005 The researchers
highlight the significance of confirmation bias Traders who obtain data and trade on
that information are likely to bias their reading of subsequent information towards the
direction of their initial view This generates autocorrelations and price patterns that can
forecast future prices like the head-and-shoulders and double-top price patterns Also
the researchers find that their model can predict positive autocorrelation with sequential
price The prediction is tested and the results are found statistically and economically
significant
Stephen (2008) examines the profitability of using technical models of moving averages
and momentum that add up to 1024 technical trading rules in DMUSD He finds that all
ID 100068
30
the trading rules are profitable The profitability is mainly because of the exploitation of
exchange rate trends the result stay valid even with sub-periods trading and declining
profit during late 1980s The results of the best 25 performing models in-the-sample
period from 1973 to 1999 are almost as good as those generated in the out-of-sample
period of 2000-2004 in the majority of the cases It is worth to mention that the risk of
making losses when applying each of these models is almost zero adding another plus
to the profitability of technical analysis in trading foreign exchange currencies
Profitability of technical trading rules is examined in combination with other factors as
well Krishnan and Menon (2009) study the influence of foreign currencies technical
indicators and time frames on trading profits The research covers the period from
September 2006 to October 2008 with 1400 observations in the sample and two
durations one year and three months The currency pairs include EURUSD
GBPUSD USDCHF and USDJPY The time frames cover five minutes 15 minutes
30 minutes one hour four hours and one day The technical indicators used are five
leading and five lagging The findings reveal that using technical analysis in foreign
currency trading activities is profitable all of the currencies technical indicators and
time frames play significant roles in generating profits in foreign exchange spot markets
EURUSD is found the most profitable and the least risky The findings also show that
short ndashterm trading is riskier and of low liquidity compared to the long-term trading
Moreover the authors find that using a combination of technical indicators in a trading
system generate remarkable profits
Researchers keep exploring various trading rules scientifically Cekirdekci and Iliev
(2010) test different set ups as well as exit strategies for trading opening range
breakouts of 30-minute time frame The research examines a technical trading system
using and back tests of around 250 stocks from various industry sectors from April
2005 to April 2010 The initial tested set ups include buy and sell filters inside bar
simple and exponential moving averages a volume indicator per cent trailing exist
overbought and oversold areas of Relative Strength Index and ATR Ratchet The
ID 100068
31
results show that when combining buy and sell signals with other indicators such as
the volume indicator the opening range is a powerful model it generates significant
returns when traded with the correct stock
Similarly Holmberg Loumlnnbark and Lundstroumlm (2012) test the profitability of the trading
strategy of the ldquoOpen Range Breakout (ORB) but in the US crude oil futures prices from
March 1983 to January 2011 The ORB is a trading rule that signals entry and exit
rules once the price moves beyond predefined boundaries Using the joint distribution of
low high open and close prices over a period of time the researchers find that their
ORB trading rule significantly generates high returns
Interestingly some researchers have conducted different types of studies to have an
indication of how widely technical analysis is applied in the financial field Using a
questionnaire survey on behalf of the Bank of England in November 1988 Taylor and
Helen (1992) find that around 90 per cent depends on technical analysis in forming their
views at different time horizons The results show that technical analysis is applied
mainly for the shorter time frames for entry and exit timings Moreover technical
analysis tools are found to be the best tools for trading currencies The survey results
also reveal that fundamentals are reliable for the long term picture whereas others rely
on both fundamental and technical analyses in taking trading decisions
Shifting to the examination of technical analysis in presence of central banks
interventions both early and modern researches show the importance of such
interventions when used with trading rules in the foreign exchange markets Silber
(1994) is among the first researchers who examine the profitability of simple trading
strategies in foreign exchange markets in presence of central banksrsquo interventions His
sample covers the German mark Swiss franc Japanese yen British pound and
Canadian dollar He uses simple moving averages as trading rules He finds evidence
that technical rules can be valuable in markets where governments are found big
players The results show that government interventions provide speculators with an
ID 100068
32
opportunity to generate abnormal returns by applying simple technical trading
strategies
There are other researchers who also examine the impact of central bank intervention
on the predictability of trading rules in foreign exchange markets LeBaron (1998)
reviews some evidence that shows predictive value over future foreign exchange prices
He analyses the profitability of simple trading rules in relation with central bank activity
using intervention information from the Fed His forecasts are assessed over one day
and one week periods His sample uses weekly and daily foreign exchange rates of
Deusche mark (DM) and Japanese yen (JP) from January 1979 to December 1992 The
interest rate series used is one week Euro rates The trading rules compare the current
price with a moving average of historical prices He finds that the predictability of
exchange rates diminishes during the periods when the Fed is inactive This leads to
the conclusion that there is a positive correlation between the Fed intervention in the
market and the profitability of the trading rules used to predict foreign exchange rates
Using a genetic programming for the Duetuche mark Japanese yen British pound and
Swiss franc and US official intervention Neely and Weller (2000) show that
interventions could be considered as trading signals themselves They use simple
moving averages as trading rules covering a sample from 1975 through 1998 In fact
they donrsquot support earlier observations that find intervention activities lead to profit in the
foreign exchange markets Their findings rather show that the profitability of technical
trading rules is a result of strong and constant trends in exchange rates which
intervention is intended to turn around
Moreover analyzing daily exchange rates of USDDEM as well as daily USD and DEM
overnight Euro rates from January 1979 to July 1994 Saacke (2002) provides further
evidence of the unusual profitability of applying technical trading strategies on days
when the Fed and Bundesbank interventions take place The central banks are found to
gain returns when they intervene in foreign exchange markets and with the usefulness
ID 100068
33
of technical analysis Intervention returns and trading rule profitability are evaluated
during horizons and post interventions Exchange rates are found to react in the
opposite direction of central banksrsquo intentions in the short term but in line with their
targets in the long term The researchers find that the trading rules of using moving
averages are considerably profitable on the days when the central banks interfere The
findings also reveal that trading rules returns are still high on days in which interventions
did not take place or on preceding days This means that central banksrsquo interventions
are not the only cause of trading rule returns Shik and Chong (2007) also find out that
the technical rules correlate positively with the interventions of the central banks
There is little attention given to the Japanese candlestick patterns in the literature even
though they were widely used in rice trading activities in Japan and have been found
very powerful when combined with other technical trading rules (Nison 2003) Recent
studies on the Japanese candle patterns are found Goo Chen and Chang (2007)
examine the profitability of Japanese candlestick patterns using daily data Their sample
includes 25 shares that are partially listed in Taiwan Top 50 Tracker Fund and Taiwan
Mid-Cap 100 Tracker Fund for 12 years from 1997 to 2006 and with 2580
observations for each stock The main objective of the study is to indentify profitable
candle patterns as well as profitable holding periods that would generate abnormal
returns for investors They use six bullish single-line patterns and seven bullish candle
pasterns for ten holding periods using a stop-loss strategy as well The first group
includes the long white candle the white Marubozu the closing white Marubozu the
opening white Marubozu the dragon doji and the paper umbrella the second group
includes the hammer the bullish engulfing the piercing lines the bullish harami the
three inside up the three outside up and the tweezers bottom The t test is used to
statistically test the profitability of the patterns NOVA and Duncanrsquos various range tests
are also applied to compare the profitability of the patterns across the ten holding
periods In general the results show that there is evidence of some profitable candle
patterns at different holding periods The researchers find that the bullish reversal
patterns are the most profitable patterns and that the profitability of various candle
ID 100068
34
patterns depends on the holding periods Another finding is that the long holding
periods are appropriate for the two candle categories with few exceptions The results
also show that the -5 stop-loss strategy does improve the performance of the
candlestick trading rules
Lana Zhanga and Xiongb (2011) develops a model that visualizes Japanese
candlestick patterns in Chinese stock markets The model transforms the prices of
open close high and low into ldquofuzzyrdquo candle charts The sample includes selected
stocks listed in four marketsrdquo SSE A Share SSE B Share Shenzhen A share and
Shenzhen B sharerdquo from January 2000 to December 2010 The results show that the
model is able to identify the reversal patterns and that it can be used to indentify early
stock reversal signals through ldquosymptoms sequencerdquo The researchers will further
enhance the model with additional fuzzy variables to reflect candlestick lines such as
the position of body and shadows to fine-tune the prediction results
In addition to the previous studies Haibin Zhao and Wang (2012) examine the
performance of the Japanese candlestick patterns in predicting equity returns using
both in-sample and out-of-the-sample forecasts Monthly data of main global financial
markets are used these markets include ldquoFTSE100 DAX CAC40 in Europe
NIKKEI225 (NK) HangSeng (HS) and Strait Times (ST) in Asiardquo Also monthly data of
Standard and Poorrsquos 500 (SampP500) is collected to find out if the candle patterns have
reached the US markets as well The researchers find that the Japanese candlestick
patterns do have predictive power in both in-sample and out-of-sample forecasts In all
the cases the Japanese trading rules are found superior to the simple buy-and-hold
Also it is found that there is important information that spreads out from the US stock
market to the other financial markets
Lu Shiu and Liu (2012) investigate the profitability of candle patterns that are composed
of two lines through buying on bullish (bearish) patterns and holding the trades till
bearish (bullish) patterns take place Their sample includes daily prices of stocks listed
ID 100068
35
in the Taiwan Top 50 Tracker Fund from 29 October 2002 to end of 2008 The
researchers study three bearish reversal patterns and three bullish reversal patterns
These are the bearish engulfing the harami the dark-cloud cover the piercing lines the
bullish engulfing and the bullish harami respectively The bootstrap methodology is
used The results show that the three bullish patterns are found generally more
profitable than the beaish patterns The returns of the three bullish patterns are found
statistically significant in the Taiwan stock market
On the other hand some researches find conflicting results or even variations within
results that are not in line with the findings above The results vary from lacking of
evidence of the profitability to declining profits when simple trading rules are applied
Levich and Thomas (1993) note weak evidence that the profitability of their rules
declines in their final subsample period 1986 to 1990 Lee and Mathur (1996) apply
moving averages and channel trading systems on ten currency pairs in foreign
exchange spot market Their sample includes ldquoAUDJPY GBPJPY CADJPY
DEMGBP DEMITL DEMJPY DEMCHF CHFGBP and CHFJPYrdquo They find both
trading systems are not profitable
LeBaron (2002) finds that the abnormal returns resulting from applying a 150-day
moving average from June 1973 to August 2002 decrease during the 1990s His
sample covers the British pound German mark and Japanese yen He assumes that
data snooping or economic issues could be the main reason for earlier positive results
Applying simple moving average trading rules on longer time periods Olson (2004) also
finds different results on the profitability of the moving average trading rules He re-
customizes moving average rules in a five-year period from 1971 to 1995 He then tests
the trading rule in 5-year out-of-sample period He finds that trading rule returns decline
over time after 1970s to approximately zero by the 1990s This suggests that the
inefficiencies of markets that are reported in earlier studies might have been temporary
Furthermore Lento and Gradojevic( 2007) find that individual trading rules do not
ID 100068
36
generate any profits above the buy-and-hold strategy when the technical rules are
applied in the DJIA
Pukthuanthong-Le and Thomas (2008) re-assess the ability of technical trading rules to
statistically and economically generate significant returns Their data covers liquid
currency futures from 1975 to 2006 The results show that the profitability of trend
following decline for the major currencies of British pound Japanese yen German mark
Euro Canadian dollar Swiss franc and Australian dollar Moreover the researchers
find that the related cross exchange rates of the major currencies also decline in the mid
of 1990s
Poor evidence of profitable candlestick strategies is also found in the literature
Brashears and Elam (1993) explore the profitably of the Japanese candlestick trading
and their ability ot forecast reversals in the cotton futures market from 1973 to
1990Their sample includes 13 candle reversal patterns The bullish patterns include the
hammer the engulfing pattern the morning star the doji star the piercing lines and the
tweezers bottom The bearish patterns include the bearish engulfing the upside gap
two crows the hanging man the dark-cloud cover the shooting star the evening star
and the tweezers top These patterns are programmed individually using MetaStock
programme The final results show that no definite evidence of predictive power for the
Japanese candle patterns in cotton futures markets The researchers recommend that
additional studies should be conducted to re-examine the predictive power of the
Japanese candle trading rules in the future
Marshall Young and Rose (2005) study the candle patterns in actively traded stocks
listed in the DJIA The sample includes data from 1992 to 2002 the starting year is
selected to make sure that market participants had basic background of the different
Japanese candle trading rules and they already started using them at that time in their
trading strategies The sample includes 28 candle patterns that fall under four main
categories bullish single lines bullish reversal patterns bearish single lines and bearish
ID 100068
37
reversal patterns To test the results they use the bootstrap methodology to generate
random prices of open high low and close Contrary to the researchersrsquo expectations
the final results show no evidence of profitable candle patterns in DJIA thus supporting
the weak form of the EMH
Moreover Young and Marshall (2007) test the predictive power of the Japanese
candlesticks in the US stock market particularly the DJIA Index from 1992 to 2002 The
authors use the t test and the bootstrapping methodology to test the results statistically
The Japanese candle patterns are technical trading rules that have been used in Japan
for centuries The use of these candle patterns has been growing among market
participants all over the world because they used to be successful with the rice trading
in Japan The authors use 28 candle patterns that vary from one- to three-candle
patterns These patterns include the long white the white the Marubozu the hammer
the bullish harami the three outside up the gravestone doji the shooting star the dark-
cloud cover and the tweezers top The findings show that candle trading rules are
statistically not profitable None of the single and multiple candlestick patterns bullish or
bearish give timing signals The authors recommend to use candlestick trading rules in
combination with other market timing tools
The section below summarizes the different findings in the literature above along with
comments and criticism
43 Summary Comments and Criticism
From the previous literature the studies have reported mixed results about the success
of technical trading in foreign exchange and stock markets Abnormal returns are
observed in many studies while other studies report less success of technical trading
rules
ID 100068
38
Longworth (1981) uses CADUSD spot and forward rates and finds that forward rates
can be predicted using spot rates concluding that markets are not efficient Brock
Lakonishok and LeBaron (1992) examine moving averages and range breakouts and
find that buy signals constantly produce higher returns than sell signals Levich and
Thomas (1994) find technical trading rules are significantly profitable on contracts of 15-
year currency futures Later on Gencay (1997) also find strong evidence of profitable
simple technical trading rules in daily DJIA supporting the previous results Osler
(2000) finds the technical trading rules of support and resistance levels are powerful
predictive indicators Clustering of foreign currency stop-loss orders and take-profit
orders in major foreign currencies are clear indicators of profitable technical trading
rules (Osker 2003) Omrane and Oppens (2004) find evidence of profitable chart
patterns that are tested statistically
More recent studies also provide strong evidence of profitable simple moving average
trading rules Shik and Chong (2007) find the profitable simple moving average rules
when moving averages and Relative Strength Index (RSI) are applied on six foreign
currencies Lento and Gradojevic (2007) further enhance technical trading rules through
a combined signal approach The results show that the strategy does outperform the
buy-and-hold trading strategy Park and Scott (2007) re-visit the historical testing
measures of the profitability of technical analysis in the empirical literature and find the
majority of the studies find technical analysis profitable Similar to the results found by
Omrane and Oppens (2004) in the foreign exchange market Friesen Weller and
Dunham (2007) provide a modal that shows evidence of how price pattern trading rules
can be profitable in the US stock markets
Moreover Stephen (2008) finds moving averages and momentum in German Mark
profitable Results of Krishnan and Menon (2009) reveal that all currencies technical
indicators and time frames play significant roles in generating profits in foreign
exchange spot markets Cekirdekci and Iliev (2010) find trading opening range
breakouts when combining buy and sell signals and other indicators a powerful model
ID 100068
39
This is in line with the results found by the earlier researchers (Lento and Gradojevic
2007 Krishnan and Menon 2009) In very recent studies Holmberg Loumlnnbark and
Lundstroumlm (2012) find ldquoOpen Range Breakout (ORB) in the US crude oil futures prices
significantly generates high returns
Other studies both old and modern examine the central banksrsquo interventions along with
trading strategies in the foreign exchange markets The researchers find that simple
trading rules are considerably profitable on the days when the central banks interfere
Silber (1994) is among the first researchers who find evidence that technical rules can
be valuable in markets where governments are found big players LeBaron (1998)
reviews some evidence of profitable simple trading rules in presence of the Feb central
bank activity He finds that the predictability of exchange rates diminishes during the
periods when the Fed is inactive This leads to the conclusion that there is a positive
correlation between the Fed intervention and the profitability of the technical trading
rules Neely and Weller (2000) show that interventions could be considered as trading
signals themselves Moreover Saacke (2002) provides further evidence of the unusual
profitability of applying technical trading strategies on days when the Fed and
Bundesbank interventions take place Shik and Chong (2007) also find that the
technical rules correlate positively with the interventions of the central banks
Evidence of profitable Japanese candle patterns is also found in the literature Goo
Chen and Chang (2007) find evidence of some profitable candle patterns at different
holding periods with bullish reversal patterns as the most profitable patterns The model
developed by Lana Zhanga and Xiongb (2011) also show that it is able to identify the
reversal patterns and that it can be used to indentify early stock reversal signals through
ldquosymptoms sequencerdquo Haibin Zhao and Wang (2012) find in all the cases the
Japanese trading rules are found superior to the simple buy-and-hold Lu Shiu and Liu
(2012) find evidence of three profitable bullish patterns in the Taiwan stock market
ID 100068
40
On the other hand some researches find conflicting results or even variations within
results that are not in line with the findings above The results vary from lacking
evidence of profitable technical trading rules to declining profits when simple trading
rules are applied Levich and Thomas (1993) note weak evidence in their final
subsample period 1986 to 1990 Lee and Mathur (1996) apply moving averages and
channel trading systems on ten foreign currencies and find both trading systems are
not profitable LeBaron (2002) finds that abnormal returns resulting from applying a 150-
day moving average decrease during the 1990s Olson (2004) also finds different
results on the profitability of the moving average trading rules He finds that trading rule
returns decline over time after 1970s to approximately zero by the 1990s Moreover
Lento and Gradojevic( 2007) find that individual trading rules do not generate any profits
above the buy-and-hold strategy in the DJIA In more recent studies Pukthuanthong-Le
and Thomas (2008) find that the profitability of trend following decline in major
currencies
Evidence of profitable Japanese candle patterns is also found poor Brashears and
Elam (1993) find indefinite evidence of predictive power for the Japanese candle
patterns in cotton futures markets Marshall Young and Rose (2005) find no evidence
of profitable candle patterns in DJIA Similarly Young and Marshall (2007) find no
evidence Japanese candle patterns in the DJIA
Though the majority of the findings in the literature supports the profitability of technical
analysis in foreign exchange markets as well as other financial markets the weak
evidence found in some studies need to be examined closely
In order to support or reject the theory of the Random Walk and Efficient Market
Hypothesis the debate on the mixed results can be objectively made The weak
evidence of profitable trading rules found by some researchers since 1980s (Brashears
and Elam 1993 Levich and Thomas 1993 Lee and Mathur 1996 LeBaron 2002
Olson 2004 Marshall Young and Rose 2005 Lento and Gradojevic 2007 and Young
ID 100068
41
and Marshall (2007) is opposed by strong evidence found by others using large
samples and targeting different markets in different regions (Longworth 1981 Brock
Lakonishok and LeBaron 1992 Gencay 1997 Osler 2000 Saacke 2002 Osker
2003 Goo Chen and Chang 2007 Shik and Chong 2007 Lento and Gradojevic 2007
Park and Scott 2007 Stephen 2008 Cekirdekci and Iliev 2010 Lana Zhanga and
Xiongb 2011 Haibin Zhao and Wang 2012 Loumlnnbark and Lundstroumlm 2012 and Lu
Shiu and Liu 2012)
Most of the trading rules tested in the literature are very simple such as moving
averages and range breakouts Moving averages can be easily modeled and tested
however it is a lagging indicator and generates false signals when used in range
trading trends or periods Also the poor evidence of profitable candle trading rules
could be due to the samples taken for the periods prior 2000 in which the knowledge of
these trading rules might not be as solid as during 2000s and onwards The
inconsistency in using statistical tests and the issue of data snooping may lead to
conflicts in results These are some of the factors that could explain the weak evidence
in the literature The strong evidence and the conclusion of inefficient markets in other
studies are challenged by the methodologies and standard statistical analysis used to
examine the profitability of technical analysis The different bubbles and major bullish
trends that usually lead to excess price volatility periods and the ignorance of good
testing procedures that address data snooping and other issues could be some of the
main reasons the findings are positively biased This is supported by the findings found
by Park and Scott (2007) Most empirical researches are subject to various issues in
their testing processes such as data snooping different selections of trading rules in-
and out-of-sample data search technologies and difficulties in estimating risk and
transaction costs
Furthermore the impact of central bank activities on the returns is assumed to be
reflected in the market price Technical analysts should not consider them as a major
source of the predictive power of some technical trading rules as found by the
ID 100068
42
researchers above Intervention activities are similar to other major economic data that
affect exchange rates and alert traders to take positions once prices are close to
support and resistance levels However technical analysis is known for discounting all
the known and unknown information
Regarding the application of trading rules financial markets are too complex to be
predicted by a single trading rule A trading system that is a combination of different
trading rules is found to work better that a single technical tool It is always
recommended to use a combination of good technical indicators as filters in which the
majority will agree on clear signals The findings about the Japanese candlestick
patterns are just a simple message that single technical tools fail most of the time They
should rather be used in combination with other powerful technical tools that can best
work during the underlying trend
After consulting the mixed results it is very important to consider important key factors
that would have a high impact on the overall research findings in regard to the
profitability of technical trading rules in financial markets The reasons for the existence
of these abnormal returns or weak evidence may not be easy to interpret and justify
However there are certain obvious factors that play major roles in reaching final results
of any study that need a careful examination and testing These factors include 1) the
possibility of changing trading rules using different time frames in line with the major
underlying trend 2) the consistency of profitable trading rules 3) the liquidity of the
financial markets as it would be more incentive for market participants to trade away
inefficiencies 3) the bullish and the bearish cycles of the markets 4) the efficiency of
trading systems that are made of powerful technical trading indicators suitable to the
underlying market trends 5) clear understanding of the trading rules of lagging and
leading indicators 6) understating different objectives of major players including
activities of central banksrsquo interventions 7) the usage of sophisticated non-linear
models 8) the usage of good statistical testing procedures addressing data snooping
ID 100068
43
and transactions costs and 9) the importance of having good parameters in place that
would turn technical analysis into a science
This research contributes to the literature by testing the predictive power of the
Japanese candlestick reversal patterns in the foreign currency market The findings are
compared to all the findings of profitable technical trading rules in general and to the
results pertaining to the studies conducted on Japanese candlestick patterns
ID 100068
44
Chapter 5
Introduction to Technical
Trading Rules
ID 100068
45
Chapter 5 Introduction to the Technical Trading Rules
The technical trading rules of the Japanese candlesticks are very popular The
Japanese have applied this charting along with its technical rules for centuries Its
popularity arises from its method to display security data for chart analysis and the use
of certain candlestick combinations that reflect the psychology of the market
participants The data of the Japanese candlesticks uses the same data of standard bar
charts open high low and close However the visual effect of the candlestick charts
provide a much better picture of the market that is easily displayed interpreted and
analyzed The price actions look like candles with wicks or shadows That is the reason
why they are called candlesticks In its simplest form a white body means that the close
is higher than the open whereas the black body means the close is lower than the high
There are different shapes for the Japanese candlesticks They also come in different
combinations based on the relationship between open high low and close prices
There are various patterns of Japanese candlesticks a Japanese candlestick pattern
may consist of one candlestick or a combination of two or more but never more than
five Most of the patterns can be used to warn of reversal levels in the markets These
patterns can be bearish bullish or continuation Generally reversal patterns of bullish
implications have their inverse patterns which have bearish meaning The third category
includes a few patterns that fall under continuation patterns Similar to the reversal
patterns continuation patterns have bullish patterns and their opposite bearish patterns
in relation to the previous trend that takes place prior to the consolidation phase
Examples of bullish patterns that warn a reversal of the trend from a downtrend to an
uptrend includes the piercing lines the morning star the bullish Doji Star the bullish
engulfing the hammer the bullish harami and the kicking patterns Examples of bearish
patterns that warn a trend reversal from an uptrend to a downtrend includes the dark-
cloud cover the evening star the hanging man the bearish engulfing the shooting star
the abandoned baby and the bearish harami The continuation patterns include the
ID 100068
46
rising and the falling three methods the separating lines the downside gap three
methods and the three-line strike (Murphy 1999) Appendix 1 shows the different
Japanese candlestick patterns Moreover the Japanese candlestick patterns can be
used jointly with other western technical tools such as oscillators and other technical
indicators which can create a powerful synergy of techniques
Below is a brief description of each of the eight Japanese candlestick reversal patterns
used in the analysis These patterns follow the descriptions provided by Nison (2001)
The description of the candle patterns are followed by an explanation of the common
technical indicator of the Relative Strength Index (RSI) that is used along with three
candle patterns as a filter
Four bullish and four bearish candle patterns are used in the analysis of this research
The bullish patterns include the bullish engulfing the piercing lines the bullish hammer
and the bullish doji star whereas the bearish patterns include the bearish engulfing the
dark-cloud cover the hanging man and the shooting star The following order of the
patternsrsquo descriptions is based on the similarity and the inverse relationship of the
patterns for easy understanding A snap shot of each candle pattern that are indentified
in the analysis using excel formulas discussed under methodology is provided
The bullish engulfing pattern is a major reversal signal that consists of two real bodies of
opposite colours The market is in a downtrend then a long white candle closes higher
and engulfs the previous black candle This shows that the bulls have taken over from
the bears and that the buying pressure becomes stronger than the selling pressure The
bearish engulfing pattern is just the opposite The market is in an uptrend then the last
white candle is wrapped by a black long body signaling a top reversal This means that
the selling pressure has overwhelmed the buying pressure There are three criteria for
the engulfing pattern 1) the market should be clearly in an uptrend or downtrend even
if it is a short-term trend 2) there are two candlesticks that form the pattern in which the
second body must wrap the previous real body and 3) the colour of the second real
ID 100068
47
body should be the opposite of the first real body colour (Nison 2001) Figures (1) and
(2) show the two patterns that are identified in USDINR and EURUSD pair currencies
Figure (1) The bullish engulfing pattern in USDINR
Figure (2) The bearish engulfing pattern in EURUSD
ID 100068
48
The piercing lines are a two-day bullish pattern that signals a bottom reversal after a
downtrend The first candlestick is a black body and the second day is a long white
body The second day opens with a downside gap below the low of the previous day
and closes higher and above the mid-point of the first black body The greater the
penetration of the white bodies into the previous black body the greater the chance for
bottom reversal An ideal pattern requires a second day penetration of more than 50
of the prior black real body The psychology behind this pattern is that the market is in a
downtrend reflected in the first bearish black body On the next day the market opens
lower with a gap reflecting more bearish sentiment Suddenly the bulls take over and
manage to close the market not only at previous close but higher into the previous body
mid-point or even slightly higher The bears will have their second thoughts about their
short positions The longs will see that the new lows could not hold and probably it is
time to go for long positions There are four main factors that indentify the importance
of the piercing lines 1) the degree of the second day penetration within the first black
body the greater the penetration degree the greater the likelihood for a bottom
reversal 2) the second day opens below a main support level but fails and closes
higher with bears being unable to control the market and 3) heavy volume on the
opening of the second day an initial selling off is followed by buying blow offs (Nison
2001) Figure (3) represents the piercing lines pattern that is identified in AUDUSD pair
currency
ID 100068
49
Figure (3) The piercing Lines pattern in AUDUSD
The dark-cloud cover is the opposite formation of the piercing lines pattern It is a two-
day bearish pattern that signals a top reversal after an uptrend The first day is a long
white real body The second day opens above the high of the previous day but closes
near the low of the day within the previous day white body The greater degree of
penetration into the previous day body the more likely a top reversal will take place
Some technical analysts require more than 50 penetration of the second day close to
the previous white real body The psychology behind this pattern is that the bulls are in
full control when the second day open with an upside gap however the bulls lose
control and no continuation of the rally takes place Then the market closes near the
close and the bulls will have a second thought about their long positions Similar to the
piercing lines pattern there are important factors that intensify the significance of the
dark-cloud cover pattern but in the opposite direction (Nison 2001) Figure (4)
represents the pattern that is identified in EURUSD pair currency
ID 100068
50
Figure (4) The Dark-cover cloud in EURUSD
The hammer is the third bullish candlestick pattern it is a one-day pattern The body of
the hammer can be white or black but it is more bullish if the body is white because it
closes at the high The hammer has a long lower shadow and closes near the high of
the session The psychology behind this pattern is that the market sells off sharply
during the session but then bounces back at the close near to the small bodyrsquos high
The hammer may have no upper shadow or a very small one enforcing bullish
implications This clearly shows that the bears have lost control and they are now
having second thoughts The main characteristic of the bullish hammer is that the lower
shadow should be at least twice or three times the height of the body (Nison 2001)
Figure (5) represents the bullish hammer pattern that is identified in GBPUSD pair
currency
ID 100068
51
Figure (5) The bullish hammer pattern in GBPUSD with the RSI filter
The hanging man looks like a hammer however it forms after an uptrend rather than a
decline Since the long lower shadow has a bullish implication it is best to wait for a
bearish confirmation with this pattern A lower opening below the body of the hanging
man on the second day and a lower close will be a good confirmation of a top reversal
The psychology behind this is that when the market closes on the next day below the
body of the hanging man the bulls who bought on the open or close of the hanging man
day will be left hanging with a bad position and are now more nervous for potential big
losses Thus they may decide to cut their losses and liquidate adding more selling
pressure The key factors for a reversal hanging man pattern are a preceding uptrend
and a next day close below the hanging man close (Nison 2001) Figure (6) represents
the pattern that is identified in USDJPY pair currency
ID 100068
52
Figure (6) The hanging man pattern in USDJPY with the RSI filter
The fourth and the last bearish candle pattern used in the sample analysis is the
shooting star It is a one-day pattern with a small real body and a long upper shadow
The small body can be white or black This pattern looks like a shooting star with its tail
glowing in the sky An ideal shooting star day opens with an upside gap but this gap is
not always important This pattern indicates that the market is rejecting a higher high A
close on the next day below the shooting star close can give a good confirmation of
potential top reversal (Nison 2001) Figure (7) represents the pattern that is identified in
USDCAD pair currency
ID 100068
53
Figure (7) The shooting star pattern in USDCAD with RSI filter
The fourth and the last bullish pattern in the analysis is the doji star A star is usually a
small real body white or black that gaps away from the prior real body If the star is a
doji rather than a small real body it is named a doji star or a doji line that warns a near
reversal Doji candlesticks can have shadows of different lengths The doji candlestick
used in the analysis is a one-day pattern in which the open price and the close price are
equal The star or doji star can be part of other reversal patterns such as the morning
star the evening and the harami Doji candlesticks can have shadows of different
lengths Generally the doji lines show indecision between the market participants The
likelihood of a reversal with a formation of a doji increases if 1) the following
candlesticks confirm a potential reversal 2) the market is in overbought or oversold
situations and 3) the market doesnrsquot form doji so often (Nison 2001) There are different
versions of doji candlesticks such as long legged doji gravestone doji and dragonfly
doji The doji that is used in the analysis has equal open and close prices regardless the
shadows length and signal for bottom reversal (Nison 2001) Figure (8) represents the
doji star pattern that is identified in USDZAR pair currency
ID 100068
54
Figure (8) The doji star pattern in USDZAR
In addition to price patterns resistance-support levels and Japanese candlestick
patterns technical analysts use a lot of technical indicators that be used in trending
markets non-trending markets and gauging sentiments There are technical indicators
or oscillators used in the non-trending markets that can still be used in trending markets
to get further insights into the market momentum Among these indicators is the
Relative Strength Index (RSI) The RSI and the other oscillators when used in
combination with price charts and Japanese candle patterns become extremely
valuable They provide traders and technical analysts further insight especially into the
short-term market extremes that are known as overbought or oversold conditions
The Relative Strength Index (RSI) is considered one of the most popular technical
indicators used actively by traders It basically measures the internal strength of a
security It focuses on price momentum specifically the changes in closing prices It
ranges between zero and a hundred It usually tops and bottoms above and below 70
and 30 readings respectively These are overbought and oversold conditions (Colby
2003) A crossing above 30 indicates a buying signal whereas a crossing below 70
ID 100068
55
indicates a selling signal Divergences between the price action and the indicator
movements also provide warning signals of potential bottom and top reversals In
addition to the signals of the oversold-overbought condition the crosses signals of the
midpoint are also used by many traders Since oscillators are best used in non-trending
markets and there is a risk of misusing the indicator the 50 reading is used as a
midpoint value to divide the horizontal range into two halves The 50 midpoint is also
used as buy and sell signals The time span used is 14 days by default and it will be
used in the analysis The RSI formula is also introduced later in the methodology
section Figures (5-7) show the three patterns that are identified using the excel formula
and the RSI filter
ID 100068
56
Chapter 6
Methodology
ID 100068
57
Chapter 6 Methodology
This research attempts to re-examine the weak form of the EMH through the application
of Japanese candlestick price patterns as technical trading rules in foreign exchange
markets It tests two null hypotheses that assume 1) all the Japanese candlestick
reversal patterns cannot be used to predict returns in foreign exchange markets and
that 2) foreign exchange markets are efficient The two alternative hypotheses state that
1) Japanese candlestick reversal patterns can be used to predict market movements
and that 2) foreign exchange markets are inefficient The one-tailed z score test is used
to test the hypotheses at 5 level of significance The following sections include the
sample data and the analytical tools used in the analysis followed by a discussion of
data analysis and a summary of findings and recommendations
61 Sample Data
The sample data includes seven foreign currencies from both advanced and emerging
financial markets These currencies include the Australian dollar (AUDUSD) British
pound (GBPUSD) Canadian dollar (USDCAD) Euro dollar (EURUSD) Japanese yen
(USDJPY) Indian rupee (USDINR) and South African rand (ZAR) The sample covers
a 12-year span which is from 1st January 2001 to 31st December 2012 These
currencies reflect good financial environment to test the technical trading rules of the
Japanese candlestick patterns in which most of market participants and academicians
are interested in All the data analysis uses daily OHLC bid rates open (O) high (H)
low (L) and close (C) obtained from the financial data provider Thomas Reuters The
total observations in the sample are 3129
ID 100068
58
62 Analytical Tools
This section explains the technical trading and statistical tools used in the analysis to
test the proposed null hypotheses It discusses the Japanese candle patterns used
challenges faced filters applied holding periods to calculate returns (losses) followed
by statistical tests to help deciding whether to reject or accept the null hypothesis
There are eight Japanese candlestick reversal patterns used in the analysis four bullish
patterns and four bearish patterns The eight candle patterns are tested for each of the
seven foreign currencies
The bullish patterns include the hammer the piercing lines the doji star and the bullish
engulfing whereas the bearish patterns include the hanging man the dark-cloud cover
the shooting star and bearish engulfing The reason of selecting these patterns is that
they are very popular and most of them are considered major reversal patterns Another
reason is the ability to transform these candlestick patterns and practice them in a
scientific manner through using excel formulas that can describe and indentify the
patterns and enable back testing
The main challenge encountered in this research is the application a scientific method
that would address the subjectivity of using the Japanese candlestick patterns as
technical trading rules Moving technical analysis to a science through transforming
subjective candle patterns into objectively defined testable patterns has always been a
challenge There are not so many mathematical definitions of the Japanese
candlesticks in the literature Some of the excel formulas that are used in the analysis
are obtained from other resources These formulas are further amended to address the
subjectivity of different variations of the candle patterns used in the analysis which are
in line with Nisonrsquos (2001) The excel formulas (3) (4) and (7) mentioned later in this
section are obtained from a paper written by Fadhel (2010) with an amendment made
to formula (7) to differentiate the shooting star pattern that shows at tops from the
ID 100068
59
inverted hammer pattern that shows at bottoms an additional condition of a next day
lower close is added This is in line with Nisonrsquos (2001) Formulas (5) and (6) are
obtained from Tech Excel Charts and Programming Blog posted by BxCapricorn (2009)
an additional condition of a lower close and a higher close on the next day is also added
to differentiate the hanging man pattern and the hammer respectively from other
similar patterns that show in opposite directions These are also in line with Nisonrsquos
(2001)
Formulas (1) to (8) describe the eight Japanese candlestick patterns the bullish
engulfing the bearish engulfing the piecing lines the dark-cloud cover the hammer
the hanging man the shooting star and the bullish doji against (1) (2) (3) (4) (5)
(6) (7) and (8) respectively Using IF and AND excel functions the following
formulas represent four columns Column A represents Date Column B represents
Open Column C represents High Column D represents Low and Column E
represents Close The formulas start on line or row 5 that represents today line 4
represents yesterday line 3 represents the day before yesterday and line 6
represents tomorrow Number one refers to the patterns identified by the formulas
=IF(AND((B4gtE4)(E5gtB5)(E5gtB4)(E4gtB5)((E5-B5)gt(B4-E4))(C5gtC4) (1)
(D5ltD4))1)
=IF(AND((E4gtB4)(B5gtE5)((B5-E5)gt(E4-B4))(E4ltB5)(B4gtE5))1) (2)
=IF(AND((E4ltB4)(((E4+B4)2)lt=E5)(B5ltE5)(B5ltE5)(E5ltB4)(B5ltD4) (3)
((E5-B5)(0001+ (C5-D5))gt06))1)
=IF(AND(E4gtB4B5gtC4B5gtE5B4ltB5E4gtE5E4ltB5B4ltE5 (4)
E5lt=(05(C4+D4)))1)
=IF(AND((C4-D4)gt(3(B4-E4))((E4-D4)(0001+C4-D4)gt06) (5)
ID 100068
60
((B4-D4)(0001+C4-D4)gt06)(E5gtE4))1)
=IF(AND((C4-D4)gt=(2(ABS(B4-E4)))((E4-D4)(0001+C4-D4)gt=075) (6)
((B4-D4)(0001+C4-D4)gt=0075)(E5ltE4))1)
=IF(AND(B4ltD4+(05(C4-D4))E4lt(D4+05(C4-D4))OR(B4ltD4+09 (7)
(C4-D4)E4ltD4+09(C4-D4))(E5ltE4))1)
=IF(B4=E41 (8)
Furthermore the 14-day Relative Strength Index (RSI) is used to distinguish the three
similar patterns that appear at different turning points these similar patterns include the
bullish hammer the hanging man and the shooting star In addition to the signals of the
oversold-overbought condition the crosses of the midpoint signals are also used by
many traders Since oscillators are best used in non-trending markets and there is a risk
of misusing the indicator the 50 reading is used as a midpoint value to divide the
horizontal range into two halves The 50 midpoint is used as buy and sell signals For
example crossing 50 to the upside is considered a buying signal whereas crossing 50
to the downside is considered a selling signal The 50 midpoint crosses concept is used
with the three candle patterns as a filter to distinguish them If the hanging man and the
shooting start patterns form above 50 it is assumed that there is a high possibility that
the trend will reverse from up to down Similarly if the bullish hammer pattern forms
below the 50 reading there is a high possibility that the current trend will reverse from
down to up In other words a reading above 50 indicates potential for a bearish
reversal and a reading below 50 indicates potential for a bullish reversal
Having used the RSI filter for the three candle patterns the results are considered only
if the average returns are statistically significant at 5 level for at least five consecutive
holding periods Formula (9) shows how the RSI is calculated as provided by Cably
(2003)
ID 100068
61
R 119894
= (C 119905
C 119905+2
C 119905+3
C 119905+4
C 119905+5
C 119905+7
C 119905+10
) minus O 119905
RSI = 100 minus 100
(1 + 119877119878)
(9)
Where
RS = the ratio of the exponentially smoothed moving average for n-period gains divided
by the absolute value of the exponentially smoothed moving average for n-period
losses
After identifying the eight bullish and bearish candle patterns and filtering them through
using the RSI overbought and oversold conditions the returns are computed for seven
holding periods one day two days three days four days five days seven days and
ten days For the bullish patterns the returns represent the difference between the open
price following the pattern day and close price of the seven holding periods as in
formula (10) For the bearish patterns the returns represent the difference between the
open price following the pattern day and close price of the seven holding periods as in
formula (11) The returns for the holding periods that fall beyond the 31 December 2012
are excluded
(10)
Where
Ri= the return of the seven holding periods
Ct = day 1 close following the pattern day
Ct+1 = day 2 close
Ct+2 = day 3 close
Ct+3 = day 4 close
Ct+4 = day 5 close
Ct+6 = day 7 close
Ct+9 = day 10 close
Ot = day 1 open
ID 100068
62
R 119894
= O 119905
minus (C 119905
C 119905+2
C 119905+3
C 119905+4
C 119905+5
C 119905+7
C 119905+10
)
119911 =X minus1198830
1198782
n
(11)
Where
Ri= the return of the seven holding periods
Ot = day 1 open following the pattern day
Ct = day 1 close
Ct+1 = day 2 close
Ct+2 = day 3 close
Ct+3 = day 4 close
Ct+4 = day 5 close
Ct+6 = day 7 close
Ct+9 = day 10 close
Having identified the patterns and computed the returns for the seven holding periods
and following the methodology used by Ramond and Leuthold (1982) and Anderson
(2003) the one-tailed z score test is used for each holding period of the pattern The
two null hypotheses are tested at 5 level of significance that is 95 confidence level
Also the same methodology including the holding periods follows Fadhelrsquos (2010)
supervised by Anderson (2010) the same author above Formula (12) represents the z
score statistical test that accounts for the gross profit variance from each trade as well
as the number of total trades It allows a comparison of results from various trading
rules and time periods To arrive to the final results using the z score test the number of
times the candle pattern is identified (n) in the formula below has to be above 30 This
formula that considers all the factors above does also provide a method to assess the
weak form efficiency of the price series used in the sample analysis (Peterson and
Leuthold 1982)
(12)
Where
X = actual Mean Gross Profits (MGP) from a given strategy
ID 100068
63
Xo = expected MGP (zero in this case)
S2 = variance of Gross Profits per trade
n = number of trades it should be above 30
Unlike securities trading the foreign exchange trading has no guaranteed return or
dividend payment Therefore the equilibrium expected return is considered zero
Trading foreign exchange currencies is similar to trading futures contracts it is a two-
party zero sum game where a price change causes one party to profit and the other
party to lose Thus since foreign exchange trading is a zero-sum game zero is
considered the rational benchmark as expected mean gross profits Moreover the
selection for gross profits instead of the net is due to the absence of a standard
transaction cost as commissions differ significantly depending on time as well as trader
and firm types Readers can deduct suitable commission charges to have some value
for mean net returns These adjustments should not impact the variance of profits
(Peterson and Leuthold 1982)
The p-value is calculated to also help decide whether the pattern identified is due to
chance or its probability of being formed by chance is really too small To calculate the
p-value using the z test statistic excel formula (13) is used If the value is equal or
below the significance level of 005 this means that the probability of the pattern was
formed by chance is very small at 95 level of confidence and the null hypothesis will
be rejected However if the p-value is above the 005 significance level it means that
the probability the pattern was created by chance is high and the null hypothesis will be
accepted
P-value = 1-NORMSDIST(ABS(z)) (13)
Where
ABS = the absolute value of z
NORMSDIST = standard normal distribution of z
ID 100068
64
Figures (9-12) show the number of times the four bullish and the four bearish candle
patterns appear in the final results Figures (10) and (12) show the number of times the
bullish hammer the bearish hanging man and shooting star patterns appear after using
the RSI filter
Figure (9) A comparison of the number of times the four bullish candle patterns appear
in the seven foreign currencies
Figure (10) A comparison of the number of times the four bullish candle patterns
appear in the seven foreign currencies after using the RSI filter
0
20
40
60
80
100
120
140
AUD CAD EUR GBP INR JPY ZAR
Bullish Candle Patterns
Bullish Hammer
Piercing Lines
Bullish Doji Star
Bullish Englulfing
Average
0
20
40
60
80
100
120
140
AUD CAD EUR GBP INR JPY ZAR
Bullish Candle Patterns - with RSI
Bullish Hammer
Piercing Lines
Bullish Doji Star
Bullish Englulfing
Average
ID 100068
65
Figure (11) A comparison of the number of times the four bearish candle patterns
appear in the seven foreign currencies
Figure (12) A comparison of the number of times the four bearish candle patterns in the
seven foreign currencies after using the RSI filter
0
100
200
300
400
500
600
AUD CAD EUR GBP INR JPY ZAR
Bearish Candle Patterns
Hanging Man
Dark-Cloud Cover
Shooting Star
Bearish Engulfing
Average
0
50
100
150
200
250
300
AUD CAD EUR GBP INR JPY ZAR
Bearish Candle Patterns - with RSI
Hanging Man
Dark-Cloud Cover
Shooting Star
Bearish Engulfing
Average
ID 100068
66
Chapter 7
Discussion of Study
Analysis
ID 100068
67
Chapter 7 Discussion of Study Analysis
Having tested the profitability of selected Japanese candlestick reversal patterns in
foreign exchange markets this chapter discusses in details the results of analyzing
candle reversal patterns in seven foreign currencies for 12-year data of 3129
observations The following seven sections discuss the results for each currency pair
After examining the bullish patterns in AUDUSD currency pair it is found that the
bullish hammer pattern is identified 77 times at less than 5 level of significance for all
the holding periods When the results are filtered using the RSI the pattern is identified
40 times in which all are significant at 5 level except of the seven-day holding period
The bullish doji star is identified 28 times throughout the sample at 5 significance
level The bullish engulfing pattern is found less profitable which is not statistically
significant either The piercing lines pattern appears very rare as it shows only 7 times
Similar to the bullish engulfing result the average returns of this pattern are found
statistically insignificant Shifting to the bearish patterns the hanging man performs best
compared with the other three patterns The pattern is indentified 89 times in which the
average returns are significant at 5 level of significance When filtered by the RSI that
is more than 50 the pattern appears 57 times with average returns that are statistically
significant Although the shooting star pattern is identified 148 times the average
returns are found statistically insignificant However when filtered for the RSI the
average returns are found statistically significant for the one-day two-day three-day
and seven-day holding periods The bearish engulfing and the dark-cloud cover are
identified 70 times and four times respectively and their average returns are found
insignificant Appendix 2 includes the descriptive statistics of the eight candle pattern
analysis for AUDUSD
The analysis of USDCAD shows poor evidence of profitable bullish candle patterns
The bullish hammer appears 58 times with significant average returns at 5 level
ID 100068
68
however when filtered using the RSI the pattern appears only 25 times and the
average returns are found significant only for the one-day and three-day holding
periods The bullish engulfing pattern appears 35 times throughout the sample with
significant average returns only for the one-day and two-day holding periods The
bullish doji star pattern appears 19 times and is found statistically insignificant The
piercing lines pattern appears only eight times and the average returns are found
significant only for the one-day two-day and ten-day holding periods at 000 003
and 004 level of significance respectively This result will not be considered because
the number of times the patterns appears which should be considered in z score
formula is less than 30 On the other hand the bearish hanging man and the shooting
star patterns show strong evidence of profitability at 5 level of significance even after
being filtered with the RSI The hanging man pattern is identified 79 times the shooting
star pattern is identified 240 times After being filtered with the RSI reading that is above
50 the hanging man and the shooting star patterns appear 44 times and 108 times
respectively The dark-cloud cover is identified only twice with statistically insignificant
average returns The bullish engulfing pattern is identified 35 times and the average
returns are considered significant only for the one-day and two-day holding periods
Appendix 3 includes the descriptive statistics of the eight candle pattern analysis for
USDCAD
In EURUSD only the bullish pattern of the hanging man shows average returns that
are statistically and consistently significant at 5 level of significance This result also
repeats when filtered with the RSI The pattern is identified 64 times and when filtered it
shows 34 times The presence of the piercing lines pattern is very poor even though
the average returns of the two-day holding period is statistically significant 000 the
pattern is identified only 7 times out of 3129 observations This result is also not
considered The average returns of the bullish doji star and the bullish engulfing
patterns are statistically insignificant They show 15 times and 49 times respectively
On the other hand the average returns of the handing man and the shooting star
patterns are statistically significant they are identified 106 times and 181 times
ID 100068
69
respectively Nevertheless when filtered for the RSI reading the average return of the
ten-day holding period of the hanging man is found 007 that is statistically
insignificant at 5 level Also the average returns of the three-day four-day and five-
day holding periods for the shooting star pattern are found insignificant 008 009
and 008 respectively The dark-cloud and the bearish engulfing patterns are found
very poor Although the bearish engulfing pattern appears 156 times the average
returns are found statistically insignificant The dark-cloud cover pattern is identified only
seven times Appendix 4 includes the descriptive statistics of the eight candle pattern
analysis for EURUSD
In GBPUSD only the average returns of the bullish hammer pattern are found
statistically and consistently significant at 5 level even after filtering for the RSI The
pattern is identified 97 times before applying the RSI filter and 37 times after using the
filter The other three bullish patterns are found statistically insignificant The piercing
lines the bullish doji star and the bullish engulfing patterns appear 7 times 17 times
and 48 times respectively On the other hand the average returns of the hanging man
and the shooting star patterns are found statistically significant at 5 level They show
99 times and 197 times respectively however when filtered for the RSI the average
returns of the hanging man pattern are found statistically insignificant for the seven-day
and the ten-day holding periods 009 and 026 respectively The existence of the
dark-cloud cover pattern is found very poor as it is identified only once The bearish
engulfing pattern is identified 131 times and its average returns are also found
insignificant Appendix 5 includes the descriptive statistics of the eight candle pattern
analysis for GBPUSD
In the first emerging foreign currency of USDINR the average returns of the bullish
hammer and the bullish engulfing patterns are found statistically significant at 5 level
The patterns are identified 40 times and 65 times respectively However when filtering
the bullish hammer using the RSI reading the average returns are found significant only
for the one-day and the ten-day holding periods 000 and 003 respectively The
ID 100068
70
piercing lines pattern appears 33 times but its average returns are found statistically
insignificant The bullish doji star pattern appears 133 times and only the three-day
average returns are found significant 002 lacking consistency in results On the
other hand the existence of the bearish patterns in USDINR is found very poor The
average returns of the hanging man pattern are found statistically significant for only the
four-day five-day and ten-day holding periods and when filtered by the RSI only the
average returns of the one-day and two-day holding periods are found significant The
pattern is identified 69 times before the RSI filter and 39 times after applying the filter
The average returns of the shooting star and the bearish engulfing patterns are found
insignificant The shooting star pattern shows 549 times before the RSI filter and 244
times after using the filter the bearish engulfing pattern is identified 55 times Even
though the average returns of the dark-cloud cover pattern are found significant for all
the holding periods except the one-day period this result should not be considered as
the pattern is identified only twice Finally the bearish engulfing pattern is identified 131
times and its average returns are also found insignificant Appendix 6 includes the
descriptive statistics of the eight candle pattern analysis for USDINR
The USDJPY currency pair lacks evidence of most of the bullish candle reversal
patterns Only the average returns of the bullish hammer pattern are found statistically
significant for the first five holding periods and the first four holding periods after
allowing for the RSI filter The pattern is identified 120 times before the RSI filter and 62
times after applying the filter The average returns of the bullish doji star and the bullish
engulfing patterns are found insignificant for all the seven holding periods they are
identified 25 times and 45 times respectively Similar to the previous results the
average returns of the piercing lines pattern are found insignificant except for the two-
day holding period 001 This result is not considered either as the pattern is
identified only four times Moving to the bearish candle reversal patterns the average
returns of both the hanging man and the shooting star patterns are found statistically
and consistently significant at 5 level even after allowing for the RSI filter The
hanging man appears 155 times before the filter and 82 times after the filter the
ID 100068
71
shooting star pattern appears 190 times before the filter and 75 times after the filter The
average returns of the dark-cloud cover are found insignificant the pattern is identified
only 4 times The average returns of the bullish engulfing pattern are found statistically
significant only for the four-day holding period lacking consistency in the overall result
Appendix 7 includes the descriptive statistics of the eight candle pattern analysis for
USDJPY
Having examined the second emerging market foreign currency and the last foreign
currency in the sample USDZAR is found to experience no bullish reversal candlestick
patterns None of the average returns of the four candle patterns are found statistically
significant at 5 level The bullish hammer pattern is identified 85 times before the RSI
filter and 41 times after the filter the bullish doji star and the bullish engulfing patterns
appear 17 times and 26 times respectively The piecing lines pattern does not appear
at all However there is some evidence of bearish candle patterns in USDZAR The
average returns of the shooting star pattern are found consistently and statistically
significant at 5 level for all the holding periods before and after the RSI filter The
pattern appears 282 times before the filter and 129 times after the filter The average
returns of the hanging man pattern are found statistically significant for the first five
holding periods before and after the filter The average returns of the dark-cloud cover
pattern are found significant only for the three-day and four-day holding periods the
pattern appears only twice Thus due to the low frequency of pattern and the lack of
consistency the pattern results are not considered Appendix 8 includes the descriptive
statistics of the eight candle pattern analysis for USDZAR
ID 100068
72
Chapter 8
Findings and
Recommendations
ID 100068
73
Chapter 8 Findings and Recommendations
After analyzing the results in detail this chapter summarizes the major results into two
areas 1) general findings in term of frequency of pattern appearance holding periods
significance levels and bullish and bearish trends and 2) specific findings that are
pertaining to each currency pair The consistency of statistical significant returns at 5
level for all the holding periods is considered However for the three patterns of the
shooting star the hanging man and the bullish hammer both pre- and post-RSI filter
results are considered statistically significant based on one conservative condition the
average returns should be statistically significant at 5 level for at least five consecutive
holding periods in a row in both data before and after the RSI filter that is above 50
reading for the bearish two candle patterns and below 50 reading for the bullish candle
pattern Another condition that needs to be satisfied when considering the findings is the
number of observations along with the 5 level of significance According to Peterson
and Leuthold (1982) the number of times the candle pattern is identified should be
above 30 in the z score statistic
Having had more 65 bullish data during the study sample and among the four bullish
candlestick reversal patterns the bullish hammer pattern is found the strongest one in
term of frequency and statistical significant average returns at 5 level The maximum
number of times the pattern appears is 97 AUDUSD can be traded using this pattern
for the first six holding periods EURUSD and GBPUSD can be traded for all the seven
holding periods USDJPY can be traded for the first five holding periods The bullish
engulfing pattern is found statistically significant only in USDINR The research also
finds that there is no evidence of the piercing lines and bullish engulfing patterns across
all the seven currencies Two other interesting findings are the very low frequency of the
piercing line pattern across the sample the number varies from four to eight except for
USDINR and USDZAR they appear 33 times and zero times respectively Another
finding is that both of the emerging market currencies USDINR and USDZAR show
ID 100068
74
poor evidence of bullish candle patterns even though most of the study sample falls
under bullish cycles only the average returns of the bullish engulfing pattern in
USDINR is found statistical significant These findings reject both of the null
hypotheses that assume all Japanese candlestick patterns cannot be used to forecast
foreign currency prices and that foreign markets are efficient Furthermore the findings
of the profitable Japanese candle patterns are in line with the results found by Goo
Chen and Chang (2007) Lana Zhanga and Xiongb (2011) Haibin Zhao and Wang
(2012) Lu Shiu and Liu (2012) on the studies that examine the profitability of the
Japanese candle patterns as technical trading rules in particular These results also
support the evidence found using other profitable technical trading rules in general by
Longworth 1981 Brock Lakonishok and LeBaron 1992 Gencay 1997Osler 2000
Saacke 2002 Osker 2003 2006 Shik and Chong 2007 Lento and Gradojevic 2007
Park and Scott 2007 Stephen 2008 Cekirdekci and Iliev 2010 and Loumlnnbark and
Lundstroumlm 2012
Moving to the general findings of the bearish candle reversal patterns strong evidence
of the hanging man and the shooting star patterns are found in most of the foreign
currencies which is statistically significant at 5 level The highest number of the times
the hanging man and shooting star patterns appear is 155 times and 129 times
respectively The pattern of the hanging man that appears in AUDUSD USDCAD and
USDJPY can be traded for all the holding periods whereas the same pattern can be
traded in EURUSD GBPUSD and USDZAR for the first six holding periods of
EURUSD the first five holding periods of GBPUSD and USDZAR respectively The
shooting star pattern can be traded in USDCAD GBPEUR USDZAR and USDJPY
for all the holding periods The research also finds that the number of times the dark-
cloud cover pattern appears is very low it is between one and seven in which the
average returns are found statistically insignificant Similarly the average returns of the
bearish engulfing pattern are found statistically insignificant even though there is a high
frequency of the pattern that goes up to 181 times The last interesting finding is that
both of the emerging market currencies show evidence of the hanging man and the
ID 100068
75
shooting star patterns with an average return that is statistically and consistently
significant at 5 level These findings also reject the two null hypotheses Moreover
these partial findings that find no evidence of profitability of the other candle patterns
are in line with the other results in the literature that find no evidence of profitable
candlestick patterns particularly in the studies done by Brashears and Elam (1993)
Marshall Young and Rose (2005) and Young and Marshall (2007) As unprofitable
technical trading rules in general the poor evidence of the candle patterns are also in
line with the other results found by Levich and Thomas (1993) Lee and Mathur (1996)
LeBaron (2002) Olson (2004) and Lento and Gradojevic (2007)
Currency-wise findings are the second part of the research main findings The bullish
hammer can be traded for the first six holding periods as well as the bearish hanging
man for all the holding periods in AUDUSD Traders can trade the bearish hanging man
and the shooting star patterns in USDCAD for all the holding periods The bullish
hammer pattern the bearish hanging man pattern can be traded in EURUSD for the
first six holding periods GBPUSD can be traded using the bullish hammer the bearish
hanging man and the shooting star patterns for all the holding periods the first five
holding periods and all the holding periods respectively USDINR can be traded using
the bullish engulfing pattern USDZAR can be traded using the bearish hanging man
and the shooting start patterns for the first five holding periods and all the holding
periods respectively Finally USDJPY can be traded using the bullish hammer pattern
for the first five holding periods it can also be traded using the bearish patterns of the
hanging man and the shooting star for all the holding periods
After finding strong evidence of some profitable Japanese candle reversal patterns in
foreign exchange markets this research provides recommendations that are divided
into two main areas The first one is in reference to trading and investment decisions
The other area is concerned with future research Based on the findings above it is
recommended to trade the Japanese candlestick patterns that are found statistically
significant at 5 level in the respective currencies This is summarized in the second
ID 100068
76
section above that is pertaining to respective currency pairs For future research it is
recommended to use more sophisticated algorithm programmes and statistical models
to re-examine the findings of this research not only using daily prices but also intraday
timeframes Since foreign exchange markets are known for being very complex and
difficult to predict it is recommended to use other technical trading rules such as
support-resistance levels and oscillators like the MACD histogram and Commodity
Channel Index (CCI) in combination with the candlestick pattern trading rules Using
such strong different trading rules in which the majority of the trading signals would
agree will help making the trading system very robust Moreover future research is
encouraged to examine the candle reversal patterns in term of bullish and bearish
trends The beauty of the Japanese candlestick patterns reveals when they are used in
combination with other trading rules The key concept in using the candlestick charting
system is the comprehensive technical picture of the market
ID 100068
77
Chapter 9
Conclusion
ID 100068
78
Chapter 9 Conclusion
This research attempts to examine the profitability of selected Japanese candlestick
reversal patterns in the foreign exchange markets as the main objective The research
tests two null hypotheses that assume all Japanese candle reversal patterns cannot be
used to forecast foreign currency price movements and that foreign exchange markets
are efficient supporting the weak form of the EMH The sample includes a 12-year data
of 3129 observations for seven foreign exchange currencies AUDUSD USDCAD
EURUSD GBPUSD USDINR USDZAR and USDJPY The selected Japanese
candle patterns include four bullish and four bearish patterns The bullish patterns
include the bullish hammer the piercing lines the bullish doji star and the bullish
engulfing whereas the bearish patterns include the hanging man the dark-cloud cover
the shooting star and the bearish engulfing The statistical z score test is used to test
the average returns of open-close difference at 5 level of significance for seven
holding periods one day two days three days four days five days seven days and
ten days The 14-day Relative Strength Index (RSI) is used to distinguish similar
patterns that appear at different turning points these similar patterns include the bullish
hammer the hanging man and the shooting star If the hanging man and the shooting
start patterns form above 50 it is assumed that there is a high possibility that the trend
will reverse from up to down Similarly if the bullish hammer pattern forms below the 50
reading there is a high possibility that the current trend will reverse from down to up To
arrive to the final results that are tested statistically using z score the number of times
the candle pattern is identified (n) has to be above 30 (Peterson and Leuthold 1982)
The second condition is that for the three candle patterns that are used in combination
with the RSI filter the results are considered only if the average returns are statistically
significant at 5 level for at least five consecutive holding periods
After examining the candle patterns in the seven currencies the research finds
evidence of some profitable of Japanese candle patterns at 5 level of significance
ID 100068
79
Strong evidence of the bullish hammer the bearish hanging man and the shooting star
patterns in some currencies is found The research finds that the frequency of pattern
appearance for the piercing lines and the dark-cloud cover patterns are the least among
the eight candle patterns Also the results show that the bullish hammer and the
bearish hanging man patterns can be traded in AUDUSD for the first six holding
periods and all the holding periods respectively The bearish hanging man and the
shooting star patterns can be traded in USDCAD for all the seven holding periods The
bullish hammer and the bearish hanging man patterns can be traded in EURUSD for all
the holding periods The bullish hammer the bearish hanging man and the shooting star
patterns can be traded in GBPUSD for the all holding periods the first five trading
periods and all the holding periods respectively The bullish engulfing pattern can be
traded in USDINR for all the holding periods The bearish hanging man and the
shooting star patterns can be traded in USDZAR for all the trading periods Moreover
the bullish hammer the bearish hanging man and the shooting star patterns can be
traded in USDJPY for the first five holding periods of the hanging man and all the
holding periods of the other two patterns Thus these results reject the two null
hypotheses Furthermore the findings of the profitable Japanese candle patterns are in
line with the results found by Goo Chen and Chang (2007) Lana Zhanga and Xiongb
(2011) Haibin Zhao and Wang (2012) Lu Shiu and Liu (2012) on the studies that
examine the profitability of the Japanese candle patterns as technical trading rules in
particular These results also support the evidence found using other profitable technical
trading rules in general by Longworth 1981 Brock Lakonishok and LeBaron 1992
Gencay 1997Osler 2000 Saacke 2002 Osker 2003 2006 Shik and Chong 2007
Lento and Gradojevic 2007 Park and Scott 2007 Stephen 2008 Cekirdekci and Iliev
2010 and Loumlnnbark and Lundstroumlm 2012
Market participants are recommended to use the above candle patterns in the
respective foreign currency in their trading investment and hedging decisions It is also
recommended to use the candle charts along with other trading rules such as support
and resistance levels and oscillators For future research it is recommended to use and
ID 100068
80
examine more sophisticated algorithm programmes and statistical models to re-test the
findings of this research using both daily and intraday prices It is also recommended to
use other technical trading rules such as support-resistance levels and oscillators such
as MACD histogram and the CCI in combination with candlestick pattern trading rules
This is required because foreign exchange markets are very complex using such strong
different trading rules makes the trading system more powerful Moreover future
research is encouraged to examine the candle reversal patterns in term of bullish and
bearish trends The beauty of the Japanese candlestick patterns reveals when they are
used in a combination with other trading rules Last but not least the key concept in
using the candlestick charting system is the comprehensive technical picture of the
market that makes these candlestick trading systems robust
ID 100068
81
Bibliography Achelis S (2001) Technical Analysis from A to Z 2nd ed New York McGraw-Hill Anderson J (2003) A Test of Weak-Form Market Efficiency in Australian Bank Bill Futures Calendar Spreads [online] [Accessed 03 September 2012] Available at httpeprintsquteduau3871Anderson_134pdf Bettman J Sault S amp Welch E (2006) Fundamental and Technical analysis Substitiutes or Compliments [online] [Accessed 07 September 2012] Available at httppapersssrncomsol3paperscfmabstract_id=899879 Brock W Lakonishok J amp LeBaron B (1991) Simple Technical Trading Rules and the Stochastic Properties of Stock Returns [online] [Accessed 10 September 2012] Available at httpwwwsantafeedumediaworkingpapers91-01-006pdf Buffett W (1984) The Superinvestors of Graham-and-doddsville [online] [Accessed 04 October 2012] Available at httpwwwbestinverespdfarticulos_valueThe20Superinvestors20of20Graham20and20Doddsville20by20Warren20Buffettpdf BxCapricorn (2009) Candlestick Alternative Individually Colored Up-Down Bars [blog entry] [Accessed 02 December 2012] Available at httppeltiertechcomWordPresscandlestick-alternative-individually-colored-up-down-bars Cekirdekci M amp Iliev V (2010) Trading System Development Trading the Opening Range Breakouts [online] [Accessed 10 October 2012] Available at httpwwwwpieduPubsE-projectAvailableE-project-042910-142422unrestrictedVeselin_Iliev_IQPpdf Colby R (2003) The Encyclopedia of Technical Market Indicators 2nd ed New York McGraw-Hill Cooper T (2011) Optimal Rotational Strategies using Combined Technical and Fundamental Analysis [online] [Accessed 09 September 2012] Available at httpwwwnaaimorgwp-contentuploads201204K2011_Tony-Cooper_Optimal-_Rotational-_Strategiespdf Fadhel D (2010) Using Candlestick Patterns to Test Efficiency in Stock Futures Markets MSc assignment The British University in Dubai Fama E (1970) ldquoEfficient Capital Markets A Review of Theory and Empirical Workrdquo Journal of Finance [online] Vol 25 (2) [Accessed 15 September 2012] Available at
ID 100068
82
httpefinanceorgcncnfmEfficient20Capital20Markets20A20Review20of20Theory20and20Empirical20Workpdf Friesen G Weller P amp Dunham L (2007) Price trends and Patterns in Technical Analysis A theoretical and empirical examination [online] [Accessed 15 September 2012] Available at httppapersssrncomsol3paperscfmabstract_id=970852 Genccedilay R 1997 The Predictability of Security Returns with Simple Technical Trading Rules Journal of Empirical Finance [online] Vol 5 [Accessed 15 September 2012] Available at httpwwwsfuca~rgencayjarticlesjef-technicalpdf HolmbergU Loumlnnbark C amp Lundstroumlm C (2012) Assessing the Profitability of Intraday Opening Range Breakout Strategies [online] [Accessed 02 September 2012] Available at httpwwwusbeumusedigitalAssets102102002_ues845pdf Jegadeesh N amp Titman S (1993) Returns to Buying Winners and Selling Losers Implications for Stock Market Efficiency Journal of Finance [online] Vol 48 (1) [Accessed 15 September 2012] Available at httpwwwe-m-horgJeTi93pdf Krishnan R amp Menon S (2009) Impact of Currency Pairs Time Frames and Technical Indicators on Trading Profit in Forex Spot Market [online] [Accessed 02 September 2012] Available at httpwwwfxinvestornetforex-educationImpactofCurrencyPairsTimeFramesonTradingProfitsInForexMarketspdf LeBaron B (1998) Technical Trading Rule Profitability and Foreign Exchange Intervention [online] Journal of International Economics Vol 49 (1) [Accessed 04 September 2012] Available at httpwwwsciencedirectcomsciencearticlepiiS0022199698000610 LeBaron B (2002) Technical Trading Profitability in Foreign Exchange Markets in the 1990rsquos [online] [Accessed 02 September 2012] Available at httppeoplebrandeisedu~blebaronwpsfx90pdf Lee C amp Mathur I (1996) A comprehensive Look at the Efficacy of Technical Trading Rules Applied to Cross-rates The European Journal of Finance [online] Vol 2 (4) [Accessed 04 September 2012] Available at httpeconpapersrepecorgarticletafeurjfiv_3a2_3ay_3a1996_3ai_3a4_3ap_3a389-411htm Lento C amp Gradojevic N (2007) The Profitability of Technical Trading Rules A Combined Signal Approach Journal of Applied Business Research [online] Vol 23 (1) [Accessed 04 September 2012] Available at httpjournalscluteonlinecomindexphpJABRarticleviewArticle1405
ID 100068
83
Levich R amp Thomas L (1993) The Significance of Technical Trading Rule Profits in the Foreign Exchange Market a Bootstrap Approach Journal of International Money and Finance [online] Vol 12 (5) [Accessed 04 September 2012] Available at httpwwwnberorgpapersw3818 Levy R (1966) Conceptual Foundations of Technical Analysis Financial Analysts Journal [online] Vol 22 (4) [Accessed 04 September 2012 Available at httpwwwjstororgdiscover1023074470026uid=3737432ampuid=2129ampuid=2ampuid=70ampuid=4ampsid=21101021522633 Lo A amp MacKinlay A (1989) Stock Market Prices Do Not Follow Random Walks Evidence From a Simple Specification Test National Bureau of Economic Research Inc[online] Vol 1(1) [Accessed 02 September 2012] Available at httpideasrepecorgpnbrnberwo2168html Longworth D (1981) Testing the Efficiency of the Canadian-US Exchange Market under the Assumption of No Risk Premium The journal of Finance [online] Vol 36 (1) [Accessed 04 September 2012] Available at httpwwwjstororgdiscover1023072327462uid=3737432ampuid=2129ampuid=2ampuid=70ampuid=4ampsid=21101019268683 Malkiel B (2003) The Efficient Market Hypothesis and Its Critics [online] [Accessed 10 October 2012] Available at httpwwwvixekcomEfficient20Market20Hypothesis20and20its20Critics20-20Malkielpdf Malkiel B Mei J amp Yang R (2006) Investment Strategies to Exploit Economic Growth in China Journal of Investment Consulting [online] Vol 7 (3) [Accessed 15 October 2012] Available at httppapersssrncomsol3paperscfmabstract_id=1702374 Marshall B amp Young M (2007) Market Timing with Candlestick Technical Analysis [online] [Accessed 10 September 2012] Available at httppapersssrncomsol3paperscfmabstract_id=980583 Murphy J (1999) Technical Analysis of Financial Markets 2nd ed New York Penguin Putnam Inc Neely C amp Weller P (2000) Technical Analysis and Central Bank Intervention [online] [Accessed 10 October 2012] Available at httpresearchstlouisfedorgwp199797-002pdf Nison S (2001) Japanese Candlestick Charting Techniques 2nd ed New York Penguin Putnam Inc
ID 100068
84
Nocera J (2009) Poking Holes in a Theory on Markets [online] [Accessed 04 November 2012] Available at httpwwwnytimescom20090606business06nocerahtmlscp=1ampsq=efficient20marketampst=cseamp_r=0 Okunev J amp White D (2003) Do momentum-based Strategies Still Work in Foreign Currency Markets [online] [Accessed 19 October 2012] Available at httpwwwdocsfceunsweduaubankingworkpapcurrencypdf Omrane W amp Oppens H (2004) The Predictive Success and Profitability of Chart Patterns in the EuroDollar Foreign Exchange Market [online] [Accessed 07 September 2012] Available at httppapersssrncomsol3paperscfmabstract_id=484384 Olson D (2004) Have Trading Rule Profits in the Currency Markets Declined over Time Journal of Banking and Finance [online] Vol 28 (1) [Accessed 04 September 2012] Available at httpwwwsciencedirectcomsciencearticlepiiS0378426602003990 Osler C (2000) Support for Resistance Technical Analysis and Intraday Exchange Rates [online] [Accessed 09 December 2012] Available at httpwwwnewyorkfedorgresearchepr00v06n20007oslepdf Osler C (2003) Currency Orders and Exchange Rate Dynamics An Explanation for the Predictive Success of Technical Analysis Journal of Finance [online] Vol 58 (5) [Accessed 16 October 2012] Available at ftpwwweconbguacilCoursesSignaling_in_Financial_MarketsReadingsArticles2009-01-1420Technical20AnalysisCurrency20Orders20and20Exchange20Rate20Dynamics20An20Explanation20for20the20Predictive20Success20ofTechnical20Analysispdf Park C amp Irwin S (2007) What Do We Know about the Probability of Technical Analysis Journal of Economic Surveys [online] Vol 21 (4) [Accessed 10 October 2012] Available at httpideasrepecorgablajecsurv21y2007i4p786-826html Peterson P amp Leuthold R (1982)Using Mechanical Trading Rules to Evaluate the Weak-Form Efficiency of Futures Markets [online] [Accessed 16 December 2012] Available at httpageconsearchumnedubitstream29574114010147pdf Pukthuanthong K amp Thomas L (2008) Weak-form Efficiency in Currency Markets Financial Analysts Journal [online] Vol 64 (3) [Accessed 04 November 2012] Available at httppapersssrncomsol3paperscfmabstract_id=1266184
ID 100068
85
Raymond Y (2012) Fundamental Analysis VS Technical Analysis [online] [Accessed 02 December 2012] Available at httppapersssrncomsol3paperscfmabstract_id=2051485 Saacke P (2002) Technical Analysis and the Effectiveness of Central Bank Intervention Journal of International Money amp Finance [online] Vol 21 (4) [Accessed 04 November 2012] Available at httpmoving-averagestechnicalanalysisorgukSaac02pdf Samuelson P (1965) Proof that Properly Anticipated Prices Fluctuate Randomly [online] [Accessed 10 October 2012] Available at httpstevereadscompapers_to_readproof_that_properly_anticipated_prices_fluctuate_randomlypdf Shik T amp Chong T (2007) A comparison of MA and RSI returns with exchange rate intervention Applied Economic Letters [online] Vol14 (5) [Accessed 15 October 2012] Available at httpideasrepecorgatafapecltv14y2007i5p371-383html SilberW (1994) Technical Trading When it Works and When it Doesnrsquot The Journal of Derivatives [online] Vol 1 No 3 [Accessed 10 October 2012] Available at httpwwwiijournalscomdoiabs103905jod1994407887 Taylor J amp Allen H (1992) The Use of Technical Analysis in Foreign Exchange Market Journal of International Money and Finance [online] Vol 11 (3) [Accessed 10 October 2012] Available at httpwwwsciencedirectcomsciencearticlepii0261560692900483 Thomas G amp Lukas M (2006) Extended Evidence on the Use of Technical Analysis in Foreign Exchange International Journal of Finance amp Economics [online] Vol 11 (4) [Accessed 14 October 2012] Available at ftpwwweconbguacilcoursesSignaling_in_Financial_MarketsReadingsArticles2009-01-1420Technical20AnalysisEXTENDED20EVIDENCE20ON20THE20USE20OF20TECHNICAL20ANALYSIS20IN20FOREIGN20EXCHANGEpdf Thomson Reuters (2013) Foreign Currency Data Download Prices downloaded from 3000 xtra terminal on 01 January 2013 Worrachate A amp Goodman D (2012) Currency Trading at $5 Trillion a Day Surpassed Pre-Lehman High BIS Says [online] [Accessed 20 December 2012] Available at httpwwwbloombergcomnews2012-03-11currency-trading-at-5-trillion-a-day-surpassed-pre-lehman-high-bis-sayshtml
ID 100068
86
Appendix 1 Japanese Candlestick Patterns
Below are the different types of Japanese candle patterns reversal and continuation
patterns The number in brackets shows the number of candles required to form the
pattern (Murphy 1999)
ID 100068
87
Appendix 1 Japanese Candlestick Patterns (continued)
ID 100068
88
Appendix 1 Japanese Candlestick Patterns (continued)
ID 100068
89
Appendix 1 Japanese Candlestick Patterns (continued)
ID 100068
90
Appendix 1 Japanese Candlestick Patterns (continued)
ID 100068
91
Appendix 2 Descriptive statistics of the eight candle pattern analysis for AUDUSD
1 Day 2 Days 3 Days 4 Days 5 Days 7 Days 10 Days 1 Day 2 Days 3 Days 4 Days 5 Days 7 Days 10 DaysAverage 00066 00076 00082 00076 00066 00047 00063 00058 00069 00086 00090 00080 00059 00067
Var 00001 00001 00002 00002 00002 00003 00006 00000 00001 00002 00002 00003 00003 00005
n 89 89 89 89 89 89 89 57 57 57 57 57 57 57
sqrt(varn) 0001 0001 0001 0001 0002 0002 0003 0001 0001 0002 0002 0002 0002 0003
Z score 7979 6128 6085 5173 3960 2622 2438 7157 5481 5297 4655 3590 2471 2162
P-value 000 000 000 000 000 000 001 000 000 000 000 000 001 002
SD 0008 0012 0013 0014 0016 0017 0025 001 001 001 001 002 002 002
Min -0004 -0023 -0020 -0023 -0034 -0030 -0054 -0003 -0013 -0014 -0023 -0034 -0023 -0035
Max 0051 0073 0049 0053 0060 0058 0076 0027 0031 0048 0053 0060 0058 0076
Average 00002 -00036 -00007 -00043 00004 00071 -00056
Var 00000 00002 00003 00004 00007 00013 00011
n 4 4 4 4 4 4 4
sqrt(varn) 0001 0007 0008 0010 0013 0018 0017
Z score 0198 -0535 -0082 -0435 0029 0396 -0328
P-value 042 030 047 033 049 035 037
SD 000 001 002 002 003 004 003
Min -0003 -0020 -0019 -0025 -0026 -0027 -0044
Max 0003 0013 0021 0021 0035 0052 0032
Average -00006 -00009 -00009 -00012 -00014 00052 00038 00039 00028 00022 00013 00016 00023 00025
Var 00001 00001 00001 00002 00002 00077 00078 00000 00000 00001 00001 00001 00001 00002
n 148 148 148 148 148 148 148 92 92 92 92 92 92 92
sqrt(varn) 0001 0001 0001 0001 0001 0007 0007 0000 0001 0001 0001 0001 0001 0002
Z score -0930 -1157 -0917 -1019 -1179 0717 0521 9602 4433 2319 1300 1573 2015 1553
P-value 018 012 018 015 012 024 030 000 000 001 010 006 002 006
SD 0007 0009 0012 0014 0015 0087 0088 0004 0006 0009 0009 0010 0011 0015
Min -0025 -0031 -0051 -0064 -0053 -0085 -0062 -0001 -0010 -0013 -0025 -0019 -0018 -0030
Max 0029 0020 0033 0050 0055 1039 1039 0019 0020 0051 0031 0031 0036 0059
Average -00015 -00015 -00017 -00016 -00021 00132 00106
Var 00001 00001 00002 00003 00003 00160 00163
n 70 70 70 70 70 70 70
sqrt(varn) 0001 0001 0002 0002 0002 0015 0015
Z score -1388 -1102 -0913 -0727 -0950 0871 0692
P-value 008 014 018 023 017 019 024
SD 001 001 002 002 002 013 013
Min -0025 -0031 -0051 -0064 -0053 -0085 -0062
Max 0029 0020 0033 0050 0055 1039 1039
1 Day 2 Days 3 Days 4 Days 5 Days 7 Days 10 Days 1 Day 2 Days 3 Days 4 Days 5 Days 7 Days 10 DaysAverage 00054 00053 00053 00057 00055 00070 00088 00054 00041 00030 00040 00039 00042 00051
Var 00000 00001 00001 00001 00002 00003 00004 00000 00001 00001 00001 00002 00003 00003
n 77 77 77 77 77 77 77 40 40 40 40 40 40 40
sqrt(varn) 0001 0001 0001 0001 0002 0002 0002 0001 0001 0001 0002 0002 0003 0003
Z score 9480 5729 5275 4439 3561 3500 4108 5895 2822 2101 2327 1886 1504 1742
P-value 000 000 000 000 000 000 000 000 000 002 001 003 007 004
SD 0005 0008 0009 0011 0014 0018 0019 001 001 001 001 001 002 002
Min -0001 -0023 -0023 -0018 -0031 -0048 -0052 -0001 -0023 -0023 -0018 -0024 -0048 -0052
Max 0034 0031 0022 0043 0040 0063 0070 0034 0031 0021 0031 0035 0045 0033
Average -00071 -00034 -00120 -00059 -00012 -00015 -00017
Var 00000 00001 00005 00005 00005 00005 00011
n 7 7 7 7 7 7 7
sqrt(varn) 0002 0004 0008 0008 0008 0008 0012
Z score -2887 -0858 -1435 -0718 -0140 -0184 -0138
P-value 000 020 008 024 044 043 045
SD 0007 0011 0022 0022 0022 0022 0033
Min -0018 -0022 -0041 -0038 -0026 -0033 -0049
Max 0002 0011 0015 0021 0025 0032 0046
Average 00032 00027 00032 00038 00061 00054 00065
Var 00000 00001 00001 00001 00001 00002 00002
n 28 28 28 28 28 28 28
sqrt(varn) 0001 0001 0002 0002 0002 0002 0002
Z score 3045 1903 1885 2206 2688 2326 2628
P-value 000 003 003 001 000 001 000
SD 0006 0007 0009 0009 0012 0012 0013
Min -0005 -0010 -0012 -0015 -0012 -0025 -0028
Max 0014 0024 0022 0018 0050 0031 0026
Average -00005 00003 00002 00010 00011 -00006 00013
Var 00000 00001 00001 00001 00002 00003 00002
n 49 49 49 49 49 49 49
sqrt(varn) 0001 0001 0002 0002 0002 0002 0002
Z score -0597 0243 0092 0586 0562 -0258 0621
P-value 028 040 046 028 029 040 027
SD 0006 0010 0012 0012 0014 0016 0014
Min -0017 -0022 -0035 -0031 -0037 -0033 -0031
Max 0012 0025 0025 0024 0031 0037 0032
At 5 level of significance
0002
Bullish
Engulfing0000
With RSI
Filter
Holding period
0004Bullish
Hammer0006
Piercing Lines -0005
Bullish Doji
Star0004
With RSI
Filter
Holding period
0007
Bullish
Candlestick
Patterns
Descriptive
Statistics
Holding
Periods
Average
Holding period
Dark-Cloud
Cover
Shooting Star
Bearish
Engulfing
0007
-0001
0001
0002
Holding periodHolding
Periods
Average
Bearish
Candlestick
Patterns
Descriptive
Statistics
Hanging Man
ID 100068
92
Appendix 3 Descriptive statistics of the eight candle pattern analysis for USDCAD
1 Day 2 Days 3 Days 4 Days 5 Days 7 Days 10 Days 1 Day 2 Days 3 Days 4 Days 5 Days 7 Days 10 DaysAverage 00053 00058 00068 00063 00072 00069 00066 00049 00055 00077 00068 00083 00092 00087
Var 00000 00000 00001 00001 00002 00003 00005 00000 00000 00001 00001 00001 00002 00003
n 79 79 79 79 79 79 79 44 44 44 44 44 44 44
sqrt(varn) 0000 0001 0001 0001 0001 0002 0003 0001 0001 0001 0002 0002 0002 0003
Z score 11920 7456 6379 4888 4907 3632 2555 8727 5249 5633 4399 4697 4543 3218
P-value 000 000 000 000 000 000 001 000 000 000 000 000 000 000
SD 0004 0007 0009 0011 0013 0017 0023 000 001 001 001 001 001 002
Min -0001 -0009 -0015 -0026 -0023 -0044 -0090 0000 -0008 -0015 -0020 -0016 -0033 -0031
Max 0016 0032 0036 0043 0059 0062 0088 0015 0022 0029 0024 0029 0028 0035
Average -00039 -00029 -00044 -00040 00016 -00041 00094
Var 00000 00003 00003 00003 00000 00002 00000
n 2 2 2 2 2 2 2
sqrt(varn) 0005 0012 0012 0012 0005 0010 0001
Z score -0794 -0250 -0373 -0331 0363 -0411 9400
P-value 021 040 035 037 036 034 000
SD 001 002 002 002 001 001 000
Min -0009 -0015 -0016 -0016 -0003 -0014 0008
Max 0001 0009 0007 0008 0006 0006 0010
Average 00056 00055 00058 00057 00064 00068 00069 00064 00062 00059 00054 00053 00065 00073
Var 00000 00001 00001 00001 00002 00003 00004 00000 00001 00001 00002 00002 00003 00005
n 240 240 240 240 240 240 240 108 108 108 108 108 108 108
sqrt(varn) 0000 0001 0001 0001 0001 0001 0001 0001 0001 0001 0001 0001 0002 0002
Z score 17964 9992 9069 7432 7383 6354 5191 11585 6832 5480 4375 4085 4026 3515
P-value 000 000 000 000 000 000 000 000 000 000 000 000 000 000
SD 0005 0008 0010 0012 0013 0016 0021 0006 0009 0011 0013 0014 0017 0022
Min -0002 -0024 -0022 -0024 -0029 -0046 -0109 0000 -0008 -0022 -0024 -0029 -0046 -0109
Max 0028 0059 0043 0047 0050 0066 0060 0028 0059 0043 0046 0039 0066 0056
Average -00002 00009 00003 00003 00005 00005 00020
Var 00001 00001 00002 00002 00003 00003 00005
n 171 171 171 171 171 171 171
sqrt(varn) 0001 0001 0001 0001 0001 0001 0002
Z score -0428 1065 0340 0237 0388 0367 1237
P-value 033 014 037 041 035 036 011
SD 001 001 001 001 002 002 002
Min -0031 -0033 -0037 -0035 -0044 -0054 -0053
Max 0046 0069 0058 0089 0120 0078 0073
1 Day 2 Days 3 Days 4 Days 5 Days 7 Days 10 Days 1 Day 2 Days 3 Days 4 Days 5 Days 7 Days 10 DaysAverage 00057 00055 00054 00047 00053 00057 00052 00052 00026 00027 00021 -00002 00014 00010
Var 00000 00001 00002 00001 00003 00004 00005 00000 00001 00001 00001 00002 00002 00002
n 58 58 58 58 58 58 58 25 25 25 25 25 25 25
sqrt(varn) 0001 0002 0002 0002 0002 0002 0003 0001 0002 0002 0002 0003 0003 0003
Z score 8061 3627 3039 2963 2402 2294 1775 6554 1535 1686 1112 -0076 0517 0347
P-value 000 000 000 000 001 001 004 000 006 005 013 047 030 036
SD 0005 0012 0014 0012 0017 0019 0022 000 001 001 001 001 001 001
Min 0000 -0016 -0022 -0020 -0031 -0024 -0044 0000 -0016 -0010 -0010 -0031 -0024 -0022
Max 0025 0043 0070 0043 0058 0072 0111 0013 0025 0021 0030 0025 0027 0043
Average 00055 00055 00080 00058 00075 00116 00160
Var 00000 00001 00003 00001 00003 00008 00006
n 8 8 8 8 8 8 8
sqrt(varn) 0002 0003 0006 0004 0006 0010 0009
Z score 3026 1927 1333 1358 1298 1182 1811
P-value 000 003 009 009 010 012 004
SD 0005 0008 0017 0012 0016 0028 0025
Min -0005 -0009 -0010 -0008 -0012 -0035 -0015
Max 0013 0015 0039 0030 0037 0044 0058
Average 00007 00034 00055 00036 00043 00044 00077
Var 00001 00002 00003 00002 00003 00005 00009
n 19 19 19 19 19 19 19
sqrt(varn) 0002 0003 0004 0003 0004 0005 0007
Z score 0382 1158 1275 1115 1085 0882 1133
P-value 035 012 010 013 014 019 013
SD 0008 0013 0019 0014 0017 0022 0030
Min -0013 -0016 -0030 -0028 -0026 -0035 -0036
Max 0025 0043 0070 0043 0058 0072 0111
Average -00014 -00025 -00014 -00023 -00008 -00011 -00034
Var 00000 00001 00001 00001 00001 00003 00002
n 35 35 35 35 35 35 35
sqrt(varn) 0001 0001 0002 0002 0002 0003 0003
Z score -1851 -1755 -0847 -1241 -0409 -0375 -1343
P-value 003 004 020 011 034 035 009
SD 0005 0008 0010 0011 0011 0017 0015
Min -0012 -0026 -0024 -0024 -0034 -0042 -0034
Max 0009 0012 0024 0019 0018 0030 0027
At 5 level of significance
Bullish
Engulfing-0002
Bullish
Hammer0005 0002
Piercing Lines 0009
Bullish Doji
Star0004
Holding period
Shooting Star 0006 0006
Bearish
Engulfing0001
Bullish
Candlestick
Descriptive
Statistics
Holding
Periods
Holding period With RSI
Filter
Hanging Man 0006 0007
Dark-Cloud
Cover-0001
Holding periodBearish
Candlestick
Patterns
Descriptive
Statistics
Holding
Periods
Average
Holding periodWith RSI
Filter
ID 100068
93
Appendix 4 Descriptive statistics of the eight candle pattern analysis for EURUSD
1 Day 2 Days 3 Days 4 Days 5 Days 7 Days 10 Days 1 Day 2 Days 3 Days 4 Days 5 Days 7 Days 10 DaysAverage 00060 00063 00053 00044 00035 00046 00043 00058 00072 00049 00054 00048 00046 00039
Var 00000 00001 00002 00002 00003 00004 00006 00000 00001 00001 00002 00003 00003 00004
n 106 106 106 106 106 106 106 57 57 57 57 57 57 57
sqrt(varn) 0001 0001 0001 0001 0002 0002 0002 0001 0001 0002 0002 0002 0002 0003
Z score 11057 6201 4199 3044 2185 2435 1841 7749 5822 3207 2860 2254 2000 1476
P-value 000 000 000 000 001 001 003 000 000 000 000 001 002 007
SD 0006 0011 0013 0015 0016 0019 0024 001 001 001 001 002 002 002
Min -0004 -0021 -0022 -0036 -0035 -0031 -0085 -0002 -0012 -0018 -0024 -0032 -0025 -0034
Max 0029 0032 0038 0044 0043 0058 0061 0029 0032 0038 0044 0043 0053 0047
Average 00004 -00009 -00024 -00043 -00081 -00047 -00059
Var 00002 00001 00003 00003 00003 00004 00005
n 7 7 7 7 7 7 7
sqrt(varn) 0005 0004 0006 0007 0007 0008 0008
Z score 0094 -0229 -0386 -0623 -1190 -0613 -0735
P-value 046 059 065 073 088 073 077
SD 001 001 002 002 002 002 002
Min -0020 -0009 -0028 -0025 -0027 -0025 -0025
Max 0018 0017 0020 0026 0018 0030 0032
Average 00066 00065 00138 00133 00147 00221 00227 00064 00054 00216 00202 00218 00359 00360
Var 00000 00001 00098 00099 00099 00194 00197 00000 00001 00201 00202 00203 00398 00399
n 181 181 181 181 181 181 181 87 87 87 87 87 87 87
sqrt(varn) 0000 0001 0007 0007 0007 0010 0010 0001 0001 0015 0015 0015 0021 0021
Z score 14089 7642 1877 1803 1981 2132 2179 9528 4571 1422 1327 1431 1678 1681
P-value 000 000 003 004 002 002 001 000 000 008 009 008 005 005
SD 0006 0012 0099 0099 0100 0139 0140 0006 0011 0142 0142 0142 0199 0200
Min -0001 -0022 -0041 -0056 -0039 -0036 -0091 -0001 -0022 -0023 -0024 -0027 -0036 -0048
Max 0033 0052 1323 1323 1323 1323 1323 0033 0052 1323 1323 1323 1323 1323
Average 00006 00007 00010 00016 00016 00012 00000
Var 00001 00002 00002 00002 00003 00004 00007
n 156 156 156 156 156 156 156
sqrt(varn) 0001 0001 0001 0001 0001 0002 0002
Z score 0748 0671 0852 1316 1188 0707 0002
P-value 023 025 020 009 012 024 050
SD 001 001 001 002 002 002 003
Min -0022 -0031 -0030 -0041 -0035 -0041 -0066
Max 0030 0039 0053 0043 0050 0071 0080
1 Day 2 Days 3 Days 4 Days 5 Days 7 Days 10 Days 1 Day 2 Days 3 Days 4 Days 5 Days 7 Days 10 DaysAverage 00069 00085 00103 00097 00082 00111 00137 00064 00080 00094 00085 00060 00108 00162
Var 00000 00001 00002 00002 00003 00004 00008 00000 00001 00001 00002 00003 00005 00010
n 64 64 64 64 64 64 64 34 34 34 34 34 34 34
sqrt(varn) 0001 0001 0002 0002 0002 0003 0003 0001 0001 0002 0002 0003 0004 0005
Z score 9122 5806 5359 5122 3939 4311 3942 7655 5739 5329 3898 2012 2946 3011
P-value 000 000 000 000 000 000 000 000 000 000 000 002 000 000
SD 0006 0012 0015 0015 0017 0021 0028 000 001 001 001 002 002 003
Min 0000 -0009 -0012 -0020 -0036 -0031 -0039 0001 -0004 -0007 -0016 -0036 -0025 -0031
Max 0034 0073 0103 0084 0055 0067 0170 0020 0028 0032 0032 0043 0067 0170
Average -00016 -00036 -00047 -00048 -00037 -00073 -00029
Var 00000 00000 00001 00001 00002 00007 00007
n 7 7 7 7 7 7 7
sqrt(varn) 0002 0001 0003 0004 0005 0010 0010
Z score -0787 -4245 -1554 -1222 -0737 -0746 -0296
P-value 022 000 006 011 023 023 038
SD 0005 0002 0008 0010 0013 0026 0026
Min -0009 -0006 -0017 -0017 -0020 -0045 -0044
Max 0008 -0001 0006 0009 0010 0016 0026
Average -00008 00002 00016 00013 00008 00001 00033
Var 00000 00001 00001 00002 00002 00001 00002
n 15 15 15 15 15 15 15
sqrt(varn) 0002 0002 0003 0003 0004 0003 0003
Z score -0494 0094 0594 0387 0216 0045 1003
P-value 031 046 028 035 041 048 016
SD 0006 0009 0010 0013 0014 0012 0013
Min -0011 -0016 -0014 -0016 -0028 -0023 -0017
Max 0016 0015 0018 0024 0021 0023 0027
Average -00010 00000 -00011 -00024 -00013 00019 00050
Var 00001 00001 00002 00002 00002 00004 00008
n 49 49 49 49 49 49 49
sqrt(varn) 0001 0002 0002 0002 0002 0003 0004
Z score -0861 0013 -0613 -1188 -0609 0677 1270
P-value 019 051 027 012 027 075 090
SD 0009 0012 0013 0014 0015 0020 0028
Min -0022 -0028 -0028 -0031 -0046 -0040 -0045
Max 0032 0047 0030 0030 0026 0065 0139
At 5 level of significance
Bullish
Engulfing0000
Bullish
Hammer0010 0009
Piercing Lines -0004
Bullish Doji
Star0001
Holding period
Shooting Star 0014 0021
Bearish
Engulfing0001
Bullish
Candlestick
Descriptive
Statistics
Holding
Periods
Holding period With RSI
Filter
Hanging Man 0005 0005
Dark-Cloud
Cover-0004
Holding periodBearish
Candlestick
Patterns
Descriptive
Statistics
Holding
Periods
Average
Holding periodWith RSI
Filter
ID 100068
94
Appendix 5 Descriptive statistics of the eight candle pattern analysis for GBPUSD
1 Day 2 Days 3 Days 4 Days 5 Days 7 Days 10 Days 1 Day 2 Days 3 Days 4 Days 5 Days 7 Days 10 DaysAverage 00067 00061 00053 00049 00054 00065 00058 00061 00055 00052 00053 00057 00048 00027
Var 00000 00002 00002 00003 00004 00008 00011 00000 00001 00002 00003 00004 00007 00010
n 99 99 99 99 99 99 99 57 57 57 57 57 57 57
sqrt(varn) 0001 0001 0002 0002 0002 0003 0003 0001 0001 0002 0002 0003 0004 0004
Z score 10008 4341 3443 2727 2588 2316 1757 7854 3929 2641 2212 2127 1368 0651
P-value 000 000 000 000 000 001 004 000 000 000 001 002 009 026
SD 0007 0014 0015 0018 0021 0028 0033 001 001 001 002 002 003 003
Min -0001 -0019 -0028 -0052 -0063 -0070 -0071 -0001 -0015 -0026 -0052 -0063 -0070 -0071
Max 0039 0078 0057 0063 0063 0109 0124 0031 0045 0057 0063 0057 0081 0124
Average 00014 00033 00006 -00084 -00093 00030 00053
Var NA NA NA NA NA NA NA
n 1 1 1 1 1 1 1
sqrt(varn) NA NA NA NA NA NA NA
Z score NA NA NA NA NA NA NA
P-value NA NA NA NA NA NA NA
SD NA NA NA NA NA NA NA
Min 0001 0003 0001 -0008 -0009 0003 0005
Max 0001 0003 0001 -0008 -0009 0003 0005
Average 00076 00083 00079 00157 00170 00178 00196 00086 00100 00096 00083 00102 00100 00117
Var 00001 00002 00003 00136 00137 00138 00142 00001 00003 00004 00006 00009 00010 00014
n 197 197 197 197 197 197 197 93 93 93 93 93 93 93
sqrt(varn) 0001 0001 0001 0008 0008 0008 0008 0001 0002 0002 0003 0003 0003 0004
Z score 14462 8325 6124 1888 2040 2118 2304 9759 5952 4630 3246 3344 3118 3013
P-value 000 000 000 003 002 002 001 000 000 000 000 000 000 000
SD 0007 0014 0018 0116 0117 0118 0119 0008 0016 0020 0025 0029 0031 0037
Min -0009 -0026 -0048 -0061 -0054 -0065 -0079 -0007 -0026 -0043 -0051 -0054 -0047 -0070
Max 0037 0093 0088 1614 1614 1614 1614 0037 0093 0088 0097 0107 0117 0151
Average 00004 00003 00130 00132 00125 00112 00127
Var 00001 00003 00200 00201 00202 00204 00208
n 131 131 131 131 131 131 131
sqrt(varn) 0001 0001 0012 0012 0012 0012 0013
Z score 0427 0200 1053 1063 1007 0898 1005
P-value 033 042 015 014 016 018 016
SD 001 002 014 014 014 014 014
Min -0027 -0041 -0042 -0056 -0059 -0075 -0097
Max 0055 0067 1610 1610 1610 1610 1610
1 Day 2 Days 3 Days 4 Days 5 Days 7 Days 10 Days 1 Day 2 Days 3 Days 4 Days 5 Days 7 Days 10 DaysAverage 00070 00061 00054 00066 00086 00079 00080 00088 00098 00090 00123 00141 00132 00120
Var 00000 00001 00002 00003 00004 00006 00009 00000 00001 00002 00003 00004 00007 00012
n 97 97 97 97 97 97 97 37 37 37 37 37 37 37
sqrt(varn) 0001 0001 0001 0002 0002 0002 0003 0001 0002 0002 0003 0003 0004 0006
Z score 12056 5534 3889 3736 4265 3309 2568 8059 5146 3929 4206 4140 3036 2071
P-value 000 000 000 000 000 000 001 000 000 000 000 000 000 002
SD 0006 0011 0014 0017 0020 0024 0031 001 001 001 002 002 003 004
Min -0002 -0019 -0024 -0032 -0036 -0043 -0119 -0001 -0011 -0020 -0032 -0036 -0043 -0119
Max 0028 0042 0049 0058 0078 0088 0108 0028 0042 0049 0058 0078 0088 0108
Average -00011 00063 -00025 -00111 -00083 -00198 -00086
Var 00002 00007 00011 00022 00021 00051 00014
n 7 7 7 7 7 7 7
sqrt(varn) 0006 0010 0013 0018 0017 0027 0014
Z score -0194 0628 -0192 -0626 -0486 -0736 -0605
P-value 042 027 042 027 031 023 027
SD 0015 0026 0034 0047 0045 0071 0038
Min -0018 -0026 -0063 -0102 -0099 -0178 -0088
Max 0024 0054 0043 0047 0047 0034 0021
Average -00013 00003 -00017 -00042 -00036 -00049 -00070
Var 00001 00001 00002 00003 00008 00011 00020
n 17 17 17 17 17 17 17
sqrt(varn) 0002 0003 0003 0005 0007 0008 0011
Z score -0562 0106 -0559 -0930 -0519 -0618 -0649
P-value 029 046 029 018 030 027 026
SD 0009 0011 0012 0019 0028 0033 0045
Min -0024 -0021 -0025 -0049 -0073 -0109 -0149
Max 0009 0015 0023 0020 0026 0027 0040
Average 00010 00020 00031 00038 00018 -00009 00043
Var 00001 00002 00003 00003 00004 00006 00008
n 48 48 48 48 48 48 48
sqrt(varn) 0002 0002 0003 0003 0003 0004 0004
Z score 0622 0980 1203 1505 0648 -0253 1057
P-value 027 016 011 007 026 040 015
SD 0011 0014 0018 0018 0020 0025 0028
Min -0024 -0026 -0044 -0036 -0057 -0066 -0085
Max 0031 0044 0044 0049 0037 0058 0084
At 5 level of significance
Bullish
Engulfing0002
Bullish
Hammer0007 0011
Piercing Lines -0006
Bullish Doji
Star-0003
Holding period
Shooting Star 0013 0010
Bearish
Engulfing0009
Bullish
Candlestick
Descriptive
Statistics
Holding
Periods
Holding period With RSI
Filter
Hanging Man 0006 0005
Dark-Cloud
Cover-0001
Holding periodBearish
Candlestick
Patterns
Descriptive
Statistics
Holding
Periods
Average
Holding periodWith RSI
Filter
ID 100068
95
Appendix 6 Descriptive statistics of the eight candle pattern analysis for USDINR
1 Day 2 Days 3 Days 4 Days 5 Days 7 Days 10 Days 1 Day 2 Days 3 Days 4 Days 5 Days 7 Days 10 DaysAverage 00878 00685 00760 00671 00864 01322 00653 00978 00930 00774 00790 00750 01638 00823
Var 00250 00591 00938 01514 02612 03663 03983 00374 00726 01313 02246 03039 04316 04429
n 69 69 69 69 69 69 69 39 39 39 39 39 39 39
sqrt(varn) 0019 0029 0037 0047 0062 0073 0076 0031 0043 0058 0076 0088 0105 0107
Z score 4611 2342 2060 1432 1405 1814 0859 3156 2155 1334 1041 0850 1558 0772
P-value 000 001 002 008 008 003 020 000 002 009 015 020 006 022
SD 0158 0243 0306 0389 0511 0605 0631 019 027 036 047 055 066 067
Min -0150 -0560 -0870 -1200 -1510 -1300 -1500 -0140 -0560 -0870 -1200 -1510 -1300 -1500
Max 0790 0880 0900 1500 1790 2470 2090 0790 0880 0900 1500 1620 2470 1825
Average 00050 -00150 -00250 00450 00500 00750 00950
Var 00000 00001 00005 00004 00002 00004 00005
n 2 2 2 2 2 2 2
sqrt(varn) 0005 0005 0015 0015 0010 0015 0015
Z score 1000 -3000 -1667 3000 5000 5000 6333
P-value 016 000 005 000 000 000 000
SD 001 001 002 002 001 002 002
Min 0000 -0020 -0040 0030 0040 0060 0080
Max 0010 -0010 -0010 0060 0060 0090 0110
Average -00684 -00692 -00759 -00699 -00692 -00661 -00647 -00865 -01014 -01246 -01153 -01164 -01473 -01630
Var 71804 72368 72772 72878 73689 74004 75017 81040 81589 81685 81601 82796 82566 83881
n 549 549 549 549 549 549 549 244 244 244 244 244 244 244
sqrt(varn) 0114 0115 0115 0115 0116 0116 0117 0182 0183 0183 0183 0184 0184 0185
Z score -0598 -0603 -0660 -0607 -0597 -0570 -0554 -0474 -0554 -0681 -0630 -0632 -0801 -0879
P-value 027 027 025 027 028 028 029 032 029 025 026 026 021 019
SD 2680 2690 2698 2700 2715 2720 2739 2847 2856 2858 2857 2877 2873 2896
Min -44310 -44390 -44400 -44420 -44490 -44550 -44480 -44310 -44390 -44340 -44100 -44290 -44240 -44420
Max 1220 2020 2080 2760 2790 2320 2550 1150 1470 1590 2760 2790 2050 2300
Average 00273 09833 09691 09676 09295 08935 18775
Var 00406 547179 547892 548641 550897 552705 1076427
n 55 55 55 55 55 55 55
sqrt(varn) 0027 0997 0998 0999 1001 1002 1399
Z score 1003 0986 0971 0969 0929 0891 1342
P-value 016 016 017 017 018 019 009
SD 020 740 740 741 742 743 1038
Min -0500 -0750 -1010 -0930 -1800 -1630 -1370
Max 0790 54800 54800 54800 54800 54800 54800
1 Day 2 Days 3 Days 4 Days 5 Days 7 Days 10 Days 1 Day 2 Days 3 Days 4 Days 5 Days 7 Days 10 DaysAverage 01364 01059 01434 01296 02064 02481 03112 01450 00992 00837 01100 01362 02317 02908
Var 00210 00518 01254 02227 02393 03067 05032 00112 00486 00968 02973 02659 02819 02750
n 40 40 40 40 40 40 40 12 12 12 12 12 12 12
sqrt(varn) 0023 0036 0056 0075 0077 0088 0112 0031 0064 0090 0157 0149 0153 0151
Z score 5948 2943 2562 1737 2669 2834 2775 4743 1558 0932 0699 0915 1511 1921
P-value 000 000 001 004 000 000 000 000 006 018 024 018 007 003
SD 0145 0228 0354 0472 0489 0554 0709 011 022 031 055 052 053 052
Min -0090 -0370 -0340 -0720 -0660 -0910 -1650 -0030 -0370 -0240 -0720 -0580 -0460 -0290
Max 0670 0660 1070 1355 1440 1750 2360 0340 0505 0815 1355 1265 1250 1340
Average 00305 00740 -16351 -16328 -15828 -16388 -17586
Var 00434 01844 916844 917174 918881 917544 915284
n 33 33 33 33 33 33 33
sqrt(varn) 0036 0075 1667 1667 1669 1667 1665
Z score 0840 0989 -0981 -0979 -0949 -0983 -1056
P-value 020 016 016 016 017 016 015
SD 0208 0429 9575 9577 9586 9579 9567
Min -0290 -0960 -54939 -54939 -54939 -54939 -54939
Max 0760 1710 0790 1000 1470 1120 1160
Average -00033 -00201 -00382 -00309 -04374 -04235 -04118
Var 00204 00321 00447 00578 227763 228851 229692
n 133 133 133 133 133 133 133
sqrt(varn) 0012 0016 0018 0021 0414 0415 0416
Z score -0264 -1291 -2085 -1483 -1057 -1021 -0991
P-value 040 010 002 007 015 015 016
SD 0143 0179 0211 0240 4772 4784 4793
Min -0570 -0930 -0860 -1380 -54980 -54980 -54980
Max 0700 0690 1000 0670 0710 1970 2160
Average 00492 01023 01242 01321 01683 01635 01580
Var 00392 00676 01072 01827 03210 04220 04971
n 65 65 65 65 65 65 65
sqrt(varn) 0025 0032 0041 0053 0070 0081 0087
Z score 2003 3173 3059 2491 2395 2029 1807
P-value 002 000 000 001 001 002 004
SD 0198 0260 0327 0427 0567 0650 0705
Min -0350 -0320 -0480 -0620 -1200 -1150 -1350
Max 1090 1210 1170 1375 1885 2360 2020
At 5 level of significance
Bullish
Engulfing0128
Bullish
Hammer0183 0157
Piercing Lines -1163
Bullish Doji
Star-0195
Holding period
Shooting Star -0069 -0122
Bearish
Engulfing0950
Bullish
Candlestick
Descriptive
Statistics
Holding
Periods
Holding period With RSI
Filter
Hanging Man 0083 0095
Dark-Cloud
Cover0033
Holding periodBearish
Candlestick
Patterns
Descriptive
Statistics
Holding
Periods
Average
Holding periodWith RSI
Filter
ID 100068
96
Appendix 7 Descriptive statistics of the eight candle pattern analysis for USDJPY
1 Day 2 Days 3 Days 4 Days 5 Days 7 Days 10 Days 1 Day 2 Days 3 Days 4 Days 5 Days 7 Days 10 DaysAverage 04627 04714 04714 04802 04465 05732 11671 03676 03777 03810 04011 05360 07405 17862
Var 02363 07149 13438 15472 21160 28719 488549 01087 04250 10271 13060 18991 28927 888050
n 155 155 155 155 155 155 155 82 82 82 82 82 82 82
sqrt(varn) 0039 0068 0093 0100 0117 0136 0561 0036 0072 0112 0126 0152 0188 1041
Z score 11851 6941 5063 4806 3822 4211 2079 10095 5246 3404 3178 3522 3942 1716
P-value 000 000 000 000 000 000 002 000 000 000 000 000 000 004
SD 0486 0846 1159 1244 1455 1695 6990 033 065 101 114 138 170 942
Min -0260 -1240 -2580 -3470 -4190 -3010 -3720 -0260 -0750 -2580 -3470 -4190 -3010 -3720
Max 3730 5210 4350 5260 4710 5770 84360 1220 2010 3320 2990 4710 5770 84360
Average 05050 02725 02975 01250 00200 01800 06800
Var 01947 14612 41297 20731 40901 85650 82270
n 4 4 4 4 4 4 4
sqrt(varn) 0221 0604 1016 0720 1011 1463 1434
Z score 2289 0451 0293 0174 0020 0123 0474
P-value 001 033 038 043 049 045 032
SD 044 121 203 144 202 293 287
Min -0040 -1320 -2180 -1620 -2420 -3330 -3290
Max 0950 1280 2570 1850 2520 3300 3100
Average 05516 05495 05417 05094 05444 05442 06372 05869 06464 06567 06036 06421 05719 07360
Var 02540 06708 11223 15253 19160 29185 34308 03170 09840 13320 20250 24616 29482 30796
n 190 190 190 190 190 190 190 75 75 75 75 75 75 75
sqrt(varn) 0037 0059 0077 0090 0100 0124 0134 0065 0115 0133 0164 0181 0198 0203
Z score 15089 9247 7049 5685 5421 4391 4742 9029 5643 4928 3673 3544 2884 3632
P-value 000 000 000 000 000 000 000 000 000 000 000 000 000 000
SD 0504 0819 1059 1235 1384 1708 1852 0563 0992 1154 1423 1569 1717 1755
Min -0130 -1320 -2180 -3600 -4150 -3330 -3760 -0110 -1200 -1470 -3600 -4150 -3300 -3760
Max 2680 4170 4210 4790 5130 5810 6580 2680 4170 4210 4790 4530 5810 4820
Average -00060 00189 01251 01894 01125 01518 02117
Var 04819 08791 15597 20948 21718 28314 38831
n 181 181 181 181 181 181 181
sqrt(varn) 0052 0070 0093 0108 0110 0125 0146
Z score -0117 0271 1348 1761 1027 1213 1445
P-value 045 039 009 004 015 011 007
SD 069 094 125 145 147 168 197
Min -1880 -2970 -2760 -3470 -3690 -3850 -4420
Max 3360 2640 6200 7680 4080 5490 5600
1 Day 2 Days 3 Days 4 Days 5 Days 7 Days 10 Days 1 Day 2 Days 3 Days 4 Days 5 Days 7 Days 10 DaysAverage 04693 04789 04751 04302 03855 -04991 -05064 04929 04990 05166 04418 03647 -00148 00368
Var 01443 05276 10453 13083 19334 620913 638899 01684 06561 12318 14783 25952 33189 48136
n 120 120 120 120 120 120 120 62 62 62 62 62 62 62
sqrt(varn) 0035 0066 0093 0104 0127 0719 0730 0052 0103 0141 0154 0205 0231 0279
Z score 13534 7223 5090 4120 3037 -0694 -0694 9457 4851 3665 2861 1782 -0064 0132
P-value 000 000 000 000 000 024 024 000 000 000 000 004 047 045
SD 0380 0726 1022 1144 1390 7880 7993 041 081 111 122 161 182 219
Min -0160 -1280 -3770 -3800 -7360 -84210 -84210 -0040 -1280 -3770 -3800 -7360 -4810 -4990
Max 1520 2670 2960 2540 3400 3540 7260 1520 2670 2960 2540 3120 3130 4480
Average 0297 0563 -0032 -0018 -0037 -0153 0130
Var 0259 0265 0314 0544 0770 3447 7578
n 4 4 4 4 4 4 4
sqrt(varn) 0254 0257 0280 0369 0439 0928 1376
Z score 117 219 -012 -005 -009 -016 009
P-value 0121 0014 0454 0481 0466 0435 0462
SD 0508 0514 0560 0738 0878 1857 2753
Min -0140 0000 -0680 -0660 -0740 -2390 -3950
Max 0990 1160 0550 0980 1170 1740 1800
Average 00712 -00032 00100 -00100 -00524 -02624 -02920
Var 02879 03971 06164 12216 16133 26647 45166
n 25 25 25 25 25 25 25
sqrt(varn) 0107 0126 0157 0221 0254 0326 0425
Z score 0664 -0025 0064 -0045 -0206 -0804 -0687
P-value 025 049 047 048 042 021 025
SD 0537 0630 0785 1105 1270 1632 2125
Min -1680 -1890 -1980 -3480 -3600 -3740 -4560
Max 1140 1050 1780 2400 2740 2590 3550
Average -00151 -00058 01167 -00253 00518 00553 00973
Var 03934 06098 10455 14099 17290 22702 26855
n 45 45 45 45 45 45 45
sqrt(varn) 0094 0116 0152 0177 0196 0225 0244
Z score -0162 -0050 0765 -0143 0264 0246 0398
P-value 044 048 022 044 040 040 035
SD 0627 0781 1022 1187 1315 1507 1639
Min -2020 -1640 -1840 -3270 -2550 -3270 -3360
Max 1350 1930 2250 2260 2700 3280 3800
At 5 level of significance
Bullish
Engulfing0039
Bullish
Hammer0176 0334
Piercing Lines 0107
Bullish Doji
Star-0077
Holding period
Shooting Star 0554 0635
Bearish
Engulfing0115
Bullish
Candlestick
Descriptive
Statistics
Holding
Periods
Holding period With RSI
Filter
Hanging Man 0582 0656
Dark-Cloud
Cover0297
Holding periodBearish
Candlestick
Patterns
Descriptive
Statistics
Holding
Periods
Average
Holding periodWith RSI
Filter
ID 100068
97
Appendix 8 Descriptive statistics of the eight candle pattern analysis for USDZAR
1 Day 2 Days 3 Days 4 Days 5 Days 7 Days 10 Days 1 Day 2 Days 3 Days 4 Days 5 Days 7 Days 10 DaysAverage 00612 00633 00436 00500 00405 00355 00221 00640 00753 00492 00552 00488 00499 00218
Var 00051 00115 00404 00311 00371 00634 01094 00061 00145 00606 00420 00478 00830 01432
n 123 123 123 123 123 123 123 71 71 71 71 71 71 71
sqrt(varn) 0006 0010 0018 0016 0017 0023 0030 0009 0014 0029 0024 0026 0034 0045
Z score 9486 6547 2408 3143 2333 1564 0742 6891 5276 1682 2272 1879 1459 0486
P-value 000 000 001 000 001 006 023 000 000 005 001 003 007 031
SD 0072 0107 0201 0176 0193 0252 0331 008 012 025 020 022 029 038
Min -0017 -0193 -1491 -0776 -0771 -1411 -1956 -0016 -0193 -1491 -0776 -0771 -1411 -1956
Max 0386 0591 0756 0701 0711 1041 1245 0386 0591 0756 0701 0711 1041 1245
Average -00173 00100 02250 01815 01525 01356 01625
Var 00008 00060 00300 00186 00015 00310 00630
n 2 2 2 2 2 2 2
sqrt(varn) 0020 0055 0123 0097 0027 0124 0178
Z score -0878 0182 1837 1881 5545 1090 0915
P-value 081 043 003 003 000 014 018
SD 003 008 017 014 004 018 025
Min -0037 -0045 0103 0085 0125 0011 -0015
Max 0002 0065 0348 0278 0180 0260 0340
Average 00629 00639 00647 01014 01293 01668 01766 00650 00596 00633 00707 00639 00715 00689
Var 00029 00130 00261 02831 05460 08072 08148 00035 00181 00321 00364 00561 00624 00686
n 282 282 282 282 282 282 282 129 129 129 129 129 129 129
sqrt(varn) 0003 0007 0010 0032 0044 0054 0054 0005 0012 0016 0017 0021 0022 0023
Z score 19658 9415 6726 3200 2939 3118 3286 12478 5039 4010 4212 3064 3252 2987
P-value 000 000 000 000 000 000 000 000 000 000 000 000 000 000
SD 0054 0114 0161 0532 0739 0898 0903 0059 0134 0179 0191 0237 0250 0262
Min -0040 -0290 -0601 -0610 -1325 -1310 -1175 -0040 -0290 -0395 -0610 -1325 -1310 -1175
Max 0363 0930 1380 8521 8523 8531 8531 0363 0930 1380 1285 1390 1480 1033
Average 00006 00056 00022 00018 -00057 -00049 00112
Var 00085 00214 00259 00296 00422 00481 00671
n 129 129 129 129 129 129 129
sqrt(varn) 0008 0013 0014 0015 0018 0019 0023
Z score 0070 0435 0155 0118 -0315 -0255 0489
P-value 047 033 044 045 062 060 031
SD 009 015 016 017 021 022 026
Min -0419 -0541 -0538 -0708 -1298 -1078 -1248
Max 0440 0762 0590 0610 0408 0650 0780
1 Day 2 Days 3 Days 4 Days 5 Days 7 Days 10 Days 1 Day 2 Days 3 Days 4 Days 5 Days 7 Days 10 DaysAverage 00810 00799 00903 00956 01014 00867 00925 00467 00517 00632 00622 00693 00713 00956
Var 00328 00205 00284 00330 00525 00750 00827 00012 00124 00213 00191 00221 00396 00595
n 85 85 85 85 85 85 85 41 41 41 41 41 41 41
sqrt(varn) 0020 0016 0018 0020 0025 0030 0031 0005 0017 0023 0022 0023 0031 0038
Z score 4123 5140 4944 4852 4078 2919 2965 8579 2970 2772 2882 2983 2296 2511
P-value 100 100 100 100 100 100 100 100 100 100 100 100 099 099
SD 0181 0143 0168 0182 0229 0274 0288 003 011 015 014 015 020 024
Min -0025 -0162 -0339 -0222 -0270 -0242 -0361 0000 -0120 -0172 -0222 -0270 -0190 -0301
Max 1590 0875 0870 1030 1510 1920 1120 0153 0590 0683 0510 0520 0670 0640
Average NA NA NA NA NA NA NA
Var NA NA NA NA NA NA NA
n NA NA NA NA NA NA NA
sqrt(varn) NA NA NA NA NA NA NA
Z score NA NA NA NA NA NA NA
P-value NA NA NA NA NA NA NA
SD NA NA NA NA NA NA NA
Min NA NA NA NA NA NA NA
Max NA NA NA NA NA NA NA
Average -00288 -00236 -00082 -00125 -00316 00166 00188
Var 00080 00105 00121 00150 00173 00147 00475
n 17 17 17 17 17 17 17
sqrt(varn) 0022 0025 0027 0030 0032 0029 0053
Z score -1331 -0949 -0307 -0420 -0993 0564 0356
P-value 009 017 038 034 016 029 036
SD 0089 0103 0110 0122 0131 0121 0218
Min -0210 -0230 -0208 -0290 -0243 -0195 -0452
Max 0163 0120 0136 0226 0216 0263 0603
Average -00025 00433 00371 00491 00388 00854 01325
Var 00075 00125 00157 00230 00331 00721 01151
n 26 26 26 26 26 26 26
sqrt(varn) 0017 0022 0025 0030 0036 0053 0067
Z score -0145 1973 1509 1651 1089 1622 1991
P-value 044 098 093 095 086 095 098
SD 0087 0112 0125 0152 0182 0268 0339
Min -0246 -0116 -0120 -0182 -0193 -0243 -0323
Max 0213 0323 0343 0443 0613 0963 1143
At 5 level of significance
Bullish
Engulfing0055
Bullish
Hammer0090 0066
Piercing Lines NA
Bullish Doji
Star-0010
Holding period
Shooting Star 0109 0066
Bearish
Engulfing0002
Bullish
Candlestick
Descriptive
Statistics
Holding
Periods
Holding period With RSI
Filter
Hanging Man 0045 0052
Dark-Cloud
Cover0121
Holding periodBearish
Candlestick
Patterns
Descriptive
Statistics
Holding
Periods
Average
Holding periodWith RSI
Filter
ID 100068
Abstract
Japanese candlestick charts were first introduced to the Western world in 1989
by Steve Nison No one in the West got to know about the Japanese technical
analysis before the first edition of his textbook and no charting packages
included them either prior to the first edition Japanese candlestick patterns have
become very popular since then Japanese candlestick patterns are technical
trading rules that are used to predict price directions based on the relationship
between opening high low and closing prices Currently many market
participants are implementing Japanese candle patterns as part of their robust
trading systems This research examines the profitability of four bullish and four
bearish Japanese candlestick reversal patterns in seven foreign exchange
currencies which represent both advanced and emerging foreign currency
markets These currencies include AUDUSD USDCAD EURUSD GBPUSD
USDINR USDJPY and USDZAR The sample covers a 12-year span of 3129
observations The statistical z score test is used to test the statistical significance
of the returns at 5 level for seven holding periods The RSI is used with three
candle patterns to further filter the results The findings show strong evidence of
some profitable candlestick reversal patterns in foreign currency markets
ID 100068
Acknowledgments
I take this opportunity to thank all the people who have helped me understand
and obtain the necessary information to conduct and complete this research
I would like to thank Dr Elango Rengasamy my supervisor for encouraging me
and providing ongoing support from day one till the submission date I would also
like to thank Jordan Kotick a technical analyst at Barclays London for providing
me with useful literature reviews and Ali Al Abdouli Learning and Development
Specialist ndash E-learning Solutions at Emirates who helped me understand excel
functions Finally I would like to thank BUiD librarians for assisting me with all my
requirements that I needed throughout the period of my research
ID 100068
1
Table of Contents
Chapter 1 Introduction helliphelliphelliphelliphelliphelliphelliphelliphelliphelliphelliphelliphelliphelliphelliphelliphelliphelliphelliphelliphelliphelliphelliphelliphellip 3
11 Rational of the Research helliphelliphelliphelliphelliphelliphelliphelliphelliphelliphelliphelliphelliphelliphelliphelliphelliphelliphelliphellip 5
12 Research Problems helliphelliphelliphelliphelliphelliphelliphelliphelliphelliphelliphelliphelliphelliphelliphelliphelliphelliphelliphelliphelliphellip 6
13 Objectives of the Research helliphelliphelliphelliphelliphelliphelliphelliphelliphelliphelliphelliphelliphelliphelliphelliphelliphellip 7
14 Null Hypothesis helliphelliphelliphelliphelliphelliphelliphelliphelliphelliphelliphelliphelliphelliphelliphelliphelliphelliphelliphelliphelliphelliphelliphellip 7
15 Limitations of the Research helliphelliphelliphelliphelliphelliphelliphelliphelliphelliphelliphelliphelliphelliphelliphelliphelliphellip 8
Chapter 2 Efficient Market Hypothesis (EMH) helliphelliphelliphelliphelliphelliphelliphelliphelliphelliphelliphelliphelliphelliphellip 10
Chapter 3 Fundamental Analysis Vs Technical Analysis helliphelliphelliphelliphelliphelliphelliphelliphellip 15
31 Subjective Technical Analysis Vs Objective Technical Analysis helliphellip 20
Chapter 4 Literature Review helliphelliphelliphelliphelliphelliphelliphelliphelliphelliphelliphelliphelliphelliphelliphelliphelliphelliphelliphelliphelliphelliphellip 23
41 Explanation of Terms and Concepts helliphelliphelliphelliphelliphelliphelliphelliphelliphelliphelliphelliphelliphellip 24
42 Survey of Literature Reviews helliphelliphelliphelliphelliphelliphelliphelliphelliphelliphelliphelliphelliphelliphelliphelliphellip 25
43 Summary Comments and Criticism helliphelliphelliphelliphelliphelliphelliphelliphelliphelliphelliphelliphelliphellip 37
Chapter 5 Introduction in Technical Trading Ruleshelliphelliphelliphelliphelliphelliphelliphelliphelliphelliphelliphellip 44
Chapter 6 Methodology helliphelliphelliphelliphelliphelliphelliphelliphelliphelliphelliphelliphelliphelliphelliphelliphelliphelliphelliphelliphelliphelliphelliphelliphellip 56
61 Data sample helliphelliphelliphelliphelliphelliphelliphelliphelliphelliphelliphelliphelliphelliphelliphelliphelliphelliphelliphelliphelliphelliphellip 57
62 Analytical tools helliphelliphelliphelliphelliphelliphelliphelliphelliphelliphelliphelliphelliphelliphelliphelliphelliphelliphelliphelliphelliphellip 58
Chapter 7 Discussion of Study Analysis helliphelliphelliphelliphelliphelliphelliphelliphelliphelliphelliphelliphelliphelliphelliphelliphellip 66
Chapter 8 Findings and Recommendations helliphelliphelliphelliphelliphelliphelliphelliphelliphelliphelliphelliphelliphelliphelliphellip 72
Chapter 9 Conclusion helliphelliphelliphelliphelliphelliphelliphelliphelliphelliphelliphelliphelliphelliphelliphelliphelliphelliphelliphelliphelliphelliphelliphelliphellip 77
Bibliography helliphelliphelliphelliphelliphelliphelliphelliphelliphelliphelliphelliphelliphelliphelliphelliphelliphelliphelliphelliphelliphelliphelliphelliphelliphelliphelliphelliphelliphellip 81
Appendices helliphelliphelliphelliphelliphelliphelliphelliphelliphelliphelliphelliphelliphelliphelliphelliphelliphelliphelliphelliphelliphelliphelliphelliphelliphelliphelliphelliphelliphelliphellip 86
Appendix 1 Japanese Candlestick Patterns helliphelliphelliphelliphelliphelliphelliphelliphelliphelliphelliphelliphelliphelliphelliphelliphellip 86
Appendix 2 Descriptive statistics of candle pattern analysis for AUDUSD helliphelliphellip 91
Appendix 3 Descriptive statistics of candle pattern analysis for USDCAD helliphelliphelliphellip 92
Appendix 4 Descriptive statistics candle pattern analysis for EURUSD helliphelliphelliphellip 93
Appendix 5 Descriptive statistics candle pattern analysis for GBPUSD helliphelliphelliphellip 94
ID 100068
2
Appendix 6 Descriptive statistics candle pattern analysis for USDINR helliphelliphelliphelliphellip 95
Appendix 7 Descriptive statistics candle pattern analysis for USDJPY helliphelliphelliphelliphellip 96
Appendix 8 Descriptive statistics candle pattern analysis for USDZAR helliphelliphelliphellip 97
ID 100068
3
Chapter 1
Introduction
ID 100068
4
Chapter 1 Introduction
Foreign exchange markets have been the main target for most of the market
participants to internationally trade invest and hedge foreign currency risk exposure
The uniqueness of this kind of financial market is mainly due to its high liquidity
leverage and geographical and time zone coverage According to an article published
by Bloomberg and based on information released by the Bank for International
Settlements (BIS) in September 2012 foreign currency trading may have reached $5
trillion a day exceeding the highest level reached prior the collapse of Lehman Brothers
in 2008 Though trading fell to approximately $47 trillion a day in October 2012 and
likely to fall further it is still remains the number-one financial market for all market
participants (Worrachate and Goodman 2012) check
The global financial market place has evolved significantly during the last decade
Investment and hedging strategies have changed accordingly Market participants have
been exploring different strategies that would enable them to generate maximum
returns with minimum risk Investment fund managers and risk managers for example
consult fundamental analysis value investing strategy technical analysis and any other
possible tool they could add to their trading-strategies portfolio
There are various tools that market participants use in foreign exchange markets
especially for spot foreign currency trading This is mainly because a large portion of
investment activity in the foreign exchange market is conducted through spot trading
The spot foreign exchange market has been closely examined to look for profitable
opportunities and find the best investment and trading strategies Both fundamental
analysis and technical analysis have been used to predict price movements though they
differ significantly Fundamental analysts study the cause of the price movements
whereas technical analysts examine the effect (Murphy 1999) Recently many
investment managers and individual traders integrate fundamental and technical
ID 100068
5
analysis in their investing and trading strategies which has been found very rewarding
They use fundamental analysis for long-term investment strategies and use technical
analysis for short-term trading activities According to a survey conducted by Taylor and
Allen (1992) 90 per cent of foreign exchange traders in London use price charts as
technical trading rules for short-term trading
Though technical analysis is used widely some academicians and market followers still
believe that returns are not predictable and that technical analysis cannot be used to
forecast prices Although there is a challenge of turning technical analysis into a
science a lot of studies have been conducted to examine the profitability of technical
trading rules statistically in financial markets Considering the information above this
research attempts to examine the profitability of using technical trading rules to predict
price movements of selected foreign currencies These technical rules are called
Japanese candlestick patterns that were originally used by Munehisa Homma who
made a fortune from trading them in the rice market in 1700s (Nison 2001) Details of
different Japanese candlestick trading patterns are discussed later in the research The
next sections include the rational of the research the research problems the objectives
of the research and the null hypotheses followed the limitations of the research
11 Rational of the Research
Foreign exchange markets are one of the main targets for most of the market
participants as they are considered the largest financial markets in the world Market
participants who access foreign exchange market include traders fund managers
pension fund managers banks corporate and other financial institutions Foreign
exchange markets do not only provide trading and investment opportunities but they
also offer risk managers great opportunities to trade as hedging activities that would
enable them to mitigate the foreign exchange risk exposure resulting from uncertainty in
high price volatility This research is important because it can serve different financial
ID 100068
6
institutions and traders for investment and hedging decision making and academicians
who are looking for tested trading results
This research is also important because it examines major foreign exchange currencies
that represent advanced and emerging economies which provide different trading
opportunities especially after the recent financial meltdown that started in 2007
Emerging markets have become one of the main targets for investors as they have
showed potential for high returns when compared with other advanced economies
Despite the fact that emerging markets may still present a high risk of political
uncertainly local infrastructure issues and illiquidity they still provide good opportunities
for outside investors Emerging markets have been experiencing faster economic
growth measured by their GDP though still partially impacted by the slow global
economic growth resulted from the Euro Zone debt crisis and the US fiscal cliff fears
The foreign exchange currencies include five advanced market currencies and two
emerging market currencies against the US dollar the Australian dollar the British
pound the Canadian dollar the Euro the Japanese yen the South African rand and
Indian rupee respectively There are four main reasons to select these currencies 1)
they are highly liquid 2) they are considered trade commodity and hedging currencies
3) they reflect both advanced and emerging foreign markets 4) they represent different
economies and geographical regions and 5) the data period used in the analysis is long
and very recent All these factors together make this research interesting and attractive
12 Research Problems
Based on the traditional finance research on financial market efficiency technical
trading rules cannot be used to beat the markets and generate excess returns It is
considered that financial markets are efficient and their prices consistently and fully
reflect available information (Fama 1970 Samuelson 1995) However there are a lot
of studies that have been conducted to re-test markets efficiency Some empirical
ID 100068
7
researches find that financial markets including foreign exchange markets are efficient
and that technical trading rules cannot be used to forecast future price movements
supporting the weak form of the Efficient Market Hypothesis (EMH)
On the other hand other empirical studies reject the concept of the first form of the
EMH and find that technical trading rules can be profitable indeed These findings of
successful trading rules have been documented empirically using different sample data
of different financial markets across different time periods and in different regions The
findings show that some financial markets have been found informationally inefficient
The foreign exchange market efficiency has also been examined and strong evidence
of profitable technical trading rules has been found
13 Objectives of the Research
The main objectives of the research are as follow
To statistically examine the predictive power of four bullish and four bearish
Japanese candlestick patterns to forecast price movements or returns in seven
selected foreign exchange currencies
To contribute to the literature by providing an additional research in the field of
technical analysis through examining the profitability of Japanese candlestick
patterns and with results that either support or reject the weak form of the EMH
To raise awareness of profitable trading strategies in major commodity and
emerging market foreign currencies that can provide good trading opportunities
for market participants and can help them make investment and hedging
decisions
14 Null Hypothesis
To test the weak form of the EMH and examine the predictive power of technical trading
ID 100068
8
rules of selected Japanese candle reversal patterns in foreign currencies the following
null hypotheses are tested
1 H0 All Japanese candlestick reversal patterns cannot be used to forecast foreign
currency price movements
Ha Japanese candlestick reversal patterns can be used to forecast
foreign currency price movement
2 H0 Foreign exchange markets are efficient
Ha Foreign exchange markets are inefficient
15 Limitations of the Research
There are two main limitations encountered while working on the methodology The first
one is the inability to include USDCNY in the sample as an emerging market foreign
currency this is due to the missing data of high and low rates from the beginning of the
sample period till the end of August 2005 downloaded from Thomson Reuters This
currency has received a lot of attention recently and many market participants have
shown interest in it through diversifying their portfolios emerging markets have shown
promising profitable opportunities especially after the last financial crisis Euro Zone
debt issue and the US fiscal cliff threat However since this research addresses
emerging market foreign currencies as well USDZAR is selected as a replacement for
the Chinese Yuan Many financial institutions especially airlines and logistics firms have
profits or repatriation in USDZAR adding another reason to include it in the sample
The second limitation is the lack of solid knowledge in programming to transform the
subjectivity of different variations of Japanese candlestick patterns into an objective
software or model that would both identify the patterns and test them statistically This
limitation is partially addressed through using excel formulas and statistical tests and
find the identified ones on real charts to ensure the patterns are properly reflected
ID 100068
9
The rest of the research paper is organized as follows Chapter two introduces the
Efficient Market Hypothesis (EMH) in its three forms Chapter three discusses the
difference between fundamental analysis and technical analysis as well as subjective
technical analysis versus objective technical analysis Chapter four includes an
explanation of terms and concepts and a survey of literature reviews followed by a
summary of reviews comments and criticism Chapter five introduces the technical
trading rules of the Japanese candlestick patterns and the Relative Strength Index
(RSI) Chapter six explains the methodology that includes the sample data and the
analytical tools used to test the null hypotheses Chapter seven includes the discussion
of the study analysis Chapter eight summarizes the findings and recommendations and
finally Chapter nine includes the conclusion followed by bibliography and appendices
ID 100068
10
Chapter 2
Efficient Market
Hypothesis (EMH)
ID 100068
11
Chapter 2 Efficient Market Hypothesis (EMH)
Markets with prices that consistently and fully reflect available information are called
efficient This is the building block of the Efficient Market Hypothesis (EMH) that was
brought up by Fama and was further developed by him in 1970 Fama (1970) divides
the EMH into three forms of market efficiencies depending on relevant information that
stock prices adjust to These subsets include the weak form the semi-strong form and
the strong form
The weak form states that future prices cannot be predicted by examining historical
prices and used to generate excess returns Therefore investment strategies and
decisions cannot be made based on technical analysis This means that security prices
do not have any particular pattern and future price movements are subject to
information that is not part of price series Thus security prices follow a random walk
rather than particular historical patterns and that market participants cannot profit from
market inefficiencies
The semi-strong form discusses the ability of stock prices to adjust efficiently to
information that is available to the public such as different announcements of annual
profits and stock splits It states that stock prices adjust to available new information to
the public very fast and objectively Thus market participants cannot earn excess
returns through trading that kind of information This form states that both fundamental
analysis and technical analysis cannot be used to beat the market and make superior
returns
Finally the strong form of the EMH is concerned with certain individuals or groups that
might have monopolistic access to such private information This form implies that stock
prices represent both public and private information Thus market participants will not
be able to use any kind of information to generate excess returns
ID 100068
12
In brief the EMH implies that the reaction of market participants is random Thus
market prices cannot be exploited to consistently generate any excess returns
particularly when accounting for the transaction costs of spreads and commissions
Market participants can be wrong but the markets are always right
Mixed empirical evidence exists in the literature that either support or reject the EMH
Although the EMH is supported by some academicians and market participants it has
also been disputed by many investors and researchers both empirically and
theoretically One of the important studies in the literature is the research conducted by
Lo and Mackinlay (1989) on the Random Walk Theory They examine the theory using
weekly stock returns for the period from 1962 and 1985 The results strongly reject the
Random Walk model for the whole sample
The EMH has started to lose some weight Interestingly even leading proponents of the
theory have started to divert in their belief in the validity of the random walk concept
Burton Malkiel a famous American economist and the author of ldquoA Random Walk Down
Wall Streetrdquo who has been a big supportive of the EMH has recently pointed out that
some emerging markets like China particularly Shanghai and Shenzhen financial
markets have been found inefficient (Malkiel Mei and Yang 2006)
Some EMH proponents still argue that luck is the main reason behind some successful
traders However being the most successful investor of the 20th century ranked among
the worlds wealthiest people Warren Buffett argued against them and stated that the
number of the large part of successful investors among the best money managers just
dispute the argument above Warren Buffet is among other super-investors who have
managed to beat index funds many times More than twenty seven years ago Buffet
mentioned that there were nine investors who invested in different firms they had made
more profits than what index funds did They were able to beat the market by a big
margin and performed very well even when the market was not attractive (Buffett
1984)
ID 100068
13
The latest finical crisis that started in 2007 has also renewed the criticism of the EMH
Jeremy Grantham one of the highly respected financial strategists and investors stated
that the EMH is responsible for the current financial crisis He said that the belief in the
model has made financial leaders underestimate the dangerous implications of asset
bubbles such as the dot-com and housing bubbles as stock prices were not irrational
after all He was quoted that NASDAQ would correct 75 per cent which does not exist in
an efficient market as this would indicate that growing shares have turned more
valuable (Nocera 2009)
The EMH has become controversial as evidence of substantial and lasting inefficiencies
are observed opening the door to direct and indirect criticism of all the three forms The
history of many financial markets records various cases with fund and other investments
mangers showing outstanding performance and being able to beat the market
consistently Though the weak form states stock price movements are random or
trendless given unchanged fundamental information many researchers have found
evidence that stock markets and other financial markets do trend They have also found
that there is an existence of a correlation between trending and length of the time frame
collecting another evidence to reject the weak form of the hypothesis Other studies
have revealed that market participants can make abnormal returns by trading stock
dividend and other announcements including major economic indicators and central
banks interventions in the foreign exchange markets Moreover there are different
financial anomalies that have been found in the markets and have enabled market
investors to generate excess returns These findings clearly reject the second form of
the EMH Similarly the last form of the EMH can be easily challenged one can argue
that the excess return made through insider trading is a good example that simply
disputes the strong form of the EMH
The key debate about making abnormal returns and beating the market ldquoconsistentlyrdquo
by the proponents of the EMH will always be challenged by the strategies that result in
making excess returns from trading technical trading rules dividend announcement and
ID 100068
14
financial anomalies and executing insider trading EMH proponents do not only have to
justify how the above can simply reject the three forms of the EMH but also explain the
rational of such asset bubbles and their subsequent collapse This research addresses
the weak form of the EMH and examines the predictive power of selected Japanese
candle reversal patterns as technical trading rules
ID 100068
15
Chapter 3
Fundamental Analysis (FA)
Vs Technical Analysis (TA)
ID 100068
16
Chapter (3) Fundamental Analysis (FA) Vs Technical
Analysis (TA)
Fundamental analysis and technical analysis are the two main approaches used by
funds and other finance managers to analyse a security value and monitor risk and
return tradeoffs while managing portfolios There has always been a debate on which
approach is superior to the other one and whether they substitute or complement each
other
Fundamental analysts focus on security market price and its true values In order to
invest in a stock or any other financial security fundamental analysts study the
economic factors of supply and demand which affect the price directions In particular
they assess all the factors that can affect the security market price in order to determine
the intrinsic value of that security (Murphy 1999) Fundamentalists look at the book
value and examine financial statements and use price-to-book ratio Earnings are
another key factor that reflects the income power of a stock using the price-earnings
ratio These two ratios are important for many fundamentalists because they show the
deviation of the shares from asset backing of the security The second ratio of price to
earnings shows the deviation of the shares from the earning power of the stock
(Raymond 12) So if the intrinsic value is below the market price this means that the
security is overpriced and should be liquidated However if the intrinsic value is above
the market the price it means that the security is underpriced and it should be added to
the portfolio
On the other hand technical analysts believe that fundamental factors of securities are
discounted and accounted for in the market price itself Technical analysts study the
market action as they believe that prices move in trends and that history patterns in
financial markets repeat themselves They forecast future market prices through
examining short- intermediate- and long-term trend directions price patterns technical
ID 100068
17
oscillators time cycles inter-market analysis and other technical tools (Murphy 1999)
As for the fundamental analysis the technical analysis has also attracted a lot of
investors practitioners and academicians The recognition of historical price
movements to forecast future directions goes back to a number of editorials written by
Charles Dow published between 1900 and 1902 in Wall Street Journal These
publications have encouraged further research and revisit of existing literature to assess
the profitability of technical analysis and test the validity of the EMH
Nowadays technical analysis is widely used by many big institutional investors and
other market participants in their trading and investing strategies The power of
mathematics of artificial intelligence as well as price pattern identification software has
been growing so drastically (Raymond 2012) The globalization and the integration of
different financial markets worldwide along with the advanced technology have enabled
technical analysts to adjust their trading strategies very rapidly when there are major
movements These speedy tools are not available for the fundamentalists
One could argue against each analysis performance Many big fund managers are
fundamentalists such as Warren Buffet John Templeton Peter Lynch and Liu Yang
They follow value investing and fundamental analysis in their investment decisions
Warren Buffett avoided IT shares prior the IT bubble at the time investors were laughing
at him At that time he acknowledged he should get a ldquoDrdquo grade for his portfolio
performance Another credit that goes for the value investing approach is when John
Templeton went for short positions on IT IPO when other traders were celebrating their
big returns In these cases both fundamental and value investing analysis won at the
end However a lot of fundamental analysts were caught by surprise in the sudden
collapse in some stock markets In 2011 Hong Kong stock market collapsed when the
market PE was not expensive at all at that time That is one of the situations when the
fundamentalists fell in the value trap (Raymond 2012) This brings the importance of
technical analysis in spotting trend changes and potential reversals well ahead
ID 100068
18
A lot of studies have been conducted to examine the ability of fundamental and
technical analyses to assist funds and risk mangers to make correct decisions
Evidence of the profitability of technical analysis is explored in details in the literature
review section Other studies have gone further by examining the ability of integrating
both analyses to optimize and further fine-tune investment and risk management
strategies Bettman Sault and Welch (2006) propose an equity valuation model which
integrates both analysis Their sample includes US listed firms from January 1983 to
December 2002 The results confirm that each analysis performs well when applied
separately However the authors find that the integration of fundamental and technical
analysis produces superior results Thus the finding confirms the nature of both
analyses as complements rather than substitutes Cooper (2011) also provides a simple
framework that integrates both technical and fundamental analyses His paper is
expository in nature and explains the concepts without any mathematical evidence It
addresses the challenges of integrating technical and fundamental analyses in an
optimum manner It opens the door for practitioners and academicians to use the ideas
in their testing models and explore the integration of both analyses in the future
The literature shows evidence of a growing success of using technical and fundamental
analyses as complements in the trading strategy and investment decisions In fact both
analyses forecasting the market attempt to resolve the same issue of determining future
price directions The fundamental analyst examines the cause of the market direction
whereas the technical analyst studies the effect At the start of major market moves
usually fundamental analysts are not able to explain what the market tends to do This
is the market stage when the two approaches fail to agree with each other However at
some stage later the two approaches do come back into sync but not early enough for
the trader to react Another explanation for the discrepancies between the two is that
market price movements tend to lead fundamentals Since the known fundamentals
have already been accounted for in the market prices are currently responding to
unfamiliar fundamentals History records that some of the major bull and bear markets
have started with little or zero perceived change in the fundamentals At the time these
ID 100068
19
changes became familiar the fresh trend is already in place With the passage of time
technical analysts can develop growing confidence in their price chart signals and they
become among the minority who can spot a change in trend directions They know at
some stage that the reasons for that trend reversal will become known to others
Most analysts categorize themselves as either chartists or fundamentalists but in real-
life situations there is an overlap A lot of fundamental analysts have some basics
about chart and trend analysis Similarly many chartists are aware of some important
fundamentals The main challenge is that sometimes price charts and fundamentals
conflict with each other (Murphy 1999)
Last but not least if a trader has a choice between the two approaches the choice
would logically be the technical analysis By default technical analysis includes the
fundamentals If the fundamentals are accounted for in the market price it makes less
sense to study those fundamentals In other words chart analysis has become a
shortcut of fundamental or value investing analysis Given the explanation above it
makes sense that one would depend on technical analysis in trading or investment
decisions It is doubtful that anyone can depend solely on fundamentals ignoring the
timing advantage of the technical analysis (Murphy 1999) The explored literature in the
literature review chapter represents different studies that examine the predictive power
of using technical analysis in financial markets with a focus on foreign currency
markets
Technical analysis is further divided into subjective technical analysis and objective
technical analysis introduced in the next section
ID 100068
20
31 Subjective Analysis Vs Objective Analysis
Technical analysis can be classified into two categories subjective and objective
technical analysis (TA) Subjective TA refers to methods and patterns of analysis that
cannot be clearly defined This leads to the conclusion that technical analysts are open
to personal views and interpretations when they use their technical trading rules This
means that it is possible for different analysts using the same method of same data
sets to have different findings Thus subjective trading rules cannot be tested and they
are exempted from empirical examinations Examples of subjective TA can include
Gann Lines trend channels price chart patterns and divergences (Aronson 2007)
On the other hand objective TA is clearly defined When an objective trading rule is
applied on a market data set its signals are very clear and there is no room for
ambiguity This helps simulating technical methods on different historical data and
identifying their performance level accuracy In other words it allows back testing Thus
any objective method can be repeatable it enables technical analysts and
academicians to re-test previous findings of profitable technical trading rules and
perhaps refute current statistical evidence Examples of objective TA include moving
average crosses (Aronson 2007)
In a nutshell one can distinguish between subjective and objective TA through using
the programmability criterion that is a method is considered objective only if it can be
implemented in a computer programme that can generate clear market positions Any
other technical trading methods that cannot be programmed become subjective by
default Subjective TA can be eliminated either through a shift into objective methods or
rejection (Aronson 2007)
Aronson (2007) classifies TA into four main categories 1) subjective TA 2) objective TA
with unidentified statistical significance 3) objective TA that does not have statistical
ID 100068
21
significance and 3) objective TA of statistical significance The first category refers to
analysis methods that cannot be implemented into a programmed algorithm and be
back tested whereas the other three categories fall under objective methods To
explain further the second category includes the methods that have been tested but
their findings have not been examined for statistical significance The third category is
considered useless even though the values have been back tested and evaluated with
statistical methods they have been found of no value whether individually or when used
in combination with other technical trading rules Most of objective technical trading
rules fall under this category This is due to the complexity and randomness of the
financial markets that make it difficult to predict The fourth and the last category
includes the objective methods that can be back tested and produce statistically and
economically significant results Some individual objective methods are useful however
since financial markets are very complex and random rules will have more value if they
are combined with other trading rules (Aronson 2007)
It has been very challenging not only to move TA to a science which is transforming
subjective TA into objective TA but also to convince analysts who have been very
proud of their technical trading rules of the importance of the statistical significance
tests and results A good example in the literature that attempts to transform subjective
TA into objective TA is done by Chang and Osler (1999) They objectify the price
pattern of head and shoulders after facing a lot of problems Among the main challenge
faced is setting up the pattern parameters as in reality the pattern does depart from the
ideal one The authors decide to define objective rules that could discriminate valid from
invalid head-and-shoulder patterns These objective rules include percentage filters
known as an Alexander filter similar to a zigzag indicator that can identify peaks and
troughs They further develop innovative approaches that could qualify the pattern such
as vertical and horizontal symmetry and the time taken to form the pattern (Aronson
2007)
ID 100068
22
There are a lot of valid attempts that have been observed in the literature The literature
review section provides various studies that attempt to test different trading rules
statistically
ID 100068
23
Chapter 4
Literature Review
ID 100068
24
Chapter (4) Literature Review
This chapter is divided into two main parts explanations of terms and concepts found
later in the literature reviews and a survey of literature reviews
41 Explanation of Terms and Concepts
Bootstrap is a method that derives a sampling distribution of the test statistic
through re-sampling with substitution from an original sample (Aronson 2007)
Data mining is the process of searching for patterns models and predictive rules
in large data (Aronson 2007)
Data mining bias is the expected variation obtained by different experiments
between the observed performance of the best observed performance and its
expected performance (Aronson 2007)
Head and shoulder and double top price patterns are pictures appear on price
charts that can be used to predict price movements
Japanese candlestick patterns are formations that are derived from open high
low and close prices they can be of one-day or more that have reversal and
continuation predictive power
Monte Carlo simulation is a common method used to solve mathematical issues
through random sampling in order to test the statistical significance of back-
tested data (Aronson 2007)
NOVA is a statistical test that tests the difference in mean returns between
multiple groups
ID 100068
25
42 Survey of Literature Reviews
Over the past three decades researchers have provided good evidence that the foreign
exchange markets are inefficient disputing the Random Walk Theory and the EMH
There is trustworthy evidence that simple technical rules or a combination or trading
rules applied by a wide range of market participants have proven to have predictive
power of security prices Thus the reality that simple trading rules generate abnormal
large returns in financial markets indicates a serious challenge to the traditional market
hypotheses To test the predictive power of technical analysis over different time frames
and data samples researchers have examined various financial markets of stocks
foreign exchange bonds and commodities Some findings show strong evidence of
profitable technical trading rules whereas others show poor or no evidence
This section explores different studies that examine the profitability of various technical
trading rules in different financial markets More attention is given to the technical
trading strategies of Japanese candlestick patterns and samples covering foreign
currency markets where possible The literature reviews focus primarily on the
outcomes of applying technical analysis and its predictive value of future price
movements The literature survey is divided into four main streams the first part covers
the studies done in the stock and foreign exchange markets that show evidence of
profitable technical trading rules the second part covers the researches that use
technical analysis in presence of central bank interventions The third part reviews
studies that apply Japanese candlestick trading rules The fourth part includes the
studies that find poor or no evidence of profitable technical trading rules Questionnaire
surveys on the application of technical analysis in trading decisions are also included in
the literature Each part reviews the literature chronologically from the oldest to the most
recent ones to reflect the development that has been made since early 1980s
Examining the profitability of technical analysis in financial markets has started very
early Longworth (1981) uses CADUSD spot and forward rates from July 1970 to
ID 100068
26
October 1976 He finds that forward rates can be predicted using spot reference rates
concluding that markets are inefficient
Brock Lakonishok and LeBaron (1992) examine two simple common trading rules
moving averages and range breakouts in the DJIA from 1897 to 1986 Having applied a
standard statistical analysis of the bootstrap method the results reveal strong evidence
of the technical trading strategies applied The buy signals are found to constantly
produce higher returns than sell signals Also the returns following buy signals are less
volatile compared with the returns generated by sell signals
Levich and Thomas (1994) examine the impact of technical trading strategies in the
foreign exchange market by using futures contracts of a 15-year time span Their data
sample covers the years from 1976 to 1990 After applying bootstrap methodology and
a statistical approach thousands of new exchange rate series are randomly generated
each tested seriesrsquo profitability is examined using a technical analysis approach The
empirical results of profit significance in both original series and randomly generated
series are compared The findings reveal that technical trading systems are significantly
profitable Although some profits declined during the five years of 1986-90 on an
average the profiles are found still positive and significant in some periods Thus these
results provide evidence of profitability and statistical evidence of how technical trading
systems are profitable in the foreign exchange market
Gencay (1997) also finds strong evidence of profitable simple technical trading rules in
daily Dow Jones Industrial Average Index Having examined linear and nonlinear
predictability of stock market return using historical buy and sell signals of the moving
average rules the result shows evidence of nonlinear predictability in the US stock
markets supporting the results found by Brock Lakonishok and LeBaron (1992)
Osler (2000) examines the technical trading rules of support and resistance levels
provided by six foreign exchange trading companies The data sample covers the
ID 100068
27
period from 1996 to 1998 The statistical test of the bootstrap technique is used The
results show that signals are very successful in forecasting trend interruptions or
reversals The findings also show that some companies are more accurate in
indentifying turning points in exchange rate trends Overall the prediction in USDJPY
and GBPUSD rates are more accurate than the prediction in DMUSD Also it is found
that the predictive power of the support-resistance levels tend to last five working days
at least once the levels are published to the public
Osker (2003) examines clustering of foreign currency stop-loss orders as well as take-
profit orders as they are considered main orders when placing trading orders His data
covers 9655 orders with a total of more than $55 billion from August 1 1999 to April
11 2000 His sample covers three foreign currencies USDJPY EURUSD and
GBPUSD He uses the crowded orders to provide an explanation for two common
predictions of technical analysis First trends are likely to reverse directions at support
and resistance areas Second trends are likely to move faster after prices penetrate
such levels He finds that take-profit orders gather at round numbers explaining the first
profit forecasting whereas stop-loss orders concentrate heavily just after round
numbers this explains the reason behind the second forecasting These findings are
obtained based on the closing rates of both orders placed at the famous dealing bank of
National Westminster The order clustering phenomenon is due to different common
reasons round numbers are easy to remember and to place orders at as they are the
first to come to anyonersquos mind The final results show that technical trading rules can be
profitable for market participants
Omrane and Oppens (2004) use other technical trading strategies They examine the
presence of price chart patterns in intra-day EURUSD using both close and high-low
prices They search for 12 chart patterns and study them based on the two criteria of
profitability and predictability Using the statistical methodology of Monte Carlo
simulation to calculate resultsrsquo statistical significance the authors find evidence of chart
ID 100068
28
patterns in the foreign exchange market The results reveal that more than 50 per cent
of the charts that are identified has high predictability
Similarly Shik and Chong (2007) also find technical trading rules profitable in foreign
exchange markets They apply moving averages and Relative Strength Index (RSI)
using daily rates of six foreign currencies They find that the profitability of using moving
averages is obvious even though currencies belong to various economic areas
In their paper Lento and Gradojevic (2007) examine the profitability of technical trading
rules by assessing their ability to outperform the trading strategy of buy and hold The
sample covers SampPTSX 300 Index NASDAQ Composite Index Dow Jones Industrial
Average Index and CADUSD spot exchange rate from May 1995 to December 1994
The trading strategies include moving average cross rules Bollinger Bands filter rules
and breakout rules of trading ranges After accounting for the transaction costs excess
returns are generated by moving average cross-over rules and trading range break-out
rules for the SampPTSX 300 Index NASDAQ Composite Index and the CADUSD spot
exchange rate Filter rules also earn excess returns when applied on the CADUSD spot
exchange rate The bootstrap methodology is used to determine the statistical
significance of the results The profitability of the technical trading rules is further
enhanced with a combined signal approach The results show that a combined single
strategy does outperform the buy-and-hold trading strategy even after accounting for
transaction costs
Park and Scott (2007) re-visit the historical testing measures of the profitability of
technical analysis in the empirical literature both early (1960ndash1987) and modern (1988ndash
2004) Early studies show that technical trading rules are profitable in foreign exchange
markets and futures markets only but not in the stock markets Modern studies
however reveal that technical trading rules constantly generate economic profits in
different markets It is worth to mention that although strong evidence of the profitability
of technical analysis is found in early studies many empirical researches faced a lot of
ID 100068
29
problems in their tests such as data snooping selection of trading strategies and
estimation of transaction cost Early studies are characterized with different limitations in
their tests application of very few trading strategies ignorance of trading rules risk and
statistical significance of returns absence of parameter optimization out-of-sample
verification and less attention to data snooping problems On the other hand modern
studies show an overall improvement earlier limitations encountered in the early
studies have been reduced the number of trading rules used for testing has been
increased risk of trading strategies has been given high attention both conventional
statistical tests and sophisticated bootstrap methods have been applied with an
emphasis on trading rule optimization as well as out-of-sample verification Also other
empirical factors such as order flows clustering interventions of central banks and
unstable market inefficiencies have been introduced as an explanation of technical
trading returns Final results of the study reveal that out of total modern studies of 95
56 studies find technical analysis profitable in trading 20 show negative results and 19
find mixed results
Though difficult to explain how technical trading strategies of price patterns might be
profitable Friesen Weller and Dunham (2007) provide a modal that shows evidence of
how such price pattern trading rules can be profitable in the US stock markets The data
covers a six-year period from January 1999 to December 2005 The researchers
highlight the significance of confirmation bias Traders who obtain data and trade on
that information are likely to bias their reading of subsequent information towards the
direction of their initial view This generates autocorrelations and price patterns that can
forecast future prices like the head-and-shoulders and double-top price patterns Also
the researchers find that their model can predict positive autocorrelation with sequential
price The prediction is tested and the results are found statistically and economically
significant
Stephen (2008) examines the profitability of using technical models of moving averages
and momentum that add up to 1024 technical trading rules in DMUSD He finds that all
ID 100068
30
the trading rules are profitable The profitability is mainly because of the exploitation of
exchange rate trends the result stay valid even with sub-periods trading and declining
profit during late 1980s The results of the best 25 performing models in-the-sample
period from 1973 to 1999 are almost as good as those generated in the out-of-sample
period of 2000-2004 in the majority of the cases It is worth to mention that the risk of
making losses when applying each of these models is almost zero adding another plus
to the profitability of technical analysis in trading foreign exchange currencies
Profitability of technical trading rules is examined in combination with other factors as
well Krishnan and Menon (2009) study the influence of foreign currencies technical
indicators and time frames on trading profits The research covers the period from
September 2006 to October 2008 with 1400 observations in the sample and two
durations one year and three months The currency pairs include EURUSD
GBPUSD USDCHF and USDJPY The time frames cover five minutes 15 minutes
30 minutes one hour four hours and one day The technical indicators used are five
leading and five lagging The findings reveal that using technical analysis in foreign
currency trading activities is profitable all of the currencies technical indicators and
time frames play significant roles in generating profits in foreign exchange spot markets
EURUSD is found the most profitable and the least risky The findings also show that
short ndashterm trading is riskier and of low liquidity compared to the long-term trading
Moreover the authors find that using a combination of technical indicators in a trading
system generate remarkable profits
Researchers keep exploring various trading rules scientifically Cekirdekci and Iliev
(2010) test different set ups as well as exit strategies for trading opening range
breakouts of 30-minute time frame The research examines a technical trading system
using and back tests of around 250 stocks from various industry sectors from April
2005 to April 2010 The initial tested set ups include buy and sell filters inside bar
simple and exponential moving averages a volume indicator per cent trailing exist
overbought and oversold areas of Relative Strength Index and ATR Ratchet The
ID 100068
31
results show that when combining buy and sell signals with other indicators such as
the volume indicator the opening range is a powerful model it generates significant
returns when traded with the correct stock
Similarly Holmberg Loumlnnbark and Lundstroumlm (2012) test the profitability of the trading
strategy of the ldquoOpen Range Breakout (ORB) but in the US crude oil futures prices from
March 1983 to January 2011 The ORB is a trading rule that signals entry and exit
rules once the price moves beyond predefined boundaries Using the joint distribution of
low high open and close prices over a period of time the researchers find that their
ORB trading rule significantly generates high returns
Interestingly some researchers have conducted different types of studies to have an
indication of how widely technical analysis is applied in the financial field Using a
questionnaire survey on behalf of the Bank of England in November 1988 Taylor and
Helen (1992) find that around 90 per cent depends on technical analysis in forming their
views at different time horizons The results show that technical analysis is applied
mainly for the shorter time frames for entry and exit timings Moreover technical
analysis tools are found to be the best tools for trading currencies The survey results
also reveal that fundamentals are reliable for the long term picture whereas others rely
on both fundamental and technical analyses in taking trading decisions
Shifting to the examination of technical analysis in presence of central banks
interventions both early and modern researches show the importance of such
interventions when used with trading rules in the foreign exchange markets Silber
(1994) is among the first researchers who examine the profitability of simple trading
strategies in foreign exchange markets in presence of central banksrsquo interventions His
sample covers the German mark Swiss franc Japanese yen British pound and
Canadian dollar He uses simple moving averages as trading rules He finds evidence
that technical rules can be valuable in markets where governments are found big
players The results show that government interventions provide speculators with an
ID 100068
32
opportunity to generate abnormal returns by applying simple technical trading
strategies
There are other researchers who also examine the impact of central bank intervention
on the predictability of trading rules in foreign exchange markets LeBaron (1998)
reviews some evidence that shows predictive value over future foreign exchange prices
He analyses the profitability of simple trading rules in relation with central bank activity
using intervention information from the Fed His forecasts are assessed over one day
and one week periods His sample uses weekly and daily foreign exchange rates of
Deusche mark (DM) and Japanese yen (JP) from January 1979 to December 1992 The
interest rate series used is one week Euro rates The trading rules compare the current
price with a moving average of historical prices He finds that the predictability of
exchange rates diminishes during the periods when the Fed is inactive This leads to
the conclusion that there is a positive correlation between the Fed intervention in the
market and the profitability of the trading rules used to predict foreign exchange rates
Using a genetic programming for the Duetuche mark Japanese yen British pound and
Swiss franc and US official intervention Neely and Weller (2000) show that
interventions could be considered as trading signals themselves They use simple
moving averages as trading rules covering a sample from 1975 through 1998 In fact
they donrsquot support earlier observations that find intervention activities lead to profit in the
foreign exchange markets Their findings rather show that the profitability of technical
trading rules is a result of strong and constant trends in exchange rates which
intervention is intended to turn around
Moreover analyzing daily exchange rates of USDDEM as well as daily USD and DEM
overnight Euro rates from January 1979 to July 1994 Saacke (2002) provides further
evidence of the unusual profitability of applying technical trading strategies on days
when the Fed and Bundesbank interventions take place The central banks are found to
gain returns when they intervene in foreign exchange markets and with the usefulness
ID 100068
33
of technical analysis Intervention returns and trading rule profitability are evaluated
during horizons and post interventions Exchange rates are found to react in the
opposite direction of central banksrsquo intentions in the short term but in line with their
targets in the long term The researchers find that the trading rules of using moving
averages are considerably profitable on the days when the central banks interfere The
findings also reveal that trading rules returns are still high on days in which interventions
did not take place or on preceding days This means that central banksrsquo interventions
are not the only cause of trading rule returns Shik and Chong (2007) also find out that
the technical rules correlate positively with the interventions of the central banks
There is little attention given to the Japanese candlestick patterns in the literature even
though they were widely used in rice trading activities in Japan and have been found
very powerful when combined with other technical trading rules (Nison 2003) Recent
studies on the Japanese candle patterns are found Goo Chen and Chang (2007)
examine the profitability of Japanese candlestick patterns using daily data Their sample
includes 25 shares that are partially listed in Taiwan Top 50 Tracker Fund and Taiwan
Mid-Cap 100 Tracker Fund for 12 years from 1997 to 2006 and with 2580
observations for each stock The main objective of the study is to indentify profitable
candle patterns as well as profitable holding periods that would generate abnormal
returns for investors They use six bullish single-line patterns and seven bullish candle
pasterns for ten holding periods using a stop-loss strategy as well The first group
includes the long white candle the white Marubozu the closing white Marubozu the
opening white Marubozu the dragon doji and the paper umbrella the second group
includes the hammer the bullish engulfing the piercing lines the bullish harami the
three inside up the three outside up and the tweezers bottom The t test is used to
statistically test the profitability of the patterns NOVA and Duncanrsquos various range tests
are also applied to compare the profitability of the patterns across the ten holding
periods In general the results show that there is evidence of some profitable candle
patterns at different holding periods The researchers find that the bullish reversal
patterns are the most profitable patterns and that the profitability of various candle
ID 100068
34
patterns depends on the holding periods Another finding is that the long holding
periods are appropriate for the two candle categories with few exceptions The results
also show that the -5 stop-loss strategy does improve the performance of the
candlestick trading rules
Lana Zhanga and Xiongb (2011) develops a model that visualizes Japanese
candlestick patterns in Chinese stock markets The model transforms the prices of
open close high and low into ldquofuzzyrdquo candle charts The sample includes selected
stocks listed in four marketsrdquo SSE A Share SSE B Share Shenzhen A share and
Shenzhen B sharerdquo from January 2000 to December 2010 The results show that the
model is able to identify the reversal patterns and that it can be used to indentify early
stock reversal signals through ldquosymptoms sequencerdquo The researchers will further
enhance the model with additional fuzzy variables to reflect candlestick lines such as
the position of body and shadows to fine-tune the prediction results
In addition to the previous studies Haibin Zhao and Wang (2012) examine the
performance of the Japanese candlestick patterns in predicting equity returns using
both in-sample and out-of-the-sample forecasts Monthly data of main global financial
markets are used these markets include ldquoFTSE100 DAX CAC40 in Europe
NIKKEI225 (NK) HangSeng (HS) and Strait Times (ST) in Asiardquo Also monthly data of
Standard and Poorrsquos 500 (SampP500) is collected to find out if the candle patterns have
reached the US markets as well The researchers find that the Japanese candlestick
patterns do have predictive power in both in-sample and out-of-sample forecasts In all
the cases the Japanese trading rules are found superior to the simple buy-and-hold
Also it is found that there is important information that spreads out from the US stock
market to the other financial markets
Lu Shiu and Liu (2012) investigate the profitability of candle patterns that are composed
of two lines through buying on bullish (bearish) patterns and holding the trades till
bearish (bullish) patterns take place Their sample includes daily prices of stocks listed
ID 100068
35
in the Taiwan Top 50 Tracker Fund from 29 October 2002 to end of 2008 The
researchers study three bearish reversal patterns and three bullish reversal patterns
These are the bearish engulfing the harami the dark-cloud cover the piercing lines the
bullish engulfing and the bullish harami respectively The bootstrap methodology is
used The results show that the three bullish patterns are found generally more
profitable than the beaish patterns The returns of the three bullish patterns are found
statistically significant in the Taiwan stock market
On the other hand some researches find conflicting results or even variations within
results that are not in line with the findings above The results vary from lacking of
evidence of the profitability to declining profits when simple trading rules are applied
Levich and Thomas (1993) note weak evidence that the profitability of their rules
declines in their final subsample period 1986 to 1990 Lee and Mathur (1996) apply
moving averages and channel trading systems on ten currency pairs in foreign
exchange spot market Their sample includes ldquoAUDJPY GBPJPY CADJPY
DEMGBP DEMITL DEMJPY DEMCHF CHFGBP and CHFJPYrdquo They find both
trading systems are not profitable
LeBaron (2002) finds that the abnormal returns resulting from applying a 150-day
moving average from June 1973 to August 2002 decrease during the 1990s His
sample covers the British pound German mark and Japanese yen He assumes that
data snooping or economic issues could be the main reason for earlier positive results
Applying simple moving average trading rules on longer time periods Olson (2004) also
finds different results on the profitability of the moving average trading rules He re-
customizes moving average rules in a five-year period from 1971 to 1995 He then tests
the trading rule in 5-year out-of-sample period He finds that trading rule returns decline
over time after 1970s to approximately zero by the 1990s This suggests that the
inefficiencies of markets that are reported in earlier studies might have been temporary
Furthermore Lento and Gradojevic( 2007) find that individual trading rules do not
ID 100068
36
generate any profits above the buy-and-hold strategy when the technical rules are
applied in the DJIA
Pukthuanthong-Le and Thomas (2008) re-assess the ability of technical trading rules to
statistically and economically generate significant returns Their data covers liquid
currency futures from 1975 to 2006 The results show that the profitability of trend
following decline for the major currencies of British pound Japanese yen German mark
Euro Canadian dollar Swiss franc and Australian dollar Moreover the researchers
find that the related cross exchange rates of the major currencies also decline in the mid
of 1990s
Poor evidence of profitable candlestick strategies is also found in the literature
Brashears and Elam (1993) explore the profitably of the Japanese candlestick trading
and their ability ot forecast reversals in the cotton futures market from 1973 to
1990Their sample includes 13 candle reversal patterns The bullish patterns include the
hammer the engulfing pattern the morning star the doji star the piercing lines and the
tweezers bottom The bearish patterns include the bearish engulfing the upside gap
two crows the hanging man the dark-cloud cover the shooting star the evening star
and the tweezers top These patterns are programmed individually using MetaStock
programme The final results show that no definite evidence of predictive power for the
Japanese candle patterns in cotton futures markets The researchers recommend that
additional studies should be conducted to re-examine the predictive power of the
Japanese candle trading rules in the future
Marshall Young and Rose (2005) study the candle patterns in actively traded stocks
listed in the DJIA The sample includes data from 1992 to 2002 the starting year is
selected to make sure that market participants had basic background of the different
Japanese candle trading rules and they already started using them at that time in their
trading strategies The sample includes 28 candle patterns that fall under four main
categories bullish single lines bullish reversal patterns bearish single lines and bearish
ID 100068
37
reversal patterns To test the results they use the bootstrap methodology to generate
random prices of open high low and close Contrary to the researchersrsquo expectations
the final results show no evidence of profitable candle patterns in DJIA thus supporting
the weak form of the EMH
Moreover Young and Marshall (2007) test the predictive power of the Japanese
candlesticks in the US stock market particularly the DJIA Index from 1992 to 2002 The
authors use the t test and the bootstrapping methodology to test the results statistically
The Japanese candle patterns are technical trading rules that have been used in Japan
for centuries The use of these candle patterns has been growing among market
participants all over the world because they used to be successful with the rice trading
in Japan The authors use 28 candle patterns that vary from one- to three-candle
patterns These patterns include the long white the white the Marubozu the hammer
the bullish harami the three outside up the gravestone doji the shooting star the dark-
cloud cover and the tweezers top The findings show that candle trading rules are
statistically not profitable None of the single and multiple candlestick patterns bullish or
bearish give timing signals The authors recommend to use candlestick trading rules in
combination with other market timing tools
The section below summarizes the different findings in the literature above along with
comments and criticism
43 Summary Comments and Criticism
From the previous literature the studies have reported mixed results about the success
of technical trading in foreign exchange and stock markets Abnormal returns are
observed in many studies while other studies report less success of technical trading
rules
ID 100068
38
Longworth (1981) uses CADUSD spot and forward rates and finds that forward rates
can be predicted using spot rates concluding that markets are not efficient Brock
Lakonishok and LeBaron (1992) examine moving averages and range breakouts and
find that buy signals constantly produce higher returns than sell signals Levich and
Thomas (1994) find technical trading rules are significantly profitable on contracts of 15-
year currency futures Later on Gencay (1997) also find strong evidence of profitable
simple technical trading rules in daily DJIA supporting the previous results Osler
(2000) finds the technical trading rules of support and resistance levels are powerful
predictive indicators Clustering of foreign currency stop-loss orders and take-profit
orders in major foreign currencies are clear indicators of profitable technical trading
rules (Osker 2003) Omrane and Oppens (2004) find evidence of profitable chart
patterns that are tested statistically
More recent studies also provide strong evidence of profitable simple moving average
trading rules Shik and Chong (2007) find the profitable simple moving average rules
when moving averages and Relative Strength Index (RSI) are applied on six foreign
currencies Lento and Gradojevic (2007) further enhance technical trading rules through
a combined signal approach The results show that the strategy does outperform the
buy-and-hold trading strategy Park and Scott (2007) re-visit the historical testing
measures of the profitability of technical analysis in the empirical literature and find the
majority of the studies find technical analysis profitable Similar to the results found by
Omrane and Oppens (2004) in the foreign exchange market Friesen Weller and
Dunham (2007) provide a modal that shows evidence of how price pattern trading rules
can be profitable in the US stock markets
Moreover Stephen (2008) finds moving averages and momentum in German Mark
profitable Results of Krishnan and Menon (2009) reveal that all currencies technical
indicators and time frames play significant roles in generating profits in foreign
exchange spot markets Cekirdekci and Iliev (2010) find trading opening range
breakouts when combining buy and sell signals and other indicators a powerful model
ID 100068
39
This is in line with the results found by the earlier researchers (Lento and Gradojevic
2007 Krishnan and Menon 2009) In very recent studies Holmberg Loumlnnbark and
Lundstroumlm (2012) find ldquoOpen Range Breakout (ORB) in the US crude oil futures prices
significantly generates high returns
Other studies both old and modern examine the central banksrsquo interventions along with
trading strategies in the foreign exchange markets The researchers find that simple
trading rules are considerably profitable on the days when the central banks interfere
Silber (1994) is among the first researchers who find evidence that technical rules can
be valuable in markets where governments are found big players LeBaron (1998)
reviews some evidence of profitable simple trading rules in presence of the Feb central
bank activity He finds that the predictability of exchange rates diminishes during the
periods when the Fed is inactive This leads to the conclusion that there is a positive
correlation between the Fed intervention and the profitability of the technical trading
rules Neely and Weller (2000) show that interventions could be considered as trading
signals themselves Moreover Saacke (2002) provides further evidence of the unusual
profitability of applying technical trading strategies on days when the Fed and
Bundesbank interventions take place Shik and Chong (2007) also find that the
technical rules correlate positively with the interventions of the central banks
Evidence of profitable Japanese candle patterns is also found in the literature Goo
Chen and Chang (2007) find evidence of some profitable candle patterns at different
holding periods with bullish reversal patterns as the most profitable patterns The model
developed by Lana Zhanga and Xiongb (2011) also show that it is able to identify the
reversal patterns and that it can be used to indentify early stock reversal signals through
ldquosymptoms sequencerdquo Haibin Zhao and Wang (2012) find in all the cases the
Japanese trading rules are found superior to the simple buy-and-hold Lu Shiu and Liu
(2012) find evidence of three profitable bullish patterns in the Taiwan stock market
ID 100068
40
On the other hand some researches find conflicting results or even variations within
results that are not in line with the findings above The results vary from lacking
evidence of profitable technical trading rules to declining profits when simple trading
rules are applied Levich and Thomas (1993) note weak evidence in their final
subsample period 1986 to 1990 Lee and Mathur (1996) apply moving averages and
channel trading systems on ten foreign currencies and find both trading systems are
not profitable LeBaron (2002) finds that abnormal returns resulting from applying a 150-
day moving average decrease during the 1990s Olson (2004) also finds different
results on the profitability of the moving average trading rules He finds that trading rule
returns decline over time after 1970s to approximately zero by the 1990s Moreover
Lento and Gradojevic( 2007) find that individual trading rules do not generate any profits
above the buy-and-hold strategy in the DJIA In more recent studies Pukthuanthong-Le
and Thomas (2008) find that the profitability of trend following decline in major
currencies
Evidence of profitable Japanese candle patterns is also found poor Brashears and
Elam (1993) find indefinite evidence of predictive power for the Japanese candle
patterns in cotton futures markets Marshall Young and Rose (2005) find no evidence
of profitable candle patterns in DJIA Similarly Young and Marshall (2007) find no
evidence Japanese candle patterns in the DJIA
Though the majority of the findings in the literature supports the profitability of technical
analysis in foreign exchange markets as well as other financial markets the weak
evidence found in some studies need to be examined closely
In order to support or reject the theory of the Random Walk and Efficient Market
Hypothesis the debate on the mixed results can be objectively made The weak
evidence of profitable trading rules found by some researchers since 1980s (Brashears
and Elam 1993 Levich and Thomas 1993 Lee and Mathur 1996 LeBaron 2002
Olson 2004 Marshall Young and Rose 2005 Lento and Gradojevic 2007 and Young
ID 100068
41
and Marshall (2007) is opposed by strong evidence found by others using large
samples and targeting different markets in different regions (Longworth 1981 Brock
Lakonishok and LeBaron 1992 Gencay 1997 Osler 2000 Saacke 2002 Osker
2003 Goo Chen and Chang 2007 Shik and Chong 2007 Lento and Gradojevic 2007
Park and Scott 2007 Stephen 2008 Cekirdekci and Iliev 2010 Lana Zhanga and
Xiongb 2011 Haibin Zhao and Wang 2012 Loumlnnbark and Lundstroumlm 2012 and Lu
Shiu and Liu 2012)
Most of the trading rules tested in the literature are very simple such as moving
averages and range breakouts Moving averages can be easily modeled and tested
however it is a lagging indicator and generates false signals when used in range
trading trends or periods Also the poor evidence of profitable candle trading rules
could be due to the samples taken for the periods prior 2000 in which the knowledge of
these trading rules might not be as solid as during 2000s and onwards The
inconsistency in using statistical tests and the issue of data snooping may lead to
conflicts in results These are some of the factors that could explain the weak evidence
in the literature The strong evidence and the conclusion of inefficient markets in other
studies are challenged by the methodologies and standard statistical analysis used to
examine the profitability of technical analysis The different bubbles and major bullish
trends that usually lead to excess price volatility periods and the ignorance of good
testing procedures that address data snooping and other issues could be some of the
main reasons the findings are positively biased This is supported by the findings found
by Park and Scott (2007) Most empirical researches are subject to various issues in
their testing processes such as data snooping different selections of trading rules in-
and out-of-sample data search technologies and difficulties in estimating risk and
transaction costs
Furthermore the impact of central bank activities on the returns is assumed to be
reflected in the market price Technical analysts should not consider them as a major
source of the predictive power of some technical trading rules as found by the
ID 100068
42
researchers above Intervention activities are similar to other major economic data that
affect exchange rates and alert traders to take positions once prices are close to
support and resistance levels However technical analysis is known for discounting all
the known and unknown information
Regarding the application of trading rules financial markets are too complex to be
predicted by a single trading rule A trading system that is a combination of different
trading rules is found to work better that a single technical tool It is always
recommended to use a combination of good technical indicators as filters in which the
majority will agree on clear signals The findings about the Japanese candlestick
patterns are just a simple message that single technical tools fail most of the time They
should rather be used in combination with other powerful technical tools that can best
work during the underlying trend
After consulting the mixed results it is very important to consider important key factors
that would have a high impact on the overall research findings in regard to the
profitability of technical trading rules in financial markets The reasons for the existence
of these abnormal returns or weak evidence may not be easy to interpret and justify
However there are certain obvious factors that play major roles in reaching final results
of any study that need a careful examination and testing These factors include 1) the
possibility of changing trading rules using different time frames in line with the major
underlying trend 2) the consistency of profitable trading rules 3) the liquidity of the
financial markets as it would be more incentive for market participants to trade away
inefficiencies 3) the bullish and the bearish cycles of the markets 4) the efficiency of
trading systems that are made of powerful technical trading indicators suitable to the
underlying market trends 5) clear understanding of the trading rules of lagging and
leading indicators 6) understating different objectives of major players including
activities of central banksrsquo interventions 7) the usage of sophisticated non-linear
models 8) the usage of good statistical testing procedures addressing data snooping
ID 100068
43
and transactions costs and 9) the importance of having good parameters in place that
would turn technical analysis into a science
This research contributes to the literature by testing the predictive power of the
Japanese candlestick reversal patterns in the foreign currency market The findings are
compared to all the findings of profitable technical trading rules in general and to the
results pertaining to the studies conducted on Japanese candlestick patterns
ID 100068
44
Chapter 5
Introduction to Technical
Trading Rules
ID 100068
45
Chapter 5 Introduction to the Technical Trading Rules
The technical trading rules of the Japanese candlesticks are very popular The
Japanese have applied this charting along with its technical rules for centuries Its
popularity arises from its method to display security data for chart analysis and the use
of certain candlestick combinations that reflect the psychology of the market
participants The data of the Japanese candlesticks uses the same data of standard bar
charts open high low and close However the visual effect of the candlestick charts
provide a much better picture of the market that is easily displayed interpreted and
analyzed The price actions look like candles with wicks or shadows That is the reason
why they are called candlesticks In its simplest form a white body means that the close
is higher than the open whereas the black body means the close is lower than the high
There are different shapes for the Japanese candlesticks They also come in different
combinations based on the relationship between open high low and close prices
There are various patterns of Japanese candlesticks a Japanese candlestick pattern
may consist of one candlestick or a combination of two or more but never more than
five Most of the patterns can be used to warn of reversal levels in the markets These
patterns can be bearish bullish or continuation Generally reversal patterns of bullish
implications have their inverse patterns which have bearish meaning The third category
includes a few patterns that fall under continuation patterns Similar to the reversal
patterns continuation patterns have bullish patterns and their opposite bearish patterns
in relation to the previous trend that takes place prior to the consolidation phase
Examples of bullish patterns that warn a reversal of the trend from a downtrend to an
uptrend includes the piercing lines the morning star the bullish Doji Star the bullish
engulfing the hammer the bullish harami and the kicking patterns Examples of bearish
patterns that warn a trend reversal from an uptrend to a downtrend includes the dark-
cloud cover the evening star the hanging man the bearish engulfing the shooting star
the abandoned baby and the bearish harami The continuation patterns include the
ID 100068
46
rising and the falling three methods the separating lines the downside gap three
methods and the three-line strike (Murphy 1999) Appendix 1 shows the different
Japanese candlestick patterns Moreover the Japanese candlestick patterns can be
used jointly with other western technical tools such as oscillators and other technical
indicators which can create a powerful synergy of techniques
Below is a brief description of each of the eight Japanese candlestick reversal patterns
used in the analysis These patterns follow the descriptions provided by Nison (2001)
The description of the candle patterns are followed by an explanation of the common
technical indicator of the Relative Strength Index (RSI) that is used along with three
candle patterns as a filter
Four bullish and four bearish candle patterns are used in the analysis of this research
The bullish patterns include the bullish engulfing the piercing lines the bullish hammer
and the bullish doji star whereas the bearish patterns include the bearish engulfing the
dark-cloud cover the hanging man and the shooting star The following order of the
patternsrsquo descriptions is based on the similarity and the inverse relationship of the
patterns for easy understanding A snap shot of each candle pattern that are indentified
in the analysis using excel formulas discussed under methodology is provided
The bullish engulfing pattern is a major reversal signal that consists of two real bodies of
opposite colours The market is in a downtrend then a long white candle closes higher
and engulfs the previous black candle This shows that the bulls have taken over from
the bears and that the buying pressure becomes stronger than the selling pressure The
bearish engulfing pattern is just the opposite The market is in an uptrend then the last
white candle is wrapped by a black long body signaling a top reversal This means that
the selling pressure has overwhelmed the buying pressure There are three criteria for
the engulfing pattern 1) the market should be clearly in an uptrend or downtrend even
if it is a short-term trend 2) there are two candlesticks that form the pattern in which the
second body must wrap the previous real body and 3) the colour of the second real
ID 100068
47
body should be the opposite of the first real body colour (Nison 2001) Figures (1) and
(2) show the two patterns that are identified in USDINR and EURUSD pair currencies
Figure (1) The bullish engulfing pattern in USDINR
Figure (2) The bearish engulfing pattern in EURUSD
ID 100068
48
The piercing lines are a two-day bullish pattern that signals a bottom reversal after a
downtrend The first candlestick is a black body and the second day is a long white
body The second day opens with a downside gap below the low of the previous day
and closes higher and above the mid-point of the first black body The greater the
penetration of the white bodies into the previous black body the greater the chance for
bottom reversal An ideal pattern requires a second day penetration of more than 50
of the prior black real body The psychology behind this pattern is that the market is in a
downtrend reflected in the first bearish black body On the next day the market opens
lower with a gap reflecting more bearish sentiment Suddenly the bulls take over and
manage to close the market not only at previous close but higher into the previous body
mid-point or even slightly higher The bears will have their second thoughts about their
short positions The longs will see that the new lows could not hold and probably it is
time to go for long positions There are four main factors that indentify the importance
of the piercing lines 1) the degree of the second day penetration within the first black
body the greater the penetration degree the greater the likelihood for a bottom
reversal 2) the second day opens below a main support level but fails and closes
higher with bears being unable to control the market and 3) heavy volume on the
opening of the second day an initial selling off is followed by buying blow offs (Nison
2001) Figure (3) represents the piercing lines pattern that is identified in AUDUSD pair
currency
ID 100068
49
Figure (3) The piercing Lines pattern in AUDUSD
The dark-cloud cover is the opposite formation of the piercing lines pattern It is a two-
day bearish pattern that signals a top reversal after an uptrend The first day is a long
white real body The second day opens above the high of the previous day but closes
near the low of the day within the previous day white body The greater degree of
penetration into the previous day body the more likely a top reversal will take place
Some technical analysts require more than 50 penetration of the second day close to
the previous white real body The psychology behind this pattern is that the bulls are in
full control when the second day open with an upside gap however the bulls lose
control and no continuation of the rally takes place Then the market closes near the
close and the bulls will have a second thought about their long positions Similar to the
piercing lines pattern there are important factors that intensify the significance of the
dark-cloud cover pattern but in the opposite direction (Nison 2001) Figure (4)
represents the pattern that is identified in EURUSD pair currency
ID 100068
50
Figure (4) The Dark-cover cloud in EURUSD
The hammer is the third bullish candlestick pattern it is a one-day pattern The body of
the hammer can be white or black but it is more bullish if the body is white because it
closes at the high The hammer has a long lower shadow and closes near the high of
the session The psychology behind this pattern is that the market sells off sharply
during the session but then bounces back at the close near to the small bodyrsquos high
The hammer may have no upper shadow or a very small one enforcing bullish
implications This clearly shows that the bears have lost control and they are now
having second thoughts The main characteristic of the bullish hammer is that the lower
shadow should be at least twice or three times the height of the body (Nison 2001)
Figure (5) represents the bullish hammer pattern that is identified in GBPUSD pair
currency
ID 100068
51
Figure (5) The bullish hammer pattern in GBPUSD with the RSI filter
The hanging man looks like a hammer however it forms after an uptrend rather than a
decline Since the long lower shadow has a bullish implication it is best to wait for a
bearish confirmation with this pattern A lower opening below the body of the hanging
man on the second day and a lower close will be a good confirmation of a top reversal
The psychology behind this is that when the market closes on the next day below the
body of the hanging man the bulls who bought on the open or close of the hanging man
day will be left hanging with a bad position and are now more nervous for potential big
losses Thus they may decide to cut their losses and liquidate adding more selling
pressure The key factors for a reversal hanging man pattern are a preceding uptrend
and a next day close below the hanging man close (Nison 2001) Figure (6) represents
the pattern that is identified in USDJPY pair currency
ID 100068
52
Figure (6) The hanging man pattern in USDJPY with the RSI filter
The fourth and the last bearish candle pattern used in the sample analysis is the
shooting star It is a one-day pattern with a small real body and a long upper shadow
The small body can be white or black This pattern looks like a shooting star with its tail
glowing in the sky An ideal shooting star day opens with an upside gap but this gap is
not always important This pattern indicates that the market is rejecting a higher high A
close on the next day below the shooting star close can give a good confirmation of
potential top reversal (Nison 2001) Figure (7) represents the pattern that is identified in
USDCAD pair currency
ID 100068
53
Figure (7) The shooting star pattern in USDCAD with RSI filter
The fourth and the last bullish pattern in the analysis is the doji star A star is usually a
small real body white or black that gaps away from the prior real body If the star is a
doji rather than a small real body it is named a doji star or a doji line that warns a near
reversal Doji candlesticks can have shadows of different lengths The doji candlestick
used in the analysis is a one-day pattern in which the open price and the close price are
equal The star or doji star can be part of other reversal patterns such as the morning
star the evening and the harami Doji candlesticks can have shadows of different
lengths Generally the doji lines show indecision between the market participants The
likelihood of a reversal with a formation of a doji increases if 1) the following
candlesticks confirm a potential reversal 2) the market is in overbought or oversold
situations and 3) the market doesnrsquot form doji so often (Nison 2001) There are different
versions of doji candlesticks such as long legged doji gravestone doji and dragonfly
doji The doji that is used in the analysis has equal open and close prices regardless the
shadows length and signal for bottom reversal (Nison 2001) Figure (8) represents the
doji star pattern that is identified in USDZAR pair currency
ID 100068
54
Figure (8) The doji star pattern in USDZAR
In addition to price patterns resistance-support levels and Japanese candlestick
patterns technical analysts use a lot of technical indicators that be used in trending
markets non-trending markets and gauging sentiments There are technical indicators
or oscillators used in the non-trending markets that can still be used in trending markets
to get further insights into the market momentum Among these indicators is the
Relative Strength Index (RSI) The RSI and the other oscillators when used in
combination with price charts and Japanese candle patterns become extremely
valuable They provide traders and technical analysts further insight especially into the
short-term market extremes that are known as overbought or oversold conditions
The Relative Strength Index (RSI) is considered one of the most popular technical
indicators used actively by traders It basically measures the internal strength of a
security It focuses on price momentum specifically the changes in closing prices It
ranges between zero and a hundred It usually tops and bottoms above and below 70
and 30 readings respectively These are overbought and oversold conditions (Colby
2003) A crossing above 30 indicates a buying signal whereas a crossing below 70
ID 100068
55
indicates a selling signal Divergences between the price action and the indicator
movements also provide warning signals of potential bottom and top reversals In
addition to the signals of the oversold-overbought condition the crosses signals of the
midpoint are also used by many traders Since oscillators are best used in non-trending
markets and there is a risk of misusing the indicator the 50 reading is used as a
midpoint value to divide the horizontal range into two halves The 50 midpoint is also
used as buy and sell signals The time span used is 14 days by default and it will be
used in the analysis The RSI formula is also introduced later in the methodology
section Figures (5-7) show the three patterns that are identified using the excel formula
and the RSI filter
ID 100068
56
Chapter 6
Methodology
ID 100068
57
Chapter 6 Methodology
This research attempts to re-examine the weak form of the EMH through the application
of Japanese candlestick price patterns as technical trading rules in foreign exchange
markets It tests two null hypotheses that assume 1) all the Japanese candlestick
reversal patterns cannot be used to predict returns in foreign exchange markets and
that 2) foreign exchange markets are efficient The two alternative hypotheses state that
1) Japanese candlestick reversal patterns can be used to predict market movements
and that 2) foreign exchange markets are inefficient The one-tailed z score test is used
to test the hypotheses at 5 level of significance The following sections include the
sample data and the analytical tools used in the analysis followed by a discussion of
data analysis and a summary of findings and recommendations
61 Sample Data
The sample data includes seven foreign currencies from both advanced and emerging
financial markets These currencies include the Australian dollar (AUDUSD) British
pound (GBPUSD) Canadian dollar (USDCAD) Euro dollar (EURUSD) Japanese yen
(USDJPY) Indian rupee (USDINR) and South African rand (ZAR) The sample covers
a 12-year span which is from 1st January 2001 to 31st December 2012 These
currencies reflect good financial environment to test the technical trading rules of the
Japanese candlestick patterns in which most of market participants and academicians
are interested in All the data analysis uses daily OHLC bid rates open (O) high (H)
low (L) and close (C) obtained from the financial data provider Thomas Reuters The
total observations in the sample are 3129
ID 100068
58
62 Analytical Tools
This section explains the technical trading and statistical tools used in the analysis to
test the proposed null hypotheses It discusses the Japanese candle patterns used
challenges faced filters applied holding periods to calculate returns (losses) followed
by statistical tests to help deciding whether to reject or accept the null hypothesis
There are eight Japanese candlestick reversal patterns used in the analysis four bullish
patterns and four bearish patterns The eight candle patterns are tested for each of the
seven foreign currencies
The bullish patterns include the hammer the piercing lines the doji star and the bullish
engulfing whereas the bearish patterns include the hanging man the dark-cloud cover
the shooting star and bearish engulfing The reason of selecting these patterns is that
they are very popular and most of them are considered major reversal patterns Another
reason is the ability to transform these candlestick patterns and practice them in a
scientific manner through using excel formulas that can describe and indentify the
patterns and enable back testing
The main challenge encountered in this research is the application a scientific method
that would address the subjectivity of using the Japanese candlestick patterns as
technical trading rules Moving technical analysis to a science through transforming
subjective candle patterns into objectively defined testable patterns has always been a
challenge There are not so many mathematical definitions of the Japanese
candlesticks in the literature Some of the excel formulas that are used in the analysis
are obtained from other resources These formulas are further amended to address the
subjectivity of different variations of the candle patterns used in the analysis which are
in line with Nisonrsquos (2001) The excel formulas (3) (4) and (7) mentioned later in this
section are obtained from a paper written by Fadhel (2010) with an amendment made
to formula (7) to differentiate the shooting star pattern that shows at tops from the
ID 100068
59
inverted hammer pattern that shows at bottoms an additional condition of a next day
lower close is added This is in line with Nisonrsquos (2001) Formulas (5) and (6) are
obtained from Tech Excel Charts and Programming Blog posted by BxCapricorn (2009)
an additional condition of a lower close and a higher close on the next day is also added
to differentiate the hanging man pattern and the hammer respectively from other
similar patterns that show in opposite directions These are also in line with Nisonrsquos
(2001)
Formulas (1) to (8) describe the eight Japanese candlestick patterns the bullish
engulfing the bearish engulfing the piecing lines the dark-cloud cover the hammer
the hanging man the shooting star and the bullish doji against (1) (2) (3) (4) (5)
(6) (7) and (8) respectively Using IF and AND excel functions the following
formulas represent four columns Column A represents Date Column B represents
Open Column C represents High Column D represents Low and Column E
represents Close The formulas start on line or row 5 that represents today line 4
represents yesterday line 3 represents the day before yesterday and line 6
represents tomorrow Number one refers to the patterns identified by the formulas
=IF(AND((B4gtE4)(E5gtB5)(E5gtB4)(E4gtB5)((E5-B5)gt(B4-E4))(C5gtC4) (1)
(D5ltD4))1)
=IF(AND((E4gtB4)(B5gtE5)((B5-E5)gt(E4-B4))(E4ltB5)(B4gtE5))1) (2)
=IF(AND((E4ltB4)(((E4+B4)2)lt=E5)(B5ltE5)(B5ltE5)(E5ltB4)(B5ltD4) (3)
((E5-B5)(0001+ (C5-D5))gt06))1)
=IF(AND(E4gtB4B5gtC4B5gtE5B4ltB5E4gtE5E4ltB5B4ltE5 (4)
E5lt=(05(C4+D4)))1)
=IF(AND((C4-D4)gt(3(B4-E4))((E4-D4)(0001+C4-D4)gt06) (5)
ID 100068
60
((B4-D4)(0001+C4-D4)gt06)(E5gtE4))1)
=IF(AND((C4-D4)gt=(2(ABS(B4-E4)))((E4-D4)(0001+C4-D4)gt=075) (6)
((B4-D4)(0001+C4-D4)gt=0075)(E5ltE4))1)
=IF(AND(B4ltD4+(05(C4-D4))E4lt(D4+05(C4-D4))OR(B4ltD4+09 (7)
(C4-D4)E4ltD4+09(C4-D4))(E5ltE4))1)
=IF(B4=E41 (8)
Furthermore the 14-day Relative Strength Index (RSI) is used to distinguish the three
similar patterns that appear at different turning points these similar patterns include the
bullish hammer the hanging man and the shooting star In addition to the signals of the
oversold-overbought condition the crosses of the midpoint signals are also used by
many traders Since oscillators are best used in non-trending markets and there is a risk
of misusing the indicator the 50 reading is used as a midpoint value to divide the
horizontal range into two halves The 50 midpoint is used as buy and sell signals For
example crossing 50 to the upside is considered a buying signal whereas crossing 50
to the downside is considered a selling signal The 50 midpoint crosses concept is used
with the three candle patterns as a filter to distinguish them If the hanging man and the
shooting start patterns form above 50 it is assumed that there is a high possibility that
the trend will reverse from up to down Similarly if the bullish hammer pattern forms
below the 50 reading there is a high possibility that the current trend will reverse from
down to up In other words a reading above 50 indicates potential for a bearish
reversal and a reading below 50 indicates potential for a bullish reversal
Having used the RSI filter for the three candle patterns the results are considered only
if the average returns are statistically significant at 5 level for at least five consecutive
holding periods Formula (9) shows how the RSI is calculated as provided by Cably
(2003)
ID 100068
61
R 119894
= (C 119905
C 119905+2
C 119905+3
C 119905+4
C 119905+5
C 119905+7
C 119905+10
) minus O 119905
RSI = 100 minus 100
(1 + 119877119878)
(9)
Where
RS = the ratio of the exponentially smoothed moving average for n-period gains divided
by the absolute value of the exponentially smoothed moving average for n-period
losses
After identifying the eight bullish and bearish candle patterns and filtering them through
using the RSI overbought and oversold conditions the returns are computed for seven
holding periods one day two days three days four days five days seven days and
ten days For the bullish patterns the returns represent the difference between the open
price following the pattern day and close price of the seven holding periods as in
formula (10) For the bearish patterns the returns represent the difference between the
open price following the pattern day and close price of the seven holding periods as in
formula (11) The returns for the holding periods that fall beyond the 31 December 2012
are excluded
(10)
Where
Ri= the return of the seven holding periods
Ct = day 1 close following the pattern day
Ct+1 = day 2 close
Ct+2 = day 3 close
Ct+3 = day 4 close
Ct+4 = day 5 close
Ct+6 = day 7 close
Ct+9 = day 10 close
Ot = day 1 open
ID 100068
62
R 119894
= O 119905
minus (C 119905
C 119905+2
C 119905+3
C 119905+4
C 119905+5
C 119905+7
C 119905+10
)
119911 =X minus1198830
1198782
n
(11)
Where
Ri= the return of the seven holding periods
Ot = day 1 open following the pattern day
Ct = day 1 close
Ct+1 = day 2 close
Ct+2 = day 3 close
Ct+3 = day 4 close
Ct+4 = day 5 close
Ct+6 = day 7 close
Ct+9 = day 10 close
Having identified the patterns and computed the returns for the seven holding periods
and following the methodology used by Ramond and Leuthold (1982) and Anderson
(2003) the one-tailed z score test is used for each holding period of the pattern The
two null hypotheses are tested at 5 level of significance that is 95 confidence level
Also the same methodology including the holding periods follows Fadhelrsquos (2010)
supervised by Anderson (2010) the same author above Formula (12) represents the z
score statistical test that accounts for the gross profit variance from each trade as well
as the number of total trades It allows a comparison of results from various trading
rules and time periods To arrive to the final results using the z score test the number of
times the candle pattern is identified (n) in the formula below has to be above 30 This
formula that considers all the factors above does also provide a method to assess the
weak form efficiency of the price series used in the sample analysis (Peterson and
Leuthold 1982)
(12)
Where
X = actual Mean Gross Profits (MGP) from a given strategy
ID 100068
63
Xo = expected MGP (zero in this case)
S2 = variance of Gross Profits per trade
n = number of trades it should be above 30
Unlike securities trading the foreign exchange trading has no guaranteed return or
dividend payment Therefore the equilibrium expected return is considered zero
Trading foreign exchange currencies is similar to trading futures contracts it is a two-
party zero sum game where a price change causes one party to profit and the other
party to lose Thus since foreign exchange trading is a zero-sum game zero is
considered the rational benchmark as expected mean gross profits Moreover the
selection for gross profits instead of the net is due to the absence of a standard
transaction cost as commissions differ significantly depending on time as well as trader
and firm types Readers can deduct suitable commission charges to have some value
for mean net returns These adjustments should not impact the variance of profits
(Peterson and Leuthold 1982)
The p-value is calculated to also help decide whether the pattern identified is due to
chance or its probability of being formed by chance is really too small To calculate the
p-value using the z test statistic excel formula (13) is used If the value is equal or
below the significance level of 005 this means that the probability of the pattern was
formed by chance is very small at 95 level of confidence and the null hypothesis will
be rejected However if the p-value is above the 005 significance level it means that
the probability the pattern was created by chance is high and the null hypothesis will be
accepted
P-value = 1-NORMSDIST(ABS(z)) (13)
Where
ABS = the absolute value of z
NORMSDIST = standard normal distribution of z
ID 100068
64
Figures (9-12) show the number of times the four bullish and the four bearish candle
patterns appear in the final results Figures (10) and (12) show the number of times the
bullish hammer the bearish hanging man and shooting star patterns appear after using
the RSI filter
Figure (9) A comparison of the number of times the four bullish candle patterns appear
in the seven foreign currencies
Figure (10) A comparison of the number of times the four bullish candle patterns
appear in the seven foreign currencies after using the RSI filter
0
20
40
60
80
100
120
140
AUD CAD EUR GBP INR JPY ZAR
Bullish Candle Patterns
Bullish Hammer
Piercing Lines
Bullish Doji Star
Bullish Englulfing
Average
0
20
40
60
80
100
120
140
AUD CAD EUR GBP INR JPY ZAR
Bullish Candle Patterns - with RSI
Bullish Hammer
Piercing Lines
Bullish Doji Star
Bullish Englulfing
Average
ID 100068
65
Figure (11) A comparison of the number of times the four bearish candle patterns
appear in the seven foreign currencies
Figure (12) A comparison of the number of times the four bearish candle patterns in the
seven foreign currencies after using the RSI filter
0
100
200
300
400
500
600
AUD CAD EUR GBP INR JPY ZAR
Bearish Candle Patterns
Hanging Man
Dark-Cloud Cover
Shooting Star
Bearish Engulfing
Average
0
50
100
150
200
250
300
AUD CAD EUR GBP INR JPY ZAR
Bearish Candle Patterns - with RSI
Hanging Man
Dark-Cloud Cover
Shooting Star
Bearish Engulfing
Average
ID 100068
66
Chapter 7
Discussion of Study
Analysis
ID 100068
67
Chapter 7 Discussion of Study Analysis
Having tested the profitability of selected Japanese candlestick reversal patterns in
foreign exchange markets this chapter discusses in details the results of analyzing
candle reversal patterns in seven foreign currencies for 12-year data of 3129
observations The following seven sections discuss the results for each currency pair
After examining the bullish patterns in AUDUSD currency pair it is found that the
bullish hammer pattern is identified 77 times at less than 5 level of significance for all
the holding periods When the results are filtered using the RSI the pattern is identified
40 times in which all are significant at 5 level except of the seven-day holding period
The bullish doji star is identified 28 times throughout the sample at 5 significance
level The bullish engulfing pattern is found less profitable which is not statistically
significant either The piercing lines pattern appears very rare as it shows only 7 times
Similar to the bullish engulfing result the average returns of this pattern are found
statistically insignificant Shifting to the bearish patterns the hanging man performs best
compared with the other three patterns The pattern is indentified 89 times in which the
average returns are significant at 5 level of significance When filtered by the RSI that
is more than 50 the pattern appears 57 times with average returns that are statistically
significant Although the shooting star pattern is identified 148 times the average
returns are found statistically insignificant However when filtered for the RSI the
average returns are found statistically significant for the one-day two-day three-day
and seven-day holding periods The bearish engulfing and the dark-cloud cover are
identified 70 times and four times respectively and their average returns are found
insignificant Appendix 2 includes the descriptive statistics of the eight candle pattern
analysis for AUDUSD
The analysis of USDCAD shows poor evidence of profitable bullish candle patterns
The bullish hammer appears 58 times with significant average returns at 5 level
ID 100068
68
however when filtered using the RSI the pattern appears only 25 times and the
average returns are found significant only for the one-day and three-day holding
periods The bullish engulfing pattern appears 35 times throughout the sample with
significant average returns only for the one-day and two-day holding periods The
bullish doji star pattern appears 19 times and is found statistically insignificant The
piercing lines pattern appears only eight times and the average returns are found
significant only for the one-day two-day and ten-day holding periods at 000 003
and 004 level of significance respectively This result will not be considered because
the number of times the patterns appears which should be considered in z score
formula is less than 30 On the other hand the bearish hanging man and the shooting
star patterns show strong evidence of profitability at 5 level of significance even after
being filtered with the RSI The hanging man pattern is identified 79 times the shooting
star pattern is identified 240 times After being filtered with the RSI reading that is above
50 the hanging man and the shooting star patterns appear 44 times and 108 times
respectively The dark-cloud cover is identified only twice with statistically insignificant
average returns The bullish engulfing pattern is identified 35 times and the average
returns are considered significant only for the one-day and two-day holding periods
Appendix 3 includes the descriptive statistics of the eight candle pattern analysis for
USDCAD
In EURUSD only the bullish pattern of the hanging man shows average returns that
are statistically and consistently significant at 5 level of significance This result also
repeats when filtered with the RSI The pattern is identified 64 times and when filtered it
shows 34 times The presence of the piercing lines pattern is very poor even though
the average returns of the two-day holding period is statistically significant 000 the
pattern is identified only 7 times out of 3129 observations This result is also not
considered The average returns of the bullish doji star and the bullish engulfing
patterns are statistically insignificant They show 15 times and 49 times respectively
On the other hand the average returns of the handing man and the shooting star
patterns are statistically significant they are identified 106 times and 181 times
ID 100068
69
respectively Nevertheless when filtered for the RSI reading the average return of the
ten-day holding period of the hanging man is found 007 that is statistically
insignificant at 5 level Also the average returns of the three-day four-day and five-
day holding periods for the shooting star pattern are found insignificant 008 009
and 008 respectively The dark-cloud and the bearish engulfing patterns are found
very poor Although the bearish engulfing pattern appears 156 times the average
returns are found statistically insignificant The dark-cloud cover pattern is identified only
seven times Appendix 4 includes the descriptive statistics of the eight candle pattern
analysis for EURUSD
In GBPUSD only the average returns of the bullish hammer pattern are found
statistically and consistently significant at 5 level even after filtering for the RSI The
pattern is identified 97 times before applying the RSI filter and 37 times after using the
filter The other three bullish patterns are found statistically insignificant The piercing
lines the bullish doji star and the bullish engulfing patterns appear 7 times 17 times
and 48 times respectively On the other hand the average returns of the hanging man
and the shooting star patterns are found statistically significant at 5 level They show
99 times and 197 times respectively however when filtered for the RSI the average
returns of the hanging man pattern are found statistically insignificant for the seven-day
and the ten-day holding periods 009 and 026 respectively The existence of the
dark-cloud cover pattern is found very poor as it is identified only once The bearish
engulfing pattern is identified 131 times and its average returns are also found
insignificant Appendix 5 includes the descriptive statistics of the eight candle pattern
analysis for GBPUSD
In the first emerging foreign currency of USDINR the average returns of the bullish
hammer and the bullish engulfing patterns are found statistically significant at 5 level
The patterns are identified 40 times and 65 times respectively However when filtering
the bullish hammer using the RSI reading the average returns are found significant only
for the one-day and the ten-day holding periods 000 and 003 respectively The
ID 100068
70
piercing lines pattern appears 33 times but its average returns are found statistically
insignificant The bullish doji star pattern appears 133 times and only the three-day
average returns are found significant 002 lacking consistency in results On the
other hand the existence of the bearish patterns in USDINR is found very poor The
average returns of the hanging man pattern are found statistically significant for only the
four-day five-day and ten-day holding periods and when filtered by the RSI only the
average returns of the one-day and two-day holding periods are found significant The
pattern is identified 69 times before the RSI filter and 39 times after applying the filter
The average returns of the shooting star and the bearish engulfing patterns are found
insignificant The shooting star pattern shows 549 times before the RSI filter and 244
times after using the filter the bearish engulfing pattern is identified 55 times Even
though the average returns of the dark-cloud cover pattern are found significant for all
the holding periods except the one-day period this result should not be considered as
the pattern is identified only twice Finally the bearish engulfing pattern is identified 131
times and its average returns are also found insignificant Appendix 6 includes the
descriptive statistics of the eight candle pattern analysis for USDINR
The USDJPY currency pair lacks evidence of most of the bullish candle reversal
patterns Only the average returns of the bullish hammer pattern are found statistically
significant for the first five holding periods and the first four holding periods after
allowing for the RSI filter The pattern is identified 120 times before the RSI filter and 62
times after applying the filter The average returns of the bullish doji star and the bullish
engulfing patterns are found insignificant for all the seven holding periods they are
identified 25 times and 45 times respectively Similar to the previous results the
average returns of the piercing lines pattern are found insignificant except for the two-
day holding period 001 This result is not considered either as the pattern is
identified only four times Moving to the bearish candle reversal patterns the average
returns of both the hanging man and the shooting star patterns are found statistically
and consistently significant at 5 level even after allowing for the RSI filter The
hanging man appears 155 times before the filter and 82 times after the filter the
ID 100068
71
shooting star pattern appears 190 times before the filter and 75 times after the filter The
average returns of the dark-cloud cover are found insignificant the pattern is identified
only 4 times The average returns of the bullish engulfing pattern are found statistically
significant only for the four-day holding period lacking consistency in the overall result
Appendix 7 includes the descriptive statistics of the eight candle pattern analysis for
USDJPY
Having examined the second emerging market foreign currency and the last foreign
currency in the sample USDZAR is found to experience no bullish reversal candlestick
patterns None of the average returns of the four candle patterns are found statistically
significant at 5 level The bullish hammer pattern is identified 85 times before the RSI
filter and 41 times after the filter the bullish doji star and the bullish engulfing patterns
appear 17 times and 26 times respectively The piecing lines pattern does not appear
at all However there is some evidence of bearish candle patterns in USDZAR The
average returns of the shooting star pattern are found consistently and statistically
significant at 5 level for all the holding periods before and after the RSI filter The
pattern appears 282 times before the filter and 129 times after the filter The average
returns of the hanging man pattern are found statistically significant for the first five
holding periods before and after the filter The average returns of the dark-cloud cover
pattern are found significant only for the three-day and four-day holding periods the
pattern appears only twice Thus due to the low frequency of pattern and the lack of
consistency the pattern results are not considered Appendix 8 includes the descriptive
statistics of the eight candle pattern analysis for USDZAR
ID 100068
72
Chapter 8
Findings and
Recommendations
ID 100068
73
Chapter 8 Findings and Recommendations
After analyzing the results in detail this chapter summarizes the major results into two
areas 1) general findings in term of frequency of pattern appearance holding periods
significance levels and bullish and bearish trends and 2) specific findings that are
pertaining to each currency pair The consistency of statistical significant returns at 5
level for all the holding periods is considered However for the three patterns of the
shooting star the hanging man and the bullish hammer both pre- and post-RSI filter
results are considered statistically significant based on one conservative condition the
average returns should be statistically significant at 5 level for at least five consecutive
holding periods in a row in both data before and after the RSI filter that is above 50
reading for the bearish two candle patterns and below 50 reading for the bullish candle
pattern Another condition that needs to be satisfied when considering the findings is the
number of observations along with the 5 level of significance According to Peterson
and Leuthold (1982) the number of times the candle pattern is identified should be
above 30 in the z score statistic
Having had more 65 bullish data during the study sample and among the four bullish
candlestick reversal patterns the bullish hammer pattern is found the strongest one in
term of frequency and statistical significant average returns at 5 level The maximum
number of times the pattern appears is 97 AUDUSD can be traded using this pattern
for the first six holding periods EURUSD and GBPUSD can be traded for all the seven
holding periods USDJPY can be traded for the first five holding periods The bullish
engulfing pattern is found statistically significant only in USDINR The research also
finds that there is no evidence of the piercing lines and bullish engulfing patterns across
all the seven currencies Two other interesting findings are the very low frequency of the
piercing line pattern across the sample the number varies from four to eight except for
USDINR and USDZAR they appear 33 times and zero times respectively Another
finding is that both of the emerging market currencies USDINR and USDZAR show
ID 100068
74
poor evidence of bullish candle patterns even though most of the study sample falls
under bullish cycles only the average returns of the bullish engulfing pattern in
USDINR is found statistical significant These findings reject both of the null
hypotheses that assume all Japanese candlestick patterns cannot be used to forecast
foreign currency prices and that foreign markets are efficient Furthermore the findings
of the profitable Japanese candle patterns are in line with the results found by Goo
Chen and Chang (2007) Lana Zhanga and Xiongb (2011) Haibin Zhao and Wang
(2012) Lu Shiu and Liu (2012) on the studies that examine the profitability of the
Japanese candle patterns as technical trading rules in particular These results also
support the evidence found using other profitable technical trading rules in general by
Longworth 1981 Brock Lakonishok and LeBaron 1992 Gencay 1997Osler 2000
Saacke 2002 Osker 2003 2006 Shik and Chong 2007 Lento and Gradojevic 2007
Park and Scott 2007 Stephen 2008 Cekirdekci and Iliev 2010 and Loumlnnbark and
Lundstroumlm 2012
Moving to the general findings of the bearish candle reversal patterns strong evidence
of the hanging man and the shooting star patterns are found in most of the foreign
currencies which is statistically significant at 5 level The highest number of the times
the hanging man and shooting star patterns appear is 155 times and 129 times
respectively The pattern of the hanging man that appears in AUDUSD USDCAD and
USDJPY can be traded for all the holding periods whereas the same pattern can be
traded in EURUSD GBPUSD and USDZAR for the first six holding periods of
EURUSD the first five holding periods of GBPUSD and USDZAR respectively The
shooting star pattern can be traded in USDCAD GBPEUR USDZAR and USDJPY
for all the holding periods The research also finds that the number of times the dark-
cloud cover pattern appears is very low it is between one and seven in which the
average returns are found statistically insignificant Similarly the average returns of the
bearish engulfing pattern are found statistically insignificant even though there is a high
frequency of the pattern that goes up to 181 times The last interesting finding is that
both of the emerging market currencies show evidence of the hanging man and the
ID 100068
75
shooting star patterns with an average return that is statistically and consistently
significant at 5 level These findings also reject the two null hypotheses Moreover
these partial findings that find no evidence of profitability of the other candle patterns
are in line with the other results in the literature that find no evidence of profitable
candlestick patterns particularly in the studies done by Brashears and Elam (1993)
Marshall Young and Rose (2005) and Young and Marshall (2007) As unprofitable
technical trading rules in general the poor evidence of the candle patterns are also in
line with the other results found by Levich and Thomas (1993) Lee and Mathur (1996)
LeBaron (2002) Olson (2004) and Lento and Gradojevic (2007)
Currency-wise findings are the second part of the research main findings The bullish
hammer can be traded for the first six holding periods as well as the bearish hanging
man for all the holding periods in AUDUSD Traders can trade the bearish hanging man
and the shooting star patterns in USDCAD for all the holding periods The bullish
hammer pattern the bearish hanging man pattern can be traded in EURUSD for the
first six holding periods GBPUSD can be traded using the bullish hammer the bearish
hanging man and the shooting star patterns for all the holding periods the first five
holding periods and all the holding periods respectively USDINR can be traded using
the bullish engulfing pattern USDZAR can be traded using the bearish hanging man
and the shooting start patterns for the first five holding periods and all the holding
periods respectively Finally USDJPY can be traded using the bullish hammer pattern
for the first five holding periods it can also be traded using the bearish patterns of the
hanging man and the shooting star for all the holding periods
After finding strong evidence of some profitable Japanese candle reversal patterns in
foreign exchange markets this research provides recommendations that are divided
into two main areas The first one is in reference to trading and investment decisions
The other area is concerned with future research Based on the findings above it is
recommended to trade the Japanese candlestick patterns that are found statistically
significant at 5 level in the respective currencies This is summarized in the second
ID 100068
76
section above that is pertaining to respective currency pairs For future research it is
recommended to use more sophisticated algorithm programmes and statistical models
to re-examine the findings of this research not only using daily prices but also intraday
timeframes Since foreign exchange markets are known for being very complex and
difficult to predict it is recommended to use other technical trading rules such as
support-resistance levels and oscillators like the MACD histogram and Commodity
Channel Index (CCI) in combination with the candlestick pattern trading rules Using
such strong different trading rules in which the majority of the trading signals would
agree will help making the trading system very robust Moreover future research is
encouraged to examine the candle reversal patterns in term of bullish and bearish
trends The beauty of the Japanese candlestick patterns reveals when they are used in
combination with other trading rules The key concept in using the candlestick charting
system is the comprehensive technical picture of the market
ID 100068
77
Chapter 9
Conclusion
ID 100068
78
Chapter 9 Conclusion
This research attempts to examine the profitability of selected Japanese candlestick
reversal patterns in the foreign exchange markets as the main objective The research
tests two null hypotheses that assume all Japanese candle reversal patterns cannot be
used to forecast foreign currency price movements and that foreign exchange markets
are efficient supporting the weak form of the EMH The sample includes a 12-year data
of 3129 observations for seven foreign exchange currencies AUDUSD USDCAD
EURUSD GBPUSD USDINR USDZAR and USDJPY The selected Japanese
candle patterns include four bullish and four bearish patterns The bullish patterns
include the bullish hammer the piercing lines the bullish doji star and the bullish
engulfing whereas the bearish patterns include the hanging man the dark-cloud cover
the shooting star and the bearish engulfing The statistical z score test is used to test
the average returns of open-close difference at 5 level of significance for seven
holding periods one day two days three days four days five days seven days and
ten days The 14-day Relative Strength Index (RSI) is used to distinguish similar
patterns that appear at different turning points these similar patterns include the bullish
hammer the hanging man and the shooting star If the hanging man and the shooting
start patterns form above 50 it is assumed that there is a high possibility that the trend
will reverse from up to down Similarly if the bullish hammer pattern forms below the 50
reading there is a high possibility that the current trend will reverse from down to up To
arrive to the final results that are tested statistically using z score the number of times
the candle pattern is identified (n) has to be above 30 (Peterson and Leuthold 1982)
The second condition is that for the three candle patterns that are used in combination
with the RSI filter the results are considered only if the average returns are statistically
significant at 5 level for at least five consecutive holding periods
After examining the candle patterns in the seven currencies the research finds
evidence of some profitable of Japanese candle patterns at 5 level of significance
ID 100068
79
Strong evidence of the bullish hammer the bearish hanging man and the shooting star
patterns in some currencies is found The research finds that the frequency of pattern
appearance for the piercing lines and the dark-cloud cover patterns are the least among
the eight candle patterns Also the results show that the bullish hammer and the
bearish hanging man patterns can be traded in AUDUSD for the first six holding
periods and all the holding periods respectively The bearish hanging man and the
shooting star patterns can be traded in USDCAD for all the seven holding periods The
bullish hammer and the bearish hanging man patterns can be traded in EURUSD for all
the holding periods The bullish hammer the bearish hanging man and the shooting star
patterns can be traded in GBPUSD for the all holding periods the first five trading
periods and all the holding periods respectively The bullish engulfing pattern can be
traded in USDINR for all the holding periods The bearish hanging man and the
shooting star patterns can be traded in USDZAR for all the trading periods Moreover
the bullish hammer the bearish hanging man and the shooting star patterns can be
traded in USDJPY for the first five holding periods of the hanging man and all the
holding periods of the other two patterns Thus these results reject the two null
hypotheses Furthermore the findings of the profitable Japanese candle patterns are in
line with the results found by Goo Chen and Chang (2007) Lana Zhanga and Xiongb
(2011) Haibin Zhao and Wang (2012) Lu Shiu and Liu (2012) on the studies that
examine the profitability of the Japanese candle patterns as technical trading rules in
particular These results also support the evidence found using other profitable technical
trading rules in general by Longworth 1981 Brock Lakonishok and LeBaron 1992
Gencay 1997Osler 2000 Saacke 2002 Osker 2003 2006 Shik and Chong 2007
Lento and Gradojevic 2007 Park and Scott 2007 Stephen 2008 Cekirdekci and Iliev
2010 and Loumlnnbark and Lundstroumlm 2012
Market participants are recommended to use the above candle patterns in the
respective foreign currency in their trading investment and hedging decisions It is also
recommended to use the candle charts along with other trading rules such as support
and resistance levels and oscillators For future research it is recommended to use and
ID 100068
80
examine more sophisticated algorithm programmes and statistical models to re-test the
findings of this research using both daily and intraday prices It is also recommended to
use other technical trading rules such as support-resistance levels and oscillators such
as MACD histogram and the CCI in combination with candlestick pattern trading rules
This is required because foreign exchange markets are very complex using such strong
different trading rules makes the trading system more powerful Moreover future
research is encouraged to examine the candle reversal patterns in term of bullish and
bearish trends The beauty of the Japanese candlestick patterns reveals when they are
used in a combination with other trading rules Last but not least the key concept in
using the candlestick charting system is the comprehensive technical picture of the
market that makes these candlestick trading systems robust
ID 100068
81
Bibliography Achelis S (2001) Technical Analysis from A to Z 2nd ed New York McGraw-Hill Anderson J (2003) A Test of Weak-Form Market Efficiency in Australian Bank Bill Futures Calendar Spreads [online] [Accessed 03 September 2012] Available at httpeprintsquteduau3871Anderson_134pdf Bettman J Sault S amp Welch E (2006) Fundamental and Technical analysis Substitiutes or Compliments [online] [Accessed 07 September 2012] Available at httppapersssrncomsol3paperscfmabstract_id=899879 Brock W Lakonishok J amp LeBaron B (1991) Simple Technical Trading Rules and the Stochastic Properties of Stock Returns [online] [Accessed 10 September 2012] Available at httpwwwsantafeedumediaworkingpapers91-01-006pdf Buffett W (1984) The Superinvestors of Graham-and-doddsville [online] [Accessed 04 October 2012] Available at httpwwwbestinverespdfarticulos_valueThe20Superinvestors20of20Graham20and20Doddsville20by20Warren20Buffettpdf BxCapricorn (2009) Candlestick Alternative Individually Colored Up-Down Bars [blog entry] [Accessed 02 December 2012] Available at httppeltiertechcomWordPresscandlestick-alternative-individually-colored-up-down-bars Cekirdekci M amp Iliev V (2010) Trading System Development Trading the Opening Range Breakouts [online] [Accessed 10 October 2012] Available at httpwwwwpieduPubsE-projectAvailableE-project-042910-142422unrestrictedVeselin_Iliev_IQPpdf Colby R (2003) The Encyclopedia of Technical Market Indicators 2nd ed New York McGraw-Hill Cooper T (2011) Optimal Rotational Strategies using Combined Technical and Fundamental Analysis [online] [Accessed 09 September 2012] Available at httpwwwnaaimorgwp-contentuploads201204K2011_Tony-Cooper_Optimal-_Rotational-_Strategiespdf Fadhel D (2010) Using Candlestick Patterns to Test Efficiency in Stock Futures Markets MSc assignment The British University in Dubai Fama E (1970) ldquoEfficient Capital Markets A Review of Theory and Empirical Workrdquo Journal of Finance [online] Vol 25 (2) [Accessed 15 September 2012] Available at
ID 100068
82
httpefinanceorgcncnfmEfficient20Capital20Markets20A20Review20of20Theory20and20Empirical20Workpdf Friesen G Weller P amp Dunham L (2007) Price trends and Patterns in Technical Analysis A theoretical and empirical examination [online] [Accessed 15 September 2012] Available at httppapersssrncomsol3paperscfmabstract_id=970852 Genccedilay R 1997 The Predictability of Security Returns with Simple Technical Trading Rules Journal of Empirical Finance [online] Vol 5 [Accessed 15 September 2012] Available at httpwwwsfuca~rgencayjarticlesjef-technicalpdf HolmbergU Loumlnnbark C amp Lundstroumlm C (2012) Assessing the Profitability of Intraday Opening Range Breakout Strategies [online] [Accessed 02 September 2012] Available at httpwwwusbeumusedigitalAssets102102002_ues845pdf Jegadeesh N amp Titman S (1993) Returns to Buying Winners and Selling Losers Implications for Stock Market Efficiency Journal of Finance [online] Vol 48 (1) [Accessed 15 September 2012] Available at httpwwwe-m-horgJeTi93pdf Krishnan R amp Menon S (2009) Impact of Currency Pairs Time Frames and Technical Indicators on Trading Profit in Forex Spot Market [online] [Accessed 02 September 2012] Available at httpwwwfxinvestornetforex-educationImpactofCurrencyPairsTimeFramesonTradingProfitsInForexMarketspdf LeBaron B (1998) Technical Trading Rule Profitability and Foreign Exchange Intervention [online] Journal of International Economics Vol 49 (1) [Accessed 04 September 2012] Available at httpwwwsciencedirectcomsciencearticlepiiS0022199698000610 LeBaron B (2002) Technical Trading Profitability in Foreign Exchange Markets in the 1990rsquos [online] [Accessed 02 September 2012] Available at httppeoplebrandeisedu~blebaronwpsfx90pdf Lee C amp Mathur I (1996) A comprehensive Look at the Efficacy of Technical Trading Rules Applied to Cross-rates The European Journal of Finance [online] Vol 2 (4) [Accessed 04 September 2012] Available at httpeconpapersrepecorgarticletafeurjfiv_3a2_3ay_3a1996_3ai_3a4_3ap_3a389-411htm Lento C amp Gradojevic N (2007) The Profitability of Technical Trading Rules A Combined Signal Approach Journal of Applied Business Research [online] Vol 23 (1) [Accessed 04 September 2012] Available at httpjournalscluteonlinecomindexphpJABRarticleviewArticle1405
ID 100068
83
Levich R amp Thomas L (1993) The Significance of Technical Trading Rule Profits in the Foreign Exchange Market a Bootstrap Approach Journal of International Money and Finance [online] Vol 12 (5) [Accessed 04 September 2012] Available at httpwwwnberorgpapersw3818 Levy R (1966) Conceptual Foundations of Technical Analysis Financial Analysts Journal [online] Vol 22 (4) [Accessed 04 September 2012 Available at httpwwwjstororgdiscover1023074470026uid=3737432ampuid=2129ampuid=2ampuid=70ampuid=4ampsid=21101021522633 Lo A amp MacKinlay A (1989) Stock Market Prices Do Not Follow Random Walks Evidence From a Simple Specification Test National Bureau of Economic Research Inc[online] Vol 1(1) [Accessed 02 September 2012] Available at httpideasrepecorgpnbrnberwo2168html Longworth D (1981) Testing the Efficiency of the Canadian-US Exchange Market under the Assumption of No Risk Premium The journal of Finance [online] Vol 36 (1) [Accessed 04 September 2012] Available at httpwwwjstororgdiscover1023072327462uid=3737432ampuid=2129ampuid=2ampuid=70ampuid=4ampsid=21101019268683 Malkiel B (2003) The Efficient Market Hypothesis and Its Critics [online] [Accessed 10 October 2012] Available at httpwwwvixekcomEfficient20Market20Hypothesis20and20its20Critics20-20Malkielpdf Malkiel B Mei J amp Yang R (2006) Investment Strategies to Exploit Economic Growth in China Journal of Investment Consulting [online] Vol 7 (3) [Accessed 15 October 2012] Available at httppapersssrncomsol3paperscfmabstract_id=1702374 Marshall B amp Young M (2007) Market Timing with Candlestick Technical Analysis [online] [Accessed 10 September 2012] Available at httppapersssrncomsol3paperscfmabstract_id=980583 Murphy J (1999) Technical Analysis of Financial Markets 2nd ed New York Penguin Putnam Inc Neely C amp Weller P (2000) Technical Analysis and Central Bank Intervention [online] [Accessed 10 October 2012] Available at httpresearchstlouisfedorgwp199797-002pdf Nison S (2001) Japanese Candlestick Charting Techniques 2nd ed New York Penguin Putnam Inc
ID 100068
84
Nocera J (2009) Poking Holes in a Theory on Markets [online] [Accessed 04 November 2012] Available at httpwwwnytimescom20090606business06nocerahtmlscp=1ampsq=efficient20marketampst=cseamp_r=0 Okunev J amp White D (2003) Do momentum-based Strategies Still Work in Foreign Currency Markets [online] [Accessed 19 October 2012] Available at httpwwwdocsfceunsweduaubankingworkpapcurrencypdf Omrane W amp Oppens H (2004) The Predictive Success and Profitability of Chart Patterns in the EuroDollar Foreign Exchange Market [online] [Accessed 07 September 2012] Available at httppapersssrncomsol3paperscfmabstract_id=484384 Olson D (2004) Have Trading Rule Profits in the Currency Markets Declined over Time Journal of Banking and Finance [online] Vol 28 (1) [Accessed 04 September 2012] Available at httpwwwsciencedirectcomsciencearticlepiiS0378426602003990 Osler C (2000) Support for Resistance Technical Analysis and Intraday Exchange Rates [online] [Accessed 09 December 2012] Available at httpwwwnewyorkfedorgresearchepr00v06n20007oslepdf Osler C (2003) Currency Orders and Exchange Rate Dynamics An Explanation for the Predictive Success of Technical Analysis Journal of Finance [online] Vol 58 (5) [Accessed 16 October 2012] Available at ftpwwweconbguacilCoursesSignaling_in_Financial_MarketsReadingsArticles2009-01-1420Technical20AnalysisCurrency20Orders20and20Exchange20Rate20Dynamics20An20Explanation20for20the20Predictive20Success20ofTechnical20Analysispdf Park C amp Irwin S (2007) What Do We Know about the Probability of Technical Analysis Journal of Economic Surveys [online] Vol 21 (4) [Accessed 10 October 2012] Available at httpideasrepecorgablajecsurv21y2007i4p786-826html Peterson P amp Leuthold R (1982)Using Mechanical Trading Rules to Evaluate the Weak-Form Efficiency of Futures Markets [online] [Accessed 16 December 2012] Available at httpageconsearchumnedubitstream29574114010147pdf Pukthuanthong K amp Thomas L (2008) Weak-form Efficiency in Currency Markets Financial Analysts Journal [online] Vol 64 (3) [Accessed 04 November 2012] Available at httppapersssrncomsol3paperscfmabstract_id=1266184
ID 100068
85
Raymond Y (2012) Fundamental Analysis VS Technical Analysis [online] [Accessed 02 December 2012] Available at httppapersssrncomsol3paperscfmabstract_id=2051485 Saacke P (2002) Technical Analysis and the Effectiveness of Central Bank Intervention Journal of International Money amp Finance [online] Vol 21 (4) [Accessed 04 November 2012] Available at httpmoving-averagestechnicalanalysisorgukSaac02pdf Samuelson P (1965) Proof that Properly Anticipated Prices Fluctuate Randomly [online] [Accessed 10 October 2012] Available at httpstevereadscompapers_to_readproof_that_properly_anticipated_prices_fluctuate_randomlypdf Shik T amp Chong T (2007) A comparison of MA and RSI returns with exchange rate intervention Applied Economic Letters [online] Vol14 (5) [Accessed 15 October 2012] Available at httpideasrepecorgatafapecltv14y2007i5p371-383html SilberW (1994) Technical Trading When it Works and When it Doesnrsquot The Journal of Derivatives [online] Vol 1 No 3 [Accessed 10 October 2012] Available at httpwwwiijournalscomdoiabs103905jod1994407887 Taylor J amp Allen H (1992) The Use of Technical Analysis in Foreign Exchange Market Journal of International Money and Finance [online] Vol 11 (3) [Accessed 10 October 2012] Available at httpwwwsciencedirectcomsciencearticlepii0261560692900483 Thomas G amp Lukas M (2006) Extended Evidence on the Use of Technical Analysis in Foreign Exchange International Journal of Finance amp Economics [online] Vol 11 (4) [Accessed 14 October 2012] Available at ftpwwweconbguacilcoursesSignaling_in_Financial_MarketsReadingsArticles2009-01-1420Technical20AnalysisEXTENDED20EVIDENCE20ON20THE20USE20OF20TECHNICAL20ANALYSIS20IN20FOREIGN20EXCHANGEpdf Thomson Reuters (2013) Foreign Currency Data Download Prices downloaded from 3000 xtra terminal on 01 January 2013 Worrachate A amp Goodman D (2012) Currency Trading at $5 Trillion a Day Surpassed Pre-Lehman High BIS Says [online] [Accessed 20 December 2012] Available at httpwwwbloombergcomnews2012-03-11currency-trading-at-5-trillion-a-day-surpassed-pre-lehman-high-bis-sayshtml
ID 100068
86
Appendix 1 Japanese Candlestick Patterns
Below are the different types of Japanese candle patterns reversal and continuation
patterns The number in brackets shows the number of candles required to form the
pattern (Murphy 1999)
ID 100068
87
Appendix 1 Japanese Candlestick Patterns (continued)
ID 100068
88
Appendix 1 Japanese Candlestick Patterns (continued)
ID 100068
89
Appendix 1 Japanese Candlestick Patterns (continued)
ID 100068
90
Appendix 1 Japanese Candlestick Patterns (continued)
ID 100068
91
Appendix 2 Descriptive statistics of the eight candle pattern analysis for AUDUSD
1 Day 2 Days 3 Days 4 Days 5 Days 7 Days 10 Days 1 Day 2 Days 3 Days 4 Days 5 Days 7 Days 10 DaysAverage 00066 00076 00082 00076 00066 00047 00063 00058 00069 00086 00090 00080 00059 00067
Var 00001 00001 00002 00002 00002 00003 00006 00000 00001 00002 00002 00003 00003 00005
n 89 89 89 89 89 89 89 57 57 57 57 57 57 57
sqrt(varn) 0001 0001 0001 0001 0002 0002 0003 0001 0001 0002 0002 0002 0002 0003
Z score 7979 6128 6085 5173 3960 2622 2438 7157 5481 5297 4655 3590 2471 2162
P-value 000 000 000 000 000 000 001 000 000 000 000 000 001 002
SD 0008 0012 0013 0014 0016 0017 0025 001 001 001 001 002 002 002
Min -0004 -0023 -0020 -0023 -0034 -0030 -0054 -0003 -0013 -0014 -0023 -0034 -0023 -0035
Max 0051 0073 0049 0053 0060 0058 0076 0027 0031 0048 0053 0060 0058 0076
Average 00002 -00036 -00007 -00043 00004 00071 -00056
Var 00000 00002 00003 00004 00007 00013 00011
n 4 4 4 4 4 4 4
sqrt(varn) 0001 0007 0008 0010 0013 0018 0017
Z score 0198 -0535 -0082 -0435 0029 0396 -0328
P-value 042 030 047 033 049 035 037
SD 000 001 002 002 003 004 003
Min -0003 -0020 -0019 -0025 -0026 -0027 -0044
Max 0003 0013 0021 0021 0035 0052 0032
Average -00006 -00009 -00009 -00012 -00014 00052 00038 00039 00028 00022 00013 00016 00023 00025
Var 00001 00001 00001 00002 00002 00077 00078 00000 00000 00001 00001 00001 00001 00002
n 148 148 148 148 148 148 148 92 92 92 92 92 92 92
sqrt(varn) 0001 0001 0001 0001 0001 0007 0007 0000 0001 0001 0001 0001 0001 0002
Z score -0930 -1157 -0917 -1019 -1179 0717 0521 9602 4433 2319 1300 1573 2015 1553
P-value 018 012 018 015 012 024 030 000 000 001 010 006 002 006
SD 0007 0009 0012 0014 0015 0087 0088 0004 0006 0009 0009 0010 0011 0015
Min -0025 -0031 -0051 -0064 -0053 -0085 -0062 -0001 -0010 -0013 -0025 -0019 -0018 -0030
Max 0029 0020 0033 0050 0055 1039 1039 0019 0020 0051 0031 0031 0036 0059
Average -00015 -00015 -00017 -00016 -00021 00132 00106
Var 00001 00001 00002 00003 00003 00160 00163
n 70 70 70 70 70 70 70
sqrt(varn) 0001 0001 0002 0002 0002 0015 0015
Z score -1388 -1102 -0913 -0727 -0950 0871 0692
P-value 008 014 018 023 017 019 024
SD 001 001 002 002 002 013 013
Min -0025 -0031 -0051 -0064 -0053 -0085 -0062
Max 0029 0020 0033 0050 0055 1039 1039
1 Day 2 Days 3 Days 4 Days 5 Days 7 Days 10 Days 1 Day 2 Days 3 Days 4 Days 5 Days 7 Days 10 DaysAverage 00054 00053 00053 00057 00055 00070 00088 00054 00041 00030 00040 00039 00042 00051
Var 00000 00001 00001 00001 00002 00003 00004 00000 00001 00001 00001 00002 00003 00003
n 77 77 77 77 77 77 77 40 40 40 40 40 40 40
sqrt(varn) 0001 0001 0001 0001 0002 0002 0002 0001 0001 0001 0002 0002 0003 0003
Z score 9480 5729 5275 4439 3561 3500 4108 5895 2822 2101 2327 1886 1504 1742
P-value 000 000 000 000 000 000 000 000 000 002 001 003 007 004
SD 0005 0008 0009 0011 0014 0018 0019 001 001 001 001 001 002 002
Min -0001 -0023 -0023 -0018 -0031 -0048 -0052 -0001 -0023 -0023 -0018 -0024 -0048 -0052
Max 0034 0031 0022 0043 0040 0063 0070 0034 0031 0021 0031 0035 0045 0033
Average -00071 -00034 -00120 -00059 -00012 -00015 -00017
Var 00000 00001 00005 00005 00005 00005 00011
n 7 7 7 7 7 7 7
sqrt(varn) 0002 0004 0008 0008 0008 0008 0012
Z score -2887 -0858 -1435 -0718 -0140 -0184 -0138
P-value 000 020 008 024 044 043 045
SD 0007 0011 0022 0022 0022 0022 0033
Min -0018 -0022 -0041 -0038 -0026 -0033 -0049
Max 0002 0011 0015 0021 0025 0032 0046
Average 00032 00027 00032 00038 00061 00054 00065
Var 00000 00001 00001 00001 00001 00002 00002
n 28 28 28 28 28 28 28
sqrt(varn) 0001 0001 0002 0002 0002 0002 0002
Z score 3045 1903 1885 2206 2688 2326 2628
P-value 000 003 003 001 000 001 000
SD 0006 0007 0009 0009 0012 0012 0013
Min -0005 -0010 -0012 -0015 -0012 -0025 -0028
Max 0014 0024 0022 0018 0050 0031 0026
Average -00005 00003 00002 00010 00011 -00006 00013
Var 00000 00001 00001 00001 00002 00003 00002
n 49 49 49 49 49 49 49
sqrt(varn) 0001 0001 0002 0002 0002 0002 0002
Z score -0597 0243 0092 0586 0562 -0258 0621
P-value 028 040 046 028 029 040 027
SD 0006 0010 0012 0012 0014 0016 0014
Min -0017 -0022 -0035 -0031 -0037 -0033 -0031
Max 0012 0025 0025 0024 0031 0037 0032
At 5 level of significance
0002
Bullish
Engulfing0000
With RSI
Filter
Holding period
0004Bullish
Hammer0006
Piercing Lines -0005
Bullish Doji
Star0004
With RSI
Filter
Holding period
0007
Bullish
Candlestick
Patterns
Descriptive
Statistics
Holding
Periods
Average
Holding period
Dark-Cloud
Cover
Shooting Star
Bearish
Engulfing
0007
-0001
0001
0002
Holding periodHolding
Periods
Average
Bearish
Candlestick
Patterns
Descriptive
Statistics
Hanging Man
ID 100068
92
Appendix 3 Descriptive statistics of the eight candle pattern analysis for USDCAD
1 Day 2 Days 3 Days 4 Days 5 Days 7 Days 10 Days 1 Day 2 Days 3 Days 4 Days 5 Days 7 Days 10 DaysAverage 00053 00058 00068 00063 00072 00069 00066 00049 00055 00077 00068 00083 00092 00087
Var 00000 00000 00001 00001 00002 00003 00005 00000 00000 00001 00001 00001 00002 00003
n 79 79 79 79 79 79 79 44 44 44 44 44 44 44
sqrt(varn) 0000 0001 0001 0001 0001 0002 0003 0001 0001 0001 0002 0002 0002 0003
Z score 11920 7456 6379 4888 4907 3632 2555 8727 5249 5633 4399 4697 4543 3218
P-value 000 000 000 000 000 000 001 000 000 000 000 000 000 000
SD 0004 0007 0009 0011 0013 0017 0023 000 001 001 001 001 001 002
Min -0001 -0009 -0015 -0026 -0023 -0044 -0090 0000 -0008 -0015 -0020 -0016 -0033 -0031
Max 0016 0032 0036 0043 0059 0062 0088 0015 0022 0029 0024 0029 0028 0035
Average -00039 -00029 -00044 -00040 00016 -00041 00094
Var 00000 00003 00003 00003 00000 00002 00000
n 2 2 2 2 2 2 2
sqrt(varn) 0005 0012 0012 0012 0005 0010 0001
Z score -0794 -0250 -0373 -0331 0363 -0411 9400
P-value 021 040 035 037 036 034 000
SD 001 002 002 002 001 001 000
Min -0009 -0015 -0016 -0016 -0003 -0014 0008
Max 0001 0009 0007 0008 0006 0006 0010
Average 00056 00055 00058 00057 00064 00068 00069 00064 00062 00059 00054 00053 00065 00073
Var 00000 00001 00001 00001 00002 00003 00004 00000 00001 00001 00002 00002 00003 00005
n 240 240 240 240 240 240 240 108 108 108 108 108 108 108
sqrt(varn) 0000 0001 0001 0001 0001 0001 0001 0001 0001 0001 0001 0001 0002 0002
Z score 17964 9992 9069 7432 7383 6354 5191 11585 6832 5480 4375 4085 4026 3515
P-value 000 000 000 000 000 000 000 000 000 000 000 000 000 000
SD 0005 0008 0010 0012 0013 0016 0021 0006 0009 0011 0013 0014 0017 0022
Min -0002 -0024 -0022 -0024 -0029 -0046 -0109 0000 -0008 -0022 -0024 -0029 -0046 -0109
Max 0028 0059 0043 0047 0050 0066 0060 0028 0059 0043 0046 0039 0066 0056
Average -00002 00009 00003 00003 00005 00005 00020
Var 00001 00001 00002 00002 00003 00003 00005
n 171 171 171 171 171 171 171
sqrt(varn) 0001 0001 0001 0001 0001 0001 0002
Z score -0428 1065 0340 0237 0388 0367 1237
P-value 033 014 037 041 035 036 011
SD 001 001 001 001 002 002 002
Min -0031 -0033 -0037 -0035 -0044 -0054 -0053
Max 0046 0069 0058 0089 0120 0078 0073
1 Day 2 Days 3 Days 4 Days 5 Days 7 Days 10 Days 1 Day 2 Days 3 Days 4 Days 5 Days 7 Days 10 DaysAverage 00057 00055 00054 00047 00053 00057 00052 00052 00026 00027 00021 -00002 00014 00010
Var 00000 00001 00002 00001 00003 00004 00005 00000 00001 00001 00001 00002 00002 00002
n 58 58 58 58 58 58 58 25 25 25 25 25 25 25
sqrt(varn) 0001 0002 0002 0002 0002 0002 0003 0001 0002 0002 0002 0003 0003 0003
Z score 8061 3627 3039 2963 2402 2294 1775 6554 1535 1686 1112 -0076 0517 0347
P-value 000 000 000 000 001 001 004 000 006 005 013 047 030 036
SD 0005 0012 0014 0012 0017 0019 0022 000 001 001 001 001 001 001
Min 0000 -0016 -0022 -0020 -0031 -0024 -0044 0000 -0016 -0010 -0010 -0031 -0024 -0022
Max 0025 0043 0070 0043 0058 0072 0111 0013 0025 0021 0030 0025 0027 0043
Average 00055 00055 00080 00058 00075 00116 00160
Var 00000 00001 00003 00001 00003 00008 00006
n 8 8 8 8 8 8 8
sqrt(varn) 0002 0003 0006 0004 0006 0010 0009
Z score 3026 1927 1333 1358 1298 1182 1811
P-value 000 003 009 009 010 012 004
SD 0005 0008 0017 0012 0016 0028 0025
Min -0005 -0009 -0010 -0008 -0012 -0035 -0015
Max 0013 0015 0039 0030 0037 0044 0058
Average 00007 00034 00055 00036 00043 00044 00077
Var 00001 00002 00003 00002 00003 00005 00009
n 19 19 19 19 19 19 19
sqrt(varn) 0002 0003 0004 0003 0004 0005 0007
Z score 0382 1158 1275 1115 1085 0882 1133
P-value 035 012 010 013 014 019 013
SD 0008 0013 0019 0014 0017 0022 0030
Min -0013 -0016 -0030 -0028 -0026 -0035 -0036
Max 0025 0043 0070 0043 0058 0072 0111
Average -00014 -00025 -00014 -00023 -00008 -00011 -00034
Var 00000 00001 00001 00001 00001 00003 00002
n 35 35 35 35 35 35 35
sqrt(varn) 0001 0001 0002 0002 0002 0003 0003
Z score -1851 -1755 -0847 -1241 -0409 -0375 -1343
P-value 003 004 020 011 034 035 009
SD 0005 0008 0010 0011 0011 0017 0015
Min -0012 -0026 -0024 -0024 -0034 -0042 -0034
Max 0009 0012 0024 0019 0018 0030 0027
At 5 level of significance
Bullish
Engulfing-0002
Bullish
Hammer0005 0002
Piercing Lines 0009
Bullish Doji
Star0004
Holding period
Shooting Star 0006 0006
Bearish
Engulfing0001
Bullish
Candlestick
Descriptive
Statistics
Holding
Periods
Holding period With RSI
Filter
Hanging Man 0006 0007
Dark-Cloud
Cover-0001
Holding periodBearish
Candlestick
Patterns
Descriptive
Statistics
Holding
Periods
Average
Holding periodWith RSI
Filter
ID 100068
93
Appendix 4 Descriptive statistics of the eight candle pattern analysis for EURUSD
1 Day 2 Days 3 Days 4 Days 5 Days 7 Days 10 Days 1 Day 2 Days 3 Days 4 Days 5 Days 7 Days 10 DaysAverage 00060 00063 00053 00044 00035 00046 00043 00058 00072 00049 00054 00048 00046 00039
Var 00000 00001 00002 00002 00003 00004 00006 00000 00001 00001 00002 00003 00003 00004
n 106 106 106 106 106 106 106 57 57 57 57 57 57 57
sqrt(varn) 0001 0001 0001 0001 0002 0002 0002 0001 0001 0002 0002 0002 0002 0003
Z score 11057 6201 4199 3044 2185 2435 1841 7749 5822 3207 2860 2254 2000 1476
P-value 000 000 000 000 001 001 003 000 000 000 000 001 002 007
SD 0006 0011 0013 0015 0016 0019 0024 001 001 001 001 002 002 002
Min -0004 -0021 -0022 -0036 -0035 -0031 -0085 -0002 -0012 -0018 -0024 -0032 -0025 -0034
Max 0029 0032 0038 0044 0043 0058 0061 0029 0032 0038 0044 0043 0053 0047
Average 00004 -00009 -00024 -00043 -00081 -00047 -00059
Var 00002 00001 00003 00003 00003 00004 00005
n 7 7 7 7 7 7 7
sqrt(varn) 0005 0004 0006 0007 0007 0008 0008
Z score 0094 -0229 -0386 -0623 -1190 -0613 -0735
P-value 046 059 065 073 088 073 077
SD 001 001 002 002 002 002 002
Min -0020 -0009 -0028 -0025 -0027 -0025 -0025
Max 0018 0017 0020 0026 0018 0030 0032
Average 00066 00065 00138 00133 00147 00221 00227 00064 00054 00216 00202 00218 00359 00360
Var 00000 00001 00098 00099 00099 00194 00197 00000 00001 00201 00202 00203 00398 00399
n 181 181 181 181 181 181 181 87 87 87 87 87 87 87
sqrt(varn) 0000 0001 0007 0007 0007 0010 0010 0001 0001 0015 0015 0015 0021 0021
Z score 14089 7642 1877 1803 1981 2132 2179 9528 4571 1422 1327 1431 1678 1681
P-value 000 000 003 004 002 002 001 000 000 008 009 008 005 005
SD 0006 0012 0099 0099 0100 0139 0140 0006 0011 0142 0142 0142 0199 0200
Min -0001 -0022 -0041 -0056 -0039 -0036 -0091 -0001 -0022 -0023 -0024 -0027 -0036 -0048
Max 0033 0052 1323 1323 1323 1323 1323 0033 0052 1323 1323 1323 1323 1323
Average 00006 00007 00010 00016 00016 00012 00000
Var 00001 00002 00002 00002 00003 00004 00007
n 156 156 156 156 156 156 156
sqrt(varn) 0001 0001 0001 0001 0001 0002 0002
Z score 0748 0671 0852 1316 1188 0707 0002
P-value 023 025 020 009 012 024 050
SD 001 001 001 002 002 002 003
Min -0022 -0031 -0030 -0041 -0035 -0041 -0066
Max 0030 0039 0053 0043 0050 0071 0080
1 Day 2 Days 3 Days 4 Days 5 Days 7 Days 10 Days 1 Day 2 Days 3 Days 4 Days 5 Days 7 Days 10 DaysAverage 00069 00085 00103 00097 00082 00111 00137 00064 00080 00094 00085 00060 00108 00162
Var 00000 00001 00002 00002 00003 00004 00008 00000 00001 00001 00002 00003 00005 00010
n 64 64 64 64 64 64 64 34 34 34 34 34 34 34
sqrt(varn) 0001 0001 0002 0002 0002 0003 0003 0001 0001 0002 0002 0003 0004 0005
Z score 9122 5806 5359 5122 3939 4311 3942 7655 5739 5329 3898 2012 2946 3011
P-value 000 000 000 000 000 000 000 000 000 000 000 002 000 000
SD 0006 0012 0015 0015 0017 0021 0028 000 001 001 001 002 002 003
Min 0000 -0009 -0012 -0020 -0036 -0031 -0039 0001 -0004 -0007 -0016 -0036 -0025 -0031
Max 0034 0073 0103 0084 0055 0067 0170 0020 0028 0032 0032 0043 0067 0170
Average -00016 -00036 -00047 -00048 -00037 -00073 -00029
Var 00000 00000 00001 00001 00002 00007 00007
n 7 7 7 7 7 7 7
sqrt(varn) 0002 0001 0003 0004 0005 0010 0010
Z score -0787 -4245 -1554 -1222 -0737 -0746 -0296
P-value 022 000 006 011 023 023 038
SD 0005 0002 0008 0010 0013 0026 0026
Min -0009 -0006 -0017 -0017 -0020 -0045 -0044
Max 0008 -0001 0006 0009 0010 0016 0026
Average -00008 00002 00016 00013 00008 00001 00033
Var 00000 00001 00001 00002 00002 00001 00002
n 15 15 15 15 15 15 15
sqrt(varn) 0002 0002 0003 0003 0004 0003 0003
Z score -0494 0094 0594 0387 0216 0045 1003
P-value 031 046 028 035 041 048 016
SD 0006 0009 0010 0013 0014 0012 0013
Min -0011 -0016 -0014 -0016 -0028 -0023 -0017
Max 0016 0015 0018 0024 0021 0023 0027
Average -00010 00000 -00011 -00024 -00013 00019 00050
Var 00001 00001 00002 00002 00002 00004 00008
n 49 49 49 49 49 49 49
sqrt(varn) 0001 0002 0002 0002 0002 0003 0004
Z score -0861 0013 -0613 -1188 -0609 0677 1270
P-value 019 051 027 012 027 075 090
SD 0009 0012 0013 0014 0015 0020 0028
Min -0022 -0028 -0028 -0031 -0046 -0040 -0045
Max 0032 0047 0030 0030 0026 0065 0139
At 5 level of significance
Bullish
Engulfing0000
Bullish
Hammer0010 0009
Piercing Lines -0004
Bullish Doji
Star0001
Holding period
Shooting Star 0014 0021
Bearish
Engulfing0001
Bullish
Candlestick
Descriptive
Statistics
Holding
Periods
Holding period With RSI
Filter
Hanging Man 0005 0005
Dark-Cloud
Cover-0004
Holding periodBearish
Candlestick
Patterns
Descriptive
Statistics
Holding
Periods
Average
Holding periodWith RSI
Filter
ID 100068
94
Appendix 5 Descriptive statistics of the eight candle pattern analysis for GBPUSD
1 Day 2 Days 3 Days 4 Days 5 Days 7 Days 10 Days 1 Day 2 Days 3 Days 4 Days 5 Days 7 Days 10 DaysAverage 00067 00061 00053 00049 00054 00065 00058 00061 00055 00052 00053 00057 00048 00027
Var 00000 00002 00002 00003 00004 00008 00011 00000 00001 00002 00003 00004 00007 00010
n 99 99 99 99 99 99 99 57 57 57 57 57 57 57
sqrt(varn) 0001 0001 0002 0002 0002 0003 0003 0001 0001 0002 0002 0003 0004 0004
Z score 10008 4341 3443 2727 2588 2316 1757 7854 3929 2641 2212 2127 1368 0651
P-value 000 000 000 000 000 001 004 000 000 000 001 002 009 026
SD 0007 0014 0015 0018 0021 0028 0033 001 001 001 002 002 003 003
Min -0001 -0019 -0028 -0052 -0063 -0070 -0071 -0001 -0015 -0026 -0052 -0063 -0070 -0071
Max 0039 0078 0057 0063 0063 0109 0124 0031 0045 0057 0063 0057 0081 0124
Average 00014 00033 00006 -00084 -00093 00030 00053
Var NA NA NA NA NA NA NA
n 1 1 1 1 1 1 1
sqrt(varn) NA NA NA NA NA NA NA
Z score NA NA NA NA NA NA NA
P-value NA NA NA NA NA NA NA
SD NA NA NA NA NA NA NA
Min 0001 0003 0001 -0008 -0009 0003 0005
Max 0001 0003 0001 -0008 -0009 0003 0005
Average 00076 00083 00079 00157 00170 00178 00196 00086 00100 00096 00083 00102 00100 00117
Var 00001 00002 00003 00136 00137 00138 00142 00001 00003 00004 00006 00009 00010 00014
n 197 197 197 197 197 197 197 93 93 93 93 93 93 93
sqrt(varn) 0001 0001 0001 0008 0008 0008 0008 0001 0002 0002 0003 0003 0003 0004
Z score 14462 8325 6124 1888 2040 2118 2304 9759 5952 4630 3246 3344 3118 3013
P-value 000 000 000 003 002 002 001 000 000 000 000 000 000 000
SD 0007 0014 0018 0116 0117 0118 0119 0008 0016 0020 0025 0029 0031 0037
Min -0009 -0026 -0048 -0061 -0054 -0065 -0079 -0007 -0026 -0043 -0051 -0054 -0047 -0070
Max 0037 0093 0088 1614 1614 1614 1614 0037 0093 0088 0097 0107 0117 0151
Average 00004 00003 00130 00132 00125 00112 00127
Var 00001 00003 00200 00201 00202 00204 00208
n 131 131 131 131 131 131 131
sqrt(varn) 0001 0001 0012 0012 0012 0012 0013
Z score 0427 0200 1053 1063 1007 0898 1005
P-value 033 042 015 014 016 018 016
SD 001 002 014 014 014 014 014
Min -0027 -0041 -0042 -0056 -0059 -0075 -0097
Max 0055 0067 1610 1610 1610 1610 1610
1 Day 2 Days 3 Days 4 Days 5 Days 7 Days 10 Days 1 Day 2 Days 3 Days 4 Days 5 Days 7 Days 10 DaysAverage 00070 00061 00054 00066 00086 00079 00080 00088 00098 00090 00123 00141 00132 00120
Var 00000 00001 00002 00003 00004 00006 00009 00000 00001 00002 00003 00004 00007 00012
n 97 97 97 97 97 97 97 37 37 37 37 37 37 37
sqrt(varn) 0001 0001 0001 0002 0002 0002 0003 0001 0002 0002 0003 0003 0004 0006
Z score 12056 5534 3889 3736 4265 3309 2568 8059 5146 3929 4206 4140 3036 2071
P-value 000 000 000 000 000 000 001 000 000 000 000 000 000 002
SD 0006 0011 0014 0017 0020 0024 0031 001 001 001 002 002 003 004
Min -0002 -0019 -0024 -0032 -0036 -0043 -0119 -0001 -0011 -0020 -0032 -0036 -0043 -0119
Max 0028 0042 0049 0058 0078 0088 0108 0028 0042 0049 0058 0078 0088 0108
Average -00011 00063 -00025 -00111 -00083 -00198 -00086
Var 00002 00007 00011 00022 00021 00051 00014
n 7 7 7 7 7 7 7
sqrt(varn) 0006 0010 0013 0018 0017 0027 0014
Z score -0194 0628 -0192 -0626 -0486 -0736 -0605
P-value 042 027 042 027 031 023 027
SD 0015 0026 0034 0047 0045 0071 0038
Min -0018 -0026 -0063 -0102 -0099 -0178 -0088
Max 0024 0054 0043 0047 0047 0034 0021
Average -00013 00003 -00017 -00042 -00036 -00049 -00070
Var 00001 00001 00002 00003 00008 00011 00020
n 17 17 17 17 17 17 17
sqrt(varn) 0002 0003 0003 0005 0007 0008 0011
Z score -0562 0106 -0559 -0930 -0519 -0618 -0649
P-value 029 046 029 018 030 027 026
SD 0009 0011 0012 0019 0028 0033 0045
Min -0024 -0021 -0025 -0049 -0073 -0109 -0149
Max 0009 0015 0023 0020 0026 0027 0040
Average 00010 00020 00031 00038 00018 -00009 00043
Var 00001 00002 00003 00003 00004 00006 00008
n 48 48 48 48 48 48 48
sqrt(varn) 0002 0002 0003 0003 0003 0004 0004
Z score 0622 0980 1203 1505 0648 -0253 1057
P-value 027 016 011 007 026 040 015
SD 0011 0014 0018 0018 0020 0025 0028
Min -0024 -0026 -0044 -0036 -0057 -0066 -0085
Max 0031 0044 0044 0049 0037 0058 0084
At 5 level of significance
Bullish
Engulfing0002
Bullish
Hammer0007 0011
Piercing Lines -0006
Bullish Doji
Star-0003
Holding period
Shooting Star 0013 0010
Bearish
Engulfing0009
Bullish
Candlestick
Descriptive
Statistics
Holding
Periods
Holding period With RSI
Filter
Hanging Man 0006 0005
Dark-Cloud
Cover-0001
Holding periodBearish
Candlestick
Patterns
Descriptive
Statistics
Holding
Periods
Average
Holding periodWith RSI
Filter
ID 100068
95
Appendix 6 Descriptive statistics of the eight candle pattern analysis for USDINR
1 Day 2 Days 3 Days 4 Days 5 Days 7 Days 10 Days 1 Day 2 Days 3 Days 4 Days 5 Days 7 Days 10 DaysAverage 00878 00685 00760 00671 00864 01322 00653 00978 00930 00774 00790 00750 01638 00823
Var 00250 00591 00938 01514 02612 03663 03983 00374 00726 01313 02246 03039 04316 04429
n 69 69 69 69 69 69 69 39 39 39 39 39 39 39
sqrt(varn) 0019 0029 0037 0047 0062 0073 0076 0031 0043 0058 0076 0088 0105 0107
Z score 4611 2342 2060 1432 1405 1814 0859 3156 2155 1334 1041 0850 1558 0772
P-value 000 001 002 008 008 003 020 000 002 009 015 020 006 022
SD 0158 0243 0306 0389 0511 0605 0631 019 027 036 047 055 066 067
Min -0150 -0560 -0870 -1200 -1510 -1300 -1500 -0140 -0560 -0870 -1200 -1510 -1300 -1500
Max 0790 0880 0900 1500 1790 2470 2090 0790 0880 0900 1500 1620 2470 1825
Average 00050 -00150 -00250 00450 00500 00750 00950
Var 00000 00001 00005 00004 00002 00004 00005
n 2 2 2 2 2 2 2
sqrt(varn) 0005 0005 0015 0015 0010 0015 0015
Z score 1000 -3000 -1667 3000 5000 5000 6333
P-value 016 000 005 000 000 000 000
SD 001 001 002 002 001 002 002
Min 0000 -0020 -0040 0030 0040 0060 0080
Max 0010 -0010 -0010 0060 0060 0090 0110
Average -00684 -00692 -00759 -00699 -00692 -00661 -00647 -00865 -01014 -01246 -01153 -01164 -01473 -01630
Var 71804 72368 72772 72878 73689 74004 75017 81040 81589 81685 81601 82796 82566 83881
n 549 549 549 549 549 549 549 244 244 244 244 244 244 244
sqrt(varn) 0114 0115 0115 0115 0116 0116 0117 0182 0183 0183 0183 0184 0184 0185
Z score -0598 -0603 -0660 -0607 -0597 -0570 -0554 -0474 -0554 -0681 -0630 -0632 -0801 -0879
P-value 027 027 025 027 028 028 029 032 029 025 026 026 021 019
SD 2680 2690 2698 2700 2715 2720 2739 2847 2856 2858 2857 2877 2873 2896
Min -44310 -44390 -44400 -44420 -44490 -44550 -44480 -44310 -44390 -44340 -44100 -44290 -44240 -44420
Max 1220 2020 2080 2760 2790 2320 2550 1150 1470 1590 2760 2790 2050 2300
Average 00273 09833 09691 09676 09295 08935 18775
Var 00406 547179 547892 548641 550897 552705 1076427
n 55 55 55 55 55 55 55
sqrt(varn) 0027 0997 0998 0999 1001 1002 1399
Z score 1003 0986 0971 0969 0929 0891 1342
P-value 016 016 017 017 018 019 009
SD 020 740 740 741 742 743 1038
Min -0500 -0750 -1010 -0930 -1800 -1630 -1370
Max 0790 54800 54800 54800 54800 54800 54800
1 Day 2 Days 3 Days 4 Days 5 Days 7 Days 10 Days 1 Day 2 Days 3 Days 4 Days 5 Days 7 Days 10 DaysAverage 01364 01059 01434 01296 02064 02481 03112 01450 00992 00837 01100 01362 02317 02908
Var 00210 00518 01254 02227 02393 03067 05032 00112 00486 00968 02973 02659 02819 02750
n 40 40 40 40 40 40 40 12 12 12 12 12 12 12
sqrt(varn) 0023 0036 0056 0075 0077 0088 0112 0031 0064 0090 0157 0149 0153 0151
Z score 5948 2943 2562 1737 2669 2834 2775 4743 1558 0932 0699 0915 1511 1921
P-value 000 000 001 004 000 000 000 000 006 018 024 018 007 003
SD 0145 0228 0354 0472 0489 0554 0709 011 022 031 055 052 053 052
Min -0090 -0370 -0340 -0720 -0660 -0910 -1650 -0030 -0370 -0240 -0720 -0580 -0460 -0290
Max 0670 0660 1070 1355 1440 1750 2360 0340 0505 0815 1355 1265 1250 1340
Average 00305 00740 -16351 -16328 -15828 -16388 -17586
Var 00434 01844 916844 917174 918881 917544 915284
n 33 33 33 33 33 33 33
sqrt(varn) 0036 0075 1667 1667 1669 1667 1665
Z score 0840 0989 -0981 -0979 -0949 -0983 -1056
P-value 020 016 016 016 017 016 015
SD 0208 0429 9575 9577 9586 9579 9567
Min -0290 -0960 -54939 -54939 -54939 -54939 -54939
Max 0760 1710 0790 1000 1470 1120 1160
Average -00033 -00201 -00382 -00309 -04374 -04235 -04118
Var 00204 00321 00447 00578 227763 228851 229692
n 133 133 133 133 133 133 133
sqrt(varn) 0012 0016 0018 0021 0414 0415 0416
Z score -0264 -1291 -2085 -1483 -1057 -1021 -0991
P-value 040 010 002 007 015 015 016
SD 0143 0179 0211 0240 4772 4784 4793
Min -0570 -0930 -0860 -1380 -54980 -54980 -54980
Max 0700 0690 1000 0670 0710 1970 2160
Average 00492 01023 01242 01321 01683 01635 01580
Var 00392 00676 01072 01827 03210 04220 04971
n 65 65 65 65 65 65 65
sqrt(varn) 0025 0032 0041 0053 0070 0081 0087
Z score 2003 3173 3059 2491 2395 2029 1807
P-value 002 000 000 001 001 002 004
SD 0198 0260 0327 0427 0567 0650 0705
Min -0350 -0320 -0480 -0620 -1200 -1150 -1350
Max 1090 1210 1170 1375 1885 2360 2020
At 5 level of significance
Bullish
Engulfing0128
Bullish
Hammer0183 0157
Piercing Lines -1163
Bullish Doji
Star-0195
Holding period
Shooting Star -0069 -0122
Bearish
Engulfing0950
Bullish
Candlestick
Descriptive
Statistics
Holding
Periods
Holding period With RSI
Filter
Hanging Man 0083 0095
Dark-Cloud
Cover0033
Holding periodBearish
Candlestick
Patterns
Descriptive
Statistics
Holding
Periods
Average
Holding periodWith RSI
Filter
ID 100068
96
Appendix 7 Descriptive statistics of the eight candle pattern analysis for USDJPY
1 Day 2 Days 3 Days 4 Days 5 Days 7 Days 10 Days 1 Day 2 Days 3 Days 4 Days 5 Days 7 Days 10 DaysAverage 04627 04714 04714 04802 04465 05732 11671 03676 03777 03810 04011 05360 07405 17862
Var 02363 07149 13438 15472 21160 28719 488549 01087 04250 10271 13060 18991 28927 888050
n 155 155 155 155 155 155 155 82 82 82 82 82 82 82
sqrt(varn) 0039 0068 0093 0100 0117 0136 0561 0036 0072 0112 0126 0152 0188 1041
Z score 11851 6941 5063 4806 3822 4211 2079 10095 5246 3404 3178 3522 3942 1716
P-value 000 000 000 000 000 000 002 000 000 000 000 000 000 004
SD 0486 0846 1159 1244 1455 1695 6990 033 065 101 114 138 170 942
Min -0260 -1240 -2580 -3470 -4190 -3010 -3720 -0260 -0750 -2580 -3470 -4190 -3010 -3720
Max 3730 5210 4350 5260 4710 5770 84360 1220 2010 3320 2990 4710 5770 84360
Average 05050 02725 02975 01250 00200 01800 06800
Var 01947 14612 41297 20731 40901 85650 82270
n 4 4 4 4 4 4 4
sqrt(varn) 0221 0604 1016 0720 1011 1463 1434
Z score 2289 0451 0293 0174 0020 0123 0474
P-value 001 033 038 043 049 045 032
SD 044 121 203 144 202 293 287
Min -0040 -1320 -2180 -1620 -2420 -3330 -3290
Max 0950 1280 2570 1850 2520 3300 3100
Average 05516 05495 05417 05094 05444 05442 06372 05869 06464 06567 06036 06421 05719 07360
Var 02540 06708 11223 15253 19160 29185 34308 03170 09840 13320 20250 24616 29482 30796
n 190 190 190 190 190 190 190 75 75 75 75 75 75 75
sqrt(varn) 0037 0059 0077 0090 0100 0124 0134 0065 0115 0133 0164 0181 0198 0203
Z score 15089 9247 7049 5685 5421 4391 4742 9029 5643 4928 3673 3544 2884 3632
P-value 000 000 000 000 000 000 000 000 000 000 000 000 000 000
SD 0504 0819 1059 1235 1384 1708 1852 0563 0992 1154 1423 1569 1717 1755
Min -0130 -1320 -2180 -3600 -4150 -3330 -3760 -0110 -1200 -1470 -3600 -4150 -3300 -3760
Max 2680 4170 4210 4790 5130 5810 6580 2680 4170 4210 4790 4530 5810 4820
Average -00060 00189 01251 01894 01125 01518 02117
Var 04819 08791 15597 20948 21718 28314 38831
n 181 181 181 181 181 181 181
sqrt(varn) 0052 0070 0093 0108 0110 0125 0146
Z score -0117 0271 1348 1761 1027 1213 1445
P-value 045 039 009 004 015 011 007
SD 069 094 125 145 147 168 197
Min -1880 -2970 -2760 -3470 -3690 -3850 -4420
Max 3360 2640 6200 7680 4080 5490 5600
1 Day 2 Days 3 Days 4 Days 5 Days 7 Days 10 Days 1 Day 2 Days 3 Days 4 Days 5 Days 7 Days 10 DaysAverage 04693 04789 04751 04302 03855 -04991 -05064 04929 04990 05166 04418 03647 -00148 00368
Var 01443 05276 10453 13083 19334 620913 638899 01684 06561 12318 14783 25952 33189 48136
n 120 120 120 120 120 120 120 62 62 62 62 62 62 62
sqrt(varn) 0035 0066 0093 0104 0127 0719 0730 0052 0103 0141 0154 0205 0231 0279
Z score 13534 7223 5090 4120 3037 -0694 -0694 9457 4851 3665 2861 1782 -0064 0132
P-value 000 000 000 000 000 024 024 000 000 000 000 004 047 045
SD 0380 0726 1022 1144 1390 7880 7993 041 081 111 122 161 182 219
Min -0160 -1280 -3770 -3800 -7360 -84210 -84210 -0040 -1280 -3770 -3800 -7360 -4810 -4990
Max 1520 2670 2960 2540 3400 3540 7260 1520 2670 2960 2540 3120 3130 4480
Average 0297 0563 -0032 -0018 -0037 -0153 0130
Var 0259 0265 0314 0544 0770 3447 7578
n 4 4 4 4 4 4 4
sqrt(varn) 0254 0257 0280 0369 0439 0928 1376
Z score 117 219 -012 -005 -009 -016 009
P-value 0121 0014 0454 0481 0466 0435 0462
SD 0508 0514 0560 0738 0878 1857 2753
Min -0140 0000 -0680 -0660 -0740 -2390 -3950
Max 0990 1160 0550 0980 1170 1740 1800
Average 00712 -00032 00100 -00100 -00524 -02624 -02920
Var 02879 03971 06164 12216 16133 26647 45166
n 25 25 25 25 25 25 25
sqrt(varn) 0107 0126 0157 0221 0254 0326 0425
Z score 0664 -0025 0064 -0045 -0206 -0804 -0687
P-value 025 049 047 048 042 021 025
SD 0537 0630 0785 1105 1270 1632 2125
Min -1680 -1890 -1980 -3480 -3600 -3740 -4560
Max 1140 1050 1780 2400 2740 2590 3550
Average -00151 -00058 01167 -00253 00518 00553 00973
Var 03934 06098 10455 14099 17290 22702 26855
n 45 45 45 45 45 45 45
sqrt(varn) 0094 0116 0152 0177 0196 0225 0244
Z score -0162 -0050 0765 -0143 0264 0246 0398
P-value 044 048 022 044 040 040 035
SD 0627 0781 1022 1187 1315 1507 1639
Min -2020 -1640 -1840 -3270 -2550 -3270 -3360
Max 1350 1930 2250 2260 2700 3280 3800
At 5 level of significance
Bullish
Engulfing0039
Bullish
Hammer0176 0334
Piercing Lines 0107
Bullish Doji
Star-0077
Holding period
Shooting Star 0554 0635
Bearish
Engulfing0115
Bullish
Candlestick
Descriptive
Statistics
Holding
Periods
Holding period With RSI
Filter
Hanging Man 0582 0656
Dark-Cloud
Cover0297
Holding periodBearish
Candlestick
Patterns
Descriptive
Statistics
Holding
Periods
Average
Holding periodWith RSI
Filter
ID 100068
97
Appendix 8 Descriptive statistics of the eight candle pattern analysis for USDZAR
1 Day 2 Days 3 Days 4 Days 5 Days 7 Days 10 Days 1 Day 2 Days 3 Days 4 Days 5 Days 7 Days 10 DaysAverage 00612 00633 00436 00500 00405 00355 00221 00640 00753 00492 00552 00488 00499 00218
Var 00051 00115 00404 00311 00371 00634 01094 00061 00145 00606 00420 00478 00830 01432
n 123 123 123 123 123 123 123 71 71 71 71 71 71 71
sqrt(varn) 0006 0010 0018 0016 0017 0023 0030 0009 0014 0029 0024 0026 0034 0045
Z score 9486 6547 2408 3143 2333 1564 0742 6891 5276 1682 2272 1879 1459 0486
P-value 000 000 001 000 001 006 023 000 000 005 001 003 007 031
SD 0072 0107 0201 0176 0193 0252 0331 008 012 025 020 022 029 038
Min -0017 -0193 -1491 -0776 -0771 -1411 -1956 -0016 -0193 -1491 -0776 -0771 -1411 -1956
Max 0386 0591 0756 0701 0711 1041 1245 0386 0591 0756 0701 0711 1041 1245
Average -00173 00100 02250 01815 01525 01356 01625
Var 00008 00060 00300 00186 00015 00310 00630
n 2 2 2 2 2 2 2
sqrt(varn) 0020 0055 0123 0097 0027 0124 0178
Z score -0878 0182 1837 1881 5545 1090 0915
P-value 081 043 003 003 000 014 018
SD 003 008 017 014 004 018 025
Min -0037 -0045 0103 0085 0125 0011 -0015
Max 0002 0065 0348 0278 0180 0260 0340
Average 00629 00639 00647 01014 01293 01668 01766 00650 00596 00633 00707 00639 00715 00689
Var 00029 00130 00261 02831 05460 08072 08148 00035 00181 00321 00364 00561 00624 00686
n 282 282 282 282 282 282 282 129 129 129 129 129 129 129
sqrt(varn) 0003 0007 0010 0032 0044 0054 0054 0005 0012 0016 0017 0021 0022 0023
Z score 19658 9415 6726 3200 2939 3118 3286 12478 5039 4010 4212 3064 3252 2987
P-value 000 000 000 000 000 000 000 000 000 000 000 000 000 000
SD 0054 0114 0161 0532 0739 0898 0903 0059 0134 0179 0191 0237 0250 0262
Min -0040 -0290 -0601 -0610 -1325 -1310 -1175 -0040 -0290 -0395 -0610 -1325 -1310 -1175
Max 0363 0930 1380 8521 8523 8531 8531 0363 0930 1380 1285 1390 1480 1033
Average 00006 00056 00022 00018 -00057 -00049 00112
Var 00085 00214 00259 00296 00422 00481 00671
n 129 129 129 129 129 129 129
sqrt(varn) 0008 0013 0014 0015 0018 0019 0023
Z score 0070 0435 0155 0118 -0315 -0255 0489
P-value 047 033 044 045 062 060 031
SD 009 015 016 017 021 022 026
Min -0419 -0541 -0538 -0708 -1298 -1078 -1248
Max 0440 0762 0590 0610 0408 0650 0780
1 Day 2 Days 3 Days 4 Days 5 Days 7 Days 10 Days 1 Day 2 Days 3 Days 4 Days 5 Days 7 Days 10 DaysAverage 00810 00799 00903 00956 01014 00867 00925 00467 00517 00632 00622 00693 00713 00956
Var 00328 00205 00284 00330 00525 00750 00827 00012 00124 00213 00191 00221 00396 00595
n 85 85 85 85 85 85 85 41 41 41 41 41 41 41
sqrt(varn) 0020 0016 0018 0020 0025 0030 0031 0005 0017 0023 0022 0023 0031 0038
Z score 4123 5140 4944 4852 4078 2919 2965 8579 2970 2772 2882 2983 2296 2511
P-value 100 100 100 100 100 100 100 100 100 100 100 100 099 099
SD 0181 0143 0168 0182 0229 0274 0288 003 011 015 014 015 020 024
Min -0025 -0162 -0339 -0222 -0270 -0242 -0361 0000 -0120 -0172 -0222 -0270 -0190 -0301
Max 1590 0875 0870 1030 1510 1920 1120 0153 0590 0683 0510 0520 0670 0640
Average NA NA NA NA NA NA NA
Var NA NA NA NA NA NA NA
n NA NA NA NA NA NA NA
sqrt(varn) NA NA NA NA NA NA NA
Z score NA NA NA NA NA NA NA
P-value NA NA NA NA NA NA NA
SD NA NA NA NA NA NA NA
Min NA NA NA NA NA NA NA
Max NA NA NA NA NA NA NA
Average -00288 -00236 -00082 -00125 -00316 00166 00188
Var 00080 00105 00121 00150 00173 00147 00475
n 17 17 17 17 17 17 17
sqrt(varn) 0022 0025 0027 0030 0032 0029 0053
Z score -1331 -0949 -0307 -0420 -0993 0564 0356
P-value 009 017 038 034 016 029 036
SD 0089 0103 0110 0122 0131 0121 0218
Min -0210 -0230 -0208 -0290 -0243 -0195 -0452
Max 0163 0120 0136 0226 0216 0263 0603
Average -00025 00433 00371 00491 00388 00854 01325
Var 00075 00125 00157 00230 00331 00721 01151
n 26 26 26 26 26 26 26
sqrt(varn) 0017 0022 0025 0030 0036 0053 0067
Z score -0145 1973 1509 1651 1089 1622 1991
P-value 044 098 093 095 086 095 098
SD 0087 0112 0125 0152 0182 0268 0339
Min -0246 -0116 -0120 -0182 -0193 -0243 -0323
Max 0213 0323 0343 0443 0613 0963 1143
At 5 level of significance
Bullish
Engulfing0055
Bullish
Hammer0090 0066
Piercing Lines NA
Bullish Doji
Star-0010
Holding period
Shooting Star 0109 0066
Bearish
Engulfing0002
Bullish
Candlestick
Descriptive
Statistics
Holding
Periods
Holding period With RSI
Filter
Hanging Man 0045 0052
Dark-Cloud
Cover0121
Holding periodBearish
Candlestick
Patterns
Descriptive
Statistics
Holding
Periods
Average
Holding periodWith RSI
Filter

ID 100068
3
Chapter 1
Introduction
ID 100068
4
Chapter 1 Introduction
Foreign exchange markets have been the main target for most of the market
participants to internationally trade invest and hedge foreign currency risk exposure
The uniqueness of this kind of financial market is mainly due to its high liquidity
leverage and geographical and time zone coverage According to an article published
by Bloomberg and based on information released by the Bank for International
Settlements (BIS) in September 2012 foreign currency trading may have reached $5
trillion a day exceeding the highest level reached prior the collapse of Lehman Brothers
in 2008 Though trading fell to approximately $47 trillion a day in October 2012 and
likely to fall further it is still remains the number-one financial market for all market
participants (Worrachate and Goodman 2012) check
The global financial market place has evolved significantly during the last decade
Investment and hedging strategies have changed accordingly Market participants have
been exploring different strategies that would enable them to generate maximum
returns with minimum risk Investment fund managers and risk managers for example
consult fundamental analysis value investing strategy technical analysis and any other
possible tool they could add to their trading-strategies portfolio
There are various tools that market participants use in foreign exchange markets
especially for spot foreign currency trading This is mainly because a large portion of
investment activity in the foreign exchange market is conducted through spot trading
The spot foreign exchange market has been closely examined to look for profitable
opportunities and find the best investment and trading strategies Both fundamental
analysis and technical analysis have been used to predict price movements though they
differ significantly Fundamental analysts study the cause of the price movements
whereas technical analysts examine the effect (Murphy 1999) Recently many
investment managers and individual traders integrate fundamental and technical
ID 100068
5
analysis in their investing and trading strategies which has been found very rewarding
They use fundamental analysis for long-term investment strategies and use technical
analysis for short-term trading activities According to a survey conducted by Taylor and
Allen (1992) 90 per cent of foreign exchange traders in London use price charts as
technical trading rules for short-term trading
Though technical analysis is used widely some academicians and market followers still
believe that returns are not predictable and that technical analysis cannot be used to
forecast prices Although there is a challenge of turning technical analysis into a
science a lot of studies have been conducted to examine the profitability of technical
trading rules statistically in financial markets Considering the information above this
research attempts to examine the profitability of using technical trading rules to predict
price movements of selected foreign currencies These technical rules are called
Japanese candlestick patterns that were originally used by Munehisa Homma who
made a fortune from trading them in the rice market in 1700s (Nison 2001) Details of
different Japanese candlestick trading patterns are discussed later in the research The
next sections include the rational of the research the research problems the objectives
of the research and the null hypotheses followed the limitations of the research
11 Rational of the Research
Foreign exchange markets are one of the main targets for most of the market
participants as they are considered the largest financial markets in the world Market
participants who access foreign exchange market include traders fund managers
pension fund managers banks corporate and other financial institutions Foreign
exchange markets do not only provide trading and investment opportunities but they
also offer risk managers great opportunities to trade as hedging activities that would
enable them to mitigate the foreign exchange risk exposure resulting from uncertainty in
high price volatility This research is important because it can serve different financial
ID 100068
6
institutions and traders for investment and hedging decision making and academicians
who are looking for tested trading results
This research is also important because it examines major foreign exchange currencies
that represent advanced and emerging economies which provide different trading
opportunities especially after the recent financial meltdown that started in 2007
Emerging markets have become one of the main targets for investors as they have
showed potential for high returns when compared with other advanced economies
Despite the fact that emerging markets may still present a high risk of political
uncertainly local infrastructure issues and illiquidity they still provide good opportunities
for outside investors Emerging markets have been experiencing faster economic
growth measured by their GDP though still partially impacted by the slow global
economic growth resulted from the Euro Zone debt crisis and the US fiscal cliff fears
The foreign exchange currencies include five advanced market currencies and two
emerging market currencies against the US dollar the Australian dollar the British
pound the Canadian dollar the Euro the Japanese yen the South African rand and
Indian rupee respectively There are four main reasons to select these currencies 1)
they are highly liquid 2) they are considered trade commodity and hedging currencies
3) they reflect both advanced and emerging foreign markets 4) they represent different
economies and geographical regions and 5) the data period used in the analysis is long
and very recent All these factors together make this research interesting and attractive
12 Research Problems
Based on the traditional finance research on financial market efficiency technical
trading rules cannot be used to beat the markets and generate excess returns It is
considered that financial markets are efficient and their prices consistently and fully
reflect available information (Fama 1970 Samuelson 1995) However there are a lot
of studies that have been conducted to re-test markets efficiency Some empirical
ID 100068
7
researches find that financial markets including foreign exchange markets are efficient
and that technical trading rules cannot be used to forecast future price movements
supporting the weak form of the Efficient Market Hypothesis (EMH)
On the other hand other empirical studies reject the concept of the first form of the
EMH and find that technical trading rules can be profitable indeed These findings of
successful trading rules have been documented empirically using different sample data
of different financial markets across different time periods and in different regions The
findings show that some financial markets have been found informationally inefficient
The foreign exchange market efficiency has also been examined and strong evidence
of profitable technical trading rules has been found
13 Objectives of the Research
The main objectives of the research are as follow
To statistically examine the predictive power of four bullish and four bearish
Japanese candlestick patterns to forecast price movements or returns in seven
selected foreign exchange currencies
To contribute to the literature by providing an additional research in the field of
technical analysis through examining the profitability of Japanese candlestick
patterns and with results that either support or reject the weak form of the EMH
To raise awareness of profitable trading strategies in major commodity and
emerging market foreign currencies that can provide good trading opportunities
for market participants and can help them make investment and hedging
decisions
14 Null Hypothesis
To test the weak form of the EMH and examine the predictive power of technical trading
ID 100068
8
rules of selected Japanese candle reversal patterns in foreign currencies the following
null hypotheses are tested
1 H0 All Japanese candlestick reversal patterns cannot be used to forecast foreign
currency price movements
Ha Japanese candlestick reversal patterns can be used to forecast
foreign currency price movement
2 H0 Foreign exchange markets are efficient
Ha Foreign exchange markets are inefficient
15 Limitations of the Research
There are two main limitations encountered while working on the methodology The first
one is the inability to include USDCNY in the sample as an emerging market foreign
currency this is due to the missing data of high and low rates from the beginning of the
sample period till the end of August 2005 downloaded from Thomson Reuters This
currency has received a lot of attention recently and many market participants have
shown interest in it through diversifying their portfolios emerging markets have shown
promising profitable opportunities especially after the last financial crisis Euro Zone
debt issue and the US fiscal cliff threat However since this research addresses
emerging market foreign currencies as well USDZAR is selected as a replacement for
the Chinese Yuan Many financial institutions especially airlines and logistics firms have
profits or repatriation in USDZAR adding another reason to include it in the sample
The second limitation is the lack of solid knowledge in programming to transform the
subjectivity of different variations of Japanese candlestick patterns into an objective
software or model that would both identify the patterns and test them statistically This
limitation is partially addressed through using excel formulas and statistical tests and
find the identified ones on real charts to ensure the patterns are properly reflected
ID 100068
9
The rest of the research paper is organized as follows Chapter two introduces the
Efficient Market Hypothesis (EMH) in its three forms Chapter three discusses the
difference between fundamental analysis and technical analysis as well as subjective
technical analysis versus objective technical analysis Chapter four includes an
explanation of terms and concepts and a survey of literature reviews followed by a
summary of reviews comments and criticism Chapter five introduces the technical
trading rules of the Japanese candlestick patterns and the Relative Strength Index
(RSI) Chapter six explains the methodology that includes the sample data and the
analytical tools used to test the null hypotheses Chapter seven includes the discussion
of the study analysis Chapter eight summarizes the findings and recommendations and
finally Chapter nine includes the conclusion followed by bibliography and appendices
ID 100068
10
Chapter 2
Efficient Market
Hypothesis (EMH)
ID 100068
11
Chapter 2 Efficient Market Hypothesis (EMH)
Markets with prices that consistently and fully reflect available information are called
efficient This is the building block of the Efficient Market Hypothesis (EMH) that was
brought up by Fama and was further developed by him in 1970 Fama (1970) divides
the EMH into three forms of market efficiencies depending on relevant information that
stock prices adjust to These subsets include the weak form the semi-strong form and
the strong form
The weak form states that future prices cannot be predicted by examining historical
prices and used to generate excess returns Therefore investment strategies and
decisions cannot be made based on technical analysis This means that security prices
do not have any particular pattern and future price movements are subject to
information that is not part of price series Thus security prices follow a random walk
rather than particular historical patterns and that market participants cannot profit from
market inefficiencies
The semi-strong form discusses the ability of stock prices to adjust efficiently to
information that is available to the public such as different announcements of annual
profits and stock splits It states that stock prices adjust to available new information to
the public very fast and objectively Thus market participants cannot earn excess
returns through trading that kind of information This form states that both fundamental
analysis and technical analysis cannot be used to beat the market and make superior
returns
Finally the strong form of the EMH is concerned with certain individuals or groups that
might have monopolistic access to such private information This form implies that stock
prices represent both public and private information Thus market participants will not
be able to use any kind of information to generate excess returns
ID 100068
12
In brief the EMH implies that the reaction of market participants is random Thus
market prices cannot be exploited to consistently generate any excess returns
particularly when accounting for the transaction costs of spreads and commissions
Market participants can be wrong but the markets are always right
Mixed empirical evidence exists in the literature that either support or reject the EMH
Although the EMH is supported by some academicians and market participants it has
also been disputed by many investors and researchers both empirically and
theoretically One of the important studies in the literature is the research conducted by
Lo and Mackinlay (1989) on the Random Walk Theory They examine the theory using
weekly stock returns for the period from 1962 and 1985 The results strongly reject the
Random Walk model for the whole sample
The EMH has started to lose some weight Interestingly even leading proponents of the
theory have started to divert in their belief in the validity of the random walk concept
Burton Malkiel a famous American economist and the author of ldquoA Random Walk Down
Wall Streetrdquo who has been a big supportive of the EMH has recently pointed out that
some emerging markets like China particularly Shanghai and Shenzhen financial
markets have been found inefficient (Malkiel Mei and Yang 2006)
Some EMH proponents still argue that luck is the main reason behind some successful
traders However being the most successful investor of the 20th century ranked among
the worlds wealthiest people Warren Buffett argued against them and stated that the
number of the large part of successful investors among the best money managers just
dispute the argument above Warren Buffet is among other super-investors who have
managed to beat index funds many times More than twenty seven years ago Buffet
mentioned that there were nine investors who invested in different firms they had made
more profits than what index funds did They were able to beat the market by a big
margin and performed very well even when the market was not attractive (Buffett
1984)
ID 100068
13
The latest finical crisis that started in 2007 has also renewed the criticism of the EMH
Jeremy Grantham one of the highly respected financial strategists and investors stated
that the EMH is responsible for the current financial crisis He said that the belief in the
model has made financial leaders underestimate the dangerous implications of asset
bubbles such as the dot-com and housing bubbles as stock prices were not irrational
after all He was quoted that NASDAQ would correct 75 per cent which does not exist in
an efficient market as this would indicate that growing shares have turned more
valuable (Nocera 2009)
The EMH has become controversial as evidence of substantial and lasting inefficiencies
are observed opening the door to direct and indirect criticism of all the three forms The
history of many financial markets records various cases with fund and other investments
mangers showing outstanding performance and being able to beat the market
consistently Though the weak form states stock price movements are random or
trendless given unchanged fundamental information many researchers have found
evidence that stock markets and other financial markets do trend They have also found
that there is an existence of a correlation between trending and length of the time frame
collecting another evidence to reject the weak form of the hypothesis Other studies
have revealed that market participants can make abnormal returns by trading stock
dividend and other announcements including major economic indicators and central
banks interventions in the foreign exchange markets Moreover there are different
financial anomalies that have been found in the markets and have enabled market
investors to generate excess returns These findings clearly reject the second form of
the EMH Similarly the last form of the EMH can be easily challenged one can argue
that the excess return made through insider trading is a good example that simply
disputes the strong form of the EMH
The key debate about making abnormal returns and beating the market ldquoconsistentlyrdquo
by the proponents of the EMH will always be challenged by the strategies that result in
making excess returns from trading technical trading rules dividend announcement and
ID 100068
14
financial anomalies and executing insider trading EMH proponents do not only have to
justify how the above can simply reject the three forms of the EMH but also explain the
rational of such asset bubbles and their subsequent collapse This research addresses
the weak form of the EMH and examines the predictive power of selected Japanese
candle reversal patterns as technical trading rules
ID 100068
15
Chapter 3
Fundamental Analysis (FA)
Vs Technical Analysis (TA)
ID 100068
16
Chapter (3) Fundamental Analysis (FA) Vs Technical
Analysis (TA)
Fundamental analysis and technical analysis are the two main approaches used by
funds and other finance managers to analyse a security value and monitor risk and
return tradeoffs while managing portfolios There has always been a debate on which
approach is superior to the other one and whether they substitute or complement each
other
Fundamental analysts focus on security market price and its true values In order to
invest in a stock or any other financial security fundamental analysts study the
economic factors of supply and demand which affect the price directions In particular
they assess all the factors that can affect the security market price in order to determine
the intrinsic value of that security (Murphy 1999) Fundamentalists look at the book
value and examine financial statements and use price-to-book ratio Earnings are
another key factor that reflects the income power of a stock using the price-earnings
ratio These two ratios are important for many fundamentalists because they show the
deviation of the shares from asset backing of the security The second ratio of price to
earnings shows the deviation of the shares from the earning power of the stock
(Raymond 12) So if the intrinsic value is below the market price this means that the
security is overpriced and should be liquidated However if the intrinsic value is above
the market the price it means that the security is underpriced and it should be added to
the portfolio
On the other hand technical analysts believe that fundamental factors of securities are
discounted and accounted for in the market price itself Technical analysts study the
market action as they believe that prices move in trends and that history patterns in
financial markets repeat themselves They forecast future market prices through
examining short- intermediate- and long-term trend directions price patterns technical
ID 100068
17
oscillators time cycles inter-market analysis and other technical tools (Murphy 1999)
As for the fundamental analysis the technical analysis has also attracted a lot of
investors practitioners and academicians The recognition of historical price
movements to forecast future directions goes back to a number of editorials written by
Charles Dow published between 1900 and 1902 in Wall Street Journal These
publications have encouraged further research and revisit of existing literature to assess
the profitability of technical analysis and test the validity of the EMH
Nowadays technical analysis is widely used by many big institutional investors and
other market participants in their trading and investing strategies The power of
mathematics of artificial intelligence as well as price pattern identification software has
been growing so drastically (Raymond 2012) The globalization and the integration of
different financial markets worldwide along with the advanced technology have enabled
technical analysts to adjust their trading strategies very rapidly when there are major
movements These speedy tools are not available for the fundamentalists
One could argue against each analysis performance Many big fund managers are
fundamentalists such as Warren Buffet John Templeton Peter Lynch and Liu Yang
They follow value investing and fundamental analysis in their investment decisions
Warren Buffett avoided IT shares prior the IT bubble at the time investors were laughing
at him At that time he acknowledged he should get a ldquoDrdquo grade for his portfolio
performance Another credit that goes for the value investing approach is when John
Templeton went for short positions on IT IPO when other traders were celebrating their
big returns In these cases both fundamental and value investing analysis won at the
end However a lot of fundamental analysts were caught by surprise in the sudden
collapse in some stock markets In 2011 Hong Kong stock market collapsed when the
market PE was not expensive at all at that time That is one of the situations when the
fundamentalists fell in the value trap (Raymond 2012) This brings the importance of
technical analysis in spotting trend changes and potential reversals well ahead
ID 100068
18
A lot of studies have been conducted to examine the ability of fundamental and
technical analyses to assist funds and risk mangers to make correct decisions
Evidence of the profitability of technical analysis is explored in details in the literature
review section Other studies have gone further by examining the ability of integrating
both analyses to optimize and further fine-tune investment and risk management
strategies Bettman Sault and Welch (2006) propose an equity valuation model which
integrates both analysis Their sample includes US listed firms from January 1983 to
December 2002 The results confirm that each analysis performs well when applied
separately However the authors find that the integration of fundamental and technical
analysis produces superior results Thus the finding confirms the nature of both
analyses as complements rather than substitutes Cooper (2011) also provides a simple
framework that integrates both technical and fundamental analyses His paper is
expository in nature and explains the concepts without any mathematical evidence It
addresses the challenges of integrating technical and fundamental analyses in an
optimum manner It opens the door for practitioners and academicians to use the ideas
in their testing models and explore the integration of both analyses in the future
The literature shows evidence of a growing success of using technical and fundamental
analyses as complements in the trading strategy and investment decisions In fact both
analyses forecasting the market attempt to resolve the same issue of determining future
price directions The fundamental analyst examines the cause of the market direction
whereas the technical analyst studies the effect At the start of major market moves
usually fundamental analysts are not able to explain what the market tends to do This
is the market stage when the two approaches fail to agree with each other However at
some stage later the two approaches do come back into sync but not early enough for
the trader to react Another explanation for the discrepancies between the two is that
market price movements tend to lead fundamentals Since the known fundamentals
have already been accounted for in the market prices are currently responding to
unfamiliar fundamentals History records that some of the major bull and bear markets
have started with little or zero perceived change in the fundamentals At the time these
ID 100068
19
changes became familiar the fresh trend is already in place With the passage of time
technical analysts can develop growing confidence in their price chart signals and they
become among the minority who can spot a change in trend directions They know at
some stage that the reasons for that trend reversal will become known to others
Most analysts categorize themselves as either chartists or fundamentalists but in real-
life situations there is an overlap A lot of fundamental analysts have some basics
about chart and trend analysis Similarly many chartists are aware of some important
fundamentals The main challenge is that sometimes price charts and fundamentals
conflict with each other (Murphy 1999)
Last but not least if a trader has a choice between the two approaches the choice
would logically be the technical analysis By default technical analysis includes the
fundamentals If the fundamentals are accounted for in the market price it makes less
sense to study those fundamentals In other words chart analysis has become a
shortcut of fundamental or value investing analysis Given the explanation above it
makes sense that one would depend on technical analysis in trading or investment
decisions It is doubtful that anyone can depend solely on fundamentals ignoring the
timing advantage of the technical analysis (Murphy 1999) The explored literature in the
literature review chapter represents different studies that examine the predictive power
of using technical analysis in financial markets with a focus on foreign currency
markets
Technical analysis is further divided into subjective technical analysis and objective
technical analysis introduced in the next section
ID 100068
20
31 Subjective Analysis Vs Objective Analysis
Technical analysis can be classified into two categories subjective and objective
technical analysis (TA) Subjective TA refers to methods and patterns of analysis that
cannot be clearly defined This leads to the conclusion that technical analysts are open
to personal views and interpretations when they use their technical trading rules This
means that it is possible for different analysts using the same method of same data
sets to have different findings Thus subjective trading rules cannot be tested and they
are exempted from empirical examinations Examples of subjective TA can include
Gann Lines trend channels price chart patterns and divergences (Aronson 2007)
On the other hand objective TA is clearly defined When an objective trading rule is
applied on a market data set its signals are very clear and there is no room for
ambiguity This helps simulating technical methods on different historical data and
identifying their performance level accuracy In other words it allows back testing Thus
any objective method can be repeatable it enables technical analysts and
academicians to re-test previous findings of profitable technical trading rules and
perhaps refute current statistical evidence Examples of objective TA include moving
average crosses (Aronson 2007)
In a nutshell one can distinguish between subjective and objective TA through using
the programmability criterion that is a method is considered objective only if it can be
implemented in a computer programme that can generate clear market positions Any
other technical trading methods that cannot be programmed become subjective by
default Subjective TA can be eliminated either through a shift into objective methods or
rejection (Aronson 2007)
Aronson (2007) classifies TA into four main categories 1) subjective TA 2) objective TA
with unidentified statistical significance 3) objective TA that does not have statistical
ID 100068
21
significance and 3) objective TA of statistical significance The first category refers to
analysis methods that cannot be implemented into a programmed algorithm and be
back tested whereas the other three categories fall under objective methods To
explain further the second category includes the methods that have been tested but
their findings have not been examined for statistical significance The third category is
considered useless even though the values have been back tested and evaluated with
statistical methods they have been found of no value whether individually or when used
in combination with other technical trading rules Most of objective technical trading
rules fall under this category This is due to the complexity and randomness of the
financial markets that make it difficult to predict The fourth and the last category
includes the objective methods that can be back tested and produce statistically and
economically significant results Some individual objective methods are useful however
since financial markets are very complex and random rules will have more value if they
are combined with other trading rules (Aronson 2007)
It has been very challenging not only to move TA to a science which is transforming
subjective TA into objective TA but also to convince analysts who have been very
proud of their technical trading rules of the importance of the statistical significance
tests and results A good example in the literature that attempts to transform subjective
TA into objective TA is done by Chang and Osler (1999) They objectify the price
pattern of head and shoulders after facing a lot of problems Among the main challenge
faced is setting up the pattern parameters as in reality the pattern does depart from the
ideal one The authors decide to define objective rules that could discriminate valid from
invalid head-and-shoulder patterns These objective rules include percentage filters
known as an Alexander filter similar to a zigzag indicator that can identify peaks and
troughs They further develop innovative approaches that could qualify the pattern such
as vertical and horizontal symmetry and the time taken to form the pattern (Aronson
2007)
ID 100068
22
There are a lot of valid attempts that have been observed in the literature The literature
review section provides various studies that attempt to test different trading rules
statistically
ID 100068
23
Chapter 4
Literature Review
ID 100068
24
Chapter (4) Literature Review
This chapter is divided into two main parts explanations of terms and concepts found
later in the literature reviews and a survey of literature reviews
41 Explanation of Terms and Concepts
Bootstrap is a method that derives a sampling distribution of the test statistic
through re-sampling with substitution from an original sample (Aronson 2007)
Data mining is the process of searching for patterns models and predictive rules
in large data (Aronson 2007)
Data mining bias is the expected variation obtained by different experiments
between the observed performance of the best observed performance and its
expected performance (Aronson 2007)
Head and shoulder and double top price patterns are pictures appear on price
charts that can be used to predict price movements
Japanese candlestick patterns are formations that are derived from open high
low and close prices they can be of one-day or more that have reversal and
continuation predictive power
Monte Carlo simulation is a common method used to solve mathematical issues
through random sampling in order to test the statistical significance of back-
tested data (Aronson 2007)
NOVA is a statistical test that tests the difference in mean returns between
multiple groups
ID 100068
25
42 Survey of Literature Reviews
Over the past three decades researchers have provided good evidence that the foreign
exchange markets are inefficient disputing the Random Walk Theory and the EMH
There is trustworthy evidence that simple technical rules or a combination or trading
rules applied by a wide range of market participants have proven to have predictive
power of security prices Thus the reality that simple trading rules generate abnormal
large returns in financial markets indicates a serious challenge to the traditional market
hypotheses To test the predictive power of technical analysis over different time frames
and data samples researchers have examined various financial markets of stocks
foreign exchange bonds and commodities Some findings show strong evidence of
profitable technical trading rules whereas others show poor or no evidence
This section explores different studies that examine the profitability of various technical
trading rules in different financial markets More attention is given to the technical
trading strategies of Japanese candlestick patterns and samples covering foreign
currency markets where possible The literature reviews focus primarily on the
outcomes of applying technical analysis and its predictive value of future price
movements The literature survey is divided into four main streams the first part covers
the studies done in the stock and foreign exchange markets that show evidence of
profitable technical trading rules the second part covers the researches that use
technical analysis in presence of central bank interventions The third part reviews
studies that apply Japanese candlestick trading rules The fourth part includes the
studies that find poor or no evidence of profitable technical trading rules Questionnaire
surveys on the application of technical analysis in trading decisions are also included in
the literature Each part reviews the literature chronologically from the oldest to the most
recent ones to reflect the development that has been made since early 1980s
Examining the profitability of technical analysis in financial markets has started very
early Longworth (1981) uses CADUSD spot and forward rates from July 1970 to
ID 100068
26
October 1976 He finds that forward rates can be predicted using spot reference rates
concluding that markets are inefficient
Brock Lakonishok and LeBaron (1992) examine two simple common trading rules
moving averages and range breakouts in the DJIA from 1897 to 1986 Having applied a
standard statistical analysis of the bootstrap method the results reveal strong evidence
of the technical trading strategies applied The buy signals are found to constantly
produce higher returns than sell signals Also the returns following buy signals are less
volatile compared with the returns generated by sell signals
Levich and Thomas (1994) examine the impact of technical trading strategies in the
foreign exchange market by using futures contracts of a 15-year time span Their data
sample covers the years from 1976 to 1990 After applying bootstrap methodology and
a statistical approach thousands of new exchange rate series are randomly generated
each tested seriesrsquo profitability is examined using a technical analysis approach The
empirical results of profit significance in both original series and randomly generated
series are compared The findings reveal that technical trading systems are significantly
profitable Although some profits declined during the five years of 1986-90 on an
average the profiles are found still positive and significant in some periods Thus these
results provide evidence of profitability and statistical evidence of how technical trading
systems are profitable in the foreign exchange market
Gencay (1997) also finds strong evidence of profitable simple technical trading rules in
daily Dow Jones Industrial Average Index Having examined linear and nonlinear
predictability of stock market return using historical buy and sell signals of the moving
average rules the result shows evidence of nonlinear predictability in the US stock
markets supporting the results found by Brock Lakonishok and LeBaron (1992)
Osler (2000) examines the technical trading rules of support and resistance levels
provided by six foreign exchange trading companies The data sample covers the
ID 100068
27
period from 1996 to 1998 The statistical test of the bootstrap technique is used The
results show that signals are very successful in forecasting trend interruptions or
reversals The findings also show that some companies are more accurate in
indentifying turning points in exchange rate trends Overall the prediction in USDJPY
and GBPUSD rates are more accurate than the prediction in DMUSD Also it is found
that the predictive power of the support-resistance levels tend to last five working days
at least once the levels are published to the public
Osker (2003) examines clustering of foreign currency stop-loss orders as well as take-
profit orders as they are considered main orders when placing trading orders His data
covers 9655 orders with a total of more than $55 billion from August 1 1999 to April
11 2000 His sample covers three foreign currencies USDJPY EURUSD and
GBPUSD He uses the crowded orders to provide an explanation for two common
predictions of technical analysis First trends are likely to reverse directions at support
and resistance areas Second trends are likely to move faster after prices penetrate
such levels He finds that take-profit orders gather at round numbers explaining the first
profit forecasting whereas stop-loss orders concentrate heavily just after round
numbers this explains the reason behind the second forecasting These findings are
obtained based on the closing rates of both orders placed at the famous dealing bank of
National Westminster The order clustering phenomenon is due to different common
reasons round numbers are easy to remember and to place orders at as they are the
first to come to anyonersquos mind The final results show that technical trading rules can be
profitable for market participants
Omrane and Oppens (2004) use other technical trading strategies They examine the
presence of price chart patterns in intra-day EURUSD using both close and high-low
prices They search for 12 chart patterns and study them based on the two criteria of
profitability and predictability Using the statistical methodology of Monte Carlo
simulation to calculate resultsrsquo statistical significance the authors find evidence of chart
ID 100068
28
patterns in the foreign exchange market The results reveal that more than 50 per cent
of the charts that are identified has high predictability
Similarly Shik and Chong (2007) also find technical trading rules profitable in foreign
exchange markets They apply moving averages and Relative Strength Index (RSI)
using daily rates of six foreign currencies They find that the profitability of using moving
averages is obvious even though currencies belong to various economic areas
In their paper Lento and Gradojevic (2007) examine the profitability of technical trading
rules by assessing their ability to outperform the trading strategy of buy and hold The
sample covers SampPTSX 300 Index NASDAQ Composite Index Dow Jones Industrial
Average Index and CADUSD spot exchange rate from May 1995 to December 1994
The trading strategies include moving average cross rules Bollinger Bands filter rules
and breakout rules of trading ranges After accounting for the transaction costs excess
returns are generated by moving average cross-over rules and trading range break-out
rules for the SampPTSX 300 Index NASDAQ Composite Index and the CADUSD spot
exchange rate Filter rules also earn excess returns when applied on the CADUSD spot
exchange rate The bootstrap methodology is used to determine the statistical
significance of the results The profitability of the technical trading rules is further
enhanced with a combined signal approach The results show that a combined single
strategy does outperform the buy-and-hold trading strategy even after accounting for
transaction costs
Park and Scott (2007) re-visit the historical testing measures of the profitability of
technical analysis in the empirical literature both early (1960ndash1987) and modern (1988ndash
2004) Early studies show that technical trading rules are profitable in foreign exchange
markets and futures markets only but not in the stock markets Modern studies
however reveal that technical trading rules constantly generate economic profits in
different markets It is worth to mention that although strong evidence of the profitability
of technical analysis is found in early studies many empirical researches faced a lot of
ID 100068
29
problems in their tests such as data snooping selection of trading strategies and
estimation of transaction cost Early studies are characterized with different limitations in
their tests application of very few trading strategies ignorance of trading rules risk and
statistical significance of returns absence of parameter optimization out-of-sample
verification and less attention to data snooping problems On the other hand modern
studies show an overall improvement earlier limitations encountered in the early
studies have been reduced the number of trading rules used for testing has been
increased risk of trading strategies has been given high attention both conventional
statistical tests and sophisticated bootstrap methods have been applied with an
emphasis on trading rule optimization as well as out-of-sample verification Also other
empirical factors such as order flows clustering interventions of central banks and
unstable market inefficiencies have been introduced as an explanation of technical
trading returns Final results of the study reveal that out of total modern studies of 95
56 studies find technical analysis profitable in trading 20 show negative results and 19
find mixed results
Though difficult to explain how technical trading strategies of price patterns might be
profitable Friesen Weller and Dunham (2007) provide a modal that shows evidence of
how such price pattern trading rules can be profitable in the US stock markets The data
covers a six-year period from January 1999 to December 2005 The researchers
highlight the significance of confirmation bias Traders who obtain data and trade on
that information are likely to bias their reading of subsequent information towards the
direction of their initial view This generates autocorrelations and price patterns that can
forecast future prices like the head-and-shoulders and double-top price patterns Also
the researchers find that their model can predict positive autocorrelation with sequential
price The prediction is tested and the results are found statistically and economically
significant
Stephen (2008) examines the profitability of using technical models of moving averages
and momentum that add up to 1024 technical trading rules in DMUSD He finds that all
ID 100068
30
the trading rules are profitable The profitability is mainly because of the exploitation of
exchange rate trends the result stay valid even with sub-periods trading and declining
profit during late 1980s The results of the best 25 performing models in-the-sample
period from 1973 to 1999 are almost as good as those generated in the out-of-sample
period of 2000-2004 in the majority of the cases It is worth to mention that the risk of
making losses when applying each of these models is almost zero adding another plus
to the profitability of technical analysis in trading foreign exchange currencies
Profitability of technical trading rules is examined in combination with other factors as
well Krishnan and Menon (2009) study the influence of foreign currencies technical
indicators and time frames on trading profits The research covers the period from
September 2006 to October 2008 with 1400 observations in the sample and two
durations one year and three months The currency pairs include EURUSD
GBPUSD USDCHF and USDJPY The time frames cover five minutes 15 minutes
30 minutes one hour four hours and one day The technical indicators used are five
leading and five lagging The findings reveal that using technical analysis in foreign
currency trading activities is profitable all of the currencies technical indicators and
time frames play significant roles in generating profits in foreign exchange spot markets
EURUSD is found the most profitable and the least risky The findings also show that
short ndashterm trading is riskier and of low liquidity compared to the long-term trading
Moreover the authors find that using a combination of technical indicators in a trading
system generate remarkable profits
Researchers keep exploring various trading rules scientifically Cekirdekci and Iliev
(2010) test different set ups as well as exit strategies for trading opening range
breakouts of 30-minute time frame The research examines a technical trading system
using and back tests of around 250 stocks from various industry sectors from April
2005 to April 2010 The initial tested set ups include buy and sell filters inside bar
simple and exponential moving averages a volume indicator per cent trailing exist
overbought and oversold areas of Relative Strength Index and ATR Ratchet The
ID 100068
31
results show that when combining buy and sell signals with other indicators such as
the volume indicator the opening range is a powerful model it generates significant
returns when traded with the correct stock
Similarly Holmberg Loumlnnbark and Lundstroumlm (2012) test the profitability of the trading
strategy of the ldquoOpen Range Breakout (ORB) but in the US crude oil futures prices from
March 1983 to January 2011 The ORB is a trading rule that signals entry and exit
rules once the price moves beyond predefined boundaries Using the joint distribution of
low high open and close prices over a period of time the researchers find that their
ORB trading rule significantly generates high returns
Interestingly some researchers have conducted different types of studies to have an
indication of how widely technical analysis is applied in the financial field Using a
questionnaire survey on behalf of the Bank of England in November 1988 Taylor and
Helen (1992) find that around 90 per cent depends on technical analysis in forming their
views at different time horizons The results show that technical analysis is applied
mainly for the shorter time frames for entry and exit timings Moreover technical
analysis tools are found to be the best tools for trading currencies The survey results
also reveal that fundamentals are reliable for the long term picture whereas others rely
on both fundamental and technical analyses in taking trading decisions
Shifting to the examination of technical analysis in presence of central banks
interventions both early and modern researches show the importance of such
interventions when used with trading rules in the foreign exchange markets Silber
(1994) is among the first researchers who examine the profitability of simple trading
strategies in foreign exchange markets in presence of central banksrsquo interventions His
sample covers the German mark Swiss franc Japanese yen British pound and
Canadian dollar He uses simple moving averages as trading rules He finds evidence
that technical rules can be valuable in markets where governments are found big
players The results show that government interventions provide speculators with an
ID 100068
32
opportunity to generate abnormal returns by applying simple technical trading
strategies
There are other researchers who also examine the impact of central bank intervention
on the predictability of trading rules in foreign exchange markets LeBaron (1998)
reviews some evidence that shows predictive value over future foreign exchange prices
He analyses the profitability of simple trading rules in relation with central bank activity
using intervention information from the Fed His forecasts are assessed over one day
and one week periods His sample uses weekly and daily foreign exchange rates of
Deusche mark (DM) and Japanese yen (JP) from January 1979 to December 1992 The
interest rate series used is one week Euro rates The trading rules compare the current
price with a moving average of historical prices He finds that the predictability of
exchange rates diminishes during the periods when the Fed is inactive This leads to
the conclusion that there is a positive correlation between the Fed intervention in the
market and the profitability of the trading rules used to predict foreign exchange rates
Using a genetic programming for the Duetuche mark Japanese yen British pound and
Swiss franc and US official intervention Neely and Weller (2000) show that
interventions could be considered as trading signals themselves They use simple
moving averages as trading rules covering a sample from 1975 through 1998 In fact
they donrsquot support earlier observations that find intervention activities lead to profit in the
foreign exchange markets Their findings rather show that the profitability of technical
trading rules is a result of strong and constant trends in exchange rates which
intervention is intended to turn around
Moreover analyzing daily exchange rates of USDDEM as well as daily USD and DEM
overnight Euro rates from January 1979 to July 1994 Saacke (2002) provides further
evidence of the unusual profitability of applying technical trading strategies on days
when the Fed and Bundesbank interventions take place The central banks are found to
gain returns when they intervene in foreign exchange markets and with the usefulness
ID 100068
33
of technical analysis Intervention returns and trading rule profitability are evaluated
during horizons and post interventions Exchange rates are found to react in the
opposite direction of central banksrsquo intentions in the short term but in line with their
targets in the long term The researchers find that the trading rules of using moving
averages are considerably profitable on the days when the central banks interfere The
findings also reveal that trading rules returns are still high on days in which interventions
did not take place or on preceding days This means that central banksrsquo interventions
are not the only cause of trading rule returns Shik and Chong (2007) also find out that
the technical rules correlate positively with the interventions of the central banks
There is little attention given to the Japanese candlestick patterns in the literature even
though they were widely used in rice trading activities in Japan and have been found
very powerful when combined with other technical trading rules (Nison 2003) Recent
studies on the Japanese candle patterns are found Goo Chen and Chang (2007)
examine the profitability of Japanese candlestick patterns using daily data Their sample
includes 25 shares that are partially listed in Taiwan Top 50 Tracker Fund and Taiwan
Mid-Cap 100 Tracker Fund for 12 years from 1997 to 2006 and with 2580
observations for each stock The main objective of the study is to indentify profitable
candle patterns as well as profitable holding periods that would generate abnormal
returns for investors They use six bullish single-line patterns and seven bullish candle
pasterns for ten holding periods using a stop-loss strategy as well The first group
includes the long white candle the white Marubozu the closing white Marubozu the
opening white Marubozu the dragon doji and the paper umbrella the second group
includes the hammer the bullish engulfing the piercing lines the bullish harami the
three inside up the three outside up and the tweezers bottom The t test is used to
statistically test the profitability of the patterns NOVA and Duncanrsquos various range tests
are also applied to compare the profitability of the patterns across the ten holding
periods In general the results show that there is evidence of some profitable candle
patterns at different holding periods The researchers find that the bullish reversal
patterns are the most profitable patterns and that the profitability of various candle
ID 100068
34
patterns depends on the holding periods Another finding is that the long holding
periods are appropriate for the two candle categories with few exceptions The results
also show that the -5 stop-loss strategy does improve the performance of the
candlestick trading rules
Lana Zhanga and Xiongb (2011) develops a model that visualizes Japanese
candlestick patterns in Chinese stock markets The model transforms the prices of
open close high and low into ldquofuzzyrdquo candle charts The sample includes selected
stocks listed in four marketsrdquo SSE A Share SSE B Share Shenzhen A share and
Shenzhen B sharerdquo from January 2000 to December 2010 The results show that the
model is able to identify the reversal patterns and that it can be used to indentify early
stock reversal signals through ldquosymptoms sequencerdquo The researchers will further
enhance the model with additional fuzzy variables to reflect candlestick lines such as
the position of body and shadows to fine-tune the prediction results
In addition to the previous studies Haibin Zhao and Wang (2012) examine the
performance of the Japanese candlestick patterns in predicting equity returns using
both in-sample and out-of-the-sample forecasts Monthly data of main global financial
markets are used these markets include ldquoFTSE100 DAX CAC40 in Europe
NIKKEI225 (NK) HangSeng (HS) and Strait Times (ST) in Asiardquo Also monthly data of
Standard and Poorrsquos 500 (SampP500) is collected to find out if the candle patterns have
reached the US markets as well The researchers find that the Japanese candlestick
patterns do have predictive power in both in-sample and out-of-sample forecasts In all
the cases the Japanese trading rules are found superior to the simple buy-and-hold
Also it is found that there is important information that spreads out from the US stock
market to the other financial markets
Lu Shiu and Liu (2012) investigate the profitability of candle patterns that are composed
of two lines through buying on bullish (bearish) patterns and holding the trades till
bearish (bullish) patterns take place Their sample includes daily prices of stocks listed
ID 100068
35
in the Taiwan Top 50 Tracker Fund from 29 October 2002 to end of 2008 The
researchers study three bearish reversal patterns and three bullish reversal patterns
These are the bearish engulfing the harami the dark-cloud cover the piercing lines the
bullish engulfing and the bullish harami respectively The bootstrap methodology is
used The results show that the three bullish patterns are found generally more
profitable than the beaish patterns The returns of the three bullish patterns are found
statistically significant in the Taiwan stock market
On the other hand some researches find conflicting results or even variations within
results that are not in line with the findings above The results vary from lacking of
evidence of the profitability to declining profits when simple trading rules are applied
Levich and Thomas (1993) note weak evidence that the profitability of their rules
declines in their final subsample period 1986 to 1990 Lee and Mathur (1996) apply
moving averages and channel trading systems on ten currency pairs in foreign
exchange spot market Their sample includes ldquoAUDJPY GBPJPY CADJPY
DEMGBP DEMITL DEMJPY DEMCHF CHFGBP and CHFJPYrdquo They find both
trading systems are not profitable
LeBaron (2002) finds that the abnormal returns resulting from applying a 150-day
moving average from June 1973 to August 2002 decrease during the 1990s His
sample covers the British pound German mark and Japanese yen He assumes that
data snooping or economic issues could be the main reason for earlier positive results
Applying simple moving average trading rules on longer time periods Olson (2004) also
finds different results on the profitability of the moving average trading rules He re-
customizes moving average rules in a five-year period from 1971 to 1995 He then tests
the trading rule in 5-year out-of-sample period He finds that trading rule returns decline
over time after 1970s to approximately zero by the 1990s This suggests that the
inefficiencies of markets that are reported in earlier studies might have been temporary
Furthermore Lento and Gradojevic( 2007) find that individual trading rules do not
ID 100068
36
generate any profits above the buy-and-hold strategy when the technical rules are
applied in the DJIA
Pukthuanthong-Le and Thomas (2008) re-assess the ability of technical trading rules to
statistically and economically generate significant returns Their data covers liquid
currency futures from 1975 to 2006 The results show that the profitability of trend
following decline for the major currencies of British pound Japanese yen German mark
Euro Canadian dollar Swiss franc and Australian dollar Moreover the researchers
find that the related cross exchange rates of the major currencies also decline in the mid
of 1990s
Poor evidence of profitable candlestick strategies is also found in the literature
Brashears and Elam (1993) explore the profitably of the Japanese candlestick trading
and their ability ot forecast reversals in the cotton futures market from 1973 to
1990Their sample includes 13 candle reversal patterns The bullish patterns include the
hammer the engulfing pattern the morning star the doji star the piercing lines and the
tweezers bottom The bearish patterns include the bearish engulfing the upside gap
two crows the hanging man the dark-cloud cover the shooting star the evening star
and the tweezers top These patterns are programmed individually using MetaStock
programme The final results show that no definite evidence of predictive power for the
Japanese candle patterns in cotton futures markets The researchers recommend that
additional studies should be conducted to re-examine the predictive power of the
Japanese candle trading rules in the future
Marshall Young and Rose (2005) study the candle patterns in actively traded stocks
listed in the DJIA The sample includes data from 1992 to 2002 the starting year is
selected to make sure that market participants had basic background of the different
Japanese candle trading rules and they already started using them at that time in their
trading strategies The sample includes 28 candle patterns that fall under four main
categories bullish single lines bullish reversal patterns bearish single lines and bearish
ID 100068
37
reversal patterns To test the results they use the bootstrap methodology to generate
random prices of open high low and close Contrary to the researchersrsquo expectations
the final results show no evidence of profitable candle patterns in DJIA thus supporting
the weak form of the EMH
Moreover Young and Marshall (2007) test the predictive power of the Japanese
candlesticks in the US stock market particularly the DJIA Index from 1992 to 2002 The
authors use the t test and the bootstrapping methodology to test the results statistically
The Japanese candle patterns are technical trading rules that have been used in Japan
for centuries The use of these candle patterns has been growing among market
participants all over the world because they used to be successful with the rice trading
in Japan The authors use 28 candle patterns that vary from one- to three-candle
patterns These patterns include the long white the white the Marubozu the hammer
the bullish harami the three outside up the gravestone doji the shooting star the dark-
cloud cover and the tweezers top The findings show that candle trading rules are
statistically not profitable None of the single and multiple candlestick patterns bullish or
bearish give timing signals The authors recommend to use candlestick trading rules in
combination with other market timing tools
The section below summarizes the different findings in the literature above along with
comments and criticism
43 Summary Comments and Criticism
From the previous literature the studies have reported mixed results about the success
of technical trading in foreign exchange and stock markets Abnormal returns are
observed in many studies while other studies report less success of technical trading
rules
ID 100068
38
Longworth (1981) uses CADUSD spot and forward rates and finds that forward rates
can be predicted using spot rates concluding that markets are not efficient Brock
Lakonishok and LeBaron (1992) examine moving averages and range breakouts and
find that buy signals constantly produce higher returns than sell signals Levich and
Thomas (1994) find technical trading rules are significantly profitable on contracts of 15-
year currency futures Later on Gencay (1997) also find strong evidence of profitable
simple technical trading rules in daily DJIA supporting the previous results Osler
(2000) finds the technical trading rules of support and resistance levels are powerful
predictive indicators Clustering of foreign currency stop-loss orders and take-profit
orders in major foreign currencies are clear indicators of profitable technical trading
rules (Osker 2003) Omrane and Oppens (2004) find evidence of profitable chart
patterns that are tested statistically
More recent studies also provide strong evidence of profitable simple moving average
trading rules Shik and Chong (2007) find the profitable simple moving average rules
when moving averages and Relative Strength Index (RSI) are applied on six foreign
currencies Lento and Gradojevic (2007) further enhance technical trading rules through
a combined signal approach The results show that the strategy does outperform the
buy-and-hold trading strategy Park and Scott (2007) re-visit the historical testing
measures of the profitability of technical analysis in the empirical literature and find the
majority of the studies find technical analysis profitable Similar to the results found by
Omrane and Oppens (2004) in the foreign exchange market Friesen Weller and
Dunham (2007) provide a modal that shows evidence of how price pattern trading rules
can be profitable in the US stock markets
Moreover Stephen (2008) finds moving averages and momentum in German Mark
profitable Results of Krishnan and Menon (2009) reveal that all currencies technical
indicators and time frames play significant roles in generating profits in foreign
exchange spot markets Cekirdekci and Iliev (2010) find trading opening range
breakouts when combining buy and sell signals and other indicators a powerful model
ID 100068
39
This is in line with the results found by the earlier researchers (Lento and Gradojevic
2007 Krishnan and Menon 2009) In very recent studies Holmberg Loumlnnbark and
Lundstroumlm (2012) find ldquoOpen Range Breakout (ORB) in the US crude oil futures prices
significantly generates high returns
Other studies both old and modern examine the central banksrsquo interventions along with
trading strategies in the foreign exchange markets The researchers find that simple
trading rules are considerably profitable on the days when the central banks interfere
Silber (1994) is among the first researchers who find evidence that technical rules can
be valuable in markets where governments are found big players LeBaron (1998)
reviews some evidence of profitable simple trading rules in presence of the Feb central
bank activity He finds that the predictability of exchange rates diminishes during the
periods when the Fed is inactive This leads to the conclusion that there is a positive
correlation between the Fed intervention and the profitability of the technical trading
rules Neely and Weller (2000) show that interventions could be considered as trading
signals themselves Moreover Saacke (2002) provides further evidence of the unusual
profitability of applying technical trading strategies on days when the Fed and
Bundesbank interventions take place Shik and Chong (2007) also find that the
technical rules correlate positively with the interventions of the central banks
Evidence of profitable Japanese candle patterns is also found in the literature Goo
Chen and Chang (2007) find evidence of some profitable candle patterns at different
holding periods with bullish reversal patterns as the most profitable patterns The model
developed by Lana Zhanga and Xiongb (2011) also show that it is able to identify the
reversal patterns and that it can be used to indentify early stock reversal signals through
ldquosymptoms sequencerdquo Haibin Zhao and Wang (2012) find in all the cases the
Japanese trading rules are found superior to the simple buy-and-hold Lu Shiu and Liu
(2012) find evidence of three profitable bullish patterns in the Taiwan stock market
ID 100068
40
On the other hand some researches find conflicting results or even variations within
results that are not in line with the findings above The results vary from lacking
evidence of profitable technical trading rules to declining profits when simple trading
rules are applied Levich and Thomas (1993) note weak evidence in their final
subsample period 1986 to 1990 Lee and Mathur (1996) apply moving averages and
channel trading systems on ten foreign currencies and find both trading systems are
not profitable LeBaron (2002) finds that abnormal returns resulting from applying a 150-
day moving average decrease during the 1990s Olson (2004) also finds different
results on the profitability of the moving average trading rules He finds that trading rule
returns decline over time after 1970s to approximately zero by the 1990s Moreover
Lento and Gradojevic( 2007) find that individual trading rules do not generate any profits
above the buy-and-hold strategy in the DJIA In more recent studies Pukthuanthong-Le
and Thomas (2008) find that the profitability of trend following decline in major
currencies
Evidence of profitable Japanese candle patterns is also found poor Brashears and
Elam (1993) find indefinite evidence of predictive power for the Japanese candle
patterns in cotton futures markets Marshall Young and Rose (2005) find no evidence
of profitable candle patterns in DJIA Similarly Young and Marshall (2007) find no
evidence Japanese candle patterns in the DJIA
Though the majority of the findings in the literature supports the profitability of technical
analysis in foreign exchange markets as well as other financial markets the weak
evidence found in some studies need to be examined closely
In order to support or reject the theory of the Random Walk and Efficient Market
Hypothesis the debate on the mixed results can be objectively made The weak
evidence of profitable trading rules found by some researchers since 1980s (Brashears
and Elam 1993 Levich and Thomas 1993 Lee and Mathur 1996 LeBaron 2002
Olson 2004 Marshall Young and Rose 2005 Lento and Gradojevic 2007 and Young
ID 100068
41
and Marshall (2007) is opposed by strong evidence found by others using large
samples and targeting different markets in different regions (Longworth 1981 Brock
Lakonishok and LeBaron 1992 Gencay 1997 Osler 2000 Saacke 2002 Osker
2003 Goo Chen and Chang 2007 Shik and Chong 2007 Lento and Gradojevic 2007
Park and Scott 2007 Stephen 2008 Cekirdekci and Iliev 2010 Lana Zhanga and
Xiongb 2011 Haibin Zhao and Wang 2012 Loumlnnbark and Lundstroumlm 2012 and Lu
Shiu and Liu 2012)
Most of the trading rules tested in the literature are very simple such as moving
averages and range breakouts Moving averages can be easily modeled and tested
however it is a lagging indicator and generates false signals when used in range
trading trends or periods Also the poor evidence of profitable candle trading rules
could be due to the samples taken for the periods prior 2000 in which the knowledge of
these trading rules might not be as solid as during 2000s and onwards The
inconsistency in using statistical tests and the issue of data snooping may lead to
conflicts in results These are some of the factors that could explain the weak evidence
in the literature The strong evidence and the conclusion of inefficient markets in other
studies are challenged by the methodologies and standard statistical analysis used to
examine the profitability of technical analysis The different bubbles and major bullish
trends that usually lead to excess price volatility periods and the ignorance of good
testing procedures that address data snooping and other issues could be some of the
main reasons the findings are positively biased This is supported by the findings found
by Park and Scott (2007) Most empirical researches are subject to various issues in
their testing processes such as data snooping different selections of trading rules in-
and out-of-sample data search technologies and difficulties in estimating risk and
transaction costs
Furthermore the impact of central bank activities on the returns is assumed to be
reflected in the market price Technical analysts should not consider them as a major
source of the predictive power of some technical trading rules as found by the
ID 100068
42
researchers above Intervention activities are similar to other major economic data that
affect exchange rates and alert traders to take positions once prices are close to
support and resistance levels However technical analysis is known for discounting all
the known and unknown information
Regarding the application of trading rules financial markets are too complex to be
predicted by a single trading rule A trading system that is a combination of different
trading rules is found to work better that a single technical tool It is always
recommended to use a combination of good technical indicators as filters in which the
majority will agree on clear signals The findings about the Japanese candlestick
patterns are just a simple message that single technical tools fail most of the time They
should rather be used in combination with other powerful technical tools that can best
work during the underlying trend
After consulting the mixed results it is very important to consider important key factors
that would have a high impact on the overall research findings in regard to the
profitability of technical trading rules in financial markets The reasons for the existence
of these abnormal returns or weak evidence may not be easy to interpret and justify
However there are certain obvious factors that play major roles in reaching final results
of any study that need a careful examination and testing These factors include 1) the
possibility of changing trading rules using different time frames in line with the major
underlying trend 2) the consistency of profitable trading rules 3) the liquidity of the
financial markets as it would be more incentive for market participants to trade away
inefficiencies 3) the bullish and the bearish cycles of the markets 4) the efficiency of
trading systems that are made of powerful technical trading indicators suitable to the
underlying market trends 5) clear understanding of the trading rules of lagging and
leading indicators 6) understating different objectives of major players including
activities of central banksrsquo interventions 7) the usage of sophisticated non-linear
models 8) the usage of good statistical testing procedures addressing data snooping
ID 100068
43
and transactions costs and 9) the importance of having good parameters in place that
would turn technical analysis into a science
This research contributes to the literature by testing the predictive power of the
Japanese candlestick reversal patterns in the foreign currency market The findings are
compared to all the findings of profitable technical trading rules in general and to the
results pertaining to the studies conducted on Japanese candlestick patterns
ID 100068
44
Chapter 5
Introduction to Technical
Trading Rules
ID 100068
45
Chapter 5 Introduction to the Technical Trading Rules
The technical trading rules of the Japanese candlesticks are very popular The
Japanese have applied this charting along with its technical rules for centuries Its
popularity arises from its method to display security data for chart analysis and the use
of certain candlestick combinations that reflect the psychology of the market
participants The data of the Japanese candlesticks uses the same data of standard bar
charts open high low and close However the visual effect of the candlestick charts
provide a much better picture of the market that is easily displayed interpreted and
analyzed The price actions look like candles with wicks or shadows That is the reason
why they are called candlesticks In its simplest form a white body means that the close
is higher than the open whereas the black body means the close is lower than the high
There are different shapes for the Japanese candlesticks They also come in different
combinations based on the relationship between open high low and close prices
There are various patterns of Japanese candlesticks a Japanese candlestick pattern
may consist of one candlestick or a combination of two or more but never more than
five Most of the patterns can be used to warn of reversal levels in the markets These
patterns can be bearish bullish or continuation Generally reversal patterns of bullish
implications have their inverse patterns which have bearish meaning The third category
includes a few patterns that fall under continuation patterns Similar to the reversal
patterns continuation patterns have bullish patterns and their opposite bearish patterns
in relation to the previous trend that takes place prior to the consolidation phase
Examples of bullish patterns that warn a reversal of the trend from a downtrend to an
uptrend includes the piercing lines the morning star the bullish Doji Star the bullish
engulfing the hammer the bullish harami and the kicking patterns Examples of bearish
patterns that warn a trend reversal from an uptrend to a downtrend includes the dark-
cloud cover the evening star the hanging man the bearish engulfing the shooting star
the abandoned baby and the bearish harami The continuation patterns include the
ID 100068
46
rising and the falling three methods the separating lines the downside gap three
methods and the three-line strike (Murphy 1999) Appendix 1 shows the different
Japanese candlestick patterns Moreover the Japanese candlestick patterns can be
used jointly with other western technical tools such as oscillators and other technical
indicators which can create a powerful synergy of techniques
Below is a brief description of each of the eight Japanese candlestick reversal patterns
used in the analysis These patterns follow the descriptions provided by Nison (2001)
The description of the candle patterns are followed by an explanation of the common
technical indicator of the Relative Strength Index (RSI) that is used along with three
candle patterns as a filter
Four bullish and four bearish candle patterns are used in the analysis of this research
The bullish patterns include the bullish engulfing the piercing lines the bullish hammer
and the bullish doji star whereas the bearish patterns include the bearish engulfing the
dark-cloud cover the hanging man and the shooting star The following order of the
patternsrsquo descriptions is based on the similarity and the inverse relationship of the
patterns for easy understanding A snap shot of each candle pattern that are indentified
in the analysis using excel formulas discussed under methodology is provided
The bullish engulfing pattern is a major reversal signal that consists of two real bodies of
opposite colours The market is in a downtrend then a long white candle closes higher
and engulfs the previous black candle This shows that the bulls have taken over from
the bears and that the buying pressure becomes stronger than the selling pressure The
bearish engulfing pattern is just the opposite The market is in an uptrend then the last
white candle is wrapped by a black long body signaling a top reversal This means that
the selling pressure has overwhelmed the buying pressure There are three criteria for
the engulfing pattern 1) the market should be clearly in an uptrend or downtrend even
if it is a short-term trend 2) there are two candlesticks that form the pattern in which the
second body must wrap the previous real body and 3) the colour of the second real
ID 100068
47
body should be the opposite of the first real body colour (Nison 2001) Figures (1) and
(2) show the two patterns that are identified in USDINR and EURUSD pair currencies
Figure (1) The bullish engulfing pattern in USDINR
Figure (2) The bearish engulfing pattern in EURUSD
ID 100068
48
The piercing lines are a two-day bullish pattern that signals a bottom reversal after a
downtrend The first candlestick is a black body and the second day is a long white
body The second day opens with a downside gap below the low of the previous day
and closes higher and above the mid-point of the first black body The greater the
penetration of the white bodies into the previous black body the greater the chance for
bottom reversal An ideal pattern requires a second day penetration of more than 50
of the prior black real body The psychology behind this pattern is that the market is in a
downtrend reflected in the first bearish black body On the next day the market opens
lower with a gap reflecting more bearish sentiment Suddenly the bulls take over and
manage to close the market not only at previous close but higher into the previous body
mid-point or even slightly higher The bears will have their second thoughts about their
short positions The longs will see that the new lows could not hold and probably it is
time to go for long positions There are four main factors that indentify the importance
of the piercing lines 1) the degree of the second day penetration within the first black
body the greater the penetration degree the greater the likelihood for a bottom
reversal 2) the second day opens below a main support level but fails and closes
higher with bears being unable to control the market and 3) heavy volume on the
opening of the second day an initial selling off is followed by buying blow offs (Nison
2001) Figure (3) represents the piercing lines pattern that is identified in AUDUSD pair
currency
ID 100068
49
Figure (3) The piercing Lines pattern in AUDUSD
The dark-cloud cover is the opposite formation of the piercing lines pattern It is a two-
day bearish pattern that signals a top reversal after an uptrend The first day is a long
white real body The second day opens above the high of the previous day but closes
near the low of the day within the previous day white body The greater degree of
penetration into the previous day body the more likely a top reversal will take place
Some technical analysts require more than 50 penetration of the second day close to
the previous white real body The psychology behind this pattern is that the bulls are in
full control when the second day open with an upside gap however the bulls lose
control and no continuation of the rally takes place Then the market closes near the
close and the bulls will have a second thought about their long positions Similar to the
piercing lines pattern there are important factors that intensify the significance of the
dark-cloud cover pattern but in the opposite direction (Nison 2001) Figure (4)
represents the pattern that is identified in EURUSD pair currency
ID 100068
50
Figure (4) The Dark-cover cloud in EURUSD
The hammer is the third bullish candlestick pattern it is a one-day pattern The body of
the hammer can be white or black but it is more bullish if the body is white because it
closes at the high The hammer has a long lower shadow and closes near the high of
the session The psychology behind this pattern is that the market sells off sharply
during the session but then bounces back at the close near to the small bodyrsquos high
The hammer may have no upper shadow or a very small one enforcing bullish
implications This clearly shows that the bears have lost control and they are now
having second thoughts The main characteristic of the bullish hammer is that the lower
shadow should be at least twice or three times the height of the body (Nison 2001)
Figure (5) represents the bullish hammer pattern that is identified in GBPUSD pair
currency
ID 100068
51
Figure (5) The bullish hammer pattern in GBPUSD with the RSI filter
The hanging man looks like a hammer however it forms after an uptrend rather than a
decline Since the long lower shadow has a bullish implication it is best to wait for a
bearish confirmation with this pattern A lower opening below the body of the hanging
man on the second day and a lower close will be a good confirmation of a top reversal
The psychology behind this is that when the market closes on the next day below the
body of the hanging man the bulls who bought on the open or close of the hanging man
day will be left hanging with a bad position and are now more nervous for potential big
losses Thus they may decide to cut their losses and liquidate adding more selling
pressure The key factors for a reversal hanging man pattern are a preceding uptrend
and a next day close below the hanging man close (Nison 2001) Figure (6) represents
the pattern that is identified in USDJPY pair currency
ID 100068
52
Figure (6) The hanging man pattern in USDJPY with the RSI filter
The fourth and the last bearish candle pattern used in the sample analysis is the
shooting star It is a one-day pattern with a small real body and a long upper shadow
The small body can be white or black This pattern looks like a shooting star with its tail
glowing in the sky An ideal shooting star day opens with an upside gap but this gap is
not always important This pattern indicates that the market is rejecting a higher high A
close on the next day below the shooting star close can give a good confirmation of
potential top reversal (Nison 2001) Figure (7) represents the pattern that is identified in
USDCAD pair currency
ID 100068
53
Figure (7) The shooting star pattern in USDCAD with RSI filter
The fourth and the last bullish pattern in the analysis is the doji star A star is usually a
small real body white or black that gaps away from the prior real body If the star is a
doji rather than a small real body it is named a doji star or a doji line that warns a near
reversal Doji candlesticks can have shadows of different lengths The doji candlestick
used in the analysis is a one-day pattern in which the open price and the close price are
equal The star or doji star can be part of other reversal patterns such as the morning
star the evening and the harami Doji candlesticks can have shadows of different
lengths Generally the doji lines show indecision between the market participants The
likelihood of a reversal with a formation of a doji increases if 1) the following
candlesticks confirm a potential reversal 2) the market is in overbought or oversold
situations and 3) the market doesnrsquot form doji so often (Nison 2001) There are different
versions of doji candlesticks such as long legged doji gravestone doji and dragonfly
doji The doji that is used in the analysis has equal open and close prices regardless the
shadows length and signal for bottom reversal (Nison 2001) Figure (8) represents the
doji star pattern that is identified in USDZAR pair currency
ID 100068
54
Figure (8) The doji star pattern in USDZAR
In addition to price patterns resistance-support levels and Japanese candlestick
patterns technical analysts use a lot of technical indicators that be used in trending
markets non-trending markets and gauging sentiments There are technical indicators
or oscillators used in the non-trending markets that can still be used in trending markets
to get further insights into the market momentum Among these indicators is the
Relative Strength Index (RSI) The RSI and the other oscillators when used in
combination with price charts and Japanese candle patterns become extremely
valuable They provide traders and technical analysts further insight especially into the
short-term market extremes that are known as overbought or oversold conditions
The Relative Strength Index (RSI) is considered one of the most popular technical
indicators used actively by traders It basically measures the internal strength of a
security It focuses on price momentum specifically the changes in closing prices It
ranges between zero and a hundred It usually tops and bottoms above and below 70
and 30 readings respectively These are overbought and oversold conditions (Colby
2003) A crossing above 30 indicates a buying signal whereas a crossing below 70
ID 100068
55
indicates a selling signal Divergences between the price action and the indicator
movements also provide warning signals of potential bottom and top reversals In
addition to the signals of the oversold-overbought condition the crosses signals of the
midpoint are also used by many traders Since oscillators are best used in non-trending
markets and there is a risk of misusing the indicator the 50 reading is used as a
midpoint value to divide the horizontal range into two halves The 50 midpoint is also
used as buy and sell signals The time span used is 14 days by default and it will be
used in the analysis The RSI formula is also introduced later in the methodology
section Figures (5-7) show the three patterns that are identified using the excel formula
and the RSI filter
ID 100068
56
Chapter 6
Methodology
ID 100068
57
Chapter 6 Methodology
This research attempts to re-examine the weak form of the EMH through the application
of Japanese candlestick price patterns as technical trading rules in foreign exchange
markets It tests two null hypotheses that assume 1) all the Japanese candlestick
reversal patterns cannot be used to predict returns in foreign exchange markets and
that 2) foreign exchange markets are efficient The two alternative hypotheses state that
1) Japanese candlestick reversal patterns can be used to predict market movements
and that 2) foreign exchange markets are inefficient The one-tailed z score test is used
to test the hypotheses at 5 level of significance The following sections include the
sample data and the analytical tools used in the analysis followed by a discussion of
data analysis and a summary of findings and recommendations
61 Sample Data
The sample data includes seven foreign currencies from both advanced and emerging
financial markets These currencies include the Australian dollar (AUDUSD) British
pound (GBPUSD) Canadian dollar (USDCAD) Euro dollar (EURUSD) Japanese yen
(USDJPY) Indian rupee (USDINR) and South African rand (ZAR) The sample covers
a 12-year span which is from 1st January 2001 to 31st December 2012 These
currencies reflect good financial environment to test the technical trading rules of the
Japanese candlestick patterns in which most of market participants and academicians
are interested in All the data analysis uses daily OHLC bid rates open (O) high (H)
low (L) and close (C) obtained from the financial data provider Thomas Reuters The
total observations in the sample are 3129
ID 100068
58
62 Analytical Tools
This section explains the technical trading and statistical tools used in the analysis to
test the proposed null hypotheses It discusses the Japanese candle patterns used
challenges faced filters applied holding periods to calculate returns (losses) followed
by statistical tests to help deciding whether to reject or accept the null hypothesis
There are eight Japanese candlestick reversal patterns used in the analysis four bullish
patterns and four bearish patterns The eight candle patterns are tested for each of the
seven foreign currencies
The bullish patterns include the hammer the piercing lines the doji star and the bullish
engulfing whereas the bearish patterns include the hanging man the dark-cloud cover
the shooting star and bearish engulfing The reason of selecting these patterns is that
they are very popular and most of them are considered major reversal patterns Another
reason is the ability to transform these candlestick patterns and practice them in a
scientific manner through using excel formulas that can describe and indentify the
patterns and enable back testing
The main challenge encountered in this research is the application a scientific method
that would address the subjectivity of using the Japanese candlestick patterns as
technical trading rules Moving technical analysis to a science through transforming
subjective candle patterns into objectively defined testable patterns has always been a
challenge There are not so many mathematical definitions of the Japanese
candlesticks in the literature Some of the excel formulas that are used in the analysis
are obtained from other resources These formulas are further amended to address the
subjectivity of different variations of the candle patterns used in the analysis which are
in line with Nisonrsquos (2001) The excel formulas (3) (4) and (7) mentioned later in this
section are obtained from a paper written by Fadhel (2010) with an amendment made
to formula (7) to differentiate the shooting star pattern that shows at tops from the
ID 100068
59
inverted hammer pattern that shows at bottoms an additional condition of a next day
lower close is added This is in line with Nisonrsquos (2001) Formulas (5) and (6) are
obtained from Tech Excel Charts and Programming Blog posted by BxCapricorn (2009)
an additional condition of a lower close and a higher close on the next day is also added
to differentiate the hanging man pattern and the hammer respectively from other
similar patterns that show in opposite directions These are also in line with Nisonrsquos
(2001)
Formulas (1) to (8) describe the eight Japanese candlestick patterns the bullish
engulfing the bearish engulfing the piecing lines the dark-cloud cover the hammer
the hanging man the shooting star and the bullish doji against (1) (2) (3) (4) (5)
(6) (7) and (8) respectively Using IF and AND excel functions the following
formulas represent four columns Column A represents Date Column B represents
Open Column C represents High Column D represents Low and Column E
represents Close The formulas start on line or row 5 that represents today line 4
represents yesterday line 3 represents the day before yesterday and line 6
represents tomorrow Number one refers to the patterns identified by the formulas
=IF(AND((B4gtE4)(E5gtB5)(E5gtB4)(E4gtB5)((E5-B5)gt(B4-E4))(C5gtC4) (1)
(D5ltD4))1)
=IF(AND((E4gtB4)(B5gtE5)((B5-E5)gt(E4-B4))(E4ltB5)(B4gtE5))1) (2)
=IF(AND((E4ltB4)(((E4+B4)2)lt=E5)(B5ltE5)(B5ltE5)(E5ltB4)(B5ltD4) (3)
((E5-B5)(0001+ (C5-D5))gt06))1)
=IF(AND(E4gtB4B5gtC4B5gtE5B4ltB5E4gtE5E4ltB5B4ltE5 (4)
E5lt=(05(C4+D4)))1)
=IF(AND((C4-D4)gt(3(B4-E4))((E4-D4)(0001+C4-D4)gt06) (5)
ID 100068
60
((B4-D4)(0001+C4-D4)gt06)(E5gtE4))1)
=IF(AND((C4-D4)gt=(2(ABS(B4-E4)))((E4-D4)(0001+C4-D4)gt=075) (6)
((B4-D4)(0001+C4-D4)gt=0075)(E5ltE4))1)
=IF(AND(B4ltD4+(05(C4-D4))E4lt(D4+05(C4-D4))OR(B4ltD4+09 (7)
(C4-D4)E4ltD4+09(C4-D4))(E5ltE4))1)
=IF(B4=E41 (8)
Furthermore the 14-day Relative Strength Index (RSI) is used to distinguish the three
similar patterns that appear at different turning points these similar patterns include the
bullish hammer the hanging man and the shooting star In addition to the signals of the
oversold-overbought condition the crosses of the midpoint signals are also used by
many traders Since oscillators are best used in non-trending markets and there is a risk
of misusing the indicator the 50 reading is used as a midpoint value to divide the
horizontal range into two halves The 50 midpoint is used as buy and sell signals For
example crossing 50 to the upside is considered a buying signal whereas crossing 50
to the downside is considered a selling signal The 50 midpoint crosses concept is used
with the three candle patterns as a filter to distinguish them If the hanging man and the
shooting start patterns form above 50 it is assumed that there is a high possibility that
the trend will reverse from up to down Similarly if the bullish hammer pattern forms
below the 50 reading there is a high possibility that the current trend will reverse from
down to up In other words a reading above 50 indicates potential for a bearish
reversal and a reading below 50 indicates potential for a bullish reversal
Having used the RSI filter for the three candle patterns the results are considered only
if the average returns are statistically significant at 5 level for at least five consecutive
holding periods Formula (9) shows how the RSI is calculated as provided by Cably
(2003)
ID 100068
61
R 119894
= (C 119905
C 119905+2
C 119905+3
C 119905+4
C 119905+5
C 119905+7
C 119905+10
) minus O 119905
RSI = 100 minus 100
(1 + 119877119878)
(9)
Where
RS = the ratio of the exponentially smoothed moving average for n-period gains divided
by the absolute value of the exponentially smoothed moving average for n-period
losses
After identifying the eight bullish and bearish candle patterns and filtering them through
using the RSI overbought and oversold conditions the returns are computed for seven
holding periods one day two days three days four days five days seven days and
ten days For the bullish patterns the returns represent the difference between the open
price following the pattern day and close price of the seven holding periods as in
formula (10) For the bearish patterns the returns represent the difference between the
open price following the pattern day and close price of the seven holding periods as in
formula (11) The returns for the holding periods that fall beyond the 31 December 2012
are excluded
(10)
Where
Ri= the return of the seven holding periods
Ct = day 1 close following the pattern day
Ct+1 = day 2 close
Ct+2 = day 3 close
Ct+3 = day 4 close
Ct+4 = day 5 close
Ct+6 = day 7 close
Ct+9 = day 10 close
Ot = day 1 open
ID 100068
62
R 119894
= O 119905
minus (C 119905
C 119905+2
C 119905+3
C 119905+4
C 119905+5
C 119905+7
C 119905+10
)
119911 =X minus1198830
1198782
n
(11)
Where
Ri= the return of the seven holding periods
Ot = day 1 open following the pattern day
Ct = day 1 close
Ct+1 = day 2 close
Ct+2 = day 3 close
Ct+3 = day 4 close
Ct+4 = day 5 close
Ct+6 = day 7 close
Ct+9 = day 10 close
Having identified the patterns and computed the returns for the seven holding periods
and following the methodology used by Ramond and Leuthold (1982) and Anderson
(2003) the one-tailed z score test is used for each holding period of the pattern The
two null hypotheses are tested at 5 level of significance that is 95 confidence level
Also the same methodology including the holding periods follows Fadhelrsquos (2010)
supervised by Anderson (2010) the same author above Formula (12) represents the z
score statistical test that accounts for the gross profit variance from each trade as well
as the number of total trades It allows a comparison of results from various trading
rules and time periods To arrive to the final results using the z score test the number of
times the candle pattern is identified (n) in the formula below has to be above 30 This
formula that considers all the factors above does also provide a method to assess the
weak form efficiency of the price series used in the sample analysis (Peterson and
Leuthold 1982)
(12)
Where
X = actual Mean Gross Profits (MGP) from a given strategy
ID 100068
63
Xo = expected MGP (zero in this case)
S2 = variance of Gross Profits per trade
n = number of trades it should be above 30
Unlike securities trading the foreign exchange trading has no guaranteed return or
dividend payment Therefore the equilibrium expected return is considered zero
Trading foreign exchange currencies is similar to trading futures contracts it is a two-
party zero sum game where a price change causes one party to profit and the other
party to lose Thus since foreign exchange trading is a zero-sum game zero is
considered the rational benchmark as expected mean gross profits Moreover the
selection for gross profits instead of the net is due to the absence of a standard
transaction cost as commissions differ significantly depending on time as well as trader
and firm types Readers can deduct suitable commission charges to have some value
for mean net returns These adjustments should not impact the variance of profits
(Peterson and Leuthold 1982)
The p-value is calculated to also help decide whether the pattern identified is due to
chance or its probability of being formed by chance is really too small To calculate the
p-value using the z test statistic excel formula (13) is used If the value is equal or
below the significance level of 005 this means that the probability of the pattern was
formed by chance is very small at 95 level of confidence and the null hypothesis will
be rejected However if the p-value is above the 005 significance level it means that
the probability the pattern was created by chance is high and the null hypothesis will be
accepted
P-value = 1-NORMSDIST(ABS(z)) (13)
Where
ABS = the absolute value of z
NORMSDIST = standard normal distribution of z
ID 100068
64
Figures (9-12) show the number of times the four bullish and the four bearish candle
patterns appear in the final results Figures (10) and (12) show the number of times the
bullish hammer the bearish hanging man and shooting star patterns appear after using
the RSI filter
Figure (9) A comparison of the number of times the four bullish candle patterns appear
in the seven foreign currencies
Figure (10) A comparison of the number of times the four bullish candle patterns
appear in the seven foreign currencies after using the RSI filter
0
20
40
60
80
100
120
140
AUD CAD EUR GBP INR JPY ZAR
Bullish Candle Patterns
Bullish Hammer
Piercing Lines
Bullish Doji Star
Bullish Englulfing
Average
0
20
40
60
80
100
120
140
AUD CAD EUR GBP INR JPY ZAR
Bullish Candle Patterns - with RSI
Bullish Hammer
Piercing Lines
Bullish Doji Star
Bullish Englulfing
Average
ID 100068
65
Figure (11) A comparison of the number of times the four bearish candle patterns
appear in the seven foreign currencies
Figure (12) A comparison of the number of times the four bearish candle patterns in the
seven foreign currencies after using the RSI filter
0
100
200
300
400
500
600
AUD CAD EUR GBP INR JPY ZAR
Bearish Candle Patterns
Hanging Man
Dark-Cloud Cover
Shooting Star
Bearish Engulfing
Average
0
50
100
150
200
250
300
AUD CAD EUR GBP INR JPY ZAR
Bearish Candle Patterns - with RSI
Hanging Man
Dark-Cloud Cover
Shooting Star
Bearish Engulfing
Average
ID 100068
66
Chapter 7
Discussion of Study
Analysis
ID 100068
67
Chapter 7 Discussion of Study Analysis
Having tested the profitability of selected Japanese candlestick reversal patterns in
foreign exchange markets this chapter discusses in details the results of analyzing
candle reversal patterns in seven foreign currencies for 12-year data of 3129
observations The following seven sections discuss the results for each currency pair
After examining the bullish patterns in AUDUSD currency pair it is found that the
bullish hammer pattern is identified 77 times at less than 5 level of significance for all
the holding periods When the results are filtered using the RSI the pattern is identified
40 times in which all are significant at 5 level except of the seven-day holding period
The bullish doji star is identified 28 times throughout the sample at 5 significance
level The bullish engulfing pattern is found less profitable which is not statistically
significant either The piercing lines pattern appears very rare as it shows only 7 times
Similar to the bullish engulfing result the average returns of this pattern are found
statistically insignificant Shifting to the bearish patterns the hanging man performs best
compared with the other three patterns The pattern is indentified 89 times in which the
average returns are significant at 5 level of significance When filtered by the RSI that
is more than 50 the pattern appears 57 times with average returns that are statistically
significant Although the shooting star pattern is identified 148 times the average
returns are found statistically insignificant However when filtered for the RSI the
average returns are found statistically significant for the one-day two-day three-day
and seven-day holding periods The bearish engulfing and the dark-cloud cover are
identified 70 times and four times respectively and their average returns are found
insignificant Appendix 2 includes the descriptive statistics of the eight candle pattern
analysis for AUDUSD
The analysis of USDCAD shows poor evidence of profitable bullish candle patterns
The bullish hammer appears 58 times with significant average returns at 5 level
ID 100068
68
however when filtered using the RSI the pattern appears only 25 times and the
average returns are found significant only for the one-day and three-day holding
periods The bullish engulfing pattern appears 35 times throughout the sample with
significant average returns only for the one-day and two-day holding periods The
bullish doji star pattern appears 19 times and is found statistically insignificant The
piercing lines pattern appears only eight times and the average returns are found
significant only for the one-day two-day and ten-day holding periods at 000 003
and 004 level of significance respectively This result will not be considered because
the number of times the patterns appears which should be considered in z score
formula is less than 30 On the other hand the bearish hanging man and the shooting
star patterns show strong evidence of profitability at 5 level of significance even after
being filtered with the RSI The hanging man pattern is identified 79 times the shooting
star pattern is identified 240 times After being filtered with the RSI reading that is above
50 the hanging man and the shooting star patterns appear 44 times and 108 times
respectively The dark-cloud cover is identified only twice with statistically insignificant
average returns The bullish engulfing pattern is identified 35 times and the average
returns are considered significant only for the one-day and two-day holding periods
Appendix 3 includes the descriptive statistics of the eight candle pattern analysis for
USDCAD
In EURUSD only the bullish pattern of the hanging man shows average returns that
are statistically and consistently significant at 5 level of significance This result also
repeats when filtered with the RSI The pattern is identified 64 times and when filtered it
shows 34 times The presence of the piercing lines pattern is very poor even though
the average returns of the two-day holding period is statistically significant 000 the
pattern is identified only 7 times out of 3129 observations This result is also not
considered The average returns of the bullish doji star and the bullish engulfing
patterns are statistically insignificant They show 15 times and 49 times respectively
On the other hand the average returns of the handing man and the shooting star
patterns are statistically significant they are identified 106 times and 181 times
ID 100068
69
respectively Nevertheless when filtered for the RSI reading the average return of the
ten-day holding period of the hanging man is found 007 that is statistically
insignificant at 5 level Also the average returns of the three-day four-day and five-
day holding periods for the shooting star pattern are found insignificant 008 009
and 008 respectively The dark-cloud and the bearish engulfing patterns are found
very poor Although the bearish engulfing pattern appears 156 times the average
returns are found statistically insignificant The dark-cloud cover pattern is identified only
seven times Appendix 4 includes the descriptive statistics of the eight candle pattern
analysis for EURUSD
In GBPUSD only the average returns of the bullish hammer pattern are found
statistically and consistently significant at 5 level even after filtering for the RSI The
pattern is identified 97 times before applying the RSI filter and 37 times after using the
filter The other three bullish patterns are found statistically insignificant The piercing
lines the bullish doji star and the bullish engulfing patterns appear 7 times 17 times
and 48 times respectively On the other hand the average returns of the hanging man
and the shooting star patterns are found statistically significant at 5 level They show
99 times and 197 times respectively however when filtered for the RSI the average
returns of the hanging man pattern are found statistically insignificant for the seven-day
and the ten-day holding periods 009 and 026 respectively The existence of the
dark-cloud cover pattern is found very poor as it is identified only once The bearish
engulfing pattern is identified 131 times and its average returns are also found
insignificant Appendix 5 includes the descriptive statistics of the eight candle pattern
analysis for GBPUSD
In the first emerging foreign currency of USDINR the average returns of the bullish
hammer and the bullish engulfing patterns are found statistically significant at 5 level
The patterns are identified 40 times and 65 times respectively However when filtering
the bullish hammer using the RSI reading the average returns are found significant only
for the one-day and the ten-day holding periods 000 and 003 respectively The
ID 100068
70
piercing lines pattern appears 33 times but its average returns are found statistically
insignificant The bullish doji star pattern appears 133 times and only the three-day
average returns are found significant 002 lacking consistency in results On the
other hand the existence of the bearish patterns in USDINR is found very poor The
average returns of the hanging man pattern are found statistically significant for only the
four-day five-day and ten-day holding periods and when filtered by the RSI only the
average returns of the one-day and two-day holding periods are found significant The
pattern is identified 69 times before the RSI filter and 39 times after applying the filter
The average returns of the shooting star and the bearish engulfing patterns are found
insignificant The shooting star pattern shows 549 times before the RSI filter and 244
times after using the filter the bearish engulfing pattern is identified 55 times Even
though the average returns of the dark-cloud cover pattern are found significant for all
the holding periods except the one-day period this result should not be considered as
the pattern is identified only twice Finally the bearish engulfing pattern is identified 131
times and its average returns are also found insignificant Appendix 6 includes the
descriptive statistics of the eight candle pattern analysis for USDINR
The USDJPY currency pair lacks evidence of most of the bullish candle reversal
patterns Only the average returns of the bullish hammer pattern are found statistically
significant for the first five holding periods and the first four holding periods after
allowing for the RSI filter The pattern is identified 120 times before the RSI filter and 62
times after applying the filter The average returns of the bullish doji star and the bullish
engulfing patterns are found insignificant for all the seven holding periods they are
identified 25 times and 45 times respectively Similar to the previous results the
average returns of the piercing lines pattern are found insignificant except for the two-
day holding period 001 This result is not considered either as the pattern is
identified only four times Moving to the bearish candle reversal patterns the average
returns of both the hanging man and the shooting star patterns are found statistically
and consistently significant at 5 level even after allowing for the RSI filter The
hanging man appears 155 times before the filter and 82 times after the filter the
ID 100068
71
shooting star pattern appears 190 times before the filter and 75 times after the filter The
average returns of the dark-cloud cover are found insignificant the pattern is identified
only 4 times The average returns of the bullish engulfing pattern are found statistically
significant only for the four-day holding period lacking consistency in the overall result
Appendix 7 includes the descriptive statistics of the eight candle pattern analysis for
USDJPY
Having examined the second emerging market foreign currency and the last foreign
currency in the sample USDZAR is found to experience no bullish reversal candlestick
patterns None of the average returns of the four candle patterns are found statistically
significant at 5 level The bullish hammer pattern is identified 85 times before the RSI
filter and 41 times after the filter the bullish doji star and the bullish engulfing patterns
appear 17 times and 26 times respectively The piecing lines pattern does not appear
at all However there is some evidence of bearish candle patterns in USDZAR The
average returns of the shooting star pattern are found consistently and statistically
significant at 5 level for all the holding periods before and after the RSI filter The
pattern appears 282 times before the filter and 129 times after the filter The average
returns of the hanging man pattern are found statistically significant for the first five
holding periods before and after the filter The average returns of the dark-cloud cover
pattern are found significant only for the three-day and four-day holding periods the
pattern appears only twice Thus due to the low frequency of pattern and the lack of
consistency the pattern results are not considered Appendix 8 includes the descriptive
statistics of the eight candle pattern analysis for USDZAR
ID 100068
72
Chapter 8
Findings and
Recommendations
ID 100068
73
Chapter 8 Findings and Recommendations
After analyzing the results in detail this chapter summarizes the major results into two
areas 1) general findings in term of frequency of pattern appearance holding periods
significance levels and bullish and bearish trends and 2) specific findings that are
pertaining to each currency pair The consistency of statistical significant returns at 5
level for all the holding periods is considered However for the three patterns of the
shooting star the hanging man and the bullish hammer both pre- and post-RSI filter
results are considered statistically significant based on one conservative condition the
average returns should be statistically significant at 5 level for at least five consecutive
holding periods in a row in both data before and after the RSI filter that is above 50
reading for the bearish two candle patterns and below 50 reading for the bullish candle
pattern Another condition that needs to be satisfied when considering the findings is the
number of observations along with the 5 level of significance According to Peterson
and Leuthold (1982) the number of times the candle pattern is identified should be
above 30 in the z score statistic
Having had more 65 bullish data during the study sample and among the four bullish
candlestick reversal patterns the bullish hammer pattern is found the strongest one in
term of frequency and statistical significant average returns at 5 level The maximum
number of times the pattern appears is 97 AUDUSD can be traded using this pattern
for the first six holding periods EURUSD and GBPUSD can be traded for all the seven
holding periods USDJPY can be traded for the first five holding periods The bullish
engulfing pattern is found statistically significant only in USDINR The research also
finds that there is no evidence of the piercing lines and bullish engulfing patterns across
all the seven currencies Two other interesting findings are the very low frequency of the
piercing line pattern across the sample the number varies from four to eight except for
USDINR and USDZAR they appear 33 times and zero times respectively Another
finding is that both of the emerging market currencies USDINR and USDZAR show
ID 100068
74
poor evidence of bullish candle patterns even though most of the study sample falls
under bullish cycles only the average returns of the bullish engulfing pattern in
USDINR is found statistical significant These findings reject both of the null
hypotheses that assume all Japanese candlestick patterns cannot be used to forecast
foreign currency prices and that foreign markets are efficient Furthermore the findings
of the profitable Japanese candle patterns are in line with the results found by Goo
Chen and Chang (2007) Lana Zhanga and Xiongb (2011) Haibin Zhao and Wang
(2012) Lu Shiu and Liu (2012) on the studies that examine the profitability of the
Japanese candle patterns as technical trading rules in particular These results also
support the evidence found using other profitable technical trading rules in general by
Longworth 1981 Brock Lakonishok and LeBaron 1992 Gencay 1997Osler 2000
Saacke 2002 Osker 2003 2006 Shik and Chong 2007 Lento and Gradojevic 2007
Park and Scott 2007 Stephen 2008 Cekirdekci and Iliev 2010 and Loumlnnbark and
Lundstroumlm 2012
Moving to the general findings of the bearish candle reversal patterns strong evidence
of the hanging man and the shooting star patterns are found in most of the foreign
currencies which is statistically significant at 5 level The highest number of the times
the hanging man and shooting star patterns appear is 155 times and 129 times
respectively The pattern of the hanging man that appears in AUDUSD USDCAD and
USDJPY can be traded for all the holding periods whereas the same pattern can be
traded in EURUSD GBPUSD and USDZAR for the first six holding periods of
EURUSD the first five holding periods of GBPUSD and USDZAR respectively The
shooting star pattern can be traded in USDCAD GBPEUR USDZAR and USDJPY
for all the holding periods The research also finds that the number of times the dark-
cloud cover pattern appears is very low it is between one and seven in which the
average returns are found statistically insignificant Similarly the average returns of the
bearish engulfing pattern are found statistically insignificant even though there is a high
frequency of the pattern that goes up to 181 times The last interesting finding is that
both of the emerging market currencies show evidence of the hanging man and the
ID 100068
75
shooting star patterns with an average return that is statistically and consistently
significant at 5 level These findings also reject the two null hypotheses Moreover
these partial findings that find no evidence of profitability of the other candle patterns
are in line with the other results in the literature that find no evidence of profitable
candlestick patterns particularly in the studies done by Brashears and Elam (1993)
Marshall Young and Rose (2005) and Young and Marshall (2007) As unprofitable
technical trading rules in general the poor evidence of the candle patterns are also in
line with the other results found by Levich and Thomas (1993) Lee and Mathur (1996)
LeBaron (2002) Olson (2004) and Lento and Gradojevic (2007)
Currency-wise findings are the second part of the research main findings The bullish
hammer can be traded for the first six holding periods as well as the bearish hanging
man for all the holding periods in AUDUSD Traders can trade the bearish hanging man
and the shooting star patterns in USDCAD for all the holding periods The bullish
hammer pattern the bearish hanging man pattern can be traded in EURUSD for the
first six holding periods GBPUSD can be traded using the bullish hammer the bearish
hanging man and the shooting star patterns for all the holding periods the first five
holding periods and all the holding periods respectively USDINR can be traded using
the bullish engulfing pattern USDZAR can be traded using the bearish hanging man
and the shooting start patterns for the first five holding periods and all the holding
periods respectively Finally USDJPY can be traded using the bullish hammer pattern
for the first five holding periods it can also be traded using the bearish patterns of the
hanging man and the shooting star for all the holding periods
After finding strong evidence of some profitable Japanese candle reversal patterns in
foreign exchange markets this research provides recommendations that are divided
into two main areas The first one is in reference to trading and investment decisions
The other area is concerned with future research Based on the findings above it is
recommended to trade the Japanese candlestick patterns that are found statistically
significant at 5 level in the respective currencies This is summarized in the second
ID 100068
76
section above that is pertaining to respective currency pairs For future research it is
recommended to use more sophisticated algorithm programmes and statistical models
to re-examine the findings of this research not only using daily prices but also intraday
timeframes Since foreign exchange markets are known for being very complex and
difficult to predict it is recommended to use other technical trading rules such as
support-resistance levels and oscillators like the MACD histogram and Commodity
Channel Index (CCI) in combination with the candlestick pattern trading rules Using
such strong different trading rules in which the majority of the trading signals would
agree will help making the trading system very robust Moreover future research is
encouraged to examine the candle reversal patterns in term of bullish and bearish
trends The beauty of the Japanese candlestick patterns reveals when they are used in
combination with other trading rules The key concept in using the candlestick charting
system is the comprehensive technical picture of the market
ID 100068
77
Chapter 9
Conclusion
ID 100068
78
Chapter 9 Conclusion
This research attempts to examine the profitability of selected Japanese candlestick
reversal patterns in the foreign exchange markets as the main objective The research
tests two null hypotheses that assume all Japanese candle reversal patterns cannot be
used to forecast foreign currency price movements and that foreign exchange markets
are efficient supporting the weak form of the EMH The sample includes a 12-year data
of 3129 observations for seven foreign exchange currencies AUDUSD USDCAD
EURUSD GBPUSD USDINR USDZAR and USDJPY The selected Japanese
candle patterns include four bullish and four bearish patterns The bullish patterns
include the bullish hammer the piercing lines the bullish doji star and the bullish
engulfing whereas the bearish patterns include the hanging man the dark-cloud cover
the shooting star and the bearish engulfing The statistical z score test is used to test
the average returns of open-close difference at 5 level of significance for seven
holding periods one day two days three days four days five days seven days and
ten days The 14-day Relative Strength Index (RSI) is used to distinguish similar
patterns that appear at different turning points these similar patterns include the bullish
hammer the hanging man and the shooting star If the hanging man and the shooting
start patterns form above 50 it is assumed that there is a high possibility that the trend
will reverse from up to down Similarly if the bullish hammer pattern forms below the 50
reading there is a high possibility that the current trend will reverse from down to up To
arrive to the final results that are tested statistically using z score the number of times
the candle pattern is identified (n) has to be above 30 (Peterson and Leuthold 1982)
The second condition is that for the three candle patterns that are used in combination
with the RSI filter the results are considered only if the average returns are statistically
significant at 5 level for at least five consecutive holding periods
After examining the candle patterns in the seven currencies the research finds
evidence of some profitable of Japanese candle patterns at 5 level of significance
ID 100068
79
Strong evidence of the bullish hammer the bearish hanging man and the shooting star
patterns in some currencies is found The research finds that the frequency of pattern
appearance for the piercing lines and the dark-cloud cover patterns are the least among
the eight candle patterns Also the results show that the bullish hammer and the
bearish hanging man patterns can be traded in AUDUSD for the first six holding
periods and all the holding periods respectively The bearish hanging man and the
shooting star patterns can be traded in USDCAD for all the seven holding periods The
bullish hammer and the bearish hanging man patterns can be traded in EURUSD for all
the holding periods The bullish hammer the bearish hanging man and the shooting star
patterns can be traded in GBPUSD for the all holding periods the first five trading
periods and all the holding periods respectively The bullish engulfing pattern can be
traded in USDINR for all the holding periods The bearish hanging man and the
shooting star patterns can be traded in USDZAR for all the trading periods Moreover
the bullish hammer the bearish hanging man and the shooting star patterns can be
traded in USDJPY for the first five holding periods of the hanging man and all the
holding periods of the other two patterns Thus these results reject the two null
hypotheses Furthermore the findings of the profitable Japanese candle patterns are in
line with the results found by Goo Chen and Chang (2007) Lana Zhanga and Xiongb
(2011) Haibin Zhao and Wang (2012) Lu Shiu and Liu (2012) on the studies that
examine the profitability of the Japanese candle patterns as technical trading rules in
particular These results also support the evidence found using other profitable technical
trading rules in general by Longworth 1981 Brock Lakonishok and LeBaron 1992
Gencay 1997Osler 2000 Saacke 2002 Osker 2003 2006 Shik and Chong 2007
Lento and Gradojevic 2007 Park and Scott 2007 Stephen 2008 Cekirdekci and Iliev
2010 and Loumlnnbark and Lundstroumlm 2012
Market participants are recommended to use the above candle patterns in the
respective foreign currency in their trading investment and hedging decisions It is also
recommended to use the candle charts along with other trading rules such as support
and resistance levels and oscillators For future research it is recommended to use and
ID 100068
80
examine more sophisticated algorithm programmes and statistical models to re-test the
findings of this research using both daily and intraday prices It is also recommended to
use other technical trading rules such as support-resistance levels and oscillators such
as MACD histogram and the CCI in combination with candlestick pattern trading rules
This is required because foreign exchange markets are very complex using such strong
different trading rules makes the trading system more powerful Moreover future
research is encouraged to examine the candle reversal patterns in term of bullish and
bearish trends The beauty of the Japanese candlestick patterns reveals when they are
used in a combination with other trading rules Last but not least the key concept in
using the candlestick charting system is the comprehensive technical picture of the
market that makes these candlestick trading systems robust
ID 100068
81
Bibliography Achelis S (2001) Technical Analysis from A to Z 2nd ed New York McGraw-Hill Anderson J (2003) A Test of Weak-Form Market Efficiency in Australian Bank Bill Futures Calendar Spreads [online] [Accessed 03 September 2012] Available at httpeprintsquteduau3871Anderson_134pdf Bettman J Sault S amp Welch E (2006) Fundamental and Technical analysis Substitiutes or Compliments [online] [Accessed 07 September 2012] Available at httppapersssrncomsol3paperscfmabstract_id=899879 Brock W Lakonishok J amp LeBaron B (1991) Simple Technical Trading Rules and the Stochastic Properties of Stock Returns [online] [Accessed 10 September 2012] Available at httpwwwsantafeedumediaworkingpapers91-01-006pdf Buffett W (1984) The Superinvestors of Graham-and-doddsville [online] [Accessed 04 October 2012] Available at httpwwwbestinverespdfarticulos_valueThe20Superinvestors20of20Graham20and20Doddsville20by20Warren20Buffettpdf BxCapricorn (2009) Candlestick Alternative Individually Colored Up-Down Bars [blog entry] [Accessed 02 December 2012] Available at httppeltiertechcomWordPresscandlestick-alternative-individually-colored-up-down-bars Cekirdekci M amp Iliev V (2010) Trading System Development Trading the Opening Range Breakouts [online] [Accessed 10 October 2012] Available at httpwwwwpieduPubsE-projectAvailableE-project-042910-142422unrestrictedVeselin_Iliev_IQPpdf Colby R (2003) The Encyclopedia of Technical Market Indicators 2nd ed New York McGraw-Hill Cooper T (2011) Optimal Rotational Strategies using Combined Technical and Fundamental Analysis [online] [Accessed 09 September 2012] Available at httpwwwnaaimorgwp-contentuploads201204K2011_Tony-Cooper_Optimal-_Rotational-_Strategiespdf Fadhel D (2010) Using Candlestick Patterns to Test Efficiency in Stock Futures Markets MSc assignment The British University in Dubai Fama E (1970) ldquoEfficient Capital Markets A Review of Theory and Empirical Workrdquo Journal of Finance [online] Vol 25 (2) [Accessed 15 September 2012] Available at
ID 100068
82
httpefinanceorgcncnfmEfficient20Capital20Markets20A20Review20of20Theory20and20Empirical20Workpdf Friesen G Weller P amp Dunham L (2007) Price trends and Patterns in Technical Analysis A theoretical and empirical examination [online] [Accessed 15 September 2012] Available at httppapersssrncomsol3paperscfmabstract_id=970852 Genccedilay R 1997 The Predictability of Security Returns with Simple Technical Trading Rules Journal of Empirical Finance [online] Vol 5 [Accessed 15 September 2012] Available at httpwwwsfuca~rgencayjarticlesjef-technicalpdf HolmbergU Loumlnnbark C amp Lundstroumlm C (2012) Assessing the Profitability of Intraday Opening Range Breakout Strategies [online] [Accessed 02 September 2012] Available at httpwwwusbeumusedigitalAssets102102002_ues845pdf Jegadeesh N amp Titman S (1993) Returns to Buying Winners and Selling Losers Implications for Stock Market Efficiency Journal of Finance [online] Vol 48 (1) [Accessed 15 September 2012] Available at httpwwwe-m-horgJeTi93pdf Krishnan R amp Menon S (2009) Impact of Currency Pairs Time Frames and Technical Indicators on Trading Profit in Forex Spot Market [online] [Accessed 02 September 2012] Available at httpwwwfxinvestornetforex-educationImpactofCurrencyPairsTimeFramesonTradingProfitsInForexMarketspdf LeBaron B (1998) Technical Trading Rule Profitability and Foreign Exchange Intervention [online] Journal of International Economics Vol 49 (1) [Accessed 04 September 2012] Available at httpwwwsciencedirectcomsciencearticlepiiS0022199698000610 LeBaron B (2002) Technical Trading Profitability in Foreign Exchange Markets in the 1990rsquos [online] [Accessed 02 September 2012] Available at httppeoplebrandeisedu~blebaronwpsfx90pdf Lee C amp Mathur I (1996) A comprehensive Look at the Efficacy of Technical Trading Rules Applied to Cross-rates The European Journal of Finance [online] Vol 2 (4) [Accessed 04 September 2012] Available at httpeconpapersrepecorgarticletafeurjfiv_3a2_3ay_3a1996_3ai_3a4_3ap_3a389-411htm Lento C amp Gradojevic N (2007) The Profitability of Technical Trading Rules A Combined Signal Approach Journal of Applied Business Research [online] Vol 23 (1) [Accessed 04 September 2012] Available at httpjournalscluteonlinecomindexphpJABRarticleviewArticle1405
ID 100068
83
Levich R amp Thomas L (1993) The Significance of Technical Trading Rule Profits in the Foreign Exchange Market a Bootstrap Approach Journal of International Money and Finance [online] Vol 12 (5) [Accessed 04 September 2012] Available at httpwwwnberorgpapersw3818 Levy R (1966) Conceptual Foundations of Technical Analysis Financial Analysts Journal [online] Vol 22 (4) [Accessed 04 September 2012 Available at httpwwwjstororgdiscover1023074470026uid=3737432ampuid=2129ampuid=2ampuid=70ampuid=4ampsid=21101021522633 Lo A amp MacKinlay A (1989) Stock Market Prices Do Not Follow Random Walks Evidence From a Simple Specification Test National Bureau of Economic Research Inc[online] Vol 1(1) [Accessed 02 September 2012] Available at httpideasrepecorgpnbrnberwo2168html Longworth D (1981) Testing the Efficiency of the Canadian-US Exchange Market under the Assumption of No Risk Premium The journal of Finance [online] Vol 36 (1) [Accessed 04 September 2012] Available at httpwwwjstororgdiscover1023072327462uid=3737432ampuid=2129ampuid=2ampuid=70ampuid=4ampsid=21101019268683 Malkiel B (2003) The Efficient Market Hypothesis and Its Critics [online] [Accessed 10 October 2012] Available at httpwwwvixekcomEfficient20Market20Hypothesis20and20its20Critics20-20Malkielpdf Malkiel B Mei J amp Yang R (2006) Investment Strategies to Exploit Economic Growth in China Journal of Investment Consulting [online] Vol 7 (3) [Accessed 15 October 2012] Available at httppapersssrncomsol3paperscfmabstract_id=1702374 Marshall B amp Young M (2007) Market Timing with Candlestick Technical Analysis [online] [Accessed 10 September 2012] Available at httppapersssrncomsol3paperscfmabstract_id=980583 Murphy J (1999) Technical Analysis of Financial Markets 2nd ed New York Penguin Putnam Inc Neely C amp Weller P (2000) Technical Analysis and Central Bank Intervention [online] [Accessed 10 October 2012] Available at httpresearchstlouisfedorgwp199797-002pdf Nison S (2001) Japanese Candlestick Charting Techniques 2nd ed New York Penguin Putnam Inc
ID 100068
84
Nocera J (2009) Poking Holes in a Theory on Markets [online] [Accessed 04 November 2012] Available at httpwwwnytimescom20090606business06nocerahtmlscp=1ampsq=efficient20marketampst=cseamp_r=0 Okunev J amp White D (2003) Do momentum-based Strategies Still Work in Foreign Currency Markets [online] [Accessed 19 October 2012] Available at httpwwwdocsfceunsweduaubankingworkpapcurrencypdf Omrane W amp Oppens H (2004) The Predictive Success and Profitability of Chart Patterns in the EuroDollar Foreign Exchange Market [online] [Accessed 07 September 2012] Available at httppapersssrncomsol3paperscfmabstract_id=484384 Olson D (2004) Have Trading Rule Profits in the Currency Markets Declined over Time Journal of Banking and Finance [online] Vol 28 (1) [Accessed 04 September 2012] Available at httpwwwsciencedirectcomsciencearticlepiiS0378426602003990 Osler C (2000) Support for Resistance Technical Analysis and Intraday Exchange Rates [online] [Accessed 09 December 2012] Available at httpwwwnewyorkfedorgresearchepr00v06n20007oslepdf Osler C (2003) Currency Orders and Exchange Rate Dynamics An Explanation for the Predictive Success of Technical Analysis Journal of Finance [online] Vol 58 (5) [Accessed 16 October 2012] Available at ftpwwweconbguacilCoursesSignaling_in_Financial_MarketsReadingsArticles2009-01-1420Technical20AnalysisCurrency20Orders20and20Exchange20Rate20Dynamics20An20Explanation20for20the20Predictive20Success20ofTechnical20Analysispdf Park C amp Irwin S (2007) What Do We Know about the Probability of Technical Analysis Journal of Economic Surveys [online] Vol 21 (4) [Accessed 10 October 2012] Available at httpideasrepecorgablajecsurv21y2007i4p786-826html Peterson P amp Leuthold R (1982)Using Mechanical Trading Rules to Evaluate the Weak-Form Efficiency of Futures Markets [online] [Accessed 16 December 2012] Available at httpageconsearchumnedubitstream29574114010147pdf Pukthuanthong K amp Thomas L (2008) Weak-form Efficiency in Currency Markets Financial Analysts Journal [online] Vol 64 (3) [Accessed 04 November 2012] Available at httppapersssrncomsol3paperscfmabstract_id=1266184
ID 100068
85
Raymond Y (2012) Fundamental Analysis VS Technical Analysis [online] [Accessed 02 December 2012] Available at httppapersssrncomsol3paperscfmabstract_id=2051485 Saacke P (2002) Technical Analysis and the Effectiveness of Central Bank Intervention Journal of International Money amp Finance [online] Vol 21 (4) [Accessed 04 November 2012] Available at httpmoving-averagestechnicalanalysisorgukSaac02pdf Samuelson P (1965) Proof that Properly Anticipated Prices Fluctuate Randomly [online] [Accessed 10 October 2012] Available at httpstevereadscompapers_to_readproof_that_properly_anticipated_prices_fluctuate_randomlypdf Shik T amp Chong T (2007) A comparison of MA and RSI returns with exchange rate intervention Applied Economic Letters [online] Vol14 (5) [Accessed 15 October 2012] Available at httpideasrepecorgatafapecltv14y2007i5p371-383html SilberW (1994) Technical Trading When it Works and When it Doesnrsquot The Journal of Derivatives [online] Vol 1 No 3 [Accessed 10 October 2012] Available at httpwwwiijournalscomdoiabs103905jod1994407887 Taylor J amp Allen H (1992) The Use of Technical Analysis in Foreign Exchange Market Journal of International Money and Finance [online] Vol 11 (3) [Accessed 10 October 2012] Available at httpwwwsciencedirectcomsciencearticlepii0261560692900483 Thomas G amp Lukas M (2006) Extended Evidence on the Use of Technical Analysis in Foreign Exchange International Journal of Finance amp Economics [online] Vol 11 (4) [Accessed 14 October 2012] Available at ftpwwweconbguacilcoursesSignaling_in_Financial_MarketsReadingsArticles2009-01-1420Technical20AnalysisEXTENDED20EVIDENCE20ON20THE20USE20OF20TECHNICAL20ANALYSIS20IN20FOREIGN20EXCHANGEpdf Thomson Reuters (2013) Foreign Currency Data Download Prices downloaded from 3000 xtra terminal on 01 January 2013 Worrachate A amp Goodman D (2012) Currency Trading at $5 Trillion a Day Surpassed Pre-Lehman High BIS Says [online] [Accessed 20 December 2012] Available at httpwwwbloombergcomnews2012-03-11currency-trading-at-5-trillion-a-day-surpassed-pre-lehman-high-bis-sayshtml
ID 100068
86
Appendix 1 Japanese Candlestick Patterns
Below are the different types of Japanese candle patterns reversal and continuation
patterns The number in brackets shows the number of candles required to form the
pattern (Murphy 1999)
ID 100068
87
Appendix 1 Japanese Candlestick Patterns (continued)
ID 100068
88
Appendix 1 Japanese Candlestick Patterns (continued)
ID 100068
89
Appendix 1 Japanese Candlestick Patterns (continued)
ID 100068
90
Appendix 1 Japanese Candlestick Patterns (continued)
ID 100068
91
Appendix 2 Descriptive statistics of the eight candle pattern analysis for AUDUSD
1 Day 2 Days 3 Days 4 Days 5 Days 7 Days 10 Days 1 Day 2 Days 3 Days 4 Days 5 Days 7 Days 10 DaysAverage 00066 00076 00082 00076 00066 00047 00063 00058 00069 00086 00090 00080 00059 00067
Var 00001 00001 00002 00002 00002 00003 00006 00000 00001 00002 00002 00003 00003 00005
n 89 89 89 89 89 89 89 57 57 57 57 57 57 57
sqrt(varn) 0001 0001 0001 0001 0002 0002 0003 0001 0001 0002 0002 0002 0002 0003
Z score 7979 6128 6085 5173 3960 2622 2438 7157 5481 5297 4655 3590 2471 2162
P-value 000 000 000 000 000 000 001 000 000 000 000 000 001 002
SD 0008 0012 0013 0014 0016 0017 0025 001 001 001 001 002 002 002
Min -0004 -0023 -0020 -0023 -0034 -0030 -0054 -0003 -0013 -0014 -0023 -0034 -0023 -0035
Max 0051 0073 0049 0053 0060 0058 0076 0027 0031 0048 0053 0060 0058 0076
Average 00002 -00036 -00007 -00043 00004 00071 -00056
Var 00000 00002 00003 00004 00007 00013 00011
n 4 4 4 4 4 4 4
sqrt(varn) 0001 0007 0008 0010 0013 0018 0017
Z score 0198 -0535 -0082 -0435 0029 0396 -0328
P-value 042 030 047 033 049 035 037
SD 000 001 002 002 003 004 003
Min -0003 -0020 -0019 -0025 -0026 -0027 -0044
Max 0003 0013 0021 0021 0035 0052 0032
Average -00006 -00009 -00009 -00012 -00014 00052 00038 00039 00028 00022 00013 00016 00023 00025
Var 00001 00001 00001 00002 00002 00077 00078 00000 00000 00001 00001 00001 00001 00002
n 148 148 148 148 148 148 148 92 92 92 92 92 92 92
sqrt(varn) 0001 0001 0001 0001 0001 0007 0007 0000 0001 0001 0001 0001 0001 0002
Z score -0930 -1157 -0917 -1019 -1179 0717 0521 9602 4433 2319 1300 1573 2015 1553
P-value 018 012 018 015 012 024 030 000 000 001 010 006 002 006
SD 0007 0009 0012 0014 0015 0087 0088 0004 0006 0009 0009 0010 0011 0015
Min -0025 -0031 -0051 -0064 -0053 -0085 -0062 -0001 -0010 -0013 -0025 -0019 -0018 -0030
Max 0029 0020 0033 0050 0055 1039 1039 0019 0020 0051 0031 0031 0036 0059
Average -00015 -00015 -00017 -00016 -00021 00132 00106
Var 00001 00001 00002 00003 00003 00160 00163
n 70 70 70 70 70 70 70
sqrt(varn) 0001 0001 0002 0002 0002 0015 0015
Z score -1388 -1102 -0913 -0727 -0950 0871 0692
P-value 008 014 018 023 017 019 024
SD 001 001 002 002 002 013 013
Min -0025 -0031 -0051 -0064 -0053 -0085 -0062
Max 0029 0020 0033 0050 0055 1039 1039
1 Day 2 Days 3 Days 4 Days 5 Days 7 Days 10 Days 1 Day 2 Days 3 Days 4 Days 5 Days 7 Days 10 DaysAverage 00054 00053 00053 00057 00055 00070 00088 00054 00041 00030 00040 00039 00042 00051
Var 00000 00001 00001 00001 00002 00003 00004 00000 00001 00001 00001 00002 00003 00003
n 77 77 77 77 77 77 77 40 40 40 40 40 40 40
sqrt(varn) 0001 0001 0001 0001 0002 0002 0002 0001 0001 0001 0002 0002 0003 0003
Z score 9480 5729 5275 4439 3561 3500 4108 5895 2822 2101 2327 1886 1504 1742
P-value 000 000 000 000 000 000 000 000 000 002 001 003 007 004
SD 0005 0008 0009 0011 0014 0018 0019 001 001 001 001 001 002 002
Min -0001 -0023 -0023 -0018 -0031 -0048 -0052 -0001 -0023 -0023 -0018 -0024 -0048 -0052
Max 0034 0031 0022 0043 0040 0063 0070 0034 0031 0021 0031 0035 0045 0033
Average -00071 -00034 -00120 -00059 -00012 -00015 -00017
Var 00000 00001 00005 00005 00005 00005 00011
n 7 7 7 7 7 7 7
sqrt(varn) 0002 0004 0008 0008 0008 0008 0012
Z score -2887 -0858 -1435 -0718 -0140 -0184 -0138
P-value 000 020 008 024 044 043 045
SD 0007 0011 0022 0022 0022 0022 0033
Min -0018 -0022 -0041 -0038 -0026 -0033 -0049
Max 0002 0011 0015 0021 0025 0032 0046
Average 00032 00027 00032 00038 00061 00054 00065
Var 00000 00001 00001 00001 00001 00002 00002
n 28 28 28 28 28 28 28
sqrt(varn) 0001 0001 0002 0002 0002 0002 0002
Z score 3045 1903 1885 2206 2688 2326 2628
P-value 000 003 003 001 000 001 000
SD 0006 0007 0009 0009 0012 0012 0013
Min -0005 -0010 -0012 -0015 -0012 -0025 -0028
Max 0014 0024 0022 0018 0050 0031 0026
Average -00005 00003 00002 00010 00011 -00006 00013
Var 00000 00001 00001 00001 00002 00003 00002
n 49 49 49 49 49 49 49
sqrt(varn) 0001 0001 0002 0002 0002 0002 0002
Z score -0597 0243 0092 0586 0562 -0258 0621
P-value 028 040 046 028 029 040 027
SD 0006 0010 0012 0012 0014 0016 0014
Min -0017 -0022 -0035 -0031 -0037 -0033 -0031
Max 0012 0025 0025 0024 0031 0037 0032
At 5 level of significance
0002
Bullish
Engulfing0000
With RSI
Filter
Holding period
0004Bullish
Hammer0006
Piercing Lines -0005
Bullish Doji
Star0004
With RSI
Filter
Holding period
0007
Bullish
Candlestick
Patterns
Descriptive
Statistics
Holding
Periods
Average
Holding period
Dark-Cloud
Cover
Shooting Star
Bearish
Engulfing
0007
-0001
0001
0002
Holding periodHolding
Periods
Average
Bearish
Candlestick
Patterns
Descriptive
Statistics
Hanging Man
ID 100068
92
Appendix 3 Descriptive statistics of the eight candle pattern analysis for USDCAD
1 Day 2 Days 3 Days 4 Days 5 Days 7 Days 10 Days 1 Day 2 Days 3 Days 4 Days 5 Days 7 Days 10 DaysAverage 00053 00058 00068 00063 00072 00069 00066 00049 00055 00077 00068 00083 00092 00087
Var 00000 00000 00001 00001 00002 00003 00005 00000 00000 00001 00001 00001 00002 00003
n 79 79 79 79 79 79 79 44 44 44 44 44 44 44
sqrt(varn) 0000 0001 0001 0001 0001 0002 0003 0001 0001 0001 0002 0002 0002 0003
Z score 11920 7456 6379 4888 4907 3632 2555 8727 5249 5633 4399 4697 4543 3218
P-value 000 000 000 000 000 000 001 000 000 000 000 000 000 000
SD 0004 0007 0009 0011 0013 0017 0023 000 001 001 001 001 001 002
Min -0001 -0009 -0015 -0026 -0023 -0044 -0090 0000 -0008 -0015 -0020 -0016 -0033 -0031
Max 0016 0032 0036 0043 0059 0062 0088 0015 0022 0029 0024 0029 0028 0035
Average -00039 -00029 -00044 -00040 00016 -00041 00094
Var 00000 00003 00003 00003 00000 00002 00000
n 2 2 2 2 2 2 2
sqrt(varn) 0005 0012 0012 0012 0005 0010 0001
Z score -0794 -0250 -0373 -0331 0363 -0411 9400
P-value 021 040 035 037 036 034 000
SD 001 002 002 002 001 001 000
Min -0009 -0015 -0016 -0016 -0003 -0014 0008
Max 0001 0009 0007 0008 0006 0006 0010
Average 00056 00055 00058 00057 00064 00068 00069 00064 00062 00059 00054 00053 00065 00073
Var 00000 00001 00001 00001 00002 00003 00004 00000 00001 00001 00002 00002 00003 00005
n 240 240 240 240 240 240 240 108 108 108 108 108 108 108
sqrt(varn) 0000 0001 0001 0001 0001 0001 0001 0001 0001 0001 0001 0001 0002 0002
Z score 17964 9992 9069 7432 7383 6354 5191 11585 6832 5480 4375 4085 4026 3515
P-value 000 000 000 000 000 000 000 000 000 000 000 000 000 000
SD 0005 0008 0010 0012 0013 0016 0021 0006 0009 0011 0013 0014 0017 0022
Min -0002 -0024 -0022 -0024 -0029 -0046 -0109 0000 -0008 -0022 -0024 -0029 -0046 -0109
Max 0028 0059 0043 0047 0050 0066 0060 0028 0059 0043 0046 0039 0066 0056
Average -00002 00009 00003 00003 00005 00005 00020
Var 00001 00001 00002 00002 00003 00003 00005
n 171 171 171 171 171 171 171
sqrt(varn) 0001 0001 0001 0001 0001 0001 0002
Z score -0428 1065 0340 0237 0388 0367 1237
P-value 033 014 037 041 035 036 011
SD 001 001 001 001 002 002 002
Min -0031 -0033 -0037 -0035 -0044 -0054 -0053
Max 0046 0069 0058 0089 0120 0078 0073
1 Day 2 Days 3 Days 4 Days 5 Days 7 Days 10 Days 1 Day 2 Days 3 Days 4 Days 5 Days 7 Days 10 DaysAverage 00057 00055 00054 00047 00053 00057 00052 00052 00026 00027 00021 -00002 00014 00010
Var 00000 00001 00002 00001 00003 00004 00005 00000 00001 00001 00001 00002 00002 00002
n 58 58 58 58 58 58 58 25 25 25 25 25 25 25
sqrt(varn) 0001 0002 0002 0002 0002 0002 0003 0001 0002 0002 0002 0003 0003 0003
Z score 8061 3627 3039 2963 2402 2294 1775 6554 1535 1686 1112 -0076 0517 0347
P-value 000 000 000 000 001 001 004 000 006 005 013 047 030 036
SD 0005 0012 0014 0012 0017 0019 0022 000 001 001 001 001 001 001
Min 0000 -0016 -0022 -0020 -0031 -0024 -0044 0000 -0016 -0010 -0010 -0031 -0024 -0022
Max 0025 0043 0070 0043 0058 0072 0111 0013 0025 0021 0030 0025 0027 0043
Average 00055 00055 00080 00058 00075 00116 00160
Var 00000 00001 00003 00001 00003 00008 00006
n 8 8 8 8 8 8 8
sqrt(varn) 0002 0003 0006 0004 0006 0010 0009
Z score 3026 1927 1333 1358 1298 1182 1811
P-value 000 003 009 009 010 012 004
SD 0005 0008 0017 0012 0016 0028 0025
Min -0005 -0009 -0010 -0008 -0012 -0035 -0015
Max 0013 0015 0039 0030 0037 0044 0058
Average 00007 00034 00055 00036 00043 00044 00077
Var 00001 00002 00003 00002 00003 00005 00009
n 19 19 19 19 19 19 19
sqrt(varn) 0002 0003 0004 0003 0004 0005 0007
Z score 0382 1158 1275 1115 1085 0882 1133
P-value 035 012 010 013 014 019 013
SD 0008 0013 0019 0014 0017 0022 0030
Min -0013 -0016 -0030 -0028 -0026 -0035 -0036
Max 0025 0043 0070 0043 0058 0072 0111
Average -00014 -00025 -00014 -00023 -00008 -00011 -00034
Var 00000 00001 00001 00001 00001 00003 00002
n 35 35 35 35 35 35 35
sqrt(varn) 0001 0001 0002 0002 0002 0003 0003
Z score -1851 -1755 -0847 -1241 -0409 -0375 -1343
P-value 003 004 020 011 034 035 009
SD 0005 0008 0010 0011 0011 0017 0015
Min -0012 -0026 -0024 -0024 -0034 -0042 -0034
Max 0009 0012 0024 0019 0018 0030 0027
At 5 level of significance
Bullish
Engulfing-0002
Bullish
Hammer0005 0002
Piercing Lines 0009
Bullish Doji
Star0004
Holding period
Shooting Star 0006 0006
Bearish
Engulfing0001
Bullish
Candlestick
Descriptive
Statistics
Holding
Periods
Holding period With RSI
Filter
Hanging Man 0006 0007
Dark-Cloud
Cover-0001
Holding periodBearish
Candlestick
Patterns
Descriptive
Statistics
Holding
Periods
Average
Holding periodWith RSI
Filter
ID 100068
93
Appendix 4 Descriptive statistics of the eight candle pattern analysis for EURUSD
1 Day 2 Days 3 Days 4 Days 5 Days 7 Days 10 Days 1 Day 2 Days 3 Days 4 Days 5 Days 7 Days 10 DaysAverage 00060 00063 00053 00044 00035 00046 00043 00058 00072 00049 00054 00048 00046 00039
Var 00000 00001 00002 00002 00003 00004 00006 00000 00001 00001 00002 00003 00003 00004
n 106 106 106 106 106 106 106 57 57 57 57 57 57 57
sqrt(varn) 0001 0001 0001 0001 0002 0002 0002 0001 0001 0002 0002 0002 0002 0003
Z score 11057 6201 4199 3044 2185 2435 1841 7749 5822 3207 2860 2254 2000 1476
P-value 000 000 000 000 001 001 003 000 000 000 000 001 002 007
SD 0006 0011 0013 0015 0016 0019 0024 001 001 001 001 002 002 002
Min -0004 -0021 -0022 -0036 -0035 -0031 -0085 -0002 -0012 -0018 -0024 -0032 -0025 -0034
Max 0029 0032 0038 0044 0043 0058 0061 0029 0032 0038 0044 0043 0053 0047
Average 00004 -00009 -00024 -00043 -00081 -00047 -00059
Var 00002 00001 00003 00003 00003 00004 00005
n 7 7 7 7 7 7 7
sqrt(varn) 0005 0004 0006 0007 0007 0008 0008
Z score 0094 -0229 -0386 -0623 -1190 -0613 -0735
P-value 046 059 065 073 088 073 077
SD 001 001 002 002 002 002 002
Min -0020 -0009 -0028 -0025 -0027 -0025 -0025
Max 0018 0017 0020 0026 0018 0030 0032
Average 00066 00065 00138 00133 00147 00221 00227 00064 00054 00216 00202 00218 00359 00360
Var 00000 00001 00098 00099 00099 00194 00197 00000 00001 00201 00202 00203 00398 00399
n 181 181 181 181 181 181 181 87 87 87 87 87 87 87
sqrt(varn) 0000 0001 0007 0007 0007 0010 0010 0001 0001 0015 0015 0015 0021 0021
Z score 14089 7642 1877 1803 1981 2132 2179 9528 4571 1422 1327 1431 1678 1681
P-value 000 000 003 004 002 002 001 000 000 008 009 008 005 005
SD 0006 0012 0099 0099 0100 0139 0140 0006 0011 0142 0142 0142 0199 0200
Min -0001 -0022 -0041 -0056 -0039 -0036 -0091 -0001 -0022 -0023 -0024 -0027 -0036 -0048
Max 0033 0052 1323 1323 1323 1323 1323 0033 0052 1323 1323 1323 1323 1323
Average 00006 00007 00010 00016 00016 00012 00000
Var 00001 00002 00002 00002 00003 00004 00007
n 156 156 156 156 156 156 156
sqrt(varn) 0001 0001 0001 0001 0001 0002 0002
Z score 0748 0671 0852 1316 1188 0707 0002
P-value 023 025 020 009 012 024 050
SD 001 001 001 002 002 002 003
Min -0022 -0031 -0030 -0041 -0035 -0041 -0066
Max 0030 0039 0053 0043 0050 0071 0080
1 Day 2 Days 3 Days 4 Days 5 Days 7 Days 10 Days 1 Day 2 Days 3 Days 4 Days 5 Days 7 Days 10 DaysAverage 00069 00085 00103 00097 00082 00111 00137 00064 00080 00094 00085 00060 00108 00162
Var 00000 00001 00002 00002 00003 00004 00008 00000 00001 00001 00002 00003 00005 00010
n 64 64 64 64 64 64 64 34 34 34 34 34 34 34
sqrt(varn) 0001 0001 0002 0002 0002 0003 0003 0001 0001 0002 0002 0003 0004 0005
Z score 9122 5806 5359 5122 3939 4311 3942 7655 5739 5329 3898 2012 2946 3011
P-value 000 000 000 000 000 000 000 000 000 000 000 002 000 000
SD 0006 0012 0015 0015 0017 0021 0028 000 001 001 001 002 002 003
Min 0000 -0009 -0012 -0020 -0036 -0031 -0039 0001 -0004 -0007 -0016 -0036 -0025 -0031
Max 0034 0073 0103 0084 0055 0067 0170 0020 0028 0032 0032 0043 0067 0170
Average -00016 -00036 -00047 -00048 -00037 -00073 -00029
Var 00000 00000 00001 00001 00002 00007 00007
n 7 7 7 7 7 7 7
sqrt(varn) 0002 0001 0003 0004 0005 0010 0010
Z score -0787 -4245 -1554 -1222 -0737 -0746 -0296
P-value 022 000 006 011 023 023 038
SD 0005 0002 0008 0010 0013 0026 0026
Min -0009 -0006 -0017 -0017 -0020 -0045 -0044
Max 0008 -0001 0006 0009 0010 0016 0026
Average -00008 00002 00016 00013 00008 00001 00033
Var 00000 00001 00001 00002 00002 00001 00002
n 15 15 15 15 15 15 15
sqrt(varn) 0002 0002 0003 0003 0004 0003 0003
Z score -0494 0094 0594 0387 0216 0045 1003
P-value 031 046 028 035 041 048 016
SD 0006 0009 0010 0013 0014 0012 0013
Min -0011 -0016 -0014 -0016 -0028 -0023 -0017
Max 0016 0015 0018 0024 0021 0023 0027
Average -00010 00000 -00011 -00024 -00013 00019 00050
Var 00001 00001 00002 00002 00002 00004 00008
n 49 49 49 49 49 49 49
sqrt(varn) 0001 0002 0002 0002 0002 0003 0004
Z score -0861 0013 -0613 -1188 -0609 0677 1270
P-value 019 051 027 012 027 075 090
SD 0009 0012 0013 0014 0015 0020 0028
Min -0022 -0028 -0028 -0031 -0046 -0040 -0045
Max 0032 0047 0030 0030 0026 0065 0139
At 5 level of significance
Bullish
Engulfing0000
Bullish
Hammer0010 0009
Piercing Lines -0004
Bullish Doji
Star0001
Holding period
Shooting Star 0014 0021
Bearish
Engulfing0001
Bullish
Candlestick
Descriptive
Statistics
Holding
Periods
Holding period With RSI
Filter
Hanging Man 0005 0005
Dark-Cloud
Cover-0004
Holding periodBearish
Candlestick
Patterns
Descriptive
Statistics
Holding
Periods
Average
Holding periodWith RSI
Filter
ID 100068
94
Appendix 5 Descriptive statistics of the eight candle pattern analysis for GBPUSD
1 Day 2 Days 3 Days 4 Days 5 Days 7 Days 10 Days 1 Day 2 Days 3 Days 4 Days 5 Days 7 Days 10 DaysAverage 00067 00061 00053 00049 00054 00065 00058 00061 00055 00052 00053 00057 00048 00027
Var 00000 00002 00002 00003 00004 00008 00011 00000 00001 00002 00003 00004 00007 00010
n 99 99 99 99 99 99 99 57 57 57 57 57 57 57
sqrt(varn) 0001 0001 0002 0002 0002 0003 0003 0001 0001 0002 0002 0003 0004 0004
Z score 10008 4341 3443 2727 2588 2316 1757 7854 3929 2641 2212 2127 1368 0651
P-value 000 000 000 000 000 001 004 000 000 000 001 002 009 026
SD 0007 0014 0015 0018 0021 0028 0033 001 001 001 002 002 003 003
Min -0001 -0019 -0028 -0052 -0063 -0070 -0071 -0001 -0015 -0026 -0052 -0063 -0070 -0071
Max 0039 0078 0057 0063 0063 0109 0124 0031 0045 0057 0063 0057 0081 0124
Average 00014 00033 00006 -00084 -00093 00030 00053
Var NA NA NA NA NA NA NA
n 1 1 1 1 1 1 1
sqrt(varn) NA NA NA NA NA NA NA
Z score NA NA NA NA NA NA NA
P-value NA NA NA NA NA NA NA
SD NA NA NA NA NA NA NA
Min 0001 0003 0001 -0008 -0009 0003 0005
Max 0001 0003 0001 -0008 -0009 0003 0005
Average 00076 00083 00079 00157 00170 00178 00196 00086 00100 00096 00083 00102 00100 00117
Var 00001 00002 00003 00136 00137 00138 00142 00001 00003 00004 00006 00009 00010 00014
n 197 197 197 197 197 197 197 93 93 93 93 93 93 93
sqrt(varn) 0001 0001 0001 0008 0008 0008 0008 0001 0002 0002 0003 0003 0003 0004
Z score 14462 8325 6124 1888 2040 2118 2304 9759 5952 4630 3246 3344 3118 3013
P-value 000 000 000 003 002 002 001 000 000 000 000 000 000 000
SD 0007 0014 0018 0116 0117 0118 0119 0008 0016 0020 0025 0029 0031 0037
Min -0009 -0026 -0048 -0061 -0054 -0065 -0079 -0007 -0026 -0043 -0051 -0054 -0047 -0070
Max 0037 0093 0088 1614 1614 1614 1614 0037 0093 0088 0097 0107 0117 0151
Average 00004 00003 00130 00132 00125 00112 00127
Var 00001 00003 00200 00201 00202 00204 00208
n 131 131 131 131 131 131 131
sqrt(varn) 0001 0001 0012 0012 0012 0012 0013
Z score 0427 0200 1053 1063 1007 0898 1005
P-value 033 042 015 014 016 018 016
SD 001 002 014 014 014 014 014
Min -0027 -0041 -0042 -0056 -0059 -0075 -0097
Max 0055 0067 1610 1610 1610 1610 1610
1 Day 2 Days 3 Days 4 Days 5 Days 7 Days 10 Days 1 Day 2 Days 3 Days 4 Days 5 Days 7 Days 10 DaysAverage 00070 00061 00054 00066 00086 00079 00080 00088 00098 00090 00123 00141 00132 00120
Var 00000 00001 00002 00003 00004 00006 00009 00000 00001 00002 00003 00004 00007 00012
n 97 97 97 97 97 97 97 37 37 37 37 37 37 37
sqrt(varn) 0001 0001 0001 0002 0002 0002 0003 0001 0002 0002 0003 0003 0004 0006
Z score 12056 5534 3889 3736 4265 3309 2568 8059 5146 3929 4206 4140 3036 2071
P-value 000 000 000 000 000 000 001 000 000 000 000 000 000 002
SD 0006 0011 0014 0017 0020 0024 0031 001 001 001 002 002 003 004
Min -0002 -0019 -0024 -0032 -0036 -0043 -0119 -0001 -0011 -0020 -0032 -0036 -0043 -0119
Max 0028 0042 0049 0058 0078 0088 0108 0028 0042 0049 0058 0078 0088 0108
Average -00011 00063 -00025 -00111 -00083 -00198 -00086
Var 00002 00007 00011 00022 00021 00051 00014
n 7 7 7 7 7 7 7
sqrt(varn) 0006 0010 0013 0018 0017 0027 0014
Z score -0194 0628 -0192 -0626 -0486 -0736 -0605
P-value 042 027 042 027 031 023 027
SD 0015 0026 0034 0047 0045 0071 0038
Min -0018 -0026 -0063 -0102 -0099 -0178 -0088
Max 0024 0054 0043 0047 0047 0034 0021
Average -00013 00003 -00017 -00042 -00036 -00049 -00070
Var 00001 00001 00002 00003 00008 00011 00020
n 17 17 17 17 17 17 17
sqrt(varn) 0002 0003 0003 0005 0007 0008 0011
Z score -0562 0106 -0559 -0930 -0519 -0618 -0649
P-value 029 046 029 018 030 027 026
SD 0009 0011 0012 0019 0028 0033 0045
Min -0024 -0021 -0025 -0049 -0073 -0109 -0149
Max 0009 0015 0023 0020 0026 0027 0040
Average 00010 00020 00031 00038 00018 -00009 00043
Var 00001 00002 00003 00003 00004 00006 00008
n 48 48 48 48 48 48 48
sqrt(varn) 0002 0002 0003 0003 0003 0004 0004
Z score 0622 0980 1203 1505 0648 -0253 1057
P-value 027 016 011 007 026 040 015
SD 0011 0014 0018 0018 0020 0025 0028
Min -0024 -0026 -0044 -0036 -0057 -0066 -0085
Max 0031 0044 0044 0049 0037 0058 0084
At 5 level of significance
Bullish
Engulfing0002
Bullish
Hammer0007 0011
Piercing Lines -0006
Bullish Doji
Star-0003
Holding period
Shooting Star 0013 0010
Bearish
Engulfing0009
Bullish
Candlestick
Descriptive
Statistics
Holding
Periods
Holding period With RSI
Filter
Hanging Man 0006 0005
Dark-Cloud
Cover-0001
Holding periodBearish
Candlestick
Patterns
Descriptive
Statistics
Holding
Periods
Average
Holding periodWith RSI
Filter
ID 100068
95
Appendix 6 Descriptive statistics of the eight candle pattern analysis for USDINR
1 Day 2 Days 3 Days 4 Days 5 Days 7 Days 10 Days 1 Day 2 Days 3 Days 4 Days 5 Days 7 Days 10 DaysAverage 00878 00685 00760 00671 00864 01322 00653 00978 00930 00774 00790 00750 01638 00823
Var 00250 00591 00938 01514 02612 03663 03983 00374 00726 01313 02246 03039 04316 04429
n 69 69 69 69 69 69 69 39 39 39 39 39 39 39
sqrt(varn) 0019 0029 0037 0047 0062 0073 0076 0031 0043 0058 0076 0088 0105 0107
Z score 4611 2342 2060 1432 1405 1814 0859 3156 2155 1334 1041 0850 1558 0772
P-value 000 001 002 008 008 003 020 000 002 009 015 020 006 022
SD 0158 0243 0306 0389 0511 0605 0631 019 027 036 047 055 066 067
Min -0150 -0560 -0870 -1200 -1510 -1300 -1500 -0140 -0560 -0870 -1200 -1510 -1300 -1500
Max 0790 0880 0900 1500 1790 2470 2090 0790 0880 0900 1500 1620 2470 1825
Average 00050 -00150 -00250 00450 00500 00750 00950
Var 00000 00001 00005 00004 00002 00004 00005
n 2 2 2 2 2 2 2
sqrt(varn) 0005 0005 0015 0015 0010 0015 0015
Z score 1000 -3000 -1667 3000 5000 5000 6333
P-value 016 000 005 000 000 000 000
SD 001 001 002 002 001 002 002
Min 0000 -0020 -0040 0030 0040 0060 0080
Max 0010 -0010 -0010 0060 0060 0090 0110
Average -00684 -00692 -00759 -00699 -00692 -00661 -00647 -00865 -01014 -01246 -01153 -01164 -01473 -01630
Var 71804 72368 72772 72878 73689 74004 75017 81040 81589 81685 81601 82796 82566 83881
n 549 549 549 549 549 549 549 244 244 244 244 244 244 244
sqrt(varn) 0114 0115 0115 0115 0116 0116 0117 0182 0183 0183 0183 0184 0184 0185
Z score -0598 -0603 -0660 -0607 -0597 -0570 -0554 -0474 -0554 -0681 -0630 -0632 -0801 -0879
P-value 027 027 025 027 028 028 029 032 029 025 026 026 021 019
SD 2680 2690 2698 2700 2715 2720 2739 2847 2856 2858 2857 2877 2873 2896
Min -44310 -44390 -44400 -44420 -44490 -44550 -44480 -44310 -44390 -44340 -44100 -44290 -44240 -44420
Max 1220 2020 2080 2760 2790 2320 2550 1150 1470 1590 2760 2790 2050 2300
Average 00273 09833 09691 09676 09295 08935 18775
Var 00406 547179 547892 548641 550897 552705 1076427
n 55 55 55 55 55 55 55
sqrt(varn) 0027 0997 0998 0999 1001 1002 1399
Z score 1003 0986 0971 0969 0929 0891 1342
P-value 016 016 017 017 018 019 009
SD 020 740 740 741 742 743 1038
Min -0500 -0750 -1010 -0930 -1800 -1630 -1370
Max 0790 54800 54800 54800 54800 54800 54800
1 Day 2 Days 3 Days 4 Days 5 Days 7 Days 10 Days 1 Day 2 Days 3 Days 4 Days 5 Days 7 Days 10 DaysAverage 01364 01059 01434 01296 02064 02481 03112 01450 00992 00837 01100 01362 02317 02908
Var 00210 00518 01254 02227 02393 03067 05032 00112 00486 00968 02973 02659 02819 02750
n 40 40 40 40 40 40 40 12 12 12 12 12 12 12
sqrt(varn) 0023 0036 0056 0075 0077 0088 0112 0031 0064 0090 0157 0149 0153 0151
Z score 5948 2943 2562 1737 2669 2834 2775 4743 1558 0932 0699 0915 1511 1921
P-value 000 000 001 004 000 000 000 000 006 018 024 018 007 003
SD 0145 0228 0354 0472 0489 0554 0709 011 022 031 055 052 053 052
Min -0090 -0370 -0340 -0720 -0660 -0910 -1650 -0030 -0370 -0240 -0720 -0580 -0460 -0290
Max 0670 0660 1070 1355 1440 1750 2360 0340 0505 0815 1355 1265 1250 1340
Average 00305 00740 -16351 -16328 -15828 -16388 -17586
Var 00434 01844 916844 917174 918881 917544 915284
n 33 33 33 33 33 33 33
sqrt(varn) 0036 0075 1667 1667 1669 1667 1665
Z score 0840 0989 -0981 -0979 -0949 -0983 -1056
P-value 020 016 016 016 017 016 015
SD 0208 0429 9575 9577 9586 9579 9567
Min -0290 -0960 -54939 -54939 -54939 -54939 -54939
Max 0760 1710 0790 1000 1470 1120 1160
Average -00033 -00201 -00382 -00309 -04374 -04235 -04118
Var 00204 00321 00447 00578 227763 228851 229692
n 133 133 133 133 133 133 133
sqrt(varn) 0012 0016 0018 0021 0414 0415 0416
Z score -0264 -1291 -2085 -1483 -1057 -1021 -0991
P-value 040 010 002 007 015 015 016
SD 0143 0179 0211 0240 4772 4784 4793
Min -0570 -0930 -0860 -1380 -54980 -54980 -54980
Max 0700 0690 1000 0670 0710 1970 2160
Average 00492 01023 01242 01321 01683 01635 01580
Var 00392 00676 01072 01827 03210 04220 04971
n 65 65 65 65 65 65 65
sqrt(varn) 0025 0032 0041 0053 0070 0081 0087
Z score 2003 3173 3059 2491 2395 2029 1807
P-value 002 000 000 001 001 002 004
SD 0198 0260 0327 0427 0567 0650 0705
Min -0350 -0320 -0480 -0620 -1200 -1150 -1350
Max 1090 1210 1170 1375 1885 2360 2020
At 5 level of significance
Bullish
Engulfing0128
Bullish
Hammer0183 0157
Piercing Lines -1163
Bullish Doji
Star-0195
Holding period
Shooting Star -0069 -0122
Bearish
Engulfing0950
Bullish
Candlestick
Descriptive
Statistics
Holding
Periods
Holding period With RSI
Filter
Hanging Man 0083 0095
Dark-Cloud
Cover0033
Holding periodBearish
Candlestick
Patterns
Descriptive
Statistics
Holding
Periods
Average
Holding periodWith RSI
Filter
ID 100068
96
Appendix 7 Descriptive statistics of the eight candle pattern analysis for USDJPY
1 Day 2 Days 3 Days 4 Days 5 Days 7 Days 10 Days 1 Day 2 Days 3 Days 4 Days 5 Days 7 Days 10 DaysAverage 04627 04714 04714 04802 04465 05732 11671 03676 03777 03810 04011 05360 07405 17862
Var 02363 07149 13438 15472 21160 28719 488549 01087 04250 10271 13060 18991 28927 888050
n 155 155 155 155 155 155 155 82 82 82 82 82 82 82
sqrt(varn) 0039 0068 0093 0100 0117 0136 0561 0036 0072 0112 0126 0152 0188 1041
Z score 11851 6941 5063 4806 3822 4211 2079 10095 5246 3404 3178 3522 3942 1716
P-value 000 000 000 000 000 000 002 000 000 000 000 000 000 004
SD 0486 0846 1159 1244 1455 1695 6990 033 065 101 114 138 170 942
Min -0260 -1240 -2580 -3470 -4190 -3010 -3720 -0260 -0750 -2580 -3470 -4190 -3010 -3720
Max 3730 5210 4350 5260 4710 5770 84360 1220 2010 3320 2990 4710 5770 84360
Average 05050 02725 02975 01250 00200 01800 06800
Var 01947 14612 41297 20731 40901 85650 82270
n 4 4 4 4 4 4 4
sqrt(varn) 0221 0604 1016 0720 1011 1463 1434
Z score 2289 0451 0293 0174 0020 0123 0474
P-value 001 033 038 043 049 045 032
SD 044 121 203 144 202 293 287
Min -0040 -1320 -2180 -1620 -2420 -3330 -3290
Max 0950 1280 2570 1850 2520 3300 3100
Average 05516 05495 05417 05094 05444 05442 06372 05869 06464 06567 06036 06421 05719 07360
Var 02540 06708 11223 15253 19160 29185 34308 03170 09840 13320 20250 24616 29482 30796
n 190 190 190 190 190 190 190 75 75 75 75 75 75 75
sqrt(varn) 0037 0059 0077 0090 0100 0124 0134 0065 0115 0133 0164 0181 0198 0203
Z score 15089 9247 7049 5685 5421 4391 4742 9029 5643 4928 3673 3544 2884 3632
P-value 000 000 000 000 000 000 000 000 000 000 000 000 000 000
SD 0504 0819 1059 1235 1384 1708 1852 0563 0992 1154 1423 1569 1717 1755
Min -0130 -1320 -2180 -3600 -4150 -3330 -3760 -0110 -1200 -1470 -3600 -4150 -3300 -3760
Max 2680 4170 4210 4790 5130 5810 6580 2680 4170 4210 4790 4530 5810 4820
Average -00060 00189 01251 01894 01125 01518 02117
Var 04819 08791 15597 20948 21718 28314 38831
n 181 181 181 181 181 181 181
sqrt(varn) 0052 0070 0093 0108 0110 0125 0146
Z score -0117 0271 1348 1761 1027 1213 1445
P-value 045 039 009 004 015 011 007
SD 069 094 125 145 147 168 197
Min -1880 -2970 -2760 -3470 -3690 -3850 -4420
Max 3360 2640 6200 7680 4080 5490 5600
1 Day 2 Days 3 Days 4 Days 5 Days 7 Days 10 Days 1 Day 2 Days 3 Days 4 Days 5 Days 7 Days 10 DaysAverage 04693 04789 04751 04302 03855 -04991 -05064 04929 04990 05166 04418 03647 -00148 00368
Var 01443 05276 10453 13083 19334 620913 638899 01684 06561 12318 14783 25952 33189 48136
n 120 120 120 120 120 120 120 62 62 62 62 62 62 62
sqrt(varn) 0035 0066 0093 0104 0127 0719 0730 0052 0103 0141 0154 0205 0231 0279
Z score 13534 7223 5090 4120 3037 -0694 -0694 9457 4851 3665 2861 1782 -0064 0132
P-value 000 000 000 000 000 024 024 000 000 000 000 004 047 045
SD 0380 0726 1022 1144 1390 7880 7993 041 081 111 122 161 182 219
Min -0160 -1280 -3770 -3800 -7360 -84210 -84210 -0040 -1280 -3770 -3800 -7360 -4810 -4990
Max 1520 2670 2960 2540 3400 3540 7260 1520 2670 2960 2540 3120 3130 4480
Average 0297 0563 -0032 -0018 -0037 -0153 0130
Var 0259 0265 0314 0544 0770 3447 7578
n 4 4 4 4 4 4 4
sqrt(varn) 0254 0257 0280 0369 0439 0928 1376
Z score 117 219 -012 -005 -009 -016 009
P-value 0121 0014 0454 0481 0466 0435 0462
SD 0508 0514 0560 0738 0878 1857 2753
Min -0140 0000 -0680 -0660 -0740 -2390 -3950
Max 0990 1160 0550 0980 1170 1740 1800
Average 00712 -00032 00100 -00100 -00524 -02624 -02920
Var 02879 03971 06164 12216 16133 26647 45166
n 25 25 25 25 25 25 25
sqrt(varn) 0107 0126 0157 0221 0254 0326 0425
Z score 0664 -0025 0064 -0045 -0206 -0804 -0687
P-value 025 049 047 048 042 021 025
SD 0537 0630 0785 1105 1270 1632 2125
Min -1680 -1890 -1980 -3480 -3600 -3740 -4560
Max 1140 1050 1780 2400 2740 2590 3550
Average -00151 -00058 01167 -00253 00518 00553 00973
Var 03934 06098 10455 14099 17290 22702 26855
n 45 45 45 45 45 45 45
sqrt(varn) 0094 0116 0152 0177 0196 0225 0244
Z score -0162 -0050 0765 -0143 0264 0246 0398
P-value 044 048 022 044 040 040 035
SD 0627 0781 1022 1187 1315 1507 1639
Min -2020 -1640 -1840 -3270 -2550 -3270 -3360
Max 1350 1930 2250 2260 2700 3280 3800
At 5 level of significance
Bullish
Engulfing0039
Bullish
Hammer0176 0334
Piercing Lines 0107
Bullish Doji
Star-0077
Holding period
Shooting Star 0554 0635
Bearish
Engulfing0115
Bullish
Candlestick
Descriptive
Statistics
Holding
Periods
Holding period With RSI
Filter
Hanging Man 0582 0656
Dark-Cloud
Cover0297
Holding periodBearish
Candlestick
Patterns
Descriptive
Statistics
Holding
Periods
Average
Holding periodWith RSI
Filter
ID 100068
97
Appendix 8 Descriptive statistics of the eight candle pattern analysis for USDZAR
1 Day 2 Days 3 Days 4 Days 5 Days 7 Days 10 Days 1 Day 2 Days 3 Days 4 Days 5 Days 7 Days 10 DaysAverage 00612 00633 00436 00500 00405 00355 00221 00640 00753 00492 00552 00488 00499 00218
Var 00051 00115 00404 00311 00371 00634 01094 00061 00145 00606 00420 00478 00830 01432
n 123 123 123 123 123 123 123 71 71 71 71 71 71 71
sqrt(varn) 0006 0010 0018 0016 0017 0023 0030 0009 0014 0029 0024 0026 0034 0045
Z score 9486 6547 2408 3143 2333 1564 0742 6891 5276 1682 2272 1879 1459 0486
P-value 000 000 001 000 001 006 023 000 000 005 001 003 007 031
SD 0072 0107 0201 0176 0193 0252 0331 008 012 025 020 022 029 038
Min -0017 -0193 -1491 -0776 -0771 -1411 -1956 -0016 -0193 -1491 -0776 -0771 -1411 -1956
Max 0386 0591 0756 0701 0711 1041 1245 0386 0591 0756 0701 0711 1041 1245
Average -00173 00100 02250 01815 01525 01356 01625
Var 00008 00060 00300 00186 00015 00310 00630
n 2 2 2 2 2 2 2
sqrt(varn) 0020 0055 0123 0097 0027 0124 0178
Z score -0878 0182 1837 1881 5545 1090 0915
P-value 081 043 003 003 000 014 018
SD 003 008 017 014 004 018 025
Min -0037 -0045 0103 0085 0125 0011 -0015
Max 0002 0065 0348 0278 0180 0260 0340
Average 00629 00639 00647 01014 01293 01668 01766 00650 00596 00633 00707 00639 00715 00689
Var 00029 00130 00261 02831 05460 08072 08148 00035 00181 00321 00364 00561 00624 00686
n 282 282 282 282 282 282 282 129 129 129 129 129 129 129
sqrt(varn) 0003 0007 0010 0032 0044 0054 0054 0005 0012 0016 0017 0021 0022 0023
Z score 19658 9415 6726 3200 2939 3118 3286 12478 5039 4010 4212 3064 3252 2987
P-value 000 000 000 000 000 000 000 000 000 000 000 000 000 000
SD 0054 0114 0161 0532 0739 0898 0903 0059 0134 0179 0191 0237 0250 0262
Min -0040 -0290 -0601 -0610 -1325 -1310 -1175 -0040 -0290 -0395 -0610 -1325 -1310 -1175
Max 0363 0930 1380 8521 8523 8531 8531 0363 0930 1380 1285 1390 1480 1033
Average 00006 00056 00022 00018 -00057 -00049 00112
Var 00085 00214 00259 00296 00422 00481 00671
n 129 129 129 129 129 129 129
sqrt(varn) 0008 0013 0014 0015 0018 0019 0023
Z score 0070 0435 0155 0118 -0315 -0255 0489
P-value 047 033 044 045 062 060 031
SD 009 015 016 017 021 022 026
Min -0419 -0541 -0538 -0708 -1298 -1078 -1248
Max 0440 0762 0590 0610 0408 0650 0780
1 Day 2 Days 3 Days 4 Days 5 Days 7 Days 10 Days 1 Day 2 Days 3 Days 4 Days 5 Days 7 Days 10 DaysAverage 00810 00799 00903 00956 01014 00867 00925 00467 00517 00632 00622 00693 00713 00956
Var 00328 00205 00284 00330 00525 00750 00827 00012 00124 00213 00191 00221 00396 00595
n 85 85 85 85 85 85 85 41 41 41 41 41 41 41
sqrt(varn) 0020 0016 0018 0020 0025 0030 0031 0005 0017 0023 0022 0023 0031 0038
Z score 4123 5140 4944 4852 4078 2919 2965 8579 2970 2772 2882 2983 2296 2511
P-value 100 100 100 100 100 100 100 100 100 100 100 100 099 099
SD 0181 0143 0168 0182 0229 0274 0288 003 011 015 014 015 020 024
Min -0025 -0162 -0339 -0222 -0270 -0242 -0361 0000 -0120 -0172 -0222 -0270 -0190 -0301
Max 1590 0875 0870 1030 1510 1920 1120 0153 0590 0683 0510 0520 0670 0640
Average NA NA NA NA NA NA NA
Var NA NA NA NA NA NA NA
n NA NA NA NA NA NA NA
sqrt(varn) NA NA NA NA NA NA NA
Z score NA NA NA NA NA NA NA
P-value NA NA NA NA NA NA NA
SD NA NA NA NA NA NA NA
Min NA NA NA NA NA NA NA
Max NA NA NA NA NA NA NA
Average -00288 -00236 -00082 -00125 -00316 00166 00188
Var 00080 00105 00121 00150 00173 00147 00475
n 17 17 17 17 17 17 17
sqrt(varn) 0022 0025 0027 0030 0032 0029 0053
Z score -1331 -0949 -0307 -0420 -0993 0564 0356
P-value 009 017 038 034 016 029 036
SD 0089 0103 0110 0122 0131 0121 0218
Min -0210 -0230 -0208 -0290 -0243 -0195 -0452
Max 0163 0120 0136 0226 0216 0263 0603
Average -00025 00433 00371 00491 00388 00854 01325
Var 00075 00125 00157 00230 00331 00721 01151
n 26 26 26 26 26 26 26
sqrt(varn) 0017 0022 0025 0030 0036 0053 0067
Z score -0145 1973 1509 1651 1089 1622 1991
P-value 044 098 093 095 086 095 098
SD 0087 0112 0125 0152 0182 0268 0339
Min -0246 -0116 -0120 -0182 -0193 -0243 -0323
Max 0213 0323 0343 0443 0613 0963 1143
At 5 level of significance
Bullish
Engulfing0055
Bullish
Hammer0090 0066
Piercing Lines NA
Bullish Doji
Star-0010
Holding period
Shooting Star 0109 0066
Bearish
Engulfing0002
Bullish
Candlestick
Descriptive
Statistics
Holding
Periods
Holding period With RSI
Filter
Hanging Man 0045 0052
Dark-Cloud
Cover0121
Holding periodBearish
Candlestick
Patterns
Descriptive
Statistics
Holding
Periods
Average
Holding periodWith RSI
Filter
ID 100068
8
rules of selected Japanese candle reversal patterns in foreign currencies the following
null hypotheses are tested
1 H0 All Japanese candlestick reversal patterns cannot be used to forecast foreign
currency price movements
Ha Japanese candlestick reversal patterns can be used to forecast
foreign currency price movement
2 H0 Foreign exchange markets are efficient
Ha Foreign exchange markets are inefficient
15 Limitations of the Research
There are two main limitations encountered while working on the methodology The first
one is the inability to include USDCNY in the sample as an emerging market foreign
currency this is due to the missing data of high and low rates from the beginning of the
sample period till the end of August 2005 downloaded from Thomson Reuters This
currency has received a lot of attention recently and many market participants have
shown interest in it through diversifying their portfolios emerging markets have shown
promising profitable opportunities especially after the last financial crisis Euro Zone
debt issue and the US fiscal cliff threat However since this research addresses
emerging market foreign currencies as well USDZAR is selected as a replacement for
the Chinese Yuan Many financial institutions especially airlines and logistics firms have
profits or repatriation in USDZAR adding another reason to include it in the sample
The second limitation is the lack of solid knowledge in programming to transform the
subjectivity of different variations of Japanese candlestick patterns into an objective
software or model that would both identify the patterns and test them statistically This
limitation is partially addressed through using excel formulas and statistical tests and
find the identified ones on real charts to ensure the patterns are properly reflected
ID 100068
9
The rest of the research paper is organized as follows Chapter two introduces the
Efficient Market Hypothesis (EMH) in its three forms Chapter three discusses the
difference between fundamental analysis and technical analysis as well as subjective
technical analysis versus objective technical analysis Chapter four includes an
explanation of terms and concepts and a survey of literature reviews followed by a
summary of reviews comments and criticism Chapter five introduces the technical
trading rules of the Japanese candlestick patterns and the Relative Strength Index
(RSI) Chapter six explains the methodology that includes the sample data and the
analytical tools used to test the null hypotheses Chapter seven includes the discussion
of the study analysis Chapter eight summarizes the findings and recommendations and
finally Chapter nine includes the conclusion followed by bibliography and appendices
ID 100068
10
Chapter 2
Efficient Market
Hypothesis (EMH)
ID 100068
11
Chapter 2 Efficient Market Hypothesis (EMH)
Markets with prices that consistently and fully reflect available information are called
efficient This is the building block of the Efficient Market Hypothesis (EMH) that was
brought up by Fama and was further developed by him in 1970 Fama (1970) divides
the EMH into three forms of market efficiencies depending on relevant information that
stock prices adjust to These subsets include the weak form the semi-strong form and
the strong form
The weak form states that future prices cannot be predicted by examining historical
prices and used to generate excess returns Therefore investment strategies and
decisions cannot be made based on technical analysis This means that security prices
do not have any particular pattern and future price movements are subject to
information that is not part of price series Thus security prices follow a random walk
rather than particular historical patterns and that market participants cannot profit from
market inefficiencies
The semi-strong form discusses the ability of stock prices to adjust efficiently to
information that is available to the public such as different announcements of annual
profits and stock splits It states that stock prices adjust to available new information to
the public very fast and objectively Thus market participants cannot earn excess
returns through trading that kind of information This form states that both fundamental
analysis and technical analysis cannot be used to beat the market and make superior
returns
Finally the strong form of the EMH is concerned with certain individuals or groups that
might have monopolistic access to such private information This form implies that stock
prices represent both public and private information Thus market participants will not
be able to use any kind of information to generate excess returns
ID 100068
12
In brief the EMH implies that the reaction of market participants is random Thus
market prices cannot be exploited to consistently generate any excess returns
particularly when accounting for the transaction costs of spreads and commissions
Market participants can be wrong but the markets are always right
Mixed empirical evidence exists in the literature that either support or reject the EMH
Although the EMH is supported by some academicians and market participants it has
also been disputed by many investors and researchers both empirically and
theoretically One of the important studies in the literature is the research conducted by
Lo and Mackinlay (1989) on the Random Walk Theory They examine the theory using
weekly stock returns for the period from 1962 and 1985 The results strongly reject the
Random Walk model for the whole sample
The EMH has started to lose some weight Interestingly even leading proponents of the
theory have started to divert in their belief in the validity of the random walk concept
Burton Malkiel a famous American economist and the author of ldquoA Random Walk Down
Wall Streetrdquo who has been a big supportive of the EMH has recently pointed out that
some emerging markets like China particularly Shanghai and Shenzhen financial
markets have been found inefficient (Malkiel Mei and Yang 2006)
Some EMH proponents still argue that luck is the main reason behind some successful
traders However being the most successful investor of the 20th century ranked among
the worlds wealthiest people Warren Buffett argued against them and stated that the
number of the large part of successful investors among the best money managers just
dispute the argument above Warren Buffet is among other super-investors who have
managed to beat index funds many times More than twenty seven years ago Buffet
mentioned that there were nine investors who invested in different firms they had made
more profits than what index funds did They were able to beat the market by a big
margin and performed very well even when the market was not attractive (Buffett
1984)
ID 100068
13
The latest finical crisis that started in 2007 has also renewed the criticism of the EMH
Jeremy Grantham one of the highly respected financial strategists and investors stated
that the EMH is responsible for the current financial crisis He said that the belief in the
model has made financial leaders underestimate the dangerous implications of asset
bubbles such as the dot-com and housing bubbles as stock prices were not irrational
after all He was quoted that NASDAQ would correct 75 per cent which does not exist in
an efficient market as this would indicate that growing shares have turned more
valuable (Nocera 2009)
The EMH has become controversial as evidence of substantial and lasting inefficiencies
are observed opening the door to direct and indirect criticism of all the three forms The
history of many financial markets records various cases with fund and other investments
mangers showing outstanding performance and being able to beat the market
consistently Though the weak form states stock price movements are random or
trendless given unchanged fundamental information many researchers have found
evidence that stock markets and other financial markets do trend They have also found
that there is an existence of a correlation between trending and length of the time frame
collecting another evidence to reject the weak form of the hypothesis Other studies
have revealed that market participants can make abnormal returns by trading stock
dividend and other announcements including major economic indicators and central
banks interventions in the foreign exchange markets Moreover there are different
financial anomalies that have been found in the markets and have enabled market
investors to generate excess returns These findings clearly reject the second form of
the EMH Similarly the last form of the EMH can be easily challenged one can argue
that the excess return made through insider trading is a good example that simply
disputes the strong form of the EMH
The key debate about making abnormal returns and beating the market ldquoconsistentlyrdquo
by the proponents of the EMH will always be challenged by the strategies that result in
making excess returns from trading technical trading rules dividend announcement and
ID 100068
14
financial anomalies and executing insider trading EMH proponents do not only have to
justify how the above can simply reject the three forms of the EMH but also explain the
rational of such asset bubbles and their subsequent collapse This research addresses
the weak form of the EMH and examines the predictive power of selected Japanese
candle reversal patterns as technical trading rules
ID 100068
15
Chapter 3
Fundamental Analysis (FA)
Vs Technical Analysis (TA)
ID 100068
16
Chapter (3) Fundamental Analysis (FA) Vs Technical
Analysis (TA)
Fundamental analysis and technical analysis are the two main approaches used by
funds and other finance managers to analyse a security value and monitor risk and
return tradeoffs while managing portfolios There has always been a debate on which
approach is superior to the other one and whether they substitute or complement each
other
Fundamental analysts focus on security market price and its true values In order to
invest in a stock or any other financial security fundamental analysts study the
economic factors of supply and demand which affect the price directions In particular
they assess all the factors that can affect the security market price in order to determine
the intrinsic value of that security (Murphy 1999) Fundamentalists look at the book
value and examine financial statements and use price-to-book ratio Earnings are
another key factor that reflects the income power of a stock using the price-earnings
ratio These two ratios are important for many fundamentalists because they show the
deviation of the shares from asset backing of the security The second ratio of price to
earnings shows the deviation of the shares from the earning power of the stock
(Raymond 12) So if the intrinsic value is below the market price this means that the
security is overpriced and should be liquidated However if the intrinsic value is above
the market the price it means that the security is underpriced and it should be added to
the portfolio
On the other hand technical analysts believe that fundamental factors of securities are
discounted and accounted for in the market price itself Technical analysts study the
market action as they believe that prices move in trends and that history patterns in
financial markets repeat themselves They forecast future market prices through
examining short- intermediate- and long-term trend directions price patterns technical
ID 100068
17
oscillators time cycles inter-market analysis and other technical tools (Murphy 1999)
As for the fundamental analysis the technical analysis has also attracted a lot of
investors practitioners and academicians The recognition of historical price
movements to forecast future directions goes back to a number of editorials written by
Charles Dow published between 1900 and 1902 in Wall Street Journal These
publications have encouraged further research and revisit of existing literature to assess
the profitability of technical analysis and test the validity of the EMH
Nowadays technical analysis is widely used by many big institutional investors and
other market participants in their trading and investing strategies The power of
mathematics of artificial intelligence as well as price pattern identification software has
been growing so drastically (Raymond 2012) The globalization and the integration of
different financial markets worldwide along with the advanced technology have enabled
technical analysts to adjust their trading strategies very rapidly when there are major
movements These speedy tools are not available for the fundamentalists
One could argue against each analysis performance Many big fund managers are
fundamentalists such as Warren Buffet John Templeton Peter Lynch and Liu Yang
They follow value investing and fundamental analysis in their investment decisions
Warren Buffett avoided IT shares prior the IT bubble at the time investors were laughing
at him At that time he acknowledged he should get a ldquoDrdquo grade for his portfolio
performance Another credit that goes for the value investing approach is when John
Templeton went for short positions on IT IPO when other traders were celebrating their
big returns In these cases both fundamental and value investing analysis won at the
end However a lot of fundamental analysts were caught by surprise in the sudden
collapse in some stock markets In 2011 Hong Kong stock market collapsed when the
market PE was not expensive at all at that time That is one of the situations when the
fundamentalists fell in the value trap (Raymond 2012) This brings the importance of
technical analysis in spotting trend changes and potential reversals well ahead
ID 100068
18
A lot of studies have been conducted to examine the ability of fundamental and
technical analyses to assist funds and risk mangers to make correct decisions
Evidence of the profitability of technical analysis is explored in details in the literature
review section Other studies have gone further by examining the ability of integrating
both analyses to optimize and further fine-tune investment and risk management
strategies Bettman Sault and Welch (2006) propose an equity valuation model which
integrates both analysis Their sample includes US listed firms from January 1983 to
December 2002 The results confirm that each analysis performs well when applied
separately However the authors find that the integration of fundamental and technical
analysis produces superior results Thus the finding confirms the nature of both
analyses as complements rather than substitutes Cooper (2011) also provides a simple
framework that integrates both technical and fundamental analyses His paper is
expository in nature and explains the concepts without any mathematical evidence It
addresses the challenges of integrating technical and fundamental analyses in an
optimum manner It opens the door for practitioners and academicians to use the ideas
in their testing models and explore the integration of both analyses in the future
The literature shows evidence of a growing success of using technical and fundamental
analyses as complements in the trading strategy and investment decisions In fact both
analyses forecasting the market attempt to resolve the same issue of determining future
price directions The fundamental analyst examines the cause of the market direction
whereas the technical analyst studies the effect At the start of major market moves
usually fundamental analysts are not able to explain what the market tends to do This
is the market stage when the two approaches fail to agree with each other However at
some stage later the two approaches do come back into sync but not early enough for
the trader to react Another explanation for the discrepancies between the two is that
market price movements tend to lead fundamentals Since the known fundamentals
have already been accounted for in the market prices are currently responding to
unfamiliar fundamentals History records that some of the major bull and bear markets
have started with little or zero perceived change in the fundamentals At the time these
ID 100068
19
changes became familiar the fresh trend is already in place With the passage of time
technical analysts can develop growing confidence in their price chart signals and they
become among the minority who can spot a change in trend directions They know at
some stage that the reasons for that trend reversal will become known to others
Most analysts categorize themselves as either chartists or fundamentalists but in real-
life situations there is an overlap A lot of fundamental analysts have some basics
about chart and trend analysis Similarly many chartists are aware of some important
fundamentals The main challenge is that sometimes price charts and fundamentals
conflict with each other (Murphy 1999)
Last but not least if a trader has a choice between the two approaches the choice
would logically be the technical analysis By default technical analysis includes the
fundamentals If the fundamentals are accounted for in the market price it makes less
sense to study those fundamentals In other words chart analysis has become a
shortcut of fundamental or value investing analysis Given the explanation above it
makes sense that one would depend on technical analysis in trading or investment
decisions It is doubtful that anyone can depend solely on fundamentals ignoring the
timing advantage of the technical analysis (Murphy 1999) The explored literature in the
literature review chapter represents different studies that examine the predictive power
of using technical analysis in financial markets with a focus on foreign currency
markets
Technical analysis is further divided into subjective technical analysis and objective
technical analysis introduced in the next section
ID 100068
20
31 Subjective Analysis Vs Objective Analysis
Technical analysis can be classified into two categories subjective and objective
technical analysis (TA) Subjective TA refers to methods and patterns of analysis that
cannot be clearly defined This leads to the conclusion that technical analysts are open
to personal views and interpretations when they use their technical trading rules This
means that it is possible for different analysts using the same method of same data
sets to have different findings Thus subjective trading rules cannot be tested and they
are exempted from empirical examinations Examples of subjective TA can include
Gann Lines trend channels price chart patterns and divergences (Aronson 2007)
On the other hand objective TA is clearly defined When an objective trading rule is
applied on a market data set its signals are very clear and there is no room for
ambiguity This helps simulating technical methods on different historical data and
identifying their performance level accuracy In other words it allows back testing Thus
any objective method can be repeatable it enables technical analysts and
academicians to re-test previous findings of profitable technical trading rules and
perhaps refute current statistical evidence Examples of objective TA include moving
average crosses (Aronson 2007)
In a nutshell one can distinguish between subjective and objective TA through using
the programmability criterion that is a method is considered objective only if it can be
implemented in a computer programme that can generate clear market positions Any
other technical trading methods that cannot be programmed become subjective by
default Subjective TA can be eliminated either through a shift into objective methods or
rejection (Aronson 2007)
Aronson (2007) classifies TA into four main categories 1) subjective TA 2) objective TA
with unidentified statistical significance 3) objective TA that does not have statistical
ID 100068
21
significance and 3) objective TA of statistical significance The first category refers to
analysis methods that cannot be implemented into a programmed algorithm and be
back tested whereas the other three categories fall under objective methods To
explain further the second category includes the methods that have been tested but
their findings have not been examined for statistical significance The third category is
considered useless even though the values have been back tested and evaluated with
statistical methods they have been found of no value whether individually or when used
in combination with other technical trading rules Most of objective technical trading
rules fall under this category This is due to the complexity and randomness of the
financial markets that make it difficult to predict The fourth and the last category
includes the objective methods that can be back tested and produce statistically and
economically significant results Some individual objective methods are useful however
since financial markets are very complex and random rules will have more value if they
are combined with other trading rules (Aronson 2007)
It has been very challenging not only to move TA to a science which is transforming
subjective TA into objective TA but also to convince analysts who have been very
proud of their technical trading rules of the importance of the statistical significance
tests and results A good example in the literature that attempts to transform subjective
TA into objective TA is done by Chang and Osler (1999) They objectify the price
pattern of head and shoulders after facing a lot of problems Among the main challenge
faced is setting up the pattern parameters as in reality the pattern does depart from the
ideal one The authors decide to define objective rules that could discriminate valid from
invalid head-and-shoulder patterns These objective rules include percentage filters
known as an Alexander filter similar to a zigzag indicator that can identify peaks and
troughs They further develop innovative approaches that could qualify the pattern such
as vertical and horizontal symmetry and the time taken to form the pattern (Aronson
2007)
ID 100068
22
There are a lot of valid attempts that have been observed in the literature The literature
review section provides various studies that attempt to test different trading rules
statistically
ID 100068
23
Chapter 4
Literature Review
ID 100068
24
Chapter (4) Literature Review
This chapter is divided into two main parts explanations of terms and concepts found
later in the literature reviews and a survey of literature reviews
41 Explanation of Terms and Concepts
Bootstrap is a method that derives a sampling distribution of the test statistic
through re-sampling with substitution from an original sample (Aronson 2007)
Data mining is the process of searching for patterns models and predictive rules
in large data (Aronson 2007)
Data mining bias is the expected variation obtained by different experiments
between the observed performance of the best observed performance and its
expected performance (Aronson 2007)
Head and shoulder and double top price patterns are pictures appear on price
charts that can be used to predict price movements
Japanese candlestick patterns are formations that are derived from open high
low and close prices they can be of one-day or more that have reversal and
continuation predictive power
Monte Carlo simulation is a common method used to solve mathematical issues
through random sampling in order to test the statistical significance of back-
tested data (Aronson 2007)
NOVA is a statistical test that tests the difference in mean returns between
multiple groups
ID 100068
25
42 Survey of Literature Reviews
Over the past three decades researchers have provided good evidence that the foreign
exchange markets are inefficient disputing the Random Walk Theory and the EMH
There is trustworthy evidence that simple technical rules or a combination or trading
rules applied by a wide range of market participants have proven to have predictive
power of security prices Thus the reality that simple trading rules generate abnormal
large returns in financial markets indicates a serious challenge to the traditional market
hypotheses To test the predictive power of technical analysis over different time frames
and data samples researchers have examined various financial markets of stocks
foreign exchange bonds and commodities Some findings show strong evidence of
profitable technical trading rules whereas others show poor or no evidence
This section explores different studies that examine the profitability of various technical
trading rules in different financial markets More attention is given to the technical
trading strategies of Japanese candlestick patterns and samples covering foreign
currency markets where possible The literature reviews focus primarily on the
outcomes of applying technical analysis and its predictive value of future price
movements The literature survey is divided into four main streams the first part covers
the studies done in the stock and foreign exchange markets that show evidence of
profitable technical trading rules the second part covers the researches that use
technical analysis in presence of central bank interventions The third part reviews
studies that apply Japanese candlestick trading rules The fourth part includes the
studies that find poor or no evidence of profitable technical trading rules Questionnaire
surveys on the application of technical analysis in trading decisions are also included in
the literature Each part reviews the literature chronologically from the oldest to the most
recent ones to reflect the development that has been made since early 1980s
Examining the profitability of technical analysis in financial markets has started very
early Longworth (1981) uses CADUSD spot and forward rates from July 1970 to
ID 100068
26
October 1976 He finds that forward rates can be predicted using spot reference rates
concluding that markets are inefficient
Brock Lakonishok and LeBaron (1992) examine two simple common trading rules
moving averages and range breakouts in the DJIA from 1897 to 1986 Having applied a
standard statistical analysis of the bootstrap method the results reveal strong evidence
of the technical trading strategies applied The buy signals are found to constantly
produce higher returns than sell signals Also the returns following buy signals are less
volatile compared with the returns generated by sell signals
Levich and Thomas (1994) examine the impact of technical trading strategies in the
foreign exchange market by using futures contracts of a 15-year time span Their data
sample covers the years from 1976 to 1990 After applying bootstrap methodology and
a statistical approach thousands of new exchange rate series are randomly generated
each tested seriesrsquo profitability is examined using a technical analysis approach The
empirical results of profit significance in both original series and randomly generated
series are compared The findings reveal that technical trading systems are significantly
profitable Although some profits declined during the five years of 1986-90 on an
average the profiles are found still positive and significant in some periods Thus these
results provide evidence of profitability and statistical evidence of how technical trading
systems are profitable in the foreign exchange market
Gencay (1997) also finds strong evidence of profitable simple technical trading rules in
daily Dow Jones Industrial Average Index Having examined linear and nonlinear
predictability of stock market return using historical buy and sell signals of the moving
average rules the result shows evidence of nonlinear predictability in the US stock
markets supporting the results found by Brock Lakonishok and LeBaron (1992)
Osler (2000) examines the technical trading rules of support and resistance levels
provided by six foreign exchange trading companies The data sample covers the
ID 100068
27
period from 1996 to 1998 The statistical test of the bootstrap technique is used The
results show that signals are very successful in forecasting trend interruptions or
reversals The findings also show that some companies are more accurate in
indentifying turning points in exchange rate trends Overall the prediction in USDJPY
and GBPUSD rates are more accurate than the prediction in DMUSD Also it is found
that the predictive power of the support-resistance levels tend to last five working days
at least once the levels are published to the public
Osker (2003) examines clustering of foreign currency stop-loss orders as well as take-
profit orders as they are considered main orders when placing trading orders His data
covers 9655 orders with a total of more than $55 billion from August 1 1999 to April
11 2000 His sample covers three foreign currencies USDJPY EURUSD and
GBPUSD He uses the crowded orders to provide an explanation for two common
predictions of technical analysis First trends are likely to reverse directions at support
and resistance areas Second trends are likely to move faster after prices penetrate
such levels He finds that take-profit orders gather at round numbers explaining the first
profit forecasting whereas stop-loss orders concentrate heavily just after round
numbers this explains the reason behind the second forecasting These findings are
obtained based on the closing rates of both orders placed at the famous dealing bank of
National Westminster The order clustering phenomenon is due to different common
reasons round numbers are easy to remember and to place orders at as they are the
first to come to anyonersquos mind The final results show that technical trading rules can be
profitable for market participants
Omrane and Oppens (2004) use other technical trading strategies They examine the
presence of price chart patterns in intra-day EURUSD using both close and high-low
prices They search for 12 chart patterns and study them based on the two criteria of
profitability and predictability Using the statistical methodology of Monte Carlo
simulation to calculate resultsrsquo statistical significance the authors find evidence of chart
ID 100068
28
patterns in the foreign exchange market The results reveal that more than 50 per cent
of the charts that are identified has high predictability
Similarly Shik and Chong (2007) also find technical trading rules profitable in foreign
exchange markets They apply moving averages and Relative Strength Index (RSI)
using daily rates of six foreign currencies They find that the profitability of using moving
averages is obvious even though currencies belong to various economic areas
In their paper Lento and Gradojevic (2007) examine the profitability of technical trading
rules by assessing their ability to outperform the trading strategy of buy and hold The
sample covers SampPTSX 300 Index NASDAQ Composite Index Dow Jones Industrial
Average Index and CADUSD spot exchange rate from May 1995 to December 1994
The trading strategies include moving average cross rules Bollinger Bands filter rules
and breakout rules of trading ranges After accounting for the transaction costs excess
returns are generated by moving average cross-over rules and trading range break-out
rules for the SampPTSX 300 Index NASDAQ Composite Index and the CADUSD spot
exchange rate Filter rules also earn excess returns when applied on the CADUSD spot
exchange rate The bootstrap methodology is used to determine the statistical
significance of the results The profitability of the technical trading rules is further
enhanced with a combined signal approach The results show that a combined single
strategy does outperform the buy-and-hold trading strategy even after accounting for
transaction costs
Park and Scott (2007) re-visit the historical testing measures of the profitability of
technical analysis in the empirical literature both early (1960ndash1987) and modern (1988ndash
2004) Early studies show that technical trading rules are profitable in foreign exchange
markets and futures markets only but not in the stock markets Modern studies
however reveal that technical trading rules constantly generate economic profits in
different markets It is worth to mention that although strong evidence of the profitability
of technical analysis is found in early studies many empirical researches faced a lot of
ID 100068
29
problems in their tests such as data snooping selection of trading strategies and
estimation of transaction cost Early studies are characterized with different limitations in
their tests application of very few trading strategies ignorance of trading rules risk and
statistical significance of returns absence of parameter optimization out-of-sample
verification and less attention to data snooping problems On the other hand modern
studies show an overall improvement earlier limitations encountered in the early
studies have been reduced the number of trading rules used for testing has been
increased risk of trading strategies has been given high attention both conventional
statistical tests and sophisticated bootstrap methods have been applied with an
emphasis on trading rule optimization as well as out-of-sample verification Also other
empirical factors such as order flows clustering interventions of central banks and
unstable market inefficiencies have been introduced as an explanation of technical
trading returns Final results of the study reveal that out of total modern studies of 95
56 studies find technical analysis profitable in trading 20 show negative results and 19
find mixed results
Though difficult to explain how technical trading strategies of price patterns might be
profitable Friesen Weller and Dunham (2007) provide a modal that shows evidence of
how such price pattern trading rules can be profitable in the US stock markets The data
covers a six-year period from January 1999 to December 2005 The researchers
highlight the significance of confirmation bias Traders who obtain data and trade on
that information are likely to bias their reading of subsequent information towards the
direction of their initial view This generates autocorrelations and price patterns that can
forecast future prices like the head-and-shoulders and double-top price patterns Also
the researchers find that their model can predict positive autocorrelation with sequential
price The prediction is tested and the results are found statistically and economically
significant
Stephen (2008) examines the profitability of using technical models of moving averages
and momentum that add up to 1024 technical trading rules in DMUSD He finds that all
ID 100068
30
the trading rules are profitable The profitability is mainly because of the exploitation of
exchange rate trends the result stay valid even with sub-periods trading and declining
profit during late 1980s The results of the best 25 performing models in-the-sample
period from 1973 to 1999 are almost as good as those generated in the out-of-sample
period of 2000-2004 in the majority of the cases It is worth to mention that the risk of
making losses when applying each of these models is almost zero adding another plus
to the profitability of technical analysis in trading foreign exchange currencies
Profitability of technical trading rules is examined in combination with other factors as
well Krishnan and Menon (2009) study the influence of foreign currencies technical
indicators and time frames on trading profits The research covers the period from
September 2006 to October 2008 with 1400 observations in the sample and two
durations one year and three months The currency pairs include EURUSD
GBPUSD USDCHF and USDJPY The time frames cover five minutes 15 minutes
30 minutes one hour four hours and one day The technical indicators used are five
leading and five lagging The findings reveal that using technical analysis in foreign
currency trading activities is profitable all of the currencies technical indicators and
time frames play significant roles in generating profits in foreign exchange spot markets
EURUSD is found the most profitable and the least risky The findings also show that
short ndashterm trading is riskier and of low liquidity compared to the long-term trading
Moreover the authors find that using a combination of technical indicators in a trading
system generate remarkable profits
Researchers keep exploring various trading rules scientifically Cekirdekci and Iliev
(2010) test different set ups as well as exit strategies for trading opening range
breakouts of 30-minute time frame The research examines a technical trading system
using and back tests of around 250 stocks from various industry sectors from April
2005 to April 2010 The initial tested set ups include buy and sell filters inside bar
simple and exponential moving averages a volume indicator per cent trailing exist
overbought and oversold areas of Relative Strength Index and ATR Ratchet The
ID 100068
31
results show that when combining buy and sell signals with other indicators such as
the volume indicator the opening range is a powerful model it generates significant
returns when traded with the correct stock
Similarly Holmberg Loumlnnbark and Lundstroumlm (2012) test the profitability of the trading
strategy of the ldquoOpen Range Breakout (ORB) but in the US crude oil futures prices from
March 1983 to January 2011 The ORB is a trading rule that signals entry and exit
rules once the price moves beyond predefined boundaries Using the joint distribution of
low high open and close prices over a period of time the researchers find that their
ORB trading rule significantly generates high returns
Interestingly some researchers have conducted different types of studies to have an
indication of how widely technical analysis is applied in the financial field Using a
questionnaire survey on behalf of the Bank of England in November 1988 Taylor and
Helen (1992) find that around 90 per cent depends on technical analysis in forming their
views at different time horizons The results show that technical analysis is applied
mainly for the shorter time frames for entry and exit timings Moreover technical
analysis tools are found to be the best tools for trading currencies The survey results
also reveal that fundamentals are reliable for the long term picture whereas others rely
on both fundamental and technical analyses in taking trading decisions
Shifting to the examination of technical analysis in presence of central banks
interventions both early and modern researches show the importance of such
interventions when used with trading rules in the foreign exchange markets Silber
(1994) is among the first researchers who examine the profitability of simple trading
strategies in foreign exchange markets in presence of central banksrsquo interventions His
sample covers the German mark Swiss franc Japanese yen British pound and
Canadian dollar He uses simple moving averages as trading rules He finds evidence
that technical rules can be valuable in markets where governments are found big
players The results show that government interventions provide speculators with an
ID 100068
32
opportunity to generate abnormal returns by applying simple technical trading
strategies
There are other researchers who also examine the impact of central bank intervention
on the predictability of trading rules in foreign exchange markets LeBaron (1998)
reviews some evidence that shows predictive value over future foreign exchange prices
He analyses the profitability of simple trading rules in relation with central bank activity
using intervention information from the Fed His forecasts are assessed over one day
and one week periods His sample uses weekly and daily foreign exchange rates of
Deusche mark (DM) and Japanese yen (JP) from January 1979 to December 1992 The
interest rate series used is one week Euro rates The trading rules compare the current
price with a moving average of historical prices He finds that the predictability of
exchange rates diminishes during the periods when the Fed is inactive This leads to
the conclusion that there is a positive correlation between the Fed intervention in the
market and the profitability of the trading rules used to predict foreign exchange rates
Using a genetic programming for the Duetuche mark Japanese yen British pound and
Swiss franc and US official intervention Neely and Weller (2000) show that
interventions could be considered as trading signals themselves They use simple
moving averages as trading rules covering a sample from 1975 through 1998 In fact
they donrsquot support earlier observations that find intervention activities lead to profit in the
foreign exchange markets Their findings rather show that the profitability of technical
trading rules is a result of strong and constant trends in exchange rates which
intervention is intended to turn around
Moreover analyzing daily exchange rates of USDDEM as well as daily USD and DEM
overnight Euro rates from January 1979 to July 1994 Saacke (2002) provides further
evidence of the unusual profitability of applying technical trading strategies on days
when the Fed and Bundesbank interventions take place The central banks are found to
gain returns when they intervene in foreign exchange markets and with the usefulness
ID 100068
33
of technical analysis Intervention returns and trading rule profitability are evaluated
during horizons and post interventions Exchange rates are found to react in the
opposite direction of central banksrsquo intentions in the short term but in line with their
targets in the long term The researchers find that the trading rules of using moving
averages are considerably profitable on the days when the central banks interfere The
findings also reveal that trading rules returns are still high on days in which interventions
did not take place or on preceding days This means that central banksrsquo interventions
are not the only cause of trading rule returns Shik and Chong (2007) also find out that
the technical rules correlate positively with the interventions of the central banks
There is little attention given to the Japanese candlestick patterns in the literature even
though they were widely used in rice trading activities in Japan and have been found
very powerful when combined with other technical trading rules (Nison 2003) Recent
studies on the Japanese candle patterns are found Goo Chen and Chang (2007)
examine the profitability of Japanese candlestick patterns using daily data Their sample
includes 25 shares that are partially listed in Taiwan Top 50 Tracker Fund and Taiwan
Mid-Cap 100 Tracker Fund for 12 years from 1997 to 2006 and with 2580
observations for each stock The main objective of the study is to indentify profitable
candle patterns as well as profitable holding periods that would generate abnormal
returns for investors They use six bullish single-line patterns and seven bullish candle
pasterns for ten holding periods using a stop-loss strategy as well The first group
includes the long white candle the white Marubozu the closing white Marubozu the
opening white Marubozu the dragon doji and the paper umbrella the second group
includes the hammer the bullish engulfing the piercing lines the bullish harami the
three inside up the three outside up and the tweezers bottom The t test is used to
statistically test the profitability of the patterns NOVA and Duncanrsquos various range tests
are also applied to compare the profitability of the patterns across the ten holding
periods In general the results show that there is evidence of some profitable candle
patterns at different holding periods The researchers find that the bullish reversal
patterns are the most profitable patterns and that the profitability of various candle
ID 100068
34
patterns depends on the holding periods Another finding is that the long holding
periods are appropriate for the two candle categories with few exceptions The results
also show that the -5 stop-loss strategy does improve the performance of the
candlestick trading rules
Lana Zhanga and Xiongb (2011) develops a model that visualizes Japanese
candlestick patterns in Chinese stock markets The model transforms the prices of
open close high and low into ldquofuzzyrdquo candle charts The sample includes selected
stocks listed in four marketsrdquo SSE A Share SSE B Share Shenzhen A share and
Shenzhen B sharerdquo from January 2000 to December 2010 The results show that the
model is able to identify the reversal patterns and that it can be used to indentify early
stock reversal signals through ldquosymptoms sequencerdquo The researchers will further
enhance the model with additional fuzzy variables to reflect candlestick lines such as
the position of body and shadows to fine-tune the prediction results
In addition to the previous studies Haibin Zhao and Wang (2012) examine the
performance of the Japanese candlestick patterns in predicting equity returns using
both in-sample and out-of-the-sample forecasts Monthly data of main global financial
markets are used these markets include ldquoFTSE100 DAX CAC40 in Europe
NIKKEI225 (NK) HangSeng (HS) and Strait Times (ST) in Asiardquo Also monthly data of
Standard and Poorrsquos 500 (SampP500) is collected to find out if the candle patterns have
reached the US markets as well The researchers find that the Japanese candlestick
patterns do have predictive power in both in-sample and out-of-sample forecasts In all
the cases the Japanese trading rules are found superior to the simple buy-and-hold
Also it is found that there is important information that spreads out from the US stock
market to the other financial markets
Lu Shiu and Liu (2012) investigate the profitability of candle patterns that are composed
of two lines through buying on bullish (bearish) patterns and holding the trades till
bearish (bullish) patterns take place Their sample includes daily prices of stocks listed
ID 100068
35
in the Taiwan Top 50 Tracker Fund from 29 October 2002 to end of 2008 The
researchers study three bearish reversal patterns and three bullish reversal patterns
These are the bearish engulfing the harami the dark-cloud cover the piercing lines the
bullish engulfing and the bullish harami respectively The bootstrap methodology is
used The results show that the three bullish patterns are found generally more
profitable than the beaish patterns The returns of the three bullish patterns are found
statistically significant in the Taiwan stock market
On the other hand some researches find conflicting results or even variations within
results that are not in line with the findings above The results vary from lacking of
evidence of the profitability to declining profits when simple trading rules are applied
Levich and Thomas (1993) note weak evidence that the profitability of their rules
declines in their final subsample period 1986 to 1990 Lee and Mathur (1996) apply
moving averages and channel trading systems on ten currency pairs in foreign
exchange spot market Their sample includes ldquoAUDJPY GBPJPY CADJPY
DEMGBP DEMITL DEMJPY DEMCHF CHFGBP and CHFJPYrdquo They find both
trading systems are not profitable
LeBaron (2002) finds that the abnormal returns resulting from applying a 150-day
moving average from June 1973 to August 2002 decrease during the 1990s His
sample covers the British pound German mark and Japanese yen He assumes that
data snooping or economic issues could be the main reason for earlier positive results
Applying simple moving average trading rules on longer time periods Olson (2004) also
finds different results on the profitability of the moving average trading rules He re-
customizes moving average rules in a five-year period from 1971 to 1995 He then tests
the trading rule in 5-year out-of-sample period He finds that trading rule returns decline
over time after 1970s to approximately zero by the 1990s This suggests that the
inefficiencies of markets that are reported in earlier studies might have been temporary
Furthermore Lento and Gradojevic( 2007) find that individual trading rules do not
ID 100068
36
generate any profits above the buy-and-hold strategy when the technical rules are
applied in the DJIA
Pukthuanthong-Le and Thomas (2008) re-assess the ability of technical trading rules to
statistically and economically generate significant returns Their data covers liquid
currency futures from 1975 to 2006 The results show that the profitability of trend
following decline for the major currencies of British pound Japanese yen German mark
Euro Canadian dollar Swiss franc and Australian dollar Moreover the researchers
find that the related cross exchange rates of the major currencies also decline in the mid
of 1990s
Poor evidence of profitable candlestick strategies is also found in the literature
Brashears and Elam (1993) explore the profitably of the Japanese candlestick trading
and their ability ot forecast reversals in the cotton futures market from 1973 to
1990Their sample includes 13 candle reversal patterns The bullish patterns include the
hammer the engulfing pattern the morning star the doji star the piercing lines and the
tweezers bottom The bearish patterns include the bearish engulfing the upside gap
two crows the hanging man the dark-cloud cover the shooting star the evening star
and the tweezers top These patterns are programmed individually using MetaStock
programme The final results show that no definite evidence of predictive power for the
Japanese candle patterns in cotton futures markets The researchers recommend that
additional studies should be conducted to re-examine the predictive power of the
Japanese candle trading rules in the future
Marshall Young and Rose (2005) study the candle patterns in actively traded stocks
listed in the DJIA The sample includes data from 1992 to 2002 the starting year is
selected to make sure that market participants had basic background of the different
Japanese candle trading rules and they already started using them at that time in their
trading strategies The sample includes 28 candle patterns that fall under four main
categories bullish single lines bullish reversal patterns bearish single lines and bearish
ID 100068
37
reversal patterns To test the results they use the bootstrap methodology to generate
random prices of open high low and close Contrary to the researchersrsquo expectations
the final results show no evidence of profitable candle patterns in DJIA thus supporting
the weak form of the EMH
Moreover Young and Marshall (2007) test the predictive power of the Japanese
candlesticks in the US stock market particularly the DJIA Index from 1992 to 2002 The
authors use the t test and the bootstrapping methodology to test the results statistically
The Japanese candle patterns are technical trading rules that have been used in Japan
for centuries The use of these candle patterns has been growing among market
participants all over the world because they used to be successful with the rice trading
in Japan The authors use 28 candle patterns that vary from one- to three-candle
patterns These patterns include the long white the white the Marubozu the hammer
the bullish harami the three outside up the gravestone doji the shooting star the dark-
cloud cover and the tweezers top The findings show that candle trading rules are
statistically not profitable None of the single and multiple candlestick patterns bullish or
bearish give timing signals The authors recommend to use candlestick trading rules in
combination with other market timing tools
The section below summarizes the different findings in the literature above along with
comments and criticism
43 Summary Comments and Criticism
From the previous literature the studies have reported mixed results about the success
of technical trading in foreign exchange and stock markets Abnormal returns are
observed in many studies while other studies report less success of technical trading
rules
ID 100068
38
Longworth (1981) uses CADUSD spot and forward rates and finds that forward rates
can be predicted using spot rates concluding that markets are not efficient Brock
Lakonishok and LeBaron (1992) examine moving averages and range breakouts and
find that buy signals constantly produce higher returns than sell signals Levich and
Thomas (1994) find technical trading rules are significantly profitable on contracts of 15-
year currency futures Later on Gencay (1997) also find strong evidence of profitable
simple technical trading rules in daily DJIA supporting the previous results Osler
(2000) finds the technical trading rules of support and resistance levels are powerful
predictive indicators Clustering of foreign currency stop-loss orders and take-profit
orders in major foreign currencies are clear indicators of profitable technical trading
rules (Osker 2003) Omrane and Oppens (2004) find evidence of profitable chart
patterns that are tested statistically
More recent studies also provide strong evidence of profitable simple moving average
trading rules Shik and Chong (2007) find the profitable simple moving average rules
when moving averages and Relative Strength Index (RSI) are applied on six foreign
currencies Lento and Gradojevic (2007) further enhance technical trading rules through
a combined signal approach The results show that the strategy does outperform the
buy-and-hold trading strategy Park and Scott (2007) re-visit the historical testing
measures of the profitability of technical analysis in the empirical literature and find the
majority of the studies find technical analysis profitable Similar to the results found by
Omrane and Oppens (2004) in the foreign exchange market Friesen Weller and
Dunham (2007) provide a modal that shows evidence of how price pattern trading rules
can be profitable in the US stock markets
Moreover Stephen (2008) finds moving averages and momentum in German Mark
profitable Results of Krishnan and Menon (2009) reveal that all currencies technical
indicators and time frames play significant roles in generating profits in foreign
exchange spot markets Cekirdekci and Iliev (2010) find trading opening range
breakouts when combining buy and sell signals and other indicators a powerful model
ID 100068
39
This is in line with the results found by the earlier researchers (Lento and Gradojevic
2007 Krishnan and Menon 2009) In very recent studies Holmberg Loumlnnbark and
Lundstroumlm (2012) find ldquoOpen Range Breakout (ORB) in the US crude oil futures prices
significantly generates high returns
Other studies both old and modern examine the central banksrsquo interventions along with
trading strategies in the foreign exchange markets The researchers find that simple
trading rules are considerably profitable on the days when the central banks interfere
Silber (1994) is among the first researchers who find evidence that technical rules can
be valuable in markets where governments are found big players LeBaron (1998)
reviews some evidence of profitable simple trading rules in presence of the Feb central
bank activity He finds that the predictability of exchange rates diminishes during the
periods when the Fed is inactive This leads to the conclusion that there is a positive
correlation between the Fed intervention and the profitability of the technical trading
rules Neely and Weller (2000) show that interventions could be considered as trading
signals themselves Moreover Saacke (2002) provides further evidence of the unusual
profitability of applying technical trading strategies on days when the Fed and
Bundesbank interventions take place Shik and Chong (2007) also find that the
technical rules correlate positively with the interventions of the central banks
Evidence of profitable Japanese candle patterns is also found in the literature Goo
Chen and Chang (2007) find evidence of some profitable candle patterns at different
holding periods with bullish reversal patterns as the most profitable patterns The model
developed by Lana Zhanga and Xiongb (2011) also show that it is able to identify the
reversal patterns and that it can be used to indentify early stock reversal signals through
ldquosymptoms sequencerdquo Haibin Zhao and Wang (2012) find in all the cases the
Japanese trading rules are found superior to the simple buy-and-hold Lu Shiu and Liu
(2012) find evidence of three profitable bullish patterns in the Taiwan stock market
ID 100068
40
On the other hand some researches find conflicting results or even variations within
results that are not in line with the findings above The results vary from lacking
evidence of profitable technical trading rules to declining profits when simple trading
rules are applied Levich and Thomas (1993) note weak evidence in their final
subsample period 1986 to 1990 Lee and Mathur (1996) apply moving averages and
channel trading systems on ten foreign currencies and find both trading systems are
not profitable LeBaron (2002) finds that abnormal returns resulting from applying a 150-
day moving average decrease during the 1990s Olson (2004) also finds different
results on the profitability of the moving average trading rules He finds that trading rule
returns decline over time after 1970s to approximately zero by the 1990s Moreover
Lento and Gradojevic( 2007) find that individual trading rules do not generate any profits
above the buy-and-hold strategy in the DJIA In more recent studies Pukthuanthong-Le
and Thomas (2008) find that the profitability of trend following decline in major
currencies
Evidence of profitable Japanese candle patterns is also found poor Brashears and
Elam (1993) find indefinite evidence of predictive power for the Japanese candle
patterns in cotton futures markets Marshall Young and Rose (2005) find no evidence
of profitable candle patterns in DJIA Similarly Young and Marshall (2007) find no
evidence Japanese candle patterns in the DJIA
Though the majority of the findings in the literature supports the profitability of technical
analysis in foreign exchange markets as well as other financial markets the weak
evidence found in some studies need to be examined closely
In order to support or reject the theory of the Random Walk and Efficient Market
Hypothesis the debate on the mixed results can be objectively made The weak
evidence of profitable trading rules found by some researchers since 1980s (Brashears
and Elam 1993 Levich and Thomas 1993 Lee and Mathur 1996 LeBaron 2002
Olson 2004 Marshall Young and Rose 2005 Lento and Gradojevic 2007 and Young
ID 100068
41
and Marshall (2007) is opposed by strong evidence found by others using large
samples and targeting different markets in different regions (Longworth 1981 Brock
Lakonishok and LeBaron 1992 Gencay 1997 Osler 2000 Saacke 2002 Osker
2003 Goo Chen and Chang 2007 Shik and Chong 2007 Lento and Gradojevic 2007
Park and Scott 2007 Stephen 2008 Cekirdekci and Iliev 2010 Lana Zhanga and
Xiongb 2011 Haibin Zhao and Wang 2012 Loumlnnbark and Lundstroumlm 2012 and Lu
Shiu and Liu 2012)
Most of the trading rules tested in the literature are very simple such as moving
averages and range breakouts Moving averages can be easily modeled and tested
however it is a lagging indicator and generates false signals when used in range
trading trends or periods Also the poor evidence of profitable candle trading rules
could be due to the samples taken for the periods prior 2000 in which the knowledge of
these trading rules might not be as solid as during 2000s and onwards The
inconsistency in using statistical tests and the issue of data snooping may lead to
conflicts in results These are some of the factors that could explain the weak evidence
in the literature The strong evidence and the conclusion of inefficient markets in other
studies are challenged by the methodologies and standard statistical analysis used to
examine the profitability of technical analysis The different bubbles and major bullish
trends that usually lead to excess price volatility periods and the ignorance of good
testing procedures that address data snooping and other issues could be some of the
main reasons the findings are positively biased This is supported by the findings found
by Park and Scott (2007) Most empirical researches are subject to various issues in
their testing processes such as data snooping different selections of trading rules in-
and out-of-sample data search technologies and difficulties in estimating risk and
transaction costs
Furthermore the impact of central bank activities on the returns is assumed to be
reflected in the market price Technical analysts should not consider them as a major
source of the predictive power of some technical trading rules as found by the
ID 100068
42
researchers above Intervention activities are similar to other major economic data that
affect exchange rates and alert traders to take positions once prices are close to
support and resistance levels However technical analysis is known for discounting all
the known and unknown information
Regarding the application of trading rules financial markets are too complex to be
predicted by a single trading rule A trading system that is a combination of different
trading rules is found to work better that a single technical tool It is always
recommended to use a combination of good technical indicators as filters in which the
majority will agree on clear signals The findings about the Japanese candlestick
patterns are just a simple message that single technical tools fail most of the time They
should rather be used in combination with other powerful technical tools that can best
work during the underlying trend
After consulting the mixed results it is very important to consider important key factors
that would have a high impact on the overall research findings in regard to the
profitability of technical trading rules in financial markets The reasons for the existence
of these abnormal returns or weak evidence may not be easy to interpret and justify
However there are certain obvious factors that play major roles in reaching final results
of any study that need a careful examination and testing These factors include 1) the
possibility of changing trading rules using different time frames in line with the major
underlying trend 2) the consistency of profitable trading rules 3) the liquidity of the
financial markets as it would be more incentive for market participants to trade away
inefficiencies 3) the bullish and the bearish cycles of the markets 4) the efficiency of
trading systems that are made of powerful technical trading indicators suitable to the
underlying market trends 5) clear understanding of the trading rules of lagging and
leading indicators 6) understating different objectives of major players including
activities of central banksrsquo interventions 7) the usage of sophisticated non-linear
models 8) the usage of good statistical testing procedures addressing data snooping
ID 100068
43
and transactions costs and 9) the importance of having good parameters in place that
would turn technical analysis into a science
This research contributes to the literature by testing the predictive power of the
Japanese candlestick reversal patterns in the foreign currency market The findings are
compared to all the findings of profitable technical trading rules in general and to the
results pertaining to the studies conducted on Japanese candlestick patterns
ID 100068
44
Chapter 5
Introduction to Technical
Trading Rules
ID 100068
45
Chapter 5 Introduction to the Technical Trading Rules
The technical trading rules of the Japanese candlesticks are very popular The
Japanese have applied this charting along with its technical rules for centuries Its
popularity arises from its method to display security data for chart analysis and the use
of certain candlestick combinations that reflect the psychology of the market
participants The data of the Japanese candlesticks uses the same data of standard bar
charts open high low and close However the visual effect of the candlestick charts
provide a much better picture of the market that is easily displayed interpreted and
analyzed The price actions look like candles with wicks or shadows That is the reason
why they are called candlesticks In its simplest form a white body means that the close
is higher than the open whereas the black body means the close is lower than the high
There are different shapes for the Japanese candlesticks They also come in different
combinations based on the relationship between open high low and close prices
There are various patterns of Japanese candlesticks a Japanese candlestick pattern
may consist of one candlestick or a combination of two or more but never more than
five Most of the patterns can be used to warn of reversal levels in the markets These
patterns can be bearish bullish or continuation Generally reversal patterns of bullish
implications have their inverse patterns which have bearish meaning The third category
includes a few patterns that fall under continuation patterns Similar to the reversal
patterns continuation patterns have bullish patterns and their opposite bearish patterns
in relation to the previous trend that takes place prior to the consolidation phase
Examples of bullish patterns that warn a reversal of the trend from a downtrend to an
uptrend includes the piercing lines the morning star the bullish Doji Star the bullish
engulfing the hammer the bullish harami and the kicking patterns Examples of bearish
patterns that warn a trend reversal from an uptrend to a downtrend includes the dark-
cloud cover the evening star the hanging man the bearish engulfing the shooting star
the abandoned baby and the bearish harami The continuation patterns include the
ID 100068
46
rising and the falling three methods the separating lines the downside gap three
methods and the three-line strike (Murphy 1999) Appendix 1 shows the different
Japanese candlestick patterns Moreover the Japanese candlestick patterns can be
used jointly with other western technical tools such as oscillators and other technical
indicators which can create a powerful synergy of techniques
Below is a brief description of each of the eight Japanese candlestick reversal patterns
used in the analysis These patterns follow the descriptions provided by Nison (2001)
The description of the candle patterns are followed by an explanation of the common
technical indicator of the Relative Strength Index (RSI) that is used along with three
candle patterns as a filter
Four bullish and four bearish candle patterns are used in the analysis of this research
The bullish patterns include the bullish engulfing the piercing lines the bullish hammer
and the bullish doji star whereas the bearish patterns include the bearish engulfing the
dark-cloud cover the hanging man and the shooting star The following order of the
patternsrsquo descriptions is based on the similarity and the inverse relationship of the
patterns for easy understanding A snap shot of each candle pattern that are indentified
in the analysis using excel formulas discussed under methodology is provided
The bullish engulfing pattern is a major reversal signal that consists of two real bodies of
opposite colours The market is in a downtrend then a long white candle closes higher
and engulfs the previous black candle This shows that the bulls have taken over from
the bears and that the buying pressure becomes stronger than the selling pressure The
bearish engulfing pattern is just the opposite The market is in an uptrend then the last
white candle is wrapped by a black long body signaling a top reversal This means that
the selling pressure has overwhelmed the buying pressure There are three criteria for
the engulfing pattern 1) the market should be clearly in an uptrend or downtrend even
if it is a short-term trend 2) there are two candlesticks that form the pattern in which the
second body must wrap the previous real body and 3) the colour of the second real
ID 100068
47
body should be the opposite of the first real body colour (Nison 2001) Figures (1) and
(2) show the two patterns that are identified in USDINR and EURUSD pair currencies
Figure (1) The bullish engulfing pattern in USDINR
Figure (2) The bearish engulfing pattern in EURUSD
ID 100068
48
The piercing lines are a two-day bullish pattern that signals a bottom reversal after a
downtrend The first candlestick is a black body and the second day is a long white
body The second day opens with a downside gap below the low of the previous day
and closes higher and above the mid-point of the first black body The greater the
penetration of the white bodies into the previous black body the greater the chance for
bottom reversal An ideal pattern requires a second day penetration of more than 50
of the prior black real body The psychology behind this pattern is that the market is in a
downtrend reflected in the first bearish black body On the next day the market opens
lower with a gap reflecting more bearish sentiment Suddenly the bulls take over and
manage to close the market not only at previous close but higher into the previous body
mid-point or even slightly higher The bears will have their second thoughts about their
short positions The longs will see that the new lows could not hold and probably it is
time to go for long positions There are four main factors that indentify the importance
of the piercing lines 1) the degree of the second day penetration within the first black
body the greater the penetration degree the greater the likelihood for a bottom
reversal 2) the second day opens below a main support level but fails and closes
higher with bears being unable to control the market and 3) heavy volume on the
opening of the second day an initial selling off is followed by buying blow offs (Nison
2001) Figure (3) represents the piercing lines pattern that is identified in AUDUSD pair
currency
ID 100068
49
Figure (3) The piercing Lines pattern in AUDUSD
The dark-cloud cover is the opposite formation of the piercing lines pattern It is a two-
day bearish pattern that signals a top reversal after an uptrend The first day is a long
white real body The second day opens above the high of the previous day but closes
near the low of the day within the previous day white body The greater degree of
penetration into the previous day body the more likely a top reversal will take place
Some technical analysts require more than 50 penetration of the second day close to
the previous white real body The psychology behind this pattern is that the bulls are in
full control when the second day open with an upside gap however the bulls lose
control and no continuation of the rally takes place Then the market closes near the
close and the bulls will have a second thought about their long positions Similar to the
piercing lines pattern there are important factors that intensify the significance of the
dark-cloud cover pattern but in the opposite direction (Nison 2001) Figure (4)
represents the pattern that is identified in EURUSD pair currency
ID 100068
50
Figure (4) The Dark-cover cloud in EURUSD
The hammer is the third bullish candlestick pattern it is a one-day pattern The body of
the hammer can be white or black but it is more bullish if the body is white because it
closes at the high The hammer has a long lower shadow and closes near the high of
the session The psychology behind this pattern is that the market sells off sharply
during the session but then bounces back at the close near to the small bodyrsquos high
The hammer may have no upper shadow or a very small one enforcing bullish
implications This clearly shows that the bears have lost control and they are now
having second thoughts The main characteristic of the bullish hammer is that the lower
shadow should be at least twice or three times the height of the body (Nison 2001)
Figure (5) represents the bullish hammer pattern that is identified in GBPUSD pair
currency
ID 100068
51
Figure (5) The bullish hammer pattern in GBPUSD with the RSI filter
The hanging man looks like a hammer however it forms after an uptrend rather than a
decline Since the long lower shadow has a bullish implication it is best to wait for a
bearish confirmation with this pattern A lower opening below the body of the hanging
man on the second day and a lower close will be a good confirmation of a top reversal
The psychology behind this is that when the market closes on the next day below the
body of the hanging man the bulls who bought on the open or close of the hanging man
day will be left hanging with a bad position and are now more nervous for potential big
losses Thus they may decide to cut their losses and liquidate adding more selling
pressure The key factors for a reversal hanging man pattern are a preceding uptrend
and a next day close below the hanging man close (Nison 2001) Figure (6) represents
the pattern that is identified in USDJPY pair currency
ID 100068
52
Figure (6) The hanging man pattern in USDJPY with the RSI filter
The fourth and the last bearish candle pattern used in the sample analysis is the
shooting star It is a one-day pattern with a small real body and a long upper shadow
The small body can be white or black This pattern looks like a shooting star with its tail
glowing in the sky An ideal shooting star day opens with an upside gap but this gap is
not always important This pattern indicates that the market is rejecting a higher high A
close on the next day below the shooting star close can give a good confirmation of
potential top reversal (Nison 2001) Figure (7) represents the pattern that is identified in
USDCAD pair currency
ID 100068
53
Figure (7) The shooting star pattern in USDCAD with RSI filter
The fourth and the last bullish pattern in the analysis is the doji star A star is usually a
small real body white or black that gaps away from the prior real body If the star is a
doji rather than a small real body it is named a doji star or a doji line that warns a near
reversal Doji candlesticks can have shadows of different lengths The doji candlestick
used in the analysis is a one-day pattern in which the open price and the close price are
equal The star or doji star can be part of other reversal patterns such as the morning
star the evening and the harami Doji candlesticks can have shadows of different
lengths Generally the doji lines show indecision between the market participants The
likelihood of a reversal with a formation of a doji increases if 1) the following
candlesticks confirm a potential reversal 2) the market is in overbought or oversold
situations and 3) the market doesnrsquot form doji so often (Nison 2001) There are different
versions of doji candlesticks such as long legged doji gravestone doji and dragonfly
doji The doji that is used in the analysis has equal open and close prices regardless the
shadows length and signal for bottom reversal (Nison 2001) Figure (8) represents the
doji star pattern that is identified in USDZAR pair currency
ID 100068
54
Figure (8) The doji star pattern in USDZAR
In addition to price patterns resistance-support levels and Japanese candlestick
patterns technical analysts use a lot of technical indicators that be used in trending
markets non-trending markets and gauging sentiments There are technical indicators
or oscillators used in the non-trending markets that can still be used in trending markets
to get further insights into the market momentum Among these indicators is the
Relative Strength Index (RSI) The RSI and the other oscillators when used in
combination with price charts and Japanese candle patterns become extremely
valuable They provide traders and technical analysts further insight especially into the
short-term market extremes that are known as overbought or oversold conditions
The Relative Strength Index (RSI) is considered one of the most popular technical
indicators used actively by traders It basically measures the internal strength of a
security It focuses on price momentum specifically the changes in closing prices It
ranges between zero and a hundred It usually tops and bottoms above and below 70
and 30 readings respectively These are overbought and oversold conditions (Colby
2003) A crossing above 30 indicates a buying signal whereas a crossing below 70
ID 100068
55
indicates a selling signal Divergences between the price action and the indicator
movements also provide warning signals of potential bottom and top reversals In
addition to the signals of the oversold-overbought condition the crosses signals of the
midpoint are also used by many traders Since oscillators are best used in non-trending
markets and there is a risk of misusing the indicator the 50 reading is used as a
midpoint value to divide the horizontal range into two halves The 50 midpoint is also
used as buy and sell signals The time span used is 14 days by default and it will be
used in the analysis The RSI formula is also introduced later in the methodology
section Figures (5-7) show the three patterns that are identified using the excel formula
and the RSI filter
ID 100068
56
Chapter 6
Methodology
ID 100068
57
Chapter 6 Methodology
This research attempts to re-examine the weak form of the EMH through the application
of Japanese candlestick price patterns as technical trading rules in foreign exchange
markets It tests two null hypotheses that assume 1) all the Japanese candlestick
reversal patterns cannot be used to predict returns in foreign exchange markets and
that 2) foreign exchange markets are efficient The two alternative hypotheses state that
1) Japanese candlestick reversal patterns can be used to predict market movements
and that 2) foreign exchange markets are inefficient The one-tailed z score test is used
to test the hypotheses at 5 level of significance The following sections include the
sample data and the analytical tools used in the analysis followed by a discussion of
data analysis and a summary of findings and recommendations
61 Sample Data
The sample data includes seven foreign currencies from both advanced and emerging
financial markets These currencies include the Australian dollar (AUDUSD) British
pound (GBPUSD) Canadian dollar (USDCAD) Euro dollar (EURUSD) Japanese yen
(USDJPY) Indian rupee (USDINR) and South African rand (ZAR) The sample covers
a 12-year span which is from 1st January 2001 to 31st December 2012 These
currencies reflect good financial environment to test the technical trading rules of the
Japanese candlestick patterns in which most of market participants and academicians
are interested in All the data analysis uses daily OHLC bid rates open (O) high (H)
low (L) and close (C) obtained from the financial data provider Thomas Reuters The
total observations in the sample are 3129
ID 100068
58
62 Analytical Tools
This section explains the technical trading and statistical tools used in the analysis to
test the proposed null hypotheses It discusses the Japanese candle patterns used
challenges faced filters applied holding periods to calculate returns (losses) followed
by statistical tests to help deciding whether to reject or accept the null hypothesis
There are eight Japanese candlestick reversal patterns used in the analysis four bullish
patterns and four bearish patterns The eight candle patterns are tested for each of the
seven foreign currencies
The bullish patterns include the hammer the piercing lines the doji star and the bullish
engulfing whereas the bearish patterns include the hanging man the dark-cloud cover
the shooting star and bearish engulfing The reason of selecting these patterns is that
they are very popular and most of them are considered major reversal patterns Another
reason is the ability to transform these candlestick patterns and practice them in a
scientific manner through using excel formulas that can describe and indentify the
patterns and enable back testing
The main challenge encountered in this research is the application a scientific method
that would address the subjectivity of using the Japanese candlestick patterns as
technical trading rules Moving technical analysis to a science through transforming
subjective candle patterns into objectively defined testable patterns has always been a
challenge There are not so many mathematical definitions of the Japanese
candlesticks in the literature Some of the excel formulas that are used in the analysis
are obtained from other resources These formulas are further amended to address the
subjectivity of different variations of the candle patterns used in the analysis which are
in line with Nisonrsquos (2001) The excel formulas (3) (4) and (7) mentioned later in this
section are obtained from a paper written by Fadhel (2010) with an amendment made
to formula (7) to differentiate the shooting star pattern that shows at tops from the
ID 100068
59
inverted hammer pattern that shows at bottoms an additional condition of a next day
lower close is added This is in line with Nisonrsquos (2001) Formulas (5) and (6) are
obtained from Tech Excel Charts and Programming Blog posted by BxCapricorn (2009)
an additional condition of a lower close and a higher close on the next day is also added
to differentiate the hanging man pattern and the hammer respectively from other
similar patterns that show in opposite directions These are also in line with Nisonrsquos
(2001)
Formulas (1) to (8) describe the eight Japanese candlestick patterns the bullish
engulfing the bearish engulfing the piecing lines the dark-cloud cover the hammer
the hanging man the shooting star and the bullish doji against (1) (2) (3) (4) (5)
(6) (7) and (8) respectively Using IF and AND excel functions the following
formulas represent four columns Column A represents Date Column B represents
Open Column C represents High Column D represents Low and Column E
represents Close The formulas start on line or row 5 that represents today line 4
represents yesterday line 3 represents the day before yesterday and line 6
represents tomorrow Number one refers to the patterns identified by the formulas
=IF(AND((B4gtE4)(E5gtB5)(E5gtB4)(E4gtB5)((E5-B5)gt(B4-E4))(C5gtC4) (1)
(D5ltD4))1)
=IF(AND((E4gtB4)(B5gtE5)((B5-E5)gt(E4-B4))(E4ltB5)(B4gtE5))1) (2)
=IF(AND((E4ltB4)(((E4+B4)2)lt=E5)(B5ltE5)(B5ltE5)(E5ltB4)(B5ltD4) (3)
((E5-B5)(0001+ (C5-D5))gt06))1)
=IF(AND(E4gtB4B5gtC4B5gtE5B4ltB5E4gtE5E4ltB5B4ltE5 (4)
E5lt=(05(C4+D4)))1)
=IF(AND((C4-D4)gt(3(B4-E4))((E4-D4)(0001+C4-D4)gt06) (5)
ID 100068
60
((B4-D4)(0001+C4-D4)gt06)(E5gtE4))1)
=IF(AND((C4-D4)gt=(2(ABS(B4-E4)))((E4-D4)(0001+C4-D4)gt=075) (6)
((B4-D4)(0001+C4-D4)gt=0075)(E5ltE4))1)
=IF(AND(B4ltD4+(05(C4-D4))E4lt(D4+05(C4-D4))OR(B4ltD4+09 (7)
(C4-D4)E4ltD4+09(C4-D4))(E5ltE4))1)
=IF(B4=E41 (8)
Furthermore the 14-day Relative Strength Index (RSI) is used to distinguish the three
similar patterns that appear at different turning points these similar patterns include the
bullish hammer the hanging man and the shooting star In addition to the signals of the
oversold-overbought condition the crosses of the midpoint signals are also used by
many traders Since oscillators are best used in non-trending markets and there is a risk
of misusing the indicator the 50 reading is used as a midpoint value to divide the
horizontal range into two halves The 50 midpoint is used as buy and sell signals For
example crossing 50 to the upside is considered a buying signal whereas crossing 50
to the downside is considered a selling signal The 50 midpoint crosses concept is used
with the three candle patterns as a filter to distinguish them If the hanging man and the
shooting start patterns form above 50 it is assumed that there is a high possibility that
the trend will reverse from up to down Similarly if the bullish hammer pattern forms
below the 50 reading there is a high possibility that the current trend will reverse from
down to up In other words a reading above 50 indicates potential for a bearish
reversal and a reading below 50 indicates potential for a bullish reversal
Having used the RSI filter for the three candle patterns the results are considered only
if the average returns are statistically significant at 5 level for at least five consecutive
holding periods Formula (9) shows how the RSI is calculated as provided by Cably
(2003)
ID 100068
61
R 119894
= (C 119905
C 119905+2
C 119905+3
C 119905+4
C 119905+5
C 119905+7
C 119905+10
) minus O 119905
RSI = 100 minus 100
(1 + 119877119878)
(9)
Where
RS = the ratio of the exponentially smoothed moving average for n-period gains divided
by the absolute value of the exponentially smoothed moving average for n-period
losses
After identifying the eight bullish and bearish candle patterns and filtering them through
using the RSI overbought and oversold conditions the returns are computed for seven
holding periods one day two days three days four days five days seven days and
ten days For the bullish patterns the returns represent the difference between the open
price following the pattern day and close price of the seven holding periods as in
formula (10) For the bearish patterns the returns represent the difference between the
open price following the pattern day and close price of the seven holding periods as in
formula (11) The returns for the holding periods that fall beyond the 31 December 2012
are excluded
(10)
Where
Ri= the return of the seven holding periods
Ct = day 1 close following the pattern day
Ct+1 = day 2 close
Ct+2 = day 3 close
Ct+3 = day 4 close
Ct+4 = day 5 close
Ct+6 = day 7 close
Ct+9 = day 10 close
Ot = day 1 open
ID 100068
62
R 119894
= O 119905
minus (C 119905
C 119905+2
C 119905+3
C 119905+4
C 119905+5
C 119905+7
C 119905+10
)
119911 =X minus1198830
1198782
n
(11)
Where
Ri= the return of the seven holding periods
Ot = day 1 open following the pattern day
Ct = day 1 close
Ct+1 = day 2 close
Ct+2 = day 3 close
Ct+3 = day 4 close
Ct+4 = day 5 close
Ct+6 = day 7 close
Ct+9 = day 10 close
Having identified the patterns and computed the returns for the seven holding periods
and following the methodology used by Ramond and Leuthold (1982) and Anderson
(2003) the one-tailed z score test is used for each holding period of the pattern The
two null hypotheses are tested at 5 level of significance that is 95 confidence level
Also the same methodology including the holding periods follows Fadhelrsquos (2010)
supervised by Anderson (2010) the same author above Formula (12) represents the z
score statistical test that accounts for the gross profit variance from each trade as well
as the number of total trades It allows a comparison of results from various trading
rules and time periods To arrive to the final results using the z score test the number of
times the candle pattern is identified (n) in the formula below has to be above 30 This
formula that considers all the factors above does also provide a method to assess the
weak form efficiency of the price series used in the sample analysis (Peterson and
Leuthold 1982)
(12)
Where
X = actual Mean Gross Profits (MGP) from a given strategy
ID 100068
63
Xo = expected MGP (zero in this case)
S2 = variance of Gross Profits per trade
n = number of trades it should be above 30
Unlike securities trading the foreign exchange trading has no guaranteed return or
dividend payment Therefore the equilibrium expected return is considered zero
Trading foreign exchange currencies is similar to trading futures contracts it is a two-
party zero sum game where a price change causes one party to profit and the other
party to lose Thus since foreign exchange trading is a zero-sum game zero is
considered the rational benchmark as expected mean gross profits Moreover the
selection for gross profits instead of the net is due to the absence of a standard
transaction cost as commissions differ significantly depending on time as well as trader
and firm types Readers can deduct suitable commission charges to have some value
for mean net returns These adjustments should not impact the variance of profits
(Peterson and Leuthold 1982)
The p-value is calculated to also help decide whether the pattern identified is due to
chance or its probability of being formed by chance is really too small To calculate the
p-value using the z test statistic excel formula (13) is used If the value is equal or
below the significance level of 005 this means that the probability of the pattern was
formed by chance is very small at 95 level of confidence and the null hypothesis will
be rejected However if the p-value is above the 005 significance level it means that
the probability the pattern was created by chance is high and the null hypothesis will be
accepted
P-value = 1-NORMSDIST(ABS(z)) (13)
Where
ABS = the absolute value of z
NORMSDIST = standard normal distribution of z
ID 100068
64
Figures (9-12) show the number of times the four bullish and the four bearish candle
patterns appear in the final results Figures (10) and (12) show the number of times the
bullish hammer the bearish hanging man and shooting star patterns appear after using
the RSI filter
Figure (9) A comparison of the number of times the four bullish candle patterns appear
in the seven foreign currencies
Figure (10) A comparison of the number of times the four bullish candle patterns
appear in the seven foreign currencies after using the RSI filter
0
20
40
60
80
100
120
140
AUD CAD EUR GBP INR JPY ZAR
Bullish Candle Patterns
Bullish Hammer
Piercing Lines
Bullish Doji Star
Bullish Englulfing
Average
0
20
40
60
80
100
120
140
AUD CAD EUR GBP INR JPY ZAR
Bullish Candle Patterns - with RSI
Bullish Hammer
Piercing Lines
Bullish Doji Star
Bullish Englulfing
Average
ID 100068
65
Figure (11) A comparison of the number of times the four bearish candle patterns
appear in the seven foreign currencies
Figure (12) A comparison of the number of times the four bearish candle patterns in the
seven foreign currencies after using the RSI filter
0
100
200
300
400
500
600
AUD CAD EUR GBP INR JPY ZAR
Bearish Candle Patterns
Hanging Man
Dark-Cloud Cover
Shooting Star
Bearish Engulfing
Average
0
50
100
150
200
250
300
AUD CAD EUR GBP INR JPY ZAR
Bearish Candle Patterns - with RSI
Hanging Man
Dark-Cloud Cover
Shooting Star
Bearish Engulfing
Average
ID 100068
66
Chapter 7
Discussion of Study
Analysis
ID 100068
67
Chapter 7 Discussion of Study Analysis
Having tested the profitability of selected Japanese candlestick reversal patterns in
foreign exchange markets this chapter discusses in details the results of analyzing
candle reversal patterns in seven foreign currencies for 12-year data of 3129
observations The following seven sections discuss the results for each currency pair
After examining the bullish patterns in AUDUSD currency pair it is found that the
bullish hammer pattern is identified 77 times at less than 5 level of significance for all
the holding periods When the results are filtered using the RSI the pattern is identified
40 times in which all are significant at 5 level except of the seven-day holding period
The bullish doji star is identified 28 times throughout the sample at 5 significance
level The bullish engulfing pattern is found less profitable which is not statistically
significant either The piercing lines pattern appears very rare as it shows only 7 times
Similar to the bullish engulfing result the average returns of this pattern are found
statistically insignificant Shifting to the bearish patterns the hanging man performs best
compared with the other three patterns The pattern is indentified 89 times in which the
average returns are significant at 5 level of significance When filtered by the RSI that
is more than 50 the pattern appears 57 times with average returns that are statistically
significant Although the shooting star pattern is identified 148 times the average
returns are found statistically insignificant However when filtered for the RSI the
average returns are found statistically significant for the one-day two-day three-day
and seven-day holding periods The bearish engulfing and the dark-cloud cover are
identified 70 times and four times respectively and their average returns are found
insignificant Appendix 2 includes the descriptive statistics of the eight candle pattern
analysis for AUDUSD
The analysis of USDCAD shows poor evidence of profitable bullish candle patterns
The bullish hammer appears 58 times with significant average returns at 5 level
ID 100068
68
however when filtered using the RSI the pattern appears only 25 times and the
average returns are found significant only for the one-day and three-day holding
periods The bullish engulfing pattern appears 35 times throughout the sample with
significant average returns only for the one-day and two-day holding periods The
bullish doji star pattern appears 19 times and is found statistically insignificant The
piercing lines pattern appears only eight times and the average returns are found
significant only for the one-day two-day and ten-day holding periods at 000 003
and 004 level of significance respectively This result will not be considered because
the number of times the patterns appears which should be considered in z score
formula is less than 30 On the other hand the bearish hanging man and the shooting
star patterns show strong evidence of profitability at 5 level of significance even after
being filtered with the RSI The hanging man pattern is identified 79 times the shooting
star pattern is identified 240 times After being filtered with the RSI reading that is above
50 the hanging man and the shooting star patterns appear 44 times and 108 times
respectively The dark-cloud cover is identified only twice with statistically insignificant
average returns The bullish engulfing pattern is identified 35 times and the average
returns are considered significant only for the one-day and two-day holding periods
Appendix 3 includes the descriptive statistics of the eight candle pattern analysis for
USDCAD
In EURUSD only the bullish pattern of the hanging man shows average returns that
are statistically and consistently significant at 5 level of significance This result also
repeats when filtered with the RSI The pattern is identified 64 times and when filtered it
shows 34 times The presence of the piercing lines pattern is very poor even though
the average returns of the two-day holding period is statistically significant 000 the
pattern is identified only 7 times out of 3129 observations This result is also not
considered The average returns of the bullish doji star and the bullish engulfing
patterns are statistically insignificant They show 15 times and 49 times respectively
On the other hand the average returns of the handing man and the shooting star
patterns are statistically significant they are identified 106 times and 181 times
ID 100068
69
respectively Nevertheless when filtered for the RSI reading the average return of the
ten-day holding period of the hanging man is found 007 that is statistically
insignificant at 5 level Also the average returns of the three-day four-day and five-
day holding periods for the shooting star pattern are found insignificant 008 009
and 008 respectively The dark-cloud and the bearish engulfing patterns are found
very poor Although the bearish engulfing pattern appears 156 times the average
returns are found statistically insignificant The dark-cloud cover pattern is identified only
seven times Appendix 4 includes the descriptive statistics of the eight candle pattern
analysis for EURUSD
In GBPUSD only the average returns of the bullish hammer pattern are found
statistically and consistently significant at 5 level even after filtering for the RSI The
pattern is identified 97 times before applying the RSI filter and 37 times after using the
filter The other three bullish patterns are found statistically insignificant The piercing
lines the bullish doji star and the bullish engulfing patterns appear 7 times 17 times
and 48 times respectively On the other hand the average returns of the hanging man
and the shooting star patterns are found statistically significant at 5 level They show
99 times and 197 times respectively however when filtered for the RSI the average
returns of the hanging man pattern are found statistically insignificant for the seven-day
and the ten-day holding periods 009 and 026 respectively The existence of the
dark-cloud cover pattern is found very poor as it is identified only once The bearish
engulfing pattern is identified 131 times and its average returns are also found
insignificant Appendix 5 includes the descriptive statistics of the eight candle pattern
analysis for GBPUSD
In the first emerging foreign currency of USDINR the average returns of the bullish
hammer and the bullish engulfing patterns are found statistically significant at 5 level
The patterns are identified 40 times and 65 times respectively However when filtering
the bullish hammer using the RSI reading the average returns are found significant only
for the one-day and the ten-day holding periods 000 and 003 respectively The
ID 100068
70
piercing lines pattern appears 33 times but its average returns are found statistically
insignificant The bullish doji star pattern appears 133 times and only the three-day
average returns are found significant 002 lacking consistency in results On the
other hand the existence of the bearish patterns in USDINR is found very poor The
average returns of the hanging man pattern are found statistically significant for only the
four-day five-day and ten-day holding periods and when filtered by the RSI only the
average returns of the one-day and two-day holding periods are found significant The
pattern is identified 69 times before the RSI filter and 39 times after applying the filter
The average returns of the shooting star and the bearish engulfing patterns are found
insignificant The shooting star pattern shows 549 times before the RSI filter and 244
times after using the filter the bearish engulfing pattern is identified 55 times Even
though the average returns of the dark-cloud cover pattern are found significant for all
the holding periods except the one-day period this result should not be considered as
the pattern is identified only twice Finally the bearish engulfing pattern is identified 131
times and its average returns are also found insignificant Appendix 6 includes the
descriptive statistics of the eight candle pattern analysis for USDINR
The USDJPY currency pair lacks evidence of most of the bullish candle reversal
patterns Only the average returns of the bullish hammer pattern are found statistically
significant for the first five holding periods and the first four holding periods after
allowing for the RSI filter The pattern is identified 120 times before the RSI filter and 62
times after applying the filter The average returns of the bullish doji star and the bullish
engulfing patterns are found insignificant for all the seven holding periods they are
identified 25 times and 45 times respectively Similar to the previous results the
average returns of the piercing lines pattern are found insignificant except for the two-
day holding period 001 This result is not considered either as the pattern is
identified only four times Moving to the bearish candle reversal patterns the average
returns of both the hanging man and the shooting star patterns are found statistically
and consistently significant at 5 level even after allowing for the RSI filter The
hanging man appears 155 times before the filter and 82 times after the filter the
ID 100068
71
shooting star pattern appears 190 times before the filter and 75 times after the filter The
average returns of the dark-cloud cover are found insignificant the pattern is identified
only 4 times The average returns of the bullish engulfing pattern are found statistically
significant only for the four-day holding period lacking consistency in the overall result
Appendix 7 includes the descriptive statistics of the eight candle pattern analysis for
USDJPY
Having examined the second emerging market foreign currency and the last foreign
currency in the sample USDZAR is found to experience no bullish reversal candlestick
patterns None of the average returns of the four candle patterns are found statistically
significant at 5 level The bullish hammer pattern is identified 85 times before the RSI
filter and 41 times after the filter the bullish doji star and the bullish engulfing patterns
appear 17 times and 26 times respectively The piecing lines pattern does not appear
at all However there is some evidence of bearish candle patterns in USDZAR The
average returns of the shooting star pattern are found consistently and statistically
significant at 5 level for all the holding periods before and after the RSI filter The
pattern appears 282 times before the filter and 129 times after the filter The average
returns of the hanging man pattern are found statistically significant for the first five
holding periods before and after the filter The average returns of the dark-cloud cover
pattern are found significant only for the three-day and four-day holding periods the
pattern appears only twice Thus due to the low frequency of pattern and the lack of
consistency the pattern results are not considered Appendix 8 includes the descriptive
statistics of the eight candle pattern analysis for USDZAR
ID 100068
72
Chapter 8
Findings and
Recommendations
ID 100068
73
Chapter 8 Findings and Recommendations
After analyzing the results in detail this chapter summarizes the major results into two
areas 1) general findings in term of frequency of pattern appearance holding periods
significance levels and bullish and bearish trends and 2) specific findings that are
pertaining to each currency pair The consistency of statistical significant returns at 5
level for all the holding periods is considered However for the three patterns of the
shooting star the hanging man and the bullish hammer both pre- and post-RSI filter
results are considered statistically significant based on one conservative condition the
average returns should be statistically significant at 5 level for at least five consecutive
holding periods in a row in both data before and after the RSI filter that is above 50
reading for the bearish two candle patterns and below 50 reading for the bullish candle
pattern Another condition that needs to be satisfied when considering the findings is the
number of observations along with the 5 level of significance According to Peterson
and Leuthold (1982) the number of times the candle pattern is identified should be
above 30 in the z score statistic
Having had more 65 bullish data during the study sample and among the four bullish
candlestick reversal patterns the bullish hammer pattern is found the strongest one in
term of frequency and statistical significant average returns at 5 level The maximum
number of times the pattern appears is 97 AUDUSD can be traded using this pattern
for the first six holding periods EURUSD and GBPUSD can be traded for all the seven
holding periods USDJPY can be traded for the first five holding periods The bullish
engulfing pattern is found statistically significant only in USDINR The research also
finds that there is no evidence of the piercing lines and bullish engulfing patterns across
all the seven currencies Two other interesting findings are the very low frequency of the
piercing line pattern across the sample the number varies from four to eight except for
USDINR and USDZAR they appear 33 times and zero times respectively Another
finding is that both of the emerging market currencies USDINR and USDZAR show
ID 100068
74
poor evidence of bullish candle patterns even though most of the study sample falls
under bullish cycles only the average returns of the bullish engulfing pattern in
USDINR is found statistical significant These findings reject both of the null
hypotheses that assume all Japanese candlestick patterns cannot be used to forecast
foreign currency prices and that foreign markets are efficient Furthermore the findings
of the profitable Japanese candle patterns are in line with the results found by Goo
Chen and Chang (2007) Lana Zhanga and Xiongb (2011) Haibin Zhao and Wang
(2012) Lu Shiu and Liu (2012) on the studies that examine the profitability of the
Japanese candle patterns as technical trading rules in particular These results also
support the evidence found using other profitable technical trading rules in general by
Longworth 1981 Brock Lakonishok and LeBaron 1992 Gencay 1997Osler 2000
Saacke 2002 Osker 2003 2006 Shik and Chong 2007 Lento and Gradojevic 2007
Park and Scott 2007 Stephen 2008 Cekirdekci and Iliev 2010 and Loumlnnbark and
Lundstroumlm 2012
Moving to the general findings of the bearish candle reversal patterns strong evidence
of the hanging man and the shooting star patterns are found in most of the foreign
currencies which is statistically significant at 5 level The highest number of the times
the hanging man and shooting star patterns appear is 155 times and 129 times
respectively The pattern of the hanging man that appears in AUDUSD USDCAD and
USDJPY can be traded for all the holding periods whereas the same pattern can be
traded in EURUSD GBPUSD and USDZAR for the first six holding periods of
EURUSD the first five holding periods of GBPUSD and USDZAR respectively The
shooting star pattern can be traded in USDCAD GBPEUR USDZAR and USDJPY
for all the holding periods The research also finds that the number of times the dark-
cloud cover pattern appears is very low it is between one and seven in which the
average returns are found statistically insignificant Similarly the average returns of the
bearish engulfing pattern are found statistically insignificant even though there is a high
frequency of the pattern that goes up to 181 times The last interesting finding is that
both of the emerging market currencies show evidence of the hanging man and the
ID 100068
75
shooting star patterns with an average return that is statistically and consistently
significant at 5 level These findings also reject the two null hypotheses Moreover
these partial findings that find no evidence of profitability of the other candle patterns
are in line with the other results in the literature that find no evidence of profitable
candlestick patterns particularly in the studies done by Brashears and Elam (1993)
Marshall Young and Rose (2005) and Young and Marshall (2007) As unprofitable
technical trading rules in general the poor evidence of the candle patterns are also in
line with the other results found by Levich and Thomas (1993) Lee and Mathur (1996)
LeBaron (2002) Olson (2004) and Lento and Gradojevic (2007)
Currency-wise findings are the second part of the research main findings The bullish
hammer can be traded for the first six holding periods as well as the bearish hanging
man for all the holding periods in AUDUSD Traders can trade the bearish hanging man
and the shooting star patterns in USDCAD for all the holding periods The bullish
hammer pattern the bearish hanging man pattern can be traded in EURUSD for the
first six holding periods GBPUSD can be traded using the bullish hammer the bearish
hanging man and the shooting star patterns for all the holding periods the first five
holding periods and all the holding periods respectively USDINR can be traded using
the bullish engulfing pattern USDZAR can be traded using the bearish hanging man
and the shooting start patterns for the first five holding periods and all the holding
periods respectively Finally USDJPY can be traded using the bullish hammer pattern
for the first five holding periods it can also be traded using the bearish patterns of the
hanging man and the shooting star for all the holding periods
After finding strong evidence of some profitable Japanese candle reversal patterns in
foreign exchange markets this research provides recommendations that are divided
into two main areas The first one is in reference to trading and investment decisions
The other area is concerned with future research Based on the findings above it is
recommended to trade the Japanese candlestick patterns that are found statistically
significant at 5 level in the respective currencies This is summarized in the second
ID 100068
76
section above that is pertaining to respective currency pairs For future research it is
recommended to use more sophisticated algorithm programmes and statistical models
to re-examine the findings of this research not only using daily prices but also intraday
timeframes Since foreign exchange markets are known for being very complex and
difficult to predict it is recommended to use other technical trading rules such as
support-resistance levels and oscillators like the MACD histogram and Commodity
Channel Index (CCI) in combination with the candlestick pattern trading rules Using
such strong different trading rules in which the majority of the trading signals would
agree will help making the trading system very robust Moreover future research is
encouraged to examine the candle reversal patterns in term of bullish and bearish
trends The beauty of the Japanese candlestick patterns reveals when they are used in
combination with other trading rules The key concept in using the candlestick charting
system is the comprehensive technical picture of the market
ID 100068
77
Chapter 9
Conclusion
ID 100068
78
Chapter 9 Conclusion
This research attempts to examine the profitability of selected Japanese candlestick
reversal patterns in the foreign exchange markets as the main objective The research
tests two null hypotheses that assume all Japanese candle reversal patterns cannot be
used to forecast foreign currency price movements and that foreign exchange markets
are efficient supporting the weak form of the EMH The sample includes a 12-year data
of 3129 observations for seven foreign exchange currencies AUDUSD USDCAD
EURUSD GBPUSD USDINR USDZAR and USDJPY The selected Japanese
candle patterns include four bullish and four bearish patterns The bullish patterns
include the bullish hammer the piercing lines the bullish doji star and the bullish
engulfing whereas the bearish patterns include the hanging man the dark-cloud cover
the shooting star and the bearish engulfing The statistical z score test is used to test
the average returns of open-close difference at 5 level of significance for seven
holding periods one day two days three days four days five days seven days and
ten days The 14-day Relative Strength Index (RSI) is used to distinguish similar
patterns that appear at different turning points these similar patterns include the bullish
hammer the hanging man and the shooting star If the hanging man and the shooting
start patterns form above 50 it is assumed that there is a high possibility that the trend
will reverse from up to down Similarly if the bullish hammer pattern forms below the 50
reading there is a high possibility that the current trend will reverse from down to up To
arrive to the final results that are tested statistically using z score the number of times
the candle pattern is identified (n) has to be above 30 (Peterson and Leuthold 1982)
The second condition is that for the three candle patterns that are used in combination
with the RSI filter the results are considered only if the average returns are statistically
significant at 5 level for at least five consecutive holding periods
After examining the candle patterns in the seven currencies the research finds
evidence of some profitable of Japanese candle patterns at 5 level of significance
ID 100068
79
Strong evidence of the bullish hammer the bearish hanging man and the shooting star
patterns in some currencies is found The research finds that the frequency of pattern
appearance for the piercing lines and the dark-cloud cover patterns are the least among
the eight candle patterns Also the results show that the bullish hammer and the
bearish hanging man patterns can be traded in AUDUSD for the first six holding
periods and all the holding periods respectively The bearish hanging man and the
shooting star patterns can be traded in USDCAD for all the seven holding periods The
bullish hammer and the bearish hanging man patterns can be traded in EURUSD for all
the holding periods The bullish hammer the bearish hanging man and the shooting star
patterns can be traded in GBPUSD for the all holding periods the first five trading
periods and all the holding periods respectively The bullish engulfing pattern can be
traded in USDINR for all the holding periods The bearish hanging man and the
shooting star patterns can be traded in USDZAR for all the trading periods Moreover
the bullish hammer the bearish hanging man and the shooting star patterns can be
traded in USDJPY for the first five holding periods of the hanging man and all the
holding periods of the other two patterns Thus these results reject the two null
hypotheses Furthermore the findings of the profitable Japanese candle patterns are in
line with the results found by Goo Chen and Chang (2007) Lana Zhanga and Xiongb
(2011) Haibin Zhao and Wang (2012) Lu Shiu and Liu (2012) on the studies that
examine the profitability of the Japanese candle patterns as technical trading rules in
particular These results also support the evidence found using other profitable technical
trading rules in general by Longworth 1981 Brock Lakonishok and LeBaron 1992
Gencay 1997Osler 2000 Saacke 2002 Osker 2003 2006 Shik and Chong 2007
Lento and Gradojevic 2007 Park and Scott 2007 Stephen 2008 Cekirdekci and Iliev
2010 and Loumlnnbark and Lundstroumlm 2012
Market participants are recommended to use the above candle patterns in the
respective foreign currency in their trading investment and hedging decisions It is also
recommended to use the candle charts along with other trading rules such as support
and resistance levels and oscillators For future research it is recommended to use and
ID 100068
80
examine more sophisticated algorithm programmes and statistical models to re-test the
findings of this research using both daily and intraday prices It is also recommended to
use other technical trading rules such as support-resistance levels and oscillators such
as MACD histogram and the CCI in combination with candlestick pattern trading rules
This is required because foreign exchange markets are very complex using such strong
different trading rules makes the trading system more powerful Moreover future
research is encouraged to examine the candle reversal patterns in term of bullish and
bearish trends The beauty of the Japanese candlestick patterns reveals when they are
used in a combination with other trading rules Last but not least the key concept in
using the candlestick charting system is the comprehensive technical picture of the
market that makes these candlestick trading systems robust
ID 100068
81
Bibliography Achelis S (2001) Technical Analysis from A to Z 2nd ed New York McGraw-Hill Anderson J (2003) A Test of Weak-Form Market Efficiency in Australian Bank Bill Futures Calendar Spreads [online] [Accessed 03 September 2012] Available at httpeprintsquteduau3871Anderson_134pdf Bettman J Sault S amp Welch E (2006) Fundamental and Technical analysis Substitiutes or Compliments [online] [Accessed 07 September 2012] Available at httppapersssrncomsol3paperscfmabstract_id=899879 Brock W Lakonishok J amp LeBaron B (1991) Simple Technical Trading Rules and the Stochastic Properties of Stock Returns [online] [Accessed 10 September 2012] Available at httpwwwsantafeedumediaworkingpapers91-01-006pdf Buffett W (1984) The Superinvestors of Graham-and-doddsville [online] [Accessed 04 October 2012] Available at httpwwwbestinverespdfarticulos_valueThe20Superinvestors20of20Graham20and20Doddsville20by20Warren20Buffettpdf BxCapricorn (2009) Candlestick Alternative Individually Colored Up-Down Bars [blog entry] [Accessed 02 December 2012] Available at httppeltiertechcomWordPresscandlestick-alternative-individually-colored-up-down-bars Cekirdekci M amp Iliev V (2010) Trading System Development Trading the Opening Range Breakouts [online] [Accessed 10 October 2012] Available at httpwwwwpieduPubsE-projectAvailableE-project-042910-142422unrestrictedVeselin_Iliev_IQPpdf Colby R (2003) The Encyclopedia of Technical Market Indicators 2nd ed New York McGraw-Hill Cooper T (2011) Optimal Rotational Strategies using Combined Technical and Fundamental Analysis [online] [Accessed 09 September 2012] Available at httpwwwnaaimorgwp-contentuploads201204K2011_Tony-Cooper_Optimal-_Rotational-_Strategiespdf Fadhel D (2010) Using Candlestick Patterns to Test Efficiency in Stock Futures Markets MSc assignment The British University in Dubai Fama E (1970) ldquoEfficient Capital Markets A Review of Theory and Empirical Workrdquo Journal of Finance [online] Vol 25 (2) [Accessed 15 September 2012] Available at
ID 100068
82
httpefinanceorgcncnfmEfficient20Capital20Markets20A20Review20of20Theory20and20Empirical20Workpdf Friesen G Weller P amp Dunham L (2007) Price trends and Patterns in Technical Analysis A theoretical and empirical examination [online] [Accessed 15 September 2012] Available at httppapersssrncomsol3paperscfmabstract_id=970852 Genccedilay R 1997 The Predictability of Security Returns with Simple Technical Trading Rules Journal of Empirical Finance [online] Vol 5 [Accessed 15 September 2012] Available at httpwwwsfuca~rgencayjarticlesjef-technicalpdf HolmbergU Loumlnnbark C amp Lundstroumlm C (2012) Assessing the Profitability of Intraday Opening Range Breakout Strategies [online] [Accessed 02 September 2012] Available at httpwwwusbeumusedigitalAssets102102002_ues845pdf Jegadeesh N amp Titman S (1993) Returns to Buying Winners and Selling Losers Implications for Stock Market Efficiency Journal of Finance [online] Vol 48 (1) [Accessed 15 September 2012] Available at httpwwwe-m-horgJeTi93pdf Krishnan R amp Menon S (2009) Impact of Currency Pairs Time Frames and Technical Indicators on Trading Profit in Forex Spot Market [online] [Accessed 02 September 2012] Available at httpwwwfxinvestornetforex-educationImpactofCurrencyPairsTimeFramesonTradingProfitsInForexMarketspdf LeBaron B (1998) Technical Trading Rule Profitability and Foreign Exchange Intervention [online] Journal of International Economics Vol 49 (1) [Accessed 04 September 2012] Available at httpwwwsciencedirectcomsciencearticlepiiS0022199698000610 LeBaron B (2002) Technical Trading Profitability in Foreign Exchange Markets in the 1990rsquos [online] [Accessed 02 September 2012] Available at httppeoplebrandeisedu~blebaronwpsfx90pdf Lee C amp Mathur I (1996) A comprehensive Look at the Efficacy of Technical Trading Rules Applied to Cross-rates The European Journal of Finance [online] Vol 2 (4) [Accessed 04 September 2012] Available at httpeconpapersrepecorgarticletafeurjfiv_3a2_3ay_3a1996_3ai_3a4_3ap_3a389-411htm Lento C amp Gradojevic N (2007) The Profitability of Technical Trading Rules A Combined Signal Approach Journal of Applied Business Research [online] Vol 23 (1) [Accessed 04 September 2012] Available at httpjournalscluteonlinecomindexphpJABRarticleviewArticle1405
ID 100068
83
Levich R amp Thomas L (1993) The Significance of Technical Trading Rule Profits in the Foreign Exchange Market a Bootstrap Approach Journal of International Money and Finance [online] Vol 12 (5) [Accessed 04 September 2012] Available at httpwwwnberorgpapersw3818 Levy R (1966) Conceptual Foundations of Technical Analysis Financial Analysts Journal [online] Vol 22 (4) [Accessed 04 September 2012 Available at httpwwwjstororgdiscover1023074470026uid=3737432ampuid=2129ampuid=2ampuid=70ampuid=4ampsid=21101021522633 Lo A amp MacKinlay A (1989) Stock Market Prices Do Not Follow Random Walks Evidence From a Simple Specification Test National Bureau of Economic Research Inc[online] Vol 1(1) [Accessed 02 September 2012] Available at httpideasrepecorgpnbrnberwo2168html Longworth D (1981) Testing the Efficiency of the Canadian-US Exchange Market under the Assumption of No Risk Premium The journal of Finance [online] Vol 36 (1) [Accessed 04 September 2012] Available at httpwwwjstororgdiscover1023072327462uid=3737432ampuid=2129ampuid=2ampuid=70ampuid=4ampsid=21101019268683 Malkiel B (2003) The Efficient Market Hypothesis and Its Critics [online] [Accessed 10 October 2012] Available at httpwwwvixekcomEfficient20Market20Hypothesis20and20its20Critics20-20Malkielpdf Malkiel B Mei J amp Yang R (2006) Investment Strategies to Exploit Economic Growth in China Journal of Investment Consulting [online] Vol 7 (3) [Accessed 15 October 2012] Available at httppapersssrncomsol3paperscfmabstract_id=1702374 Marshall B amp Young M (2007) Market Timing with Candlestick Technical Analysis [online] [Accessed 10 September 2012] Available at httppapersssrncomsol3paperscfmabstract_id=980583 Murphy J (1999) Technical Analysis of Financial Markets 2nd ed New York Penguin Putnam Inc Neely C amp Weller P (2000) Technical Analysis and Central Bank Intervention [online] [Accessed 10 October 2012] Available at httpresearchstlouisfedorgwp199797-002pdf Nison S (2001) Japanese Candlestick Charting Techniques 2nd ed New York Penguin Putnam Inc
ID 100068
84
Nocera J (2009) Poking Holes in a Theory on Markets [online] [Accessed 04 November 2012] Available at httpwwwnytimescom20090606business06nocerahtmlscp=1ampsq=efficient20marketampst=cseamp_r=0 Okunev J amp White D (2003) Do momentum-based Strategies Still Work in Foreign Currency Markets [online] [Accessed 19 October 2012] Available at httpwwwdocsfceunsweduaubankingworkpapcurrencypdf Omrane W amp Oppens H (2004) The Predictive Success and Profitability of Chart Patterns in the EuroDollar Foreign Exchange Market [online] [Accessed 07 September 2012] Available at httppapersssrncomsol3paperscfmabstract_id=484384 Olson D (2004) Have Trading Rule Profits in the Currency Markets Declined over Time Journal of Banking and Finance [online] Vol 28 (1) [Accessed 04 September 2012] Available at httpwwwsciencedirectcomsciencearticlepiiS0378426602003990 Osler C (2000) Support for Resistance Technical Analysis and Intraday Exchange Rates [online] [Accessed 09 December 2012] Available at httpwwwnewyorkfedorgresearchepr00v06n20007oslepdf Osler C (2003) Currency Orders and Exchange Rate Dynamics An Explanation for the Predictive Success of Technical Analysis Journal of Finance [online] Vol 58 (5) [Accessed 16 October 2012] Available at ftpwwweconbguacilCoursesSignaling_in_Financial_MarketsReadingsArticles2009-01-1420Technical20AnalysisCurrency20Orders20and20Exchange20Rate20Dynamics20An20Explanation20for20the20Predictive20Success20ofTechnical20Analysispdf Park C amp Irwin S (2007) What Do We Know about the Probability of Technical Analysis Journal of Economic Surveys [online] Vol 21 (4) [Accessed 10 October 2012] Available at httpideasrepecorgablajecsurv21y2007i4p786-826html Peterson P amp Leuthold R (1982)Using Mechanical Trading Rules to Evaluate the Weak-Form Efficiency of Futures Markets [online] [Accessed 16 December 2012] Available at httpageconsearchumnedubitstream29574114010147pdf Pukthuanthong K amp Thomas L (2008) Weak-form Efficiency in Currency Markets Financial Analysts Journal [online] Vol 64 (3) [Accessed 04 November 2012] Available at httppapersssrncomsol3paperscfmabstract_id=1266184
ID 100068
85
Raymond Y (2012) Fundamental Analysis VS Technical Analysis [online] [Accessed 02 December 2012] Available at httppapersssrncomsol3paperscfmabstract_id=2051485 Saacke P (2002) Technical Analysis and the Effectiveness of Central Bank Intervention Journal of International Money amp Finance [online] Vol 21 (4) [Accessed 04 November 2012] Available at httpmoving-averagestechnicalanalysisorgukSaac02pdf Samuelson P (1965) Proof that Properly Anticipated Prices Fluctuate Randomly [online] [Accessed 10 October 2012] Available at httpstevereadscompapers_to_readproof_that_properly_anticipated_prices_fluctuate_randomlypdf Shik T amp Chong T (2007) A comparison of MA and RSI returns with exchange rate intervention Applied Economic Letters [online] Vol14 (5) [Accessed 15 October 2012] Available at httpideasrepecorgatafapecltv14y2007i5p371-383html SilberW (1994) Technical Trading When it Works and When it Doesnrsquot The Journal of Derivatives [online] Vol 1 No 3 [Accessed 10 October 2012] Available at httpwwwiijournalscomdoiabs103905jod1994407887 Taylor J amp Allen H (1992) The Use of Technical Analysis in Foreign Exchange Market Journal of International Money and Finance [online] Vol 11 (3) [Accessed 10 October 2012] Available at httpwwwsciencedirectcomsciencearticlepii0261560692900483 Thomas G amp Lukas M (2006) Extended Evidence on the Use of Technical Analysis in Foreign Exchange International Journal of Finance amp Economics [online] Vol 11 (4) [Accessed 14 October 2012] Available at ftpwwweconbguacilcoursesSignaling_in_Financial_MarketsReadingsArticles2009-01-1420Technical20AnalysisEXTENDED20EVIDENCE20ON20THE20USE20OF20TECHNICAL20ANALYSIS20IN20FOREIGN20EXCHANGEpdf Thomson Reuters (2013) Foreign Currency Data Download Prices downloaded from 3000 xtra terminal on 01 January 2013 Worrachate A amp Goodman D (2012) Currency Trading at $5 Trillion a Day Surpassed Pre-Lehman High BIS Says [online] [Accessed 20 December 2012] Available at httpwwwbloombergcomnews2012-03-11currency-trading-at-5-trillion-a-day-surpassed-pre-lehman-high-bis-sayshtml
ID 100068
86
Appendix 1 Japanese Candlestick Patterns
Below are the different types of Japanese candle patterns reversal and continuation
patterns The number in brackets shows the number of candles required to form the
pattern (Murphy 1999)
ID 100068
87
Appendix 1 Japanese Candlestick Patterns (continued)
ID 100068
88
Appendix 1 Japanese Candlestick Patterns (continued)
ID 100068
89
Appendix 1 Japanese Candlestick Patterns (continued)
ID 100068
90
Appendix 1 Japanese Candlestick Patterns (continued)
ID 100068
91
Appendix 2 Descriptive statistics of the eight candle pattern analysis for AUDUSD
1 Day 2 Days 3 Days 4 Days 5 Days 7 Days 10 Days 1 Day 2 Days 3 Days 4 Days 5 Days 7 Days 10 DaysAverage 00066 00076 00082 00076 00066 00047 00063 00058 00069 00086 00090 00080 00059 00067
Var 00001 00001 00002 00002 00002 00003 00006 00000 00001 00002 00002 00003 00003 00005
n 89 89 89 89 89 89 89 57 57 57 57 57 57 57
sqrt(varn) 0001 0001 0001 0001 0002 0002 0003 0001 0001 0002 0002 0002 0002 0003
Z score 7979 6128 6085 5173 3960 2622 2438 7157 5481 5297 4655 3590 2471 2162
P-value 000 000 000 000 000 000 001 000 000 000 000 000 001 002
SD 0008 0012 0013 0014 0016 0017 0025 001 001 001 001 002 002 002
Min -0004 -0023 -0020 -0023 -0034 -0030 -0054 -0003 -0013 -0014 -0023 -0034 -0023 -0035
Max 0051 0073 0049 0053 0060 0058 0076 0027 0031 0048 0053 0060 0058 0076
Average 00002 -00036 -00007 -00043 00004 00071 -00056
Var 00000 00002 00003 00004 00007 00013 00011
n 4 4 4 4 4 4 4
sqrt(varn) 0001 0007 0008 0010 0013 0018 0017
Z score 0198 -0535 -0082 -0435 0029 0396 -0328
P-value 042 030 047 033 049 035 037
SD 000 001 002 002 003 004 003
Min -0003 -0020 -0019 -0025 -0026 -0027 -0044
Max 0003 0013 0021 0021 0035 0052 0032
Average -00006 -00009 -00009 -00012 -00014 00052 00038 00039 00028 00022 00013 00016 00023 00025
Var 00001 00001 00001 00002 00002 00077 00078 00000 00000 00001 00001 00001 00001 00002
n 148 148 148 148 148 148 148 92 92 92 92 92 92 92
sqrt(varn) 0001 0001 0001 0001 0001 0007 0007 0000 0001 0001 0001 0001 0001 0002
Z score -0930 -1157 -0917 -1019 -1179 0717 0521 9602 4433 2319 1300 1573 2015 1553
P-value 018 012 018 015 012 024 030 000 000 001 010 006 002 006
SD 0007 0009 0012 0014 0015 0087 0088 0004 0006 0009 0009 0010 0011 0015
Min -0025 -0031 -0051 -0064 -0053 -0085 -0062 -0001 -0010 -0013 -0025 -0019 -0018 -0030
Max 0029 0020 0033 0050 0055 1039 1039 0019 0020 0051 0031 0031 0036 0059
Average -00015 -00015 -00017 -00016 -00021 00132 00106
Var 00001 00001 00002 00003 00003 00160 00163
n 70 70 70 70 70 70 70
sqrt(varn) 0001 0001 0002 0002 0002 0015 0015
Z score -1388 -1102 -0913 -0727 -0950 0871 0692
P-value 008 014 018 023 017 019 024
SD 001 001 002 002 002 013 013
Min -0025 -0031 -0051 -0064 -0053 -0085 -0062
Max 0029 0020 0033 0050 0055 1039 1039
1 Day 2 Days 3 Days 4 Days 5 Days 7 Days 10 Days 1 Day 2 Days 3 Days 4 Days 5 Days 7 Days 10 DaysAverage 00054 00053 00053 00057 00055 00070 00088 00054 00041 00030 00040 00039 00042 00051
Var 00000 00001 00001 00001 00002 00003 00004 00000 00001 00001 00001 00002 00003 00003
n 77 77 77 77 77 77 77 40 40 40 40 40 40 40
sqrt(varn) 0001 0001 0001 0001 0002 0002 0002 0001 0001 0001 0002 0002 0003 0003
Z score 9480 5729 5275 4439 3561 3500 4108 5895 2822 2101 2327 1886 1504 1742
P-value 000 000 000 000 000 000 000 000 000 002 001 003 007 004
SD 0005 0008 0009 0011 0014 0018 0019 001 001 001 001 001 002 002
Min -0001 -0023 -0023 -0018 -0031 -0048 -0052 -0001 -0023 -0023 -0018 -0024 -0048 -0052
Max 0034 0031 0022 0043 0040 0063 0070 0034 0031 0021 0031 0035 0045 0033
Average -00071 -00034 -00120 -00059 -00012 -00015 -00017
Var 00000 00001 00005 00005 00005 00005 00011
n 7 7 7 7 7 7 7
sqrt(varn) 0002 0004 0008 0008 0008 0008 0012
Z score -2887 -0858 -1435 -0718 -0140 -0184 -0138
P-value 000 020 008 024 044 043 045
SD 0007 0011 0022 0022 0022 0022 0033
Min -0018 -0022 -0041 -0038 -0026 -0033 -0049
Max 0002 0011 0015 0021 0025 0032 0046
Average 00032 00027 00032 00038 00061 00054 00065
Var 00000 00001 00001 00001 00001 00002 00002
n 28 28 28 28 28 28 28
sqrt(varn) 0001 0001 0002 0002 0002 0002 0002
Z score 3045 1903 1885 2206 2688 2326 2628
P-value 000 003 003 001 000 001 000
SD 0006 0007 0009 0009 0012 0012 0013
Min -0005 -0010 -0012 -0015 -0012 -0025 -0028
Max 0014 0024 0022 0018 0050 0031 0026
Average -00005 00003 00002 00010 00011 -00006 00013
Var 00000 00001 00001 00001 00002 00003 00002
n 49 49 49 49 49 49 49
sqrt(varn) 0001 0001 0002 0002 0002 0002 0002
Z score -0597 0243 0092 0586 0562 -0258 0621
P-value 028 040 046 028 029 040 027
SD 0006 0010 0012 0012 0014 0016 0014
Min -0017 -0022 -0035 -0031 -0037 -0033 -0031
Max 0012 0025 0025 0024 0031 0037 0032
At 5 level of significance
0002
Bullish
Engulfing0000
With RSI
Filter
Holding period
0004Bullish
Hammer0006
Piercing Lines -0005
Bullish Doji
Star0004
With RSI
Filter
Holding period
0007
Bullish
Candlestick
Patterns
Descriptive
Statistics
Holding
Periods
Average
Holding period
Dark-Cloud
Cover
Shooting Star
Bearish
Engulfing
0007
-0001
0001
0002
Holding periodHolding
Periods
Average
Bearish
Candlestick
Patterns
Descriptive
Statistics
Hanging Man
ID 100068
92
Appendix 3 Descriptive statistics of the eight candle pattern analysis for USDCAD
1 Day 2 Days 3 Days 4 Days 5 Days 7 Days 10 Days 1 Day 2 Days 3 Days 4 Days 5 Days 7 Days 10 DaysAverage 00053 00058 00068 00063 00072 00069 00066 00049 00055 00077 00068 00083 00092 00087
Var 00000 00000 00001 00001 00002 00003 00005 00000 00000 00001 00001 00001 00002 00003
n 79 79 79 79 79 79 79 44 44 44 44 44 44 44
sqrt(varn) 0000 0001 0001 0001 0001 0002 0003 0001 0001 0001 0002 0002 0002 0003
Z score 11920 7456 6379 4888 4907 3632 2555 8727 5249 5633 4399 4697 4543 3218
P-value 000 000 000 000 000 000 001 000 000 000 000 000 000 000
SD 0004 0007 0009 0011 0013 0017 0023 000 001 001 001 001 001 002
Min -0001 -0009 -0015 -0026 -0023 -0044 -0090 0000 -0008 -0015 -0020 -0016 -0033 -0031
Max 0016 0032 0036 0043 0059 0062 0088 0015 0022 0029 0024 0029 0028 0035
Average -00039 -00029 -00044 -00040 00016 -00041 00094
Var 00000 00003 00003 00003 00000 00002 00000
n 2 2 2 2 2 2 2
sqrt(varn) 0005 0012 0012 0012 0005 0010 0001
Z score -0794 -0250 -0373 -0331 0363 -0411 9400
P-value 021 040 035 037 036 034 000
SD 001 002 002 002 001 001 000
Min -0009 -0015 -0016 -0016 -0003 -0014 0008
Max 0001 0009 0007 0008 0006 0006 0010
Average 00056 00055 00058 00057 00064 00068 00069 00064 00062 00059 00054 00053 00065 00073
Var 00000 00001 00001 00001 00002 00003 00004 00000 00001 00001 00002 00002 00003 00005
n 240 240 240 240 240 240 240 108 108 108 108 108 108 108
sqrt(varn) 0000 0001 0001 0001 0001 0001 0001 0001 0001 0001 0001 0001 0002 0002
Z score 17964 9992 9069 7432 7383 6354 5191 11585 6832 5480 4375 4085 4026 3515
P-value 000 000 000 000 000 000 000 000 000 000 000 000 000 000
SD 0005 0008 0010 0012 0013 0016 0021 0006 0009 0011 0013 0014 0017 0022
Min -0002 -0024 -0022 -0024 -0029 -0046 -0109 0000 -0008 -0022 -0024 -0029 -0046 -0109
Max 0028 0059 0043 0047 0050 0066 0060 0028 0059 0043 0046 0039 0066 0056
Average -00002 00009 00003 00003 00005 00005 00020
Var 00001 00001 00002 00002 00003 00003 00005
n 171 171 171 171 171 171 171
sqrt(varn) 0001 0001 0001 0001 0001 0001 0002
Z score -0428 1065 0340 0237 0388 0367 1237
P-value 033 014 037 041 035 036 011
SD 001 001 001 001 002 002 002
Min -0031 -0033 -0037 -0035 -0044 -0054 -0053
Max 0046 0069 0058 0089 0120 0078 0073
1 Day 2 Days 3 Days 4 Days 5 Days 7 Days 10 Days 1 Day 2 Days 3 Days 4 Days 5 Days 7 Days 10 DaysAverage 00057 00055 00054 00047 00053 00057 00052 00052 00026 00027 00021 -00002 00014 00010
Var 00000 00001 00002 00001 00003 00004 00005 00000 00001 00001 00001 00002 00002 00002
n 58 58 58 58 58 58 58 25 25 25 25 25 25 25
sqrt(varn) 0001 0002 0002 0002 0002 0002 0003 0001 0002 0002 0002 0003 0003 0003
Z score 8061 3627 3039 2963 2402 2294 1775 6554 1535 1686 1112 -0076 0517 0347
P-value 000 000 000 000 001 001 004 000 006 005 013 047 030 036
SD 0005 0012 0014 0012 0017 0019 0022 000 001 001 001 001 001 001
Min 0000 -0016 -0022 -0020 -0031 -0024 -0044 0000 -0016 -0010 -0010 -0031 -0024 -0022
Max 0025 0043 0070 0043 0058 0072 0111 0013 0025 0021 0030 0025 0027 0043
Average 00055 00055 00080 00058 00075 00116 00160
Var 00000 00001 00003 00001 00003 00008 00006
n 8 8 8 8 8 8 8
sqrt(varn) 0002 0003 0006 0004 0006 0010 0009
Z score 3026 1927 1333 1358 1298 1182 1811
P-value 000 003 009 009 010 012 004
SD 0005 0008 0017 0012 0016 0028 0025
Min -0005 -0009 -0010 -0008 -0012 -0035 -0015
Max 0013 0015 0039 0030 0037 0044 0058
Average 00007 00034 00055 00036 00043 00044 00077
Var 00001 00002 00003 00002 00003 00005 00009
n 19 19 19 19 19 19 19
sqrt(varn) 0002 0003 0004 0003 0004 0005 0007
Z score 0382 1158 1275 1115 1085 0882 1133
P-value 035 012 010 013 014 019 013
SD 0008 0013 0019 0014 0017 0022 0030
Min -0013 -0016 -0030 -0028 -0026 -0035 -0036
Max 0025 0043 0070 0043 0058 0072 0111
Average -00014 -00025 -00014 -00023 -00008 -00011 -00034
Var 00000 00001 00001 00001 00001 00003 00002
n 35 35 35 35 35 35 35
sqrt(varn) 0001 0001 0002 0002 0002 0003 0003
Z score -1851 -1755 -0847 -1241 -0409 -0375 -1343
P-value 003 004 020 011 034 035 009
SD 0005 0008 0010 0011 0011 0017 0015
Min -0012 -0026 -0024 -0024 -0034 -0042 -0034
Max 0009 0012 0024 0019 0018 0030 0027
At 5 level of significance
Bullish
Engulfing-0002
Bullish
Hammer0005 0002
Piercing Lines 0009
Bullish Doji
Star0004
Holding period
Shooting Star 0006 0006
Bearish
Engulfing0001
Bullish
Candlestick
Descriptive
Statistics
Holding
Periods
Holding period With RSI
Filter
Hanging Man 0006 0007
Dark-Cloud
Cover-0001
Holding periodBearish
Candlestick
Patterns
Descriptive
Statistics
Holding
Periods
Average
Holding periodWith RSI
Filter
ID 100068
93
Appendix 4 Descriptive statistics of the eight candle pattern analysis for EURUSD
1 Day 2 Days 3 Days 4 Days 5 Days 7 Days 10 Days 1 Day 2 Days 3 Days 4 Days 5 Days 7 Days 10 DaysAverage 00060 00063 00053 00044 00035 00046 00043 00058 00072 00049 00054 00048 00046 00039
Var 00000 00001 00002 00002 00003 00004 00006 00000 00001 00001 00002 00003 00003 00004
n 106 106 106 106 106 106 106 57 57 57 57 57 57 57
sqrt(varn) 0001 0001 0001 0001 0002 0002 0002 0001 0001 0002 0002 0002 0002 0003
Z score 11057 6201 4199 3044 2185 2435 1841 7749 5822 3207 2860 2254 2000 1476
P-value 000 000 000 000 001 001 003 000 000 000 000 001 002 007
SD 0006 0011 0013 0015 0016 0019 0024 001 001 001 001 002 002 002
Min -0004 -0021 -0022 -0036 -0035 -0031 -0085 -0002 -0012 -0018 -0024 -0032 -0025 -0034
Max 0029 0032 0038 0044 0043 0058 0061 0029 0032 0038 0044 0043 0053 0047
Average 00004 -00009 -00024 -00043 -00081 -00047 -00059
Var 00002 00001 00003 00003 00003 00004 00005
n 7 7 7 7 7 7 7
sqrt(varn) 0005 0004 0006 0007 0007 0008 0008
Z score 0094 -0229 -0386 -0623 -1190 -0613 -0735
P-value 046 059 065 073 088 073 077
SD 001 001 002 002 002 002 002
Min -0020 -0009 -0028 -0025 -0027 -0025 -0025
Max 0018 0017 0020 0026 0018 0030 0032
Average 00066 00065 00138 00133 00147 00221 00227 00064 00054 00216 00202 00218 00359 00360
Var 00000 00001 00098 00099 00099 00194 00197 00000 00001 00201 00202 00203 00398 00399
n 181 181 181 181 181 181 181 87 87 87 87 87 87 87
sqrt(varn) 0000 0001 0007 0007 0007 0010 0010 0001 0001 0015 0015 0015 0021 0021
Z score 14089 7642 1877 1803 1981 2132 2179 9528 4571 1422 1327 1431 1678 1681
P-value 000 000 003 004 002 002 001 000 000 008 009 008 005 005
SD 0006 0012 0099 0099 0100 0139 0140 0006 0011 0142 0142 0142 0199 0200
Min -0001 -0022 -0041 -0056 -0039 -0036 -0091 -0001 -0022 -0023 -0024 -0027 -0036 -0048
Max 0033 0052 1323 1323 1323 1323 1323 0033 0052 1323 1323 1323 1323 1323
Average 00006 00007 00010 00016 00016 00012 00000
Var 00001 00002 00002 00002 00003 00004 00007
n 156 156 156 156 156 156 156
sqrt(varn) 0001 0001 0001 0001 0001 0002 0002
Z score 0748 0671 0852 1316 1188 0707 0002
P-value 023 025 020 009 012 024 050
SD 001 001 001 002 002 002 003
Min -0022 -0031 -0030 -0041 -0035 -0041 -0066
Max 0030 0039 0053 0043 0050 0071 0080
1 Day 2 Days 3 Days 4 Days 5 Days 7 Days 10 Days 1 Day 2 Days 3 Days 4 Days 5 Days 7 Days 10 DaysAverage 00069 00085 00103 00097 00082 00111 00137 00064 00080 00094 00085 00060 00108 00162
Var 00000 00001 00002 00002 00003 00004 00008 00000 00001 00001 00002 00003 00005 00010
n 64 64 64 64 64 64 64 34 34 34 34 34 34 34
sqrt(varn) 0001 0001 0002 0002 0002 0003 0003 0001 0001 0002 0002 0003 0004 0005
Z score 9122 5806 5359 5122 3939 4311 3942 7655 5739 5329 3898 2012 2946 3011
P-value 000 000 000 000 000 000 000 000 000 000 000 002 000 000
SD 0006 0012 0015 0015 0017 0021 0028 000 001 001 001 002 002 003
Min 0000 -0009 -0012 -0020 -0036 -0031 -0039 0001 -0004 -0007 -0016 -0036 -0025 -0031
Max 0034 0073 0103 0084 0055 0067 0170 0020 0028 0032 0032 0043 0067 0170
Average -00016 -00036 -00047 -00048 -00037 -00073 -00029
Var 00000 00000 00001 00001 00002 00007 00007
n 7 7 7 7 7 7 7
sqrt(varn) 0002 0001 0003 0004 0005 0010 0010
Z score -0787 -4245 -1554 -1222 -0737 -0746 -0296
P-value 022 000 006 011 023 023 038
SD 0005 0002 0008 0010 0013 0026 0026
Min -0009 -0006 -0017 -0017 -0020 -0045 -0044
Max 0008 -0001 0006 0009 0010 0016 0026
Average -00008 00002 00016 00013 00008 00001 00033
Var 00000 00001 00001 00002 00002 00001 00002
n 15 15 15 15 15 15 15
sqrt(varn) 0002 0002 0003 0003 0004 0003 0003
Z score -0494 0094 0594 0387 0216 0045 1003
P-value 031 046 028 035 041 048 016
SD 0006 0009 0010 0013 0014 0012 0013
Min -0011 -0016 -0014 -0016 -0028 -0023 -0017
Max 0016 0015 0018 0024 0021 0023 0027
Average -00010 00000 -00011 -00024 -00013 00019 00050
Var 00001 00001 00002 00002 00002 00004 00008
n 49 49 49 49 49 49 49
sqrt(varn) 0001 0002 0002 0002 0002 0003 0004
Z score -0861 0013 -0613 -1188 -0609 0677 1270
P-value 019 051 027 012 027 075 090
SD 0009 0012 0013 0014 0015 0020 0028
Min -0022 -0028 -0028 -0031 -0046 -0040 -0045
Max 0032 0047 0030 0030 0026 0065 0139
At 5 level of significance
Bullish
Engulfing0000
Bullish
Hammer0010 0009
Piercing Lines -0004
Bullish Doji
Star0001
Holding period
Shooting Star 0014 0021
Bearish
Engulfing0001
Bullish
Candlestick
Descriptive
Statistics
Holding
Periods
Holding period With RSI
Filter
Hanging Man 0005 0005
Dark-Cloud
Cover-0004
Holding periodBearish
Candlestick
Patterns
Descriptive
Statistics
Holding
Periods
Average
Holding periodWith RSI
Filter
ID 100068
94
Appendix 5 Descriptive statistics of the eight candle pattern analysis for GBPUSD
1 Day 2 Days 3 Days 4 Days 5 Days 7 Days 10 Days 1 Day 2 Days 3 Days 4 Days 5 Days 7 Days 10 DaysAverage 00067 00061 00053 00049 00054 00065 00058 00061 00055 00052 00053 00057 00048 00027
Var 00000 00002 00002 00003 00004 00008 00011 00000 00001 00002 00003 00004 00007 00010
n 99 99 99 99 99 99 99 57 57 57 57 57 57 57
sqrt(varn) 0001 0001 0002 0002 0002 0003 0003 0001 0001 0002 0002 0003 0004 0004
Z score 10008 4341 3443 2727 2588 2316 1757 7854 3929 2641 2212 2127 1368 0651
P-value 000 000 000 000 000 001 004 000 000 000 001 002 009 026
SD 0007 0014 0015 0018 0021 0028 0033 001 001 001 002 002 003 003
Min -0001 -0019 -0028 -0052 -0063 -0070 -0071 -0001 -0015 -0026 -0052 -0063 -0070 -0071
Max 0039 0078 0057 0063 0063 0109 0124 0031 0045 0057 0063 0057 0081 0124
Average 00014 00033 00006 -00084 -00093 00030 00053
Var NA NA NA NA NA NA NA
n 1 1 1 1 1 1 1
sqrt(varn) NA NA NA NA NA NA NA
Z score NA NA NA NA NA NA NA
P-value NA NA NA NA NA NA NA
SD NA NA NA NA NA NA NA
Min 0001 0003 0001 -0008 -0009 0003 0005
Max 0001 0003 0001 -0008 -0009 0003 0005
Average 00076 00083 00079 00157 00170 00178 00196 00086 00100 00096 00083 00102 00100 00117
Var 00001 00002 00003 00136 00137 00138 00142 00001 00003 00004 00006 00009 00010 00014
n 197 197 197 197 197 197 197 93 93 93 93 93 93 93
sqrt(varn) 0001 0001 0001 0008 0008 0008 0008 0001 0002 0002 0003 0003 0003 0004
Z score 14462 8325 6124 1888 2040 2118 2304 9759 5952 4630 3246 3344 3118 3013
P-value 000 000 000 003 002 002 001 000 000 000 000 000 000 000
SD 0007 0014 0018 0116 0117 0118 0119 0008 0016 0020 0025 0029 0031 0037
Min -0009 -0026 -0048 -0061 -0054 -0065 -0079 -0007 -0026 -0043 -0051 -0054 -0047 -0070
Max 0037 0093 0088 1614 1614 1614 1614 0037 0093 0088 0097 0107 0117 0151
Average 00004 00003 00130 00132 00125 00112 00127
Var 00001 00003 00200 00201 00202 00204 00208
n 131 131 131 131 131 131 131
sqrt(varn) 0001 0001 0012 0012 0012 0012 0013
Z score 0427 0200 1053 1063 1007 0898 1005
P-value 033 042 015 014 016 018 016
SD 001 002 014 014 014 014 014
Min -0027 -0041 -0042 -0056 -0059 -0075 -0097
Max 0055 0067 1610 1610 1610 1610 1610
1 Day 2 Days 3 Days 4 Days 5 Days 7 Days 10 Days 1 Day 2 Days 3 Days 4 Days 5 Days 7 Days 10 DaysAverage 00070 00061 00054 00066 00086 00079 00080 00088 00098 00090 00123 00141 00132 00120
Var 00000 00001 00002 00003 00004 00006 00009 00000 00001 00002 00003 00004 00007 00012
n 97 97 97 97 97 97 97 37 37 37 37 37 37 37
sqrt(varn) 0001 0001 0001 0002 0002 0002 0003 0001 0002 0002 0003 0003 0004 0006
Z score 12056 5534 3889 3736 4265 3309 2568 8059 5146 3929 4206 4140 3036 2071
P-value 000 000 000 000 000 000 001 000 000 000 000 000 000 002
SD 0006 0011 0014 0017 0020 0024 0031 001 001 001 002 002 003 004
Min -0002 -0019 -0024 -0032 -0036 -0043 -0119 -0001 -0011 -0020 -0032 -0036 -0043 -0119
Max 0028 0042 0049 0058 0078 0088 0108 0028 0042 0049 0058 0078 0088 0108
Average -00011 00063 -00025 -00111 -00083 -00198 -00086
Var 00002 00007 00011 00022 00021 00051 00014
n 7 7 7 7 7 7 7
sqrt(varn) 0006 0010 0013 0018 0017 0027 0014
Z score -0194 0628 -0192 -0626 -0486 -0736 -0605
P-value 042 027 042 027 031 023 027
SD 0015 0026 0034 0047 0045 0071 0038
Min -0018 -0026 -0063 -0102 -0099 -0178 -0088
Max 0024 0054 0043 0047 0047 0034 0021
Average -00013 00003 -00017 -00042 -00036 -00049 -00070
Var 00001 00001 00002 00003 00008 00011 00020
n 17 17 17 17 17 17 17
sqrt(varn) 0002 0003 0003 0005 0007 0008 0011
Z score -0562 0106 -0559 -0930 -0519 -0618 -0649
P-value 029 046 029 018 030 027 026
SD 0009 0011 0012 0019 0028 0033 0045
Min -0024 -0021 -0025 -0049 -0073 -0109 -0149
Max 0009 0015 0023 0020 0026 0027 0040
Average 00010 00020 00031 00038 00018 -00009 00043
Var 00001 00002 00003 00003 00004 00006 00008
n 48 48 48 48 48 48 48
sqrt(varn) 0002 0002 0003 0003 0003 0004 0004
Z score 0622 0980 1203 1505 0648 -0253 1057
P-value 027 016 011 007 026 040 015
SD 0011 0014 0018 0018 0020 0025 0028
Min -0024 -0026 -0044 -0036 -0057 -0066 -0085
Max 0031 0044 0044 0049 0037 0058 0084
At 5 level of significance
Bullish
Engulfing0002
Bullish
Hammer0007 0011
Piercing Lines -0006
Bullish Doji
Star-0003
Holding period
Shooting Star 0013 0010
Bearish
Engulfing0009
Bullish
Candlestick
Descriptive
Statistics
Holding
Periods
Holding period With RSI
Filter
Hanging Man 0006 0005
Dark-Cloud
Cover-0001
Holding periodBearish
Candlestick
Patterns
Descriptive
Statistics
Holding
Periods
Average
Holding periodWith RSI
Filter
ID 100068
95
Appendix 6 Descriptive statistics of the eight candle pattern analysis for USDINR
1 Day 2 Days 3 Days 4 Days 5 Days 7 Days 10 Days 1 Day 2 Days 3 Days 4 Days 5 Days 7 Days 10 DaysAverage 00878 00685 00760 00671 00864 01322 00653 00978 00930 00774 00790 00750 01638 00823
Var 00250 00591 00938 01514 02612 03663 03983 00374 00726 01313 02246 03039 04316 04429
n 69 69 69 69 69 69 69 39 39 39 39 39 39 39
sqrt(varn) 0019 0029 0037 0047 0062 0073 0076 0031 0043 0058 0076 0088 0105 0107
Z score 4611 2342 2060 1432 1405 1814 0859 3156 2155 1334 1041 0850 1558 0772
P-value 000 001 002 008 008 003 020 000 002 009 015 020 006 022
SD 0158 0243 0306 0389 0511 0605 0631 019 027 036 047 055 066 067
Min -0150 -0560 -0870 -1200 -1510 -1300 -1500 -0140 -0560 -0870 -1200 -1510 -1300 -1500
Max 0790 0880 0900 1500 1790 2470 2090 0790 0880 0900 1500 1620 2470 1825
Average 00050 -00150 -00250 00450 00500 00750 00950
Var 00000 00001 00005 00004 00002 00004 00005
n 2 2 2 2 2 2 2
sqrt(varn) 0005 0005 0015 0015 0010 0015 0015
Z score 1000 -3000 -1667 3000 5000 5000 6333
P-value 016 000 005 000 000 000 000
SD 001 001 002 002 001 002 002
Min 0000 -0020 -0040 0030 0040 0060 0080
Max 0010 -0010 -0010 0060 0060 0090 0110
Average -00684 -00692 -00759 -00699 -00692 -00661 -00647 -00865 -01014 -01246 -01153 -01164 -01473 -01630
Var 71804 72368 72772 72878 73689 74004 75017 81040 81589 81685 81601 82796 82566 83881
n 549 549 549 549 549 549 549 244 244 244 244 244 244 244
sqrt(varn) 0114 0115 0115 0115 0116 0116 0117 0182 0183 0183 0183 0184 0184 0185
Z score -0598 -0603 -0660 -0607 -0597 -0570 -0554 -0474 -0554 -0681 -0630 -0632 -0801 -0879
P-value 027 027 025 027 028 028 029 032 029 025 026 026 021 019
SD 2680 2690 2698 2700 2715 2720 2739 2847 2856 2858 2857 2877 2873 2896
Min -44310 -44390 -44400 -44420 -44490 -44550 -44480 -44310 -44390 -44340 -44100 -44290 -44240 -44420
Max 1220 2020 2080 2760 2790 2320 2550 1150 1470 1590 2760 2790 2050 2300
Average 00273 09833 09691 09676 09295 08935 18775
Var 00406 547179 547892 548641 550897 552705 1076427
n 55 55 55 55 55 55 55
sqrt(varn) 0027 0997 0998 0999 1001 1002 1399
Z score 1003 0986 0971 0969 0929 0891 1342
P-value 016 016 017 017 018 019 009
SD 020 740 740 741 742 743 1038
Min -0500 -0750 -1010 -0930 -1800 -1630 -1370
Max 0790 54800 54800 54800 54800 54800 54800
1 Day 2 Days 3 Days 4 Days 5 Days 7 Days 10 Days 1 Day 2 Days 3 Days 4 Days 5 Days 7 Days 10 DaysAverage 01364 01059 01434 01296 02064 02481 03112 01450 00992 00837 01100 01362 02317 02908
Var 00210 00518 01254 02227 02393 03067 05032 00112 00486 00968 02973 02659 02819 02750
n 40 40 40 40 40 40 40 12 12 12 12 12 12 12
sqrt(varn) 0023 0036 0056 0075 0077 0088 0112 0031 0064 0090 0157 0149 0153 0151
Z score 5948 2943 2562 1737 2669 2834 2775 4743 1558 0932 0699 0915 1511 1921
P-value 000 000 001 004 000 000 000 000 006 018 024 018 007 003
SD 0145 0228 0354 0472 0489 0554 0709 011 022 031 055 052 053 052
Min -0090 -0370 -0340 -0720 -0660 -0910 -1650 -0030 -0370 -0240 -0720 -0580 -0460 -0290
Max 0670 0660 1070 1355 1440 1750 2360 0340 0505 0815 1355 1265 1250 1340
Average 00305 00740 -16351 -16328 -15828 -16388 -17586
Var 00434 01844 916844 917174 918881 917544 915284
n 33 33 33 33 33 33 33
sqrt(varn) 0036 0075 1667 1667 1669 1667 1665
Z score 0840 0989 -0981 -0979 -0949 -0983 -1056
P-value 020 016 016 016 017 016 015
SD 0208 0429 9575 9577 9586 9579 9567
Min -0290 -0960 -54939 -54939 -54939 -54939 -54939
Max 0760 1710 0790 1000 1470 1120 1160
Average -00033 -00201 -00382 -00309 -04374 -04235 -04118
Var 00204 00321 00447 00578 227763 228851 229692
n 133 133 133 133 133 133 133
sqrt(varn) 0012 0016 0018 0021 0414 0415 0416
Z score -0264 -1291 -2085 -1483 -1057 -1021 -0991
P-value 040 010 002 007 015 015 016
SD 0143 0179 0211 0240 4772 4784 4793
Min -0570 -0930 -0860 -1380 -54980 -54980 -54980
Max 0700 0690 1000 0670 0710 1970 2160
Average 00492 01023 01242 01321 01683 01635 01580
Var 00392 00676 01072 01827 03210 04220 04971
n 65 65 65 65 65 65 65
sqrt(varn) 0025 0032 0041 0053 0070 0081 0087
Z score 2003 3173 3059 2491 2395 2029 1807
P-value 002 000 000 001 001 002 004
SD 0198 0260 0327 0427 0567 0650 0705
Min -0350 -0320 -0480 -0620 -1200 -1150 -1350
Max 1090 1210 1170 1375 1885 2360 2020
At 5 level of significance
Bullish
Engulfing0128
Bullish
Hammer0183 0157
Piercing Lines -1163
Bullish Doji
Star-0195
Holding period
Shooting Star -0069 -0122
Bearish
Engulfing0950
Bullish
Candlestick
Descriptive
Statistics
Holding
Periods
Holding period With RSI
Filter
Hanging Man 0083 0095
Dark-Cloud
Cover0033
Holding periodBearish
Candlestick
Patterns
Descriptive
Statistics
Holding
Periods
Average
Holding periodWith RSI
Filter
ID 100068
96
Appendix 7 Descriptive statistics of the eight candle pattern analysis for USDJPY
1 Day 2 Days 3 Days 4 Days 5 Days 7 Days 10 Days 1 Day 2 Days 3 Days 4 Days 5 Days 7 Days 10 DaysAverage 04627 04714 04714 04802 04465 05732 11671 03676 03777 03810 04011 05360 07405 17862
Var 02363 07149 13438 15472 21160 28719 488549 01087 04250 10271 13060 18991 28927 888050
n 155 155 155 155 155 155 155 82 82 82 82 82 82 82
sqrt(varn) 0039 0068 0093 0100 0117 0136 0561 0036 0072 0112 0126 0152 0188 1041
Z score 11851 6941 5063 4806 3822 4211 2079 10095 5246 3404 3178 3522 3942 1716
P-value 000 000 000 000 000 000 002 000 000 000 000 000 000 004
SD 0486 0846 1159 1244 1455 1695 6990 033 065 101 114 138 170 942
Min -0260 -1240 -2580 -3470 -4190 -3010 -3720 -0260 -0750 -2580 -3470 -4190 -3010 -3720
Max 3730 5210 4350 5260 4710 5770 84360 1220 2010 3320 2990 4710 5770 84360
Average 05050 02725 02975 01250 00200 01800 06800
Var 01947 14612 41297 20731 40901 85650 82270
n 4 4 4 4 4 4 4
sqrt(varn) 0221 0604 1016 0720 1011 1463 1434
Z score 2289 0451 0293 0174 0020 0123 0474
P-value 001 033 038 043 049 045 032
SD 044 121 203 144 202 293 287
Min -0040 -1320 -2180 -1620 -2420 -3330 -3290
Max 0950 1280 2570 1850 2520 3300 3100
Average 05516 05495 05417 05094 05444 05442 06372 05869 06464 06567 06036 06421 05719 07360
Var 02540 06708 11223 15253 19160 29185 34308 03170 09840 13320 20250 24616 29482 30796
n 190 190 190 190 190 190 190 75 75 75 75 75 75 75
sqrt(varn) 0037 0059 0077 0090 0100 0124 0134 0065 0115 0133 0164 0181 0198 0203
Z score 15089 9247 7049 5685 5421 4391 4742 9029 5643 4928 3673 3544 2884 3632
P-value 000 000 000 000 000 000 000 000 000 000 000 000 000 000
SD 0504 0819 1059 1235 1384 1708 1852 0563 0992 1154 1423 1569 1717 1755
Min -0130 -1320 -2180 -3600 -4150 -3330 -3760 -0110 -1200 -1470 -3600 -4150 -3300 -3760
Max 2680 4170 4210 4790 5130 5810 6580 2680 4170 4210 4790 4530 5810 4820
Average -00060 00189 01251 01894 01125 01518 02117
Var 04819 08791 15597 20948 21718 28314 38831
n 181 181 181 181 181 181 181
sqrt(varn) 0052 0070 0093 0108 0110 0125 0146
Z score -0117 0271 1348 1761 1027 1213 1445
P-value 045 039 009 004 015 011 007
SD 069 094 125 145 147 168 197
Min -1880 -2970 -2760 -3470 -3690 -3850 -4420
Max 3360 2640 6200 7680 4080 5490 5600
1 Day 2 Days 3 Days 4 Days 5 Days 7 Days 10 Days 1 Day 2 Days 3 Days 4 Days 5 Days 7 Days 10 DaysAverage 04693 04789 04751 04302 03855 -04991 -05064 04929 04990 05166 04418 03647 -00148 00368
Var 01443 05276 10453 13083 19334 620913 638899 01684 06561 12318 14783 25952 33189 48136
n 120 120 120 120 120 120 120 62 62 62 62 62 62 62
sqrt(varn) 0035 0066 0093 0104 0127 0719 0730 0052 0103 0141 0154 0205 0231 0279
Z score 13534 7223 5090 4120 3037 -0694 -0694 9457 4851 3665 2861 1782 -0064 0132
P-value 000 000 000 000 000 024 024 000 000 000 000 004 047 045
SD 0380 0726 1022 1144 1390 7880 7993 041 081 111 122 161 182 219
Min -0160 -1280 -3770 -3800 -7360 -84210 -84210 -0040 -1280 -3770 -3800 -7360 -4810 -4990
Max 1520 2670 2960 2540 3400 3540 7260 1520 2670 2960 2540 3120 3130 4480
Average 0297 0563 -0032 -0018 -0037 -0153 0130
Var 0259 0265 0314 0544 0770 3447 7578
n 4 4 4 4 4 4 4
sqrt(varn) 0254 0257 0280 0369 0439 0928 1376
Z score 117 219 -012 -005 -009 -016 009
P-value 0121 0014 0454 0481 0466 0435 0462
SD 0508 0514 0560 0738 0878 1857 2753
Min -0140 0000 -0680 -0660 -0740 -2390 -3950
Max 0990 1160 0550 0980 1170 1740 1800
Average 00712 -00032 00100 -00100 -00524 -02624 -02920
Var 02879 03971 06164 12216 16133 26647 45166
n 25 25 25 25 25 25 25
sqrt(varn) 0107 0126 0157 0221 0254 0326 0425
Z score 0664 -0025 0064 -0045 -0206 -0804 -0687
P-value 025 049 047 048 042 021 025
SD 0537 0630 0785 1105 1270 1632 2125
Min -1680 -1890 -1980 -3480 -3600 -3740 -4560
Max 1140 1050 1780 2400 2740 2590 3550
Average -00151 -00058 01167 -00253 00518 00553 00973
Var 03934 06098 10455 14099 17290 22702 26855
n 45 45 45 45 45 45 45
sqrt(varn) 0094 0116 0152 0177 0196 0225 0244
Z score -0162 -0050 0765 -0143 0264 0246 0398
P-value 044 048 022 044 040 040 035
SD 0627 0781 1022 1187 1315 1507 1639
Min -2020 -1640 -1840 -3270 -2550 -3270 -3360
Max 1350 1930 2250 2260 2700 3280 3800
At 5 level of significance
Bullish
Engulfing0039
Bullish
Hammer0176 0334
Piercing Lines 0107
Bullish Doji
Star-0077
Holding period
Shooting Star 0554 0635
Bearish
Engulfing0115
Bullish
Candlestick
Descriptive
Statistics
Holding
Periods
Holding period With RSI
Filter
Hanging Man 0582 0656
Dark-Cloud
Cover0297
Holding periodBearish
Candlestick
Patterns
Descriptive
Statistics
Holding
Periods
Average
Holding periodWith RSI
Filter
ID 100068
97
Appendix 8 Descriptive statistics of the eight candle pattern analysis for USDZAR
1 Day 2 Days 3 Days 4 Days 5 Days 7 Days 10 Days 1 Day 2 Days 3 Days 4 Days 5 Days 7 Days 10 DaysAverage 00612 00633 00436 00500 00405 00355 00221 00640 00753 00492 00552 00488 00499 00218
Var 00051 00115 00404 00311 00371 00634 01094 00061 00145 00606 00420 00478 00830 01432
n 123 123 123 123 123 123 123 71 71 71 71 71 71 71
sqrt(varn) 0006 0010 0018 0016 0017 0023 0030 0009 0014 0029 0024 0026 0034 0045
Z score 9486 6547 2408 3143 2333 1564 0742 6891 5276 1682 2272 1879 1459 0486
P-value 000 000 001 000 001 006 023 000 000 005 001 003 007 031
SD 0072 0107 0201 0176 0193 0252 0331 008 012 025 020 022 029 038
Min -0017 -0193 -1491 -0776 -0771 -1411 -1956 -0016 -0193 -1491 -0776 -0771 -1411 -1956
Max 0386 0591 0756 0701 0711 1041 1245 0386 0591 0756 0701 0711 1041 1245
Average -00173 00100 02250 01815 01525 01356 01625
Var 00008 00060 00300 00186 00015 00310 00630
n 2 2 2 2 2 2 2
sqrt(varn) 0020 0055 0123 0097 0027 0124 0178
Z score -0878 0182 1837 1881 5545 1090 0915
P-value 081 043 003 003 000 014 018
SD 003 008 017 014 004 018 025
Min -0037 -0045 0103 0085 0125 0011 -0015
Max 0002 0065 0348 0278 0180 0260 0340
Average 00629 00639 00647 01014 01293 01668 01766 00650 00596 00633 00707 00639 00715 00689
Var 00029 00130 00261 02831 05460 08072 08148 00035 00181 00321 00364 00561 00624 00686
n 282 282 282 282 282 282 282 129 129 129 129 129 129 129
sqrt(varn) 0003 0007 0010 0032 0044 0054 0054 0005 0012 0016 0017 0021 0022 0023
Z score 19658 9415 6726 3200 2939 3118 3286 12478 5039 4010 4212 3064 3252 2987
P-value 000 000 000 000 000 000 000 000 000 000 000 000 000 000
SD 0054 0114 0161 0532 0739 0898 0903 0059 0134 0179 0191 0237 0250 0262
Min -0040 -0290 -0601 -0610 -1325 -1310 -1175 -0040 -0290 -0395 -0610 -1325 -1310 -1175
Max 0363 0930 1380 8521 8523 8531 8531 0363 0930 1380 1285 1390 1480 1033
Average 00006 00056 00022 00018 -00057 -00049 00112
Var 00085 00214 00259 00296 00422 00481 00671
n 129 129 129 129 129 129 129
sqrt(varn) 0008 0013 0014 0015 0018 0019 0023
Z score 0070 0435 0155 0118 -0315 -0255 0489
P-value 047 033 044 045 062 060 031
SD 009 015 016 017 021 022 026
Min -0419 -0541 -0538 -0708 -1298 -1078 -1248
Max 0440 0762 0590 0610 0408 0650 0780
1 Day 2 Days 3 Days 4 Days 5 Days 7 Days 10 Days 1 Day 2 Days 3 Days 4 Days 5 Days 7 Days 10 DaysAverage 00810 00799 00903 00956 01014 00867 00925 00467 00517 00632 00622 00693 00713 00956
Var 00328 00205 00284 00330 00525 00750 00827 00012 00124 00213 00191 00221 00396 00595
n 85 85 85 85 85 85 85 41 41 41 41 41 41 41
sqrt(varn) 0020 0016 0018 0020 0025 0030 0031 0005 0017 0023 0022 0023 0031 0038
Z score 4123 5140 4944 4852 4078 2919 2965 8579 2970 2772 2882 2983 2296 2511
P-value 100 100 100 100 100 100 100 100 100 100 100 100 099 099
SD 0181 0143 0168 0182 0229 0274 0288 003 011 015 014 015 020 024
Min -0025 -0162 -0339 -0222 -0270 -0242 -0361 0000 -0120 -0172 -0222 -0270 -0190 -0301
Max 1590 0875 0870 1030 1510 1920 1120 0153 0590 0683 0510 0520 0670 0640
Average NA NA NA NA NA NA NA
Var NA NA NA NA NA NA NA
n NA NA NA NA NA NA NA
sqrt(varn) NA NA NA NA NA NA NA
Z score NA NA NA NA NA NA NA
P-value NA NA NA NA NA NA NA
SD NA NA NA NA NA NA NA
Min NA NA NA NA NA NA NA
Max NA NA NA NA NA NA NA
Average -00288 -00236 -00082 -00125 -00316 00166 00188
Var 00080 00105 00121 00150 00173 00147 00475
n 17 17 17 17 17 17 17
sqrt(varn) 0022 0025 0027 0030 0032 0029 0053
Z score -1331 -0949 -0307 -0420 -0993 0564 0356
P-value 009 017 038 034 016 029 036
SD 0089 0103 0110 0122 0131 0121 0218
Min -0210 -0230 -0208 -0290 -0243 -0195 -0452
Max 0163 0120 0136 0226 0216 0263 0603
Average -00025 00433 00371 00491 00388 00854 01325
Var 00075 00125 00157 00230 00331 00721 01151
n 26 26 26 26 26 26 26
sqrt(varn) 0017 0022 0025 0030 0036 0053 0067
Z score -0145 1973 1509 1651 1089 1622 1991
P-value 044 098 093 095 086 095 098
SD 0087 0112 0125 0152 0182 0268 0339
Min -0246 -0116 -0120 -0182 -0193 -0243 -0323
Max 0213 0323 0343 0443 0613 0963 1143
At 5 level of significance
Bullish
Engulfing0055
Bullish
Hammer0090 0066
Piercing Lines NA
Bullish Doji
Star-0010
Holding period
Shooting Star 0109 0066
Bearish
Engulfing0002
Bullish
Candlestick
Descriptive
Statistics
Holding
Periods
Holding period With RSI
Filter
Hanging Man 0045 0052
Dark-Cloud
Cover0121
Holding periodBearish
Candlestick
Patterns
Descriptive
Statistics
Holding
Periods
Average
Holding periodWith RSI
Filter