do insurance companies pose systemic risk? j. david cummins, temple university naic winter 2009...
TRANSCRIPT

Do Insurance Companies Pose Systemic Risk?
J. David Cummins, Temple University
NAIC Winter 2009 National Meeting
Perspectives on Systemic RiskDecember 3, 2009
Copyright J. David Cummins, 2009, all rights reserved. Not to be reproduced without author’s permission.

Outline of Presentation
What is Systemic Risk? Too Big To Fail – Not just for financial institutions Insurers: How Big Are They?
Relative to banks Fraction of GDP
Insurers: How Solvent Are They? Insolvency rates Guaranty fund assessments Stock performance
Do flat guaranty fund premia create moral hazard? AIG: What Went Wrong? Does insurance pose a systemic risk?
If so, what are the systemic threats to the industry?

What is Systemic Risk?

What Is Systemic Risk?
The risk that an event will trigger a loss of economic value or confidence in a substantial segment of the financial system serious enough to have significant adverse effects on the real economy. Group of 10 (2001).
Systemic financial risk involves A system-wide financial crisis . . . accompanied by a sharp decline
in asset values and economic activity The spread of instability throughout the financial system (contagion) Sufficient to affect the real economy
World Economic Forum (2008).
Systemic risk is exposure to extreme correlations

Financial Crisis and Systemic Risk
Financial Crisis Prices of risky assets drop sharply Prices of safe assets increase (flight to quality) Asset price volatility increases Liquidity dries up (rising bid-ask spread & price impact) Financial institutions become financially distressed Credit markets dry up, economic activity depressed
Financial systemic risk: Financial crisis in which many institutions become financially distressed, with a potential impact on real economic activity
Financial distress does not mean systemic risk!

All Systemic Financial Crises Involve “Runs”
In crisis, investors seek cash at all costs As prices no longer adjust supply, access to credit
becomes central Maturity mismatch compounds shock and spreads runs
Rapid withdrawals lead to “fire sales,” prices crash Losses induce margin calls, more fire sales
Runs are both cause and consequence of extreme correlation
Crises that do not spread to general credit market do not qualify (e.g., “dot-com” bubble)

“Too Big to Fail” & “Too Interconnected to Fail”
Institutions that pose significant systemic risk are viewed as “Too Big to Fail” -- e.g., failure would cause ripple effects throughout the economy due to the sheer size of the enterprises
“Too Interconnected to Fail” -- Firms with multiple counterparty relationships could trigger a cascading chain of failures – “domino effect”

Too-Big-To-Fail Has Been With Us For a Long Time and Isn’t Confined to Financial Institutions
Industry/Company Year Type of Assistance
Penn Central Railroad 1970 $676.3 million in loan guarantees – Gov’t spent $19.7 billion and got back about $4 billion
Lockheed 1971 Gov’t loan which was paid off
New York City 1975 Loans and loan guarantees
Chrysler 1980 Loan guarantees and warrants – Gov’t earned a profit of about $660 million
Continental Illinois 1984 Government took 80% ownership and phrase TBTF was coined
Airline Industry 2001 Gov’t bought stock below mkt and provided loan guarantees
Automobile industry2008-2009
Govt takes equity stake in GM & Chrysler = $80 billion
Insurers:How Big And How Risky?

Total Assets: US Banks and Insurers
02,0004,0006,0008,000
10,00012,00014,00016,00018,00020,000
Ass
ets
($B
illio
ns)
Banks Life Insurers PC Insurers
Assets: Banks $14 trillion, insurers $5.8 trillion.
Source: Federal Reserve Flow of Funds accounts.

Total US Life and P-C Premiums: % of GDP
7.0%
7.2%
7.4%
7.6%
7.8%
8.0%
8.2%
8.4%
8.6%
8.8%
9.0%
Pre
miu
ms/
GD
P (
%)
Source: A.M. Best Company, American Council of Life Insurance, St. Louis Federal Reserve Bank.
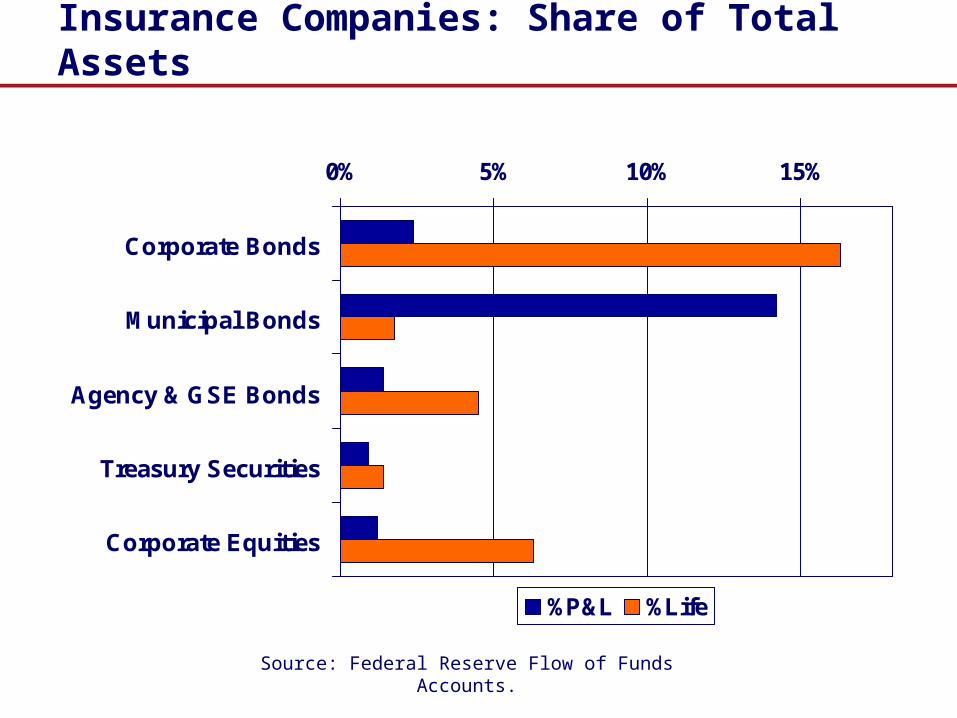
Insurance Companies: Share of Total Assets
0% 5% 10% 15%
Corporate Bonds
Municipal Bonds
Agency & GSE Bonds
Treasury Securities
Corporate Equities
%P&L %Life
Source: Federal Reserve Flow of Funds Accounts.

Equity Capital-to-Assets Ratios
0
0.05
0.1
0.15
0.2
0.25
0.3
0.35
0.4
Banks Life Insurers PC Insurers
Source: Federal Reserve Flow of Funds accounts, American Council of Life Insurance.

Premiums-to-Surplus Ratios: US Insurers
0.5
1
1.5
2
2.5
3
PC Insurers LH Insurers

P/C Insurer Impairments: 1969-2008
815
127
119
349
13 1219
916
14 1336
4931
3450
4855
6058
4129
1612
3118 19
49 5047
3518
14 15
75
0
10
20
30
40
50
60
7069 70 71 72 73 74 75 76 77 78 79 80 81 82 83 84 85 86 87 88 89 90 91 92 93 94 95 96 97 98 99 00 01 02 03 04 05 06 07 08
Nu
mb
er o
f Im
pai
rmen
ts
Source: A.M. Best; Insurance Information Institute
Historically low impairments in 2007-2008.
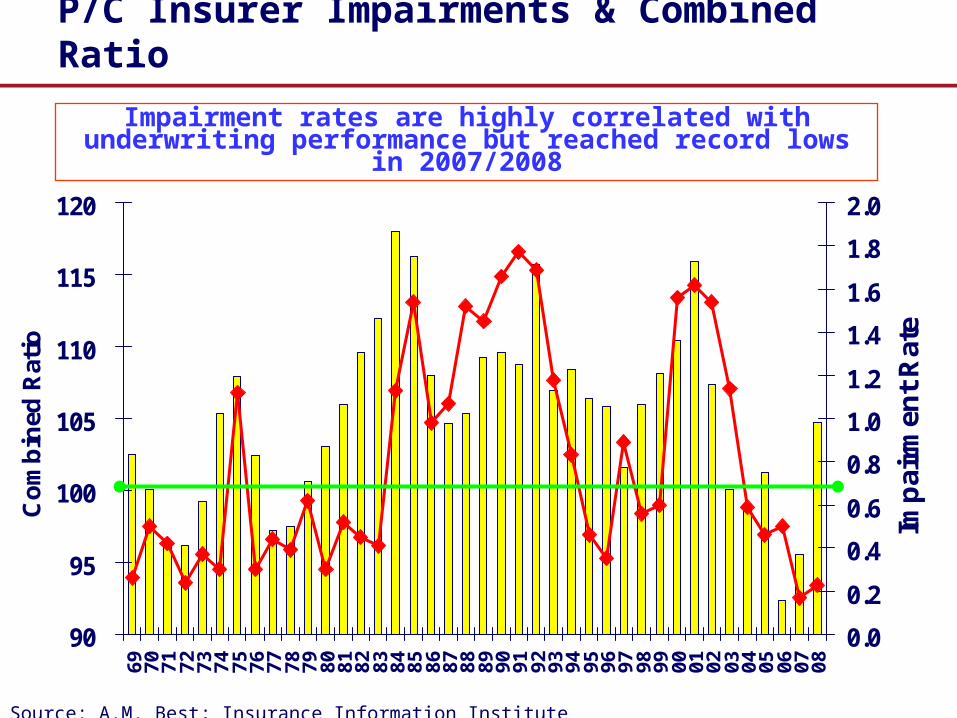
P/C Insurer Impairments & Combined Ratio
90
95
100
105
110
115
120
69 70 71 72 73 74 75 76 77 78 79 80 81 82 83 84 85 86 87 88 89 90 91 92 93 94 95 96 97 98 99 00 01 02 03 04 05 06 07 08
Co
mb
ined
Rat
io
0.0
0.2
0.4
0.6
0.8
1.0
1.2
1.4
1.6
1.8
2.0
Imp
airm
ent
Rat
e
Impairment rates are highly correlated with underwriting performance but reached record lows in 2007/2008
Source: A.M. Best; Insurance Information Institute

P/C Impairment: Triggering Events
Source: A.M. Best: 1969-2008 Impairment Review, Special Report, Apr. 6, 2009.
Deficient loss reserves,
inadequate pricing, and rapid growth
are the leading triggers. Investment
& catastrophe losses play a much
smaller role.
Reinsurance Failure3.7%
Rapid Growth14.3%
Misc.9.1%
Affiliate Impairment
7.9%
Sig. Change in Business
4.2%
Deficient Loss
Reserves/In-adequate Pricing38.1%
Investment Problems
7.0%
Alleged Fraud8.1%
Catastrophe Losses7.6%
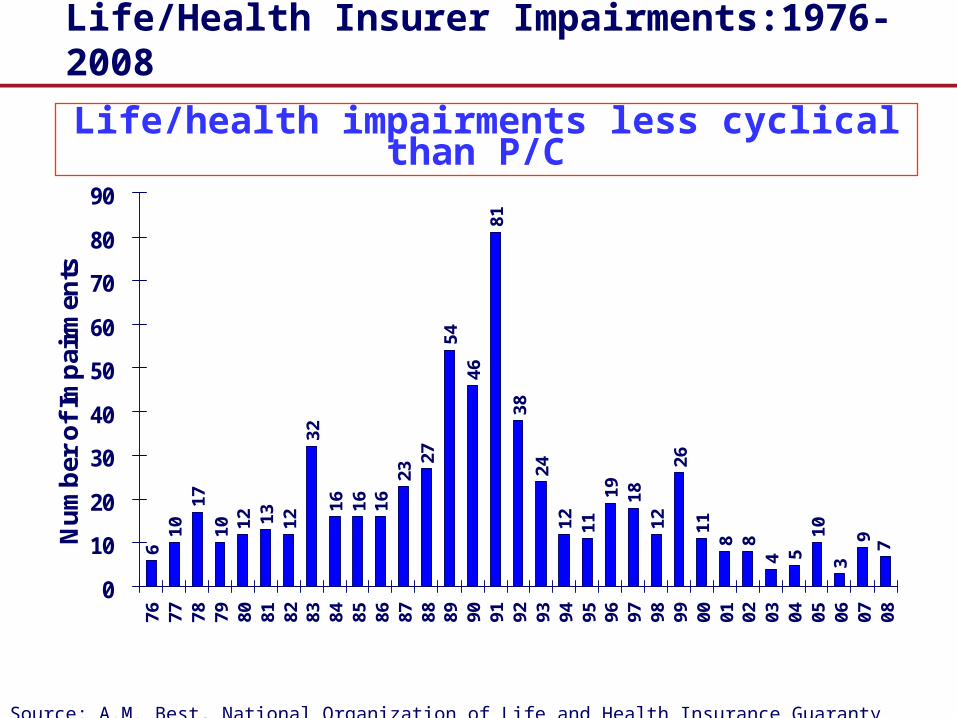
Life/Health Insurer Impairments:1976-2008
610
1710 12 13 12
3216 16 16
2327
5446
8138
2412 11
19 1812
2611
8 84 5
103
9 7
0
10
20
30
40
50
60
70
80
90
76 77 78 79 80 81 82 83 84 85 86 87 88 89 90 91 92 93 94 95 96 97 98 99 00 01 02 03 04 05 06 07 08
Nu
mb
er o
f Im
pai
rmen
ts
Life/health impairments less cyclical than P/C
Source: A.M. Best, National Organization of Life and Health Insurance Guaranty Associations.

L-H Impairment Frequency & Profits
0
0.5
1
1.5
2
2.5
3
3.5
Fai
lure
Fre
qu
ency
-1
0
1
2
3
4
5
Aft
er-t
ax P
rofi
t M
arg
in (
%)
Source: A.M. Best.
L-H: Less obvious relationship with profits than P-L

L-H Impairments: Triggering Events
Source: A.M. Best: 2009 U.S. Life/Health – 1976-2008 Impairment Review, Special Report, May 25, 2009.
Inadequate pricing, affiliate problems, rapid
growth, and investments are
primary causes of L/H insolvencies.
Affiliate Problems
19.3%
Sig. Change in Business
4.6%
Misc8.6%
Reins Failure2.0%
Inadequate Pricing27.7%Alleged Fraud
8.6%
Rapid Growth14.7%
Investment Problems
14.5%
Life insurers more susceptible to affiliate problems.

Property-Casualty InsurerGuaranty Fund Assessments: 1978-2007
0
200
400
600
800
1000
1200
1400
Ass
essm
ents
($M
illio
ns)
0.00%
0.05%
0.10%
0.15%
0.20%
0.25%
0.30%
0.35%
0.40%
0.45%
0.50%
Ass
essm
ents
: % o
f Pre
miu
ms
GF Assessments % of NPW
Source: A.M. Best Company, National Conference of Insurance Guaranty Funds.

Life-Health Insurer Guaranty Fund Assessments: 1988-2007
0
100
200
300
400
500
600
700
800
900
1000
As
se
ss
me
nts
($
Mill
ion
s)
0.00%
0.05%
0.10%
0.15%
0.20%
0.25%
0.30%
0.35%
0.40%
As
se
ss
me
nts
: %
of
Pre
miu
ms
Assessments % of Premiums
Source: A.M. Best, National Organization of Life and Health Insurance Guaranty Associations.

US Life Insurers: 12 Month Change in Premiums (as of June 30, 2009)
Met
Pru
AIG
Har
tford
Man
ulife
TIAA
NY Life
Aeg
on U
SA
ING
USA
NW
Mut
ual
Linc
oln
Fin
Axa
US
-60
-50
-40
-30
-20
-10
0
10
20
30
40
% C
hang
e
Source: A.M. Best Company.

US Insurance Stock Indices vs. S&P 500
200
400
600
800
1000
1200
1400
1600
1800
Ind
ex 1
2/31
/04
= 1
000
P-C Life S&P 500
PC insurers beat the S&P, life insurers do not.
Source: A.M. Best Company.

Insurer Solvency: Conclusions
Insurers have about $6 trillion in assets but are not especially large relative to overall economy (8% of total U.S. financial assets)
US regulated insurance companies highly solvent Insolvency rates are low Guaranty fund costs are low
Life insurers give cause for concern May be over-leveraged Recent adverse performance is danger signal More interconnected than PC insurers (susceptibility to affiliates)
Inter-connectedness does not pose serious solvency threat for PC insurers based on past experience
Monolines are a different story – but not traditional insurance

Do Guaranty Funds Create Moral Hazard?
In theory, mis-priced guaranty fund coverage provides incentives for excessive risk-taking
In practice, guaranty funds do not seem to be a problem So-far, at least, there is no solvency crisis for US
regulated insurance companies Guaranty fund assessments have been very low
Possible rationale: Risk-based capital (introduced in 1994) blunts insurer
incentives for excessive risk-taking GF protection is incomplete (low maximums, etc.)

AIG: What Went Wrong?

AIG: What Went Wrong?
AIG’s traditional insurance operations did not cause its meltdown
AIG’s problems came from: Credit default swaps out of AIG Financial Products
● (Supposedly) regulated by Office of Thrift Supervision● US regulators had no jurisdiction
Securities lending program of life insurance subsidiaries
● Indicates need for more regulatory scrutiny in the future● US regulators do have jurisdiction if lending is out of regulated
life insurance subsidiaries

AIG Revenues Before the Crash
Foreign Life & Retirement
28%
Asset Management
5%
Foreign P&C11%
US P&C32%
Financial Services (AIGFP)
9%
US Life&Retirem
ent15%
12 months ending 12/31/2006.

AIG’s Credit Default Swaps
AIG sold CDS contracts, mostly to European banks
Banks were using the swaps to reduce regulatory capital, relying on AIGs overall credit rating (regulatory arbitrage)
AIG Financial Products had about $500 billion in CDS outstanding but virtually no capital AIG’s models supposedly showed that losses on the
CDS portfolio were virtually impossible Watch out for model risk and managerial moral hazard
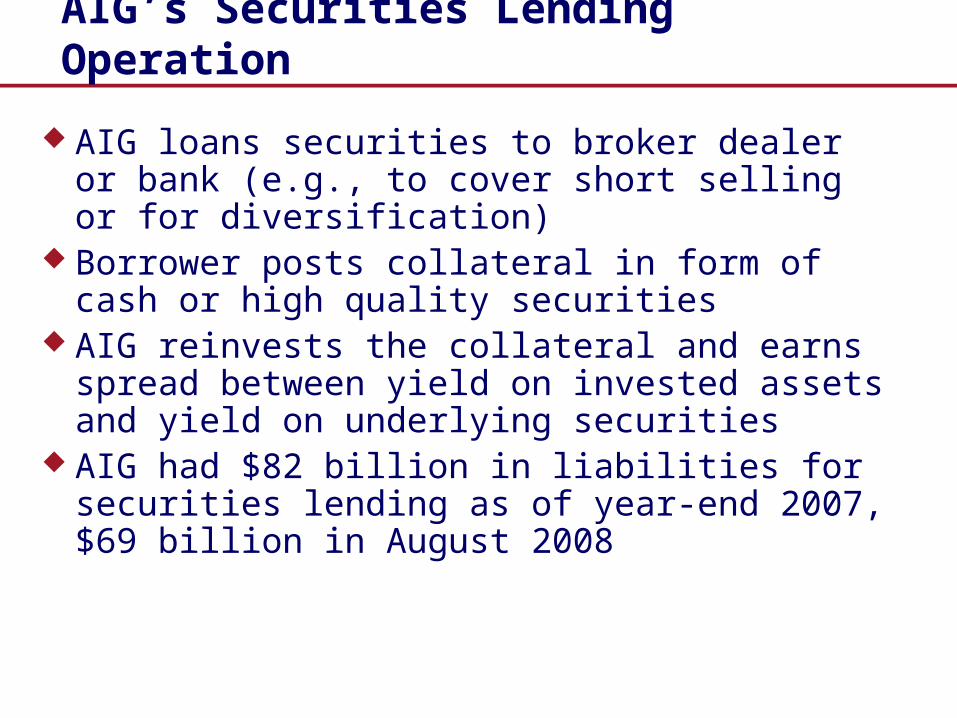
AIG’s Securities Lending Operation
AIG loans securities to broker dealer or bank (e.g., to cover short selling or for diversification)
Borrower posts collateral in form of cash or high quality securities
AIG reinvests the collateral and earns spread between yield on invested assets and yield on underlying securities
AIG had $82 billion in liabilities for securities lending as of year-end 2007, $69 billion in August 2008

AIG Securities Lending: What Went Wrong
Declines in value of mortgages and other assets in 2007-2008 reduced value of reinvested collateral in securities lending programs
Many of the counterparties in the securities lending operation were the same institutions holding AIG credit default swaps
As asset values declined, borrowers terminated the securities lending arrangement to Improve liquidity Reduce exposure to AIG’s credit risk
At the same time, AIG had to post additional collateral for the CDS transactions as underlying “insured” asset values declined

The Bailout: Payments to AIG Counterparties
Counterparty CDS Trans. Asset Lending Total
Goldman Sachs 8.10 4.80 12.90
Societe Gen. 11.00 0.90 11.90
Deutsche Bank 5.40 6.40 11.80
Barclays 1.50 7.00 8.50
Merrill Lynch 4.90 1.90 6.80
Bank of Amer 0.70 4.50 5.20
UBS 3.30 1.70 5.00
BNP Paribus 0 4.90 4.90
Others 14.70 11.60 26.30
Total 49.60 43.70 93.30

US Insurer Assessments vs. AIG
Total US life and P-C assessments: 1988-2007 $18 billion
Federal assistance to AIG (as of June 30, 2009): $136 billion Not necessarily a net loss But . . . .
Total assets of largest insurers: 2008 Met Life: $422.6 billion State Farm: $116.5 billion
Source: A.M. Best Company, Harrington (2009).
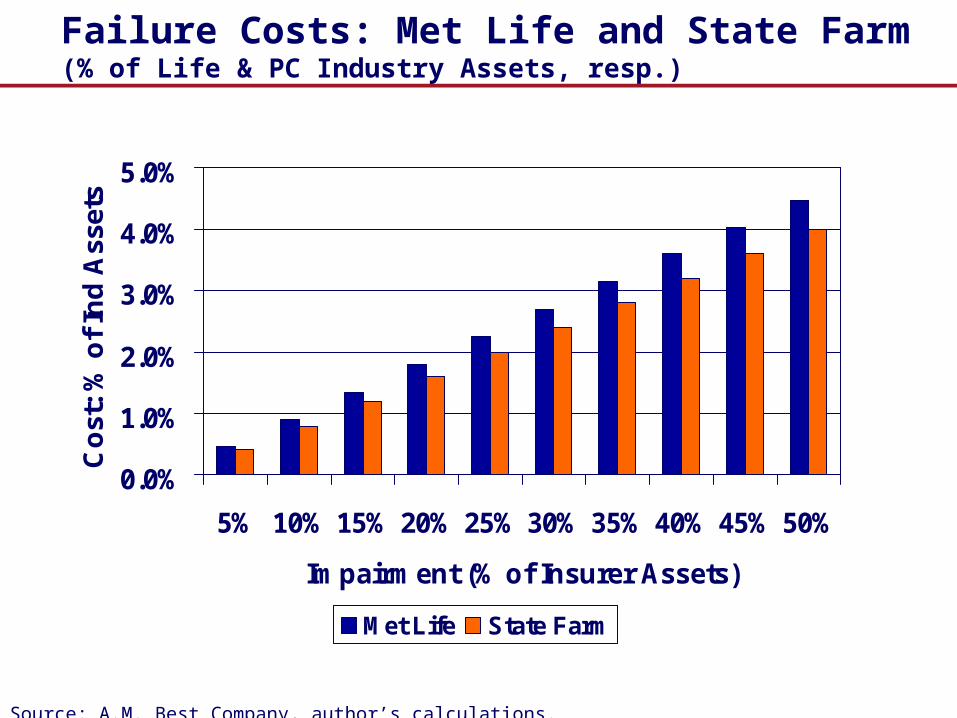
Failure Costs: Met Life and State Farm(% of Life & PC Industry Assets, resp.)
0.0%
1.0%
2.0%
3.0%
4.0%
5.0%
5% 10% 15% 20% 25% 30% 35% 40% 45% 50%
Impairment (% of Insurer Assets)
Co
st:
% o
f In
d A
sset
s
Met Life State Farm
Source: A.M. Best Company, author’s calculations.

Does Insurance Pose Systemic Risk?

What Is Systemic Risk Policy Trying to Prevent?
Runs on banks – traditional concern Contagion – information asymmetries
Banking system collapse – Continental bank
● Correspondent bank collapse – counterparties● Jobs would be lost
Threat to settlement system and network effects Fear that Infrastructure of short term money market and OTC derivatives would
not handle failure of significant counterparty and might cast doubts on the soundness of other counter parties (Bernanke on Bear Stearns)
Panic due to loss of confidence Risks to system due to failure of “highly interconnected” firm “Unpredictable consequences of a failure for broader financial system” Reaction of counterparties of other firms that might come under future
government control AIG was large, complex and interconnected whose failure would impose losses on
counterparties and also endanger the entire world’s financial sector (Bernanke-Morehouse University)

Property-Casualty Insurance Does Not Create Systemic Risk
“Runs” are not possible To obtain funds, it is necessary to have a claim Unlike bank deposits, which are instanteously “putable”
Inter-sector exposure among insurers and between insurers and reinsurers not sufficiently large to cause cascading failures (e.g., reinsurance failures and affiliate problems account for about 11% of P-C failures but 20% in L-H insurance)
Insurance not involved in liquidity creation, payments system or business/consumer lending
Insurers hold only small proportion of total invested assets in the economy
Insurance claim payments not a major financial asset for any economic sector

Does Life Insurance Pose Systemic Risk?
Why LI may be systemically risky Life insurance investment products are susceptible to
“runs” (withdrawals and/or suspension of premium payments/annuity considerations)
Life insurers are thinly capitalized Insurance guaranty fund system probably not adequate
for a major run or liquidity crisis Life insurers owned by banks (and vice versa) could
add to fragility of banking system
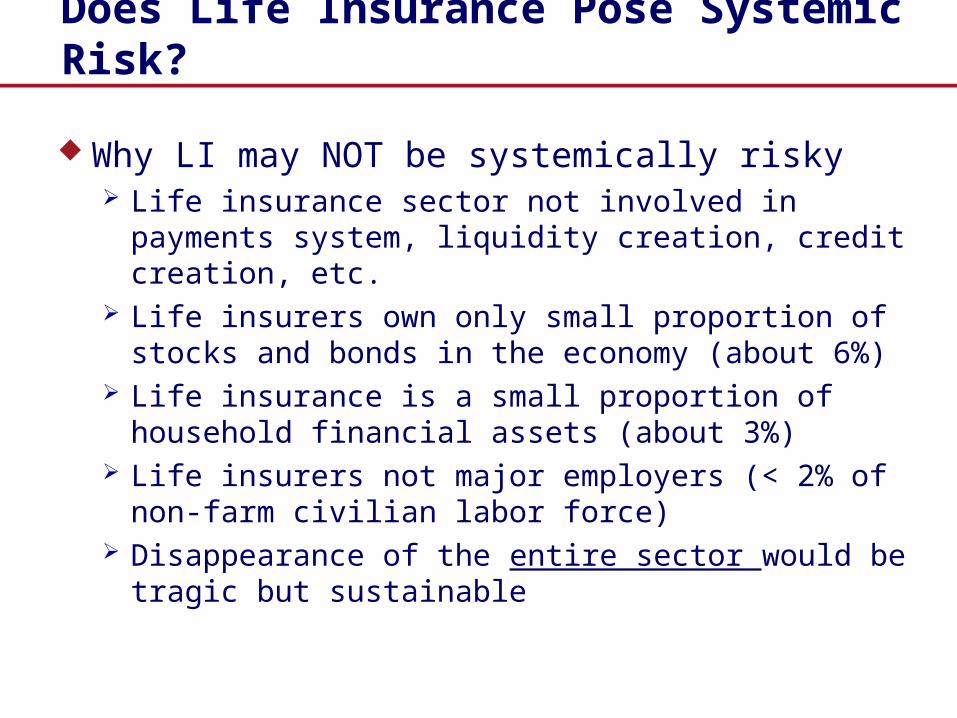
Does Life Insurance Pose Systemic Risk?
Why LI may NOT be systemically risky Life insurance sector not involved in payments system,
liquidity creation, credit creation, etc. Life insurers own only small proportion of stocks and
bonds in the economy (about 6%) Life insurance is a small proportion of household
financial assets (about 3%) Life insurers not major employers (< 2% of non-farm
civilian labor force) Disappearance of the entire sector would be tragic but
sustainable

Systemic Risk In Insurance: Banking Activities
As AIG debacle shows, the main systemic risk posed by the insurance industry comes from insurer participation in “banking” activities, e.g., credit default swaps (CDS) and other derivatives
Swiss Re data shows that insurers and reinsurers accounted for 33% of CDS market in early 2000s
As with AIG, most insurers are not adequately capitalized to sustain large CDS meltdown
Insurance groups should not be permitted to conduct CDS operations

Systemic Risk and OTC Derivatives
“Too big to fail” partly based on counterparty risk Reduce counterparty risk by moving popular products to
centralized clearing – e.g., credit default swaps Reduce remaining counterparty risk by trade
transparency Liquidity also improved by enhanced transparency
Require CDS writers to hold adequate capital Derivatives trading poses significant “model risk,” i.e.,
impossible to foresee all possible eventualities that could cause major losses.
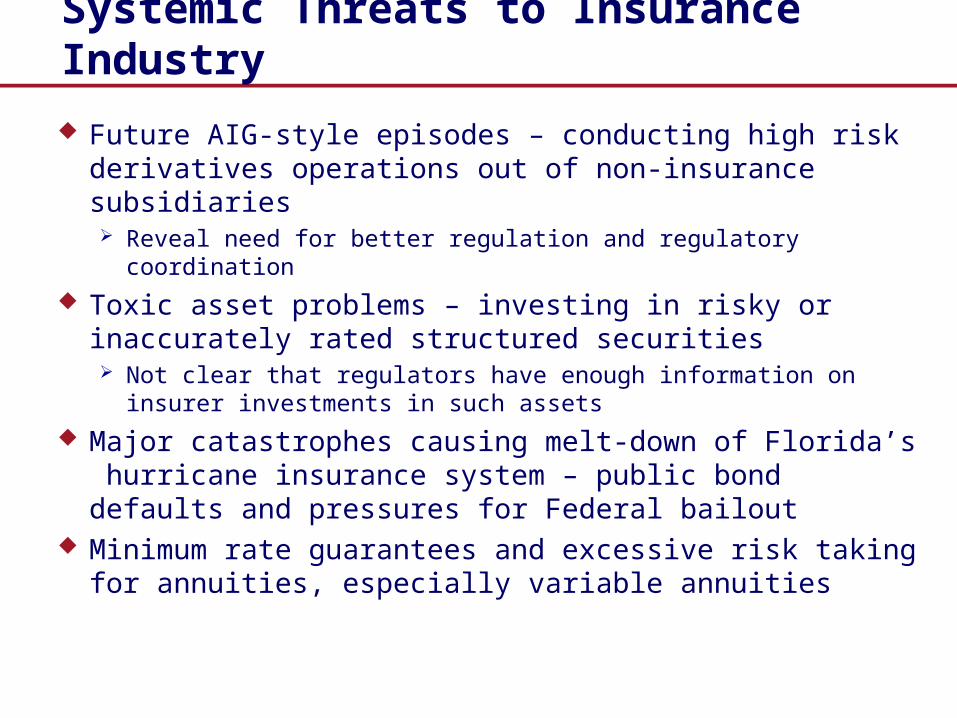
Systemic Threats to Insurance Industry
Future AIG-style episodes – conducting high risk derivatives operations out of non-insurance subsidiaries Reveal need for better regulation and regulatory coordination
Toxic asset problems – investing in risky or inaccurately rated structured securities Not clear that regulators have enough information on insurer
investments in such assets
Major catastrophes causing melt-down of Florida’s hurricane insurance system – public bond defaults and pressures for Federal bailout
Minimum rate guarantees and excessive risk taking for annuities, especially variable annuities

Systemic Risk: Lessons
At the national level, the financial crisis exposed the limits of supervision that is geared only to local entities and neglects the systemic implications of financial institutions with global reach
There can be little doubt that global governance and the institutions charged to develop the frameworks and carry out such governance should be strengthened (World Economic Forum 2009)

Further Information
American International Group, 2009, AIG: Is the Risk Systemic? Powerpoint presentation (New York).
De Bandt, Olivier and Philipp Hartmann, 2000, Systemic Risk: A Survey (Frankfurt, Germany: European Central Bank).
Group of 10, 2001, Report on Consolidation in the Financial Sector Harrington, Scott E., 2009, The Financial Crisis, Systemic Risk, and the Future of Insurance
Regulation (Indianapolis, IN: National Association of Mutual Insurance Companies). Kaufman, George G., 1996, “Bank Failures, Systemic Risk, and Bank Regulation,” The CATO
Journal 16: 17-45. Kaufman, George G., 2000, “Banking and Currency Crises and Systemic Risk: Lessons from
Recent Events,” Federal Reserve Bank of Chicago Economic Perspectives 24: 9-28. Swiss Re, 2003, Reinsurance – A Systemic Risk, Sigma No. 5/2003 (Zurich, Switzerland). World Economic Forum, 2009, Global Risks 2009 (Geneva, Switzerland).