do higher tariffs reduce import prices? evidence from the … · •paraguay and algeria have more...
TRANSCRIPT
Tariff Incidence:
Evidence from U.S. Sugar Duties, 1890-1930
Douglas Irwin
Dartmouth College & NBER

Who bears the burden of import tariffs?
• Charles Bickerdike, EJ (1906)
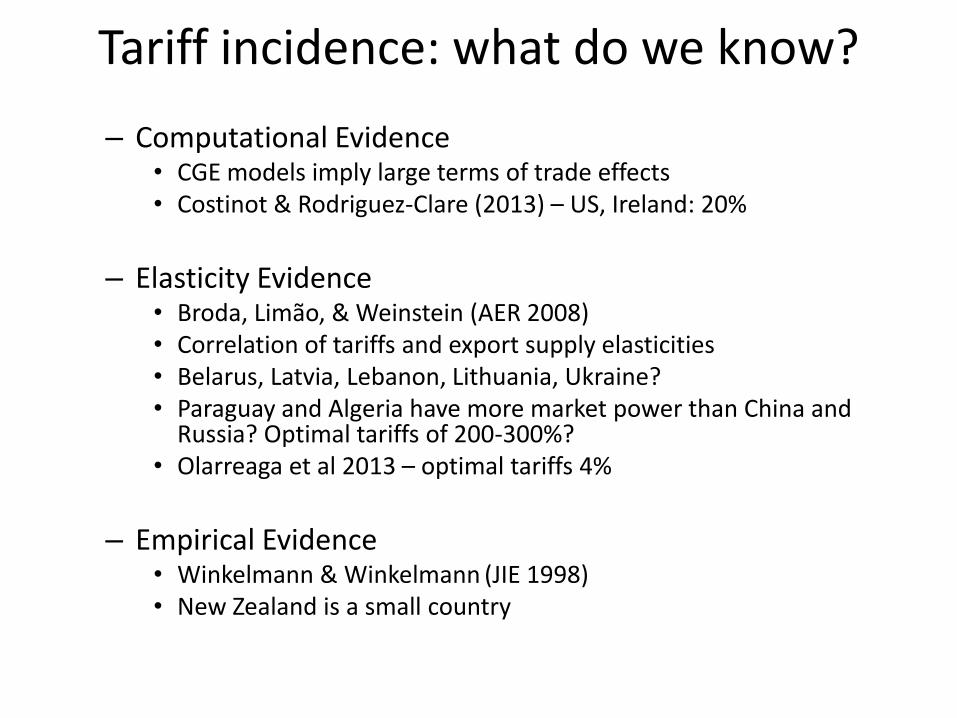
Tariff incidence: what do we know?
– Computational Evidence• CGE models imply large terms of trade effects• Costinot & Rodriguez-Clare (2013) – US, Ireland: 20%
– Elasticity Evidence• Broda, Limão, & Weinstein (AER 2008)• Correlation of tariffs and export supply elasticities• Belarus, Latvia, Lebanon, Lithuania, Ukraine?• Paraguay and Algeria have more market power than China and
Russia? Optimal tariffs of 200-300%?• Olarreaga et al 2013 – optimal tariffs 4%
– Empirical Evidence• Winkelmann & Winkelmann (JIE 1998)• New Zealand is a small country
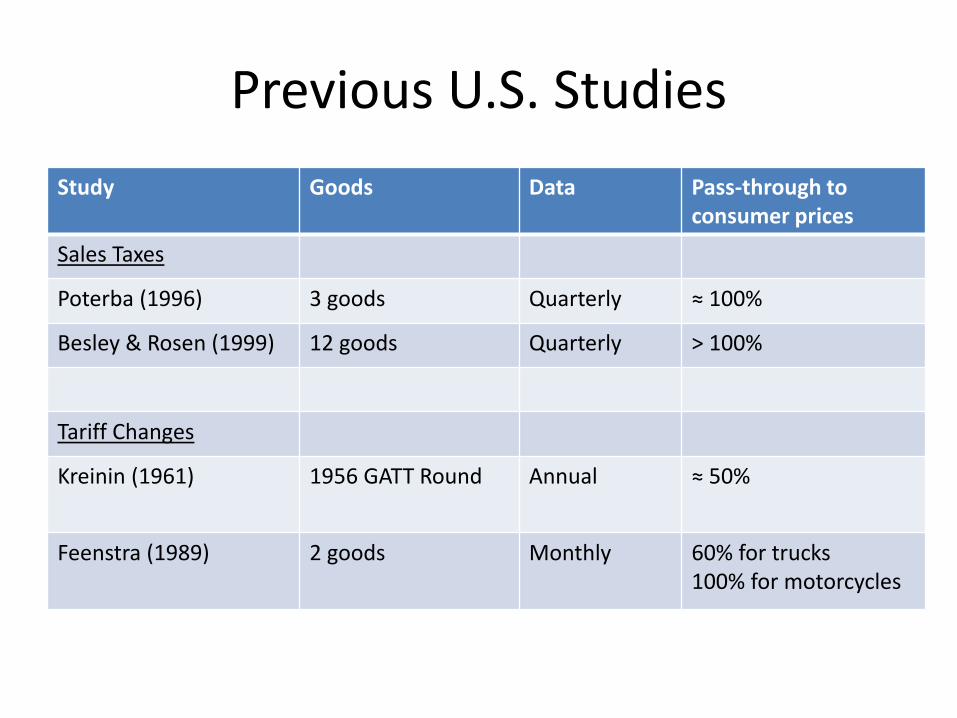
Previous U.S. Studies
Study Goods Data Pass-through to consumer prices
Sales Taxes
Poterba (1996) 3 goods Quarterly ≈ 100%
Besley & Rosen (1999) 12 goods Quarterly > 100%
Tariff Changes
Kreinin (1961) 1956 GATT Round Annual ≈ 50%
Feenstra (1989) 2 goods Monthly 60% for trucks100% for motorcycles

Why pre-1930?
• Unilateral tariff changes (no bargaining)
• Large tariff changes (up & down)
• No exchange rate variation (gold standard)
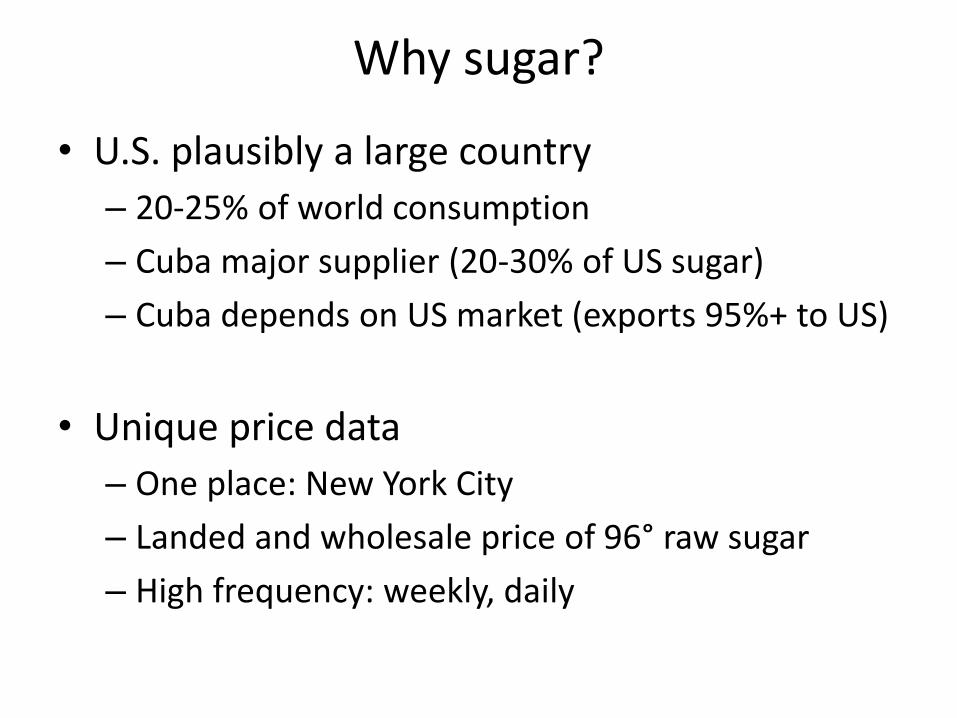
Why sugar?
• U.S. plausibly a large country
– 20-25% of world consumption
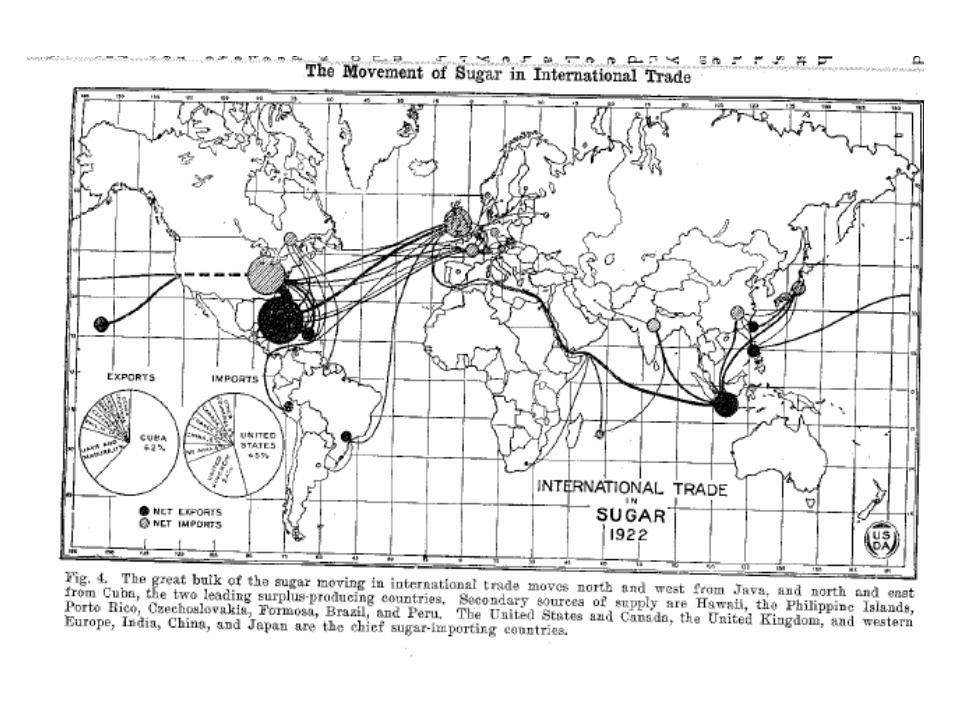
– Cuba major supplier (20-30% of US sugar)
– Cuba depends on US market (exports 95%+ to US)
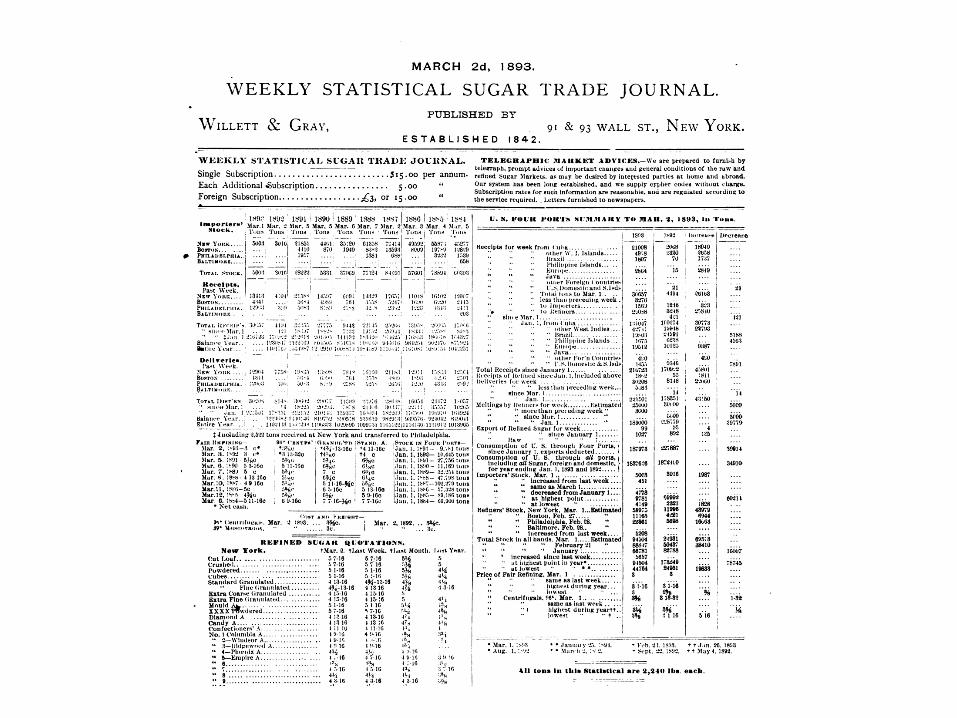
• Unique price data
– One place: New York City
– Landed and wholesale price of 96° raw sugar
– High frequency: weekly, daily
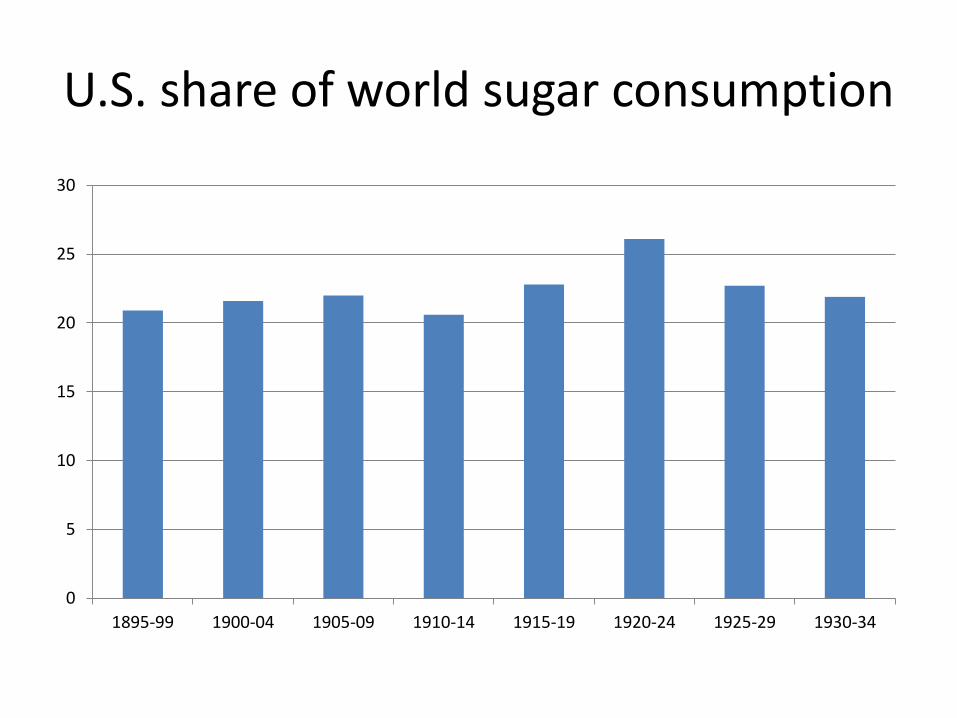
U.S. share of world sugar consumption
0
5
10
15
20
25
30
1895-99 1900-04 1905-09 1910-14 1915-19 1920-24 1925-29 1930-34
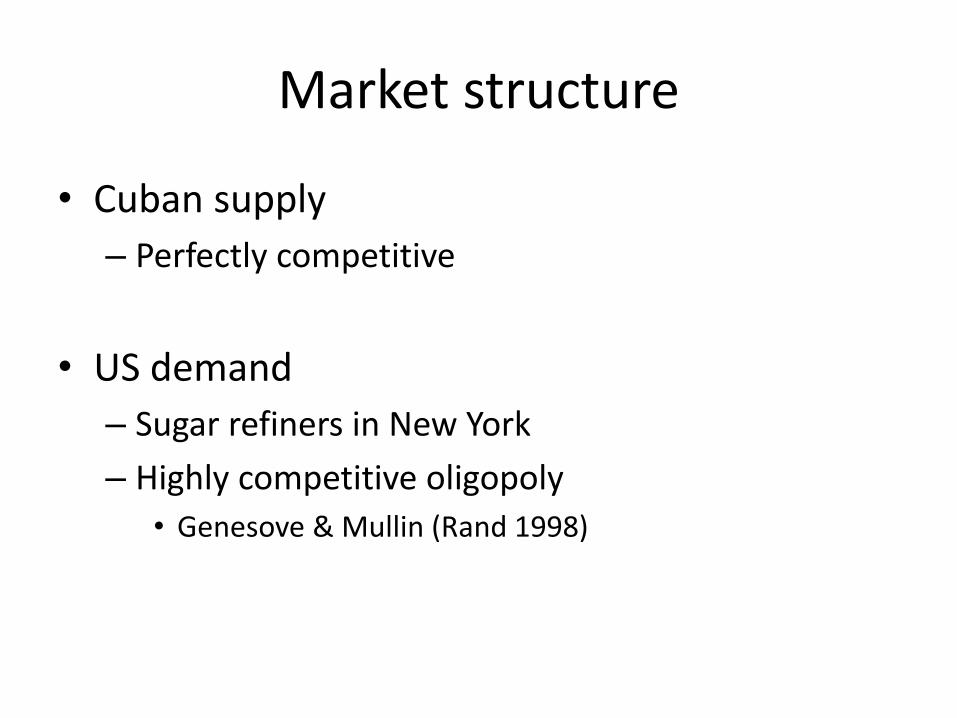
Market structure
• Cuban supply
– Perfectly competitive
• US demand
– Sugar refiners in New York
– Highly competitive oligopoly
• Genesove & Mullin (Rand 1998)
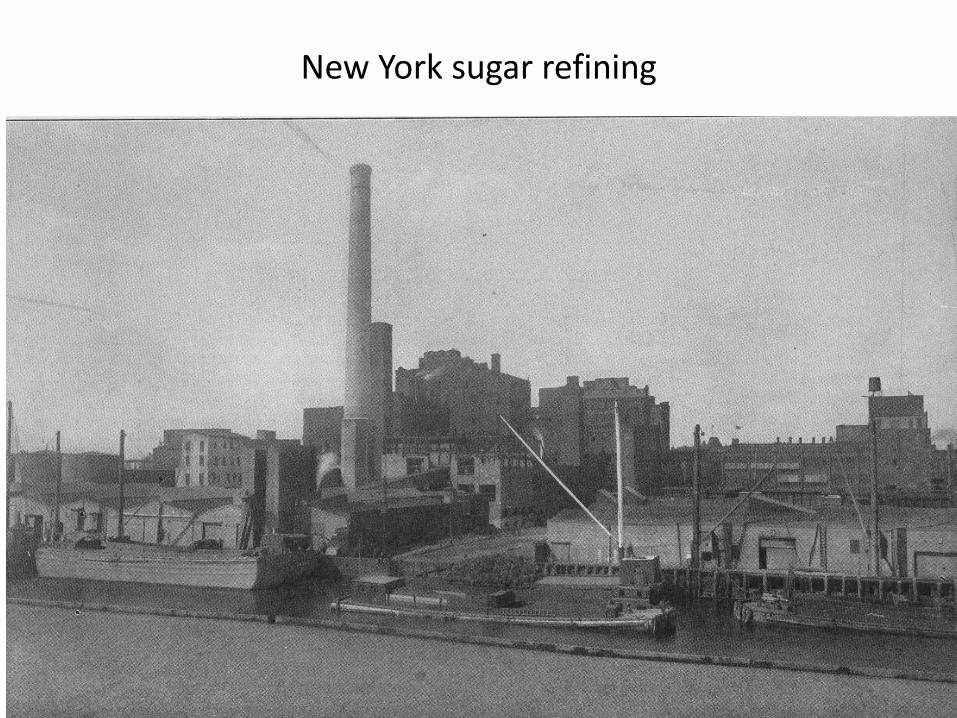
New York sugar refining

Ad valorem tariff on raw sugar
0
20
40
60
80
100
120
1890 1895 1900 1905 1910
ad v
alo
rem
rate

Weekly sugar prices
1
2
3
4
5
6
7
1890 1895 1900 1905 1910
Cuba New York
cent
s pe
r po
und
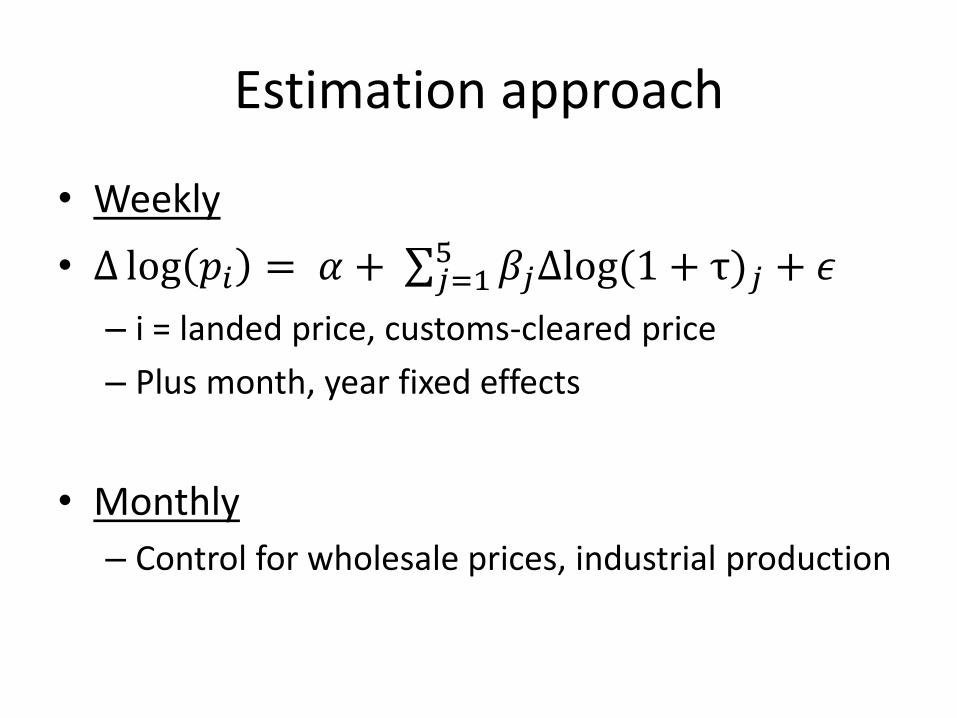
Estimation approach
• Weekly
• ∆ log 𝑝𝑖 = 𝛼 + 𝑗=15 𝛽𝑗∆log(1 + τ)𝑗 + 𝜖
– i = landed price, customs-cleared price
– Plus month, year fixed effects
• Monthly
– Control for wholesale prices, industrial production

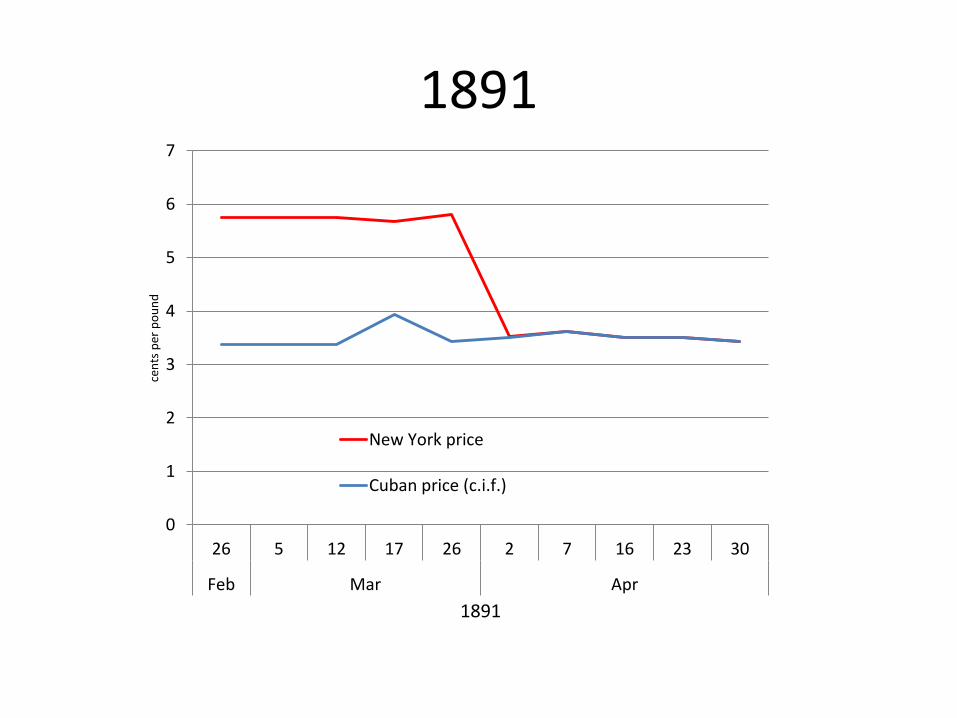
1891
0
1
2
3
4
5
6
7
26 5 12 17 26 2 7 16 23 30
Feb Mar Apr
cen
ts p
er p
ou
nd
1891
New York price
Cuban price (c.i.f.)
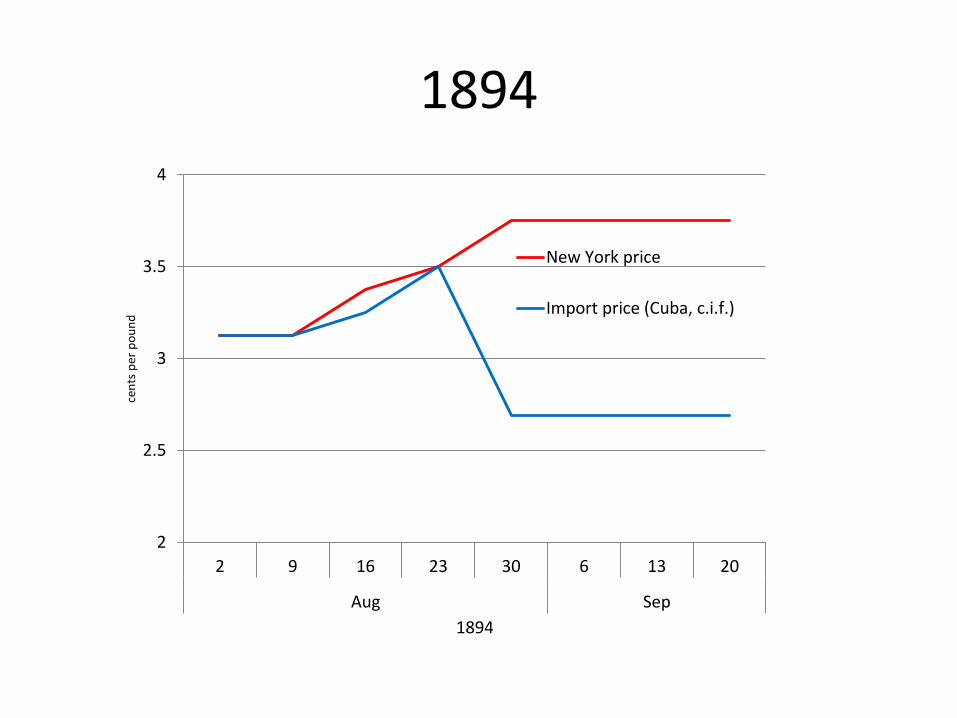
1894
2
2.5
3
3.5
4
2 9 16 23 30 6 13 20
Aug Sep
cen
ts p
er p
ou
nd
1894
New York price
Import price (Cuba, c.i.f.)
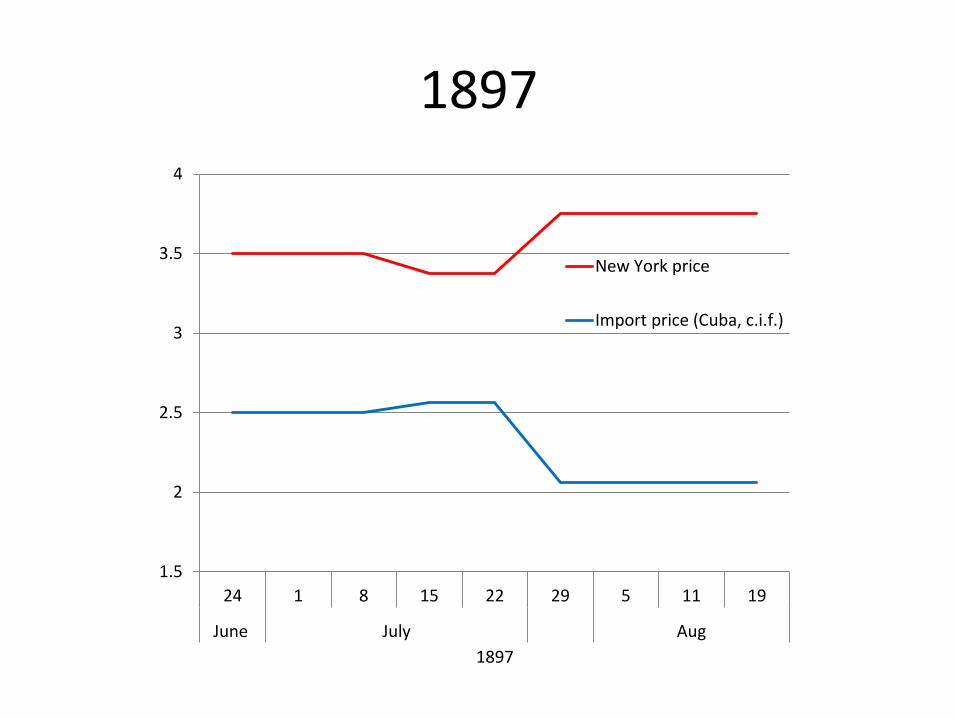
1897
1.5
2
2.5
3
3.5
4
24 1 8 15 22 29 5 11 19
June July Aug
1897
New York price
Import price (Cuba, c.i.f.)

1903
0
0.5
1
1.5
2
2.5
3
3.5
4
3 10 17 24 31 7 14 21 28
Dec-03 Jan-04
New York price
Import price (Cuba c.i.f.)

1914
1.5
2
2.5
3
3.5
29 5 11 19 26 5 12 19 26 2
Jan Feb Mar Apr
1914
New York price
Import price (Cuba, c.i.f.)
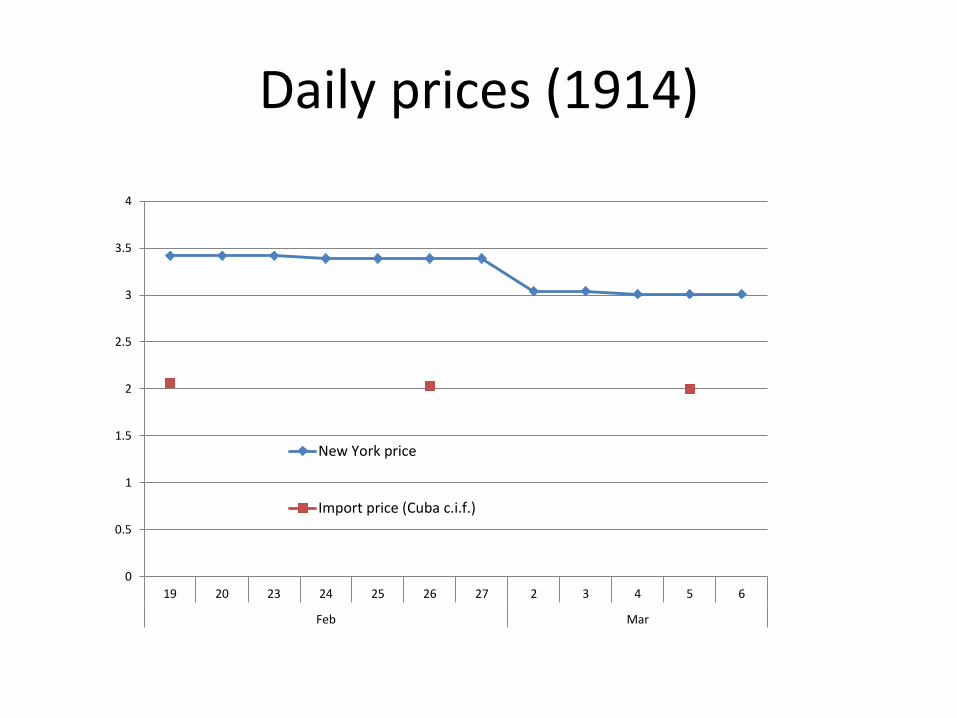
Daily prices (1914)
0
0.5
1
1.5
2
2.5
3
3.5
4
19 20 23 24 25 26 27 2 3 4 5 6
Feb Mar
New York price
Import price (Cuba c.i.f.)
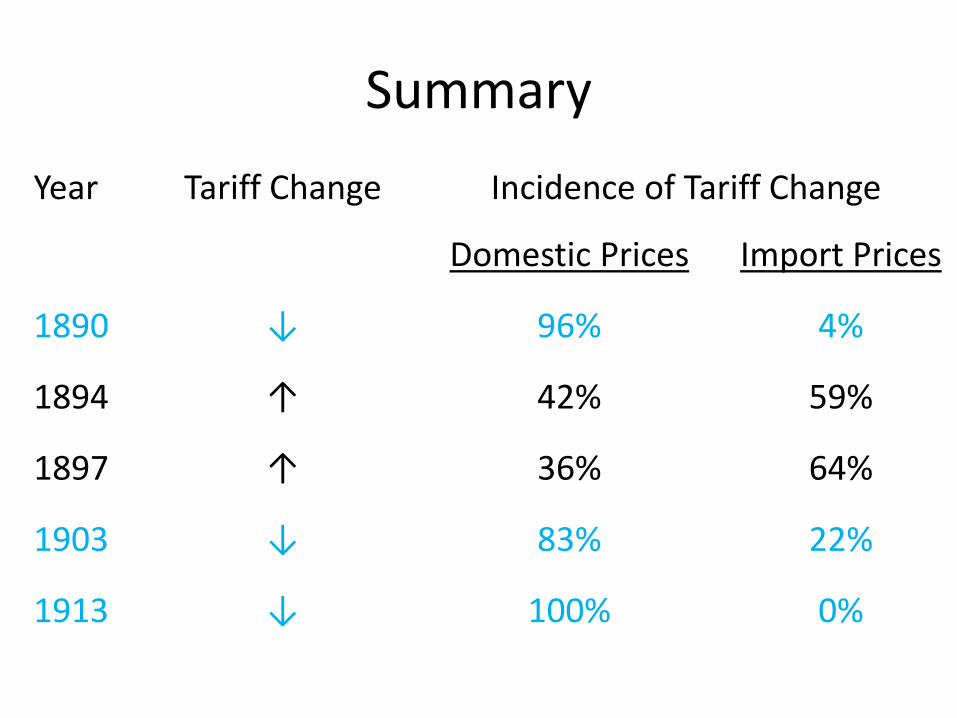
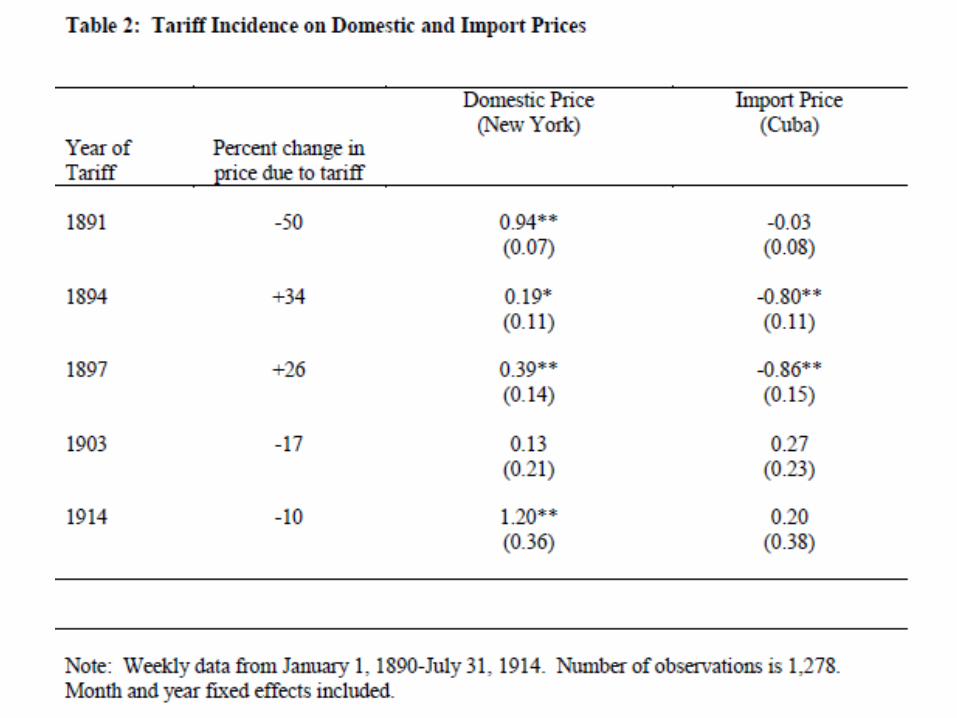
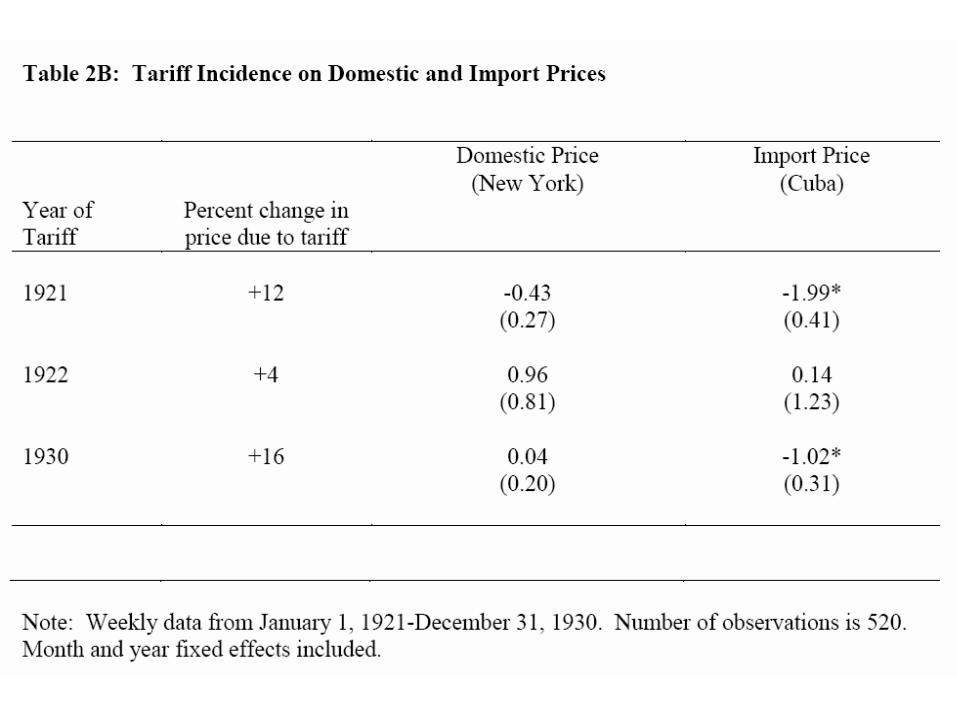
Summary
Year Tariff Change Incidence of Tariff Change
Domestic Prices Import Prices
1890 ↓ 96% 4%
1894 ↑ 42% 59%
1897 ↑ 36% 64%
1903 ↓ 83% 22%
1913 ↓ 100% 0%
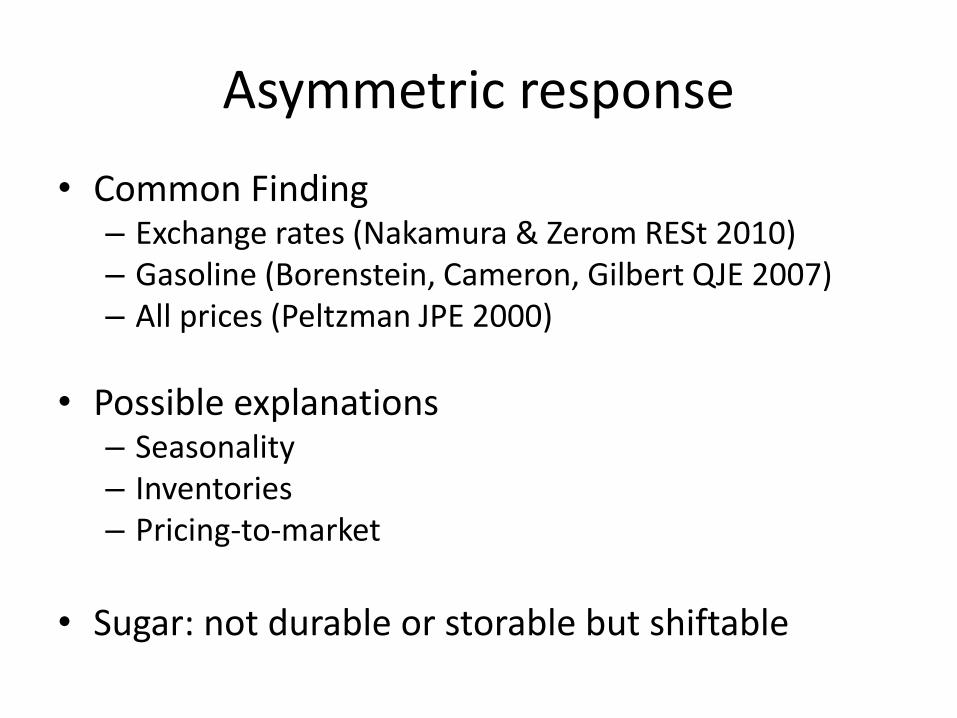
Asymmetric response
• Common Finding– Exchange rates (Nakamura & Zerom RESt 2010)– Gasoline (Borenstein, Cameron, Gilbert QJE 2007)– All prices (Peltzman JPE 2000)
• Possible explanations– Seasonality– Inventories– Pricing-to-market
• Sugar: not durable or storable but shiftable
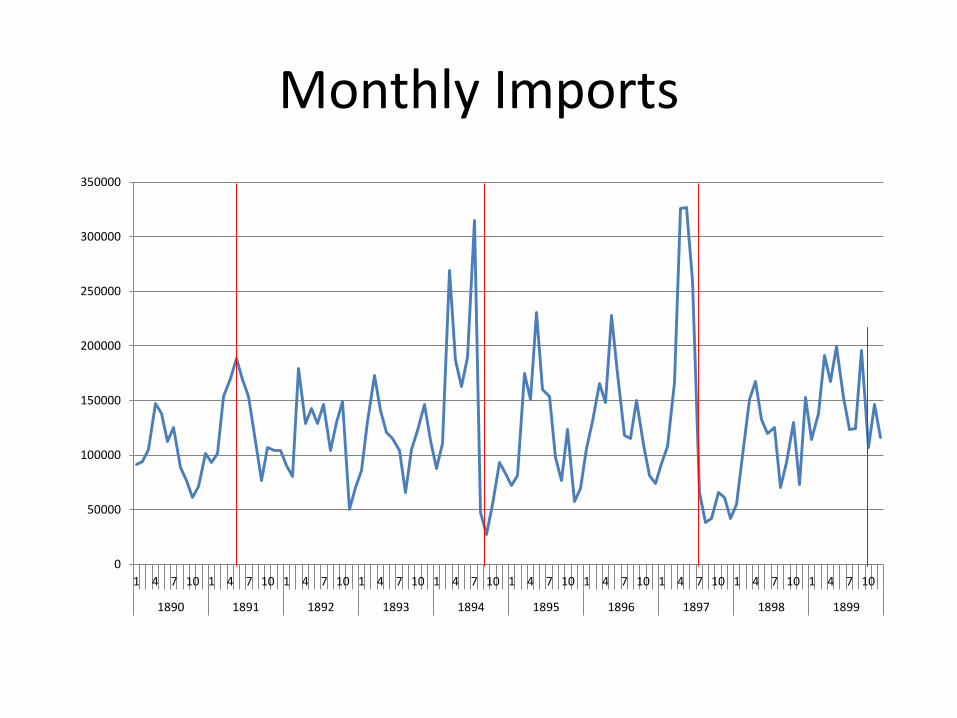
Monthly Imports
0
50000
100000
150000
200000
250000
300000
350000
1 4 7 10 1 4 7 10 1 4 7 10 1 4 7 10 1 4 7 10 1 4 7 10 1 4 7 10 1 4 7 10 1 4 7 10 1 4 7 10
1890 1891 1892 1893 1894 1895 1896 1897 1898 1899
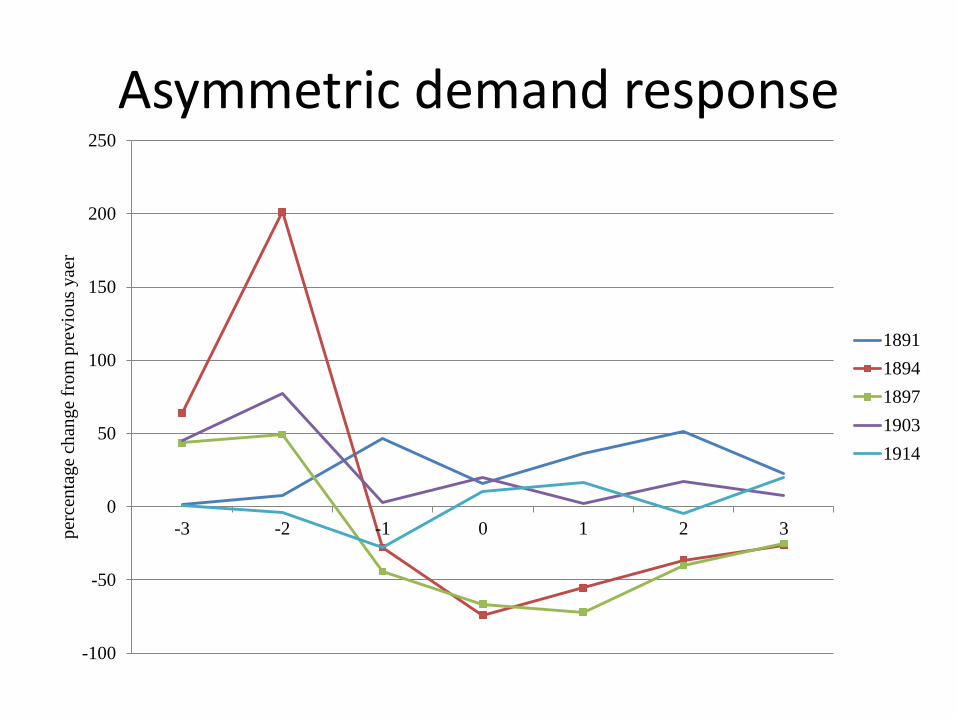
Asymmetric demand response
-100
-50
0
50
100
150
200
250
-3 -2 -1 0 1 2 3per
cen
tage
chan
ge
fro
m p
rev
ious
yae
r
1891
1894
1897
1903
1914
Check using monthly data
• Unit values (only import price)
• Higher level of aggregation
• Tariff reduction – consistent with no impact
• Tariff increase – unclear, less precision
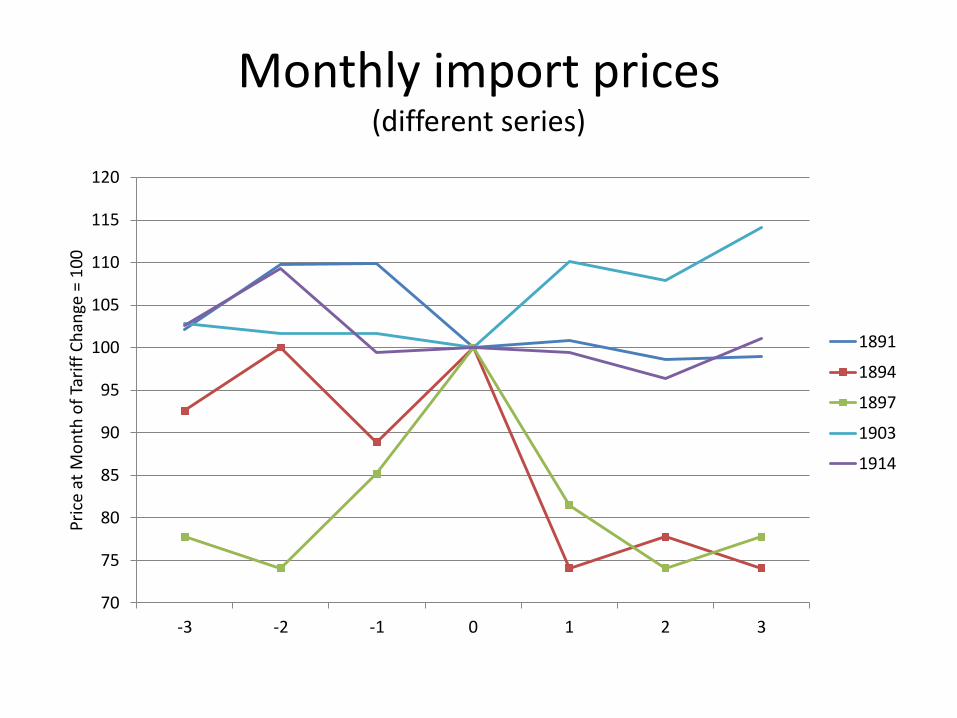
Monthly import prices(different series)
70
75
80
85
90
95
100
105
110
115
120
-3 -2 -1 0 1 2 3
Pri
ce a
t M
on
th o
f Ta
riff
Ch
ange
= 1
00
1891
1894
1897
1903
1914
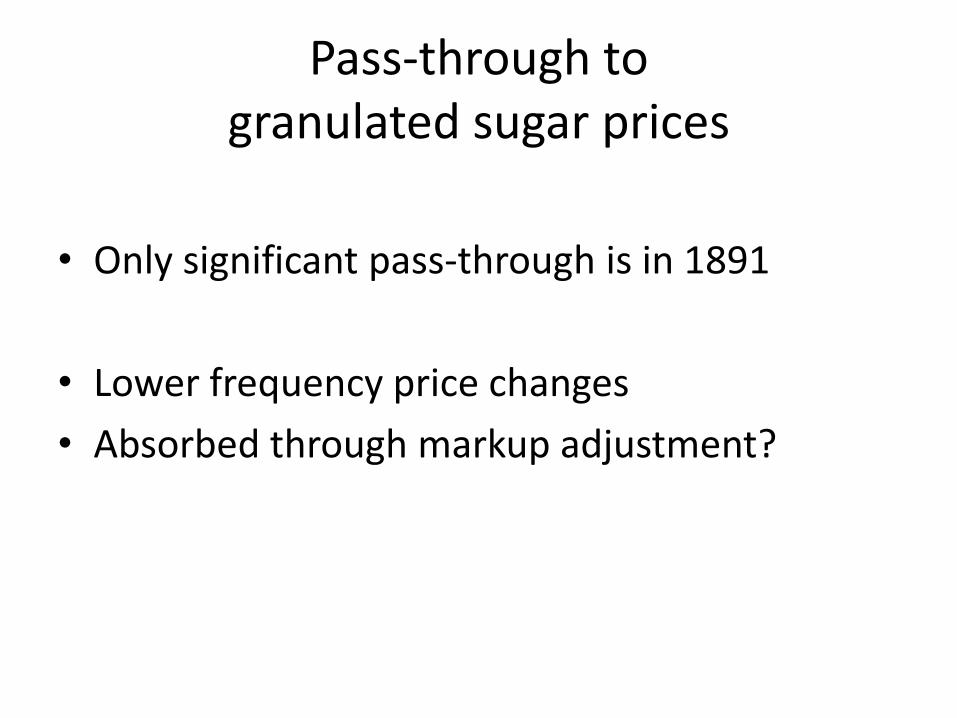
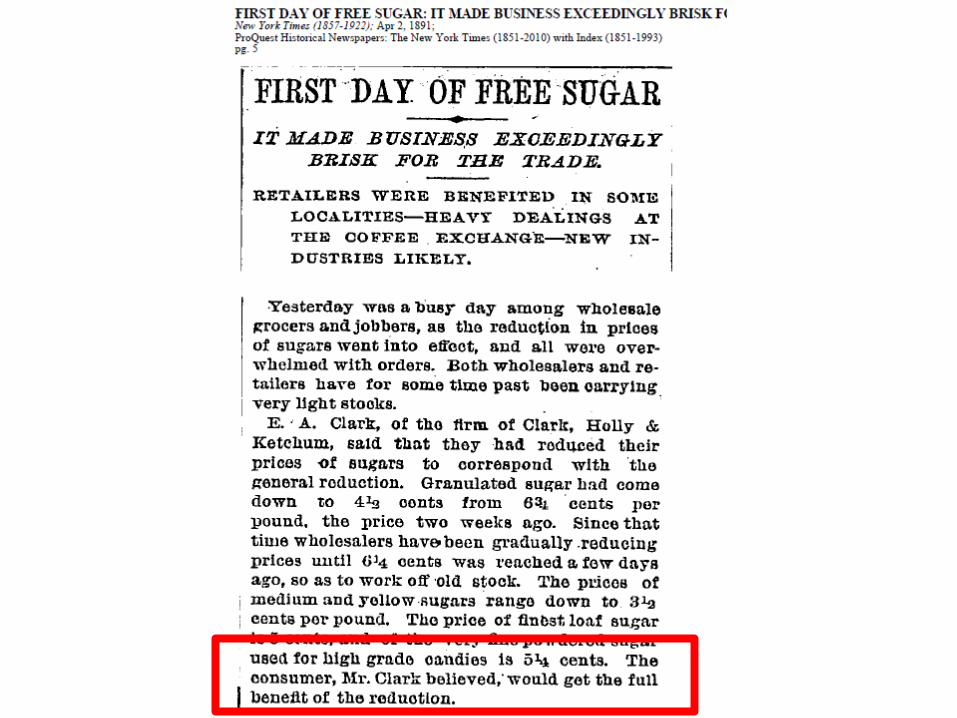
Pass-through to granulated sugar prices
• Only significant pass-through is in 1891
• Lower frequency price changes
• Absorbed through markup adjustment?
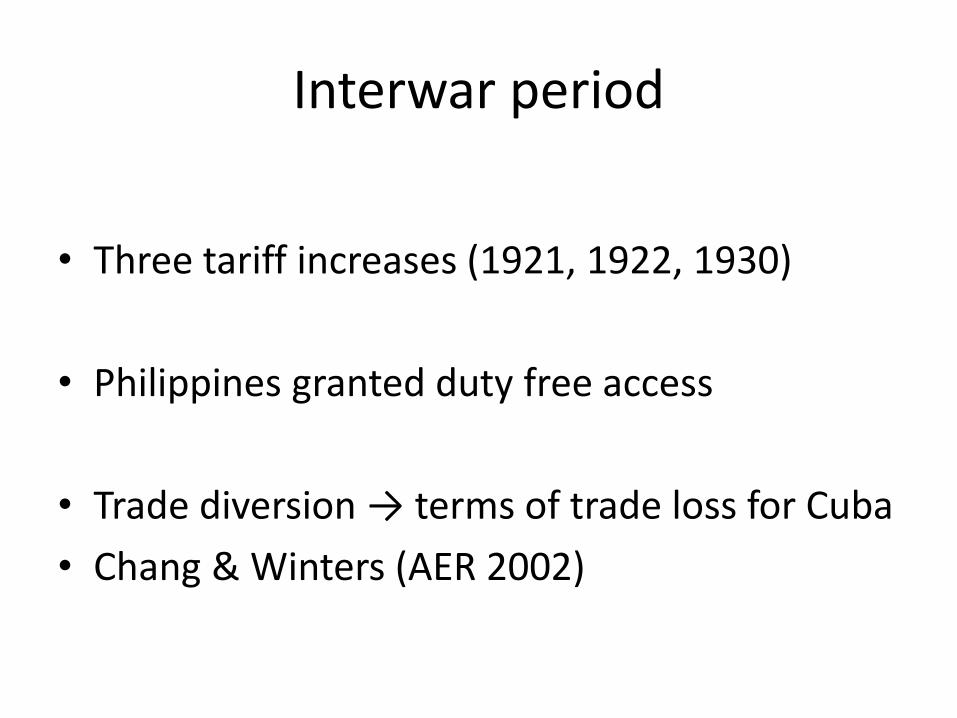
Interwar period
• Three tariff increases (1921, 1922, 1930)
• Philippines granted duty free access
• Trade diversion → terms of trade loss for Cuba
• Chang & Winters (AER 2002)
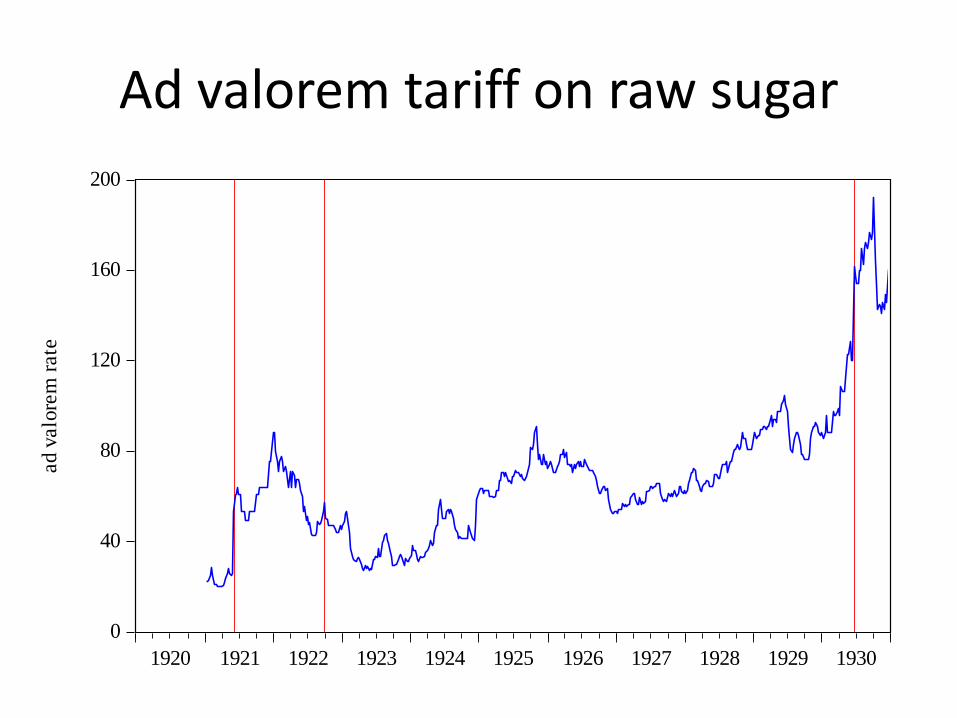
Ad valorem tariff on raw sugar
0
40
80
120
160
200
1920 1921 1922 1923 1924 1925 1926 1927 1928 1929 1930
ad v
alo
rem
rate
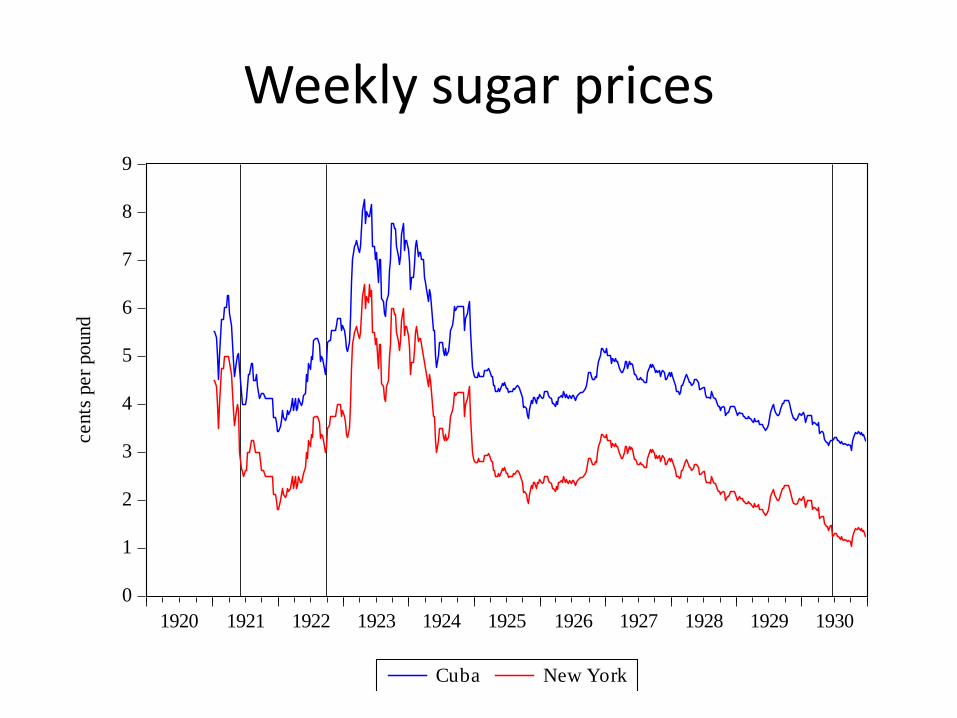
Weekly sugar prices
0
1
2
3
4
5
6
7
8
9
1920 1921 1922 1923 1924 1925 1926 1927 1928 1929 1930
Cuba New York
cents
per
pound
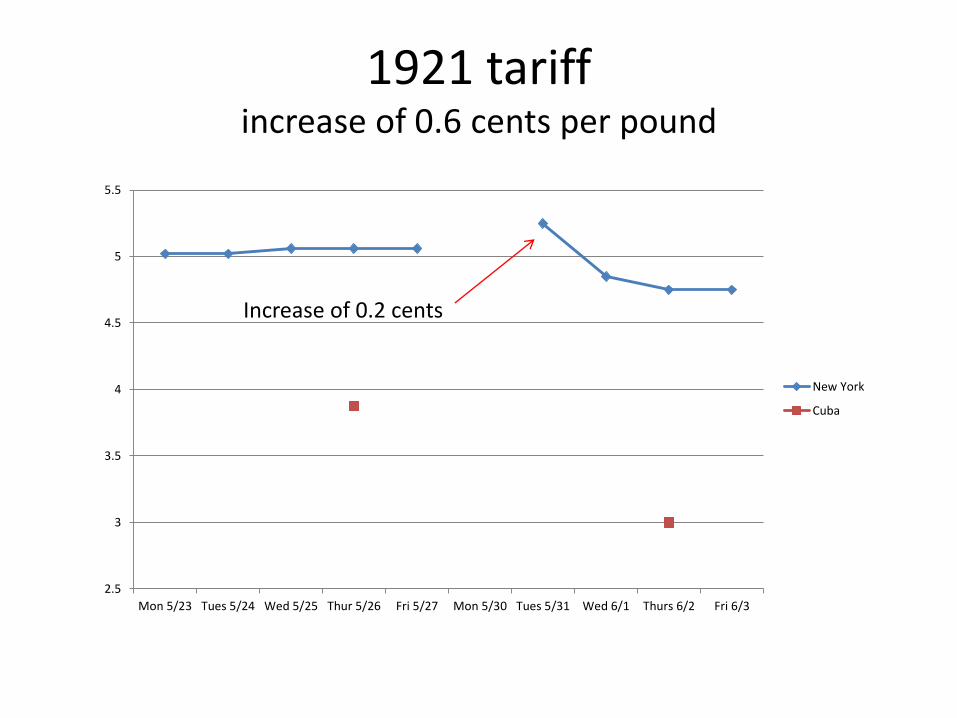
1921 tariffincrease of 0.6 cents per pound
2.5
3
3.5
4
4.5
5
5.5
Mon 5/23 Tues 5/24 Wed 5/25 Thur 5/26 Fri 5/27 Mon 5/30 Tues 5/31 Wed 6/1 Thurs 6/2 Fri 6/3
New York
Cuba
Increase of 0.2 cents
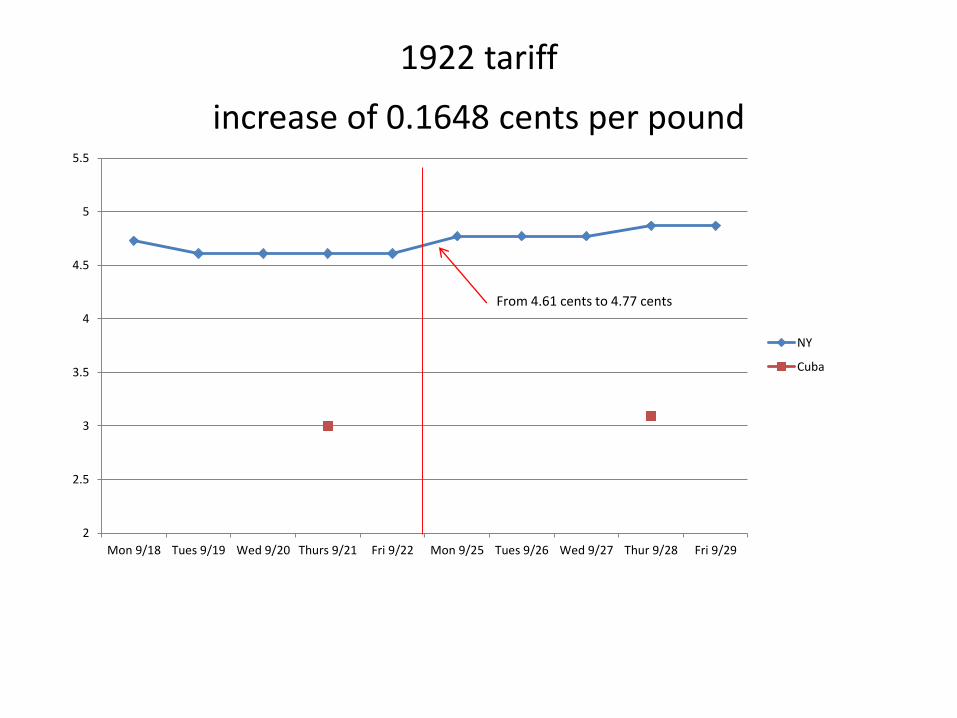
1922 tariff
increase of 0.1648 cents per pound
2
2.5
3
3.5
4
4.5
5
5.5
Mon 9/18 Tues 9/19 Wed 9/20 Thurs 9/21 Fri 9/22 Mon 9/25 Tues 9/26 Wed 9/27 Thur 9/28 Fri 9/29
NY
Cuba
From 4.61 cents to 4.77 cents
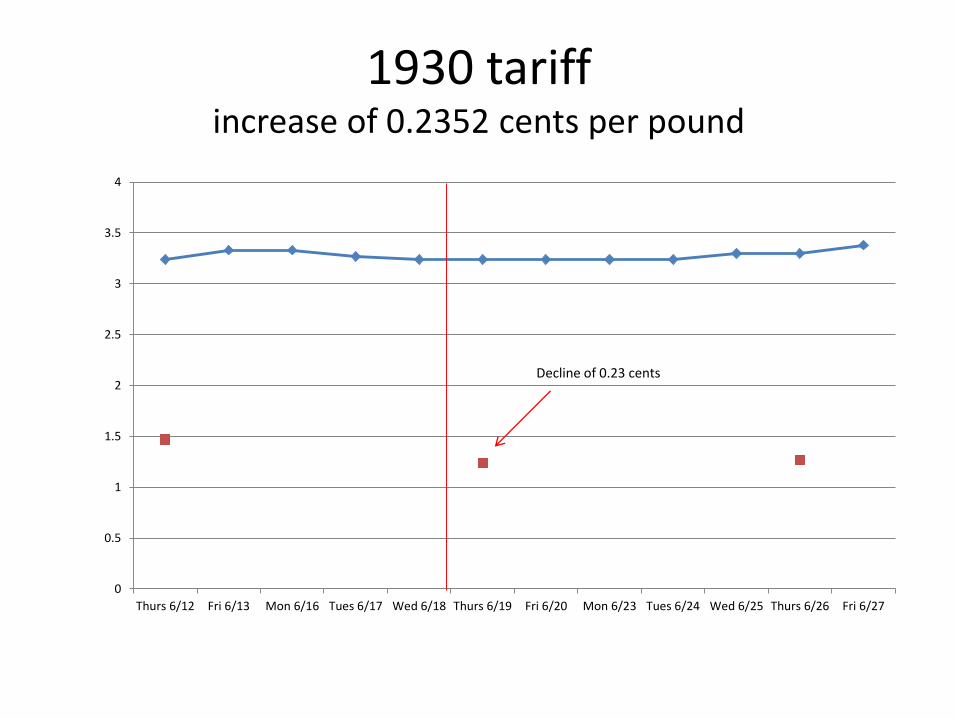
1930 tariffincrease of 0.2352 cents per pound
0
0.5
1
1.5
2
2.5
3
3.5
4
Thurs 6/12 Fri 6/13 Mon 6/16 Tues 6/17 Wed 6/18 Thurs 6/19 Fri 6/20 Mon 6/23 Tues 6/24 Wed 6/25 Thurs 6/26 Fri 6/27
Decline of 0.23 cents
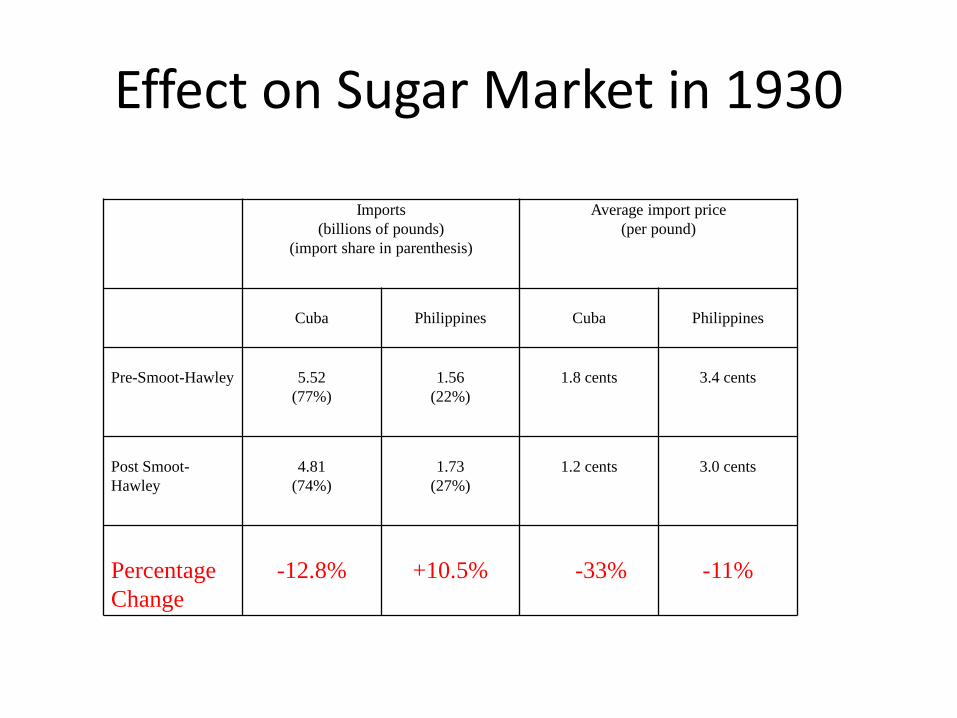
Effect on Sugar Market in 1930
Imports
(billions of pounds)
(import share in parenthesis)
Average import price
(per pound)
Cuba Philippines Cuba Philippines
Pre-Smoot-Hawley 5.52
(77%)
1.56
(22%)
1.8 cents 3.4 cents
Post Smoot-
Hawley
4.81
(74%)
1.73
(27%)
1.2 cents 3.0 cents
Percentage
Change
-12.8% +10.5% -33% -11%
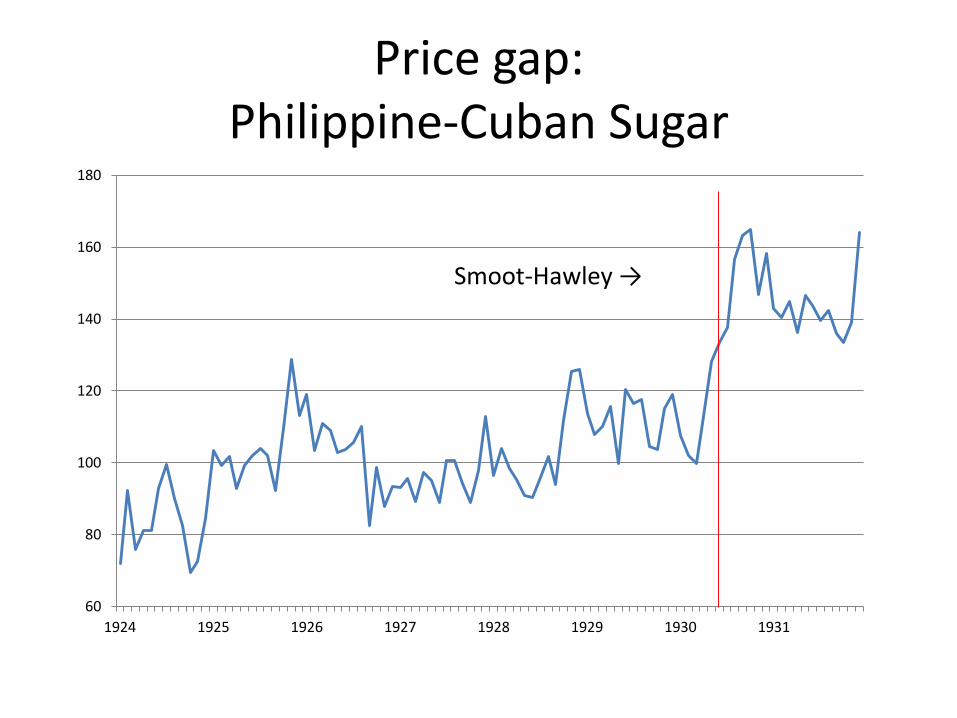
Price gap: Philippine-Cuban Sugar
60
80
100
120
140
160
180
1924 1925 1926 1927 1928 1929 1930 1931
Smoot-Hawley →

Conclusion
• Asymmetric incidence of tariff changes
– Reductions: ≈ 100% pass-through
– Increases: ≈ 40% percent pass through
• Asymmetric demand response
– Forward shifting of imports with tariff increase
– Little postponement with tariff decrease

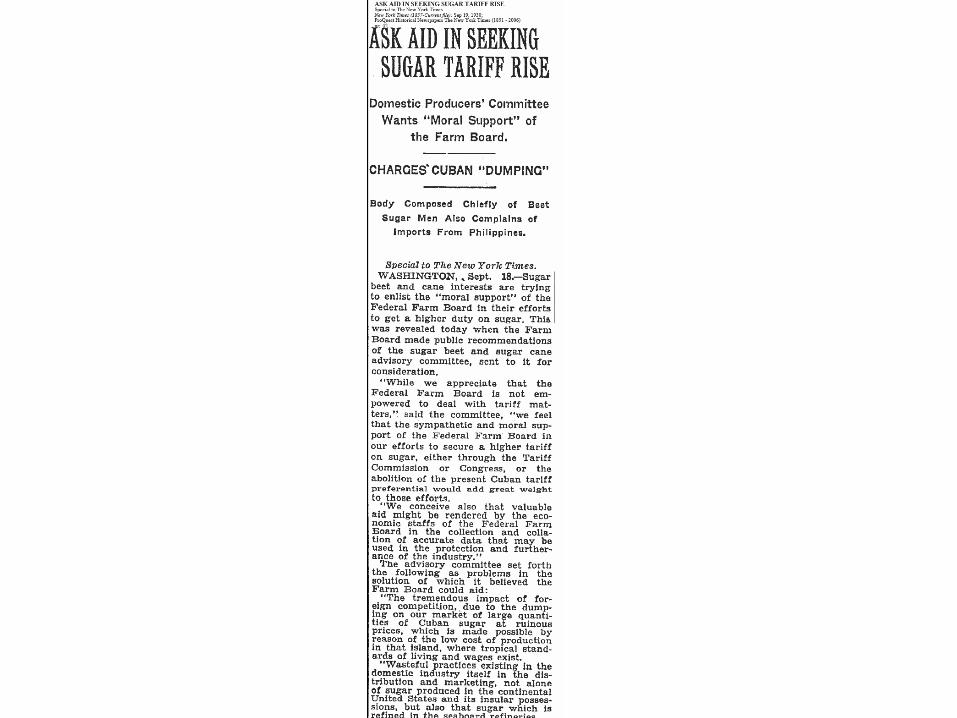
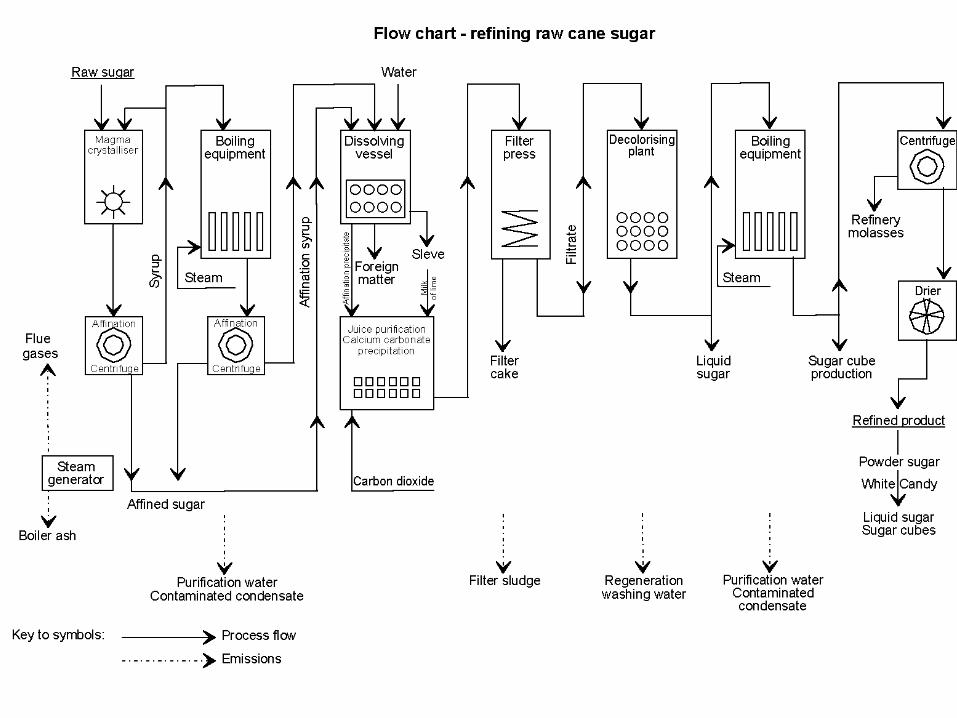
The Smoot-Hawley Tariff of 1930
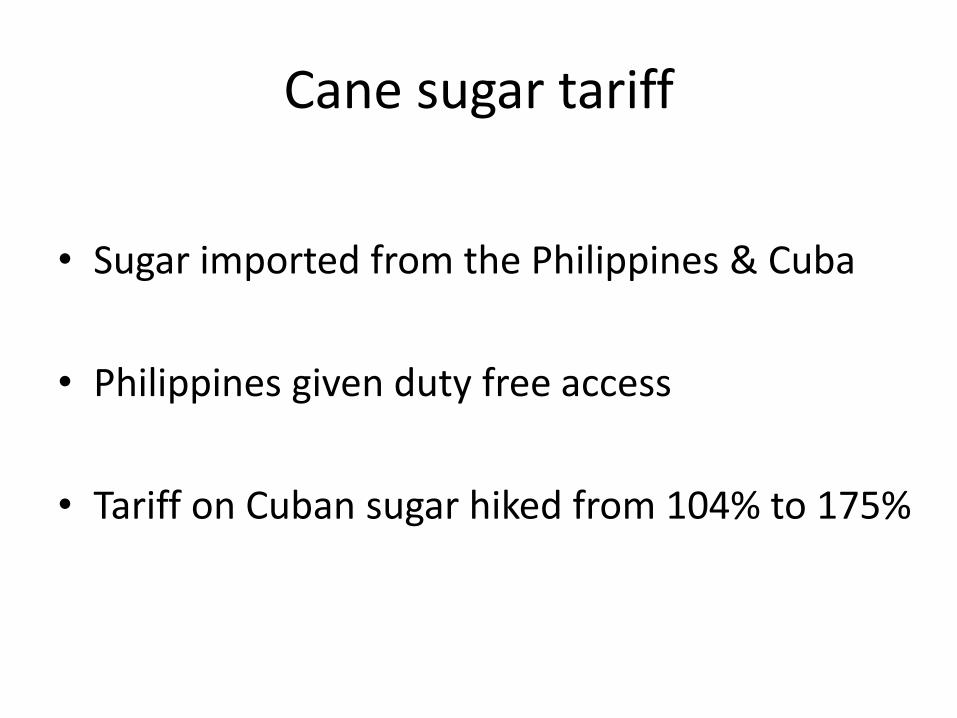
Cane sugar tariff
• Sugar imported from the Philippines & Cuba
• Philippines given duty free access
• Tariff on Cuban sugar hiked from 104% to 175%
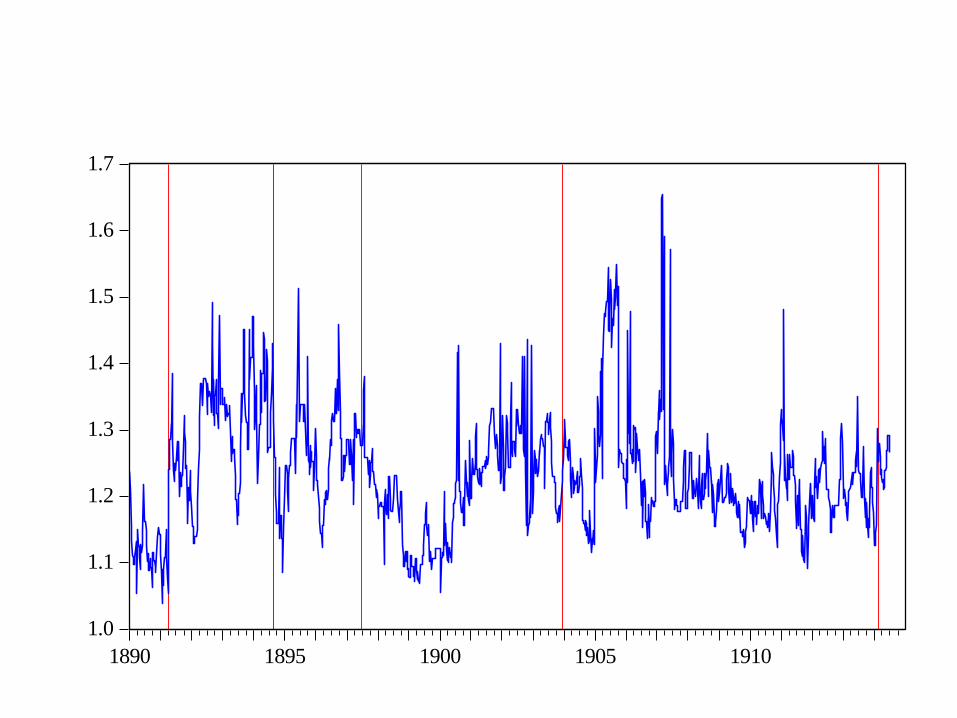
1.0
1.1
1.2
1.3
1.4
1.5
1.6
1.7
1890 1895 1900 1905 1910
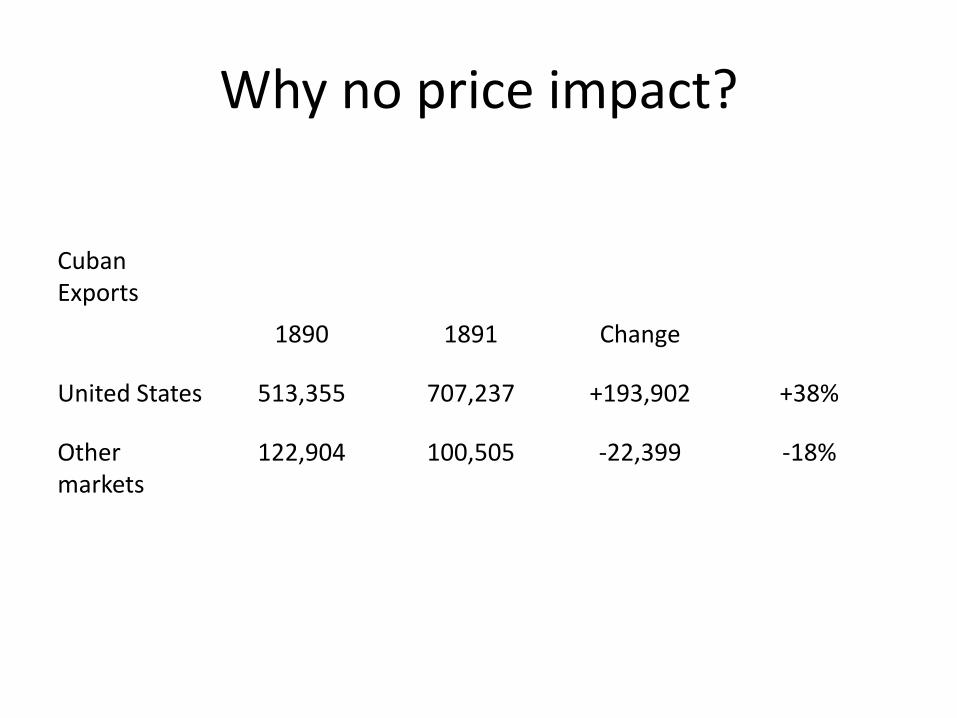
Why no price impact?
Cuban Exports
1890 1891 Change
United States 513,355 707,237 +193,902 +38%
Other markets
122,904 100,505 -22,399 -18%
Bagwell-Staiger (2010)
• “the empirical relevance of terms-of-trade manipulation is much greater than has been widely believed . . . .most countries, even apparently ‘small’ countries, have significant ability to alter their terms of trade on many imported products with their tariff choices.”