do girls pay the price of civil war? violence and infant
TRANSCRIPT

Do Girls Pay the Price of Civil War?
Violence and Infant Mortality in Congo∗
Olivier Dagnelie† Giacomo De Luca‡ Jean-Francois Maystadt§
September 2014
Abstract
This paper documents the impact of civil wars in the Democratic Re-
public of Congo on infant mortality between 1997 and 2004. It adopts an
instrumental variable approach to correct for the non-random timing and
location of conflict. Strong and robust evidence, including mother fixed
∗We would like to thank Olivier Ecker, Kalle Hirvonen, Hannes Mueller,Petros Sekeris, and all participants in conferences and seminars where previousversions of this paper were presented. All errors and opinions expressed remainour own. Jean-Francois Maystadt is grateful to the Center for Institutions andEconomic Performance (LICOS), KU Leuven and the International Food PolicyResearch Institute (IFPRI) for their support during his post-doctoral position,during which this research was initiated. He also acknowledges the CGIARResearch Program on Policies, Institutions, and Markets (PIM) and the KULeuven research fund (Methusalem) for their financial support.†Centre for Research in Economic Development, University of Namur, Bel-
gium. Email: [email protected].‡Department fo Economics, University of York, UK and LICOS KU Leuven,
Belgium. Email: [email protected].§Department of Economics, Lancaster University Management School, Lan-
caster, LA1 4YX, UK. Email: [email protected].
1

effects regressions, shows that conflict significantly increases girl mortal-
ity. It also examines the mechanisms explaining this phenomenon, with
a focus on disentangling the behavioral from the biological factors. The
analysis suggests that gender imbalances in infant mortality are driven
by the selection induced by a higher vulnerability of boys in utero rather
than by gender discrimination.
Keywords: civil war, infant mortality, gender discrimination.
2

1 Introduction
The impact of violence on the demography of a society can substantially increase
the overall costs of a conflict, and heavily affect the time and the nature of
the recovery process (Ghobarah, Huth, and Russett 2003; Chen, Loayza, and
Reynal-Querol 2008). A solid knowledge of the effects of war on the most
fragile section of the population therefore represents a necessary condition for
devising the proper responses to protect the next generations in conflict-prone
environments, given the persistence over the life cycle of the detrimental impact
of shocks experienced in early life (Aguero and Deolalikar 2012; Akresh et al.
2012; Dominguez and Barre 2013).
A variety of factors may have a negative impact on infants’ health. Malnutri-
tion, resulting from the contraction of the internal supply of food and a partial
collapse of trade in the regions in which violence unravels, for instance, wors-
ens the general health status of the affected population (Alderman, Hoddinott,
and Kinsey 2006; Jenkins, Scanlan, and Peterson 2007; Bundervoet, Verwimp,
and Akresh 2009; Akresh and Edmonds 2011). Areas affected by violence are
characterized by losses of or poor access to health infrastructures, due to lack
of equipment and human resources. Timely interventions in cases of illness are
crucial to guarantee full recovery. Limited access to health centers seriously af-
fects antenatal care, professional birth attendance, and postnatal care, thereby
endangering the survival of infants. Amid violence, health programs (such as
prevention through vaccination and health education) are usually interrupted
or implemented discontinuously, increasing the spread of vector-borne diseases.
3

When displacement of large shares of a population occurs, lack of clean water
and hygiene leads to a higher risk of diarrhea, one of the major causes of child
morbidity and mortality. Finally, infants’ health may deteriorate as a conse-
quence of conflict-related shocks experienced in utero (Camacho 2008; Almond
and Currie 2011; Akresh, Lucchetti, and Thirumurthy 2012; Mansoor and Rees
2012; Minoiu and Shemyakina 2012).
In line with these intuitive considerations, the literature regularly reports
increased infant mortality rates in areas affected by civil war. The detrimental
effect is consistent across humanitarian organization reports and the medical
literature (Toole, Galson, and Brady 1993; Goma Epidemiology Group 1995;
Danish Epidemiology Science Centre 1999; Kiros and Hogan 2001; Medecins
sans Frontieres 2003; Coghlan et al. 2006). For instance, Coghlan et al. (2006)
reported higher infant mortality rates in the eastern side of the Democratic
Republic of Congo (DRC), the region of the country most heavily affected by
the recent civil war.
Contributions in the demography and economics literature, closer to this
work in scope and methodologies, also consistently find higher child mortality
rates in conflict-ridden areas (Guha-Sapir and van Panhuis 2004; Guha-Sapir et
al. 2005; Guha-Sapir and D’Aoust 2010). Davis and Kuritsky (2002) showed
that severe military conflicts in sub-Saharan Africa raised infant mortality by
12 per thousand. Studying Khmer Rouge Cambodia, de Walque (2005) showed
that infant and under-five mortality were very high for children born from 1970
to 1979. In particular, a child born between 1975 and 1979 had roughly a 15
4

percent risk of dying within the first year of life, with no significant difference
in mortality across gender. No gender differences were reported by Singh et al.
(2005), who studied child mortality among a displaced population in Sudan and
Uganda. Interestingly, they also found no difference in child mortality between
refugees and the resident population, hinting that camps for internally displaced
people might have an ambiguous effect on mortality. Finally, Verwimp and Van
Bavel (2005) found that girls born during the refugee crisis in Rwanda displayed
a particularly higher mortality rate as compared with those in the nonrefugee
population.
None of the previous studies, however, explicitly controlled for the potential
endogeneity of conflict location. In particular, this paper argues that conflict
is typically not randomly located and that failing to properly account for this
may lead to a bias in the estimated results. The fact that violence has been
reported to target wealthier households in neighboring countries like Burundi
(Bundervoet 2010), Rwanda (Verpoorten 2009), and Uganda (Blattman and
Annan 2010) suggests a bias that may push the estimated response of socioe-
conomic outcomes to conflict toward zero. Besides the likely nonrandomness of
conflict, microlevel data on conflict events (based on news reports) may suffer
from measurement error. Conflict events in more remote and less connected
locations will typically be underreported in the news and consequently in the
data (Restrepo, Spagat, and Vargas 2006; Verpoorten 2012). Controlling for
the endogeneity solves these two issues at least partially.
This brings us to the main contributions of the present article. First, it
5

studies the impact of recent violence in DRC on infant mortality rates, explic-
itly addressing the potential endogeneity of conflict location and timing. It
instruments for conflict intensity using a mineral price index. In other words,
it exploits the exogenous variation in the potential value of mineral sites gener-
ated by changes in world mineral prices to predict the geographic distribution
of the conflict. The resulting estimates confirm the concerns expressed above.
Simple ordinary least squares (OLS) results predict (for some specifications of
the model) a decrease in mortality rates during the conflict in the districts most
heavily affected by the violence, perhaps because the violence targets wealthier
households likely to suffer lower infant mortality rates. An instrumental vari-
ables analysis, however, yields the more intuitive result that conflict increases
infant mortality rates, but interestingly the detrimental effect seems to concen-
trate only among girls. This finding is robust to many different specifications,
including a very demanding one that controls for mother fixed effects. The mag-
nitude of the effects is substantial. According to the specification controlling for
mother fixed effects (along with a long list of individual and climatic variables),
an increase in conflict of 1 standard deviation would translate into a 9 percent
increase in the likelihood that a girl will die before she turns one year old.
The second contribution of the current study is to shed light on the gender-
specific impact it uncovers. It investigates whether the imbalance is driven by
biological or behavioral factors. More specifically, it identifies in the literature
potential factors that may foster gender discrimination against girls in house-
holds facing difficult times. The analysis finds no evidence for the existence
6

of gender discrimination in the context of DRC conflict. In line with medical
evidence (Shettles 1961; Mizuno 2000; Kraemer 2000; Catalano et al. 2006), an
alternative explanation relates to the biological vulnerability of boys in utero
that would generate gender selection at birth (Valente, forthcoming).1 The
present study assesses whether girls’ higher mortality rate may be partially ex-
plained by a selection in utero against boys due to conflict exposure, and it
finds tentative evidence for this mechanism. Overall, the analysis suggests that
gender imbalance in child mortality is largely explained by selection in utero
against boys rather than resulting from gender discrimination in times of scarce
resources. In other words, the survival of the fittest boys in utero would explain
gender imbalances during the first 12 months of life.
In the next section we provide the relevant background information on the
armed conflict in the DRC. Section 3 presents the data. Section 4 lays out
the empirical strategy, and results are presented in Section 5. Section 6 dis-
cusses the relative importance of behavioral and biological factors in explaining
the different impact of violence on male and female infants. The last section
concludes.
2 Historical Background
The DRC has experienced two of the most violent wars in recent history. The
first Congolese war, which started at the end of 1996, is usually interpreted as
a fight by the coalition of the Congolese rebellion led by Laurent-Desire Kabila
7

with the foreign governments of Rwanda and Uganda not only to overthrow
Mobutu but also to eradicate the presence of Rwandan Hutu refugees in eastern
DRC, where they had escaped in the aftermath of the 1994 genocide (Vlassen-
root and Raeymaekers 2004; Prunier 2009).
The second Congolese war unraveled between 1998 and 2004, with an as-
tonishing estimated death toll of more than 3.8 million people (International
Rescue Committee 2011) and an estimated 1.7 million internally displaced peo-
ple (Internal Displacement Monitoring Center 2011). This magnitude of death
and displacement is likely to have impinged upon the health of infants in af-
fected areas. Interestingly, there is extensive anecdotal evidence of the role of
minerals in shaping the dynamics of the conflicts, particularly during the sec-
ond war (Congdon Fors and Olsson 2004; Turner 2007; Gambino 2011; Stearns
2011; Sanchez de la Sierra 2013). This link will constitute the rationale of our
instrumental variable strategy.
The provinces most heavily affected by the violence were Orientale and North
and South Kivu, the areas in which the concentration of local and foreign armed
groups was highest. Conflict was also concentrated in the territory of Pweto
(Haut-Katanga district) in the Katanga province as well as in Kinshasa (see
Figure 1).
[FIGURE 1 ABOUT HERE]
8

3 Data Sources and Sample Construction
To assess the impact of the conflict in terms of infant mortality —defined as child
mortality at 12 months —we make use of the Demographic and Health Survey
(DHS) on DRC carried out in 2007. Since we take advantage of the timing
and location variations of conflict events, our main sample excludes children
for whom we do not know exactly where their household was living at the
time of their birth.2 We select those children born between 1997 and 2004,
encompassing the two Congolese wars. DHS surveys are meant to be nationally
representative and collect individual information on women aged 15 to 49 on
education, demographic, and health issues as well as some information on the
location of the interview, among which are GPS coordinates.3 Thanks to the
inclusion of each woman’s maternal history in the dataset, we have recovered
detailed information such as when her children were born; whether they are still
alive and if not, when they died; and whether they were part of a multiple birth.
This enables us to create variables counting the number of brothers and sisters
alive at the time of a child’s birth.
We also take advantage of the geographical information linked to each DHS
cluster to create three climatic variables. Given the emerging evidence on the
links between weather shocks and violence (Hsiang, Burke, and Miguel 2013),
introducing these variables could potentially reduce the risk of confounding
factors. The first two variables are expressed in standard deviations from a
long-term average (that is, of the previous 25 years) and are the relative sum
of, respectively, monthly rainfall and temperature observations during the first
9

12 months of life of each child. The data used to construct the measure of
precipitation and temperature come from Terrestrial Precipitation: 1900–2008
Gridded Monthly Time Series, Version 2.01, interpolated and documented by
Matsuura and Willmott (2009). This dataset is a compilation of updated sources
and provides monthly precipitation (and mean temperature) interpolated to a
latitude/longitude grid of 0.5 degree by 0.5 degree from an average of 20 weather
stations.
We also create a third variable combining rainfall with daily temperature ob-
tained from the Prediction of Worldwide Energy Resource (POWER) database
of the US National Aeronautics and Space Administration (NASA): the number
of months of potential malaria exposure in the first 12 months of life. To build
such an index we apply the approach proposed by Kudamatsu , Persson, and
Str omberg (2012). Four conditions have to be simultaneously satisfied for a
month to be considered as malaria prone: The malaria index Mdm for district
d and month m is set to 1 if and only if
1. average monthly rainfall during the past 3 months is at least 60 mm,
2. rainfall in at least 1 of the past 3 months is at least 80 mm,
3. no day in the past 12 months has an average temperature below 5◦C, and
4. the average temperature in the past 3 months exceeds 19.5◦C plus the
standard deviation of the monthly temperature in the past 12 months.
For the first stage of our instrumental variables estimates, we investigate
the relationship between conflict events and mineral prices. To this end, we
10

construct a panel dataset of conflict events and a price index. We filter the data
from the Armed Conflict Location and Event Data Project (ACLED) dataset
on the DRC and keep events from January 1, 1997, to December 12, 2004, that
are not described as riots (Raleigh et al. 2010). A conflict event is defined as
a single altercation wherein force is used by one or more groups for a political
end (Raleigh et al. 2010). Thanks to the availability in the dataset of GPS co-
ordinates for each conflict event, we assign each conflict to its respective district
and time period, using the shapefiles on DRC from the Global Administrative
Areas Database. For each month in the period considered, we create a district-
level measure of conflict by summing all events taking place in a given district
(ConflictEvent).
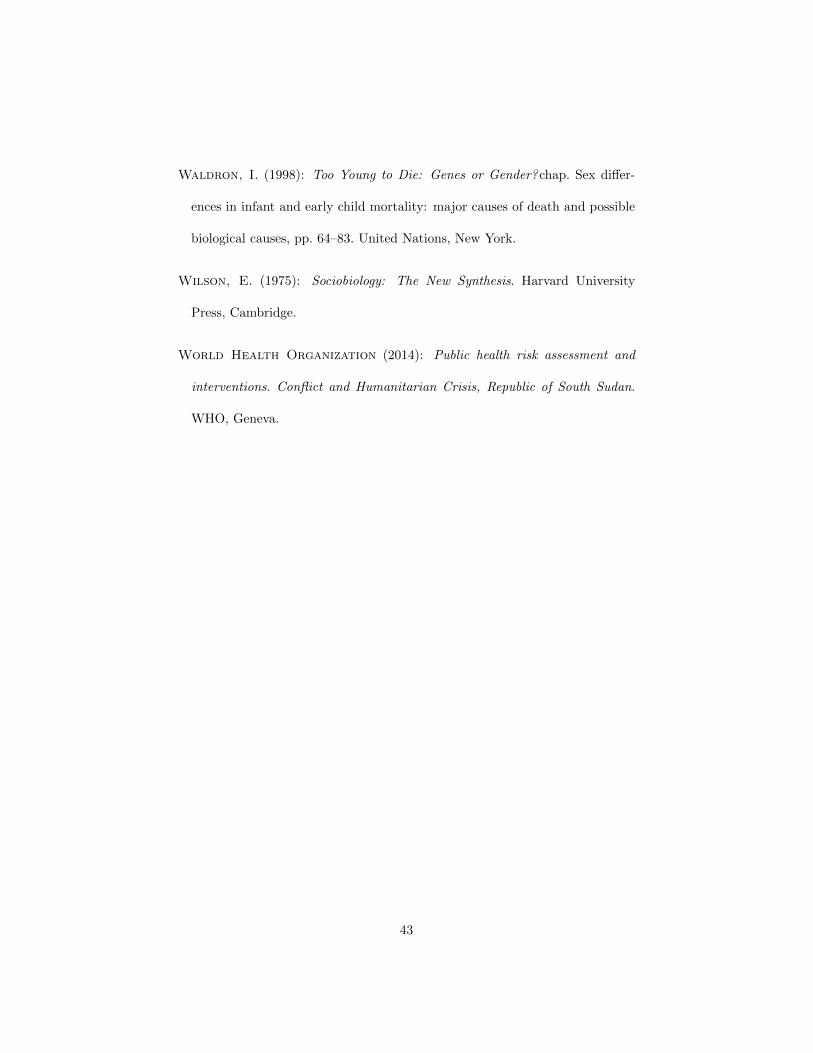
The location of ore for various minerals, obtained from the mineral occur-
rences map of DRC, is also assigned to one of the 38 districts.4 We therefore
know the mineral potential of each district of DRC, which we use to compute a
price index.
One can observe, in Figures 1 and 2, the geographical repartition by district,
respectively, of conflict events from 1997 to 2004 and mineral exploitation sites in
DRC. It is rather striking that the eastern part of the country, richer in minerals
as confirmed by Figure 2, experienced more conflict events. This correlation,
however, does not account for time variations, which we intend to exploit by
interacting the mineral potential of each district with the monthly price of the
corresponding resource.
[FIGURE 2 ABOUT HERE]
11

We turn to the United Nations Conference on Trade and Development (UNC-
TAD) dataset to get the monthly price series of 12 minerals (aluminium, copper,
gold, iron, lead, manganese, nickel, oil, phosphate, tin, wolframite, and zinc) and
compile information from The Economics of Tantalum (Roskill Information Ser-
vices 2009), Metal Pages, and the US Geological Survey to build our price series
for tantalum. The number of extraction sites is interacted with the monthly
mineral prices to obtain a time-varying measure of relative mineral value by
district (Price Index). For each time period and district, we compute a price
index taking account of the number of extraction sites and the price for the set
of 13 minerals, as follows:
Price Indexit =∑r
ωriprt, (1)
where ωri = mineralsri/∑
j mineralsrj is a weight measuring the relative im-
portance of mineral r in district i with respect to other districts and prt is the
price of mineral r at period t with a price normalized to 100 for the first period
(January 1997). Since we have no information as to the realized or potential
extraction of ores of each mineral location, we decided to weight each monthly
ore price by a ratio of the number of mineral deposits in the district over the
total number of deposits of this particular mineral in the country. This way,
we intend to proxy the extraction potential by ore of each district. We sum
this potential over all minerals in a price index in order to reflect the district
resource endowment value at each point in time. In other words, we capture
12
how the monthly change in mineral prices alters the relative potential value of
the mining sector across districts. This strategy is similar to the one adopted by
Bruckner and Ciccone (2010) in their study on conflict in sub-Saharan Africa.
All the variables used in our analysis are described in Table 1. In order
to obtain a nationally representative dataset, we resort to sampling weights
provided in the DHS. These are needed to render the estimates independent
from the sampling design.
Table 1 shows a few noteworthy things. First, infant mortality is relatively
high during the period 1997–2004 as 1 child in 10 failing to reach the age of
one year. As is commonly observed worldwide, boy mortality is higher than
girl mortality (Wilson 1975; Waldron 1998; Garenne 2003). Interestingly, the
average ratio of male over female mortality stands at about 1.2, which lies
toward the bottom of the range of 1.15—1.30 identified by Garenne (2003) in
other countries in normal times. This may already suggest a detrimental impact
of warfare on girls’ mortality at the aggregated level. Our empirical analysis will
put forward compelling evidence that, once the potential endogeneity of conflict
location is properly addressed, conflict significantly increases girl mortality.
[TABLE 1 ABOUT HERE]
4 Empirical Strategy
The ultimate goal is to estimate the impact of conflict on infant mortality.
Since the timing and location of conflict events is likely to be nonrandom, we
13

turn to instrumental variable analysis. We first discuss in detail the first-stage
relationship, wherein we predict conflict distribution based on the change in
mineral prices. We then use this instrument to assess the impact of conflict on
infant mortality.
Conflict
In the context of conflict in the DRC, we expect resources to shape the distri-
bution of the violence. We therefore use the previously described price index
to predict the intensity of conflict by district and over time. Formally, the
first-stage specification is as follows:
Conflictdt = αd + βt + δdt + γPrice Indexdt + εdt, (2)
where Conflictdt is one of the measures of conflict. We control for district fixed
effects, αd, time fixed effects, βt, and district-specific linear time trends, δdt.
We run several specifications of the model using Conflict Events as dependent
variable to check the robustness of the first-stage relationship. Next, given
the interest of this study, we run the first stage to predict, for each month in
the sample, the conflict distribution over the preceding 12 months, denoted by
Conflict Events 12. We also adopt an alternative measure of conflict, which
records for each month the number of months featuring violence in the districts
over the preceding 12 months, denoted by Conflict Exposure 12. In those cases,
we change the price index used accordingly (Price Index 12).
14

Infant Mortality
The second stage of the analysis focuses on infant mortality, defined as the
mortality of children by 12 months of age. In order to exploit the richness of
the dataset, we first run cross-sectional regressions with several types of fixed
effects, including a within-household comparison through the use of mother
fixed effects. As an alternative specification, we next run panel regressions to
estimate mortality rates at 12 months by district.
Cross-section Regressions
In this context, the unit of observation is a child, i, born at month m, in district
d. We check 12 months after her birth whether she is still alive and assign value
1 to our binary variable Mortalityimd if childi died during the first 12 months
of her life. We denote by ConflictEvents 12dm the sum of conflict events that
took place in district d during the first 12 months of life of child i born 12 months
before month m, that is ConflictEvents 12dm =∑12
j=1 ConflictEventsdm−j .
Formally, we estimate the following model:
Mortalityidm = αd +βm + δ′Xi +λ
′Xhh + γConflictEvents 12dm + εidm, (3)
where Xi is a vector of control variables including whether the child was part
of a multiple birth, whether she was the first child, her number of siblings alive,
a malaria index (summing the number of months of exposure to malaria), and
rainfall and temperature anomalies (with respect to a long-term average of 25
15

years). A further set of variables, Xhh, controls for household characteristics
including the education level of the mother and a measure of the wealth of the
household.
To deal with the potential endogeneity of conflict distribution, the conflict
intensity measure is instrumented by the mineral price index described above.
Formally, the following system of two equations is estimated by limited infor-
mation maximum likelihood:
Mortalityimd = αd + βm + δ′Xi + λ
′Xhh + γConflictEvents 12dm + εidm (4)
ConflictEvents 12dm = δd + ρm + η′Xi + θ
′Xhh + νPrice Index 12dm + υidm.(5)
The idea behind this empirical strategy is to exploit the timing and location
variations of conflict events and to compare children born in the same month
in districts affected differently by conflict. Standard errors are clustered at the
village level, and sampling weights are used to render the estimates indepen-
dent of the sampling design. As mentioned before, the regressions are run on
the sample of children known to have been born in their mother’s interview
district. Enlarging the sample to include those children who migrated does not
qualitatively change the results.
The most demanding and most convincing specification of this empirical ex-
ercise is to include in the model mother fixed effects, enabling us to compare
along the dimension of exposure to conflict children born to the same mother.
Controlling for mother fixed effects allows us to take account of both environ-
16

mental differences between children and each mother’s genetic features. In order
to ease the estimation process, we partial out each variable with the series of all
the fixed effects. By the Frisch-Waugh-Lovell theorem, we know this method to
keep the sign and magnitude of the coefficients unchanged. In order to ensure
that the initial inference was correct, we turn to 999 replications of wild boot-
strap (percentile-t method), known to resist to heteroskedasticity, to produce
confidence intervals.5
Beyond the strength of the instruments, this empirical strategy is based
on a key identifying assumption. If mineral prices influence infant mortality
through another channel than the occurrence of violence, this would violate our
exclusion restriction. In particular, one could claim that wealth effects coming
from mineral price variations could invalidate our identification strategy. A
first indication that it should not be the case is that our point estimates are
virtually unchanged when controlling for household characteristics such as the
education of the mother or household wealth. Controlling for wealth effects,
the exclusion restriction is likely to hold. To test further the plausibility of our
exclusion restriction, we proceed to a placebo test. Regressions of the same price
index on infant mortality over the period 1980–1996 showed that the exclusion
does not seem to be at risk.6 In particular, we fix the length of the sample to
96 months, as in the main analysis. Next, we run regressions starting on the
first month of the enlarged sample (January 1980). Moving each time by one
month our sliding window of 96 months from the start of the sample until the
end, we test the reduced-form relationship in 95 regressions for the preconflict
17

period. When we include no district-specific linear trends, we obtain only 9 out
of 95 times a (weakly) significant reduced-form relationship. Including linear
district-specific trends yields no significant coefficient out of the 95 regressions.
The results of this placebo exercise are summarized in Table 2. Such a result is
difficult to conciliate with price-induced wealth effects.
[TABLE 2 ABOUT HERE]
Panel Regressions
As an alternative specification, we aggregate the data at the district level (at
the cost of not controlling for changes in the composition of the district popu-
lations). The unit of observation is then the district, d, for which we compute
a mortality rate on all the children born there 12 months before, Mortalitydm.
We run the following fixed-effect panel regression (with or without district-
specific linear trends):
Mortalitydm = αd + βm + γConflictEvents 12dm + εdm. (6)
As for the cross-section analysis, we correct for endogeneity with two-stage least
squares, instrumenting conflict by mineral prices, and estimate the following
18

system of equations:
Mortalitydm = αd + βm + γConflictEvents 12dm + εdm (7)
ConflictEvents 12dm = δd + ρm + ηPrice Index 12dm + εdm. (8)
5 Results
Conflict
Table 3 exhibits that at the district level, the relationship between mineral prices
and conflict events is highly significant and negative (first column and row of
Panel A). Adding linear district-specific time trends confirms the significance of
the price index coefficient (first column and row of Panel B). We run a set of
further robustness checks on the first stage. In the second row of column 1, we
exclude tantalum from the price index, given the alleged relevance of this mineral
in the conflict dynamics as stressed in the international press. Conversely, in the
third row we compute the price index only on tantalum. Interestingly, removing
one mineral at a time from the analysis does not alter the results. The next
three rows replicate the first three but predict conflict in a 12-month period
based on the sum of the price variations over a 12-month period.
In column 2, we restrict the analysis to the 19 districts (half of DRC districts)
hosting most of the violence in the period considered. Here also, removing one
district at a time does not qualitatively change the findings. In column 3 we
restrict the analysis to the 19 districts richest in minerals (based on the price
19

index).
[TABLE 3 ABOUT HERE]
In column 4–6 we focus on the role of tantalum in the relationship between
mineral prices and conflict. In column 4 the analysis is conducted only on
districts with tantalum mines. Column 5 restricts the sample to the 5 districts
most influenced by the tantalum price changes, and the last column looks at
the districts excluded from column 5. All specifications confirm the negative
relationship.
Alternative specifications, displayed in Figure 3 and in which we extend the
period considered, confirm the robustness of this relationship, which still holds
after 2004, the end of the second Congolese war but with a lesser magnitude.
The longer the period included in the analysis after 2004, the lower the coefficient
of interest.
[FIGURE 3 ABOUT HERE]
Finally, we test the first stage using a nonparametric smoother (a locally
weighted smoother, specifically the lowess estimator) on the demeaned and de-
trended versions of the conflict and mineral price measures. The result of this
exercise, reported in Figure 4, confirms that the linear specification constitutes a
good approximation of a potentially more complex relationship.7 The negative
relationship is again confirmed using a nonparametric approach.
[FIGURE 4 ABOUT HERE]
20

Table 4 puts forward our the measures of conflict, Conflict Events 12 and
Conflict Exposure 12, the coefficient of which is again strongly significant and
negative. Significance is actually increased with linear district-specific trends.8
[TABLE 4 ABOUT HERE]
Infant Mortality
Table 5 presents cross-section regressions over the sample of children born be-
tween 1997 and 2004, for all children (columns 1–2), only boys (columns 3–4) or
only girls (columns 5–6). We find strong evidence for the nonrandom distribu-
tion of violence. Table 5 suggests a downward bias of ‘naive’ OLS regressions.
The downward biases that affect the OLS estimates suggest that some unob-
served factors simultaneously explain the number of conflict events by district
and child mortality. A potential explanation may be that conflicts are more
likely to target more wealthy (and therefore healthy) households in a looting-
driven warfare. The downward biases may also arise from measurement errors.
The results also identify a gender-specific impact of conflict episodes on child
mortality. Girls are more adversely affected by conflict than boys. According
to column 6, a change by 1 standard deviation in the number of conflict events
(that is, by about 14 conflict events) increases the probability of a girl’s dying
within the first year of life by about 7 percent. The magnitude of this effect
is far from trivial, inasmuch as it constitutes a doubling of girls mortality (at
mean value). Adding the full set of controls in Panel B of Table 5 leaves the
coefficients of interest virtually unchanged. That is very reassuring with respect
21

to the exclusion restriction. Conditional on household wealth, the exclusion re-
striction is more likely to hold.9 Given the magnitude and significance of the
F-statistics on the instrument, it is very unlikely that the analysis should be
invalidated by a problem of weak instrument.
[TABLE 5 ABOUT HERE]
Being part of a multiple birth is robustly significant and increases mortality,
although the result hinges on only 2 percent of the sample. Being a first child
is likely to be detrimental as well, although the impact is less robust because it
loses significance once the sample is split by gender, following the increase of the
standard errors. In line with the literature, we find strong and robust harmful
effects for children whose mother does not record any years of formal education
(see, for instance, Behrman and Wolfe 1987; Strauss and Thomas 1995). As
expected, wealth decreases infant mortality. These results are extremely robust
to alternative specifications. Household size is also negatively associated with
infant mortality. In Table 6, we assess the robustness of the results to the addi-
tion of a linear trend (column 1), the inclusion of nonresident households in the
sample (column 2), and the use of the alternative measurement of violence based
on the number of months of exposure (columns 3–4). The addition of a linear
trend improves the efficiency of the point estimates while, as expected, the pre-
cision and the size of the conflict coefficients decrease with the extended sample.
Adopting the alternative measure of violence gives even higher coefficients for
the variable of interest. According to the coefficient reported in column 4, an
increase of 1 standard deviation in violence translates into about a 13 percent
22

increase in the likelihood of a girl’s dying within the first 12 months of life.
[TABLE 6 ABOUT HERE]
Despite the addition of mother and household characteristics in Panel B of
Tables 5 and 6, we cannot be certain unobserved child characteristics are not
driving the relationship between violence and infant mortality. To reduce that
concern, we introduce mother fixed effects. Intuitively, we compare the mortality
of children with the same mother differently exposed to conflict. The gender
imbalance in infant mortality is further confirmed in Table 7. The magnitude
of the effect is even stronger. According to the results reported in column 6,
an increase in conflict of 1 standard deviation would translate into a 9 percent
increase in the likelihood of a girl’s dying before she turns one year old. Said
differently, an increase of 1 standard deviation in conflict would be responsible
for the death of 454 additional girls out of the sample of 5,155 girls. As for the
previous specifications, the mother fixed effects results do not depend on the
inclusion of climate and individual characteristics (Panel B of Table 7). Table 8
further indicates that the results are robust to the inclusion of a district-specific
time trend, the inclusion of nonresident households in the sample, and the use of
the alternative definition of conflict (months of exposure). Gender imbalances
in child mortality is confirmed when randomly reallocating migrant mothers to
districts of origin using a uniform distribution. In more than 75 percent of the
1000 simulated samples, the impact of conflict on girl mortality is positive and
significant at, at least, 90 percent level of confidence. In a similar proportion,
the impact is negative for boys. Figure A.2 provides the resulting kernel graph
23

of the t statistics of the estimated coefficients. 10
[TABLE 7 ABOUT HERE]
[TABLE 8 ABOUT HERE]
As a final robustness test we aggregate the data at the district level and run
panel regressions on mortality rates by gender. The results, presented in Table
9, are qualitatively identical to those obtained from cross-section regressions
using individual observations. According to the estimate reported in column 6
of Panel A, an increase by 1 standard deviation (12.3) in conflict events would
increase the likelihood of a girl’s dying within the first 12 months of life by about
7.1 percentage points. That would correspond to an increase of about 94 percent,
at mean value. Such an increase is actually almost identical to the one obtained
with the cross-sectional estimates but lower than our preferred specification with
mother fixed effects. As in the context of cross-section analysis, these results
remain unaffected by the inclusion of aggregated climatic variables (Panel B of
Table 9), the introduction of district-specific time trends (Panel A of Table 10),
and the use of an alternative measurement of violence (Panels B–D of Table
10). The impact of an increase by one standard deviation in violence on girls
mortality increases to about 10–12 percent using the alternative measure of
conflict.
[TABLE 9 ABOUT HERE]
[TABLE 10 ABOUT HERE]
24

The results obtained in this section consistently suggest that considering
conflict events as nonrandom events and consequently exploiting mineral price
variations as exogenous shocks on the likelihood of conflicts makes a significant
difference when estimating the impact of conflict on infant mortality. A robust
pattern emerges: when we control for the endogeneity of conflict intensity, we
find that girls are substantially more affected by violence than boys. The next
section attempts to identify the factors behind this gender-specific effect.
6 Behavioral versus Biological Factors
Two broad classes of factors may drive these findings. First, households may dis-
criminate against girls when resources within households become more limited
during times of warfare. In other words, gender imbalances in infant mortality
would be the result of behavioral factors in a situation in which sons are favored
by parents.11 An alternative explanation relates to the biological vulnerability
of boys in utero that would generate a strong selection effect at birth. As ex-
plained by Valente (forthcoming), gender-based mortality selection in utero may
be explained either by the fact that a male fetus is frailer than its female coun-
terpart (Shettles 1961; Kraemer 2000; Mizuno 2000; Catalano et al. 2006) or
by the ability of females in poor conditions to favor female offspring due to the
lesser variance in reproductive success of girls compared with boys, the so-called
Trivers and Willard (1973) hypothesis. Distinguishing behavioral factors from
biological ones is far from obvious from an empirical point of view (Garenne
25

2003; Mu and Zhang 2011). In this section, we propose various strategies to
test the plausibility of the two mechanisms.
We conjecture that the behavioral hypothesis would be consistent with sev-
eral exacerbating or mitigating factors. The results of tests for behavioral factors
are reported in Table 11, where only the coefficients of interest are presented.12
First, the literature on gender discrimination suggests that when the decision-
making power is in the hands of women, such discrimination against girls should
be at least partly corrected (Thomas 1990, 1994; Duflo 2003, 2012). Interacting
the conflict measure with a dummy capturing female-headed households, we do
not find any evidence for such a mitigating factor (Panel A of Table 11). In con-
trast, we could also expect widows to particularly value the survival of a male
offspring in a context in which inheritance rules are generally discriminatory
against women. If this is true, we should observe more discrimination against
girls of widows during violence. Interacting conflict with a dummy for widows,
however, no differentiated impact is found (Panel B).
[TABLE 11 ABOUT HERE]
Consistent with the literature on sibling rivalry (Morduch 2000; Akresh and
Edmonds 2011), we expect the composition of the household, and in particu-
lar the number of brothers and sisters to have an additional impact on girls’
mortality. Controlling for household size, when a girl has several brothers, we
expect gender discrimination to be even stronger. The reverse is expected when
a girl has several sisters, because the burden of gender discrimination would be
shared among sisters. The results of these exercises, reported in Panels C and
26

D, suggest once more that the behavioral hypothesis has very little explanatory
power.13
An alternative strategy to assess the role of behavioral factors consists in
introducing an interaction term between violence and a proxy for son prefer-
ence at the household level. We define boy preference following Jayachandran
and Kuziemko (2011) in subtracting the ideal number of sons reported by each
mother to the number of boys alive in her household. If our gender imbalance
is driven by discrimination, we should find a stronger discrimination among
households whose boy preference is stronger. The results of this test, in Panel
E, show no additional effect due to stronger boy preference. We also test the
robustness of these results to dividing the Jayachandran and Kuziemko (2011)
proxy for son preference by the same indicator for daughter preference, to disen-
tangle the preference for boys from the preference for large family. No evidence
of stronger probability of girls’ dying within the first year of life is found in
households with a stronger boy preference. That remains true when we adopt a
different measure for boys preference, namely the ratio between the number of
boys alive and the ideal number of sons reported by mothers.14 Since we do not
find any evidence for the existence of heterogeneous impacts along the dimen-
sions that should reveal the presence of gender discrimination, we conclude that
the behavioral hypothesis is unlikely to constitute a major explanation for the
gender imbalances in infant mortality due to the civil war in DRC. Of course,
the absence of evidence is only suggestive of an evidence-of-absence effect. But
at least, contrary to initial expectation, the behavioral factors seem not to be
27

driving the gender imbalances in mortality in times of conflict in DRC.
The main alternative explanation for the gender-specific effect hinges on a
biological hypothesis. As reported above, medical evidence shows that male fe-
tuses are more vulnerable than their female counterparts. In particular, recent
studies have provided strong evidence that the sex ratio at birth decreases fol-
lowing a worsening of the pregnancy environment, as a consequence of a civil war
(Valente, forthcoming), terrorist attacks (Catalano et al. 2006), or prolonged
economic crisis (Fernandez et al. 2011). If this has been the case in DRC, the
higher impact of violence on girls’ mortality rate may be a direct consequence
of the selection induced by higher mortality of boys in utero. We therefore test
whether conflict intensity affected the sex ratio at birth in the panel framework.
To reduce the number of undefined values for the ratio when either no boy or
no girl is born in a particular month, we define the sex ratio for each region and
district as the number of boys born over the total number of births (replacing
missing values by 0.5 when no birth is recorded for a particular month). The
average ratio in our sample stands at 0.511, which is slightly lower than half the
value of 1.03 of the sex ratio (boys over girls) at birth given by Anderson and
Ray (2012) for the whole sub-Saharan Africa (compared with 1.06 in developed
countries). We find some tentative evidence, reported in Table 12, that the sex
ratio at birth significantly decreases following violence experienced during preg-
nancy. According to the results reported in column 2 of Panel A, an increase
by 1 standard deviation in the number of violent events experienced in utero
reduces the sex ratio by about 14 percent, at the mean value of the sex ratio at
28

birth. Using the alternative measure of conflict (months of exposure) provides
very similar results (column 4).
[TABLE 12 ABOUT HERE]
To further investigate the strength of the selection effect in utero, we assess
the impact of violence experienced in utero and during the first 12 months of
life on the sex ratio among one-year-old children (Panels B–D of Table 12).
We first look at the impact of violence experienced while in utero on the sex
ratio among one-year-old children. Results turn (barely) insignificant but are
still negative (Panel B). We then assess the separate impact of violence in utero
versus violence during the first 12 months of life on sex ratio in Panel C. Finally,
in Panel D, we test the cumulative impact of violence from conception until the
first birthday on sex ratio. The results jointly confirm the importance of violence
experienced in utero in driving the sex ratio. The higher mortality rate among
girls caused by violence during the first 12 months of life, as documented in this
study, is only marginally compensating for the strong selection effect against
boys in utero.
In the absence of evidence for behavioral factors, this analysis suggests that
gender imbalances in infant mortality are at least partially driven by the selec-
tion induced by higher vulnerability of boys in utero.
29

7 Conclusions
In this paper we analyzed the impact on infant mortality of the armed conflict
afflicting the DRC from 1997 to 2004. This study differs from existing microlevel
studies in a major way. Relying on a credible instrumental variable approach,
we control for the nonrandom timing and location of conflict violence. This
is particularly relevant when we exploit within-district variations inasmuch as
we show that our instrumental variables results significantly differ from our
ordinary least squares findings, raising some concerns about potential bias in
the existing studies relying on geographical variation in exposure to conflicts.
We find that experiencing violence substantially increases mortality rates
among infants, but only for girls. This pattern is robust to many different spec-
ifications, controlling for district and month fixed effects, rainfall anomalies, and
mother fixed effects. Why does violence affect especially girls’ mortality? Two
broad classes of factors could explain the gender imbalance we uncover: behav-
ioral and biological. According to the former, girls may be more discriminated
against by households faced with difficult circumstances in times of conflict, to
safeguard their male offspring. The latter, instead, would ascribe to purely bi-
ological factors the gender-specific resilience to conflict. For instance, boys and
girls may feature different resistance levels to negative shocks.
We adopt several strategies to assess the different roles of behavioral versus
biological factors in explaining our result. We find no support for gender dis-
crimination to be driving the higher mortality rates among girls. Instead, we
find suggestive evidence that gender imbalances in infant mortality in times of
30

warfare are mainly driven by biological factors. More specifically, we show that
violence is more fatal for male fetuses than for their female counterparts. In
turn, the higher vulnerability of boys in utero induces a selection in the sample
of children born in conflict-affected regions. Overall, our results suggest that
more attention should be paid to understanding possible selection in utero in
studies assessing the impact of shocks in early life.
Our analysis also delivers a critical policy recommendation. Gender-specific
warfare damages have sometimes led scholars and policymakers to call for gender-
based targeted interventions. Although they may be grounded on good motives
and may help in reducing gender discrimination in general, our study warns
that these policies may miss their targets if they fail to account for the possible
selection in utero. In other words, despite providing some evidence of gender
imbalances in infant mortality, our paper suggests that any policy should be
drawn on a sound understanding of the sources of such gender bias. As bio-
logical factors in utero are found to be a more prominent explanation than the
standard behavioral factors, our paper resets the priority to policies aiming at
enhancing the resilience of (pregnant) women to violent experiences. Policies
ensuring high coverage of multiple micronutrient supplementation and other
nutrition-sensitive programs directly addressing pregnant women, family plan-
ning to delay the age of first pregnancy, or educational interventions designed
to increase spacing between births may therefore all prove comparatively more
effective in reducing infant mortality in times of violence than policies targeting
gender discrimination during the first year of life (Black et al. 2013; Bhutta et
31

al. 2013; Ruel and Alderman 2013; WHO 2014).
32

References
Aguero, J., and A. Deolalikar (2012): “Late Bloomers? Identifying Crit-
ical Periods in Human Capital Accumulation. Evidence from the Rwanda
Genocide,” Unpublished.
Akresh, R., S. Bhalotra, M. Leone, and U. Osili (2012a): “War and
Stature: Growing up during the Nigerian civil war,” American Economic
Review: Papers and Proceedings, 102(3), 273–277.
Akresh, R., and E. V. Edmonds (2011): “Sibling rivaly, residential rivalry
and constraints on the availability of child labor,” NBER Working Paper,
17165.
Akresh, R., L. Lucchetti, and H. Thirumurthy (2012b): “Wars and civil
health: Evidence from the Eritrean-Ethiopian Conflict,” Journal of Develop-
ment Economics, 99(2), 330–340.
Alderman, H., J. Hoddinott, and B. Kinsey (2006): “Long term conse-
quences of early childhood malnutrition,” Oxford Economic Papers, 58, 450–
474.
Almond, D., and J. Currie (2011): “Killing Me Softly: The Fetal Origins
Hypothesis,” The Journal of Economic Perspectives, 25(3), 153–172.
Almond, D., L. Edlund, H. Li, and J. Zhang (2008): “Long-term effects of
early life development: Evidence from the 1959-1961 China famine,” in The
economic consequences of demographic change in East Asia, ed. by T. Ito,
33

and A. Rose, p. 321–345. National Bureau of Economic Research, Cambridge,
MA.
Anderson, S., and D. Ray (2012): “Missing women: Age and Disease,”
Review of Economic Studies, 77, 1262–1300.
Behrman, J. R., and B. L. Wolfe (1987): “How does mother’s schooling af-
fect family health, nutrition, medical care usage, and household sanitation?,”
Journal of Econometrics, 36(1–2), 185 – 204.
Bhutta, Z. A., J. K. Das, A. Rizvi, M. F. Gaffey, N. Walker, S. Hor-
ton, P. Webb, A. Lartey, and R. E. Black (2013): “Evidence-based
interventions for improvement of maternal and child nutrition: what can be
done and at what cost?,” The Lancet, 382(9890), 452 – 477.
Black, R. E., C. G. Victora, S. P. Walker, Z. A. Bhutta, P. Chris-
tian, M. de Onis, M. Ezzati, S. Grantham-McGregor, J. Katz,
R. Martorell, and R. Uauy (2013): “Maternal and child undernutri-
tion and overweight in low-income and middle-income countries,” The Lancet,
382(9890), 427 – 451.
Black, S., P. J. Devereux, and K. Salvanes (2008): “Does grief transfer
across generations? In-utero deaths and child outcomes,” Working Paper
19979, NBER.
Blattman, C., and J. Annan (2010): “The consequences of child soldiering,”
The Review of Economics and Statistics, 92(4).
34

Bruckner, M., and A. Ciccone (2010): “International ommodity prices,
growth and the outbreak of civil war in sub-saharan Africa,” Economic Jour-
nal, 120, 519–534.
Bundervoet, T. (2010): “Assets, Activity Choices, and Civil War: Evidence
from Burundi,” World Development, 38(7), 955–965.
Bundervoet, T., P. Verwimp, and R. Akresh (2009): “Health and Civil
War in Rural Burundi,” Journal of Human Resources, 44(2), 536–563.
Camacho, A. (2008): “Stress and birth weight: evidence from terrorist at-
tacks,” The American Economic Review: Papers and Proceedings, 98(2), 511–
515.
Catalano, R., T. Bruckner, A. Marks, and B. Eskenazi (2006): “Ex-
ogenbous shocks to the human sex ratio: the case of September 11, 2001 in
New York City,” Human reproduction, 21(12), 3127–3131.
Chen, S., N. V. Loayza, and M. Reynal-Querol (2008): “The Aftermath
of Civil War,” The World Bank Economic Review, 22 (1), 63–85.
Coghlan, B., R. J. Brennan, P. Ngoy, D. Dofara, B. Otto,
M. Clements, and T. Stewart (2006): “Mortality in the Democratic Re-
public of Congo: a nationwide survey,” Lancet, 367, 44–51.
Congdon Fors, H., and O. Olsson (2004): “Congo: The Size of Predation,”
Journal of Peace Research, 41, 321–336.
35

Danish Epidemiology Science Centre (1999): “Nutritional status and
mortality of refugee and resident children in a non-camp setting during con-
flict: follow-up study in Guinea-Bissau,” British Medical Journal, 319(7214),
878–881.
Davis, D., and J. Kuritsky (2002): “Violent conflict and its impact on health
indicators in Sub-Saharan Africa, 1980 to 1997,” Paper presented at the an-
nual meeting of the International Studies Association, New Orleans, LA.
de Walque, D. (2005): “Selective Mortality During the Khmer Rouge Period
in Cambodia,” Population and Development Review, 31(2), 351–368.
Domingues, P., and T. Barre (2013): “The health consequences of the
Mozambican civil war: An anthropometric approach,” Economic Develop-
ment and Cultural Change, 61(4), 755–788.
Duflo, E. (2003): “Grandmothers and Granddaughters: Old-Age Pensions and
Intrahousehold Allocation in South Africa,” World Bank Economic Review,
17(1), 1–25.
(2012): “Women Empowerment and Economic Development,” Journal
of Economic Literature, 50(4), 1051–1079.
Eriksson, J. G., E. Kajantie, C. Osmond, K. Thornburg, and D. J.
Barker (2010): “Boys live dangerously in the womb,” American Journal of
Human Biology, 22(3), 330–335.
Fernandez, S., R. Medina, J. Britton, and A. Fogarty (2011): “The
36

association between living through a prolonged economic depression and the
male: female birth ratio. A longitudinal study from Cuba, 1960-2008,” Amer-
ican Journal of Epidemiology, 174(12), 1327–1331.
Gambino, T. (2011): “Democratic Republic of Congo,” in Background Case
Study to the World Development Report 2011: Conflict, Security and Devel-
opment, ed. by World Bank. Washington, DC.
Garenne, M. (2003): “Sex differences in health indicators among children in
African DHS surveys,” Journal of Biosocial Science, 35, 601–614.
Ghobarah, H. A., P. Huth, and B. Russett (2003): “Civil Wars Kill and
Maim People - Long After the Shooting Stops,” American Political Science
Review, 97 (2), 189–202.
Goma Epidemiology Group (1995): “Public health impact of Rwandan
refugee crisis: what happened in Goma Zaire, in July 1994?,” Lancet,
345(8946), 339–344.
Guha-Sapir, D., and O. D’Aoust (2010): “Demographic and health conse-
quences of civil conflict,” World development report 2011 - background paper,
World Bank.
Guha-Sapir, D., and W. G. van Panhuis (2004): “Conflict-related Mortal-
ity: An Analysis of 37 Datasets,” Disasters, 28 (4), 418–428.
Guha-Sapir, D., W. G. van Panhuis, O. Degomme, and V. Teran (2005):
37

“Civil Conflicts in Four African Countries: A Five-Year Review of Trends in
Nutrition and Mortality,” Epidemiologic Reviews, 27, 67–77.
Hernandez-Julian, R., H. Mansour, and C. Peters (2014): “The Effects
of Intrauterine Malnutrition on Birth and Fertility Outcomes: Evidence From
the 1974 Bangladesh Famine,” Demography, pp. 1–22.
Hsiang, S., M. Burke, and E. Miguel (2013): “Quantifying the Influence
of Climate on Human Conflict,” Science, 342(6151), 1235367.
Internal Displacement Monitoring Center (2011): “IDPs Need
Further Assistance in Context of Continued Attacks and Insecurity,”
Accessed March 2011. http://www.internal-displacement.org/sub-saharan-
africa/democratic-republic-of-the-congo/2011/idps-need-further-assistance-
in-context-of-continued-attacks-and-insecurity.
International Rescue Committee (2011): “IRC Study Reveals 31,000
Die Monthly in Congo Conflict and 3.8 Million Died in Past Six
Years. When Will the World Pay Attention?,” Accessed March 2011.
http://www.rescue.org/news/irc-study-reveals-31000-die-monthly-congo-
conflict-and-38-million-died-past-six-years-when-will-3538.
Jayachandran, S., and I. Kuziemko (2011): “Why do mothers breastfeed
girls less than boys? Evidence and Implications for Child Health in India,”
Quarterly Journal of Economics, 126(3), 1485–1538.
Jenkins, J. C., S. J. Scanlan, and L. Peterson (2007): “Military Famine,
38

Human Rights, and Child Hunger: A Cross-National Analysis, 1990-2000,”
The Journal of Conflict Resolution, 51 (6), 823–847.
Kiros, G., and D. Hogan (2001): “War, Famine and Excess Child Mortality
in Africa: The Role of Parental Education,” International Journal of Epi-
demiology, 30, 447–455.
Kraemer, S. (2000): “The fragile male,” British Medical Journal, 321, 1609–
1612.
Kudamatsu, M., T. Persson, and D. Stromberg (2012): “Weather and
Infant Mortality in Africa,” CEPR Discussion Papers 9222.
Mansoor, H., and D. Rees (2012): “Armed conflict and birth weight: Ev-
idence from the al-Aqsa Intifada,” Journal of Development Economics, 99,
190–199.
Matsuura, K., and C. Willmott (2009): “Terrestrial air tempera-
ture: 1900–2008 gridded monthly time series (version 2.01),” Available at:
http://climate.geog.udel.edu/.
Medecins sans frontieres (2003): “Mortality among displaced former
UNITA members and their families in Angola: a retrospective cluster sur-
vey,” British Medical Journal, 327(7416), 650–660.
Minoiu, C., and O. Shemyakina (2012): “Child health and conflict in Cote
d’Ivoire,” American Economic Review: Papers and Proceedings, 102(3), 294–
299.
39

Mizuno, R. (2000): “The male/female ratio of fetal deaths and births in
Japan,” Lancet, 356, 738–739.
Morduch, J. (2000): “Sibling Rivalry in Africa,” American Economic Review,
90(2), 405–409.
Mu, and Zhang (2011): “Why does the Great Chinese Famine affect the male
and female survivors differently? Mortality selection versus son preference,”
Economics and Human Biology, 9, 92–105.
Peterman, A., T. Palermo, and Bredenkamp (2011): “Estimates and
determinants of Sexual Violence Against Women in the Democratic Republic
of Congo,” American Journal of Public Health, 101(6), 1060–1067.
Prunier, G. (2009): Africa’s World Wars: Congo, the Rwandan Genocide, and
the Making of a Continental Catastrophe. Oxford University Press, Oxford.
Raleigh, C., A. Linke, H. Hegre, and J. Karlsen (2010): “Introducing
ACLED: An Armed Conflict Location and Event Dataset,” Journal of Peace
Research, 47(5), 651–660.
Restrepo, J. A., M. Spagat, and J. F. Vargas (2006): “Special Data
Feature; The Severity of the Colombian Conflict: Cross-Country Datasets
Versus New Micro-Data,” Journal of Peace Research, 43(1), 99–115.
Roseboom, T. J., J. H. P. van der Meulen, C. Osmond, D. J. P.
Barker, A. C. J. Ravelli, and O. P. Bleker (2001): “Adult survival
40

after prenatal exposure to Dutch famine 1944-45,” Paediatric and Perinatal
Epidemiology, 16, 220–225.
Ruel, M. T., and H. Alderman (2013): “Nutrition-sensitive interventions
and programmes: how can they help to accelerate progress in improving ma-
ternal and child nutrition?,” The Lancet, 382(9891), 536 – 551.
Sanchez de la Sierra, R. (2013): “On the Origin of States: Stationary
Bandits and Taxation in Eastern Congo,” SSRN Working Paper, Available
at: http://ssrn.com/abstract=2358701.
Shettles, L. (1961): “Conception and birth sex ratios,” Obstetrics and Gyne-
cology, 18, 122–130.
Singh, K., U. Karunakara, G. Burnham, and H. Kenneth (2005):
“Forced Migration and Under-five Mortality: A Comparison of Refugees and
Hosts in North-western Uganda and Southern Sudan,” European Journal of
Population, 21, 247–270.
Stearns, J. (2011): Dancing in the Glory of Monsters: The Collapse of the
Congo and the Great War of Africa. Public Affairs.
Strauss, J., and D. Thomas (1995): The Handbook of Development Eco-
nomicschap. Human Resources: Empirical Modeling of Household and Family
Decisions, pp. 64–83. Amsterdam: Elsevier.
Thomas, D. (1990): “Intra-household Resource Allocation: An Inferential Ap-
proach,” Journal of Human Resources, 25(4), 635–664.
41

(1994): “Like father, like son or like mother, like daughter: Parental
education and child health,” Journal of Human Resources, 29(4), 950–989.
Toole, M., S. Galson, and W. Brady (1993): “Are War and Public Health
Compatible?,” Lancet, 341, 1193–1196.
Trivers, R., and D. Willard (1973): “Natural selection of parental ability
to vary the sex ratio of offsprings,” Science, 179, 90.
Turner, T. (2007): The Congo Wars: Conflict, myth and reality. Zed Books.
Valente, C. (2013): “Civil conflict, gender-specific fetal loss, and selection:
A new test of the Trivers-Willard hypothesis,” Journal of Development Eco-
nomics, forthcoming.
Verpoorten, M. (2009): “Cattle Sales in war and Peacetime: a study of
Household Coping Rwanda, 1991-2001,” Journal of Development Economics,
188(1), 67–86.
(2012): “Detecting hidden violence: The spatial distribution of excess
mortality in Rwanda,” Political Geography, 31(1), 44–56.
Verwimp, P., and J. Van Bavel (2005): “Child Survival and Fertility of
Refugees in Rwanda,” European Journal of Population, 21, 271–290.
Vlassenroot, K., and T. Raeymaekers (2004): “The Politics of Rebellion
and Intervention in Ituri: The Emergence of a New Political Complex?,”
African Affairs, 103, 385–412.
42
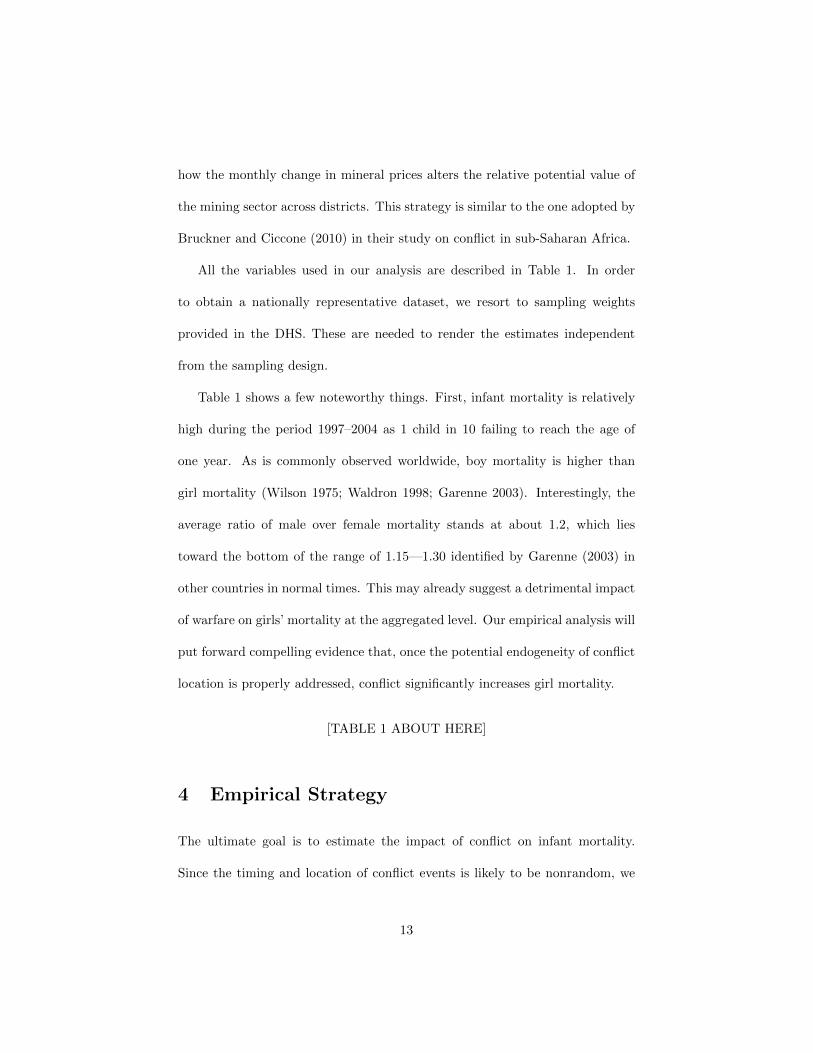
Waldron, I. (1998): Too Young to Die: Genes or Gender?chap. Sex differ-
ences in infant and early child mortality: major causes of death and possible
biological causes, pp. 64–83. United Nations, New York.
Wilson, E. (1975): Sociobiology: The New Synthesis. Harvard University
Press, Cambridge.
World Health Organization (2014): Public health risk assessment and
interventions. Conflict and Humanitarian Crisis, Republic of South Sudan.
WHO, Geneva.
43

Notes
1The higher vulnerability of boys in utero has been established for other
shocks such as famine (Rosebloom et al. 2001; Almond et al. 2008; Hernandez-
Julian et al. 2014), mother’s health deficiencies (Eriksson et al. 2010) or a
parental death (Black et al. 2014).
2DHS datasets provide the number of years a household has been living in the
village where the interview took place. Information about previous location is,
however, not available, which means that we do not know whether households
who migrated remained in the same district. In Section 5 we show that our
results are robust to the inclusion of children belonging to nonresident house-
holds and to randomly reallocating migrant mothers to districts of origin using
a uniform distribution.
3Because only surviving women are interviewed, we are likely to underesti-
mate the impact of conflict on child mortality. Nonetheless, there is no reason
to believe that this source of sample selection will affect gender imbalances in
child mortality.
4The geological service of the African Museum of Tervuren, Belgium, pro-
vided the mineral occurrences map of DRC.
5Traditional robust two-stage least squares standard errors produced quali-
tatively similar results.
6Infant mortality for this period is reconstructed retrospectively from the
DHS.
7Reducing the bandwidth of this estimator from 0.80 to 0.20, and hence
44

producing less smoothing by focusing on closer points in the local regressions,
leaves the general trend unchanged.
8These results hold if we use quadratic instead of linear trends.
9Figure A.1 in appendix further supports the exclusion restriction. It graph-
ically shows the coefficients obtained by regressing girl mortality on the price
index over a moving window of 96 months. It is striking to see how the co-
efficients are consistently around zero in the preconflict period. The negative
response of girls’ mortality to mineral price shocks is particularly strong during
the period of investigation. As shown on the right panel, the relationship is
even stronger in highly conflictive districts.
10Given the lack of information about the district a migrant household resided
when migrating, we had little choice but to perform a simulation exercise. We
run 1000 two-stage least-squares regressions (on boy and girl mortality) where
each migrant mother is randomly allocated to one of the 38 districts, follow-
ing a uniform distribution (with equal probability to migrate in any district).
Standard errors are clustered at the village level by artificially, creating a new
village for the randomly allocated migrants within each district.
11Another possibility would be that girls have been systematically targeted
by armed violence. Even though gender-based (sexual) violence has been a
dramatic phenomenon in eastern DRC (Peterman, Palermo, and Bredenkamp
2011), since we are dealing with infants, this is not likely to be the major
mechanism explaining gender imbalances.
12The appendix reports the full tables for the interested reader.
45

13Controlling for the number of siblings similar to Akresh and Edmonds (2011)
or using a dummy for having at least one brother or one sister does not change
the results.
14Results not reported in the paper; available upon request.
46

Table 1: Descriptive statistics (1997–2004)
Variable N Mean Std. dev. Min. Max.
Panel A: Cross-section datasetInfant mortality 10,397 0.107 0.310 0 1Boy mortality 5,242 0.117 0.321 0 1Girl mortality 5,155 0.098 0.297 0 1Number of conflict events 10,397 7.896 14.467 0 123Exposure to conflict (# months) 10,397 2.276 2.820 0 12Price index 12 m 10,397 492.04 624.06 0 3,002.6Twin 10,397 0.017 0.131 0 11st child 10,397 0.195 0.396 0 1# brothers alive 10,397 1.209 1.457 0 8# sisters alive 10,397 1.175 1.430 0 8Exposure to malaria 10,397 7.4 2.991 0 11Rain 25y (dev) 10,397 -0.239 0.990 -3.477 5.149Temp 25y (dev) 10,397 0.737 1.083 -1.546 5.397Mother —no educ. 10,397 0.251 0.434 0 1Mother —primary 10,397 0.424 0.494 0 1Mother —secondary 10,397 0.315 0.464 0 1Wealth index 10,397 -1,655.5 97,422.5 -107,521 341,565Female-headed HH 10,397 0.139 0.346 0 1Household size 10,397 7.336 3.063 1 28
Panel B: Panel dataset (district-month)Infant mortality rate (12 m) 2,876 0.106 0.221 0 1Boy mortality rate (12 m) 2,876 0.090 0.234 0 1Girl mortality rate (12 m) 2,876 0.076 0.218 0 1Number of conflict events 2,876 5.639 12.327 0 123Exposure to conflict 2,876 1.769 2.538 0 12Price index 12 m 2,876 417.351 585.228 0 3,002.567Months of malaria exposure (avg) 2,876 7.699 2.666 0 11Rain 25 y (avg dev) 2,876 -0.213 0.944 -3.239 5.149Temp 25 y (avg dev) 2,876 0.826 1.096 -1.523 5.259Sex ratio at birth 2,598 0.511 0.350 0 1Number of conflict in utero 2,598 4.412 10.079 0 103Exposure to conflict in utero 2,598 1.353 1.951 0 9Price index 9m in utero 2,598 296.009 412.647 0 1,924.32Notes: Correction for sampling weights. HH=household.
47

Table 2: Placebo test of exclusion restriction
p-value less than: 0.1 0.05 0.01 # regressions
No trends 9 0 0 95Linear trends 0 0 0 95Notes: The table reports the number of times wefound a significant reduced-form relationship be-tween our price index and infant mortality for theprewar period 1980–1996 using a sliding window of96 months for each regression.
48

Table 3: Panel regressions on the impact of mineral prices on conflict
Dependent variable: Monthly conflict events(1) (2) (3) (4) (5) (6)All 19 highest C 19 highest P TA districts 5 districts Drop (5) districts
Panel A: No trendPrice index -.00922*** -.0107*** -.0102*** -.0125*** -.0226*** -.00498*
(.00224) (.00271) (.00297) (.00234) (.0033) (.00262)
Price index - No TA -.00892*** -.0106*** -.00902*** -.0225* -.0467* -.00582**(.00281) (.00341) (.00246) (.0118) (.0205) (.00245)
TA price index -.0106** -.012** -.0129** -.0114** -.0145 .151(.0044) (.00509) (.00493) (.00471) (.00931) (.119)
Price index 12 -.012*** -.0154*** -.0151*** -.0218*** -.0415** -.00406(.00391) (.0048) (.00496) (.00393) (.0108) (.00251)
Price index 12 - No TA -.00618** -.00874** -.00896** -.00755 -.039* -.00441*(.00256) (.00343) (.00312) (.0107) (.0166) (.00251)
TA price index 12 -.0298*** -.0303*** -.0322*** -.0309*** -.0445** .144(.00554) (.00619) (.00596) (.00591) (.0124) (.118)
Panel B: Linear trendPrice index -.0103*** -.0116*** -.0105*** -.0125*** -.0171** -.0073**
(.00198) (.00233) (.00283) (.0022) (.00543) (.00331)
Price index - No TA -.0133*** -.0154*** -.011*** -.0328** -.0362 -.00866***(.00373) (.0043) (.00333) (.0143) (.0332) (.0026)
TA price index -.00906** -.0103** -.0113** -.00983** -.0115 .151(.00406) (.00476) (.0046) (.00437) (.00863) (.12)
Price index 12 -.0167*** -.0189*** -.0177*** -.0251*** -.0292 -.00638**(.00358) (.00315) (.00353) (.0036) (.0144) (.00298)
Price index 12 - No TA -.0124*** -.0156*** -.0116*** -.0286*** -.025 -.00719**(.00395) (.00424) (.00394) (.00939) (.0251) (.00276)
TA price index 12 -.0245*** -.0244*** -.0266*** -.0256*** -.0362*** .152(.00298) (.00371) (.00344) (.00339) (.00759) (.117)
N 3648 1824 1824 2112 480 3168
District FE � � � � � �Month-year FE � � � � � �Notes: *** p < 0.01, ** p < 0.05, * p < 0.1; FE = fixed effects; TA = tantalum.
49

Table 4: First-step specifications
Conflict UCDP UCDPDependent variable: Conflict events exposure events fatalities
(1) (2) (3) (4) (5)
Price index 12 -0.0120*** -0.0167*** -0.0014*(.0039) (.0036) (.0007)
N 3,648 3,648 3,648
Linear trend �District FE � � � � �Month-year FE � � � � �Notes: *** p < 0.01, ** p < 0.05, * p < 0.1; FE = fixed effects.
50

Table 5: Regressions of intensity of conflict on child mortality F TESTS TOBE REPLACED
Dependent variable: Mortality rate at 12 monthsAll Boys Girls
OLS 2SLS OLS 2SLS OLS 2SLS(1) (2) (3) (4) (5) (6)
Panel A:Conflict events -0.0007 0.0008 -0.0017*** -0.0041 0.0002 0.0051**
(0.0005) (0.0021) (0.0006) (0.0032) (0.0008) (0.0023)
F-stat of IV 38.49*** 28.16*** 38.64***
Panel B:Conflict events -0.0010* 0.0008 -0.0018*** -0.0043 -0.0002 0.0055**
(0.0006) (0.0022) (0.0007) (0.0031) (0.0008) (0.0024)
Twin 0.1797*** 0.1801*** 0.1443*** 0.1430*** 0.2362*** 0.2342***(0.0406) (0.0403) (0.0474) (0.0466) (0.0682) (0.0682)
1st child 0.0138 0.0148 0.0228 0.0210 0.0029 0.0063(0.0118) (0.0116) (0.0199) (0.0196) (0.0176) (0.0174)
# brothers alive -0.0006 -0.0002 0.0055 0.0049 -0.0062 -0.0052(0.0040) (0.0040) (0.0046) (0.0046) (0.0057) (0.0057)
# sisters alive 0.0082 0.0082 0.0049 0.0047 0.0099* 0.0092*(0.0051) (0.0051) (0.0066) (0.0064) (0.0052) (0.0050)
Malaria exposure 0.0036 0.0033 0.0035 0.0040 0.0031 0.0020(0.0028) (0.0027) (0.0034) (0.0035) (0.0025) (0.0023)
Rain 25y (dev) 0.0125* 0.0051 0.0079 0.0181 0.0148* -0.0087(0.0064) (0.0108) (0.0091) (0.0147) (0.0078) (0.0130)
Temp 25y (dev) -0.0073 -0.0096 -0.0067 -0.0032 -0.0048 -0.0114(0.0065) (0.0068) (0.0088) (0.0092) (0.0085) (0.0086)
Mother—no educ. 0.0589* 0.0583* 0.0299 0.0316 0.0856** 0.0845**(0.0329) (0.0327) (0.0419) (0.0416) (0.0385) (0.0387)
Mother—primary 0.0234 0.0227 0.0116 0.0137 0.0326 0.0329(0.0280) (0.0278) (0.0386) (0.0381) (0.0337) (0.0343)
Mother—secondary -0.0023 -0.0029 -0.0310 -0.0286 0.0205 0.0200(0.0268) (0.0266) (0.0377) (0.0374) (0.0293) (0.0300)
Wealth index -0.0000 -0.0000 -0.0000* -0.0000* -0.0000 -0.0000(0.0000) (0.0000) (0.0000) (0.0000) (0.0000) (0.0000)
HH size -0.0079*** -0.0078*** -0.0091*** -0.0091*** -0.0067*** -0.0065***(0.0021) (0.0021) (0.0030) (0.0029) (0.0017) (0.0017)
Female-headed HH -0.0186 -0.0187 -0.0282* -0.0273** -0.0122 -0.0109(0.0123) (0.0122) (0.0144) (0.0138) (0.0222) (0.0214)
F-stat of IV 46.67*** 33.94*** 51.99***
District & month-year FE � � � � � �N 10,397 10,397 5,242 5,242 5,155 5,155Notes: *** p < 0.01, ** p < 0.05, * p < 0.1; correction for sampling weights; sample of residentsonly; standard errors clustered at the village level; dummies for ethnic groups (10) and religion (9)are included in all regressions of Panel B. 2SLS = two-stage least squares; FE = fixed effects; HH =household; IV = instrumental variables; OLS = ordinary least squares.
51

Table 6: IV regressions of conflict on girl mortality—alternative specifications CHECK F TESTS
Dependent variable: Girls’ mortality at 12 monthsConflict UCDP UCDP
Conflict events exposure events fatalities(1) (2) (3) (4) (5) (6)
Panel A: No controlsConflict 0.0058** 0.0033* 0.0022** 0.0426** 0.0967** 0.0008*
(0.0024) (0.0018) (0.0010) (0.0196) (0.0491) (0.0005)
F-stat of IV 125.7*** 31.81*** 115.21*** 21.36***
Panel B: Full set of controlsConflict 0.0056** 0.0034** 0.0024** 0.0475** 0.1058* 0.0009*
(0.0027) (0.0019) (0.0011) (0.0212) (0.0555) (0.0005)
F-stat of IV 112.03*** 39.53*** 110.47*** 23.04***
Linear trend �Includes nonresidents � �Includes DHS 2013 �District & month-year FE � � � � � �N 5,155 6,680 13,787 5,155 5,056 5,056Notes: *** p < 0.01, ** p < 0.05, * p < 0.1; standard errors clustered at the village level; allcolumns report the second stage results of a two-stage least squares procedure; correction forsampling weights; full set of controls in Panel B as in Panel B of Table 5; FE = fixed effects;IV = instrumental variables; DHS = Demographic and Health Surveys.
52

Table 7: Regressions of conflict on infant mortality—mother fixed effects CHECK F-TESTS
Dependent variable: Mortality rate at 12 monthsAll Boys Girls
OLS 2SLS OLS 2SLS OLS 2SLS(1) (2) (3) (4) (5) (6)
Panel A:Conflict events -0.0010 -0.0005 -0.0014* -0.0037 -0.001 0.0040**
[-0.003, 0.000] [-0.005, 0.004] [-0.003, 0.000] [-0.011, 0.004] [-0.002, 0.001] [ 0.000, 0.008]
F-stat of IV 42.2*** 32.6*** 34.1***
Panel B:Conflict events -0.0014** 0.0001 -0.0015** -0.0040 -0.0010 0.0060**
[-0.003, -0.000] [-0.006, 0.006] [-0.003, -0.000] [-0.011, 0.003] [-0.003, 0.001] [0.000, 0.011]
Twin 0.115** 0.116** 0.109 0.109 0.137 0.139(0.00993 - 0.221) (0.00102 - 0.230) (-0.0247 - 0.243) (-0.0292 - 0.248) (-0.0542 - 0.329) (-0.0501 - 0.327)
1st child -0.00738 -0.00771 -0.00307 -0.00240 -0.0243 -0.0241(-0.0556 - 0.0408) (-0.0559 - 0.0405) (-0.0450 - 0.0389) (-0.0805 - 0.0757) (-0.0796 - 0.0309) (-0.0886 - 0.0404)
# brothers 0.0704*** 0.0715*** 0.0960*** 0.0946*** 0.0207* 0.0255*(0.0704 - 0.0704) (0.0715 - 0.0715) (0.0960 - 0.0960) (0.0946 - 0.0946) (-0.00247 - 0.0438) (-0.000221 - 0.0513)
# sisters 0.0459*** 0.0463*** -0.00151 -0.00247 0.0635*** 0.0653***(0.0459 - 0.0459) (0.0463 - 0.0463) (-0.0487 - 0.0457) (-0.0296 - 0.0246) (0.0635 - 0.0635) (0.0653 - 0.0653)
Malaria index 0.00740 0.00596 0.00413 0.00630 0.000701 -0.00593(-0.00463 - 0.0194) (-0.00713 - 0.0191) (-0.0107 - 0.0189) (-0.0106 - 0.0232) (-0.0100 - 0.0114) (-0.0225 - 0.0106)
Rain 25y 0.0170** 0.0101 0.00241 0.0128 0.0190* -0.0107(0.000776 - 0.0332) (-0.0148 - 0.0350) (-0.0144 - 0.0192) (-0.0156 - 0.0413) (-0.00255 - 0.0406) (-0.0426 - 0.0212)
Temp. 25y -0.0122 -0.0139 -0.0140 -0.0116 0.00285 -0.00447(-0.0305 - 0.00619) (-0.0311 - 0.00334) (-0.0378 - 0.00977) (-0.0333 - 0.0102) (-0.0125 - 0.0182) (-0.0219 - 0.0130)
F-stat of IV 47.6*** 36.6*** 37.7***
Mother FE � � � � � �Month-year FE � � � � � �N 8,869 8,869 4,460 4,460 4,409 4,409Notes: *** p < 0.01, ** p < 0.05, * p < 0.1; correction for sampling weights; sample of residents only; confidence intervalsproduced by wild bootstrap (percentile-t method). 2SLS = two-stage least squares; FE = fixed effects; IV = instrumentalvariables; OLS = ordinary least squares.
53

Table 8: Alternative IV specifications with mother fixed effects
Dependent variable: Girls’ mortality at 12 monthsConflict UCDP UCDP
Conflict events exposure events fatalities(1) (2) (3) (4) (5) (6)
Panel A: No controlsConflict 0.006** 0.004* 0.049** 0.049**
[0.001, 0.010] [0.000, 0.008] [0.014, 0.083] [0.014, 0.083]
F-stat of IV 34.2*** 24.9*** 27.2*** 27.4***
Panel B: Full set of controlsConflict 0.006** 0.005** 0.052** 0.051**
[0.001, 0.010] [0.000, 0.009] [0.006, 0.088] [0.006, 0.088]
F-stat of IV 37.8*** 27.4*** 28.2*** 28.4***
Linear trend �Includes nonresidents � �Includes DHS 2013 �Mother FE � � � � � �Month-year FE � � � � � �N 5,155 6,680 5,155 5,155Notes: *** p < 0.01, ** p < 0.05, * p < 0.1; confidence intervals produced by wild bootstrap (percentile-t method);all columns report the second stage results of a two-stage least squares procedure; correction for sampling weights;full set of controls in Panel B as in Panel B of Table 5; FE = fixed effects; IV = instrumental variables; DHS =Demographic and Health Surveys.
54

Table 9: Panel regressions on the impact of conflict on child mortality
Dependent variable: Mortality rate at 12 monthsAll Boys Girls
OLS 2SLS OLS 2SLS OLS 2SLS(1) (2) (3) (4) (5) (6)
Panel A: No controls
Conflict events -0.0008* 0.0035 -0.0008 0.0005 -0.0001 0.0058**(0.0005) (0.0033) (0.0005) (0.0038) (0.0006) (0.0027)
F-stat of IV 52.09*** 52.09*** 52.09***
Panel B: Full set of controls
Conflict events -0.0009* 0.0036 -0.0009* 0.0015 -0.0000 0.0051**(0.0005) (0.0030) (0.0005) (0.0036) (0.0006) (0.0025)
F-stat of IV 62.91*** 62.91*** 62.91***
District & month-year FE � � � � � �N 2,876 2,876 2,876 2,876 2,876 2,876Notes: *** p < 0.01, ** p < 0.05, * p < 0.1; sample of residents only; standard errors clusteredat the district level; full set of controls in Panels B and D. 2SLS = two-stage least squares; FE= fixed effects; IV = instrumental variables; OLS = ordinary least squares.
55

Table 10: IV regressions of conflict on girl mortality—alternative panel specifications
Dependent variable: Girls’ mortality at 12 monthsConflict UCDP UCDP
Conflict events exposure events fatalities(1) (2) (3) (4) (5) (6)
Panel A: No controlsConflict
F stat of IV
Panel B: Full set of controlsConflict
F stat of IV
Linear trend �Includes nonresidents � �Includes DHS 2013 �District & month-year FE � � � � � �N 5,155 6,680 5,155 5,155Notes: *** p < 0.01, ** p < 0.05, * p < 0.1; all columns report the second stage results ofa two-stage least squares procedure; sample of residents only; standard errors clustered atthe district level; FE = fixed effects; IV = instrumental variables; DHS = Demographicand Health Surveys.
56

Table 11: IV regressions of conflict on girl mortality—behavioral factors
Dependent variable: Girls’ mortality at 12 monthsConflict UCDP UCDP
Conflict events exposure events fatalities(1) (2) (3) (4) (5)
Panel A: Female-headed HHConflict 0.0056** 0.0062** 0.0447** 0.0504**
(0.0024) (0.0028) (0.0198) (0.0194)Conflict*Female-Headed HH -0.0008 -0.0032 0.0055 -0.0124
(0.0031) (0.0033) (0.0208) (0.0194)F-stat of IV 21.65*** 53.97*** 12.48*** 21.98***
Panel B: WidowConflict 0.0054** 0.0057** 0.0443** 0.0482**
(0.0024) (0.0028) (0.0201) (0.0239)Conflict*Widow 0.0011 0.0005 0.0080 0.0043
(0.0028) (0.0028) (0.0173) (0.0164)F-stat of IV 21.15*** 55.83*** 11.54*** 22.42***
Panel C: Number of brothersConflict 0.0062** 0.0064** 0.0479** 0.0508**
(0.0029) (0.0032) (0.0217) (0.0255)Conflict*# brothers -0.0007 -0.0006 -0.0025 -0.0020
(0.0010) (0.0010) (0.0046) (0.0052)F-stat of IV 22.19*** 59.77*** 11.54*** 22.61***
Panel D: Number of sistersConflict 0.0058** 0.0061* 0.0470** 0.0508*
(0.0027) (0.0032) (0.0212) (0.0260)Conflict*# sisters -0.0002 -0.0002 -0.0012 -0.0014
(0.0008) (0.0009) (0.0037) (0.0038)F-stat of IV 22.38*** 68.24*** 11.53*** 23.29***
Panel E: Son preferenceConflict 0.0061** 0.0068** 0.0478** 0.0537**
(0.0030) (0.0032) (0.0231) (0.0257)Conflict*son pref. -0.0008 -0.0009 -0.0044 -0.0044
(0.0006) (0.0007) (0.0030) (0.0032)F-stat of IV 30.46*** 72.89*** 14.48*** 25.88***
Linear trend � �District & month-year FE � � � � �Full set of controls � � � � �Notes: *** p < 0.01, ** p < 0.05, * p < 0.1; correction for sampling weights; allcolumns report the second stage results of a two-stage least squares procedure; sampleof residents only; standard errors clustered at the village level; FE = fixed effects; HH= household; IV = instrumental variables.
57

Table 12: Regressions of conflict on girl mortality—biological factors
Dependent variable: Sex ratio (boys/total births)Conflict UCDP UCDP
Conflict events exposure events fatalities(1) (2) (3) (4) (5)
Panel A: Sex ratio at birth
Conflict in utero -0.0068 -0.0071* -0.0540 -0.0553*(0.0041) (0.0041) (0.0341) (0.0331)
F-stat of IV 26.07*** 32.99*** 43.16*** 49.56***N 2,598 2,598 2,598 2,598
Panel B: Sex ratio at 12 months—separate impacts in utero and first year
Conflict in utero -0.0058 -0.0068 -0.0444 -0.0455(0.0063) (0.0061) (0.0343) (0.0301)
Conflict 0.0007 0.0019 -0.0014 0.0045(0.0074) (0.0073) (0.0362) (0.0364)
F-stat of IV (in utero) 29.37*** 20.87*** 21.20*** 30.54***F-stat of IV (Conflict) 13.84*** 35.25*** 20.85*** 27.71***N 2,598 2,598 2,598 2,598
Panel C: Sex ratio at 12 months—total impact in utero and first year
Conflict in utero & 12 months -0.0056** -0.0052** -0.0568* -0.0536**(0.0026) (0.0025) (0.0292) (0.0273)
F-stat of IV 29.69*** 39.41*** 15.05*** 20.41***N 2,291 2,291 2,291 2,291
Linear trend � �District & month-year FE � � � � �Notes: *** p < 0.01, ** p < 0.05, * p < 0.1; correction for sampling weights; sampleof residents only; standard errors clustered at the village level; all columns report thesecond stage results of a two-stage least squares procedure; FE = fixed effects; IV =instrumental variables.
58

Figure 1: Map of conflict events in Democratic Republic of Congo, 1997–2004
59
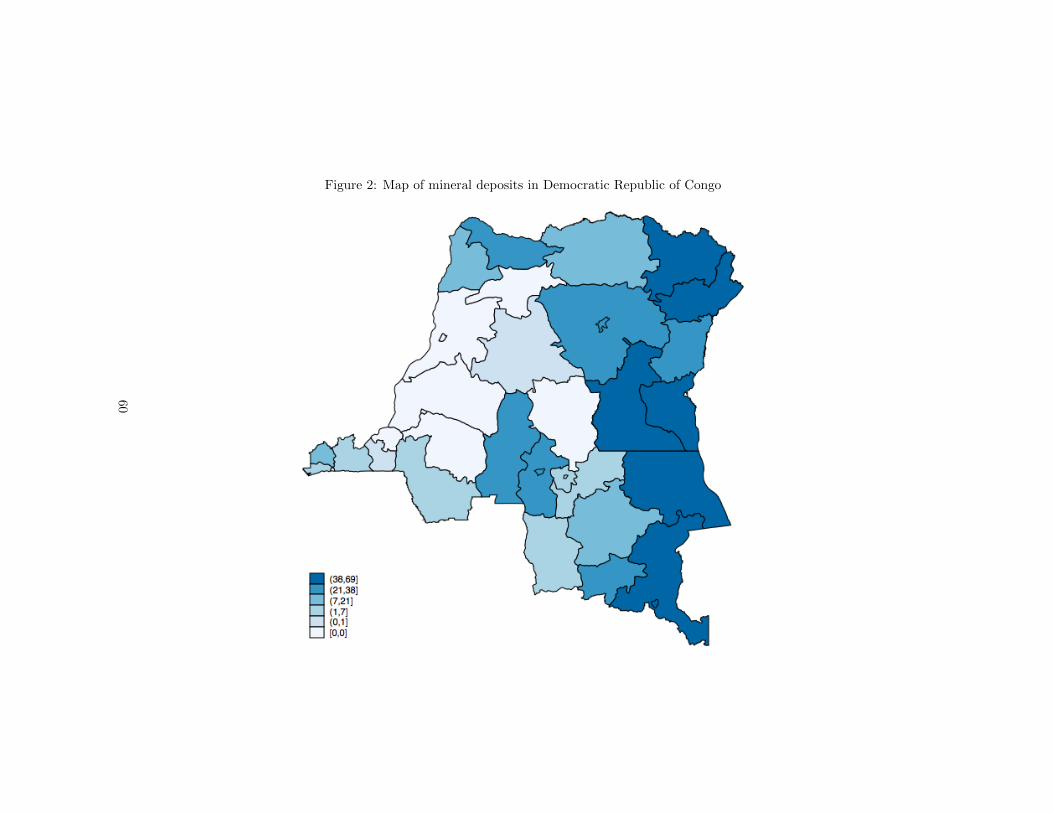
Figure 2: Map of mineral deposits in Democratic Republic of Congo
60

Figure 3: First-stage regressions on extended periods
61

Figure 4: Lowess estimation of first stage
62

Appendix
Table A.1: Regressions of conflict on girl mortality—interaction with female-headed HH
Sample of residents Whole sampleOLS 2SLS 2SLS 2SLS 2SLS 2SLS[1] [2] [3] [4] [5] [6]
Panel A:Conflict events -0.0000(0.0008) 0.0052 **(0.0023) 0.0061 **(0.0024) 0.0035 * (0.0018)Conflict*female-headed HH 0.0011 (0.0018)-0.0003 (0.0033)-0.0025 (0.0035) -0.0014 (0.0029)Female-headed HH -0.0006(0.0240) 0.0093 (0.0347) 0.0171 (0.0351)-0.0055 (0.0520) 0.0201 (0.0512) 0.0212 (0.0329)Exposure to conflict 0.0427 **(0.0194) 0.0480 **(0.0196)Exposure*female-headed HH 0.0073 (0.0207)-0.0090 (0.0205)F-stat of IV 20.19*** 64.18*** 12.25*** 10.34*** 17.24***District and month-year FE yes yes yes yes yes yesLinear trend - - yes - yes -N 5,155 5,155 5,155 5,155 5,155 6,080Panel B:Conflict events 0.0000 (0.0008) 0.0056 **(0.0024) 0.0062 **(0.0028) 0.0039 **(0.0019)Conflict*female-headed HH 0.0008 (0.0017)-0.0008 (0.0031)-0.0032 (0.0033) -0.0019 (0.0028)Female-headed HH -0.0172(0.0242)-0.0059 (0.0350) 0.0024 (0.0351)-0.0205 (0.0533) 0.0070 (0.0514) 0.0062 (0.0335)Exposure to conflict 0.0447 **(0.0198) 0.0504 **(0.0239)Exposure*female-headed HH 0.0055 (0.0208)-0.0124 (0.0194)F-stat of IV 21.65*** 53.97*** 12.48*** 21.98*** 20.07***District and month-year FE yes yes yes yes yes yesControl yes yes yes yes yes yesEthnicity (10) and religion (9) yes yes yes yes yes yesLinear trend - - yes - yes -N 5,155 5,155 5,155 5,155 5,155 6,080Notes: Correction for sampling weights. Standard errors clustered at the village level.
63

Table A.2: Regressions of conflict on girl mortality—interaction with mother’s being a widow
Sample of residents Whole sampleOLS 2SLS 2SLS 2SLS 2SLS 2SLS[1] [2] [3] [4] [5] [6]
Panel A:Conflict events -0.0001(0.0007)0.0050**(0.0024)0.0058**(0.0024) 0.0034 * (0.0018)Conflict*widow 0.0017 (0.0018)0.0009 (0.0031)0.0004 (0.0030) -0.0003 (0.0025)Widow 0.0048 (0.0265)0.0073 (0.0334)0.0088 (0.0334) 0.0036 (0.0435)0.0082 (0.0431) 0.0249 (0.0332)Exposure to conflict 0.0423 **(0.0197)0.0467**(0.0199)Exposure*widow 0.0062 (0.0184)0.0037 (0.0175)F-stat of IV 19.31*** 63.65*** 10.39*** 33.08*** 16.86***District and month-year FE yes yes yes yes yes yesLinear trend - - yes - yes -N 5,155 5,155 5,155 5,155 5,155 6,080Panel B:Conflict events -0.0001(0.0008)0.0054**(0.0024)0.0057**(0.0028) 0.0038 **(0.0019)Conflict*widow 0.0016 (0.0018)0.0011 (0.0028)0.0005 (0.0028) -0.0003 (0.0025)Widow 0.0042 (0.0252)0.0017 (0.0290)0.0092 (0.0293)-0.0037 (0.0387)0.0102 (0.0382) 0.0215 (0.0314)Exposure to conflict 0.0443 **(0.0201)0.0482**(0.0239)Exposure*widow 0.0080 (0.0173)0.0043 (0.0164)F-stat of IV 21.15*** 55.83*** 11.54*** 22.42*** 20.12***District and month-year FE yes yes yes yes yes yesControl yes yes yes yes yes yesEthnicity (10) and religion (9) yes yes yes yes yes yesLinear trend - - yes - yes -N 5,155 5,155 5,155 5,155 5,155 6,080Notes: Correction for sampling weights. Standard errors clustered at the village level.
64

Table A.3: Regressions of conflict on girl mortality—interaction with number of brothers
Sample of residents Whole sampleOLS 2SLS 2SLS 2SLS 2SLS 2SLS[1] [2] [3] [4] [5] [6]
Panel A:Conflict events 0.0005 (0.0009) 0.0061 **(0.0028) 0.0065 **(0.0029) 0.0043 **(0.0022)Conflict*# brothers -0.0002(0.0003)-0.0009 (0.0009)-0.0008 (0.0010) -0.0009 (0.0008)# brothers 0.0013 (0.0045) 0.0054 (0.0074) 0.0042 (0.0074) 0.0072 (0.0105) 0.0060 (0.0109) 0.0060 (0.0067)Exposure to conflict 0.0468 **(0.0214) 0.0498 **(0.0214)Exposure*# brothers -0.0036 (0.0047)-0.0031 (0.0050)F-stat of IV 19.52*** 67.89*** 10.45*** 33.43*** 16.68***District and month-year FE yes yes yes yes yes yesLinear trend - - yes - yes -N 5,155 5,155 5,155 5,155 5,155 6,080Panel B:Conflict events 0.0004 (0.0010) 0.0062 **(0.0029) 0.0064 **(0.0032) 0.0045 **(0.0023)Conflict*# brothers -0.0002(0.0003)-0.0007 (0.0010)-0.0006 (0.0010) -0.0006 (0.0008)# brothers 0.0022 (0.0049) 0.0056 (0.0075) 0.0046 (0.0078) 0.0066 (0.0104) 0.0053 (0.0111) 0.0046 (0.0067)Exposure to conflict 0.0479 **(0.0217) 0.0508 **(0.0255)Exposure*# brothers -0.0025 (0.0046)-0.0020 (0.0052)F-stat of IV 22.19*** 59.77*** 11.54*** 22.61*** 20.05***District and month-year FE yes yes yes yes yes yesControl yes yes yes yes yes yesEthnicity (10) and religion (9) yes yes yes yes yes yesLinear trend - - yes - yes -N 5,155 5,155 5,155 5,155 5,155 6,080Notes: Correction for sampling weights. Standard errors clustered at the village level.
65

Table A.4: Regressions of conflict on girl mortality—interaction with number of sisters
Sample of residents Whole sampleOLS 2SLS 2SLS 2SLS 2SLS 2SLS[1] [2] [3] [4] [5] [6]
Panel A:Conflict events 0.0004 (0.0009) 0.0055 **(0.0026) 0.0061 **(0.0029) 0.0036 *(0.0020)Conflict*# sisters -0.0002(0.0003)-0.0003 (0.0009)-0.0002 (0.0009) -0.0002 (0.0008)# sisters 0.0033 (0.0045) 0.0042 (0.0074) 0.0044 (0.0072) 0.0056 (0.0097) 0.0066 (0.0097) 0.0051 (0.0072)Exposure to conflict 0.0453 **(0.0208) 0.0491 **(0.0220)Exposure*# sisters -0.0014 (0.0039)-0.0016 (0.0039)F-stat of IV 20.33*** 73.90*** 10.37*** 33.82*** 18.92***District and month-year FE yes yes yes yes yes yesLinear trend - - yes - yes -N 5,155 5,155 5,155 5,155 5,155 6,080Panel B:Conflict events 0.0003 (0.0010) 0.0058 **(0.0027) 0.0061 * (0.0032) 0.0039 *(0.0021)Conflict*# sisters -0.0001(0.0003)-0.0002 (0.0008)-0.0002 (0.0009) -0.0001 (0.0008)# sisters 0.0080 (0.0051) 0.0090 (0.0076) 0.0100 (0.0077) 0.0102 (0.0097) 0.0122 (0.0102) 0.0087 (0.0072)Exposure to conflict 0.0470 **(0.0212) 0.0508 * (0.0260)Exposure*# sisters -0.0012 (0.0037)-0.0014 (0.0038)F-stat of IV 22.38*** 68.24*** 11.53*** 23.29*** 23.83***District and month-year FE yes yes yes yes yes yesControl yes yes yes yes yes yesEthnicity (10) and religion (9) yes yes yes yes yes yesLinear trend - - yes - yes -N 5,155 5,155 5,155 5,155 5,155 6,080Notes: Correction for sampling weights. Standard errors clustered at the village level.
66

Table A.5: Regressions of conflict on girl mortality—interaction with a proxy for son preference
Sample of residents Whole sampleOLS 2SLS 2SLS 2SLS 2SLS 2SLS[1] [2] [3] [4] [5] [6]
Panel A:Conflict events 0.0004 (0.0007) 0.0054 * (0.0028) 0.0064 **(0.0029) 0.0038 * (0.0021)Conflict*son pref. -0.0000(0.0002)-0.0008 (0.0007)-0.0008 (0.0007) -0.0007 (0.0006)Son preference 0.0023 (0.0031) 0.0062 (0.0054) 0.0061 (0.0055) 0.0096 (0.0074) 0.0095 (0.0077) 0.0067 (0.0049)Exposure to conflict 0.0422 * (0.0218) 0.0477 **(0.0213)Exposure*son pref. -0.0043 (0.0032)-0.0043 (0.0034)F-stat of IV 29.58*** 81.44*** 13.90*** 35.83*** 32.58***District and month-year FE yes yes yes yes yes yesLinear trend - - yes - yes -N 4,726 4,726 4,726 4,726 4,726 5,556Panel B:Conflict events 0.0004 (0.0007) 0.0061 **(0.0030) 0.0068 **(0.0032) 0.0044 **(0.0022)Conflict*son pref. 0.0000 (0.0002)-0.0008 (0.0006)-0.0009 (0.0007) -0.0008 (0.0005)Son preference 0.0017 (0.0041) 0.0053 (0.0058) 0.0052 (0.0060) 0.0082 (0.0075) 0.0083 (0.0079) 0.0064 (0.0054)Exposure to conflict 0.0478 **(0.0231) 0.0537 **(0.0257)Exposure*son pref. -0.0044 (0.0030)-0.0044 (0.0032)F-stat of IV 30.46*** 72.89*** 14.48*** 25.88*** 35.19***District and month-year FE yes yes yes yes yes yesEthnicity (10) and religion (9) yes yes yes yes yes yesLinear trend - - yes - yes -N 4,726 4,726 4,726 4,726 4,726 5,556Notes: Correction for sampling weights. Standard errors clustered at the village level.
67

Figure A.1: Placebo test on girls sample
68
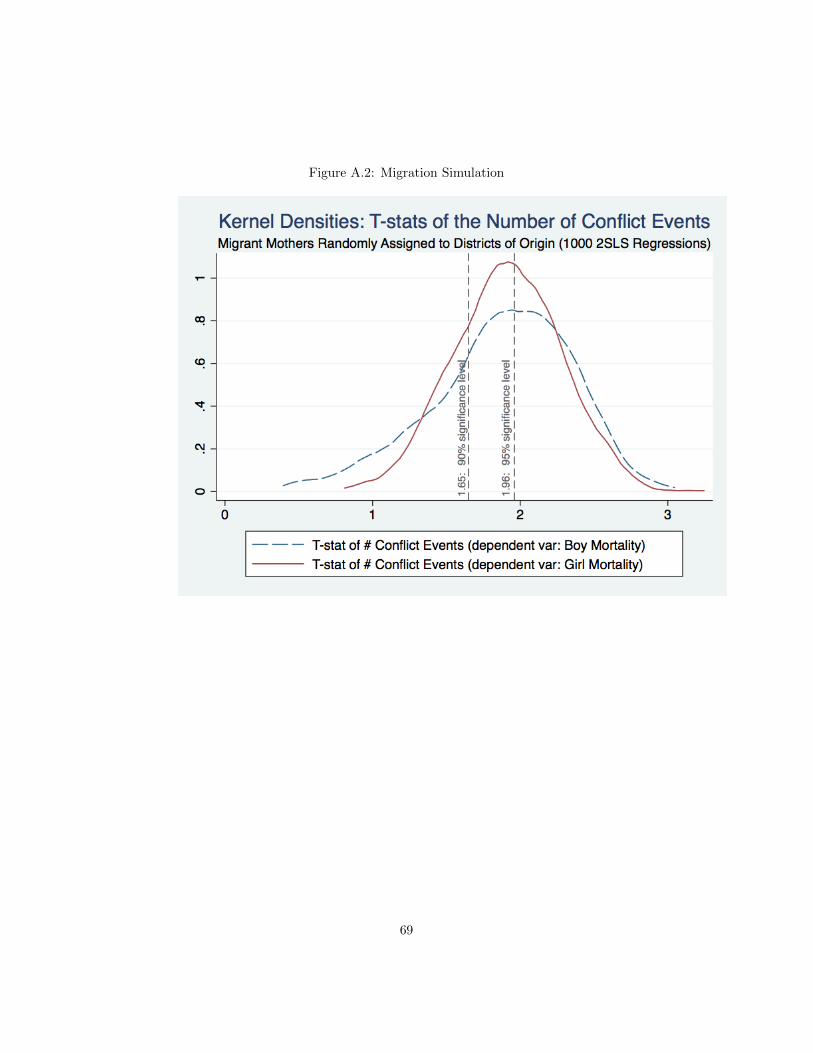
Figure A.2: Migration Simulation
69