do emotions in advertising drive sales? - affectiva · do emotions in advertising drive sales? use...
TRANSCRIPT

RESEARCH PAPER – SEPT 2013
Do Emotions in Advertising Drive Sales? Use of Facial Coding to Understand The Relationship between Emotional Responses to Ads and Sales Effectiveness
Daniel McDuff, Research Assistant, Massachusetts Institute of Technology, USA Rana El Kaliouby, Chief Science Office, Affectiva, USA Evan Kodra, Senior Data Scientist, Affectiva, USA Laurent Larguinat, Director - Market Marketing Lab, Mars, Belgium
Abstract Ads that evoke emotions keep us entertained and are more memorable, but do they really drive product sales? To answer this question, we conduct the first large-scale facial coding study to quantitatively measure people’s tacit emotional responses to ads. The high temporal resolution of facial coding yields insights into the emotional profile of a “successful” ad. Facial coding provides evidence for discrimination of sales effectiveness and could be used to complement traditional self-report methods.

RESEARCH PAPER – SEPT 2013
1 Introduction It is now widely accepted that human emotions play a significant role in driving our decisions, from the type of content we watch to the products and services we buy (LeDoux 2002; Damasio 1994). Physiological changes in our heart rate, posture, facial expression and voice convey emotion responses to the world around us. These responses are encoded in the System 1 brain circuit, the automatic and largely emotional processing system of the brain. When making decisions, our past and current emotion experiences bias our decision-making subconsciously, making emotions an important influencer on our decisions (Loewenstein and Lerner 2003).
Figure 1. What types of emotional responses to advertising drive sales? We collected and analyzed over 11,000 facial responses to find out. Images taken are a subset of facial response data collected with permission to share publicly.
Emotions and Advertising Effectiveness The role of emotion in marketing and advertising has been considered extensively since early work by Zajonc (Zajonc 1980) who argued that emotions function independently of cognition and can indeed override it. Since then, emotions in advertising have been shown to enhance the emotional connection consumers have with brands (Mehta and Purvis 2006), ad likeability (McDuff, et al. 2013), engagement (Teixeira, Wedel, and Pieters 2010), recall (Hazlett and Hazlett 1999, Ambler and Burne 1999) and decisions to share (virality) (Berger and Milkman 2011). These relationships suggest that a strong link should exist between emotion responses to advertising and sales. By creating ads that surprise, that entertain, and even make you cry, advertisers aim to help you remember the product, build positive associations with the brand and ultimately drive sales.
But are ads that are successful in evoking emotions also successful in driving sales? This is precisely the question MARS Marketing and Affectiva aimed to answer in this research partnership. Like many advertisers, MARS is faced with the challenge of assessing which ads are more likely to be effective from a sales point of view. It is critical to understand why, for instance, only one of two humorous ads that MARS had produced

RESEARCH PAPER – SEPT 2013
in the Chocolate category succeeded in boosting sales. What are the emotion profiles of the ad that led to sales success?
Beyond predicting sales effectiveness, MARS also sought insights into what really makes an ad work in order to identify “best practices” that can inform the design of future advertising to increase ad effectiveness.
Today, the de facto approach to predicting sales effectiveness of advertising is through traditional surveys. Respondents watch an ad and then answer a number of questions that capture aspects of the viewers’ cognitive assessment of the ad, such as awareness of the brand, persuasion of a message, and purchase intent (how likely they are to purchase the product as a result of viewing the ad). These responses are then correlated to sales data1. This approach models the cognitive aspects of decision-making but misses on people’s visceral emotional responses, which play an equally important role in influencing a person’s memory for a product and purchase decisions. Hill and Levin (Hill and Levin 2013) apply facial coding to response to 13 ads and show correlation with sales effectiveness. While this is promising for facial coding and advertisers, they use manual facial coding, which is very time consuming, expensive and hard to scale. We show results from a larger number of viewers and a greater cohort of ads using a highly automated and scalable system.
Other approaches to determining sales effectiveness of an ad focus more on the ad, coding for salient features, such as package shots and celebrity shots, and these features are then correlated with the sales data. The challenge with this approach is that it doesn’t factor in the cognitive nor emotion responses of the viewers.
Until now it has been difficult to measure emotional responses to advertising in a passive and scalable way. As a result, there are currently no large-scale studies that analyze the relationship between emotion responses to ads and sales success.
Research Objectives The primary goal of this partnership was to explore the role that emotions in advertising play in driving sales. Specifically, we set out to:
1. Capture emotional responses to ads in different regional markets and product categories;
2. Identify the emotion trajectories that are indicators of advertising effectiveness; 3. Find out if facial coding complements traditional cognitive surveys in predicting
sales effectiveness.
To systematically explore how emotions in advertising drive sales, our teams designed a large-scale study to collect facial emotion responses to ads for which we also had sales data. Figure 1 shows example facial responses collected using our system. Figure 2 shows a summary of our experimental design. So far, we have collected over 11,000 face videos from 1,153 panelists who watched 115 ads between them from their
1 http://www.campaignbrief.com/2011/11/millward-‐brown-‐announces-‐the-‐m.html 2 Millward Brown signs Unilever and Coke to facial coding deals.

RESEARCH PAPER – SEPT 2013
homes in the United States, United Kingdom, France and Germany. The ads represent 70 unique brands. These ads have sales performance indices that were obtained from single-source data and were subsequently run through a model to extract just the lift that can be directly associated with the TV ad. We built models to predict sales effectiveness; these models in turn yielded insights into why particular ads drove sales while others did not.
Figure 2: To model the role of emotional advertising in driving sales, we collected spontaneous facial emotion responses to 115 ads via an Internet survey. Automated facial coding was used to process over 11,000 videos for underlying emotion responses such as joy and disgust. We then built discriminative models to map the relationship between emotion responses and short-term sales for each ad.
Hypotheses H1. Dynamics matter: The high temporal resolution of facial coding will lead to insights into common emotional profiles of a “successful” ad. We hypothesize that for enjoyment-based ads, an increase in positive expressions (e.g., joy) and/or the absence of negative expressions (e.g., disgust) are discriminative of a successful ad.
H2 Facial coding provides evidence for sales effectiveness of an ad: The combination of facial emotion responses and self-report captures the cognitive and emotional aspects of decision-making, and is thus more discriminative of sales success than self-report alone. In addition, facial expressions alone may have discriminative value.
2 Measuring Emotions Emotion theorists have long debated the exact definition of an emotion and have proposed multiple taxonomies of emotions, several of which have been popularized in advertising research. Two of the most commonly used models are the discrete and dimensional models of emotion. Discrete theories of emotion posit that there are neural “affect” programs that drive a set of core basic emotions, and that these emotions are universal. The basic emotions proposed by Ekman (1993) are the most common: happiness, disgust, fear, anger, surprise, sadness and contempt. The dimensional theory of emotions divides the emotion space into a number of continuous dimensions (Schlosberg 1954; Russell 1980; Scherer 2000). Valence (pleasantness) and arousal

RESEARCH PAPER – SEPT 2013
(activation) are the most frequently used dimensions (Russell 1980). Most work in advertising has focused on a discrete approach to emotion measurement. In this work, we utilize both discrete measures of emotion as well as dimension measures.
Measuring emotions is complex, leaving advertisers with open questions related to how to best leverage emotion in advertising to drive sales impact. The status quo is to measure emotions using surveys, interviews or by instructing a panelist to turn a dial to quantify their state. FaceTrace (Wood 2007) and AdSam (Morris 1995) use pictorial representations to aid subjects in this task, making reports more intuitive. Self-reported measures, while convenient, are often biased by participants’ cognitive filters, do not capture moment-by-moment emotion responses and, in the case of dials, detract from the viewing experience itself (Cornelius 1996). In addition, because the effects of ads are often implicit or subliminal, people are often unable to articulate the impact of an ad or map their experience to a single number on a scale.
Emerging neuromarketing approaches such as brainwave measurement may be accurate but are obtrusive, hard to scale and expensive (Ariely and Berns 2010). What is needed is an objective measure of emotion that is both unobtrusive and scalable.
Figure 3. Descriptions and examples of the discrete emotions and dimensions of emotion, which are captured by our facial coding technology (AFFDEX).
Facial Expressions – The Universal Language of Emotion
Since the early work of Darwin in 1870 (Darwin, Ekman, and Prodger 2002), facial expressions have long been considered the universal language of emotion, and are recognized across cultures, age and gender. The Facial Action Coding System (FACS) (Ekman and Friesen 1977) is a comprehensive catalogue of unique action units (AU) that correspond to each independent motion of the face. FACS enables the measurement and scoring of facial activity in an objective way and is often used to discriminate between subtle differences in facial motion (Hjortsjo 1970).

RESEARCH PAPER – SEPT 2013
A number of methods can be used for measuring facial activity. Derbaix (1995) used manual facial expression coding. Due to the time, effort and expertise required for coding AUs this data has limited temporal resolution and the number of ads tested is quite small. Electromyography (EMG) uses electrodes attached to the face to measure muscle potentials (Hazlett and Hazlett 1999; Bolls, Lang, and Potter 2001). However, this technique is obtrusive and requires specialized hardware.
Automated Facial Coding: Unobtrusive and Scalable Measure of Emotion Facial coding technology provides an objective measure of emotion that is unobtrusive, cost-effective and scalable. The universality of facial expressions, the ubiquity of webcams and recent developments in computer vision make automatic facial coding an objective, passive and scalable measure of emotion. Moreover, unlike self-report, facial coding enables the remote measurement of subtle and nuanced expressions of emotion on a moment-by-moment basis.
Affectiva’s automated facial coding technology captures facial action units and identifies the main dimensions of emotion (valence and arousal/intensity) and a range of discrete emotion states, e.g., enjoyment, surprise, disgust/dislike, confusion and skepticism. These states were chosen because of their relevance, especially in ad testing. Definition and examples for each of these measures are given in Figure 3. The technology is made available as a cloud-based platform, allowing for seamless integration with online surveys as well as offline venue-based studies. Affectiva’s facial coding platform is currently used on an ongoing basis to pre-test ad copies globally for major brands including Unilever, Coca Cola and others2. With more than 1 billion emotion data points, we have built a market-based and product-based normative database of emotion responses. Facial coding has also been applied in advertising research (Teixeira et al., 2011), media testing (McDuff et al. 2013; Kodra et al. 2013) and political polling (McDuff, El Kaliouby, et al. 2013).
Figure 4: How facial coding works. Video responses to the commercials are captured and analyzed frame-by-frame to extract the facial expression metrics. Temporal features from these positive and negative emotion metrics are used to predict sales performance.
Figure 4 shows a flow diagram of how automated facial coding is done. To quantify a person’s emotional response, algorithms process each frame of the face video and locate the main features on the face (e.g., mouth, eyebrows). The movement, shape and
2 Millward Brown signs Unilever and Coke to facial coding deals.

RESEARCH PAPER – SEPT 2013
texture composition of these regions are used to identify facial action units such as an eyebrow raise or smirk. Machine learning classifiers then map facial texture and movement to emotional states.
Figure 5: Examples of facial responses recorded. The facial coding algorithms are robust to large variations in lighting conditions, image quality, head pose and scale.
To train the emotion classifiers, our framework leverages a growing repository of real-world facial data, which at the time of writing exceeds over 300 million facial frames (sourced from 500,000+ facial videos) of real-world emotion data that represents a multitude of age ranges, ethnicities and cultures. Such diversity in the training data helps ensure that the classifiers are resilient to challenging conditions such as those shown in Figure 5. The average accuracy when tested on spontaneous images is over 90%; the smile detector is the most accurate detector with accuracy of 97%.
The outputs are moment-by-moment measures that are computed for each frame of the video (15 frames per second) and averaged for all the viewers of an ad. The post processing of the metrics toward predictive modeling is described further in the Results Section.
Figure 6: Breakdown of the 115 ads by country and product category.
3 The Experiment The Ads

RESEARCH PAPER – SEPT 2013
MARS selected a subset of ads from their database that could be quantified as good, average, and bad with high confidence. Most were entertaining but had performed quite differently in the market: some performed poorly, others did very well. The ads were all aired between 2001 and 2012. In total, 115 ads were tested, from 4 different regions (France, Germany, UK and US) and four product categories (pet care, instant foods, chocolate and chewing gum). Figure 6 shows the breakdown of ads by country and category. Each ad was viewed by ~100 respondents; over 11,000 responses were captured making this to date the largest existing dataset of facial emotion responses linked with sales data.
Sales Effectiveness Measurement
The sales labels are based on single source data from a four-week period during which the ad was aired on TV and four weeks prior to airing. Participants were given a set-top box for tracking their exposure to ads and their purchases were logged. The probability of a participant purchasing the brand conditioned on them being exposed to the brand over the four week is calculated with media weight taken into account via a proprietary MARS econometric model. The sales performance indices are outputs from this econometric model and isolate regional and product specific sales lift driven by an advertisement after accounting for a variety of other factors that influence sales. The sales effectiveness used here is hence measured as good, average, or bad and reflect percent sales lift driven by an ad alone. These three categories reflect a confident assessment of the advertisement specific effect on sales effectiveness for the product of consideration. It is worth noting that the percent sales lift index can differ normatively by country and product market, and thus the conversion to good, average, and bad categories yields a level playing field for analysis. Across all categories, the number of good, average and bad ads was 54, 25 and 36 respectively.
Figure 7. Structure of the online survey used to collect self-report and facial responses to the ads. The survey was split into two parts in order to capture pre- and post-reported feelings in addition to facial responses.
Methodology

RESEARCH PAPER – SEPT 2013
Figure 7 shows a schematic of the survey used to collect the data, which incorporates Affectiva’s Internet framework for recording and analyzing facial responses to ads, whilst watching ad content. An online survey is set up with a custom face recorder. All that was needed from participants is a browser with Flash support and a webcam, as well as consent to turn on their webcam while watching the ad, making it very simple for people to participate from their homes. The face recording system is similar to that described by McDuff et al. (2012). There are several advantages to online data collection. Firstly, the system is scalable and allows efficient data collection from a large number of people. Secondly, it allows a broader and global demographic to be sampled than just those available in a close geographic locale. In addition, seamless integration with online, survey-based pre-tests allows for a fast rollout.
In order to assess pre and post measures of brand purchase intent the survey was divided into two parts (Figure 7). Initially participants completed a pre-survey in which they were asked a number of questions about a series of brands. This was followed by a minimum of a three-day delay to minimize the participant’s memory of brands and questions that might appear in the main survey. The main survey entailed watching 10 video ads while the respondents’ emotional responses were captured. The ads were shown in isolation (no clutter reel was used) and no viewer watched multiple ads from the same brand. After watching each video viewers were asked questions about the ad.
In the pre-survey and following all the videos (pre- and post questioning) they were asked about their likelihood of purchasing the brands:
Q. Next time you are buying [product category] how likely are you TO PURCHASE [brand name] products?
Not likely to purchase Likely to purchase
Q. How LIKABLE do you find each of the following brands?
Very dislikable
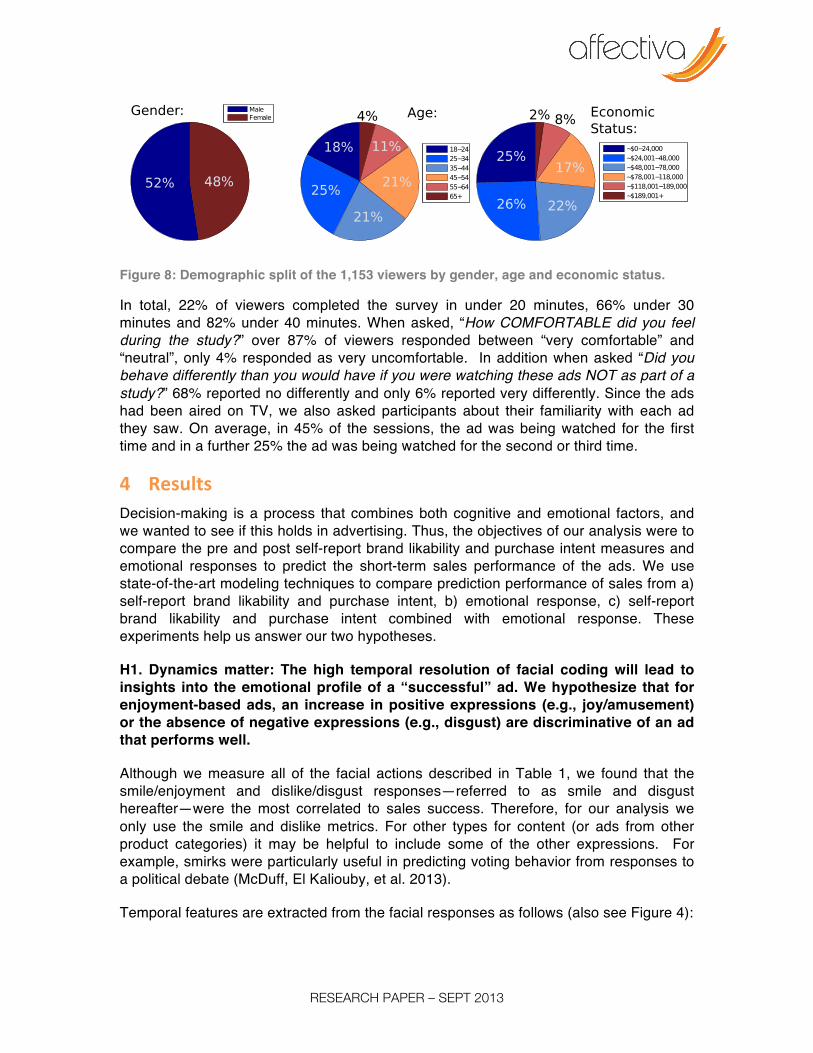
Figure 8 shows the demographic split of the viewers for all the ads combined. The viewers were recruited such that the gender balance for each ad was approximately 50% female; at least 70% of the viewers were product category users for the categories featured in the ads they watched. The viewers were also selected to ensure diversity in economic status. The demographic split for each country was similar to the demographic split across all the data combined.
RESEARCH PAPER – SEPT 2013
Figure 8: Demographic split of the 1,153 viewers by gender, age and economic status.
In total, 22% of viewers completed the survey in under 20 minutes, 66% under 30 minutes and 82% under 40 minutes. When asked, “How COMFORTABLE did you feel during the study?” over 87% of viewers responded between “very comfortable” and “neutral”, only 4% responded as very uncomfortable. In addition when asked “Did you behave differently than you would have if you were watching these ads NOT as part of a study?” 68% reported no differently and only 6% reported very differently. Since the ads had been aired on TV, we also asked participants about their familiarity with each ad they saw. On average, in 45% of the sessions, the ad was being watched for the first time and in a further 25% the ad was being watched for the second or third time.
4 Results Decision-making is a process that combines both cognitive and emotional factors, and we wanted to see if this holds in advertising. Thus, the objectives of our analysis were to compare the pre and post self-report brand likability and purchase intent measures and emotional responses to predict the short-term sales performance of the ads. We use state-of-the-art modeling techniques to compare prediction performance of sales from a) self-report brand likability and purchase intent, b) emotional response, c) self-report brand likability and purchase intent combined with emotional response. These experiments help us answer our two hypotheses.
H1. Dynamics matter: The high temporal resolution of facial coding will lead to insights into the emotional profile of a “successful” ad. We hypothesize that for enjoyment-based ads, an increase in positive expressions (e.g., joy/amusement) or the absence of negative expressions (e.g., disgust) are discriminative of an ad that performs well.
Although we measure all of the facial actions described in Table 1, we found that the smile/enjoyment and dislike/disgust responses—referred to as smile and disgust hereafter—were the most correlated to sales success. Therefore, for our analysis we only use the smile and dislike metrics. For other types for content (or ads from other product categories) it may be helpful to include some of the other expressions. For example, smirks were particularly useful in predicting voting behavior from responses to a political debate (McDuff, El Kaliouby, et al. 2013).
Temporal features are extracted from the facial responses as follows (also see Figure 4):

RESEARCH PAPER – SEPT 2013
• The per-respondent smile and disgust profiles are aggregated across respondents to create an ad-level smile and an ad-level disgust profile.
• For each ad the aggregated ad-level smile and disgust time series are partitioned into 10 equal-length segments.
• The maximum smile and disgust frame are chosen from each segment to form an ad-wise “intensity profile” of Smile and Disgust/Dislike.
• For the prediction of sales performance (Section 4), the Smile and Disgust/Dislike profiles are used to calculate a positive and negative emotion value.
In the next subsection, we utilize these intensity profiles in an effort to test hypotheses H1 and H2.
H2. Facial coding provides evidence for sales effectiveness of an ad: The combination of facial emotion responses and self-report captures the cognitive and emotional aspects of decision-making, and is thus more discriminative of sales success than self-report alone. In addition, facial expressions alone may have discriminative value.
In order to test the second hypothesis, we compare the discriminative performance of the self-reported responses, the facial expression metrics and a combination of the two modalities. Following from H1, we use the temporal dynamics of facial emotions as candidate predictors of sales effectiveness. We treat the prediction as a two-class problem aiming to learn the difference between responses to ads with good sales versus ads which bad sales; in this analysis we do not consider the ads with average performance. Support Vector Machines (SVM) are a class of statistical classification models that have been used effectively in many disciplines where prediction is a objective (Wang 2005). Therefore, SVMs were chosen to perform classification of ads in this preliminary analysis. Cost and gamma parameters, two inputs to SVMs that must be chosen, were varied in the validation process performed on the training data.
We use a leave-one-commercial-out framework to ensure that the results generalize to new (unseen) ads. Taking all the features and labels for N-1 ads we train a classifier, then we test it on the features and labels for the ad left out. This is repeated N times, where N is the number of ads (115). We use a start of the art classifier that learns the profile of a good versus bad ad. We compare the performance of our models with a baseline that represents chance (i.e., the flip of a coin to decide whether the ad would perform well or badly in sales.)
The following features were used for the following four experiments:
E1. Naïve: Features are random; this is equivalent to flipping a coin to make each decision where the coin is biased using the prior probabilities of each category.
E2. Self-report: We take the mean of the delta in pre- and post-purchase intent ratings and the mean of the post-purchase intent rating across all viewers for an ad. We also take the mean of the delta in pre- and post-likability ratings and the mean of the post-likability rating across all viewers for an ad.
RESEARCH PAPER – SEPT 2013
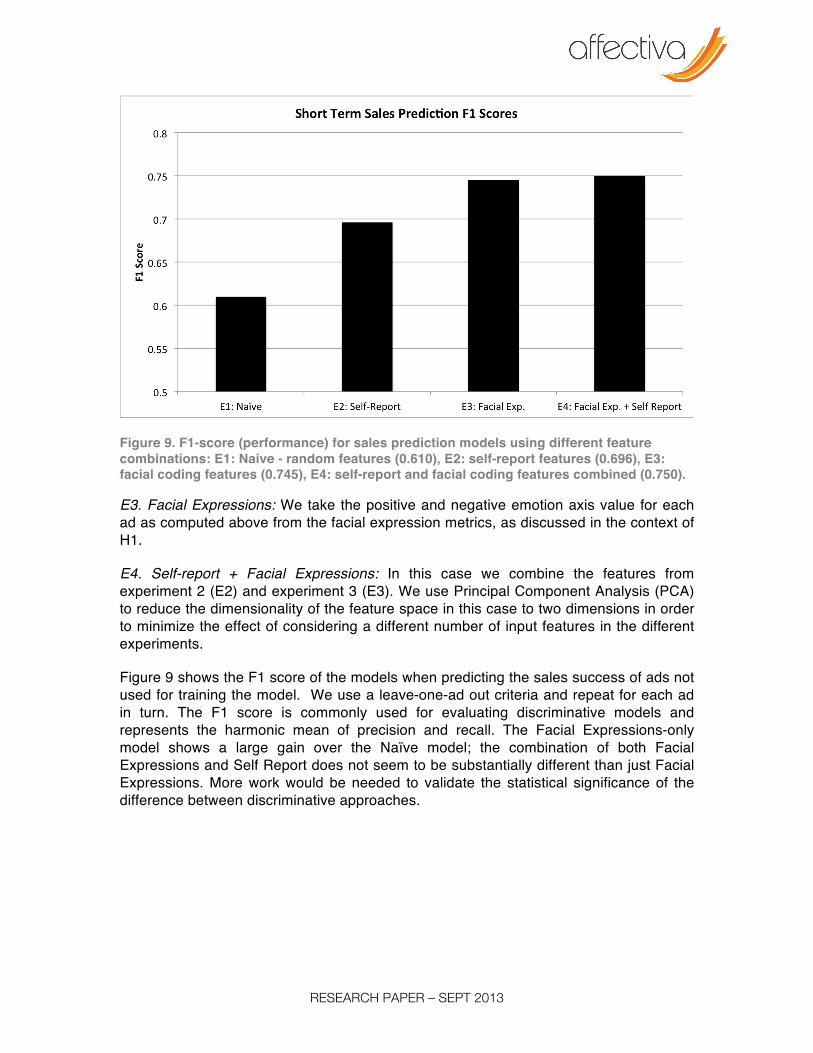
Figure 9. F1-score (performance) for sales prediction models using different feature combinations: E1: Naive - random features (0.610), E2: self-report features (0.696), E3: facial coding features (0.745), E4: self-report and facial coding features combined (0.750).
E3. Facial Expressions: We take the positive and negative emotion axis value for each ad as computed above from the facial expression metrics, as discussed in the context of H1.
E4. Self-report + Facial Expressions: In this case we combine the features from experiment 2 (E2) and experiment 3 (E3). We use Principal Component Analysis (PCA) to reduce the dimensionality of the feature space in this case to two dimensions in order to minimize the effect of considering a different number of input features in the different experiments.
Figure 9 shows the F1 score of the models when predicting the sales success of ads not used for training the model. We use a leave-one-ad out criteria and repeat for each ad in turn. The F1 score is commonly used for evaluating discriminative models and represents the harmonic mean of precision and recall. The Facial Expressions-only model shows a large gain over the Naïve model; the combination of both Facial Expressions and Self Report does not seem to be substantially different than just Facial Expressions. More work would be needed to validate the statistical significance of the difference between discriminative approaches.

RESEARCH PAPER – SEPT 2013
Figure 10. Facial coding is more discriminative than self-report: Left) Mean increase in self-reported brand liking before and after the ads. Right) Smile response gradient for viewers during the ad. The error bars show the standard errors for change in likability and smile gradients across all ads in each category, respectively. Tests have not yet been performed to assess significance of differences between means between categories.
To demonstrate why we would expect the facial expressions to be more discriminative than the self-report metrics Figure 10 shows the normalized distributions of self-report responses vs. smile response gradients for the three sales performance categories; there is a greater difference for facial coding than for the self-reported likability.
These results validate both of our hypotheses. Firstly, the positive and negative emotion measurements, which capture the trend (gradient) of the smile response and the level of disgust expressed, are predictors of sales effectiveness. Secondly, the improvement in classification accuracy between the models that use self-report metrics versus facial expression metrics shows that the automatically coded spontaneous facial actions were more telling of the short-term sales effectiveness than the self reported purchase intent or likability of the brand. Finally, combining these two sources of information led to a marginal increase in the performance. It is not clear that combining the two is statistically significant compared to facial expressions alone; this needs to be further tested. However, the marginal discriminative performance may support previously work that shows that cognitively evaluated responses are correlated with facial behavior but are also complementary (Kassam 2010).
5 Case Studies In order to understand the importance of facial emotion dynamics, we examine several case studies. Examples include a case where facial coding was a more accurate predictor of sales success and a case where the combination of self-report and facial coding was more informative than either alone.
Case I: Facial responses correctly predict sales success (but self-report does not)
Category: Chocolate Sales: Good Country: FR

RESEARCH PAPER – SEPT 2013
In this case study we feature an ad for a Chocolate brand that was tested in France and performed well from a sales point of view. Facial responses correctly predicted good sales performance but the self-report metrics did not. Figure 11 shows the mean delta in purchase intent and brand likability for the viewers that watched the ad and the aggregate smile and disgust tracks for the ad. The self-reported responses to this ad show a large mean decrease in likability for the brand, which contributed to a prediction of “bad” sales performance. However, the aggregate smile track had a strong positive gradient – lots of expression of positive emotion that increase over time; and there were no marked negative expressions. Together these two dimensions of emotion correctly predicted a successful sales outcome for the ad.
Figure 11. Left) Mean delta in self-reported purchase intent and brand likability for viewers. Right) Aggregate smile and disgust tracks for viewers. The self-report measures predicted poor sales performance, the facial expressions correctly predicted improvement in short-term sales.
Case II: Self-reported responses correctly predict sales (but facial coding does not)
Category: Gum Sales: Good Country: United States
In the second case study, we feature an ad for a Chewing Gum brand that aired in the United States and also had a good impact on sales. In this case, the self-report metrics correctly predicted the sales performance but the facial expressions metrics did not. Figure 12 shows the mean delta in purchase intent and brand likability for the viewers that watched the ad and the aggregate smile and disgust tracks for the ad.

RESEARCH PAPER – SEPT 2013
Figure 12. Left) Mean delta in self-reported purchase intent and brand likability for viewers. Right) Aggregate smile and disgust tracks for viewers. The self-report measures correctly predicted good sales performance; the facial expressions incorrectly predicted poor short-term sales due to the strong aggregate disgust response. However, combining the self-report and facial metrics together this ad was correctly classified.
This was an intentionally humorous ad, as evidenced in the upward smile trajectory; however, the ad also contained scenes where a man appears to be physically bullied by some yodelers in a car park, which elicited strong expressions of dislike/disgust. In the classification the mean disgust response caused the classification to be “bad”. The self-reported responses show a positive delta in self-reported purchase intent and brand likability before and after watching the ad. This leads to the self-report features correctly classifying this ad as performing well in sales. In reality when we combined the self-report and facial metrics together this ad was also correctly classified showing that the facial action coding did not harm the discriminative power of the self-report measures.
Case III: Using Facial coding with self-report boosts discriminative power
Category: Gum Sales: Poor Country: United States
Finally, in this third case study we examine a case in which the self-report metrics and the facial expression metrics alone both predicted the sales result incorrectly but the self-report metrics combined correctly predicted the sales performance.
Here, the information content within the self-report responses and facial responses alone was not strong enough to classify this as “bad”, although they both show signs of negative responses. However, when we combine the modalities the alignment of the negative responses (although both weak) gives enough information to predict the sales correctly. This is encouraging as it shows synergies where self-report responses and facial expressions combined can perform better than either on their own. Figure 13 shows the mean delta in purchase intent and brand likability for the viewers that watched the ad (left) and the aggregate smile and disgust profiles for the ad (right).

RESEARCH PAPER – SEPT 2013
Figure 9. Left) Mean delta in self-reported purchase intent and brand likability for viewers. Right) Aggregate smile and disgust tracks for viewers. The self-report measures and facial expressions individually incorrectly predicted good sales performance. However, the combination of self-report and facial expressions correctly predicted poor short-term sales performance.
This was another ad with an intention of eliciting positive affect via humor that did not generate strong positive expressions (notice the weak smile track in Figure 13). The self-report ratings were weak, both in terms of purchase intent and brand likability.
The three case studies presented here demonstrate the power of incorporating facial coding into sales prediction models. Part of the benefit of coding facial responses is the high temporal resolution of the measurement. Unlike self-reported feelings we can capture accurately how expressed emotional responses evolve over time. In case study one there is a successful “humorous” ad – the success of which was not identified using pre- and post-questionnaires. In case study three we discover that the combination of facial expressions and self-report can boost the understanding of whether an ad is effective or not.
6 Conclusions Driving product sales is the holy grail of advertising. This paper presented the first large-scale study using cloud-based facial coding technology to understand the relation between emotions in advertising and sales effectiveness of ads. We collected over 11,000 face videos from 1,153 panelists who watched 115 commercials for which we also had sales data, from the comfort of their homes in the United States, United Kingdom, France and Germany. The ads represented 70 unique brands in the chocolate, chewing gum, rice and pet care categories.
We show evidence that emotions in advertising, captured with facial coding, can be indicative of ad success (with two dimensions of positive and negative emotion separating good and bad ads in over 70% of cases) The dynamics of how emotion responses unfold over time yields insights into the emotional profile of a “good” ad. In particular, increasing amusement throughout an ad was a predictor of success, while the presence of negative emotions was inversely correlated to sales. This high temporal resolution is hard to obtain from self-reported measures, unless a dial is used, which detracts from the viewing experience. We also show evidence that facial emotion

RESEARCH PAPER – SEPT 2013
responses could complement traditional self-report methods; in this case study, boosting the discriminative power of self-reported measures by 8%.
Facial coding is scalable and allows efficient data collection from a large number of people. Secondly, it allows a broader and global demographic to be sampled than just those available in a close geographic locale. In addition, seamless integration with online, survey-based pre-tests allows for a fast rollout. We showed how our approach can be applied to rapidly obtain insights re: advertising effectiveness.
While further statistical tests are needed to validate the robustness of the discriminative models and to quantify differences between different methods, the results thus far are promising. We have several exciting next steps. First, we will continue to analyze the relationship between ad structure, scene transition and brand reveal with the emotion responses to provide actionable insights in the creation of content. Second, we plan to generalize these findings to other ad genres (e.g., causal-related advertising and sentimental ads), other product categories (e.g, automotive industry) and other countries (e.g., China) and to try to improve predictions by accounting for differences by product market and region.
7 Implications In this paper we have shown strong initial evidence that automated facial coding can provide discriminative value for ad-driven sales effectiveness. Fortunately, we have also found that this discriminative value is linked to logical and intuitive real-time, moment-by-moment emotional response patterns. This has a number of implications for the future of advertising and suggests that there is value in making the measurement of facial responses a routine part of copy testing. Specifically, implications of this work are:
1. Ad optimization and real-time tracking: We can do live prediction of the performance of ads from the current emotional responses of viewers. This could impact the decision of when, or if to air the ad, as well as media spend.
2. From animatics to finished film: This technology could be employed powerfully in the creation or editing of advertising content in order to improve the likelihood of success of ads, even at an early stage mock-ups.
Acknowledgements We would like to thank the following people for their help with this research: Lina Chen helped with the survey and data collection, Youssef Kashef generously helped with the translation of the surveys, Anna Yastrebova and Sassa Jarvio organized the copies to be tested and provided great feedback on the survey design. Francesco Cordaro provided significant help in reviewing the paper.
References Ambler, T., and T. Burne. 1999. “The Impact of Affect on Memory of Advertising.”
Journal of Advertising Research 39: 25–34.

RESEARCH PAPER – SEPT 2013
Ariely, Dan, and Gregory S. Berns. 2010. “Neuromarketing: The Hope and Hype of Neuroimaging in Business.” Nature Reviews Neuroscience 11 (4): 284–292.
Berger, J., and K. Milkman. 2011. “What Makes Online Content Viral.” Unpublished Manuscript, University of Pennsylvania, Philadelphia.
Bolls, P.D., A. Lang, and R.F. Potter. 2001. “The Effects of Message Valence and Listener Arousal on Attention, Memory, and Facial Muscular Responses to Radio Advertisements.” Communication Research 28 (5): 627.
Cornelius, R. R. 1996. The Science of Emotion: Research and Tradition in the Psychology of Emotions. Prentice-‐Hall, Inc.
Damasio, A.R. 1994. Descartes’ Error. Putnam New York.
Darwin, C., P. Ekman, and P. Prodger. 2002. The Expression of the Emotions in Man and Animals. Oxford University Press, USA.
Derbaix, C.M. 1995. “The Impact of Affective Reactions on Attitudes Toward the Advertisement and the Brand: A Step Toward Ecological Validity.” Journal of Marketing Research: 470–479.
Ekman, P, and WV Friesen. 1977. Facial Action Coding System. Consulting Psychologists Press, Stanford University, Palo Alto.
Ekman, P. 1993. “Facial Expression and Emotion.” American Psychologist 48 (4): 384–392. doi:10.1037/0003-‐066X.48.4.384.
Hazlett, Richard L, and Sasha Yassky Hazlett. 1999. “Emotional Response to Television Commercials: Facial EMG Vs. Self-‐Report.” Journal of Advertising Research 39 (2): 7–23.
Hill, Dan, and Aron Levin. 2013. “Applying Facial Coding to Ad Testing”. Quirk’s Marketing Research Media.
Hjortsjo, C.H. 1970. “Man’s Face and Mimic Language”. Studen litteratur.
Kassam, Karim Sadik. 2010. “Assessment of Emotional Experience through Facial Expression”. Harvard University.
Kodra, Evan, Thibaud Senechal, Daniel McDuff, and Rana el Kaliouby. 2013. “From Dials to Facial Coding: Automated Detection of Spontaneous Facial Expressions for Media Research.” In . http://www.affectiva.com/assets/From-‐Dials-‐to-‐Facial-‐Coding-‐Automated-‐Detection-‐of-‐Spontaneous-‐Facial-‐Expressions-‐for-‐Media-‐Research.pdf.
LeDoux, J. 2002. “Emotion, Memory and the Brain.” Special Editions.

RESEARCH PAPER – SEPT 2013
Loewenstein, G., and J.S. Lerner. 2003. “The Role of Affect in Decision Making.” Handbook of Affective Science 619: 642.
McDuff, Daniel, Rana el Kaliouby, David Demirdjian, and Rosalind Picard. 2013. “Predicting Online Media Effectiveness Based on Smile Responses Gathered Over the Internet.” In IEEE Conference on Automatic Face and Gesture Recognition (AMFG) 2013. http://www.affectiva.com/assets/Predicting-‐Online-‐Media-‐Effectiveness-‐Based-‐on-‐Smile-‐Responses-‐Gathered-‐Over-‐the-‐Internet.pdf.
McDuff, Daniel, Rana El Kaliouby, Evan Kodra, and Rosalind Picard. 2013. “Measuring Voter’s Candidate Preference Based on Affective Responses to Election Debates.” In .
McDuff, Daniel, Rana El Kaliouby, and Rosalind Picard. 2012. “Crowdsourcing Facial Responses to Online Videos.” IEEE Transactions on Affective Computing. http://projects.computer.org/csdl/trans/ta/preprint/tta2012990015-‐abs.html.
Mehta, A., and S.C. Purvis. 2006. “Reconsidering Recall and Emotion in Advertising.” Journal of Advertising Research 46 (1): 49.
Morris, J. D. 1995. “Observations: SAM: The Self-‐assessment Manikin.” Journal of Advertising Research 35 (6): 63–68.
Russell, J. A. 1980. “A Circumplex Model of Affect.” Journal of Personality and Social Psychology 39 (6): 1161–1178. doi:10.1037/h0077714.
Scherer, K.R. 2000. “Psychological Models of Emotion.” The Neuropsychology of Emotion 137.
Schlosberg, Harold. 1954. “Three Dimensions of Emotion.” The Psychological Review 61 (2).
Teixeira, T., M. Wedel, and R. Pieters. 2010. “EMOTION-‐INDUCED ENGAGEMENT IN INTERNET VIDEO ADS.” Journal of Marketing Research (August): 1–48.
Wang, Lipo. 2005. Support Vector Machines: Theory and Applications. Vol. 177. Springer. http://books.google.com/books?hl=en&lr=&id=uTzMPJjVjsMC&oi=fnd&pg=PA1&dq=svm+applications&ots=GCGL5u2Enb&sig=4Itg1K4IatsVrxZjUZHljrPs8hY.
Wood, Orlando. 2007. “Using Faces; Measuring Emotional Engagement for Early Stage Creative.” In European Society for Opinion and Marketing Research (ESOMAR), 12:05–08.

RESEARCH PAPER – SEPT 2013
Zajonc, R.B. 1980. “Feeling and Thinking: Preferences Need No Inferences.” American Psychologist 35 (2): 151.
The Authors Daniel McDuff was a research intern at Affectiva in 2012 and is currently a PhD student at the MIT Media Lab. Rana el Kaliouby is co-founder and Chief Science Officer at Affectiva. Evan Kodra is a senior data scientist at Affectiva and a PhD candidate at Northeastern University. Laurent Larguinat is the Director of the Mars Marketing Laboratory, which is responsible for all of the marketing science research at Mars, Inc.