do domestic firms benefit from foreign direct …...i none of the previous studies use firm-level...
TRANSCRIPT
4~~~~~~~~~ ......'...
POLICY RESEARCH WORKING PAPER 1248
Do Domestic Firms Benefit ksmsthatteclt. . gains fZi~~~~~~gm lareli iiwe Ntien"t:
from Foreign Direct a*Xp:N Vb*i
Investment? vees
Evidence from Panel Data
Bnian AitkenAnn Harson
The World BankPolicy Research DepartmentTrade Policy Division UFebruary 1994
Pub
lic D
iscl
osur
e A
utho
rized
Pub
lic D
iscl
osur
e A
utho
rized
Pub
lic D
iscl
osur
e A
utho
rized
Pub
lic D
iscl
osur
e A
utho
rized

IOLICY RESEARCHI WORKING PAPER 1248
Summary findings
Many developing countries now actively solicit foreign foreign equity participation are strongly correlated withinvestment, offering foreign firms subsidies, tax holidays, increases in plant productivity.and exemptions from import duties. One justification for Second, they measure the impact of joint ventures andsubsidizing these firms is the so-called spillover of foreign subsidiaries on plants with no foreign investment.technology from foreign to domestic firms. Facing fewer data limitations than in previous studies,
Usinf panel data - following more than 4,000 they find that foreign investment negatively affects theVenezuelan firms from 1975 through 1989 - Aitken productivity of domestically owned plants.and Harrison explore two aspects of the effect of foreign Thes: results suggest that whatever technology gainsdirect investment. occur through foreign investment are captured entirely
First, they examine the relative performa.ice of joint by joint ventures.ventures and domestic firms. They find that increases in
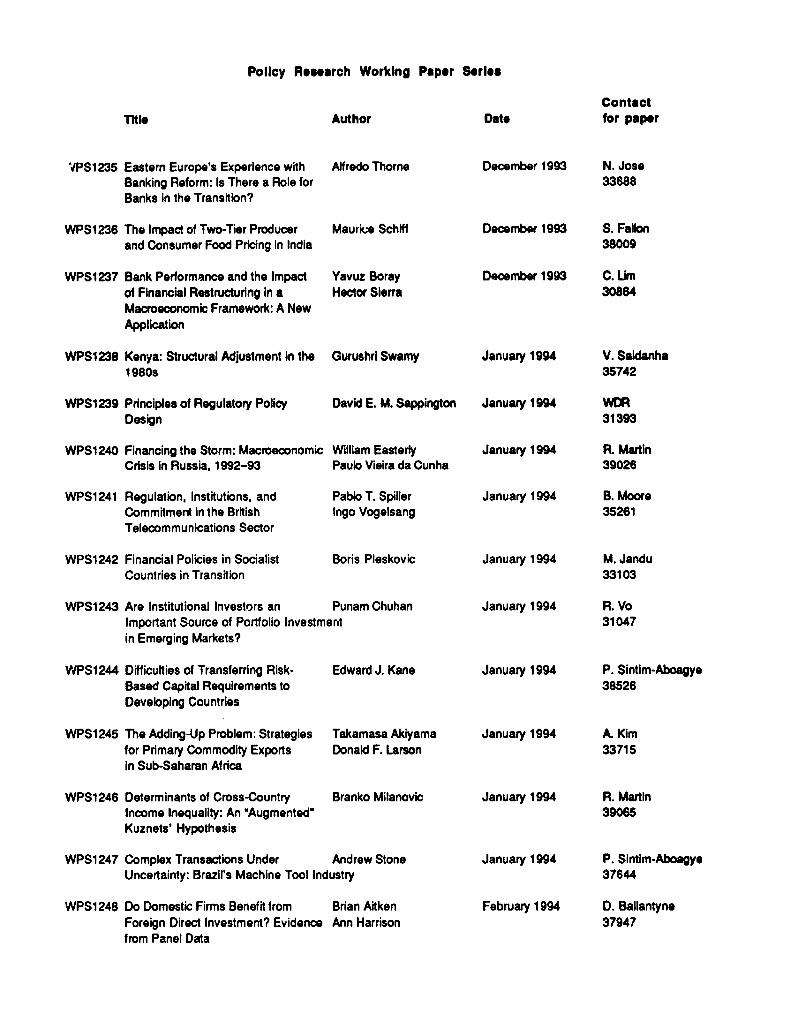
This paper- a product of the Trade Policy Division, Policy Research Department - is part of a larger effort in the departmeto examine the determinants and consequences of foreign investrnent at the micro level. Copies of the paperare available free frothe World Bank, 1818 H Stceet NW, Washington, DC 20433. Please contact Dawn Ballantyrie, room N10-023, extension 37947(42 pages). February 1994.
The Policy Research Working Paper Series 4ihseminates the rindings of work in progress to encorqe the exchwag of ideas aboutdevelopment issues. An obective of the series is to get the findings out quickly, ewen if the presentations eC kss than fidly polished. Th.papers carry .he names oa the authors and should be used and cited accordingly. The findings, interpretations, and conclusions are theauthors' own and shouvd not be attinbuted to the World Bank, its Lxcutive Board of Directors, or any of its member countries.
Produced by the Policy Research Dissemination Center

Do Dometic Firma benefit fromForeign Direct Investment?
Evidence hfom Panel Data
Brian AitkenInternational Monetary Fund
and
Ann HarrisonWorld Bank
*The authors would like to thank Susan Collins, Rudi Dornbusch, Stan Fischer, David Genesove, RobPorter, Ed Wolff, Mayra Zermeno, and seminar participants at Boston University, Brandeis, Fletcher,MIT, Princeton, the Winter 1992 AEA Meetings, the NBER International and Productivity lunches, andthe NBER Summer Institute for useful comments and discussion.
1 Background
In the 1980s, the disappearance of non-equity sources of forelgn capital created a resurgence of
interest in direct foreign investment (DFI). The need for alternative sources of capital, combined with
an increasing skepticism about import substituting trade strategies, led many developing countries to
liberalize restrictions on incoming foreign investment. Some countries actually tiUted the balance towards
foreign firms by offeing special incentives: in Mexico, the maquiladora firms pay no income taxes; in
much of the Caribbean, forein firms receive income tax holidays, import duty exemptions, and subsidies
for infrastructure. 'Me expectation that foreln investment serves as a catalyst for rimaetic production
has led countries such as Taiwan and Bulgaria to offer special treatment for foreign firms in high
technology sectors.
Can these subsidies be justifiod? Apart from the employment and capital inflows which
accompany foreign investment, multinational activity may generate knowledge transfers or new
technology to domestic firms.' If foreign firms introduce new products or processes to the dcmestic
market, domestic firms may benefit from the accelerated diffusion of now technology (ceece, 1977;
Davies, 1977). In some cases, domestic firms may increase productivity simply by observing nearby
foreip firms. In other cases, diffusion may occur from labor turnover as domestic employees move from
foreign to domestic firms. Several studies have shown that foreign finns initiate more on-the-job training
programs than their domestic counterpats (Edfelt, 1975; Gonclaves, 1986; Watson, 1972). If these
benefits from foreip investment are not completely internalized by the incoming firm, some type of
subsidy could be justified.
Case sttdies present mixed evidence on the role of foreign investment in gSerating technology
transfer to domestic fims. In Mauritius and Bangladesh, studies suggest that the entry of several foreip
'See Caves (1982), and Heleinor (1989) for surveys of technology transfer «d foreip directinvestment.
firms led to the creation of a booming, domestically-ownted eAport industry for textiles (Rhee and Belot
(1990)). Mansfield and Romeo (1980), however, found In a survey ot ;5 multinationals that only a small
share had accelerated access to process technology for local competitors. A 1970s study commissioned
by the OECD of 65 subsidiaries in twelve developing countries found almost no evidence of technology
transferred to local competitors (see Germidis (1977)). The lack of spillovers to domestic flru was
attributed to a number of factors, including limited hiring of domestic employees in higher level positibns,
very little labor mobility between domestic firms and foreign subsidiaries, limited subrontracting to local
firms, no research and development by the subsidiaries, and few incentives by multinatioiWs to diffuse
their knowledge to 3cal competitors.
Few recearchers have attempted to go beyond qualitative case study evidence. In a pioneering
paper, Caves (1974) tested for the impact of foreign presence on value-added per worker in Australian
domestically-owned manufacturing sectors. Caves found that the positive disparity between foreign and
domestic value-added per worker disappears as foreign firms employed an increasing share of t!.e labor
in the sector, which is consistent with the spillover hypothesis. Globerman (1979) replicated Caves
(1974) using sectoraj, cross-section data for Canadian manufacturing industries in 1972. The results are
consistent with a weak spillover effect.
Yet spillovers from foreign investment are likely to be much larger in industrializing countries,
where the gap between domestic and foreign productivity may be significant. Most of the empirical work
on technology spillovers from foreign investment in developing countries has focused on Mexico.
Blomstrom and Persson (1983), Blomstrom (1986), and Blomstrom and Wolff (1989) generally find that
sectors with higher foreign ownership exhibited higher levels of productivity, faster productivity growth
and faster convergence of productivity levels to US norms.2
2Blomstrom (1989) provides a synthesis of his previous work on the impact of foreign investment inMexiSo.
2
I
None of the previous studies use firm-level data, restricting the authors' ability to examine
domestic and foreign firm behavior separately. In this paper, we use ̂ .' .ual census data on Venezuelan
firms, averaging over 4,000 firms annually, to examine two related issues. First, to what extent do joint
ventures or wholly owned foreign subsidiaries exhibit higher levels of productivity than tieir domestic
counterparts? Second, can we identify any technology 'spillovers' from these foreign entrants to
dornestically owned firms?
All previous attempts to measure spillover effects fiom foreign investment face a critical
identification problem: if foreign investment gravitates towards more productive industries, then the
positive impact of foreign presence on domestic firm productivity will be over-estimated. As a result,
one could find a positive spillover from foreign investment v7here no spillover occurs. This paper differs
from previous studies by using the differences in foreign investment across regions and over time to
identify technology spillo-ers within each industry. Unlike previous studies, we observe the behavior of
each plant over time, which allows us to control for fixed differences in productivity levels across
industries.
We find a strong relationship between increased foreign equity participation and plant
performance, suggesting that individual plants do benefit from foreign investment. We also find,
however, that productivity across domestic plants falls when foreign investment increases. Section 2
presents a theoretical framework which takes into account the possible benefits as well as the copts of
foreign investment. Section 3 describes the policy environment and compares the behavior of domestic
and foreign plants. Section 4 presents the results from testing for technology spillovers from foreign
plants, while Section S concludes.
3

2 Foregn Invetment, Competdt0on and Technology Spillovurs: The Frnmework
The so-called "Industrial organization" approach to DFI in manufacturing suggests that
multinationals can compete locally with more informed domestic firms because multinationals posses a
nontangible productive asset, such as technological inowhow, marketing and managih,g skills, export
contacts, coordinated relationships with suppliers and customers, and repuItation.' Since the assets are
almost always gained through experience, they cannot be e sily licensed to host country firms, but can
be costlessly transferred to subsidiaries who locate in host countrles either to circumvent trade barion
or produce with cheap local labor (Teece, 1977).
Although the intangible firm-specific asset may not be licensed, domestic industry might
nonetheless benefit from the presence of frcreign firms. As workers employed by fo:eign firms or
participating in joint ventures gain experience, for example, they may accumulate knowledge which is
valued outside the firm; foreign firms exert an externality by increasing the domestic stock of human
capital. As experienced workers leave the foreign firms, this human capital becomes available to
domestic firms, raising their measured productivity. Likewise, some firm-specific knowledge of foreign
firms might 'spill over' to domestic industry as domestic firms are exposed to new products, prusduction
and marketing techniques, or receive technical support. fronm upstreamn or downstream foreign firms. In
addition, foreign firms may act as a stable source of demand for inputs in an industry, which can benefit
upstream domestic firms by allowing them to train and maintain relationships with experienced
employees. In all these cases, foreign presence would raise the productivity of domestically-owned firms.
But foreigi presence can also reduce total factor productivity of domestically-owned firms. In
an environment in which imperfectly competitive domestic firms face fixed costs of production, foreign
'See Rymer (1960) Caves (1971), and more recently Horstman and Markusen (1989), Helpman(1984), and Krugman (1983). For Surveys, see Rugman (1986), Crieco (1986).
4
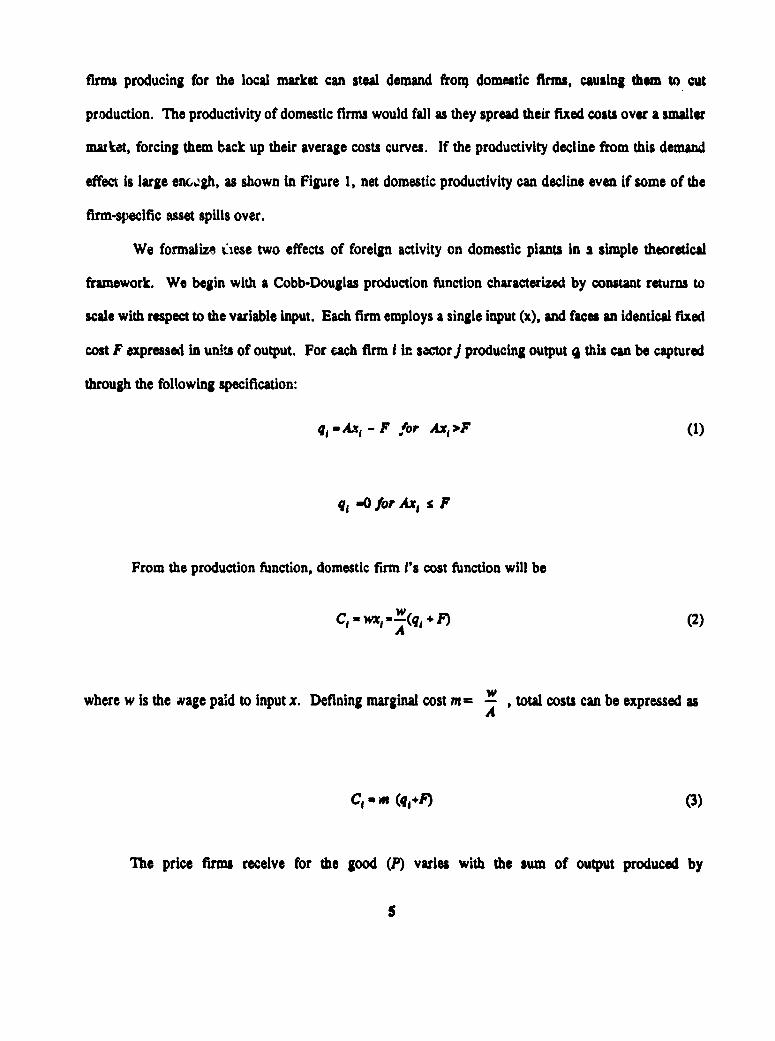
firms producing for the local market can steal demand fron) domestic firms, causing them to cut
production. The productivity of domestic firms would fall as they spread their fixod costs over a smaller
maxket, forcing them back up their average costs curves. If the productivity decline from this demand
effect is large enmgh, as shown in Figure 1, net domestic productivity can decline even if some of the
firm-specific asset spills over.
We formalize uCese two effects of foreign activity on domestic plants in s simple theoretical
framework. We begin with a Cobb-Douglas production function characterized by constant returns to
scale with respect to the variable input. Each firm employs a single input (x), and faces an identical fixed
cost F expresse. in units of output. For each firm I ir. sectorj producing output q this can be captured
through the following specification:
q10 Ax, - F for Ax5*F (1)
q1 -0 for Ax, s F
From the production function, domestic firm I's cost function will be
C, w 1, (q, .FP) (2)A
where w Is the gvage pa.d to Input x. Defining marginal cost m = w , total costs can be expressed asA
C, am (q+,F) (3)
The price firms receive for the good (P) varies with the sum of output produced by
5

domestically-owned firms Q and output by foreign-owned fl ms QM
P= A -Q-Q* (4)
Foreign-owned output Q* it assumed to be exogenous. This assumption is based on the belief that
foreign entry and expansion i" developing countries is typically determined by outside factors, such as
political risk, domestic resource ondowments, technological superiority, lower labor cosu, transport costs,
and infrastructure.
If domestic firms maxim:e profits in a Cournot competitive manner, we can solve (3) for q% ad
combine with (4) to yield the standard Cournot reaction function
qm p (5)
where n is the number of domestic firms in the indr ;try. An increases in foreign investment is
represented as an increase in Q*, and causes a fall in output by domestically-owned firms.'
To model the technology transfer from foreign-owned firms to domestic firms, we assume
domestic productivity is given by
A, 111a6QO (6)
If a is positive, domestic firms receive positive spillovers from foreign investment. We now combine
equation (6) with the reaction function in equation (5) to derive our estimating equation giving the
lomestic firm's output as a fuinction of inputs and foreign investment. The production function for
domestic fums in a given industry can be rewritten from (1) as
'A more extensive version of the theoretical model, which allows fo; endogenous entry and exit bydomestic firms, is derived in the appendix.
6

g,=zAl , _ AF (7)
Rearranging, this is equal to
qd =A x( (8)
Taking logs and substituting firm output q, (Q) from '1) together with (6), equation (8) becomes
I*gq 4 oSg ,+6Q'+log x- F (9)q(Q')
To determine the nature of the last term in equation 0), we replace q (Q) with the relationship in (5)
and linearize aF t Q5 0 to getq(QT)
- z -F(n+l) +yQ =C + y Q (IOA)q(Q') P-M
where
y5. F d - (n+l) (1OB)q2(0) dQ* (-rn) 2
7

'Me coefficient y will be negatve when lncroasr in Q cause domestic flrm output to contract since,
*Om (5), dQ 'dQ
Suktituting equation IOA into equation 9 gives domestic firm output as a function of inputs and
foreign investm.mnt
loS q - log -, + Q. + log x + C+yQ (11)
-C+ logx# + (t +y)Q' log 'i1
Foreign presence affects domestic total factor productivity through two distinct channels. First,
foreign presence can raise domestic plant productivity through technology spillovers, captured in the
model by the coefficient alpha. The term y captures the negative impact of foreign presence on domestic
productivity when increases in foreign activity lower the level of output optimally chosen by each
domestic firm. The value of -y will be negati e if an increase in foreign presence reduces domestic tow I
factor productivity by causing domestic output to contract.' Since these two e.fects move in opposite
I We have also considered the possibility that foreign investment cw'ld affect domestic returns to scalewhen there are no fixed costs. ' there are fixed costs with constant retuvis to scale Li factor inputs, thenthe negative scale effects of Q n TFP is correctly estimated by a log linear specification; variations ininputs will properly estimats input coefficients, and the Q* variable will capture the fixet cost component.To the extent, however, that there are increasing returns to scale on inputs and no fixed costs (ie a Cobb-
s

directions, estimation of quation 11) is required to determine the net effect of foreign presence on
domesta: productivity.
3. Foreign and Domestlc Firnm In Venezuela
Foreign ownership in Venezuela is restricted to minority partIcipation only in somw areas of
manufacturing, such as basic industies (iron, steel, and aluminum) and is only excluded from investing
In manufacturing enterprises in the petroleum sector. Although foreign investment in Venezuela has
generally averaged less than 10 percent of total assets in Venezuela's manufacturing sector (Table 1),
reforms initiated in 1986 and extended in 1990 are likely to incre e its role.'
The dataset employed in this paper is taken from the Venezuelan industrial survey (Enquesta
Douglas specification with the sum of the coefficients greater than unity), then the negative impact of anincrease in Q* will be underestima by a log linear specification: variations in productlvity associatedwith changes in scale will be reflected by variations in inputs. In Venezuela, the degree of bias is likelyto be small since the estimates reported in the paper suggest zoustant returns to scale in factor inputs.
Venezuelan firms are classified by degree of foreign ownership into three types: national, with lessthan 20 percent foreign ownership; mixed with 20 to 49.9 percent foreign ownership; and foreign fimns,with majority foreign control. Until 1989, the Superintendencia de Inversiones Extranjeras (SIEX)exercised subs .atial discretion in regulating the inflow of foreign investment. Profit remittances werelimited to 20 percent (plus LABOR) of the investment (based on book value). Since purchasing equityin existing firms was prohibited, foreign investment could only be in the form of direct investmentregistered with SIEX. Payments by a firm for its foreign partner's technology were prohibited, andcontracts that called for royalty or patent payments needed SIEX approval.
During the period from 1975 to 1989, foreign firms were discriminated against in a number ofdifferen; ways. First, they faced higher tax rates on corporate income-SO percent versus 35 percent fordomestic firms. lhey were also restricted from imposirg confidentiality and exclusive use of trade secretsin joint ventures. Finally, foreign firms were obliged to buy bolivares at the official exchange rate ratherthan the free market rate.
In 1989, the restriction on profit repatriation was elininated. Bureaucratic discretion waseliminated and SIMX was authorized to teject foreign investment applications only if they did not complywith the sectoral :estrictions discussed above. When exchange rates were unified following reforms, thediscrepancy between official and free market exchange rates were eliminated. The restrictions on use ofconfidentiality and trade secret requirements are currently being negotiated as part of agreements onproperty rights, and the differential tax rates between foreign and domestic fums is addressed in pendingtax legislation.
9

Industrat), which is conducted annually by the National Statistical Bureau (Oficina Central de Estadistica
e Infonmatica, OCE!). The years covered include 1976 through 1989, with the exception of 1980 (the
industrial survey is not taken in census years). The Enquesta Industrial covers all plants in the formal
sector with more than 50 workers, as well as a large sample of smaller plants. For the smaller plants,
OCEI calculates the sample weights, permitting aggregation of output and other variables to estimate the
total value for the entire manufacturing sector. The number of plants ranges from a low of 3,955 plants
in 1982 to a high of 6,044 plants in 1978. The data contain information on foreign ownership, assets,
employment, detailed cost information, location, and product destination. RespoLdents are guaranteed
anonymity in responding to the survey. Since the industrial census gives the percentage of subscribed
capital owned by domestic investors, it is possible to derive the mean share of foreign investment by year,
location, and sector. Table I shows the mean weighted share of the stock of FDI in manufacturing for
selected years, using number cf employees as the weight.7 Table 2 shows that the majority of the stock
of foreign investment over 1975-89 has been in autos (machinery, transport and metal products), basic
metals (iron, steel, and aluminum), chemicals, and food and beverages.
Table 3 compares the performance of foreign and domestic firms in terms of their labor
productivity, export and import behavior, and wages. On average, foreign owned firms exhibited higher
labor productivity, a higher propensity to import as well as export, and paid higher wages than their
domestic counterparts. The net contribution of foreign firms to foreign exchange earnings, defined as
export sales less expenditures on imported inputs, is also higher than for domestic firms. The
comparative results are robust to corrections for size, capital intensity, and skill composition of foreign
versus domestic firms.
The magnitude of technology transfer from foreign to domestic firms is likely to depend on the
7Since foreign firms tend to be more capital intensive than domestic firms, the share of foreign fuimsis significantly higher if weighted by physical capital.
10

magnitude of the productivity advantages exhibited by joint ventures. Although labor productivity
provides one measure of technology advantage, it is an imperfect measure since it varies with capital
intensity as well as with the level of other factor inputs. Therefore, we compared the total factor
productivity of the two sets of plants.
To compare the levels of total factor productivity between domestic plants and plants with foreign
equity participation, output is regressed on the type of ownership (foreign/domestic) of the plant, as well
as the plant's capital, materials, skilled labor, unskilled labor, and industry (at the four digit level).
Output is calculated as the value of sales less the change in inventories, deflated by a four-digit level
production price deflator. Skilled and unskilled labor are measured as the number of skilled and unskilled
employees. Although an ideal measure of labor input would be the number of hours worked, this
information is only availab'e for selected years. Material costs are adjusted for changes in inventories,
then deflated by a production price deflator. Capital stock is the stock of capital reported by each firm
at the beginning of thle year, deflated by the GDP deflator.
The results are presented in Table 4. In the first column of Table 4, foreign investment is
measured as a zero-one dummry variable. A firm is defined as "foreign" if at least some of its equity is
foreign-owned. After controlling for differences in inputs, the results show that firms vwith some foreign
equity (either joint ventures of foreign subsidiaries) had an 8.5 percent increase in output over domestic
firms in the same industry. Since we already control for input differences, this 8.5 % is a pure
productivity gain. In the second column of Table 4, foreign ownership is modelled as a continuous
variable which varies from 0 to 100 percent of the plant's total equity. These results show that a 10
percent increase in foreign ownership raises a firm's productivity by 1.36 percent. A 100 percent
increase in foreign ownership would raise productivity by 13.6 percent, which is approximately consistent
with the 8.5 % increase we estimate using the dummy variable approach in the first column of Table 4.
If foreign owners purchase shares in only the most productive domestic firms, the foreign
ii

ownership variable could simply act as a proxy for an unobserved productivity advantage unrelated to
ownership. By transforming the estimating equation into differences, we eliminate this unobserved fixed
effect, Isolating the productivity Impact of a change In ownership on a given plant. Table S presents the
results of regressing changes in the level of total factor productivity on changes in ownership, controlling
for changes in inputs. In column 1 foreign investment is modeled as a dummy variable, while in column
2 it is modeled as continuous variable. The fourth row in column I indicates that joint ventures exhibited
a level of total factor productivity which was 7.0 percent higher after 5 years than domestic firms which
remained domestically-owned. Since changes in capital are included, this increase in productivity is
independent of the increase in productivity from new investment which might accompany increases in
foreign ownership. The second column in Table 5 suggests that firms experiencing an increase in foreign
ownership of ten percentage points were 1.1 percent more productive after 5 years than firms which did
not change ownership.
One possible explanation for the productivity advantage accompanying foreign ownership is that
foreign firms are able to pick out future high performers and invest their capital in those plants. Yet it
seems doubtful that foreign investors would possess better information than domestic investors, or that
firms expecting higher future productivity performance would be biased towards foreign sources of
capital. The observed productivity advantage of firms with foreign equity participation is consistent with
the hypothesis that joint ventures possess a technological superiority over their domestic counterparts.
The next section examines whether any of this technological advantage 'spills over" to domestic firms.
4. Testing for Spillovers: Empirical Results
In the theoretical framework outlined above, we derived output q, denoted as Y,(j) for plant i in
sector j at time t, as a function of input x and foreign presence. Input x consists of plant i's unsk,lled
12
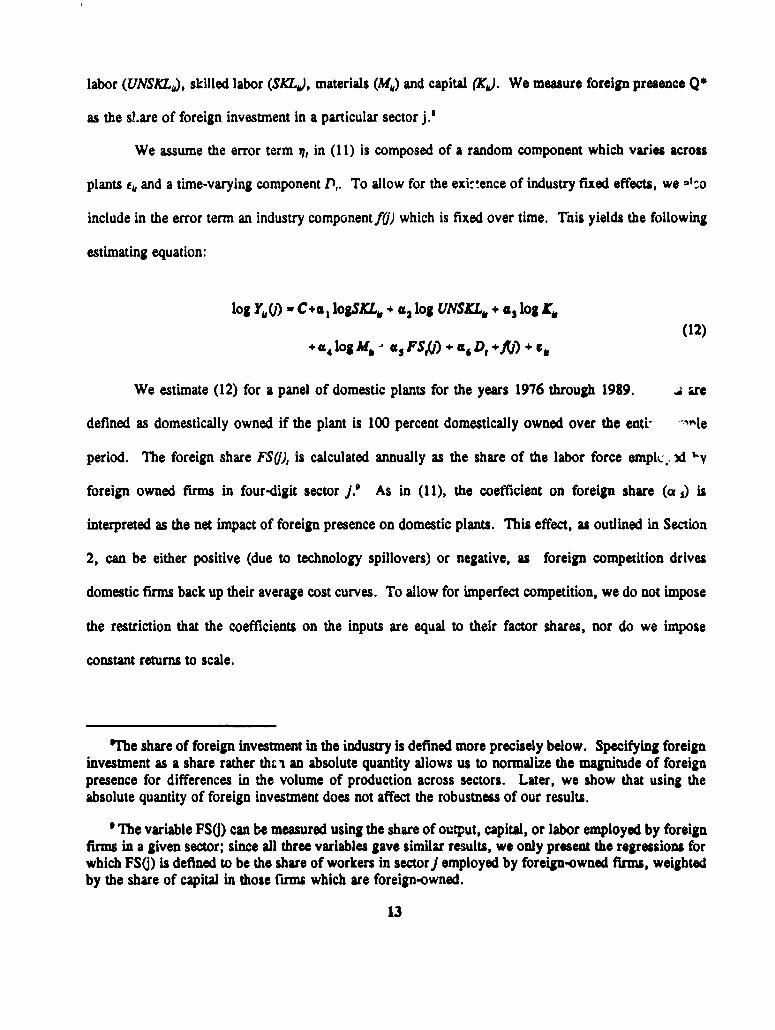
labor (UNSKLk, skilled labor (SKLB, materials (M) and capital (K). We meaure foreign presence Q
as the sLare of foreign investment in a particular sector j.'
We assume the error term a, in (11) is composed of a random component which varies across
plants ef and a time-varying component D,. To allow for the exif,ence of industry fixed effects, we '^o
include in the error term an industry componentf() which is fixed over time. Tnis yields the following
estimating equation:
log Y,TQ) u C+aj logSKEL, + a. log UNSKL,, + a, log K,(12)
+a4 log Mb , as FS,Q) + as De + t + g) ,
We estimate (12) for a panel of domestic plants for the years 1976 through 1989. . &re
defined as domestically owned if the plant is 100 percent domestically owned over the enti- ""le
period. The foreign share FS(), is calculated annually as the share of the labor force emplhv. xi "y
foreign owned firms in four-digit sector J.' As in (11), the coefficient on foreign share (a ,) is
interpreted as the net impact of foreign presence on domestic plants. This effect, as outlined in Section
2, can be either positive (due to technology spillovers) or negative, as foreign competition drives
domestic firms back up their average cost curves. To allow for imperfect competition, we do not impose
the restriction that the coefficients on the inputs are equal to their factor shares, nor do we impose
constant returns to scale.
'The share of foreign investment in the industry is defined more precisely below. Specifying foreigninvestment as a share rather thz i an absolute quantity allows us to normalize the magnitude of foreignpresence for differences in the volume of production across sectors. Later, we show that using theabsolute quantity of foreign investnent does not affect the robustness of our results.
' The variable FS() can be measured using the share of output, capital, or labor employed by foreignfirms in a given sector; since all three variables gave similar results, we only present the regressions forwhich FSO) is defined to be the share of workers in sectorj employed by foreign-owned firms, weightedby the share of capital in those rms which are foreign-owned.
13

4.1 The Impact of Foreign Investment: Reproducing Earlier Results
Previous tests for spillovers were performed by Globerman (1978) for Canadian data and
Blomstrom and Persson (1983) for Mexican data. These researchers used cross-section industry data to
estimate some variation of (12) at the sectoral level, where the coefficient on foreign share was
interpreted as a measure of spillovers from foreign presence to domestic firms. Past studies generally
estimated a positive value for this coefficient, although it was not always statistically significant. Since
previous researchers relied primarily on cross-section estimation, they were forced to ignore any sector-
specific fixed effect, which is captured by f() in (12). If foreign investors tend to gravitate towards
industries which have a higher level of total factor productivity, then the variable FS() will be positively
correlated with the error term, and the OLS estimate of the impact of foreign presence will be biased
upwards. Indeed, evidence from Venezuelan manufacturing firms suggests this is the case.
To illustrate, the first row of table 6 estimates (12) without controlling for the fixed effect f(j).
The coefficients on the inputs are all positive and statistically significant, as expected. The coefficient
on unskilled labor is three times as high as for skilled labor, indicating the higher share of unskilled labor
in total labor payments in Venezuela. The coefficient on FS(), is positive and statistically significant,
and the point estimate is in the same range as the results obtained in earlier work. The point estimate,
0.061, suggests that if the share of labor employed by foreign-owned firms rose from 0 to 10 percent of
the manufacturing sector, output would increase by 0.6 percent. Since the estimation controls for
increases in inputs, this 0.6 increase is a pure (total factor) productivity gain.
One way to correct for the bias caused by an industry fixed effect is to introduce sector dummy
variables to control for f(j) in (12). This would allow for fixed productivity differences across industries
caused by unobserved factors, exploiting the time series and within-industry variation in productivity to
isolate the impact of foreign investment. The second row in Table 6 reports the estimation results
including industry dummies at the two-digit level. Including industry dummies causes the coefricient on
14

foreign investment to switch from positive to negative and statistically insignificant. Introducing fcur-
digit industry dummy variables changes the estimate even more dramatically. Controlling for productivity
differences at the four-digit level, industries with greater foreign presence are significantly less productive
than those with no foreign presence. The negative impact is large and statistically significant. The
results in the third row of Table 6 imply that an increase in the share of foreign investment from 0 to 10
percent is accompanied by a decline in total factor productivity of 2.2 percent for domestic plants.'°
This evidence suggests that previous findings of a positive impact of foreign investment of
domestic productivity are not robust to the inclusion of industry, but reflect the tendency of foreign
investment to take place in more productive industries. If we interpret the coefficient in thc context of
the theoretical equation (11), the negative coefficient we observe in table 6 is consistent with a large
detrimental impact of foreign presence on the scale of domestically-owned production.
4.2 Separating Technology from Demand Effects
A negative coefficient on foreign share does not preclude the possibility that some technology
transfer from joint ventures to domestic firms does occur. For example, foreign investment could be
associated with declining nroductivity on aggregate and at the same time convey substantial benefits to
those few plants located nearby. In this section we attempt to disentangle the possible technology
spiliovers from the demand effects using the dispersion of foreign invcstment across regions.
In many theories of technology transfer, where technology is broadly defined to include anything
which allows the firm to produce more efficiently, the transfer of technology takes place at a local level.
10 lhe results are almost equivalent when we estimate (12) using "within" estimates, which arecomputed by subtracting from each variable its sector mean and running OLS on the transformedvariables. The reason why the two sets of estimates are not exactly equivalent is because we includetime-dummy variables, and the within estimates capture the interaction between the time and industryeffects.
15

Whether trained workers leave the joint venture to work at nearby domestic firms, or whether the joint
venture demonstrates a product, process or market previously unknown to domestic owners, the benefits
are likely to be received by neighboring domestic firms first before they diffuse to other, more distant
domestic firms. To the extent that technology is transferred locally, estimation of (12) should include
a variable which measures foreign presence within each region. It is also likely that the negative effect
of foreign investment is more likely to occur at the aggregate level, as domestic firms compete with joint
ventures in national markets. To test for the possibility that technology is transferred at the local level,
we broaden the analysis to include both regional and sectoral foreign share variables in the same
regression. We modify equation (6) to assume that a domestic firm's technology is a function of foreign
presence in its region s, as weli as regional fixed factors a,:
Al-III as eo (13)
Equation (11) now becomes
logq1 - C+logx1 + a Q8 +yQ +loga, + log i, (14)
The coefficient a determines the impact of regional foreign presence, while the coefficient y captures
the effect of national foreign investment. To estimate a, we include in the regression FS(,sX, defined
u the share of industry 3's workers in region s employed by foreign firms located in the industry and
region. The "unadjusted" estimation is given by
logY,, - Constant + a X logSKL + aslog UNSKL, + as logM(15)
+a4 logK&, +5S FS(f)t + s" FS(sA), +a7D, +flj) +a(s) +tv
16

where fC) is captured by a dummy variable Indicating the firm's four-digit Industry, and is included to
control for any industry-level factors.
If the location-specific productivity term a(s), is positively correlated with foreign sh&ar, FS(sJ)
over-estimates the impact of location-specific foreign investment on productivity. For example, foreign
firms may be more attracted to regions which benefit from agglomeration economies or bettor
infrastructure; we could observe a correlation between domestic productivity and foreign share in a
location even in the absence of spillovers. Variations in productivity due to agglomeratwn economies
or other region-specific effects may be captured by levels in the real skilled wage. For the United States,
Rauch (1991) also provides empirical evidence that variations in human capital accumulation across cities
is reflected in higher wages for indiv!nuals. Another factor which can be used to capture exogenous
differences in productivity across regions in Venezuela is the price of energy. The government
encouraged relocation to some regions by implementing uneven energy subsidies acrou regions.
Differences in electricity prices could have affected both productivity as well as foreign relocation across
regions.
Including the log of the skilled wage for all industries in region s Oog Wage(s)) and the log of
eectricity prices (og Elecp(s). can be used to control for these location-specific productivity effects.
The resulting "adjusted" estimation equation Is given by
logY - Constn + allogSKL,, + xlogUNSKL*,+ a5logM4 +a4logK,(16)
+as FS(f),+ axFS(sJ),+ aD,+ a. log Wage(s), + a ogEkcp(s), +ftj) +g1
Since foreip investment in any one four-digit industry is unlikely to significantly affect the skilled wage
for all industries in the region, the skilled wage will be independent of FS(sJ),.
Foreign share, electricity prices, and the skilled wage are calculated at the district level. Venezuela
17

is divided into 23 regions, which in turn are subdivided into districts. Regions may have several or as
many as 20 districts. In all, the total number of region-district locations adds up to 220 separate
locations. In a country one-third larger than the state of Texas, this indicates that the average district size
is 40 miles wide by 40 miles long (1600 square miles). Appendix Table A. I shows the average share
of labor employed at foreign owned firms and the standard deviation of this measure across
region-districts. The size of the standard deviations in Table A. I indicates that foreign presence is not
uniformly distributed across industries and across regioni."
Estimates of the impact of regional foreign share on domestic firm productivity are given in Table
7. The coefficients on sectoral foreign investment are negative and significant as before. For both the
adjusted and unadjusted estimates, the coefficient on regional foreign investment is statistically
insignificant, and when the real skilled wage and electricity prices are included, the coefficient on foreign
investment falls to zero. We find a consistently positive and large association between the real skilled
wage and individual firm productivity. The association with electricity prices (although much smaller)
is also statistically significant and negative as expected. This suggests that foreign investment is likely
to locate in areas with highly productive skilled workers or lower energy prices, biasing the unadjusted
estimates upwards. We also experimented with other measures which might reflect location-specific
productivity differences, such as the number of firms in each location, rent prices, and the
industry-specific skilled wage in the location, but the results were unchanged.
The within estimates are reported in the last row of Table 7. These estimates were computed by
subtracting from each variable its region-sector mean over time. This formulation allows us to control
for any unobserved differences across regions and sectors. It would be equivalent to including both sector
and region dummies in the estimation, as well as sector-region interactive terms. The within estimates
'"Although the table shows industry values at the two-digit level, the regressions were estimated withall industry variables calculated at the four-digit level.
18

support the results in the first and second rows, indicating no statistically signiflcant impact of
region-specific foreign investment on domestic firm productivity growth.
Two conclusions can be drawn from the results presented in the previous two sections. The first
is ihat if technology transfer indeed takes place, it is overwhelmed by the negative productivity effects
of joint ventures on domestically-owned firms. The second is to the extent that domestic and foreign
firms compete on national (and not local) markets, there is no evidence to support the hypothesis that
technology is transferred locally from joint ventures to domestically-owned firms. It is interesting to note
that the empirical results confirm case study evidence for Venezuela claiming very little cases of
technology transfer from multinationals to domestically-owned firms (Matos(1977)). In the next section,
we explore the robustness of our results.
43 Alternative Specifications
One possible explanation for the insignificant coefficient on regional foreign presence is the fact
that new technology may only slowly filter through to domestic firms. Consequently, the positive impact
of foreign investment on observed productivity may not appear for several years. It is also likely that
the negative effect. of foreign investment would dissipate over time as the adverse impact of competition
disappeared.
One simple test for this is to examine the impact of foreign investment on domestic firm
productivity growth over a longer time horizon. Table 8 presents a "long difference' version of Table
7, using one-year, two-year, three-year and four-year differences of all the dependent and independent
variables instead of deviations from sector-region means. Our previous results are generally maintained
in this dynamic specification, although some interesting differences emerge. We continue to see a strong
negative impact of sectoral foreign share and a generally insignificant (but positive) impact of regional
19

forsign share on productivity. 7The trends In the point estimates, however, are quite interesting. The
negative impact of sectoral foreign presence diminishes slightly over time. At the same time, the point
estimates on regional foreign presence become more positive and increase in magnitude over time. The
coefficient on the three year lag for foreign share Is positive and statistically significant, but the estimate
is smaller and insignificant for the fourth lag. These results on local foreip presence provide some weak
evidence of technology spillovers.
Another possibility is that foreign investment is specified incorrectly. The specification used
earlier in the paper Is a weighted average of foreign investment in each sector, where foreign investment
is defined as the share of the plant's assets which are foreign owned and the weights are given by the
number of employees in the plant. Table 9 reports the coefficient on foreign share using three alternative
definitions. First, foreign share was redefined as the total number of employees in plants where at least
5 percent of assets are foreign owned, divided by the total number of employees in all plants in that
sector. This is described in Table 9 as 'unweighted". Second, foreign share was redeflned as a zero-one
variable, equal to one if there is any foreign investment at all in a region. This specification could only
be applied to the regional estimates, since there is some foreign invtstment in all sectors in Venezuela.
T'he rationale for this specification is that the Impact of foreign Investment may be nonlinear. One foreign
plant in a sector could potentially have as much impact on technology transfer as several foreign firms.
Finally, instead of defining foreign presence as a share, we redefined it as the number of employees
employed by foreign firms. We also included total employment in the regression to control for aggregate
employment changes. This specification is the closest to the theoretical model developed earlier. This
specification provides a test of whether the negative coefficient on foreign share could be due to the
possibility that foreign firms do not adjust quickly to economic downturns, while domestic firms react
immediately. This would lead us to observe a rising foreign share during periods of economic decline.
The results presented in Table 9 suggest that the impact of sectoral foreign ir ;estment on
20

domestic plant productivity Is robust to alternative specifications for foreign presence. The coefficient
on "unweigiited' foreign presence, at botb the sector and regional level is statistically significant and
negative. If we define foreign investmnent as a zero-one dummy variable in each re-ion, the results are
mixed. The levels estimates give a positive and statistically significant coefficient on regional DFI, but
the coefficient in the within estimates is significantly negative. The within estimates are more likely to
be unbiased, since the levels estimation captures the fact that foreign invasunent is attracted to regions
with higher productive capacity. Finally, we present separate estimates for the numerator (number of
employees in plants with foreign equity) and the denominator (total sectoral employment) used to calculate
the foreign share variable. The results confirm that defining foreign investment as a share variable does
not lead to spurious results. The coefficient on foreign iiivestment continues to be statistically significant
and negative at both the sector and region level. Total employment within a sector has a positive but
insignificant impact on domestic plant productivity.
These results point to two robust, but quite different conclusions about the impact of foreign
investment on productivity in Venezuela's manufacturing sector. On the one hand, plants with rising
foreign participation exhibit significant and positive productivity gains over time. On the other hand,
plants which do not receive foreign investment appear to suffer as a result of increases in joint venture
activity. One natural question to ask is what is the net impact of these two offsetting forces? Table 10
combines all plants to estimate the impact of foreign investment using aggregate data. Although the
results are not directly comparable to the plant-level estimation, they do provide evidence regarding the
aggregate effects of foreign investment on productivity. The results show that the positive effects far
outweigh the negative impact, in part because the estimates at the aggregate level give much greater
weight to larger plants. The within estimates suggest that an increase in foreign investment from 10 to
21

20 percent of the manufacturing sector would increase aggregate productivity by S. 1 percent.h
5. Conclusion
Many developing countries now actively solicit foreign investment, offering income tax holidays,
import duty exemptions, and subsidies to foreign firms. One justification for subsidizing these firms is
the so-called "spillover' of technology from foreign to domestic firms. Despite the significant interest in
the possibilit,; of such spillovers, there have been no empirical tests using micro data. Using a panel of
more than 4000 Venezuelan plants between 1975 and 1989, this pape-r tests for the existence of
technology transfer via foreign firms.
First, we examine the relative performance of joint ventures and domestic firms. We find that
plants with some foreign investment consistently outperform domestic plants. We also find that increases
in foreign equity participation are strongly correlated with increases in plant productivity. This suggests
that the host country does benefit from foreign equity participation through the irnproved performince
of joint ventures.
Second, we measure the impact of joint venture activity and wholly owned foreign subsidiaries
on the productivity of plants who receive no foreign investment. Facing fewer data limitations thaii any
of the previous studies, we find that foreign investment negatively affects productivity of domestic fiiT.
These negative effects are large and robust to alternative specifications of the model. Although previous
studies generally found positive effects, we show that these results can be explained by the tendency for
multinationals to locate in the more productive sectors.
We conclude that there do exist benefits from foreign investment, but that such benefits are
internalized by joint ventures. In other words, foreign investment provides direct benefits to those firms
22 The within estimates differ from the dummy variable estimates presented in the second rowbecause the dummy variable specification does not include time-industry interactive terms.
22

receiving the investment, but there are no 'spillovers' to other plants. This suggests that industrializing
countries suich as Venezuela are correct in emphasizing the benefits from foreign investmeu t to e
recipients, However, we also conclude that less emphasis should be placed on any externalitiV .r
"spillovers' to other local firms.
23

References
Blornstrom, Magnus, 1986. "Foreign Investment and Productive Efficiency: the Case of Mexico", TheJournal of Industrial Economics, Vol.XXV, September.
Blomstrom, Magnus, 1989. Foreign Investment and Spillovers. Routledge, London and New York.
Blomstrom, Magnus, and Hakan Persson, 1983. "Foreign In.vestment and Spillover Efficiency in anUnderdeveloped Economy: Evidence from the Mexican Manufacturing Industry", WorldDevelopment, Vol. 11, Number 6.
Blomstrom, Magnus and Edward W. Wolff, 1989. 'Multinational Corporations and ProductivityConvergence in Mexico". NYU working paper.
Caves, Richard E., 'International Corporations: The Industrial Economics of Foreign Investment",Economica, February.
Caves, Richard E., 1974. 'Multinational firms, Competition, and Productivity in Host-Country Markets",Economica, May.
Caves, Richard E., 1982, Multinational Enterprise and Economic Analysis, Camnbridge University Press.
Davies, H., 1977, "Technological Transfer through Commercial Transactions", Journal of IndustrialEconomics, 26 (December), pp. 165-7 1.
Edfelt, R.B., 1975, Direa Investment in a Developing Economy: Towards Evaluating the HumanResource Development Impact in Brazil, Ph.D. Thesis, University of California, Los Angeles.
Germidis, Dimitri, 1977. 7hansfer of Technology by Multinational Corporations, two volumes,Development Centre of the Organization for Economic Co-operation and Development,Paris.
Globerman, Steven, 1979. "Foreign Direct Investment and 'Spillover' Efficiency Benefits in CanadianManufacturing Industries", Canadian Journal of Economics, February.
Goncalves, R., 1986 "Technological Spillovers and Manpower Training: A Comparative Analysis ofMultinational and National Enterprises in Brazilian Manufacturing", Journal of DevelopmentEconomics, XI July.
Grieco, J.M., 1986, "Foreign Investment and Development: Theories and Evidence", in T. Moran, ed.Investing in Development: New Roles for Privawe Capital?, Overseas Development Council,Washington, DC
Helleiner, G.K., 1989, "Transnational Corporations and Direct Foreign Investment", in ed. H. Cheneryand T.N. Srinivasan, Handbook of Development Economics, Vol. II, Ch. 27.
24

Helpman, E., 1984, "A Simple Theory of International Trade with Multinational Corporations", Journalof Political Economy, Vol. 92, pp. 451-471.
Horstman, I. and J. Markusen, 1989, "Firm-Specific Assets and the Gains from Direct ForeignInvestment", Economica, 56 (February), pp. 41-48.
Hynier, S, 1960, "The International Operations of National Firms: A Study of DirectInvestment", Ph.D. Thesis, MIT, Cambridge, MA.
Kindleberger, C.P., 1969, American Bisiness Abroad: SLx Lectures on Direct Investment, YaleUniversity Press, New Haven.
Krugman, P., 1983, "The New Theories of International Trade and the MultinationalEnterprise", in C.P. Kindleberger and D. Audretch, eds. The Multinational Corporationin the 1980's, Cambridge, MA, MIT Press.
Matos, Luis, 1977, 'Multinational corporations and transfer of technology: the case ofVenezuela", in Germidis, D, editor. Transfer of Technology by MultinationalCorporations, Volume I, Development Centre of the Organization for Economic Co-operation and Development, Paris.
Rauch, James E., 1991, "Productivity Gains From Geographic Concentration of Human Capital:Evidence from the Cities", University of California, San Diego.
Rhee, Y.W. and T. Belot, 1989, "Export Catalysts in Low-Income Countries", Industry and EnergyDepartnent, Industry Series Paper No.5, The World Bank.
Riedel, J., 1975, "The Nature and Determinants of Export-Oriented Direct Investment: A Case Study ofTaiwan", Weltwirrschaftliches Archiv, No.3, pp.507-578.
Rugman, A., 1986, "New Theories of the Multinational Enterprise: An Assessment of InternalizationTheory", Bulletin of Economic Research, 38:2, pp.101-118.
Steuer, M.D. et al, 1973, The Impact of Foreign Direct Inzvestment on the United Kingdom, London.
Teece, D.J., 1977, "Technology Transfer by Multinational Firms: The Resource Cost of TransferringTechnological Knowhow", Economic Journal, 87 (June), pp242-261.
Watson, C.E., 1972 "The Brazilianization of U.S. Subsidiaries", Personnel, July-August.
Willmore, L., 1976, "Direct Foreign Investment in Central American Manufacturing", WorldDevelopment, 4 (June), pp.499-517.
Willmore, L., 1986, "The Comparative Performance of Foreign and Domestic Firms in Brazil", WorldDevelopment Vol. 14 No.4, pp. 489-502.
25

l'able 1: The Share of Foreign Direct Investment in Manufacturlng(percent weighted by number of employees)
r ..L_: =2 ..... =-.. -.- - - . .1 - __________________
_________1 91976 El 1981 1989
'. rPduriAuts 8 5 6
Testilevs c& Clothing 6 6 3
A 'i 1:. oiucjus 0 0 2
,'-et & Publishing 10 11 9
i' , ri.als, Petrol 6 8 7
! ote-ry, Glass 6 8 7
rl SiL Metals 7 6 12
i aN1hinery 9 9 13
1 ,c'essional 8 t0 4. Equipment
26

Table 2: Distribution of Foreign Ownership Acrou Sectors(percent weighted by number of employees)
Sector 1976 1981 1989
Food Products 24 15 19
Textiles & Clothing 16 14 6
Wood Products 0 0 1
Paper & Publishing 9 12 8
Chemicals, Petrol 11 17 14
Pottery, Glass 6 7 6
Basic Metals 6 7 15
Machinery 26 28 31
Professional 1 1Equipment . .
Total 100 100 100
27
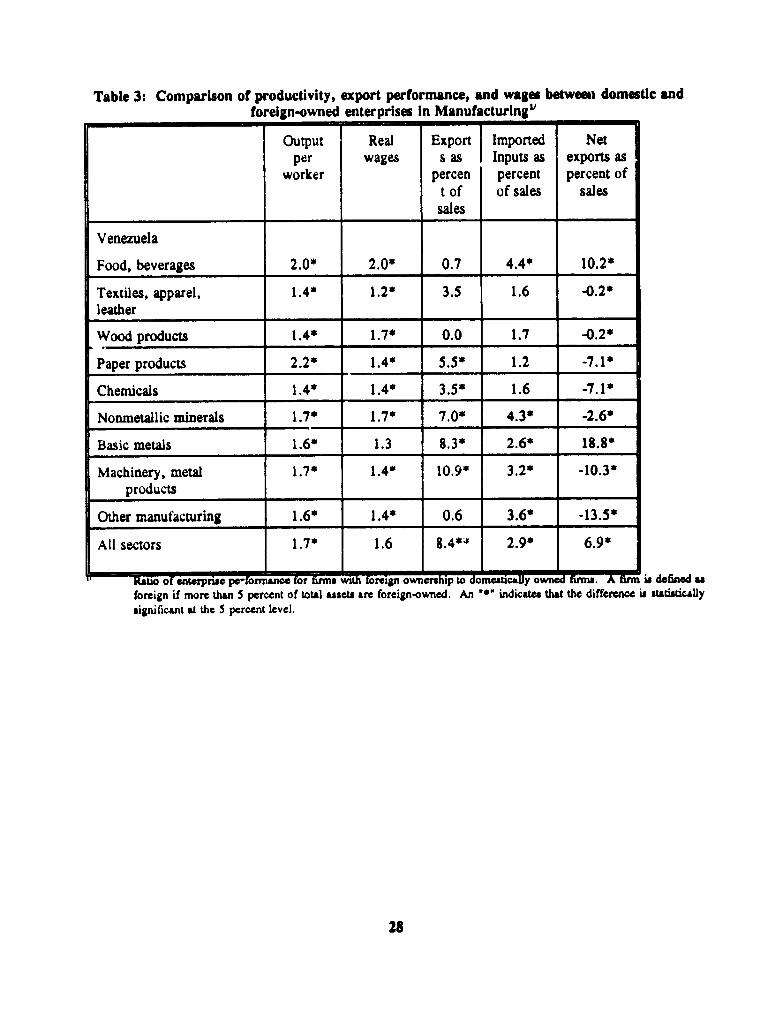
Table 3: Comparison of productivity, export performance, and wages betwee domestic andforeign-owned enterprises in ManufacturingU
Output Real Export Imported Netper wages s as Inputs as exports as
worker percen percent percent ofs of of sales salessales
Venezuela
Food, beverages 2.0* 2.0* 0.7 4.4* 10.2*
Textiles, apparel, 1.4* 1.2* 3. 1.6 0.2*leather I IWood products 1.4* I 1.7* 0.0 1.7 40.2* |
Paper products 2.2* 1.4* 5.5* 1.2 -7.1*
Chemicals 1 .4* 1 .4* 35* 1.6 -7.1*
Nonmetallic minerals 1.7* 1.7* 7.0* 4.3* -2.6*
Basic metals 1.6* 1.3 8.3* 2.6* 18.8*
Machinery, metal 1.7* 1.4* 10.9' 3.2* -10.3*products
Other manutacturing 1.6* 1.4* 0.6 3.6* -13.5*
All sectors 1.7* 1.6 8.4*' 2.9* | 6.9*
Ratio o enterp pefor ically owned fin A fir dfined asforeign if more than S percent of totAl asset are foreign-owned. An *' indicates that the difference is statiatic.llysignificant at the 5 percent level.
28

Table 4: Comparing the Level of Total Factor Productivity (T?)Betwee Forap and Domesticaily-Owned Flrms
Coefficet on Foreign Ownership I/
Seotor 0-1 Dummy Variable 21 Continuous Variable 3/
Food Products 0.091 0.113(4.1) (3.2)
Textiles and Clothing 0.099 0.248(3.3) (3.9)
Wood Products 0.095 0.06S(1.8) (0._)
Paper and Publishing 0.080 0.18O(2.9) (4.1)
Potter, and uLass 0.147 0.282(5.5) (5.2)
Buie Metals -0.001 -0.046(0.0) (0.6)
Machinery and Equipment 0.077 0.104(4.7) (3.5)
All Industries 0.085 0.136(6.6) (6.4)
1/ Coefficients are eatimated from a regrssion of log output mgressed on (log) materials, skiLie labor, unskilled labor,annual time dummies, four-digit SIC industry dummies and one of 2 measures of foreign ownership. T-statistics aeSiven in 0.
V Firms am considered foreign-owned if the share of foreign ownership of the firm's capital is grter than zero.3/ The share of fium equity which is foreign owned, varies between 0 and 100%.
Table 5: Comparing Total Factor Productivity Growth (TFP)Between Foreign and Domestically-Owned Firms
Coeffcient on Foreign Ownership 1/
Long Differences 0-1 Dummy Variable 2/ Continuous Variable 3/
Two-year differences 0.015 0.027_________________________ ~~~(1.7) (i.6)
Three-year Differences 0.026 0.042___________________________ ~~(2.4) (2.1)
Four-year differences 0.045 0.071_________________________ ~~~(3.7) (2.8)
Five-year Differences 0.070 0.112________________________ ~~~~(4.4) (3.7)
1/ Coefficient are estimated from a regression of log changes in (log) output gresed on changes in (log) materials,skilled labor, unskilled labor and annual time dummy variables. T-statistics in parenthescs.
V Coefficient on changes in foreign ownership dummy variable, equal to 1 if foreign ownership is geter than zero.3/ Coefficient on changes in the firm's share of capital which is foreign owned.
29

Tpble 6: Impact of Sectoral Foreign Investment on Productivityof Domestic Firnu
Dependent Variable - Log Output Produced by Domestically-Owned Firms
Sample I Independeut Variables
Materials Capital Unskl Ski ForeignLabor Labor Presence
Without lndustry Du 'mies 0.569 0.084 0.296 0.110 0.061
obs=35514 (327.0) (59.2) (103.7) (44.7) (1.9)
With 2-digit Dummies 0.573 0.076 0.293 0.114 -0.028
obs=35514 (272.9) (44.7) (84.8) (39.4) (0.9)
With 4-digit Dummies 0.585 0.060 0.293 0.108 -0.223
obs- 35514 (280.2) (36.8) (87.7) (39.0) (3.8)
T-statistics in parentheses. Domestlcally-owned firms defined as firms which had no foreign ownershipover the entire sample period. All regressions include annual time dummy variables.
30
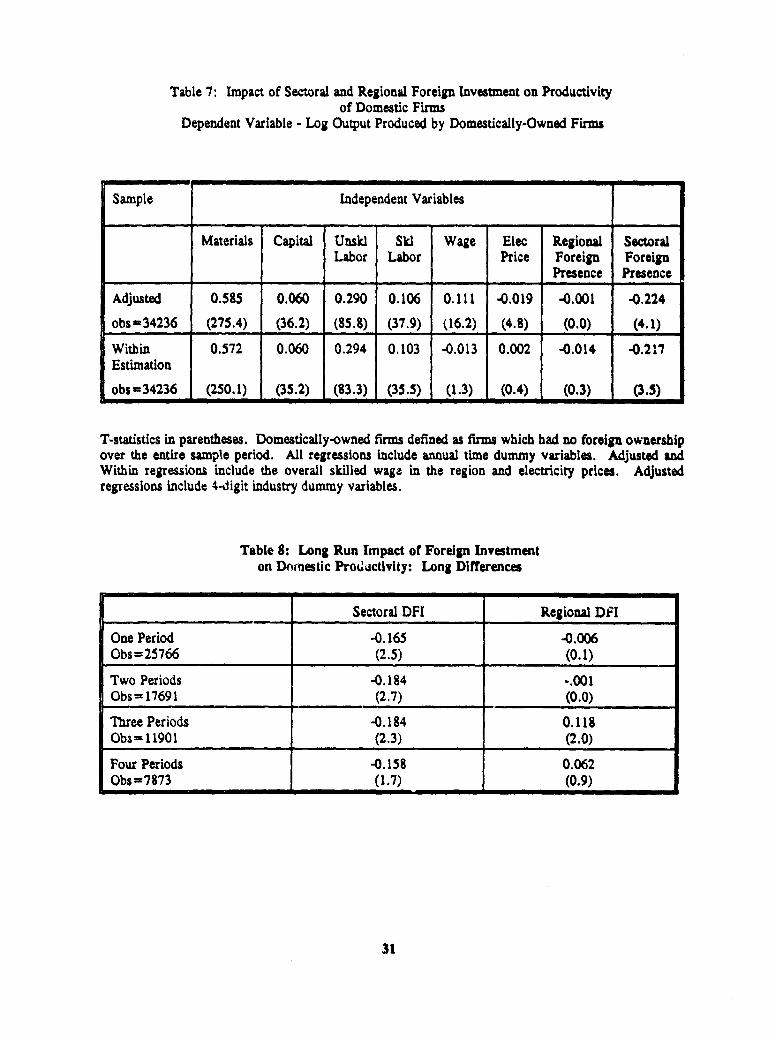
Table 7: Impact of Sectoral and Regional Foreign Investment on Productivityof Domestic Firms
Dependent Variable - Log Output Produced by Domestically-Owned Firms
Sample Independent Variables
Materials Capital Unskl Skl Wage Elec Regional SwctoralLabor Labor Price Foreign Foreign
Presence Presence
Adjusted 0.585 0.060 0.290 0.106 0.111 .0.019 -0.001 -0.224
obs = 34236 (275.4) (36.2) (85.8) (37.9) (16.2) (4.8) (0.0) (4.1)
Within 0.572 0.060 0.294 0.103 40.013 0.002 -0.014 -0.217Estimation
obs = 34236 (250.1) (35.2) (83.3) (35.5) (1.3) (0.4) (0.3) (3.5)
T-statistics in parentheses. Domestically-owned firms defined as firms which had no foreign ownershipover the entire sample period. All regressions include annual time dummy variables. Adjusted andWithin regressions include the overall skilled wage in the region and electricity prices. Adjustedregressions include 4-digit industry dummy variables.
Table 8: Long Run Impact of Foreign Investmenton Domnestic Pro(.Xctlvlty: Long Differences
Sectoral DFI Regional DPI
One Period -0.165 -0.006Obs = 25766 (2.5) (0.1)
Two Periods -0.184 -.001Obs = 17691 (2.7) (0.0)
Three Periods -0.184 0.118Obs= 11901 (2.3) (2.0)
Four Periods -0.158 0.062Obs =7873 (1.7) (0.9)
31
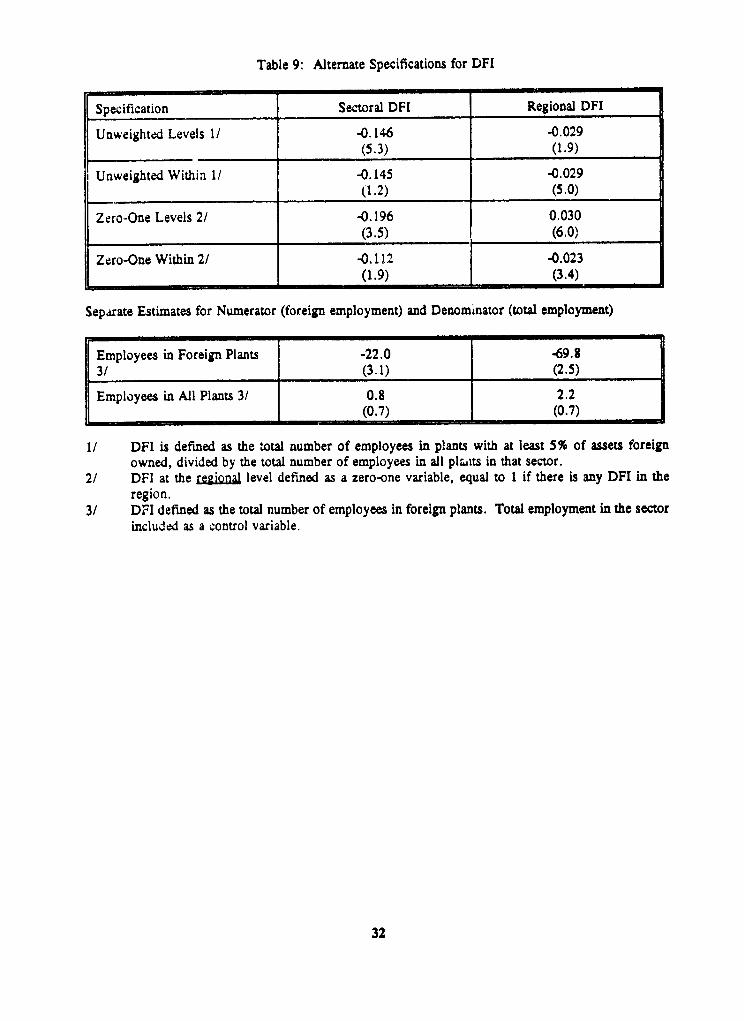
Table 9: Alternate Specifications for DFI
Specification Sectoral DFI Regional DFI
Unweighted Levels 1/ -0.146 -0.029(5.3) (1.9)
Unweighted Within 1/ -0.145 -0.029(1.2) (5.0)
Zero-One Levels 2/ -0.196 0.030(3.5) (6.0)
Zero-One Within 2/ -0.112 -0.023__________________________ (1.9) (3.4)
Separate Estimates for Numerator (foreign employment) and Denominator (total employment)
Employees in Foreign Plants -22.0 -69.83/ (3.1) (2.5)
Employeesin All Plants 3/ 0.8 2.2IL_ 1~~~~~ (0.7) (0.7)
1/ DFI is defined as the total number of employees in plants with at least 5% of assets foreignowned, divided by the total number of employees in all plaits in that sector.
2/ DFI at the regional level defined as a zero-one variable, equal to 1 if there is any DFI in theregion.
3/ DFI defined as the total number of employees in foreign plants. Total employment in the sectorincluded as a control variable.
32

Table 10: Impact of foreign Investment on total factorproductivity using aggregate datau
Plant-level date aggregated to industry-level Coefficient on Foreigp Share2'
All plants: foreign and domestic
No industry dummy 0.567Variables (6.0)
Industry dummy 0.357Variables included (3.4)
Within estimates 0.505(4.8)
Only wholly domestically-owned plants__
No industry dummy 0.1 1Variables (1.2)
Industry dummy -0.468Variables included (4.5)
Within estimates -0.487(4.8)
Log total output in the four-digit sector is regressed on the foreign share of the sector, the logsof sectoral materials, skilled labor, unskilled labor, and annual time dummies. T-statistics aregiven in ( ).
2v Coefficients correspond to total labor employed in foreign-owned firms in a 4-digit sector dividedby the total labor force in that sector.
2' Firms are defined as wholly domestically-owned if they retain 100 percent domestic ownershipthroughout the sample period.
33

Appendix Table A.1: The Share of Labor enployed at Foreign-ownedFirnm - Means and Standard Deviations across Region-Districts
Sector - Average Foreign Share
T 1975-77 1 1982-84 198648 1Food Products 2.8% 2.7% 3.6%
___________ __ (10.5%) (10.5%) (13.8%)
Textiles & Clothing 1.1 0.9(5.5) ('.S) (6.3)
Wood Products 0.2 0.4 1.0(2.2) (3.2) (7.1)
Paper & Publishing 6.8 8.6 7.2_ _________________ (11.8) (16.7) (16.7)
Pottery ard Glass 2.8 3.8 4.4(8.4) (13.8) (14.5)
Basic Metals 5.0 4.8 5.9___ ___ ___ ___ _ _ (12.6) (12.6) (13.8)
Machines and 3.1 3.2 3.7Equipment (10.0) (10.5) (11.8)
Standard deviations in parentheses
34

Figu 1: Output Response of Doamesic Fumns to Fomip Ewy
AC,
q
35

APPENDIX
This appendix extends the model presented in the paper to allow for entry and exit of domestic
firms.
Zero Profts and Free Entry
We extend the model to allow for the impact of foreign investment on entry and exit of
domestically-owned firms, accounting for the optimal firm behavior given in (5) We show the estimation
in equation 11 remains unchanged with entry and exit, provided the least efficient domestic firms are the
first to be driven out by foreign competition.
Domestically-owned firms enter or exit until the marginal firm earns zero profits. Firm i earns
profits according to
R-(P-m)qj-F, (Al)
Substituting into this expression the first order condition for profit maximization under Cournot
competition, profits become
We allow for the possibility that not all firms have the same fixed costs, and we assume that as
firms enter, each new firm faces a higher fixed cost than the previous entrant; firms continue to enter
until the marginal firm receives zero profits. To capture this fixed cost relationship, we assume fixed
costs for the ith firm are given by
36

FIuF(I) F'>O (A3)
Combining equation (A2) and (A3)
I11 uq2 -F(aT) (A4)
There exists a marginal firm n such that profits in (A4) are zero. This firm produces q, according to
(AS):
q.F^) 2 (AM)
Firn symmetry guarantees the level of output in (AS) will be productd by all firms:
qjmF(n)2 (A6)
Equations (5) and (A6) jointly determine the level of output and the number of firms which satisfy both
the profit maximization and the zero profit conditions. To solve for the level of output explicitly, we
rewrite (A6) in terms of n:
n sF-'(q:)) (A7)
Combining (A7) with the reaction function in (5) gives
qF.; p-Q*gM (A8)F3'(q)
37

Equation (AS) implicitly defines equilibrium domestic firm output q1(Q) as a function of foreign output.
Applying the implicit function theorem to (AS) gives
dqi ,[ ' (1+2gq P-2-, F-(Q,)-']<O (M9)dQ* mel (n+1)2
which is negative when P-1'>,,O Substituting (A9) into (IOB) gives the equation for y accounting
for entry and exit:
ye [ (I+2q. (ne 1 F (Q)-9]<O (AIO)q2(o) nm elV
Provided F-11 is positive, allowing free entry and exit does not change the
result that foreign entry reduces domestic productivity by forcing domestic firms to spread their fixed
costs over lower output.
Ihis prediction holds only if fixed costs vary across domestic firms. If fixed costs are identical
for all firms (F"-l O) then enough domestic firms exit in response to foreign entry such that eacii
remaining domestic firm's output remains unchanged (y - 0). iLf, however, fixed costs vary across
firms, and firms with the highest fixed cost are the first to exit, then the domestic output will contract
in response to foreign entry partially through the exit of domestic firms and partly through lower levels
of production for remaining domestic firms.
Although allowing entry and exit does not change the estimation equation, it does introduce
sample selection bias when estimating y. Exit insures that foreign entry drives out the least efficient
firms in the sector, lowering the sector's average fixed cost; the firms which remain in sectors
experiencing high foreign presence will be more productive, resulting in biased estimates of the impact
of foreign presence on a domestic firm's productivity. We show below that entry and exit bias the
38
estimated 'y to be higher (lees negative) than the true -y.
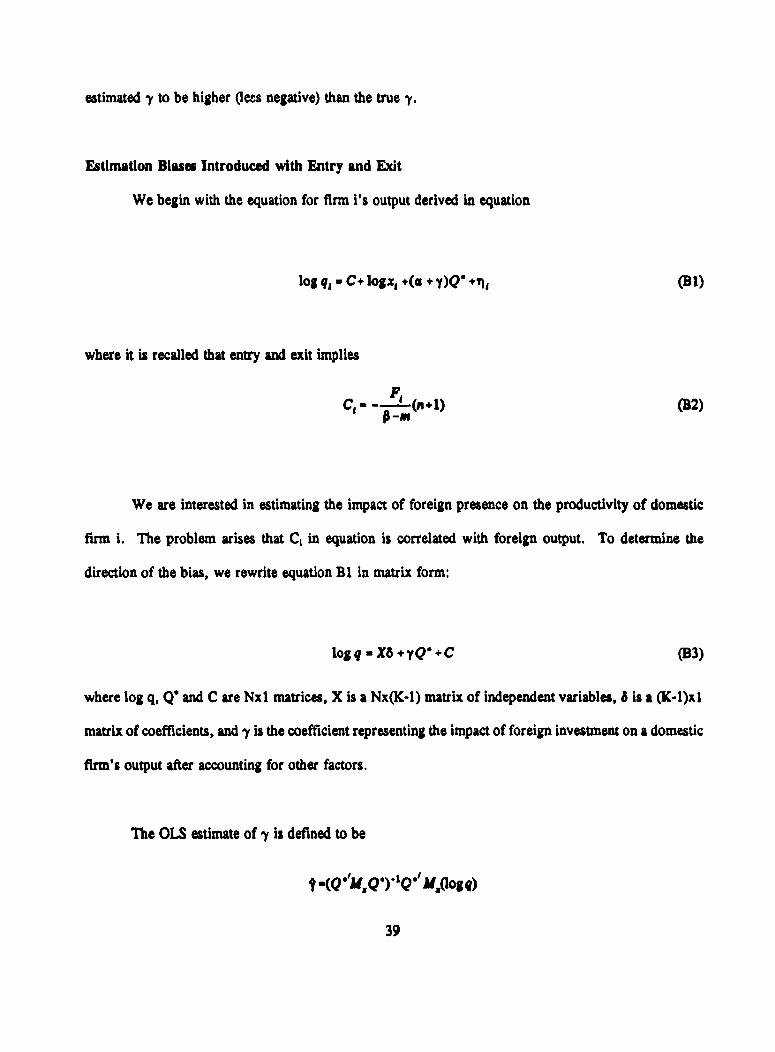
Estimation Blases Introduced with Entry and Exit
We begin with the equation for firm i's output derived in equation
log q, u C+ logx +( + y)Q +%, (Bi)
where it is recalled that entry and exit implies
Cf. F, (n+1) (82)
We are interested in estimating the impact of foreign presence on the productivity of domestic
firm i. The problem arises that Ci in equation is correlated with foreign output. To determine the
direction of the bias, we rewrite equation Bl in matrix form:
logq - Xo yQ +C (B3)
where log q, Q and C are Nxl matrices, X is a Nx(K-1) matrix of independent variables, 6 is a (K-I)xl
matrix of coefficients, and 'y is the coefficient representing the impact of foreign investment on a domestic
firm's output after accounting for other factors.
The OLS estimate of y is defined to be
t1 (QofMQ Q)'T Q11 Mx8 ogq)
39

* y(Q8 IMQ Q)-IQ IMQ + (Q'M1 Q.) 4Qh'C
mY + (QM QT)- Q'MsQ + (Q'MsQ*) Qs C
my +(QM 1Q')-,Q C (B4)
where Q"M. represents the element of Q orthogonal to the matrix X. To determine the direction of
the bias we compute the correlation between Q' and C. We show that Q is positively correlated with
C, and therefore the estimate y is biased upward, understating the negative impact of foreign presence
on the domestic firm's productivity.
To determine the correlation between Q and C, we examine the interaction between Q and the
stochastic term Fi in equation B2. Firm i's fixed costs can be decomposed into the average fixed cost
for industry j to which firm i belongs, and the deviation of firm i's fixed costs from the industry average.
The average fixed cost in industry j (denoted FQ)) is determined by
FJE) = n f F(u)du (B5)
40

where n(j) is given by equation 12 in the text to be
nU) -F-1 (q2 (Q*Q))) (B6)
Differentiating equation B6 with respect to foreign output in sector j gives
dn) s-F- l <O (B7)dQOj) dQ'
Exogenous increases in foreign output result in the fall in the number of domestic firms in the industry.
We can now determine the effect of foreign output on average fixed costs by differentiating equation B5
with respect to Q:
dFQ) = dFU) ='%Q) co (B8)dQ dnQ) dQQ)
Average fixed costs in the sector fall with foreign investment as foreign entry drives out the domestic
firms with the highest fixed costs.
To solve the correlation between Q' and F1 let Q' denote the average foreign output actoss
sectors, and similarly let F be .verage fixed costs for all domestic firms.
41

The correlation between F, and Q' () is given by
E,Ay[F1 -FJ[QQ' -Q'
mE,EFF, ) -F)+.][Q()-QJ (B9)
"E,EA(FaJ(J))(QQ) Q0 +( 4)XQ(j -Q)]
UEAFQ)-J'(QQ)-Q)1 0°
and is negative from equation B8.
Since F 1is negatively correlated witL. Q(i) it follows that C=-FPl-R is positively correlated
with Q(j). lherefore t understates the true negative impact of foreign presence on domestic
productivity.
42

Policy Research Working Paper Series
ContactTttle Author Date for paper
WPS1221 Does Research and Development Nancy Birdsall November 1993 S. RajanContribute to Economic Growth Changyong Rhee 33747in Developing Countries?
WPS1222 Trade Reform in Ten Sub-Saharan Faezeh Foroutan November 1993 S. FallonCountries: Achievements and Failures 38009
WPS1223 How Robust Is a Poverty Profile? Martin Ravalllon November 1993 P. CookBenu Bidani 33902
WPS1224 Devaluation in Low-inflation Miguel A. KIguel November 1993 R. LuzEconomies Nha Ghei 39059
WPSI 225 Intra-Sub-Saharan African Trade: Faezeh Foroutan November 1993 S. FallonIs It Too Little? Lant Pritchett 38009
WPS1226 Forecasting Volatiiity in Commodity Kenneth F. Kroner November 1993 F. HatabMarkets Devin P. Kneafsey 35835
Stijn Claessens
WPS1227 Designing Water Institutions: Marie Leigh Livingston December 1993 C. SpoonerMarket Failures and Institutional 30464Response
WPS1228 Competition, Competition Policy, Bernard M. Hoekman December 1993 L. O'Connorand the GATT Petros C. Mavroidis 37009
WPS1229 The Structure, Regulation, and E. P. Davis December 1993 P. Inf antePerformance of Pension Funds in 37642Nine Industrial Countries
WPS1 230 Unemployment in Mexico: Its Ana Revenga December 1993 R. StephenCharacteristics and Determinants Michelle Riboud 37040
WPS1231 Making a Market: Mass Privatization Nemat Shafik December 1993 A. Correain the Czech and Slovak Republics 38549
WPS1232 Will GATT Enforcement Control J. Michael Finger December 1993 N. ArtisAntidumping? K. C. Fung 37947
WPS1233 Hedging Cotton Price Risk in Sudhakar Satyanarayan December 1993 D. GustafsonFrancophone African Countries Elton Thigpen 33714
Panos Varangis
WPS1234 Price Formation, Nominal Anchors, Andr6s Solimano December 1993 S. Florezand Stabilization Policies in Hungary: David E. Yuravlivker 39075An Empirical A- ilysis
Policy Research Working Paper Series
ContactTitle Author Date for paper
VPS1235 Eastem Europe's Experience with Alfredo Thorne December 1993 N. JoseBanking Reform: Is There a Role for 33688Banks In the Transiton?
WPS1236 The Impact of Two-Tier Producer Maurkec Schift December 1993 S. Fallonand Consumer Food Pricing in India 38009
WPS1237 Bank Performance and the Impact Yavuz Boray Deomber 1993 C. Urnof Financial Restructuring in a Hector Sierra 30864Macroeconomic Framework: A NewApplication
WPS1238 Kenya: Structural Adjustment In the Gurushri Swamy January 1994 V. Sakianha1980s 35742
WPS1239 Principles of Regulatory Policy David E. M. Sappington January 1994 WmRDesign 31393
WPS1240 Financing the Storm: Macroeconomic William Easterly January 1994 R. MartinCrisis in Russia, 1992-93 Paulo Visira da Cunha 39026
WPS1 241 Regulation, Institutions, and Pablo T. Spiller January 1994 B. MooreCommitment in the British Ingo Vogelsang 35261Telecommunications Sector
WPS1242 Financial Policies in Socialist Boris Pleskovic January 1994 M. JanduCountries in Transition 33103
WPS1243 Are Institutional Investors an Punam Chuhan January 1994 R. VoImportant Source of Portfolio Investment 31047in Emerging Markets?
WPS1244 Difficulties of Transferring Risk- Edward J. Kane January 1994 P. Sintim-AboagyeBased Capital Requirements to 38526Developing Countries
WPS1245 The Adding-Up Problem: Strategies Takamasa Akiyama January 1994 A. Kimfor Primary Commodity Exports Donald F. Larson 33715in Sub-Saharan Africa
WPS1246 Determinants of Cross-Country Branko Milanovic January 1994 R. MartinIncome Inequality: An *Augmented 39065Kuznets' Hypothesis
WPS1247 Complex Transactions Under Andrew Stone January 1994 P. Sintim-AboagyeUncertainty: Brazil's Machine Tool Industry 37644
WPS1248 Do Domestic Firms Benefit from Brian Aitken February 1994 D. BallantyneForeign Direct Investment? Evidence Ann Harrison 37947from Panel Data