do demographics explain structural inflation?78415781-b4d... · expenditure — reflects the life...
TRANSCRIPT
Do demographics explain structural inflation?
Executive summaryIn aggregate, the world’s population is graying, caused by a combination of lower birthrates and longer lifespans. Another worldwide phenomenon is a 25 year-long decline in the rate of inflation. Accepted doctrine is that these two trends are intertwined — many observers believe that aging results in shrinking consumption which leads to lower inflation. We believe this relationship may be reversed — we believe that aging may lead to higher inflation, meaning that the US could face higher structural inflation in the future.
May 2018
Ray JanssenSenior Analyst,Invesco
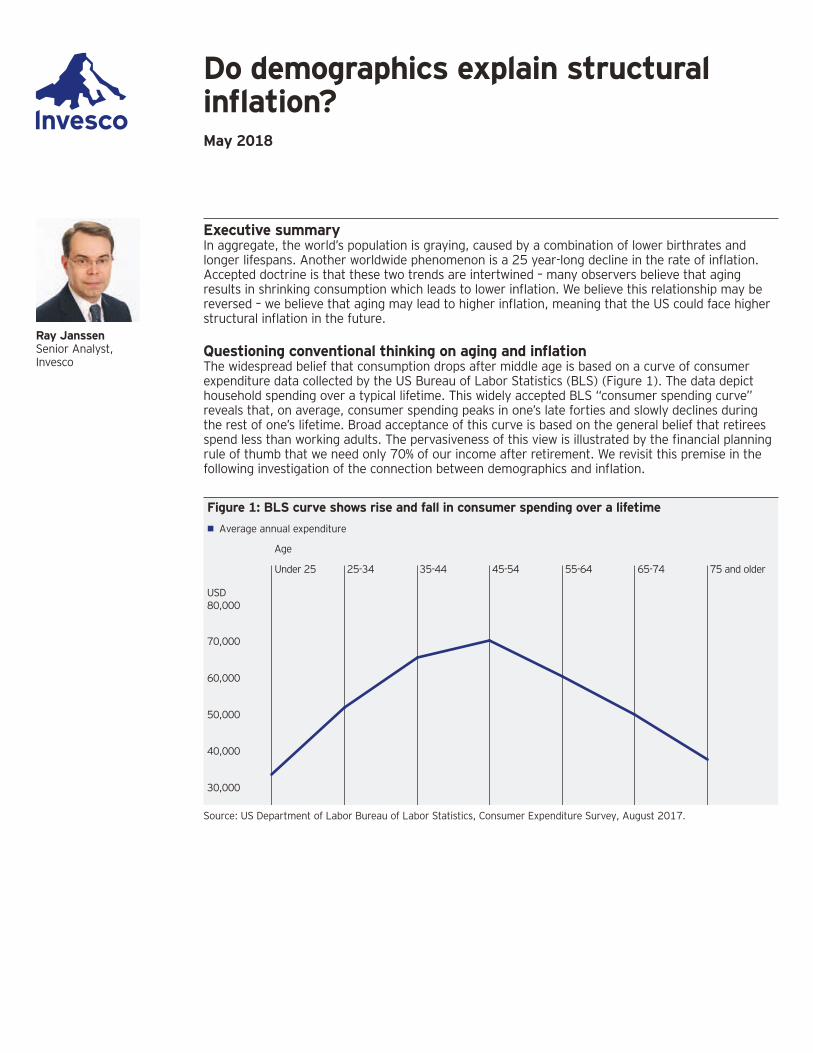
Questioning conventional thinking on aging and inflationThe widespread belief that consumption drops after middle age is based on a curve of consumer expenditure data collected by the US Bureau of Labor Statistics (BLS) (Figure 1). The data depict household spending over a typical lifetime. This widely accepted BLS “consumer spending curve” reveals that, on average, consumer spending peaks in one’s late forties and slowly declines during the rest of one’s lifetime. Broad acceptance of this curve is based on the general belief that retirees spend less than working adults. The pervasiveness of this view is illustrated by the financial planning rule of thumb that we need only 70% of our income after retirement. We revisit this premise in the following investigation of the connection between demographics and inflation.
Figure 1: BLS curve shows rise and fall in consumer spending over a lifetime
• Average annual expenditure
Source: US Department of Labor Bureau of Labor Statistics, Consumer Expenditure Survey, August 2017.
30,000
40,000
50,000
60,000
70,000
USD80,000
Age
Under 25 25-34 35-44 45-54 55-64 65-74 75 and older

“BLS spending curve” misses part of the storyOur analysis suggests that the BLS consumer expenditure curve does not accurately represent how an individual’s consumption varies over a lifetime. First, this is because the BLS expenditure data reflect household versus individual consumption. The shape of the BLS curve — a rise and fall in expenditure — reflects the life cycle of a typical family, which grows and shrinks as children are born and leave home, causing a corresponding cycle in household spending. Because the BLS data do not measure an individual’s spending over a lifetime, we utilize alternate data to measure lifecycle spending patterns.
Second, the curve fails to account for consumption paid for by a third party such as Medicare in the US, which accounts for the bulk of US retirees’ medical spending. Third, analyzing only consumption (i.e. only the demand side of the equation) is flawed, in our view, since inflation results from imbalances in both supply and demand. Rather, we believe that any robust theory of inflation dynamics must also include an analysis of supply. This means an individual’s labor input must also be part of the analysis.
Starting from scratch: An individual’s contribution to an economy’s supply and demandGiven these shortcomings of the consumer expenditure data, we searched for an alternative data source to document the supply and demand that an individual imparts to an economy. We identified broadly representative data collected by the National Transfer Accounts, an international consortium of economists and other social scientists investigating the impacts of population aging.
These data are shown in Figure 2 and suggest that an individual’s consumption curve is not bell shaped as traditionally accepted, but rather increases steadily throughout most of our lives. As a very young child, an individual’s consumption is initially very low. As we age, consumption increases via increased food intake, formal education and activities such as entertainment. After formal education spending concludes (late teens or early 20’s) and young adults are no longer financially supported by their parents, individual spending falls temporarily before gradually rising as young adults begin to accumulate belongings, such as furnishings and cars, and become financially independent. Spending continues to slowly rise as it begins to include more “wants” (vacations, luxury goods, etc.) versus predominately “needs” (food, shelter). Eventually, later in life, needs begin to overtake wants, as the need for medical care for the elderly begins to escalate until the end of life.
The supply curve is much simpler: one’s productivity rises quickly upon entrance to the workforce and eventually peaks during middle age, given the limitations of the human body, particularly for physical work. Labor supply falls immediately toward zero once retirement begins, but rather than falling sharply, the curve is smoothed by variations in retirement ages by country, profession and individual preference.
2
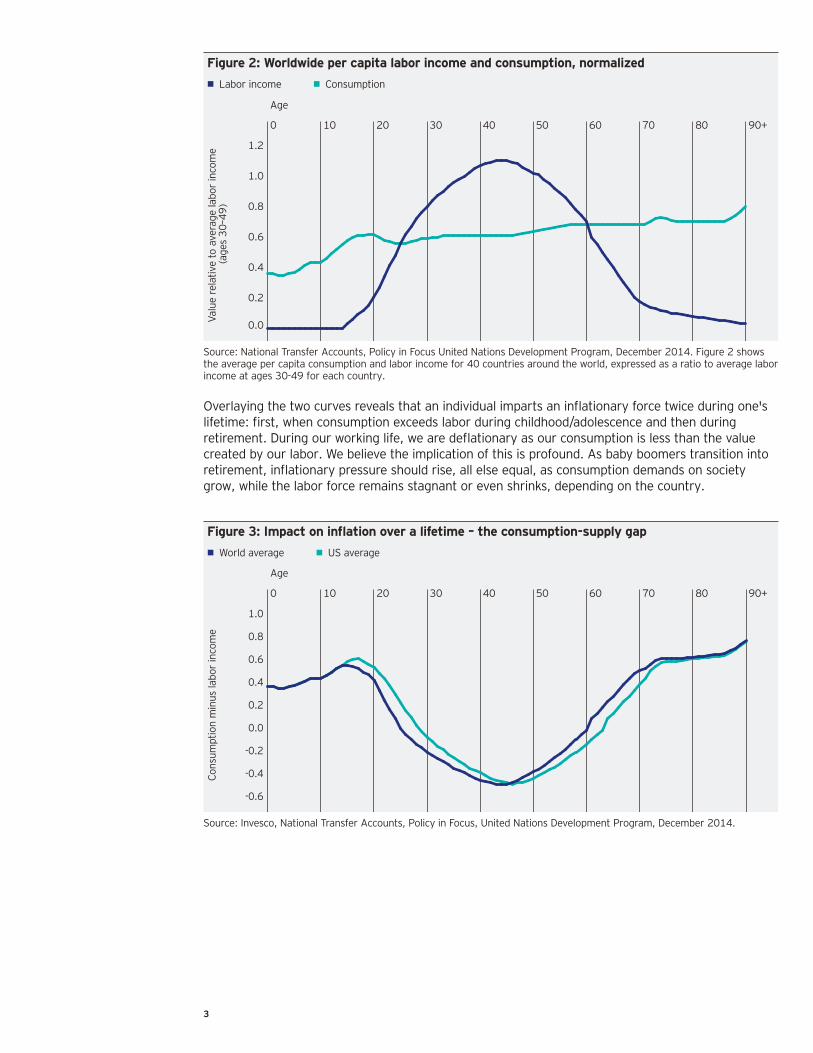
Figure 2: Worldwide per capita labor income and consumption, normalized
• Labor income • Consumption
Valu
e re
lativ
e to
ave
rage
labo
r in
com
e (a
ges
30–4
9)
0.0
0.2
0.4
0.6
0.8
1.0
1.2
90+80706050403020100
Age
Source: National Transfer Accounts, Policy in Focus United Nations Development Program, December 2014. Figure 2 shows the average per capita consumption and labor income for 40 countries around the world, expressed as a ratio to average labor income at ages 30-49 for each country.
Figure 3: Impact on inflation over a lifetime — the consumption-supply gap
• World average • US average
Cons
umpt
ion
min
us la
bor
inco
me
90+80706050403020100
Age
-0.6
-0.4
-0.2
0.0
0.2
0.4
0.6
0.8
1.0
Source: Invesco, National Transfer Accounts, Policy in Focus, United Nations Development Program, December 2014.
3
Overlaying the two curves reveals that an individual imparts an inflationary force twice during one's lifetime: first, when consumption exceeds labor during childhood/adolescence and then during retirement. During our working life, we are deflationary as our consumption is less than the value created by our labor. We believe the implication of this is profound. As baby boomers transition into retirement, inflationary pressure should rise, all else equal, as consumption demands on society grow, while the labor force remains stagnant or even shrinks, depending on the country.
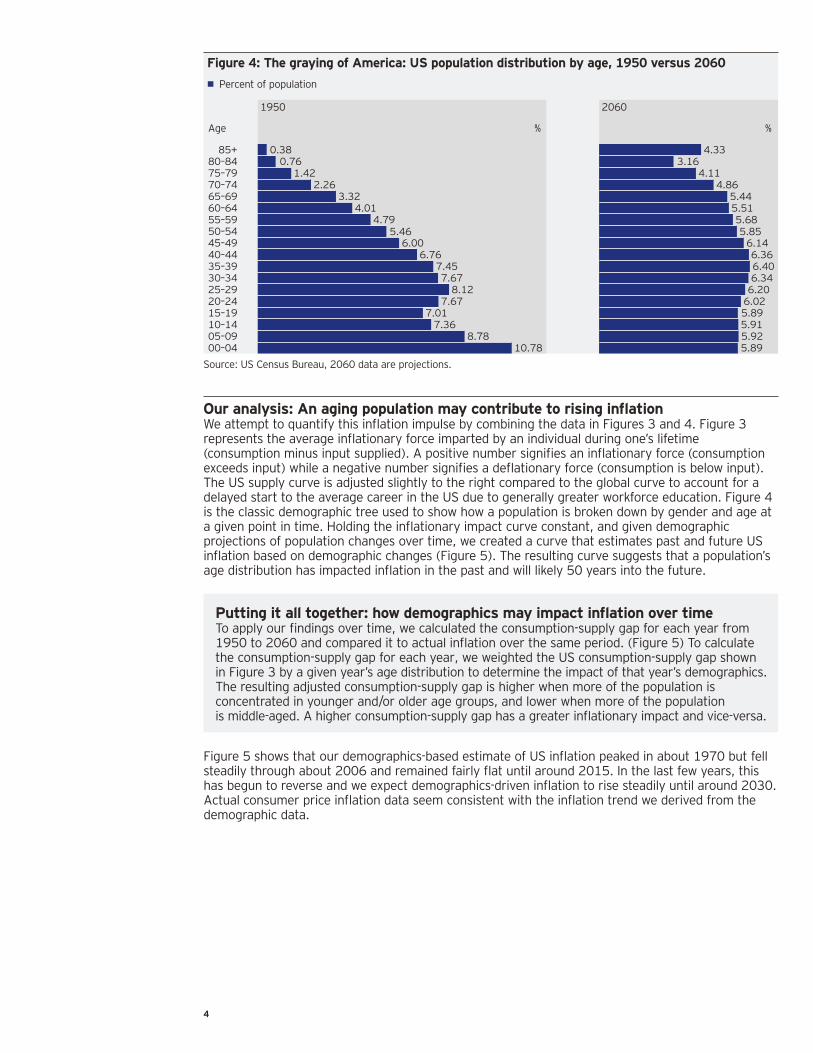
Figure 4: The graying of America: US population distribution by age, 1950 versus 2060
• Percent of population
Age % %
1950
00–0405–0910–1415–1920–2425–2930–3435–3940–4445–4950–5455–5960–6465–6970–7475–79 1.42
2.263.32
4.014.79
5.466.00
6.767.457.67
8.127.67
7.017.36
8.7810.78
3.164.11
4.865.445.515.685.85
6.146.366.406.34
6.206.025.895.915.925.89
4.33
2060
Source: US Census Bureau, 2060 data are projections.
Our analysis: An aging population may contribute to rising inflationWe attempt to quantify this inflation impulse by combining the data in Figures 3 and 4. Figure 3 represents the average inflationary force imparted by an individual during one’s lifetime (consumption minus input supplied). A positive number signifies an inflationary force (consumption exceeds input) while a negative number signifies a deflationary force (consumption is below input). The US supply curve is adjusted slightly to the right compared to the global curve to account for a delayed start to the average career in the US due to generally greater workforce education. Figure 4 is the classic demographic tree used to show how a population is broken down by gender and age at a given point in time. Holding the inflationary impact curve constant, and given demographic projections of population changes over time, we created a curve that estimates past and future US inflation based on demographic changes (Figure 5). The resulting curve suggests that a population’s age distribution has impacted inflation in the past and will likely 50 years into the future.
Putting it all together: how demographics may impact inflation over time To apply our findings over time, we calculated the consumption-supply gap for each year from 1950 to 2060 and compared it to actual inflation over the same period. (Figure 5) To calculate the consumption-supply gap for each year, we weighted the US consumption-supply gap shown in Figure 3 by a given year’s age distribution to determine the impact of that year’s demographics. The resulting adjusted consumption-supply gap is higher when more of the population is concentrated in younger and/or older age groups, and lower when more of the population is middle-aged. A higher consumption-supply gap has a greater inflationary impact and vice-versa.
Figure 5 shows that our demographics-based estimate of US inflation peaked in about 1970 but fell steadily through about 2006 and remained fairly flat until around 2015. In the last few years, this has begun to reverse and we expect demographics-driven inflation to rise steadily until around 2030. Actual consumer price inflation data seem consistent with the inflation trend we derived from the demographic data.
4
80–84 0.7685+ 0.38
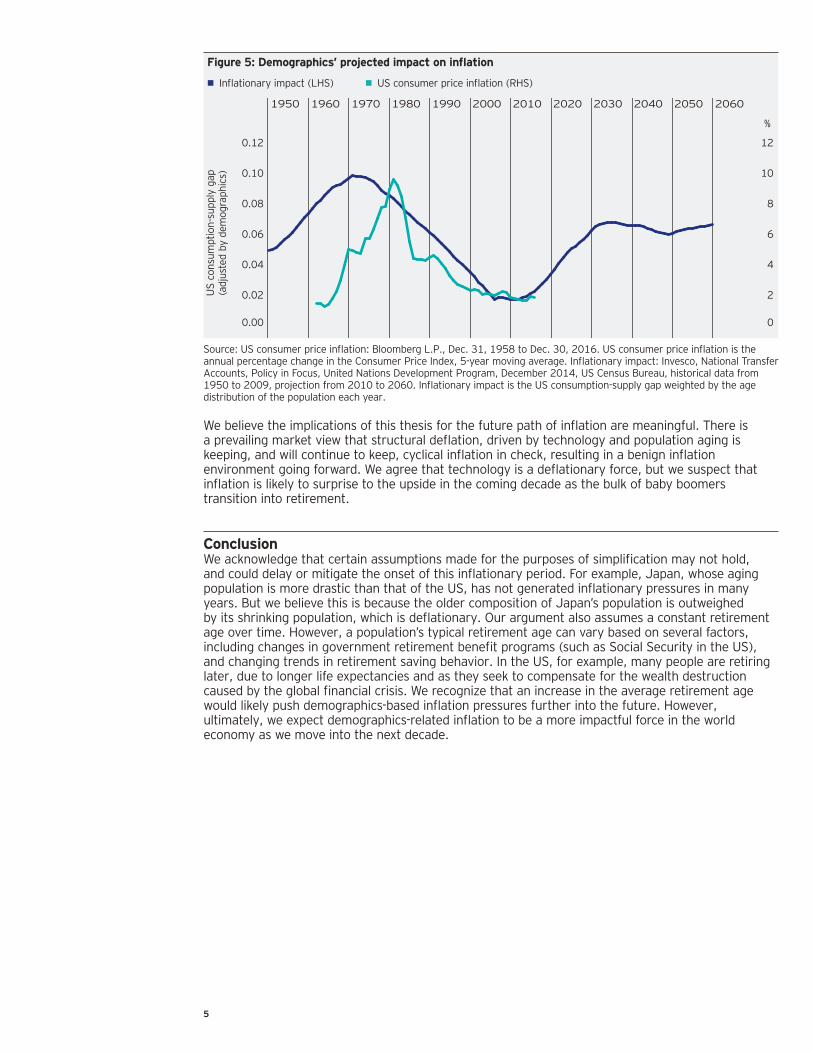
Figure 5: Demographics’ projected impact on inflation
• Inflationary impact (LHS) • US consumer price inflation (RHS)
%
US
cons
umpt
ion-
supp
ly g
ap(a
djus
ted
by d
emog
raph
ics)
0.00
0.02
0.04
0.06
0.08
0.10
0.12
0
2
4
6
8
10
12
20601950 1960 1970 1980 1990 2000 2010 2020 2030 2040 2050
Source: US consumer price inflation: Bloomberg L.P., Dec. 31, 1958 to Dec. 30, 2016. US consumer price inflation is the annual percentage change in the Consumer Price Index, 5-year moving average. Inflationary impact: Invesco, National Transfer Accounts, Policy in Focus, United Nations Development Program, December 2014, US Census Bureau, historical data from 1950 to 2009, projection from 2010 to 2060. Inflationary impact is the US consumption-supply gap weighted by the age distribution of the population each year.
We believe the implications of this thesis for the future path of inflation are meaningful. There is a prevailing market view that structural deflation, driven by technology and population aging is keeping, and will continue to keep, cyclical inflation in check, resulting in a benign inflation environment going forward. We agree that technology is a deflationary force, but we suspect that inflation is likely to surprise to the upside in the coming decade as the bulk of baby boomers transition into retirement.
ConclusionWe acknowledge that certain assumptions made for the purposes of simplification may not hold, and could delay or mitigate the onset of this inflationary period. For example, Japan, whose aging population is more drastic than that of the US, has not generated inflationary pressures in many years. But we believe this is because the older composition of Japan’s population is outweighed by its shrinking population, which is deflationary. Our argument also assumes a constant retirement age over time. However, a population’s typical retirement age can vary based on several factors, including changes in government retirement benefit programs (such as Social Security in the US), and changing trends in retirement saving behavior. In the US, for example, many people are retiring later, due to longer life expectancies and as they seek to compensate for the wealth destruction caused by the global financial crisis. We recognize that an increase in the average retirement age would likely push demographics-based inflation pressures further into the future. However, ultimately, we expect demographics-related inflation to be a more impactful force in the world economy as we move into the next decade.
5

Important Information
This document has been prepared only for those persons to whom Invesco has provided it for informational purposes only. This document is not an offering of a financial product and is not intended for and should not be distributed to retail clients who are resident in jurisdiction where its distribution is not authorized or is unlawful. Circulation, disclosure, or dissemination of all or any part of this document to any person without the consent of Invesco is prohibited.
This document may contain statements that are not purely historical in nature but are "forward-looking statements," which are based on certain assumptions of future events. Forward-looking statements are based on information available on the date hereof, and Invesco does not assume any duty to update any forwardlooking statement. Actual events may differ from those assumed. There can be no assurance that forwardlooking statements, including any projected returns, will materialize or that actual market conditions and/or performance results will not be materially different or worse than those presented.
The information in this document has been prepared without taking into account any investor’s investment objectives, financial situation or particular needs. Before acting on the information the investor should consider its appropriateness having regard to their investment objectives, financial situation and needs.
You should note that this information:
• may contain references to amounts which are not in local currencies• may contain financial information which is not prepared in accordance with the laws or practices of you country of
residence;• may not address risks associated with investment in foreign currency denominated investments; an• does not address local tax issues
All material presented is compiled from sources believed to be reliable and current, but accuracy cannot be guaranteed. Investment involves risk. Please review all financial material carefully before investing. The opinions expressed are based on current market conditions and are subject to change without notice. These opinions may differ from those of other Invesco investment professionals.
The distribution and offering of this document in certain jurisdictions may be restricted by law. Persons into whose possession this marketing material may come are required to inform themselves about and to comply with any relevant restrictions. This does not constitute an offer or solicitation by anyone in any jurisdiction in which such an offer is not authorised or to any person to whom it is unlawful to make such an offer or solicitation.