do concrete materials specifications address real performance? david a. lange university of illinois...
TRANSCRIPT
ILLINOIS
University of Illinois at Urbana -Champaign
ILLINOISUniversity of Illinois at Urbana -Champaign
Do Concrete Materials Specifications Address Real Performance?
David A. LangeUniversity of Illinois at Urbana-Champaign
ILLINOIS
University of Illinois at Urbana -Champaign
ILLINOISUniversity of Illinois at Urbana -Champaign
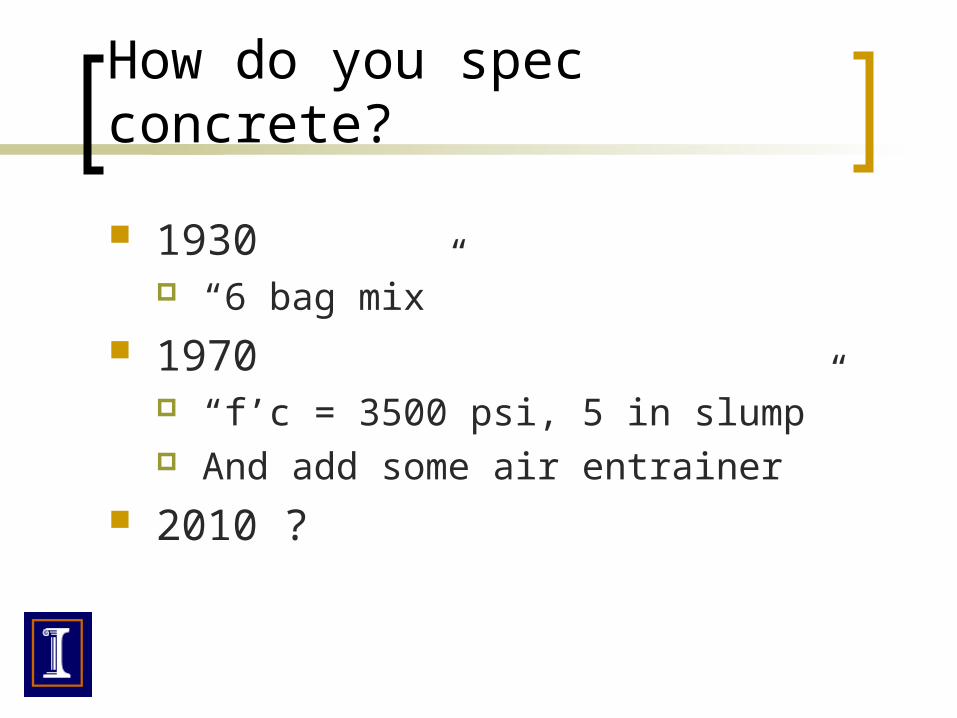
How do you spec concrete?
1930 “6 bag mix”
1970 “f’c = 3500 psi, 5 in slump” And add some air entrainer
2010 ?
ILLINOIS
University of Illinois at Urbana -Champaign
ILLINOISUniversity of Illinois at Urbana -Champaign
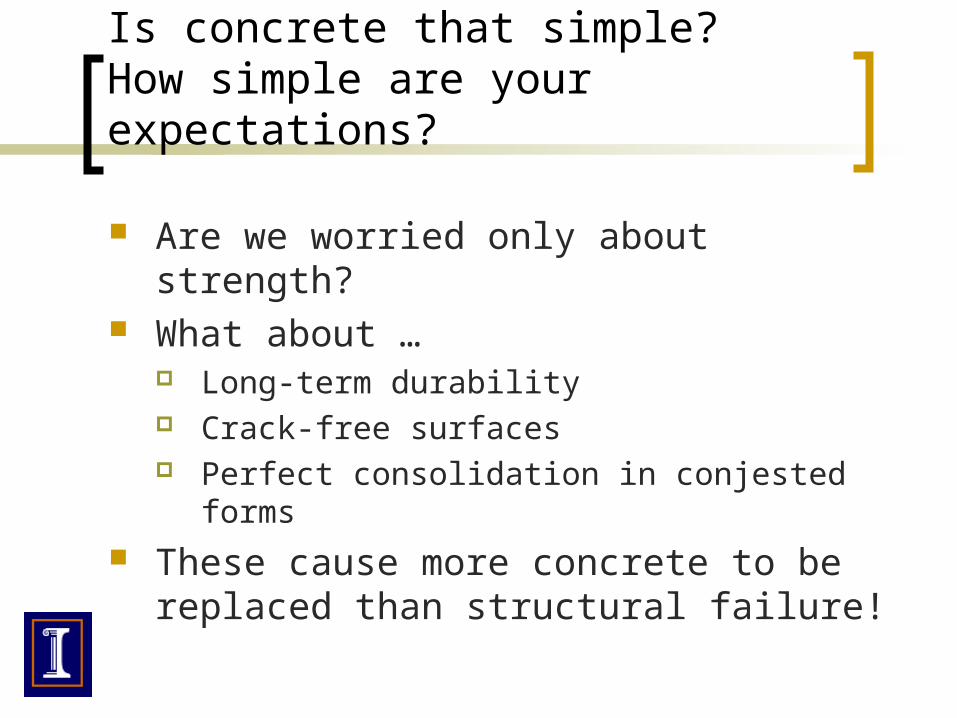
Is concrete that simple? How simple are your expectations?
Are we worried only about strength? What about …
Long-term durability Crack-free surfaces Perfect consolidation in conjested forms
These cause more concrete to be replaced than structural failure!

ILLINOIS
University of Illinois at Urbana -Champaign
ILLINOISUniversity of Illinois at Urbana -Champaign
Seeking the Holy Grail
Admixtures developed in 1970’s open the door to lower w/c and high strength
Feasible high strength concrete moved from 6000 psi to 16,000 psi
Feasible w/c moved from 0.50 to 0.30 Everybody loves high strength!
ILLINOIS
University of Illinois at Urbana -Champaign
ILLINOISUniversity of Illinois at Urbana -Champaign
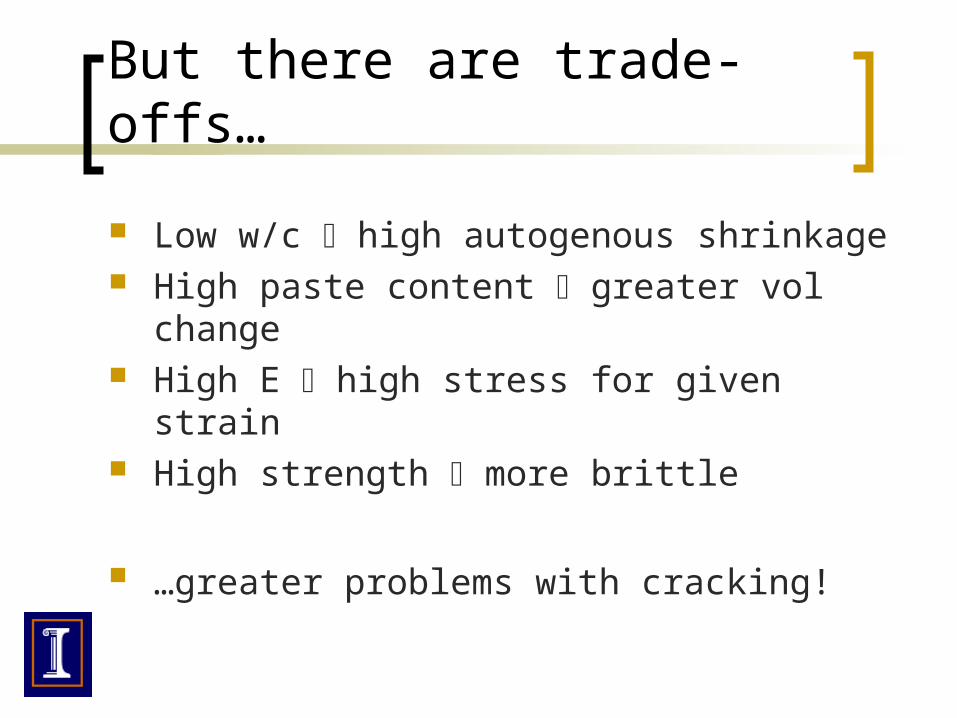
But there are trade-offs…
Low w/c high autogenous shrinkage High paste content greater vol change High E high stress for given strain High strength more brittle
…greater problems with cracking!

ILLINOIS
University of Illinois at Urbana -Champaign
ILLINOISUniversity of Illinois at Urbana -Champaign
For example: Early slab cracks
Early age pavement cracking is a persistent problem Runway at Willard
Airport (7/21/98) Early cracking within
18 hrs and additional cracking at 3-8 days
ILLINOIS
University of Illinois at Urbana -Champaign
ILLINOISUniversity of Illinois at Urbana -Champaign
Concrete IS complex
Properties change with time Microstructure changes with time Volume changes with time Self imposed stresses occur Plus, you are placing it in the field under
variable weather conditions There are a million ways to make
concrete for your desired workability, early strength, long-term performance
ILLINOIS
University of Illinois at Urbana -Champaign
ILLINOISUniversity of Illinois at Urbana -Champaign
Overview
Volume stability Internal RH and drying shrinkage Restrained stress Case: Airport slab curling Case: SCC segregation

ILLINOIS
University of Illinois at Urbana -Champaign
ILLINOISUniversity of Illinois at Urbana -Champaign
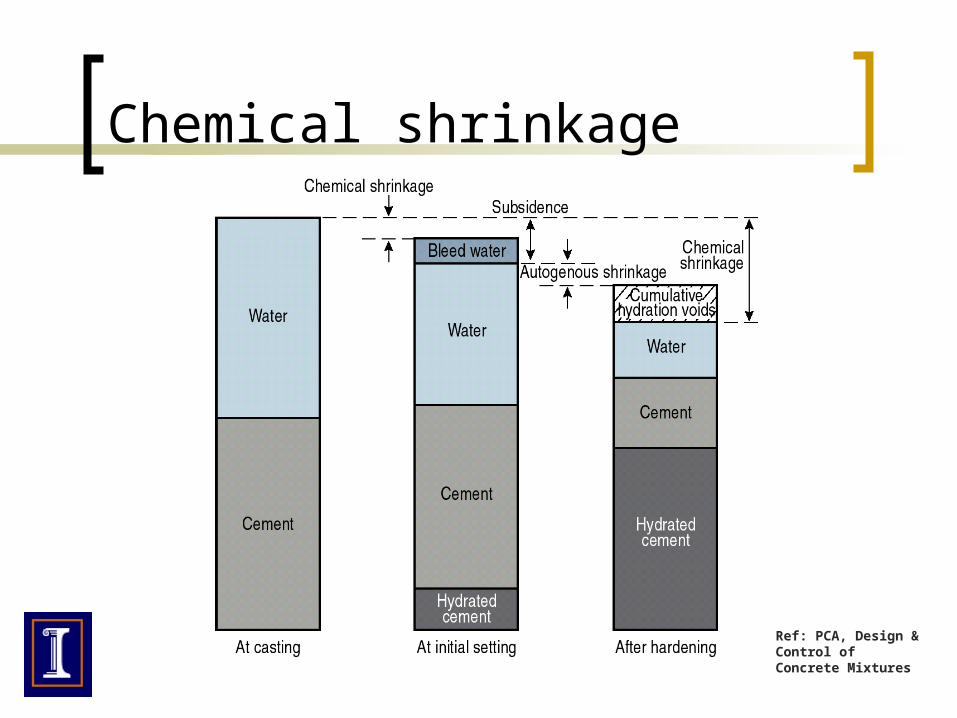
Chemical shrinkage
Volume stability
Volume Change
Thermal Shrinkage Creep
External Influences
Autogenous shrinkage
External drying shrinkage Basic creep Drying creepHeat release
from hydration
Cement hydration
ILLINOIS
University of Illinois at Urbana -Champaign
ILLINOISUniversity of Illinois at Urbana -Champaign
Chemical shrinkage
Ref: PCA, Design & Control of Concrete Mixtures
ILLINOIS
University of Illinois at Urbana -Champaign
ILLINOISUniversity of Illinois at Urbana -Champaign
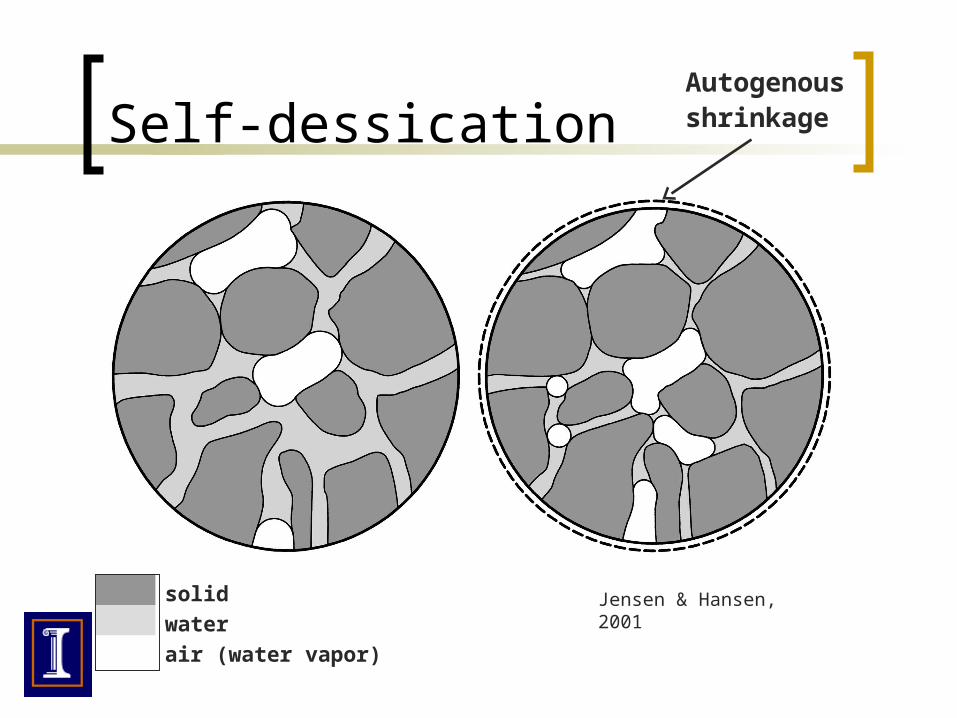
Self-dessication
solid
water
air (water vapor)
Jensen & Hansen, 2001
Autogenousshrinkage
ILLINOIS
University of Illinois at Urbana -Champaign
ILLINOISUniversity of Illinois at Urbana -Champaign
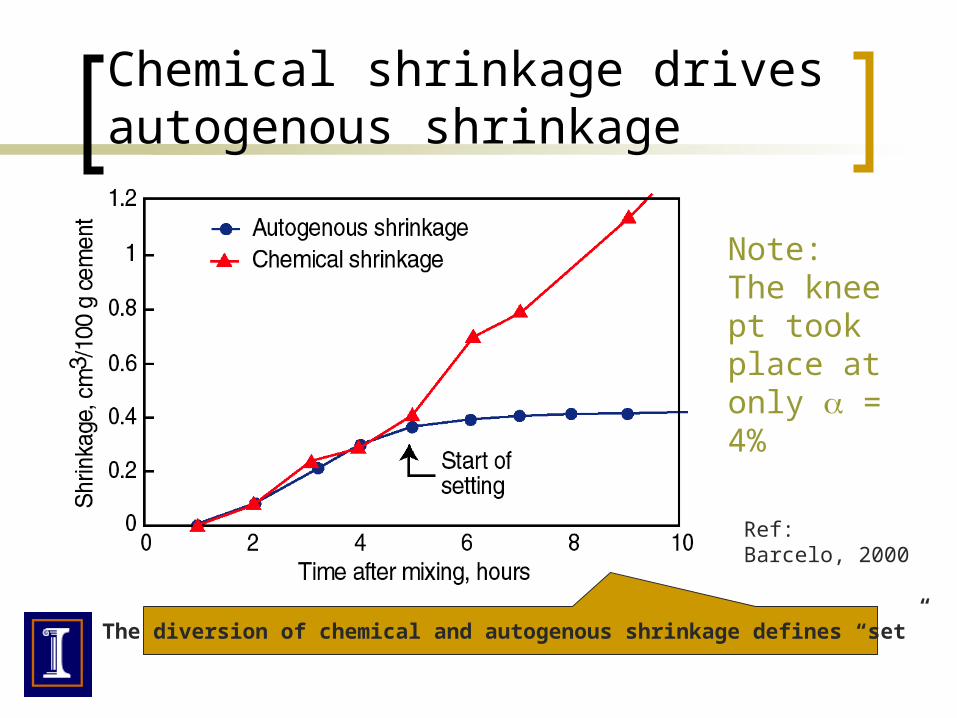
Chemical shrinkage drives autogenous shrinkage
Ref: Barcelo, 2000
Note: The knee pt took place at only = 4%
The diversion of chemical and autogenous shrinkage defines “set”

ILLINOIS
University of Illinois at Urbana -Champaign
ILLINOISUniversity of Illinois at Urbana -Champaign
Measuring autogenous shrinkage
Sometimes the easiest solution is also the best…

ILLINOIS
University of Illinois at Urbana -Champaign
ILLINOISUniversity of Illinois at Urbana -Champaign
Autogenous shrinkage
-250
-200
-150
-100
-50
0
50
0 20 40 60 80 100
Age (d)
Autogenous Shrinkage (10
-6 m/m)
OPC1, w/c = 0.40SCC1, w/c = 0.39SCC2, w/c = 0.33SCC3, w/c = 0.41SCC4, w/c = 0.32HPC1, w/c = 0.25SCC2-2SCC2-slag
ILLINOIS
University of Illinois at Urbana -Champaign
ILLINOISUniversity of Illinois at Urbana -Champaign
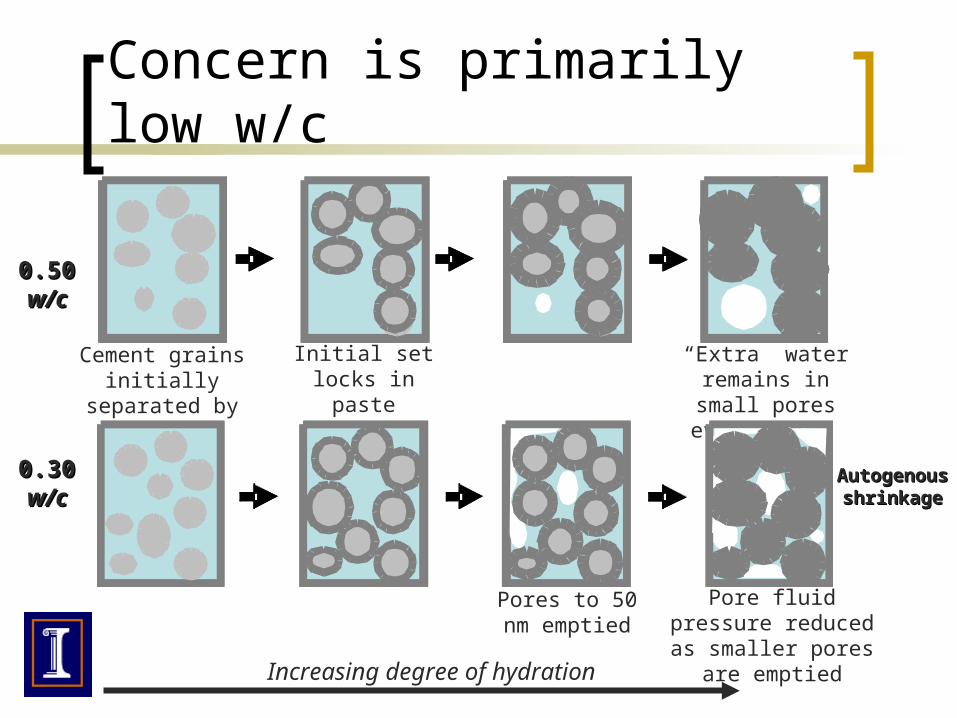
Concern is primarily low w/c
0.50 0.50 w/cw/c
0.30 0.30 w/cw/c
Cement grains initially separated
by water
Initial set locks in paste structure
“Extra” water remains in small
pores even at =1
Pores to 50 nm emptied
Pore fluid pressure reduced as smaller pores are emptied
Autogenous Autogenous shrinkageshrinkage
Increasing degree of hydration

ILLINOIS
University of Illinois at Urbana -Champaign
ILLINOISUniversity of Illinois at Urbana -Champaign
Internal RH & Internal Drying

ILLINOIS
University of Illinois at Urbana -Champaign
ILLINOISUniversity of Illinois at Urbana -Champaign
Mechanism of shrinkage
Shrinkage dominated by capillary surface tension mechanism
As water leaves pore system, curved menisci develop, creating reduction in RH and “vacuum” (underpressure) within the pore fluid
Hydration product
Hydration product

ILLINOIS
University of Illinois at Urbana -Champaign
ILLINOISUniversity of Illinois at Urbana -Champaign
Physical source of stress
p”sy
S S
" ' 2y yF p p sΣ = + +
Water surface
1m
Pc
Vapor Diffusion
We can quantify the stress using measured internal RH using Kelvin Laplace equation
ln( )"
'
RH RTp
v− =−
p” = vapor pressure = pore fluid pressureR = universal gas constantT = temperature in kelvinsv’ = molar volume of water
ILLINOIS
University of Illinois at Urbana -Champaign
ILLINOISUniversity of Illinois at Urbana -Champaign
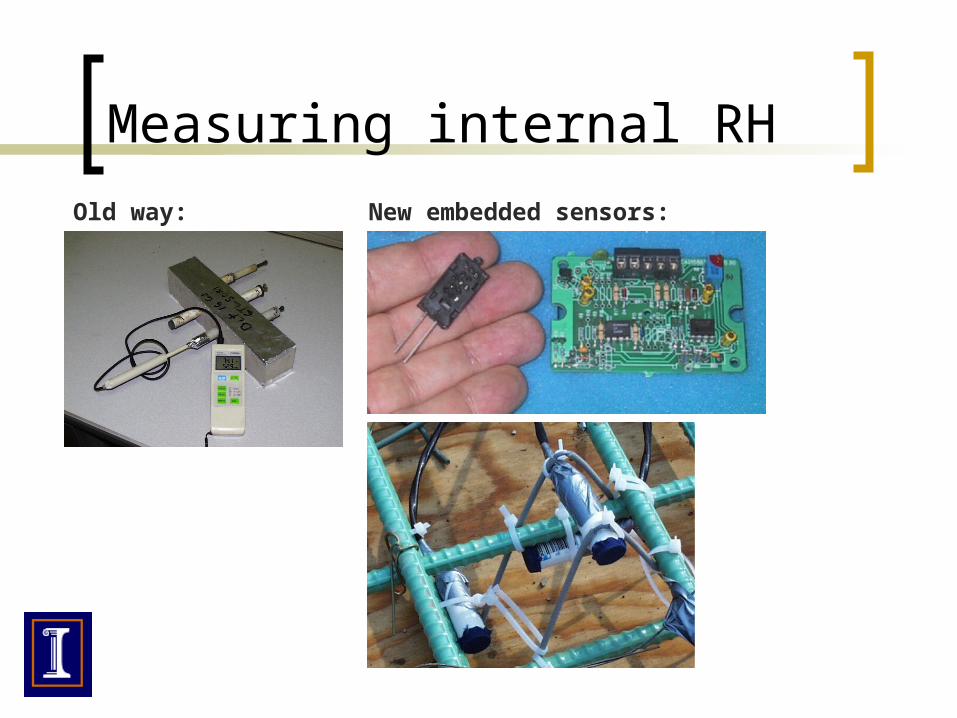
Measuring internal RH
Old way: New embedded sensors:

ILLINOIS
University of Illinois at Urbana -Champaign
ILLINOISUniversity of Illinois at Urbana -Champaign
Reduced RH drives shrinkageSCC4, w/c = 0.34
-100
-90
-80
-70
-60
-50
-40
-30
-20
-10
0
0 10 20 30 40 50 60 70 80
Age (d)
97.5
98.0
98.5
99.0
99.5
100.0
Autogenous Shrinkage
Relative Humidity

ILLINOIS
University of Illinois at Urbana -Champaign
ILLINOISUniversity of Illinois at Urbana -Champaign
Modeling RH & Stress
⎟⎟⎠
⎞⎜⎜⎝
⎛−⎟
⎟⎠
⎞⎜⎜⎝
⎛⎟⎠
⎞⎜⎝
⎛−−−=0
3
3
1
3
1
98.01(75.01
'
)ln(
kk
RH
v
RTRHaHTHTε
⎟⎟⎠
⎞⎜⎜⎝
⎛−⎟
⎟⎠
⎞⎜⎜⎝
⎛⎟⎠
⎞⎜⎝
⎛−−−=0
3
3
1
3
1
98.01(75.01
'
)ln(
kk
RH
v
RTRHHTε
0.0E+00
1.0E-04
2.0E-04
3.0E-04
4.0E-04
0 7 14 21 28 35 42 49 56
Time (day)
Drying Shrinkage (in./in./) Measured
Theoretical
Fitted
Add a fitting parameter
NOTE: The fitting parameter is associated with creep in the nanostructure
ILLINOIS
University of Illinois at Urbana -Champaign
ILLINOISUniversity of Illinois at Urbana -Champaign
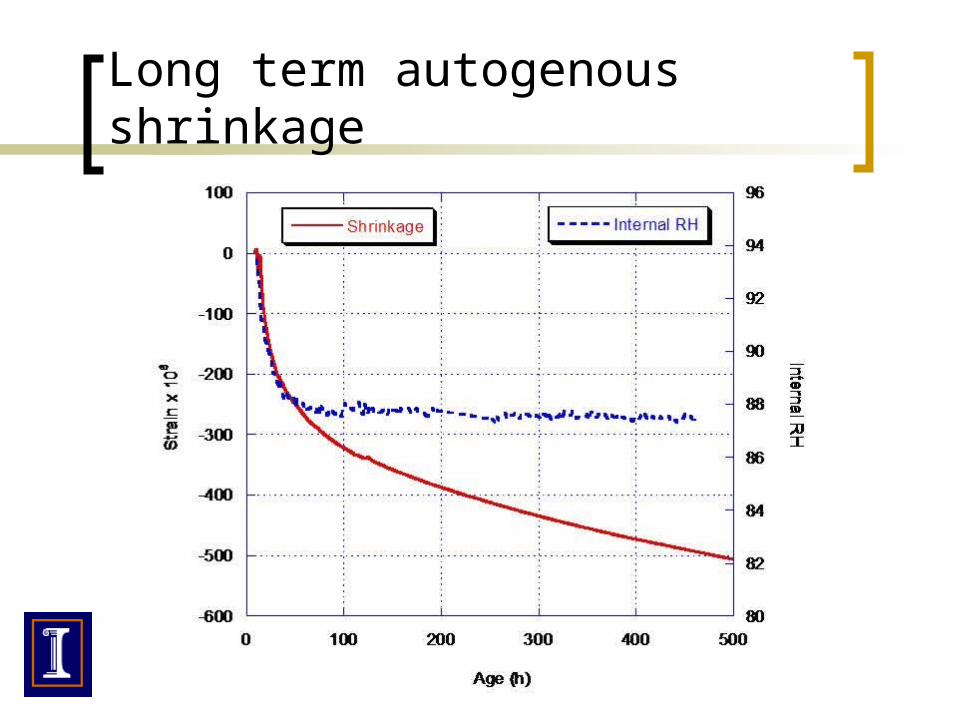
Long term autogenous shrinkage
ILLINOIS
University of Illinois at Urbana -Champaign
ILLINOISUniversity of Illinois at Urbana -Champaign
External drying stresses
ILLINOIS
University of Illinois at Urbana -Champaign
ILLINOISUniversity of Illinois at Urbana -Champaign
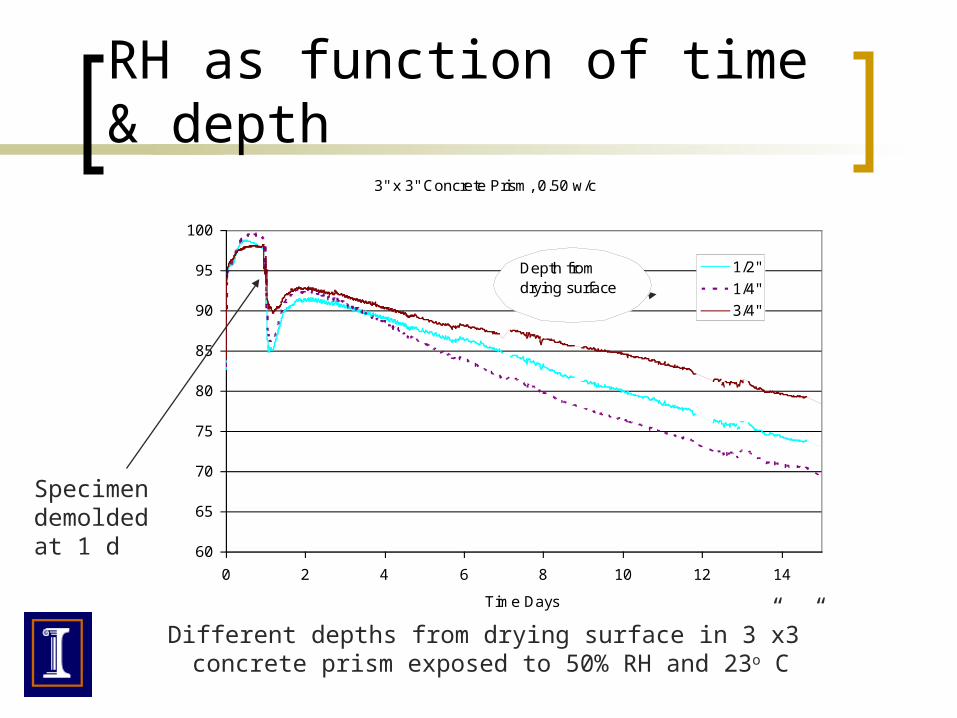
RH as function of time & depth
Different depths from drying surface in 3”x3” concrete prism exposed to 50% RH and 23o C
3" x 3" Concrete Prism, 0.50 w/c
60
65
70
75
80
85
90
95
100
0 2 4 6 8 10 12 14
Time Days
Internal RH (%)
1/2"
1/4"
3/4"
Depth from drying surface
Specimen demolded at 1 d

ILLINOIS
University of Illinois at Urbana -Champaign
ILLINOISUniversity of Illinois at Urbana -Champaign
External restraint stress superposed
ft
+ +-
Free shrinkage drying stresses
++
Overall stress gradient in restrained cement materials
+
Applied restraint stress
T=0

ILLINOIS
University of Illinois at Urbana -Champaign
ILLINOISUniversity of Illinois at Urbana -Champaign
Time to fracture (under full restraint) related to gradient severity
0
1
2
3
4
5
6
0 10 20 30 40 50 60 70
Specimen Width (mm)
Stress (MPa)
A-44A-44 AverageB-44B-44 AverageC-44C-44 AverageD-44D-44 Average4141 Average3838 Average3232 Average
Failed at 7.9 days
Failed at 3.3 days
ILLINOIS
University of Illinois at Urbana -Champaign
ILLINOISUniversity of Illinois at Urbana -Champaign
Shrinkage problems
Uniform shrinkage cracking under restraint
Shrinkage Gradients Tensile stresses on top surface Curling behavior of slabs, and cracking u
nder wheel loading

ILLINOIS
University of Illinois at Urbana -Champaign
ILLINOISUniversity of Illinois at Urbana -Champaign
Evidence of surface drying damage
Hwang & Young ’84
Bisshop ‘02

ILLINOIS
University of Illinois at Urbana -Champaign
ILLINOISUniversity of Illinois at Urbana -Champaign
Restrained stresses

ILLINOIS
University of Illinois at Urbana -Champaign
ILLINOISUniversity of Illinois at Urbana -Champaign
Applying restraint
LVDT Extensometer
Load cell
Actuator
3 in (76 mm)
3 in (76 mm)
Feedback Control
ILLINOIS
University of Illinois at Urbana -Champaign
ILLINOISUniversity of Illinois at Urbana -Champaign
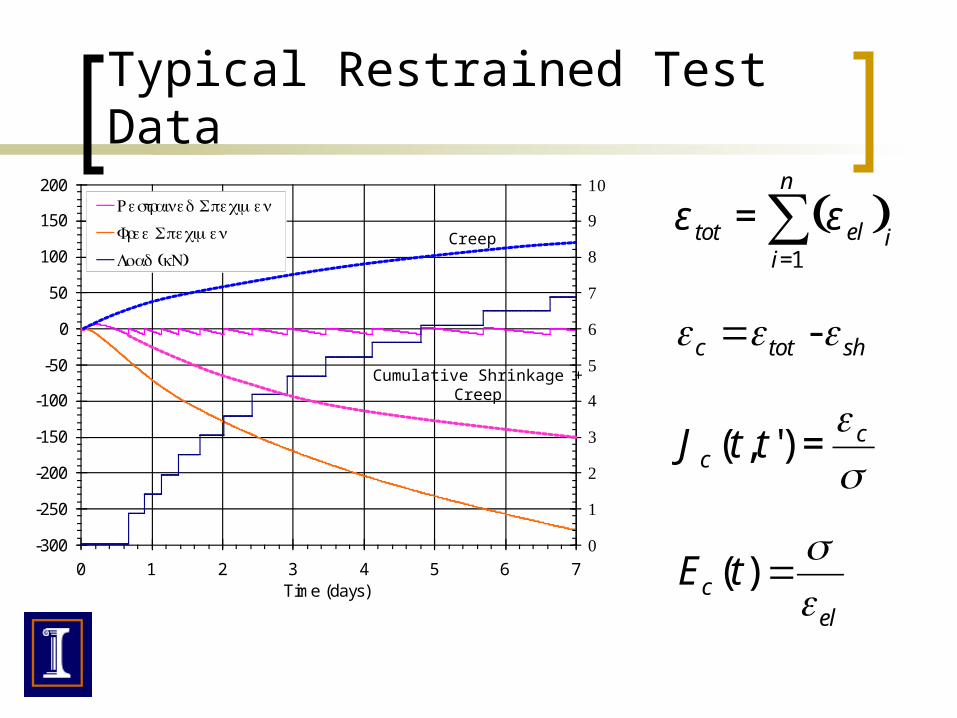
Typical Restrained Test Data
Creep
Cumulative Shrinkage + Creep
-c tot sh =
c
c ttJ =)',(
( )1
n
tot el ii
ε ε=
= ∑
( )cel
E t
=
ILLINOIS
University of Illinois at Urbana -Champaign
ILLINOISUniversity of Illinois at Urbana -Champaign
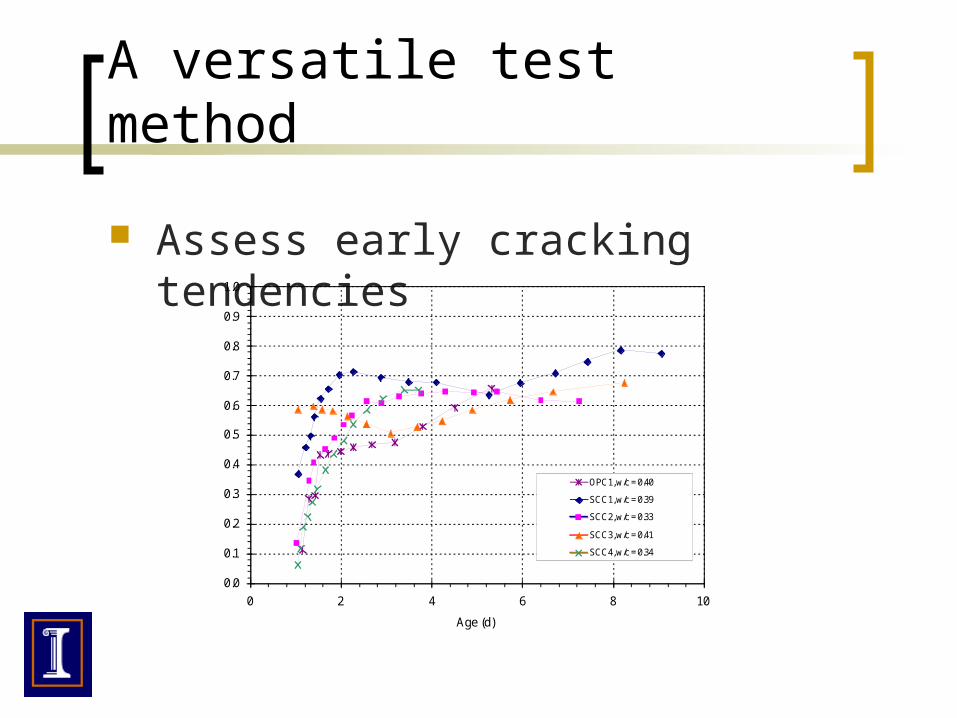
A versatile test method
Assess early cracking tendencies
0.0
0.1
0.2
0.3
0.4
0.5
0.6
0.7
0.8
0.9
1.0
0 2 4 6 8 10
Age (d)
Stress-Strength RatioOPC1, w/c = 0.40
SCC1, w/c = 0.39
SCC2, w/c = 0.33
SCC3, w/c = 0.41
SCC4, w/c = 0.34

ILLINOIS
University of Illinois at Urbana -Champaign
ILLINOISUniversity of Illinois at Urbana -Champaign
Chemical shrinkage
Volume stability
Volume Change
Thermal Shrinkage Creep
External Influences
Autogenous shrinkage
External drying shrinkage Basic creep Drying creepHeat release
from hydration
Cement hydration
ILLINOIS
University of Illinois at Urbana -Champaign
ILLINOISUniversity of Illinois at Urbana -Champaign
Now we are ready for structural modeling!
All this work defines “material models” that capture… Autogenous shrinkage Drying shrinkage Creep Thermal deformation Interdependence of creep & shrinkage
ILLINOIS
University of Illinois at Urbana -Champaign
ILLINOISUniversity of Illinois at Urbana -Champaign
Case: Airfield slabs
ILLINOIS
University of Illinois at Urbana -Champaign
ILLINOISUniversity of Illinois at Urbana -Champaign
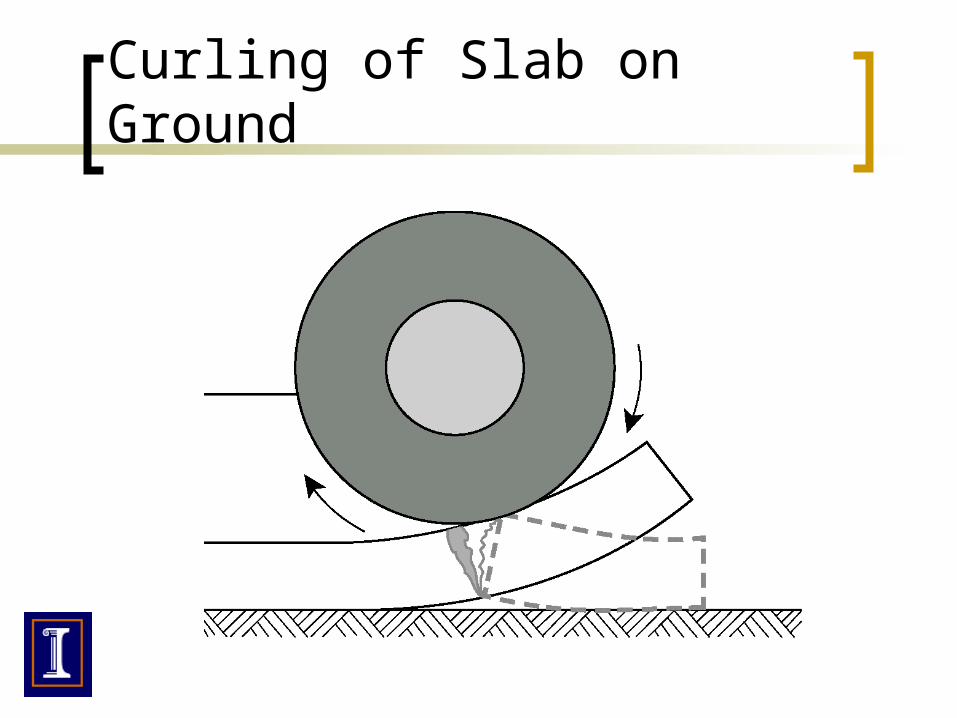
Curling of Slab on Ground
ILLINOIS
University of Illinois at Urbana -Champaign
ILLINOISUniversity of Illinois at Urbana -Champaign
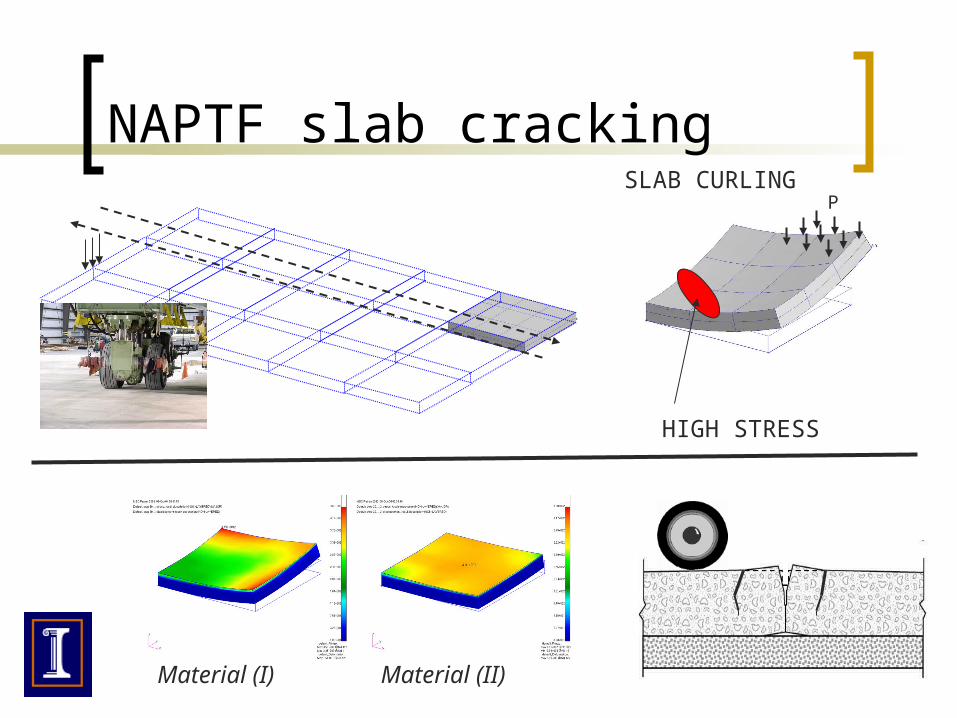
HIGH STRESS
SLAB CURLINGP
NAPTF slab cracking
Material (I) Material (II)

ILLINOIS
University of Illinois at Urbana -Champaign
ILLINOISUniversity of Illinois at Urbana -Champaign
¼ modeling using symmetric boundary conditions
NAPTF single slab
1. 20-node solid elements for slab2. Non-linear springs for base contact
2250 mm
2250 mm
275 mm.
Finite Element Model

ILLINOIS
University of Illinois at Urbana -Champaign
ILLINOISUniversity of Illinois at Urbana -Champaign
Loadings
Age(day)
14 28 42 56 7075
80
85
90
95
100
105
262.5mm
25mm
137.5mm
Temperature Internal RH
Age(day)
14 28 42 56 7018
20
22
24
26
28
30
32262.5mm25mm
137.5mm
Number are sensor locations (Depth from top surfaces of the slab)
ILLINOIS
University of Illinois at Urbana -Champaign
ILLINOISUniversity of Illinois at Urbana -Champaign
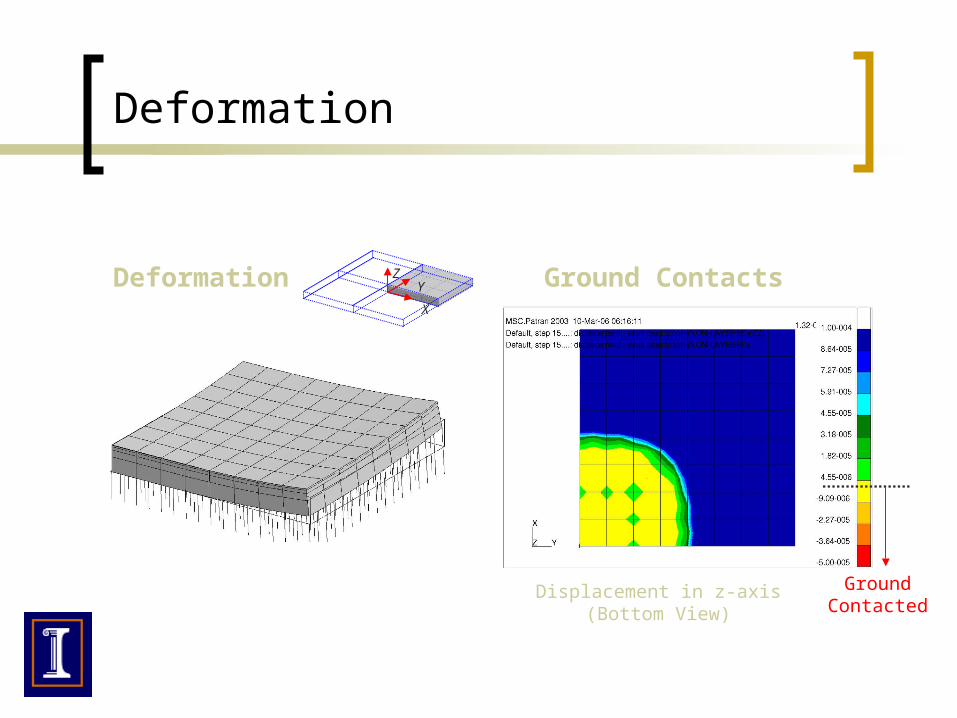
DeformationX
ZY
Deformation
Displacement in z-axis(Bottom View)
Ground Contacted
Ground Contacts

ILLINOIS
University of Illinois at Urbana -Champaign
ILLINOISUniversity of Illinois at Urbana -Champaign
Maximum Principle Stress
Stress Distribution
Age = 68 days
1.61 MPa (234 psi)
X
ZY
What will happen when wheel loads are applied ?

ILLINOIS
University of Illinois at Urbana -Champaign
ILLINOISUniversity of Illinois at Urbana -Champaign
Clip Gauge Setup
Lift-off Displacement
Age(day)
14 28 42 56 70
0
1
2
3
4
MeasuredModel prediction
Lift-off Displacement

ILLINOIS
University of Illinois at Urbana -Champaign
ILLINOISUniversity of Illinois at Urbana -Champaign
Analysis of stresses
σmax = 77 psi
Curling Only Curling + Wheel loading
σmax = 472 psi σmax = 558 psi
No Curling
ILLINOIS
University of Illinois at Urbana -Champaign
ILLINOISUniversity of Illinois at Urbana -Champaign
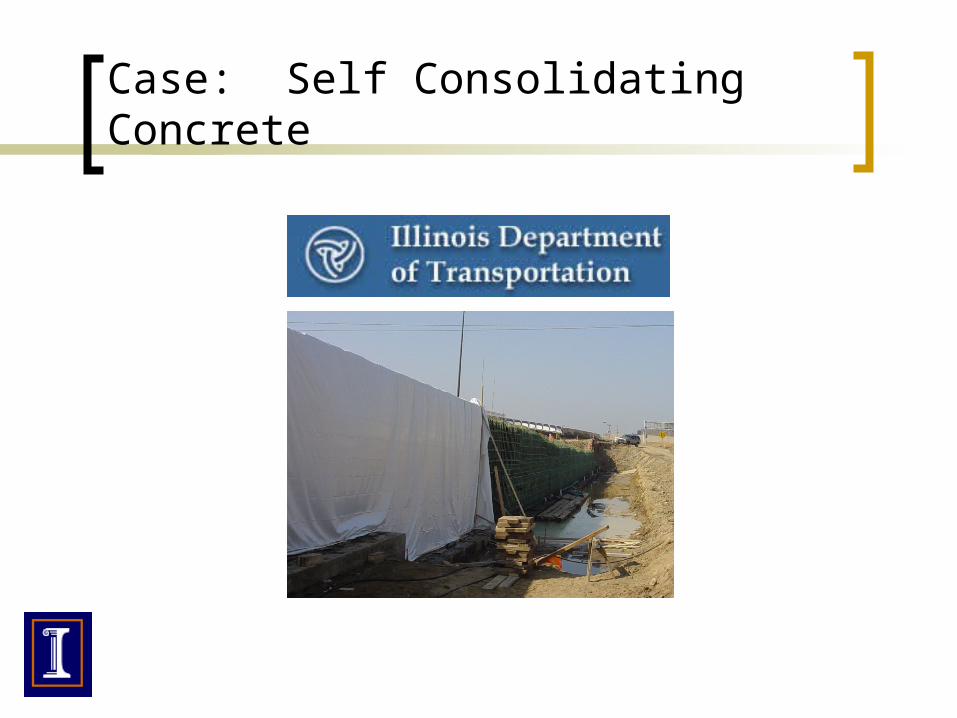
Case: Self Consolidating Concrete
ILLINOIS
University of Illinois at Urbana -Champaign
ILLINOISUniversity of Illinois at Urbana -Champaign
Several issues
Do SCC mixtures tend toward higher shrinkage?
How will segregation influence stresses?
ILLINOIS
University of Illinois at Urbana -Champaign
ILLINOISUniversity of Illinois at Urbana -Champaign
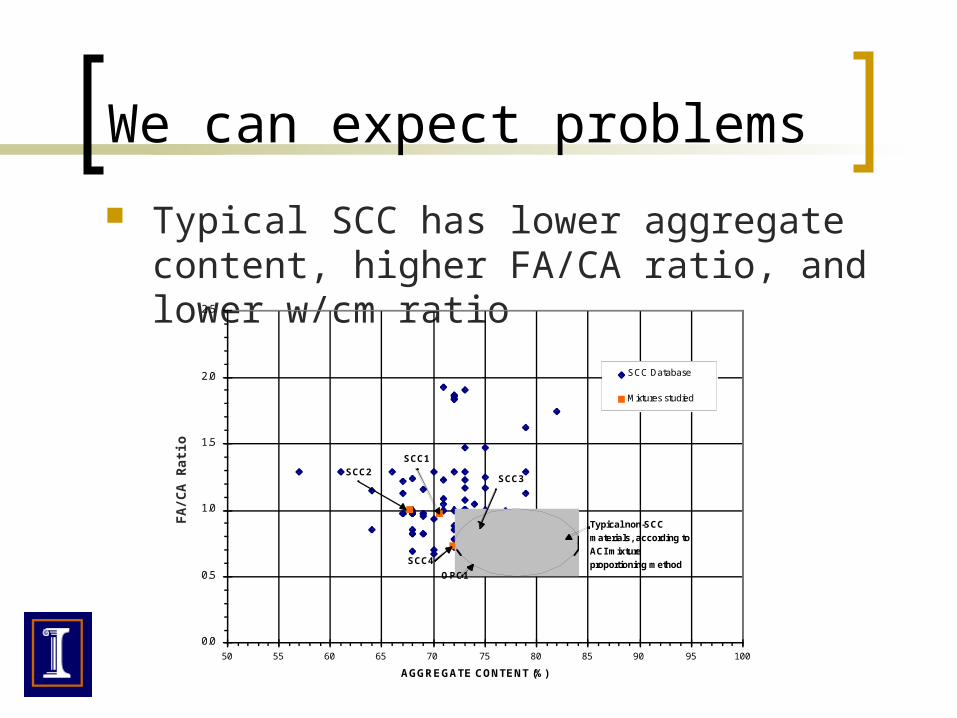
We can expect problems
Typical SCC has lower aggregate content, higher FA/CA ratio, and lower w/cm ratio
0.0
0.5
1.0
1.5
2.0
2.5
50 55 60 65 70 75 80 85 90 95 100
AGGREGATE CONTENT (%)
FA/CA RATIO
SCC Database
Mixtures studied
SCC4
OPC1
SCC3 SCC2
SCC1
Typical non-SCC
materials, according to
ACI mixture
proportioning method
FA
/CA
Rat
io
ILLINOIS
University of Illinois at Urbana -Champaign
ILLINOISUniversity of Illinois at Urbana -Champaign
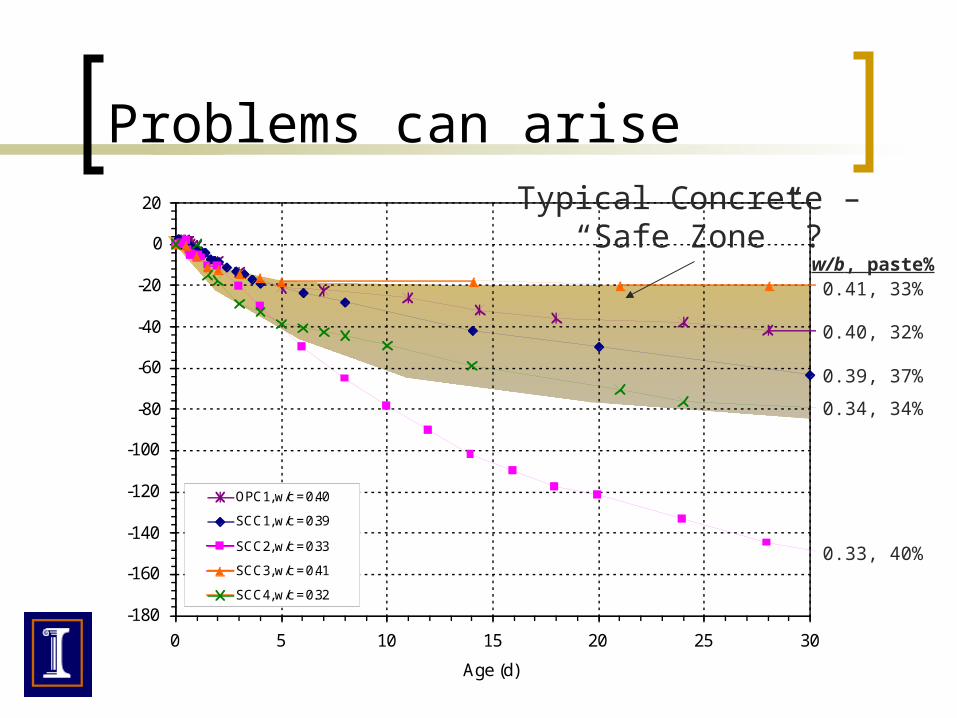
Problems can arise
-180
-160
-140
-120
-100
-80
-60
-40
-20
0
20
0 5 10 15 20 25 30
Age (d)
Autogenous Shrinkage (10
-6 m/m)
OPC1, w/c = 0.40
SCC1, w/c = 0.39
SCC2, w/c = 0.33
SCC3, w/c = 0.41
SCC4, w/c = 0.32
Typical Concrete – “Safe Zone” ?
0.39, 37%
0.34, 34%
0.41, 33%
0.40, 32%
0.33, 40%
w/b, paste%
ILLINOIS
University of Illinois at Urbana -Champaign
ILLINOISUniversity of Illinois at Urbana -Champaign
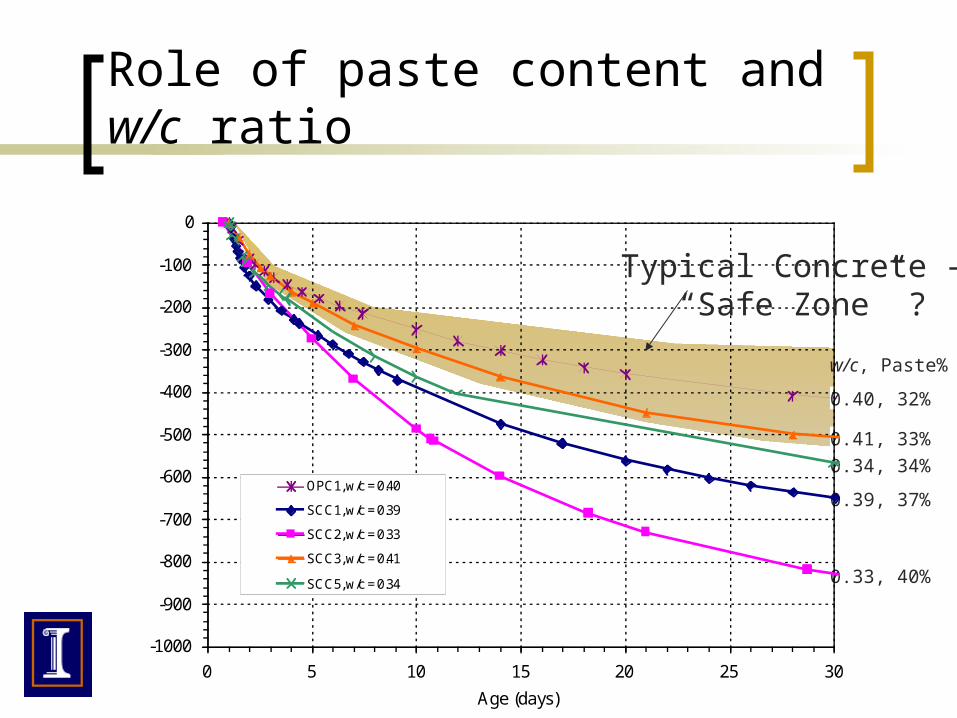
Role of paste content and w/c ratio
0.39, 37%
0.34, 34%
0.41, 33%
0.40, 32%
0.33, 40%
w/c, Paste%
-1000
-900
-800
-700
-600
-500
-400
-300
-200
-100
0
0 5 10 15 20 25 30
Age (days)
Free Shrinkage (x10
-6)
OPC1, w/c = 0.40
SCC1, w/c = 0.39
SCC2, w/c = 0.33
SCC3, w/c = 0.41
SCC5, w/c = 0.34
Typical Concrete – “Safe Zone” ?

ILLINOIS
University of Illinois at Urbana -Champaign
ILLINOISUniversity of Illinois at Urbana -Champaign
Acceptance Criteria: w/c ratio Tazawa et al found that 0.30
was an acceptable threshold In our study, 0.34 keeps total
shrinkage at reasonable levels 0.42 eliminates autogenous
shrinkage Application specific limits
High Restraint: 0.42 Med Restraint: 0.34 Low Restraint: w/c based on
strength or cost
0
100
200
300
400
500
600
700
800
900
0.30 0.32 0.34 0.36 0.38 0.40 0.42
w/cm
Autogenous Shrinkage Strain (x10
-6)
Autogenous Shrinkage (28d)
Total Shrinkage (28d)
ILLINOIS
University of Illinois at Urbana -Champaign
ILLINOISUniversity of Illinois at Urbana -Champaign
0
100
200
300
400
500
600
700
800
900
30% 32% 34% 36% 38% 40% 42%
Paste Content by Volume
Autogenous Shrinkage Strain (x10
-6)
Autogenous Shrinkage (28d)
Total Shrinkage (28d)
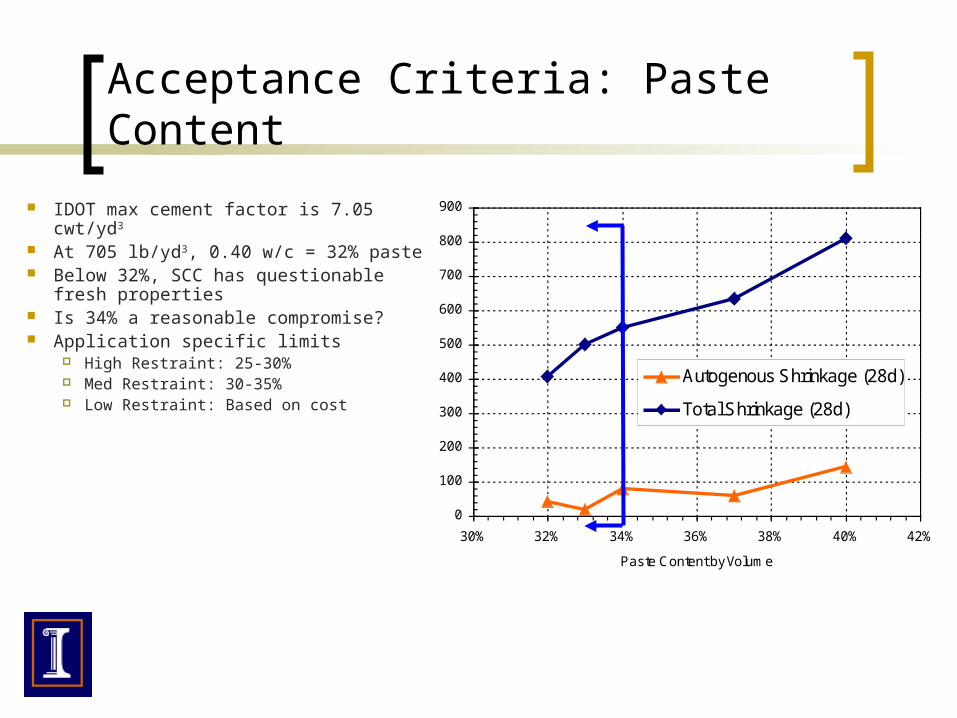
Acceptance Criteria: Paste Content
IDOT max cement factor is 7.05 cwt/yd3 At 705 lb/yd3, 0.40 w/c = 32% paste Below 32%, SCC has questionable
fresh properties Is 34% a reasonable compromise? Application specific limits
High Restraint: 25-30% Med Restraint: 30-35% Low Restraint: Based on cost

ILLINOIS
University of Illinois at Urbana -Champaign
ILLINOISUniversity of Illinois at Urbana -Champaign
Segregation
SCC may segregate during placement Static or Dynamic
How does this impact hardened performance?

ILLINOIS
University of Illinois at Urbana -Champaign
ILLINOISUniversity of Illinois at Urbana -Champaign
Consider static segregation
Specimen 8” x 8” x 20” prism
8 equal layers Each layer
assigned:CA%, E and sh

ILLINOIS
University of Illinois at Urbana -Champaign
ILLINOISUniversity of Illinois at Urbana -Champaign
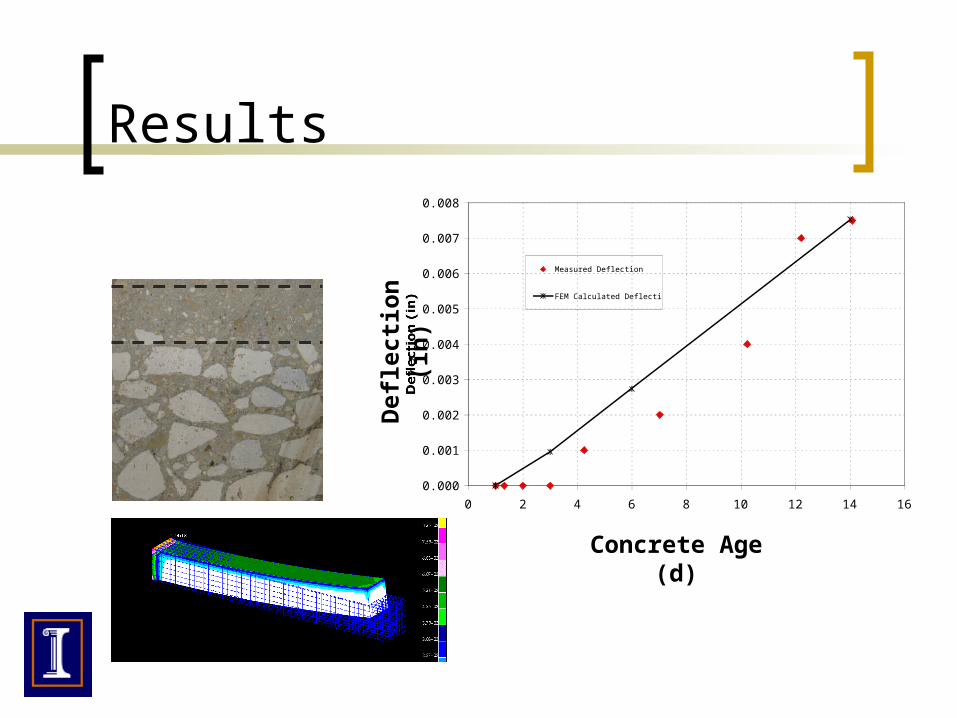
Experiment Cast vertically to produce a
segregated cross section
Laid flat to measure deflection caused by autogenous shrinkage of segregated layer
ILLINOIS
University of Illinois at Urbana -Champaign
ILLINOISUniversity of Illinois at Urbana -Champaign
Results
0.000
0.001
0.002
0.003
0.004
0.005
0.006
0.007
0.008
0 2 4 6 8 10 12 14 16
Concrete Age (d)
Deflection (in)
Measured Deflection
FEM Calculated Deflection
Def
lect
ion
(i
n)
Concrete Age (d)
ILLINOIS
University of Illinois at Urbana -Champaign
ILLINOISUniversity of Illinois at Urbana -Champaign
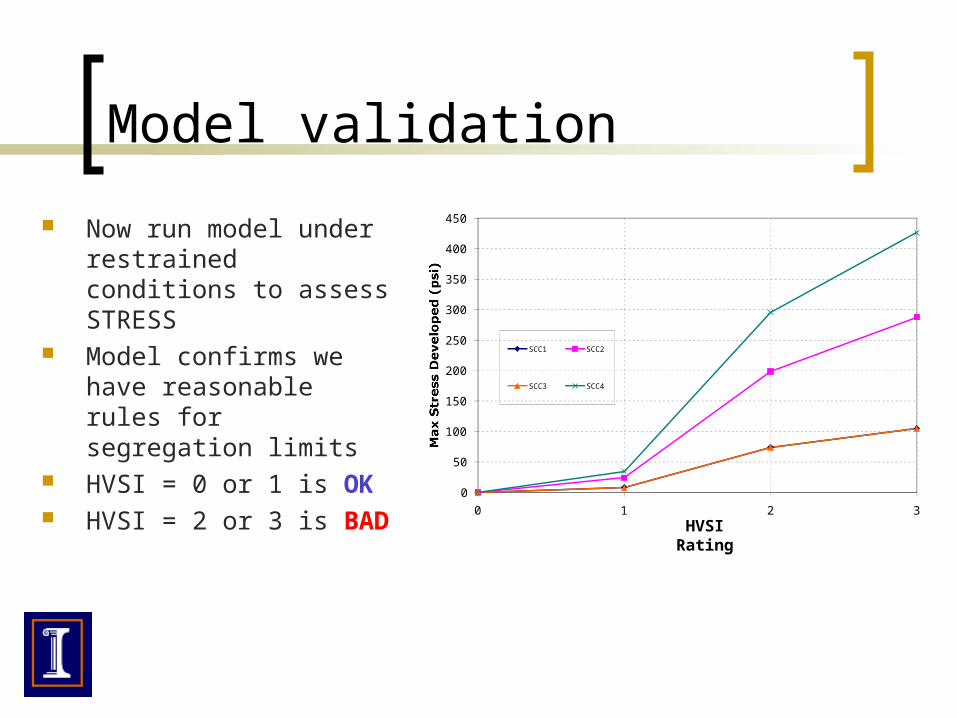
Model validation
Now run model under restrained conditions to assess STRESS
Model confirms we have reasonable rules for segregation limits
HVSI = 0 or 1 is OK HVSI = 2 or 3 is BAD
0
50
100
150
200
250
300
350
400
450
0 1 2 3
HVSI Rating
Max Stress Developed (psi)
SCC1 SCC2
SCC3 SCC4
HVSI Rating

ILLINOIS
University of Illinois at Urbana -Champaign
ILLINOISUniversity of Illinois at Urbana -Champaign
ILLINOIS
University of Illinois at Urbana -Champaign
ILLINOISUniversity of Illinois at Urbana -Champaign
Back to Specifications…
What is the “real performance” we need to ensure? More that strength
Spec writers need to assert more control Example: IDOT -- SCC will have limits on
segregation, min. aggregate content, min. w/c
ILLINOIS
University of Illinois at Urbana -Champaign
ILLINOISUniversity of Illinois at Urbana -Champaign
Specing “real performance”
How do you impose long-term requirements using short-term properties?
How do you impose limitation on long term cracking when factors are so extensive, including environment and loadings “beyond control of material supplier”?

ILLINOIS
University of Illinois at Urbana -Champaign
ILLINOISUniversity of Illinois at Urbana -Champaign
Performance vs. Prescription
Can Performance Based Specs do the whole job? Prescriptions…
Min. and max w/c Min. aggregate content Aggregate gradation limits
Performance requirements… Max. drying shrinkage, maybe autogenous shrinkage Permeability (RCPT ?)

ILLINOIS
University of Illinois at Urbana -Champaign
ILLINOISUniversity of Illinois at Urbana -Champaign
Last thoughts
“Times they are a’changing…” We have higher expectations We have new tools, new knowledge We are ever pushing the boundaries of
past experience