do choice schools break the link between public schools
TRANSCRIPT

Do Choice Schools Break the Link Between Public Schools and Property Values? Evidence from House Prices in New York City Amy Ellen Schwartz, Ioan Voicu and Keren Mertens Horn __________________________ WORKING PAPER 2014-03
________________________________
DEPARTMENT OF ECONOMICS
UNIVERSITY OF MASSACHUSETTS BOSTON ________________________________

Do Choice Schools Break the Link Between Public Schools and Property Values? Evidence from House Prices in New York City*
Amy Ellen Schwartz
Wagner School of Public Service New York University
295 Lafayette Street, New York NY 10012 USA [email protected]
Ioan Voicu
Office of the Comptroller of the Currency United States Department of the Treasury
400 7th Street SW Suite 3E-218, Washington DC 20219 USA [email protected]
Keren Mertens Horn (corresponding author - 516-317-7059)
Department of Economics University of Massachusetts, Boston
100 Morrissey Blvd, Boston MA 02125 USA [email protected]
*We thank Colin Chellman for expert and patient research assistance and the Lincoln Institute of Land Policy for their generous support of this project. We are also grateful to Ingrid Ellen, Vicki Been, Colin Chellman, Jeffrey Zabel and Roz Greenstein for their comments and feedback on previous drafts as well as seminar participants in the Greater Boston Urban and Real Estate Economics group, American Economic Finance Association Annual Meeting and at the Lincoln Land Institute.

1
I. Introduction
Increasing school choice continues to attract more attention from policymakers and
researchers. Currently the majority of research on choice schools has focused on the relationship
between school choice and student academic performance (Belfield and Levin, 2002; Hoxby,
2004; Rouse and Barrow, 2009). There has been little empirical work, in contrast, examining
how these choice schools are affecting housing markets, despite the well accepted theoretical
(and empirical) link between schools and housing values. As school choice continues to become
a more central component in reforming urban school systems (Ladd, 2002), and improving
public schools is critical for attracting and retaining middle class families in urban
neighborhoods, it is important to understand how increasing school choice shapes the long-term
economic health and viability of the country’s central cities. In this paper, we examine how
choice schools affect house prices in New York City, particularly the link between the quality of
locally zoned schools and surrounding housing values.
The existing work examining the relationship between schools and housing has focused
almost exclusively on the extent to which the price of a house reflects the quality and
characteristics of the local public school -- more specifically, the school that children would
attend based upon their location in the school’s ‘catchment area’ or ‘attendance zone’ (hereafter
‘zoned school’). A large body of literature explores the capitalization of zoned school quality
into house prices to identify how much households are willing to pay for high performance
public schools. Two recent reviews of this literature come to similar conclusions, that
households are willing to pay between 3 to 5 percent more for a one standard deviation
improvement in test scores (Machin, 2011; Nguyen-Hoang and Yinger, 2011). Our study builds

2
on the innovations within this literature, employing a boundary discontinuity approach to
compare housing units that are near one another, and therefore embedded in a similar
neighborhood, but in different school zones (Black, 1999), as well as including longitudinal data
on property sales to isolate the relationship between school quality and housing values (Dhar and
Ross, 2012).
This literature, however, has paid relatively little attention to the impacts on property
values of schools that admit students based upon other (not exclusively geographic) criteria –
including magnet schools, alternative schools, and charter schools. Reback (2005) and Brunner
et al. (2012) explore the effects of inter-district school choice on housing values. They find that
school districts receiving additional students experience declines in housing values, and districts
that send students to outside school districts experience increases in housing values. There are
challenges, however, when looking across school district boundaries, as the underlying school
finance structure between districts is often different, as are property tax rates. Importantly, and
uniquely, New York City is a single tax district, meaning property tax rates are constant across
school zones throughout the school district.1 Therefore, any differences that we uncover will be
more tightly linked to differences in school quality rather than taxes.
Machin and Salvanes (2010) and Chisesi (2012) study the adoption of an intra-district
school choice program in Norway and Colorado, respectively, and find results in line with those
of Reback (2005) and Brunner et al. (2012). Machin and Salvanes (2010) find that the valuations
to school performance fall by over 50 percent after all high schools in the district become choice
1 As part of the larger NYC budget, the Department of Education is financed through a mix of city tax revenue and state and federal aid, which contrasts with other school districts nationwide that are primarily financed through property taxes. In 2009, for example, 40% of the NYC tax revenue came from property taxes, 21% came from personal income taxes, 13% came from general sales taxes and 8% came from corporation taxes (IBO, 2010). The remainder of the budget was funded through state and federal categorical grants. In 2010, 30% of the $60 billion dollar NYC budget went to the Department of Education (IBO, 2010).
3
schools. Chisesi (2012) finds that once intra-district choices are available property values in
initially low-quality school attendance zones increase, while property values in initially high-
quality zones decline. Our study in contrast includes some schools that are choice schools, but
others that remain zoned schools, allowing a comparison of the capitalization rates before and
after nearby choice schools open.
In a more closely related study, Fack and Grenet (2010) look within the Paris school
district, to investigate the impact of publicly funded, private middle schools on real estate. They
find that an increase in the number of nearby private schools is linked to decreased capitalization
of public school performance into residential property values. We build on this research by
focusing on public schools within the United States.2 We also take this research a step further by
exploring whether and how the opening of a choice school and its quality affect property values.3
Our study utilizes rich data on New York City public elementary schools geo-coded and
matched to data on property sales for a fifteen-year period beginning in 1988. New York City
provides an ideal site in which to conduct the research outlined above. In addition to being a
single tax district, a significant number of choice schools have emerged in New York City during
this time period. Additionally, we have rich detailed data on housing and schools, including
information about the location and characteristics of property sales (address-specific), school
location, performance and student characteristics.
To identify the impact of a new choice school on the capitalization of zoned school
quality into housing values we rely on a triple difference methodology. First we incorporate a
2 New York City also has a large private elementary school market (85 private elementary schools, including parochial schools, in 1999-2000 school year). The analysis of the impact of these schools however is beyond the scope of this paper. http://nces.ed.gov/ccd/elsi 3 In another related study by Horowitz, Keil and Spector (2007), they investigate the impact of the existence of charter schools on property values in Toledo, Ohio. They find no evidence that charter elementary schools impact surrounding property values. However, their sample includes a very small number of sales and charter schools.

4
boundary discontinuity approach, following Black (1999), to compare the capitalization of
school quality into prices of houses that are close to one another but in different elementary
school attendance zones. Similar to Black (1999), we rely on smaller and smaller distances from
the boundary to test the stability of our results. Second, we compare housing units that are
within 3,000 feet of a choice school to housing units outside of these rings. We believe that this
is the appropriate distance, as New York City offers transportation assistance beyond this
distance.4 Third, we take advantage of choice school openings to look at the capitalization rates
before and after the choice school opens.
We then address three supplemental research questions. First we examine school
closures as well as school openings. Second we move away from the narrow view of schools
seen only through test scores and examine whether inclusion of student composition and school
resources alters our primary results. Third we explore how the quality of the choice school
factors into this relationship, by including a variety of measures of choice school quality.
We find that the proximity of alternative school choices does dampen the relationship
between the zoned elementary school and property values. The opening of a choice school
reduces the capitalization of test scores from zoned schools into housing values by
approximately one third. We also find that the opening of the choice school is positively
capitalized into housing values, suggesting that choice schools in New York City are viewed as
neighborhood amenities. When including characteristics of the choice school it appears that the
quality of the choice school is also capitalized into housing values, but at a lower rate than is the
quality of the zoned school.
This paper proceeds as follows. We begin with our theoretical and empirical approaches.
We then describe the data we have assembled to answer this research question. We continue 4 http://schools.nyc.gov/Offices/Transportation/ServicesandEligibility/BusTransportation/default.htm.
5
with our primary results from the triple difference estimation. We then present results from our
supplementary research questions and then our concluding remarks.
II. Why should choice schools affect housing markets?
There is currently a growing policy interest among key decision makers and advocates to
increase the school choices available to parents within their school district. A popular argument
in favor of school choice is that increasing choice could further reduce the achievement gap by
delinking school attendance from a household’s residential address, enabling lower income
students to attend higher performance schools that are often located in higher income
neighborhoods (Rouse and Barrow, 2009).5 The growing literature on the impacts of increased
choice on student achievement finds some evidence to support these arguments (Belfield and
Levin, 2002; Hoxby, 2004; Rouse and Barrow, 2009). If additional school choice does sever (or
at least dampen) the link between attendance at neighborhood schools and houses, decreasing the
incentives for households to sort into neighborhoods based on school quality (Nechyba, 2003;
Bayer et al., 2007), then we may expect to see a decrease in the capitalization of zoned school
quality into housing values when additional choice schools are located nearby. Even more, home
buyers may be less willing to pay for higher quality in zoned schools as the availability of choice
schools – which have no residential requirement – increases.
How choice schools will affect property values on net, however, is not as clear. A key
argument presented in favor of choice schools is that widening the range of schools available to 5 One argument often used against increasing school choice is that it will actually decrease the quality of schools available to lower income households as these are the households least likely to exercise their choice options. Therefore the last remaining households with resources in a neighborhood will attend the choice school leaving the neighborhood school with even greater levels of poverty concentration and perhaps even racial concentration (Ladd, 2002).

6
families will increase competition between schools and thereby improve efficiency and
effectiveness (Hoxby, 2003). This argument dates back to Milton Friedman’s seminal work in
1955, in which he argues that school choice can reduce the existing monopoly within our public
school system (Friedman, 1955). If increasing choice in an urban school district increases the
relative attractiveness of housing in that school district (increasing the demand for housing),
additional school choices could increase property values, especially for properties that are
located near these new schools (i.e. where the option value of attending one of these new schools
is highest). We may expect to find increases in property values for housing units that are located
near to choice schools.
Alternatively, it is possible that additional school choices could be viewed by residents as
a dis-amenity and lead to declines in property values. For example, if choice schools can be
attended by students outside of the neighborhood, more schools might mean that ‘undesirable’
kids would be in the neighborhood or even just the presence of more kids may outweigh any
utility gains from having a larger array of school choices nearby. Having many schools to
choose from may also make it more difficult and time consuming for parents to select one, again
leading to declines in the utility associated with a given property. The net effect of choice
schools on housing values is therefore ultimately an empirical question.
III. Empirical Approach
We employ a triple-difference estimation strategy to identify the relationship between
choice schools and housing values. First we establish the baseline relationship between housing

7
values and zoned school performance in New York City. We estimate the following empirical
model:
lnPizdt = α + βXizdt + ϕZTestzdt-1Z + ρdtVdt + εizdt (1)
where i indexes the unit of property, z the school zone, d the community school district (CSD),
and t the quarter/year. lnPizdt is the log of the sales price per unit of property; Xizdt is a vector of
property-related characteristics (e.g., age, building class, structural characteristics); Testzdt-1Z is a
measure of the average math and English Language Arts proficiency rates (i.e., shares of
students scoring at or above the proficient cutoff point) for the locally zoned schools, one-year
lagged. We use lagged rather than contemporaneous values of school performance to allow for
the possibility that changes in school quality are not immediately captured in property values.
Vdt are a series of dummy variables indicating the quarter and community school district of the
sale, which allow for distinct time trends for each CSD used in the analysis. One may be
concerned that other activities, unrelated to schools, may have been taking place in the city’s
neighborhoods during our study period, and if so, the change in property values that we interpret
as the schooling impact may be due, at least in part, to these other activities. Our CSD-quarter
fixed effects should capture, to a large extent, the impacts of other investments.
We then incorporate a simplified boundary discontinuity approach, including in our
analysis housing units that are within a small distance of an elementary school attendance zone
boundary. To estimate the following model we include properties within a short distance of an
elementary school boundary, beginning with 1,200 feet and narrowing this distance to 800 feet,

8
which we call a ‘boundary group’, k, and then estimate the model using boundary group fixed
effects as follows:6
lnPizkdt = α + βXizkdt + ϕZTestzdt-1Z + ρdtVdt + ω k + εizkdt (2)
This specification allows us to compare housing units that are close to one another but in
different elementary school attendance zones, identifying the impact of school quality on
housing values.
To determine how the opening of a choice school influences this relationship we add to
this empirical model a series of indicators about the choice school. We estimate the following
model:
lnPizkdt = α + βXizkdt + ϕZTestzdt-1Z + λEver_Ci + γEver_Ci*Testzdt-1
Z + θPost_Cit +
ηPost_Cit*Testzdt-1Z + ρdtVdt + ω k + εizkdt (3)
Ever_Ci and Post_Cit are indicator variables which describe whether the housing unit is ever
within 3,000 feet of a choice school during the study period and whether the choice school is
open, respectively. θ is a key independent variable, indicating the direct relationship between the
opening of a choice school and property values. The interaction terms Ever_Ci*Testzdt-1Z and
Post_Cit*Testzdt-1Z allow us to identify whether the relationship between test scores from zoned
schools and property values is different for housing units that are ever within 3,000 feet of a
choice school and, most importantly, after the choice school opens. The other key parameter in
6 We explain how we constructed these boundary groups in more detail in the data appendix.

9
this model is η which represents the triple difference estimator. This coefficient captures the
extent to which the relationship between house prices and zoned school test scores changes once
a choice school opens.
We also assess the effect a choice school closing by supplementing model (3) with a
dummy variable indicating whether the zoned school is within 3000 feet of a closed choice
school and its interaction with the zoned school test score.
To assess whether test scores tell the whole story, we add to our model additional
measures of school characteristics. Specifically, we add to model (3) the share black and the
share Hispanic, to provide a description of school demographics. We also include the total
enrollment in the school to provide a picture of school size. We then interact each of these
additional zoned school variables with the indicator for an open choice school to determine
whether the impact of these characteristics changes with the opening of a choice school.7
In our last analysis we examine whether the characteristics of the choice school itself are
capitalized into housing values. Specifically we add to model (3) proficiency rates at the choice
school once it is open. This set of regressions provides some insight into whether “good” choice
schools could have different effects on housing markets than “bad” choice schools.
IV. Data
As previously mentioned, with hundreds of elementary schools, and a large number of
recently opened choice schools, a uniform property tax rate across attendance zones, and a
7 We have also run this model with a wider range of covariates, including the share of students eligible for free and reduced price lunch, the share of students that are Asian, the share that have limited English proficiency, the teacher pupil ratio, the total enrollment in logs and the share of teachers with more than 5 years of experience. For ease of presentation we present the streamlined results which tell the same story. Results for this larger model are available from the authors upon request.

10
diverse student population, New York City provides an ideal research site to investigate the
impact of choice schools on the capitalization of school quality into property values. This study
makes use of a richly detailed data set on New York City’s schools and properties.
Property sales
Through an arrangement with the New York City Department of Finance, we have
obtained a database that contains sales prices and dates for all transactions of apartment
buildings, condominium apartments and single-family homes over the period 1989-2004.8 We
have obtained information about the characteristics of these properties from an administrative
dataset gathered by the Department of Finance for the purpose of assessing property taxes (the
Real Property Assessment Data file).9 Our baseline sample includes over 350,000 residential
property sales, spread across 32 community school districts that administer elementary and
middle schools. Both because of the long time span of the data and New York City’s size, this is
a very large sample size compared with much of the literature.
Table 1 shows summary statistics for the sales sample. The first column shows the
characteristics of the full sample; the second column shows the characteristics of transacting
properties that were located within 3,000 feet of one choice school; and the last column shows
the characteristics of transacting properties that were located within 3,000 feet of more than one
choice school.
As shown in the first column, most of the sales in our sample were located in Brooklyn 8 All sales of residential properties are included in this dataset, other than sales of apartments in cooperative buildings. The latter are excluded because they are not considered real estate sales by the NYC Department of Finance, and therefore are not part of the DOF’s database. 9 These characteristics are used as explanatory variables in the hedonic regressions. RPAD data contain information about buildings rather than individual units (except in the case of condominiums). Nonetheless, these building characteristics explain variations in prices surprisingly well, suggesting the data are rich enough for estimating hedonic price equations (see Ellen et al., 2006, for more detail on these data). In a cross-section regression including only RPAD variables, the R2 is 0.68.

11
and Queens, largely because those boroughs include a relatively large share of smaller
properties, which sell more frequently than apartment buildings. Seventy one percent of all
buildings sold were either one- or two-family homes, and 84 percent were either single-family
homes, two-family homes, or small apartment buildings. Over one third of the transacting
properties had garages and 70 percent were built before the Second World War.
School data
With the cooperation of the New York City Department of Education (NYC DOE), we
compiled a data set that includes information for the period 1988 to 2003 about the full set of
public elementary schools in New York City.10 We focus on elementary schools because of the
strong tie between residential location and the choice of elementary schools.11 Most elementary
students in public schools choose either their local zoned school or another school in their
CSD.12 There is much more choice available at the middle and high school levels and more
students commute to attend schools at some distance from their homes at these higher levels;
therefore, the tie between housing and school quality is weaker. The sample size varies between
615 schools in 1988 and 700 schools in 2003. The number of zones served by these elementary
schools ranges from 593 in 1988 to 611 in 2003.13
For each school, we have data on educational outcomes such as performance on
10 This dataset was compiled from the NYC DOE’s Annual School Reports (ASRs), 1987-88 to 2002-03. The selection of elementary schools is based on information on the lowest grade in school. Schools with the lowest grade less than or equal to grade 4 are included in the elementary category. The year 1988 denotes the 1987 to 1988 academic year, 1989 denotes the 1988 to 1989 academic year, and so on. 11 Importantly, there is significant variation in NYC elementary schools. For more information, see Rubenstein et al. (2009). 12 Note that nationally roughly 95% of school aged children attend public schools; in New York City that number is considerably lower at 90%. 13 The number of school zones is smaller than the number of schools as two or more schools may serve the same zone and because some schools do not have a designated attendance zone. Zone boundaries were obtained from the New York City Department of Education (DOE) and they pertain to 2003.

12
standardized reading and math tests (i.e., the share of students scoring at or above a
predetermined threshold).14 We also have data on a range of school characteristics including
share of students eligible for free lunch, share of students that are black and Hispanic, the
teacher/pupil ratio and the share of teachers with five or more years of experience.
As noted previously, in some cases, school zones may overlap, partially or entirely, or the
same property may be within 3,000 feet of several choice schools, and thus there may be
multiple schools serving the same property. Properties served by multiple schools are assigned
weighted means of the characteristics of these schools (including enrollment), with weights
given by school enrollment.15 We create separate sets of school variables for the zoned and
choice schools associated with a given property.
Table 2 provides a description of the elementary schools, including all available school
inputs and performance measures. The first three columns show statistics for our full sample of
schools, and the remaining columns compare the characteristics of the zoned and choice schools.
Note that this table shows averages for schools – that is, it describes the average school – rather
than averages over students, which would describe the characteristics of the whole student
population.16
The last six columns of Table 2 reveal some systematic differences between the choice
schools and those which were assigned specific attendance zones. The experience and education
levels of the teachers in the choice schools are lower, whereas the teacher-pupil ratio is slightly
higher. The choice schools are smaller and the significant decline in their enrollment between
14 Student performance on standardized tests is reported for a citywide test in reading (CTB/McGraw Hill Test of Basic Skills or New York State English Language Assessment) and mathematics (California Achievement Test or CAT or New York State Math Assessment). 15 Assuming that the probability of attending a given school is equal to the share of that school’s enrollment in total enrollment across all schools serving the property, the weighted average of a characteristic can be interpreted as an expected value. 16 These averages are not weighted by student. They are simple averages of school characteristics.

13
1988 and 2003 has increased the size gap between zoned and choice schools. The academic
performance of the students of the choice schools is weaker, although strong improvements over
the study period has brought them almost on par with the students of zoned schools with respect
to reading performance. As for student demographics, it is worth noticing that choice schools
started with significantly higher proportions of minorities and students from disadvantaged
backgrounds or in need of remedial language courses. However, by 2003 most of these
differences had virtually disappeared.
New York City School Context
These statistics make clear that this set of choice schools is not predominantly composed
of magnet schools, but includes a range of schools such as those designed to serve low
performing students. Additional information we were able to collect offers further evidence
about the variety of choice schools included in the analysis – with the caveat that this
information describes the schools as of 2008, not at the time of our study. Of the 123 choice
schools that were active at some point in time during our study period, 22 offer city-wide or
district-wide gifted-and-talented programs, 17 are alternative schools, 8 are magnet schools, 12
are schools that offer bilingual programs, 3 have unzoned special education programs, and 2 are
charter schools; for the remaining choice schools we could not determine the specific type. The
information about the types of choice schools was collected from internet sources, particularly
www.insideschools.org and the NYC Department of Education website. Finally, note that
though there are a significant number of choice schools the number of zoned schools far exceeds
the number of choice schools; only 6 to 10 percent of all elementary schools are choice schools.

14
As these schools represent a wide range of school types, there is also no one single
process that led to the opening of these choice schools. These schools are the result of
competing and coordinated processes. Some of these schools were built where there were no
other schools and there was a need for more capacity.17 Other schools were built in struggling
districts where there was a desire to create new opportunities with these new schools. Some
educators had the goals of creating magnet schools to integrate students across a number of
struggling schools, while others had empty space in an existing school and opening a choice
school was the chosen policy response.18 Throughout this period there was a growing
experimentation with choice schools, with no coordinated, strategic process leading to the
opening of each school.
Comparing the performance in math and reading at choice schools to that at the nearest
zoned schools reveals test scores at choice schools were, on average, 3 percentage points above
those at the nearest zoned school at the start of our study period. This average, however, masks
the wide variation between the performance of choice schools and their nearest zoned school. At
the 25th percentile, choice schools performed 13 percentage points below their nearest zoned
schools, and at the 75th percentile, choice schools performed 5 percentage points above their
nearest zoned school. This reflects the wide range of different types of choice schools opening
during this time period. The gap between choice schools and their nearest zoned schools shrinks
during our study period, and by the end of our study period choice schools perform two
percentage points below their nearest zoned school. Again this masks a wide variation; at the
25th percentile, choice schools performed 12 percentage points below their nearest zoned
17 http://www.nytimes.com/1995/09/05/nyregion/last-of-new-schools-in-five-year-plan-are-opening-but-overcrowding-persists.html 18 http://www.nytimes.com/1989/10/18/us/education-cavazos-presses-parental-choice-in-public-schools.html

15
schools, and at the 75th percentile, choice schools performed 6 percentage points above their
nearest choice school.
We show the distribution of choice schools throughout New York City in Figure 1. We
see that these choice schools are opening across the city during our study period (1988-2003).
This figure also shows us that at the beginning of our study period choice schools were heavily
concentrated in Manhattan and the Bronx, and that over time they also proliferated in Brooklyn
and Queens. Thus, other than in Staten Island, each borough has a significant number of choice
schools during our study period.
V. Results
We begin by establishing that school performance of zoned schools is capitalized into
housing values, where housing values are measured as the log of the sales price per unit of
property. Table 3 presents results for model specification (1), where we measure school
performance of zoned schools using the mean of both proficiency in math and English Language
Arts. This model includes a large set of building level controls as well as Community School
District (CSD) by time fixed effects. Overall the model performs well. Building level control
variables have in general the expected signs and the regression explains about 78 percent of the
variation in log prices. As expected, we find that zoned school performance, as measured by
proficiency rates in math and English Language Arts, is capitalized into housing values in New
York City.
As pointed out by Black (1999) these estimates could be subject to bias, as school zones
with high performance public schools could be quite different from school zones with lower

16
performance schools in a number of ways that cannot be measured. To control for this source of
bias we incorporate a simplified boundary discontinuity approach, where we estimate the
distance to the nearest elementary school boundary for each building in our sample, and assign
all buildings within a small distance of a given boundary to a ‘boundary group.’ Table 4 presents
results for this specification, where we begin with all housing units within 1,200 feet of an
elementary school attendance zone boundary and then limit our sample to buildings within 1,000
feet and then further to 800 feet. We can see that the coefficient is smaller, similar to results
found by Black (1999) and others when employing this methodology, but still highly significant.
The magnitude of this coefficient is more closely in line with existing literature. We find that a
ten percentage point improvement in the average proficiency in math and ELA is associated with
a 1.3 to 1.7 percent increase in housing values (depending on the distance to the attendance zone
boundary). To compare this estimate to the broader literature, a one standard deviation increase
in school performance is associated with a 3 percent increase in housing values.
To understand how choice schools shape this relationship, we estimate model (3), where
we now include an indicator for whether a housing unit is ever near a choice school and an
indicator for whether the choice school is open, as well as interactions between these indicators
and the performance of the zoned elementary school. We again limit our sample to housing units
within 1,200 feet of a boundary and then down to 800 feet from the boundary. We present
results for this specification in Table 5a. The coefficient on proficiency remains approximately
the same with the inclusion of the choice school variables. The indicator variable for when a
choice school opens is positive and significant, indicating that the opening of a choice school is
associated with an increase in housing values. Next, turning to our key independent variable of
interest, the interaction between the open choice school and proficiency rates in the zoned
17
school, we see this variable is negative and strongly significant. The magnitude of this
coefficient suggests that the capitalization of the zoned school into property values declines by
about one third after the choice school opens. To test whether these results were different in
zones with high performing vs. low performing zoned schools, we also stratified our sample and
find the results are strongest in neighborhoods with high performing zoned schools, as one may
expect. These are the neighborhoods where households pay the largest premium for the zoned
school, and in these neighborhoods the opening of a choice school reduces the capitalization of
school quality into housing values by approximately two thirds.19
To assess whether a choice school closing has the opposite effect of a choice school
opening, in Table 5b we model the closure of choice schools. We do find some evidence that
this relationship is symmetric. The closing of a choice school has a negative effect on housing
values, though it is not statistically significant at traditional confidence levels. The interaction
between choice school closures and the capitalization of the zoned school quality is positive, and
approximately the same magnitude as the interaction between choice school openings and the
capitalization of the zoned school quality. This builds further confidence that these results are
identifying the weakened link between zoned school quality and housing values once a choice
school opens near to one’s residence.
We next broaden our analysis to include percent Black, percent Hispanic, and school
enrollment, and test how their impacts on property values are shaped by the opening of a choice
school. As shown in table 6, estimates of the impacts of test scores are similar, though the
magnitude is smaller. Test scores are still significantly correlated to home values. The
dampening affect (the interaction between open choice schools and the zoned school pass rate),
19 These results are not presented but are available from the authors upon request. Results in neighborhoods with lower performing schools are similar to the overall results, but are only marginally statistically significant.

18
however, remains. Here, an open choice school reduces the capitalization of the zoned school
quality into housing values by about one half. The race of students in the school is also
capitalized into housing values – an increase in the representation of Hispanics and Blacks is
associated with a slight decrease in house values (a 10 percent increase in the share Hispanic or
Black is associated with a 1 percent decline in housing values) but these coefficients do not
change with the opening of a choice school. School size (enrollment) has no statistically
significant effect on house values.
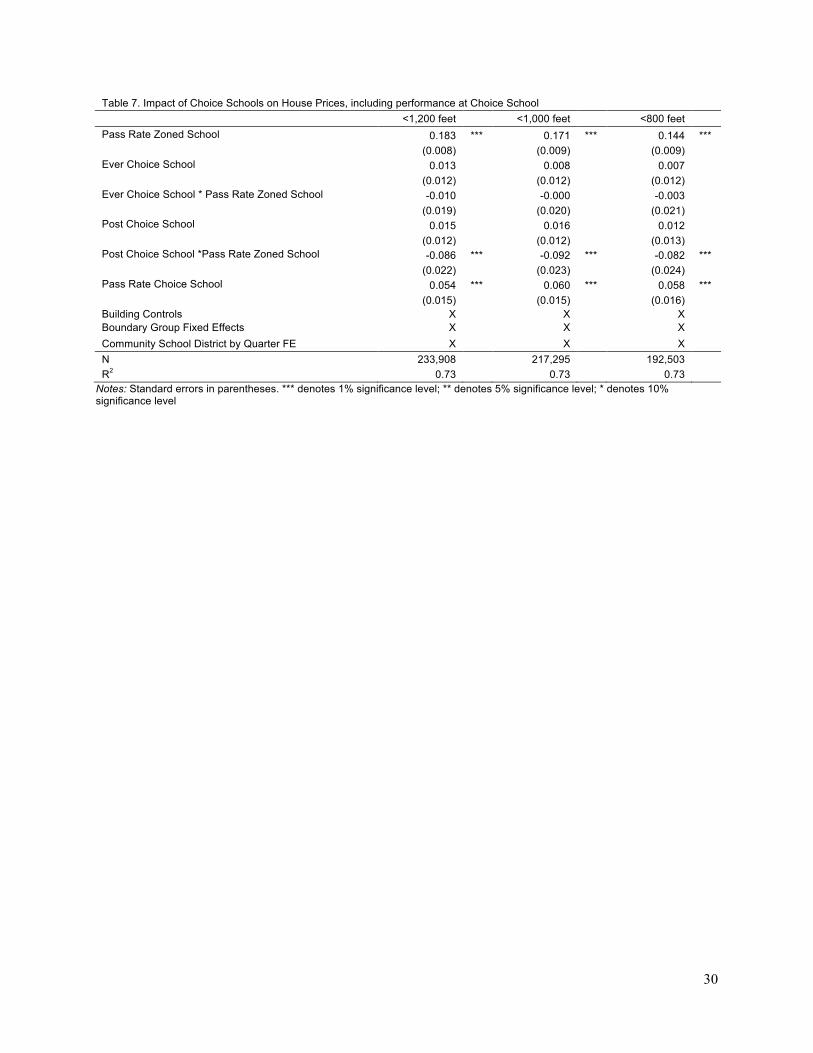
Finally, we test whether the impact of choice schools depends upon the quality of the
choice school, exploring the idea that a high performing choice school may have a different
impact than a low performing choice school. As shown in Table 7, the share of students passing
math and reading in the choice school does shape the way that the choice schools affect housing
values. The performance of the choice school is capitalized into the value of homes within a
small vicinity of the school (note that the coefficient on the opening of the choice school is no
longer significant, though still positive). However, the extent of capitalization is smaller than
that for the performance of zoned schools - perhaps not surprising given the inherently weaker
link between choice schools and their surrounding neighborhoods.
VIII. Conclusion
As school choices continue to grow within school districts across the country, it is critical
that we understand the ramifications of these new options. This paper presents a rigorous
exploration of how choice schools affect housing markets, especially the link between the quality

19
of locally zoned schools and surrounding housing values. Relying on detailed data for New
York City public elementary schools as well as property sales data for the years 1988 to 2003,
we find evidence that the opening of a choice school weakens the relationship between housing
values and the zoned elementary school. We find that the opening of a choice school reduces the
capitalization of the zoned school into housing values by approximately one third. Interestingly
we also find that the choice school itself is associated with increasing property values, suggesting
that neighbors view these schools as amenities. When incorporating the quality of the choice
school in our model, we find that a higher quality choice school is associated with high values
for nearby properties.
To provide a sense of the magnitude of this effect, consider a $100,000 home in a school
zone with an average school, which has a pass rate of 54.3%. The direct effect of the choice
school opening is to increase housing values by 2.2%. The indirect effect, through the
dampening of the relationship between housing values and the zoned school, is 2.6% (or -
0.048*0.543). Overall this leads to a net decrease of 0.4% or almost $400. For the average
homeowner a new choice school leads to a small decline in their housing value. However, this
describes the average experience, and we may in fact be interested in what happens in low
performing school zones where choice schools were created in an attempt to improve overall
educational quality. Let us consider a low performing school district with a performance of
30%. Here the direct effect of a choice school opening is again 2.2%. The indirect effect is a
decrease of 1.4%. In this example, on net, the household gains approximately 0.8% or almost
$800. From a policy perspective the opening of a choice school could be particularly beneficial
for homeowners in districts with below average schools, though on average it appears to have a

20
negative impact on housing values. Together our results suggest that opening of choice schools
have important ramifications for urban housing markets.

21
References
Bayer, Patrick, Fernando Ferreira and Robert McMillan. 2007. “A Unified Framework for Measuring Preferences for Schools and Neighborhoods.” Journal of Political Economy 115(4): 588-638.
Belfield, Clive R. and Henry M. Levin. 2002. “The Effects of Competition between Schools on Educational Outcomes: A Review for the United States.” Review of Educational Research 72(2): 279-341.
Black, Sandra. 1999. “Do Better Schools Matter? Parental Valuation of Elementary Education.” Quarterly Journal of Economics 114(2): 577-599.
Brunner, Eric J., Sung-Woo Cho and Randall Reback. 2012. “Mobility, housing markets and schools: Estimating the effects of inter-district choice programs.” Journal of Public Economics 96(7-8): 604-614.
Chisesi, Lawrence J. 2012. “School Choice Impacts within a Local School District.” Unpublished Dissertation.
Dhar, Paramita and Stephen Ross. 2012. “School district quality and property values: Examining differences along school district boundaries.” Journal of Urban Economics 71(1): 18-25.
Ellen, Ingrid, Amy Schwartz and Ioan Voicu. 2006. “The External Effects of Subsidized Housing.” Regional Science and Urban Economics 36: 679-707.
Fack, Gabrielle and Julien Grenet. 2010. “When do better schools raise house prices? Evidence from Paris public and private schools.” Journal of Public Economics 94(1-2): 59-77.
Friedman, Milton. 1955. The Role of Government in Education. In Economics and the Public Interest, edited by Robert Solo, 123–44.New Brunswick, NJ: Rutgers University Press.
Horowitz, John, Stanley Keil and Lee Spector. 2007. “Do charter schools affect property values?” Working Paper Department of Economics Ball State University.
Hoxby, Caroline M. 2004. “School Choice and School Competition: Evidence from the United States,” Swedish Economic Policy Review, 10.2.
Hoxby, Caroline M. 2003. "School Choice and School Productivity (Or, Could School Choice be a Rising Tide that Lifts All Boats," in C. Hoxby, ed. The Economics of School Choice, Chicago: University of Chicago Press.
Ladd, Helen F. 2002. Market Based Reforms in Urban Education. Washington DC: Economic Policy Institute.

22
Machin, Stephen. 2011. “Houses and schools: Valuation of school quality through the housing market.” Labour Economics 18: 723-729.
Machin, Stephen and Kjell Salvanes. 2010. “Valuing School Quality via a School Choice Reform.” IZA Discussion Paper No. 4719.
Nechyba, Thomas. 2003. “School finance, spatial income segregation, and the nature of communities.” Journal of Urban Economics 54(1): 61-88.
Nguyen-Hoang, Phuong and John Yinger. 2011. “The capitalization of school quality into house values: A review.” Journal of Housing Economics 20: 30-48.
Reback, Randall. 2005. “House prices and the provision of local public services: capitalization under school choice programs.” Journal of Urban Economics 57(2): 275-301.
Rouse, Cecilia E. and Lisa Barrow. 2009. “School Vouchers and Student Achievement: Recent Evidence and Remaining Questions.” Annual Review of Economics 1: 17-24.
Rubenstein, Ross, Amy Ellen Schwartz, Leanna Stiefel and Jeff Zabel. 2009. “Spending, Size, and Grade Span in K-8 Schools.” Education Finance and Policy, 4(1): 60-88.

23
Table 1 Characteristics of Residential Properties Sold
Percentage of all
property sales
Percentage of property sales within 3,000 ft of one
choice school
Percentage of property sales within 3,000 ft of two or more
choice schools Borough
Manhattan 10.1 29.5 34.4 Bronx 9.5 14 36.4 Brooklyn 30.9 32.5 28.3 Queens 37.1 19.6 0.9 Staten Island 12.5 4.5 0 Building Class
Single-family detached 25.9 12.9 4.3 Single-family attached 15.2 8.8 5.6 Two-family 29.9 28.2 25.9 Walk-up apartments 13 19 31.4 Elevator apartments 0.4 1 2 Loft buildings 0 0.1 0 Condominiums 12.4 26.1 25.3 Mixed-use, primarily residential 3.2 4 5.8 (includes store or office plus residential units)
Other Structural Characteristics Built pre-World War II 70.1 76.2 88.2
Garage 37.4 20.4 7.6 Corner location 8.5 6.5 7.1 Major alteration prior to sale 1.6 3.5 6.8
N = 352,291

Table 2 School Characteristics All Schools Zoned Schools Choice Schools
Change*
Change*
Change*
1988 2003 1988-2003 1988 2003
1988-2003 1988 2003
1988-2003
Mean % students passing math 62.8 56.4 -6.4
63.4 56.8 -6.6
53.4 52.7 -0.7 Mean % students passing reading 44.5 53.7 9.2
45.2 53.9 8.7
34.2 51.9 17.7
Mean % teachers with more than 5 years experience 80.4 52.7 -27.7
80.8 53.5 -27.3
75 45.3 -29.6
Mean % teachers with masters 66.9 78.2 11.3
67.5 78.4 10.9
57.2 76.4 19.3 Mean % teachers with less than 2 years in this school 11.6 35.7 24
11.3 34.5 23.2
16.3 46.4 30.1
Mean teacher-pupil ratio** 5.6 6.9 1.2
5.6 6.7 1.1
6 8.1 2.1 Mean school enrollment 753.3 749 -0.6
759.9 772.3 1.6
656 529.4 -19.3
Mean % of students who are: Free lunch eligible 62.6 74 11.4
61.4 74.2 12.8
79.8 72.2 -7.6
White 23.4 16 -7.5
24.5 16.1 -8.4
7.6 14.6 7 Black 36 33.6 -2.4
35.9 33.3 -2.6
37.7 35.9 -1.8
Hispanic 33.9 38.3 4.4
32.7 37.9 5.2
51.2 41.7 -9.4 Asian 6.8 12.2 5.5
7 12.7 5.7
3.5 7.7 4.2
LEP 10.5 11.4 0.9
10.3 11.6 1.2
13 10 -3 N 615 700 85 576 633 57 39 67 28
* For enrollment, this figure represents the percentage change in mean between the two years; for the other characteristics, this figure represents the change in mean between the two years. ** Teacher-pupil ratio is expressed as teahcers per 100 pupils.


26
Table 3 Impact of School Performance on House Prices (log of sales price per unit of property)* Pass Rate Zoned School 0.695 ***
(0.005) Odd shape 0.027 *** (0.002) Garage 0.042 *** (0.001) Extension 0.043 *** (0.002) Corner 0.030 *** (0.002) Major alteration prior to sale 0.091 *** (0.005) Age of unit -0.004 *** (0.000) (Age of unit)2 0.000 *** (0.000) Log square feet per unit 0.598 *** (0.002) Number of buildings on same lot -0.000 (0.000) Includes commercial space -0.045 *** (0.005) Single-family detached 0.162 *** (0.002) Two-family home -0.246 *** (0.002) Three-family home -0.468 *** (0.003) Four-family home -0.609 *** (0.004) Five/six-family home -1.011 *** (0.005) More than six-families no elevator -1.378 *** (0.005) Walkup, units not specified -1.329 *** (0.008) Elevator apartment building, cooperatives -1.765 *** (0.051) Elevator apartment building, not cooperatives -1.384 *** (0.010) Loft building -0.871 *** (0.035) Condominium, single family attached -0.168 *** (0.013) Condominium, walk-up apartments -0.163 *** (0.005) Condominium, elevator building -0.288 *** (0.004) Condominium, miscellaneous 0.177 *** (0.033) Muli-use, single family with store -0.000 (0.008) Multi-use, two family with store -0.363 *** (0.007) Multi-use, three-family with store -0.572 *** (0.011) Multi-use, four or more family with store -0.744 *** (0.008) Community School District by Quarter FE X N 352,291 R2 0.78 *We also include indicators for missing variables, including alteration, age and square feet Notes:Standard errors in parentheses. *** denotes 1% significance level; ** denotes 5% significance level; * denotes 10% significance level

27
Table 4 Impact of School Performance on House Prices, including boundary group fixed effects <1,200 feet <1,000 feet <800 feet Pass Rate Zoned School 0.171 *** 0.161 *** 0.133 ***
(0.008) (0.008) (0.009) Building Controls X X X Boundary Group Fixed Effects X X X Community School District by Quarter FE X X X N 233,908 217,295 192,503 R2 0.73 0.73 0.73
Notes: Standard errors in parentheses. *** denotes 1% significance level; ** denotes 5% significance level; * denotes 10% significance level

28
Table 5a Impact of Choice Schools on House Prices, before and after choice schools open <1,200 feet <1,000 feet <800 feet Pass Rate Zoned School 0.179 *** 0.168 *** 0.140 *** (0.008) (0.009) (0.009) Ever Choice School 0.015 0.010 0.009 (0.012) (0.012) (0.012) Ever Choice School*Pass Rate Zoned School -0.011 -0.002 -0.005 (0.019) (0.020) (0.021) Post Choice School 0.025 ** 0.027 * 0.022 * (0.012) (0.012) (0.013) Post Choice School*Pass Rate Zoned School -0.054 *** -0.056 *** -0.048 ** (0.021) (0.021) (0.022) Building Controls X X X Boundary Group Fixed Effects X X X Community School District by Quarter FE X X X N 233,908 217,295 192,503 R2 0.73 0.73 0.73
Notes: Standard errors in parentheses. *** denotes 1% significance level; ** denotes 5% significance level; * denotes 10% significance level
Table 5b Impact of Choice Schools on House Prices, before and after choice schools open <1,200 feet <1,000 feet <800 feet Pass Rate Zoned School 0.178 *** 0.166 *** 0.139 *** (0.008) (0.009) (0.009) Ever Choice School 0.016 0.010 0.008 (0.012) (0.012) (0.013) Ever Choice School*Pass Rate Zoned School -0.016 -0.005 -0.005 (0.020) (0.020) (0.021) Post Choice School 0.025 ** 0.027 ** 0.024 * (0.012) (0.012) (0.013) Post Choice School*Pass Rate Zoned School -0.055 *** -0.058 *** -0.051 ** (0.021) (0.021) (0.022) Closed Choice School -0.027 * -0.024 -0.013 (0.015) (0.016) (0.016) Closed Choice School *Pass Rate Zoned School 0.086 *** 0.090 *** 0.063 ** (0.028) (0.029) (0.031) Building Controls X X X Boundary Group Fixed Effects X X X Community School District by Quarter FE X X X N 233,908 217,295 192,503 R2 0.73 0.73 0.73
Notes: Standard errors in parentheses. *** denotes 1% significance level; ** denotes 5% significance level; * denotes 10% significance level

29
Table 6 Impact of Choice School on House Prices with detailed school characteristics
<1200 Ft <1000 Ft <800 Ft Pass Rate Zoned School 0.119 *** 0.115 *** 0.097 *** (0.010)
(0.011)
(0.011)
% Black -0.001 *** -0.001 *** -0.001 ***
(0.000)
(0.000)
(0.000)
% Hispanic -0.001 *** -0.001 *** -0.001 ***
(0.000)
(0.000)
(0.000)
Total Enrollment (logs) -0.002
0.000
0.001
(0.003)
(0.003)
(0.003)
Ever Choice School -0.055
-0.040
-0.010 (0.053)
(0.055)
(0.058)
Interactions with Ever: Pass Rate Zoned School -0.010
-0.015
-0.025 (0.026)
(0.027)
(0.028)
% Black 0.000 * 0.000 *** 0.000 ***
(0.000)
(0.000)
(0.000)
% Hispanic 0.000
0.000
0.000
(0.000)
(0.000)
(0.000)
Total Enrollment (logs) 0.012
0.011
0.008
(0.007)
(0.008)
(0.008)
Post Choice School 0.095
0.085
0.042
(0.061)
(0.062)
(0.065)
Interactions with Post: Pass Rate Zoned School -0.069 ** -0.063 ** -0.053 *
(0.029)
(0.029)
(0.031) % Black 0.000
0.000
0.000
(0.000)
(0.000)
(0.000) % Hispanic 0.000 ** 0.000 * 0.000 *
(0.000)
(0.000)
(0.000)
Total Enrollment (logs) -0.006
-0.006
0.000
(0.008)
(0.009)
(0.009)
Building Controls X X X Boundary Group Fixed Effects X X X Community School District by Quarter FE X X X N 233,908 217,295 192,503 R2 0.73 0.73 0.73 Notes: Standard errors in parentheses. *** denotes 1% significance level; ** denotes 5% significance level; * denotes 10% significance level
30
Table 7. Impact of Choice Schools on House Prices, including performance at Choice School <1,200 feet <1,000 feet <800 feet Pass Rate Zoned School 0.183 *** 0.171 *** 0.144 *** (0.008) (0.009) (0.009) Ever Choice School 0.013 0.008 0.007 (0.012) (0.012) (0.012) Ever Choice School * Pass Rate Zoned School -0.010 -0.000 -0.003 (0.019) (0.020) (0.021) Post Choice School 0.015 0.016 0.012 (0.012) (0.012) (0.013) Post Choice School *Pass Rate Zoned School -0.086 *** -0.092 *** -0.082 *** (0.022) (0.023) (0.024) Pass Rate Choice School 0.054 *** 0.060 *** 0.058 *** (0.015) (0.015) (0.016) Building Controls X X X Boundary Group Fixed Effects X X X Community School District by Quarter FE X X X N 233,908 217,295 192,503 R2 0.73 0.73 0.73
Notes: Standard errors in parentheses. *** denotes 1% significance level; ** denotes 5% significance level; * denotes 10% significance level

31
Appendix A: Construction of Boundary Groups
To create boundary groups we rely on the centroid of each building parcel and measure the distance between that parcel and the nearest boundary. We assign each parcel to the attendance zone in which it is located. We then measure the distance between each parcel and the nearest attendance zone outside of the parcel’s attendance zone. Therefore, for each building parcel we have three identifiers: the distance to the boundary, the parcel’s attendance zone and the nearest attendance zone outside of the current zone. Based on these indicators we then construct ‘boundary groups.’ Boundary groups consist of parcels on two sides of an attendance zone boundary within a given distance of that boundary. For example the set of boundary groups that include only properties within 800 feet of the boundary include properties on two sides of a boundary within 800 feet of that boundary.