dna protocols & applications
DESCRIPTION
DNATRANSCRIPT

2/3/2014 DNA Protocols & Applications
http://www.qiagen.com/knowledge-and-support/spotlight/protocols-and-applications-guide/dna/ 1/20
Resource Center
Troubleshooting & Support
Spotlight on Expertise
Webinars
Videos & Virtual Demos
Apps
Meetings & Exhibitions
Learn more
Knowledge & Support
Sign up for E-News
Enter email address
DNA Protocols & Applications
Considerations for isolation and quantification of both genomic DNA and plasmid DNA
This section describes considerations for isolation and quantification of both
genomic DNA from different sample sources and plasmid DNA. It also deals with
common plasmid DNA procedures, including how to make and transform
competent cells, how to culture and handle plasmid-containing cells, and
commonly used techniques for analysis of genomic DNA.
What is DNA?
DNA extraction technologies
Working with DNA: Good laboratory practice
Conversions for nucleic acids: DNA
Spectrophotometric measurement of DNA concentration
Sample storage prior to extraction of genomic DNA
Sample disruption for extraction of genomic DNA
Working with DNA: Good microbiological practice
Storage of E. coli strains
Plasmid specifications
Bacterial cultivation media and antibiotics
Lysis of bacterial cells for plasmid purification
Transformation of DNA
Transformation of competent E. coli
Isopropanol precipitation of DNA
Storage of DNA
Endotoxins and what to consider
Quantification of DNA
Spectrophotometry
Fluorometry
Agarose gel
Restriction endonuclease digestion of DNA
Ligation of DNA
DNA analysis using analytical gels
Pouring an agarose gel
Running an agarose gel
Visual analysis of the gel
Analysis of DNA by Southern blotting
DNA cleanup
References
What is DNA?
Genomic DNA
Genomic DNA constitutes the total genetic information of an organism. The genomes of almost all organisms are DNA,
the only exceptions being some viruses that have RNA genomes. Genomic DNA molecules are generally large, and in
most organisms are organized into DNA–protein complexes called chromosomes. The size, number of chromosomes,
and nature of genomic DNA varies between different organisms (see table Sizes and molecular weights of various
genomic DNAs). Viral DNA genomes are relatively small and can be single- or double-stranded, linear, or circular. All other
organisms have double-stranded DNA genomes. Bacteria have a single, circular chromosome. In eukaryotes, most
genomic DNA is located within the nucleus (nuclear DNA) as multiple linear chromosomes of different sizes. Eukaryotic
cells additionally contain genomic DNA in the mitochondria and, in plants and lower eukaryotes, the chloroplasts. This
DNA is usually a circular molecule and is present as multiple copies within these organelles.
Sizes and molecular weights of various genomic DNAs
Innovative Tools for Genotyping
Cancer — Unraveling the
Complexity
HPV Testing
High-resolution melting
(HRM) Technology
Microbiology & Microbiome
Next-Generation
Sequencing
Plasmid Resource Center
Protocols & Applications
Guide
DNA
RNA
PCR
Whole Genome
Amplification (WGA)
Next-generation
sequencing (NGS)
Epigenetics
Transfection
Protein
Animal Cell Culture
Pyrosequencing Resource
Center
Whole Genome
Amplification (WGA)
Sign up
Print Bookmark Share
Download the brochure
Home Products Knowledge & Support About QIAGEN
Sample & Assay Technologies
Log in Cart Wishlist 0
Search

2/3/2014 DNA Protocols & Applications
http://www.qiagen.com/knowledge-and-support/spotlight/protocols-and-applications-guide/dna/ 2/20
Back to top
Organism Base pairs per haploid
genome
Molecular weight of genome
(daltons)
Number of
chromosomes
SV40 5243 3.4 x 10⁶ –
F174 5386 3.5 x 10⁶ –
Adenovirus 2 35,937 2.3 x 10⁷ –
Lambda 48,502 3.2 x 10⁷ –
Escherichia coli 4.7 x 10⁶ 3.1 x 10⁹ x = 1
Saccharomyces
cerevisiae 1.5 x 10⁷ 9.8 x 10⁹ 2x = 32
Dictyostelium
discoideum 5.4 x 10⁷ 3.5 x 10¹⁰ x = 6
Arabidopsis thaliana 7.0 x 10⁷ 4.6 x 10¹⁰ 2x = 10
Caenorhabditis elegans 8.0 x 10⁷ 5.2 x 10¹⁰ 2x = 12
Drosophila
melanogaster 1.4 x 10⁸ 9.1 x 10¹⁰ 2x = 8
Gallus domesticus
(chicken) 1.2 x 10⁹ 7.8 x 10¹¹ 2x = 78
Mus musculus (mouse) 2.7 x 10⁹ 1.8 x 10¹² 2x = 40
Rattus norvegicus (rat) 3.0 x 10⁹ 2.0 x 10¹² 2x = 42
Xenopus laevis 3.1 x 10⁹ 2.0 x 10¹² 2x = 36
Homo sapiens 3.3 x 10⁹ 2.1 x 10¹² 2x = 46
Zea mays 3.9 x 10⁹ 2.5 x 10¹² 2x = 20
Nicotiana tabacum 4.8 x 10⁹ 3.1 x 10¹² 2x = 48
Adapted from references 1 and 2.
Genomic DNA contains genes, discrete regions that encode a protein or RNA. A gene comprises the coding DNA
sequence, as well as the associated regulatory elements that control gene expression. Nuclear eukaryotic genes also
contain noncoding regions called introns. The number of genes varies widely between different organisms. Coding DNA
represents only a small fraction of eukaryotic genomic DNA: the bulk of the DNA is noncoding, much of which is made up
of repetitive sequences. Some noncoding DNA has structural and regulatory functions; however, the function of most of
this DNA is largely unknown. The number of copies of each genetic locus present in a cell, or ‘ploidy’, also varies between
organisms. The somatic (body) cells of organisms that reproduce sexually are usually diploid, having two sets of
homologous chromosomes and hence two copies of each genetic locus, while the germ (reproductive) cells are haploid
and have only one copy of each chromosome. Prokaryotic cells are haploid. Some plants are polyploid, for example,
modern wheat, which is hexaploid (six copies of each chromosome).
Plasmid DNA
Bacterial plasmids are closed circular molecules of double-stranded DNA that range in size from 1 to >200 kb. They are
found in a variety of bacterial species, where they behave as additional genetic units inherited and replicated
independently of the bacterial chromosome. However, they rely upon enzymes and proteins provided by the host for their
successful transcription and replication.
Plasmids often contain genes that code for enzymes that can be advantageous to the host cell in some circumstances.
The encoded enzymes may be involved in resistance to, or production of, antibiotics, resistance to toxins found in the
environment (e.g., complex organic compounds), or the production of toxins by the bacteria itself.
Once purified, plasmid DNA can be used in a wide variety of downstream applications such as sequencing, PCR,
expression of proteins, transfection, and gene therapy.
DNA extraction technologies
DNA can be purified using many different methods and the downstream application determines how pure the DNA should
be. In addition to isolation using home-made methods (e.g., CsCl gradients), DNA extraction kits are available from many
suppliers. The characteristics of the 3 most common types of DNA extraction kit are shown in the table Characteristics of
common DNA extraction kits.
Characteristics of common DNA extraction technologies
Anion-exchange Silica-membrane technology Magnetic-particle technology
What it is Solid-phase, anion-exchange
chromatography
Selective adsorption to silica
membranes
Binding to magnetic silica
particles under controlled ionic
conditions
Procedure
Binding: variable salt and pH
Elution: variable salt and pH
Alcohol precipitation
Binding: high salt
Elution: low salt
Ready-to-use eluate
Binding: high salt
Elution: low salt
Ready-to-use eluate
Advantages
Delivers ultrapure, transfection-
grade DNA for optimal results in
sensitive applications
Delivers high-purity nucleic
acids for use in most
downstream applications
Delivers high-purity nucleic
acids for use in most
downstream applications
Fast, inexpensive Fast, inexpensive
No silica-slurry carry over, no
alcohol precipitation
Easy to automate; no alcohol
precipitation
Anion-exchange methods yield DNA of a purity and biological activity equivalent to at least two rounds of purification in
CsCl gradients, in a fraction of the time. Purified nucleic acids are of the highest possible quality and are ideal for sensitive
downstream biological applications, such as transfection, microinjection, sequencing, and gene therapy research.
Silica-membrane technology yields high-purity nucleic acids suitable for most molecular biology and clinical research
applications, such as restriction digestion, ligation, labeling, amplification, and radioactive and fluorescent sequencing.

2/3/2014 DNA Protocols & Applications
http://www.qiagen.com/knowledge-and-support/spotlight/protocols-and-applications-guide/dna/ 3/20
Back to top
Back to top
Back to top
Magnetic-particle technology yields high-purity nucleic acids suitable for most molecular biology applications used in
clinical and veterinary research, such as restriction digestion, ligation, labeling, amplification, and radioactive and
fluorescent sequencing. Magnetic-particle technology can often be automated to enable fast and economical nucleic acid
purification procedures.
Working with DNA: Good laboratory practice
Handling DNA
DNA is a relatively stable molecule. However, introduction of nucleases to DNA solutions should be avoided as these
enzymes will degrade DNA. Genomic DNA consists of very large DNA molecules, which are fragile and can break easily.
To ensure the integrity of genomic DNA, excessive and rough pipetting and vortexing should be avoided. DNA is subject to
acid hydrolysis when stored in water, and should therefore be stored in TE buffer, see table TE buffer, pH 7.4.
TE Buffer, pH 7.4
Component Volume
1 M Tris×Cl, pH7.4 10 ml
0.5 M EDTA, pH 8.0 2 ml
Conversions for nucleic acids: DNA
Molecular weight conversions for DNA
MW of a double-stranded DNA molecule (sodium salt) = (number of base pairs) x (662 daltons/base pair)
MW of a single-stranded DNA molecule (sodium salt) = (number of base pairs) x (331 daltons/base pair)
MW of a DNA oligonucleotide (sodium salt, pH ≥7):
MW = (NA x 335.2) + (NC x 311.2) + (NC x 351.2) + (NT x 326.2) + P
Where NX = the number of residues of the respective nucleotide within the oligonucleotide (the MW listed for each
nucleotide is the MW of that nucleotide, with associated sodium, incorporated in the oligonucleotide)
For dephosphorylated oligonucleotides: P = –84.0
For phosphorylated oligonucleotides: P = 40.0
Molecular conversions for DNA
Molar conversions for DNA can be found in the tables Microgram DNA conversions and Picomole DNA conversions.
Protein/DNA conversions can be found in the table Protein/DNA conversions.
Microgram DNA conversions
1 µg pmol Molecules
20 b oligonucleotide 152 9.1 x 10¹³
1000 bp DNA 1.52 9.1 x 10¹¹
pUC 19 DNA (2686 bp) 0.57 3.4 x 10¹¹
pBR322 DNA (4363 bp) 0.35 2.1 x 10¹¹
Lambda DNA (48,502 bp) 0.03 1.8 x 10¹⁰
Picomole DNA conversions
1 pmol Micrograms
20 b oligonucleotide 0.0066
1000 bp DNA 0.66
pUC 19 DNA (2686 bp) 1.77
pBR322 DNA (4363 bp) 2.88
Lambda DNA (48,502 bp) 32.01
Protein/DNA conversions
1 pmol DNA
10,000 Da 270 bp
30,000 Da 810 bp
100,000 Da 2.7 kb
1 kb of DNA encodes 333 amino acids @ 3.7 x 10⁴ Daltons.
Spectrophotometric measurement of DNA concentration
The concentration of DNA and RNA should be determined by measuring the absorbance at 260 nm (A260) in a
spectrophotometer. For accuracy, absorbance readings at 260 nm should fall between 0.15 and 1.0.
Pure DNA has an A260/A280 ratio of 1.8–2.0 in 10 mM Tris·Cl, pH 8.5.
Strong absorbance at A280 resulting in a low A260/A280 ratio indicates the presence of contaminants, such as proteins.
Strong absorbance at 270 nm and 275 nm may indicate the presence of contaminating phenol.
Absorbance at 325 nm suggests contamination by particulates in the solution or dirty cuvettes.
Spectrophotometric conversions from absorbance at 260 nm
1 A260 unit Concentration (µg/ml)*
dsDNA 50

2/3/2014 DNA Protocols & Applications
http://www.qiagen.com/knowledge-and-support/spotlight/protocols-and-applications-guide/dna/ 4/20
Back to top
dsDNA 50
ssDNA 33
Oligonucleotides 20–30
* This relationship is only valid for measurements made at neutral pH, and is based on a standard 1 cm path.
Adapted from reference 1.
Sample storage prior to extraction of genomic DNA
The quality of the starting material affects the quality and yield of the isolated DNA. The highest DNA yield and quality is
achieved by purifying genomic DNA from freshly harvested tissues and cells. If samples cannot be processed immediately
after harvesting, they should be stored under conditions that preserve DNA integrity. In general, genomic DNA yields will
decrease if samples, particularly animal samples, are stored at either 2–8°C or –20°C without previous treatment. In
addition, repeated freezing and thawing of frozen samples should be avoided as this will lead to genomic DNA of reduced
size or to reduced yields of pathogen DNA (e.g., viral DNA). Recommendations for storage of different starting materials
are discussed below.
Blood
An anticoagulant should be added to blood samples that will be stored. For example, blood samples treated with heparin
or EDTA can be stored at 2–8°C for a few days or at –20°C or –80°C for a few weeks. Alternatively, blood samples can be
treated with ACD Solution B (0.48% citric acid, 1.32% sodium citrate, 1.47% glucose; use 1 ml per 6 ml blood) and stored
for at least 5 days at 2–8°C or 1 month at –20°C. For long-term storage, blood nuclei can be prepared and stored at –
20°C.
Other clinical samples
Most biological fluids (e.g., plasma, serum, and urine) and stool samples can be stored at 2–8°C for several hours.
Freezing at –20°C or –80°C is recommended for long-term storage. Swabs can be stored dry at room temperature.
Formalin fixation and paraffin embedding (FFPE) is another means of sample storage and is particularly relevant for
clinical tissue samples. Depending on the tissue type, the speed at which biomolecules are degraded, induced, or
modified following harvesting can vary. Therefore, the procedures for tissue removal and fixation should be done as
quickly as possible.
Fixation of tissues involves placing specimens in a formalin solution, which can vary in composition (a typical 10%
formalin solution may contain 3.7% formaldehyde as well as 1–1.5% methanol). The resulting chemical reaction leads to
cross-links between biomolecules, including cross-links between nucleic acids, between proteins, and between nucleic
acids and proteins. For optimal results, neutral-buffered formalin solution should be used instead of unbuffered or acidic
formalin solutions. Neutral buffer slows down the degradation of formalin, whose degradation products are believed to
contribute to impairing nucleic acid quality.
The ratio of formalin to tissue should be at least 10:1 to ensure optimal fixation. This is easy to achieve when working with
small tissue specimens, such as needle biopsies. However, when dealing with large tissue samples there may be
insufficient formalin for fixation. In this case, sections of the tissue should be cut for formalin fixation. Tissues should be
fixed for no more than 24 hours to avoid overfixation.
After fixation in formalin, tissue specimens are embedded in paraffin, a process which consists of several steps. The first
step is dehydration, where water is replaced by an alcohol, usually ethanol. This is followed by clearing, where the alcohol
is replaced by xylene or a xylene substitute, and by impregnation, where xylene is replaced by paraffin. The final step is
embedding, where the entire specimen is surrounded with paraffin. It is important that tissue specimens are fully
dehydrated prior to impregnation, as residual water may lead to sample degradation. We recommend always using fresh
alcohol and xylene, to avoid any possibility of carryover of water from previous uses. To ensure optimal recovery of usable
DNA from FFPE samples, low-melting–temperature paraffin should be used instead. In addition, paraffin containing
additives such as beeswax should be avoided, as they may interfere with recovery of biomolecules.
Animal tissue
Freshly harvested tissue can be immediately frozen and stored at –20°C, –80°C, or in liquid nitrogen. Lysed tissue
samples can be stored in a suitable lysis buffer for several months at ambient temperature.
Animal and human tissues can also be fixed for storage. We recommend using fixatives such as alcohol and formalin;
however, long-term storage of tissues in formalin will result in chemical modification of the DNA. Fixatives that cause
cross-linking, such as osmic acid, are not recommended if DNA will be isolated from the tissue. It is also possible to
isolate DNA from paraffin-embedded tissue (see Other clinical samples).
Animal, yeast, and bacterial cell cultures
Centrifuge harvested cell cultures, remove the supernatant, and then store the cells at –20°C or –80°C. Alternatively,
animal cell nuclei can be prepared and stored at –20°C.
Plant tissue
Fresh leaves and needles from most plant species can be stored for up to 24 hours at 4°C without affecting DNA quality or
yield. In general, samples that will be stored for longer than 24 hours should be stored at –80°C. However, some samples
(e.g., tree buds) can be stored for several days at 4°C. Tissues stored at 4°C should be kept in a closed container to
prevent dehydration. Large samples (e.g., branches) can be stored in a plastic bag containing a wet paper towel.
If it is not practical to store frozen samples, a number of methods are available for drying plant tissue, for example, silica
gel, food dehydrators, or lyophilizers (3). To prevent DNA degradation, material should be completely desiccated in less
than 24 hours. Dried samples should be kept in the dark at room temperature under desiccating or hermetic conditions for
long-term storage. Depending on how the sample was handled, the DNA in herbarium and forensic samples may be
degraded. Disrupted plant material can be stored in a suitable lysis buffer for several months at ambient temperature.
Fungal material
Mycelium should be harvested directly from a culture dish or liquid culture. For liquid cultures, the cells should be pelleted
2/3/2014 DNA Protocols & Applications
http://www.qiagen.com/knowledge-and-support/spotlight/protocols-and-applications-guide/dna/ 5/20
Back to top
Mycelium should be harvested directly from a culture dish or liquid culture. For liquid cultures, the cells should be pelleted
by centrifugation and the supernatant removed before DNA isolation or storage. Harvested samples can be either directly
frozen or freeze dried, and stored at –80°C.
Sample disruption for extraction of genomic DNA
Complete disruption and lysis of cell walls and plasma membranes of cells and organelles is an absolute requirement
for all genomic DNA isolation procedures. Incomplete disruption results in significantly reduced yields.
Disruption methods
Lysis buffer
Disruption generally involves use of a lysis buffer that contains a detergent (for breaking down cellular membranes) and a
protease (for digestion of protein cellular components). The choice of protease depends on the lysis buffer used. Some
sample types require additional treatment for efficient lysis; this is described in more detail in Special considerations for
isolating genomic DNA from different sample sources.
Disruption using rotor–stator homogenizers
Rotor–stator homogenizers thoroughly disrupt animal and plant tissues in 5–90 seconds depending on the toughness of
the sample. The rotor turns at very high speed causing the sample to be disrupted by a combination of turbulence and
mechanical shearing. Foaming of the sample should be kept to a minimum by using properly sized vessels, by keeping
the tip of the homogenizer submerged, and by holding the immersed tip to one side of the tube. Rotor–stator
homogenizers are available in different sizes and operate with probes of different sizes. Probes with diameters of 5 mm
and 7 mm are suitable for volumes up to 300 µl and can be used for homogenization in microfuge tubes. Probes with a
diameter of 10 mm or above require larger tubes.
Disruption using bead mills
In disruption using a bead mill, the sample is agitated at high speed in the presence of beads. Disruption occurs by the
shearing and crushing action of the beads as they collide with the cells. Disruption efficiency is influenced by:
Size and composition of beads
Ratio of buffer to beads
Amount of starting material
Speed and configuration of agitator
Disintegration time
The optimal beads to use are 0.1 mm (mean diameter) glass beads for bacteria, 0.5 mm glass beads for yeast and
unicellular animal cells, 3–7 mm stainless steel beads for animal tissues, and 3–7 mm stainless steel or tungsten
carbide beads for plant and fungal tissues. It is essential that glass beads are pretreated by washing in concentrated nitric
acid. Alternatively, use commercially available acid-washed glass beads. All other disruption parameters must be
determined empirically for each application.
Disruption using a mortar and pestle
For disruption using a mortar and pestle, freeze the sample immediately in liquid nitrogen and grind to a fine powder
under liquid nitrogen. Transfer the suspension (tissue powder and liquid nitrogen) into a liquid-nitrogen–cooled,
appropriately sized tube and allow the liquid nitrogen to evaporate without allowing the sample to thaw. Add lysis buffer
and continue as quickly as possible with the isolation procedure.
Special considerations for isolating genomic DNA from different sample sources
Some sample sources contain substances that can cause problems in DNA isolation and analysis. Special
considerations are required when working with these sample sources. In this section, considerations for working with a
number of different sources are discussed.
Blood
Human blood samples are routinely collected for clinical analysis. Blood contains a number of enzyme inhibitors that can
interfere with downstream DNA analysis. In addition, common anticoagulants such as heparin and EDTA can interfere
with downstream assays. DNA isolation from blood requires a method to provide high-quality DNA without contaminants
or enzyme inhibitors.
In animals, erythrocytes (red blood cells) from birds, fish, and frogs contain nuclei and hence genomic DNA, while those
from mammals do not. Since healthy mammalian blood contains approximately 1000 times more erythrocytes than nuclei-
containing leukocytes (white blood cells, comprising lymphocytes, monocytes, and granulocytes) removing the
erythrocytes prior to DNA isolation can give higher DNA yields. This can be accomplished by several methods. One is
selective lysis of erythrocytes, which are more susceptible than leukocytes to hypotonic shock and burst rapidly in the
presence of a hypotonic buffer. Alternatively, Ficoll density-gradient centrifugation can be performed to recover
mononuclear cells (lymphocytes and monocytes) and remove erythrocytes. This technique also removes granulocytes. A
third method is to prepare a leukocyte-enriched fraction of whole blood, called buffy coat, by centrifuging whole blood at
3300 x g for 10 minutes at room temperature. After centrifugation, three different fractions are distinguishable: the upper
clear layer is plasma; the intermediate layer is buffy coat; and the bottom layer contains concentrated erythrocytes.
Blood samples, including those treated to remove erythrocytes, can be efficiently lysed using lysis buffer and protease or
proteinase K. Along with the animal’s genomic DNA, viral and bacterial DNA can also be isolated from blood samples.
Other clinical samples
Most biological fluids can be treated in the same way as blood samples for isolation of DNA. Isolation of DNA from stool
samples is more difficult, as stool typically contains many compounds that can degrade DNA and inhibit downstream
enzymatic reactions.
Animal tissues and cell culture
Animal cell cultures and most animal tissues can be efficiently lysed using lysis buffer and protease or proteinase K.
Fresh or frozen samples should be cut into small pieces to aid lysis. Mechanical disruption using a homogenizer or

2/3/2014 DNA Protocols & Applications
http://www.qiagen.com/knowledge-and-support/spotlight/protocols-and-applications-guide/dna/ 6/20
Back to top
mortar and pestle prior to lysis can reduce lysis time. Skeletal muscle, heart, and skin tissue have an abundance of
contractile proteins, connective tissue, and collagen, and care should be taken to ensure complete digestion with
protease or proteinase K.
For fixed tissues, the fixative should be removed prior to lysis. Formalin can be removed by washing the tissue in
phosphate-buffered saline (PBS). Paraffin should be similarly removed from paraffin-embedded tissues by extraction with
xylene followed by washing with ethanol.
Yeast cell cultures
Yeast cell cultures must first be treated with lyticase or zymolase to digest the cell wall. The resulting spheroplasts are
collected by centrifugation and then lysed using lysis buffer and proteinase K or protease.
Bacterial DNA
Many bacterial cell cultures can be efficiently lysed using lysis buffer and protease or proteinase K. Some bacteria,
particularly Gram-positive bacteria, require pre-incubation with specific enzymes (e.g., lysozyme or lysostaphin) to lyse the
rigid, multilayered cell wall.
Bacterial DNA can also be isolated from a wide variety of clinical samples. Bacterial cells should be pelleted from
biological fluids, and the DNA isolated as for bacterial cell cultures. Swab samples should be pretreated with fungicide
before centrifugation of bacterial cells.
DNA viruses
In clinical applications, viral DNA is often (although not always) isolated from cell-free body fluids, where their titer can be
very low. Virus particles may need to be concentrated before DNA isolation by ultracentrifugation, ultrafiltration, or
precipitation. Addition of carrier DNA may also be necessary during DNA isolation when the expected yield of DNA is low.
Integrated viral DNA is prepared using the same procedure as for isolation of genomic DNA from the relevant sample.
Bacteriophage, such as M13 and lambda, are isolated from infected bacterial cultures. The bacterial cells must be
removed from the culture by centrifugation prior to isolation of viral DNA.
Plants
Isolation of DNA from plant material presents special challenges, and commonly used techniques often require
adaptation before they can be used with plant samples. Several plant metabolites have chemical properties similar to
those of nucleic acids, and are difficult to remove from DNA preparations. Co-purified metabolites and contaminants
introduced by the purification procedure, such as salts or phenol, can inhibit enzymatic reactions or cause variations in UV
spectrophotometric measurements and gel migration.
DNA isolation is often improved by using plants grown under conditions that do not induce high levels of plant metabolites.
Because of the great variation among plants, it is difficult to make general statements about growth conditions to use.
However, as a general guideline, it is recommended to use healthy, young tissues when possible. DNA yields from young
tissues are often higher than from old tissue because young tissue generally contains more cells than the same amount
of older tissue. Young tissue of the same weight also contains fewer metabolites. In addition, many protocols for “home-
made” DNA isolation methods recommend growing plants in darkness for 1–2 days before harvesting to prevent high-
level accumulation of plant metabolites.
Working with DNA: Good microbiological practice
Growth of E. coli strains
Good microbiological technique will always ensure the best yield and quality of plasmid DNA. To prepare the perfect
bacterial culture for your plasmid prep, follow the steps below.
1. Prepare a starter culture by inoculating a single colony from a freshly streaked selective plate into 2–10 ml LB (Luria-
Bertani) medium containing the appropriate antibiotic. Grow at 37°C for ~8 hours (logarithmic growth phase, see
figure Growth of E. coli cultures) with vigorous shaking (~300 rpm).
Tip: Do not inoculate directly from glycerol stocks, agar stabs, or plates that have been stored for a long time, as this
may lead to loss or mutation of the plasmid.
Tip: It is often convenient to grow the starter culture during the day so that the larger culture can be grown overnight for
harvesting the following morning.
2. Dilute the starter culture 1/500 to 1/1000 into a larger volume of selective LB medium, as indicated in the appropriate
plasmid purification protocol.
Use a flask of at least 4 times the volume of culture to ensure sufficient aeration.
Do not use a larger culture volume than recommended in the protocol, as this will result in inefficient lysis and reduce
the quality of the preparation.
3. Grow the culture at 37°C with vigorous shaking (~300 rpm) for 12–16 hours (see next section).
4. Harvest the bacterial culture 12–16 hours after inoculation. This corresponds to the transition from logarithmic into
stationary growth phase (see figure Growth curve of E. coli in LB medium), when cell density is high (3–4 x 10⁹ cells
per ml) and RNA content of cells is low. Harvesting too early may result in lower than expected yields of plasmid DNA
due to a lower cell density. Harvesting too late may result in low plasmid quality and yield due to DNA degradation
from over-aging of the culture.
Tip: Growth of cultures is dependent on factors such as host strain, plasmid insert and copy number, and culture
medium. To determine the optimal harvesting time for a particular system, monitor the cell density and the growth of
the culture by measuring the OD600 (see next section).
5. Harvest the bacterial culture by centrifugation at 6000 x g for 15 min at 4°C. Remove all traces of supernatant by
inverting the open centrifuge tube until all of the medium has been drained. The cells are now ready for the lysis
procedure, as indicated in the appropriate plasmid purification protocol.
The procedure may be stopped at this point and continued later by freezing the cell pellets obtained by centrifugation.
The frozen cell pellets may be stored at –20°C for several weeks.
The E. coli growth curve
The growth curve of an E. coli culture can be divided into several distinct phases. The first, lag phase, occurs directly after
dilution of the starter culture into fresh medium. During this phase, cell division is slow as the bacteria adapt to the fresh
medium. The bacteria then start to divide more rapidly and the culture enters logarithmic (log) phase (4–5 hours after

2/3/2014 DNA Protocols & Applications
http://www.qiagen.com/knowledge-and-support/spotlight/protocols-and-applications-guide/dna/ 7/20
Back to top
Back to top
medium. The bacteria then start to divide more rapidly and the culture enters logarithmic (log) phase (4–5 hours after
dilution), during which the number of cells increases exponentially. As the available nutrients in the medium are used up
and released metabolites inhibit bacterial growth, the culture becomes saturated and enters stationary phase (~16 hours
after dilution), during which cell density remains constant. Eventually the culture enters the phase of decline as cells start
to lyse, the number of viable bacteria falls, and DNA becomes partly degraded.
Storage of E. coli strains
There are different methods for storing E. coli strains depending on the desired storage time. Glycerol stocks and stab
cultures enable long-term storage of bacteria, while agar plates can be used for short-term storage. Preparation
instructions and useful tips for each of these methods are given below.
Glycerol stocks
E. coli strains can be stored for many years at –70°C in 15% glycerol.
Prepare glycerol stocks of bacteria as follows:
1. Add 0.15 ml glycerol (100%) to a 2 ml screw-cap vial and sterilize by autoclaving.
Tip: Vials of sterilized glycerol can be prepared in batches and stored at room temperature until required.
2. Add 0.85 ml of a logarithmic-phase E. coli culture to the vial of pre-sterilized glycerol.
3. Vortex the vial vigorously to ensure even mixing of the bacterial culture and the glycerol.
4. Freeze in ethanol–dry ice or liquid nitrogen and store at –70°C.
Tip: Avoid repeated thawing and re-freezing of glycerol stocks as this can reduce the viability of the bacteria.
Tip: For precious strains, storage of 2 stock vials is recommended.
Tip: When recovering a stored strain, it is advisable to check the antibiotic markers by streaking the strain onto a
selective plate.
Stab cultures
E. coli strains can also be stored for up to 1 year as stabs in soft agar. Stab cultures are used to transport or send
bacterial strains to other labs.
Prepare stab cultures as follows:
1. Prepare and autoclave LB agar (standard LB medium containing 0.7% agar).
2. Cool the LB agar to below 50°C (when you can hold it comfortably) and add the appropriate antibiotic(s). While the
agar is still liquid, add 1 ml agar to a 2 ml screw-cap vial under sterile conditions, then leave to solidify.
3. Vials of agar can be prepared in batches and stored at room temperature until required.
4. Using a sterile straight wire, pick a single colony from a freshly streaked plate and stab it deep down into the soft agar
several times (see figure Inoculating a stab culture).
5. Incubate the vial at 37°C for 8–12 h leaving the cap slightly loose.
6. Seal the vial tightly and store in the dark, preferably at 4°C.
7. When recovering a stored strain, it is advisable to check the antibiotic markers by streaking the strain onto a selective
plate.
Agar plates
Plates of streaked bacteria can be sealed with Parafilm and stored upside-down at 4°C for several weeks. Bacteria should
always be streaked onto plates containing the appropriate antibiotic to ensure that selective markers are not lost.
To obtain well-isolated colonies, streak an agar plate as follows:
1. Flame a wire loop, and cool on a spare sterile agar plate.
2. Using the wire loop, streak an inoculum of bacteria (from a glycerol stock, stab culture, or single colony on another
plate) across one corner of a fresh agar plate, as shown in the figure Streaking bacteria on agar plates.
3. Flame and cool the wire loop again. Pass it through the first streak and then streak again across a fresh corner of the
plate.
4. Repeat again to form a pattern.
5. Incubate the plate upside down at 37°C for 12–24 hours until colonies develop.
Generating liquid cultures from bacterial stocks
The figure, Essential steps for storage and handling of E. coli shows the sequence of steps necessary to go from a
stored stock of bacteria to a liquid culture for plasmid isolation. Bacterial stocks should always be streaked onto selective
plates prior to use, to check that they give rise to healthy colonies carrying the appropriate antibiotic resistance. Stocks can
potentially contain mutants arising from the cultures used to prepare them, or can deteriorate during storage.
Inoculate liquid cultures from a healthy, well-isolated colony, picked from a freshly streaked selective plate. This will
ensure that cells growing in the culture are all descended from a single founder cell, and have the same genetic makeup.
Tip: Culture volumes >10 ml should not be inoculated directly from a plate, but diluted 1/500 to 1/1000 from a pre-culture of
2–5 ml.
Plasmid specifications
Plasmids vary widely in their copy number (see table Origin of replication and copy numbers of various plasmids and
cosmids), depending on the origin of replication they contain (pMB1 or pSC101 for example) which determines whether
they are under relaxed or stringent control; as well as the size of the plasmid and its associated insert. Some plasmids,
such as the pUC series and derivatives, have mutations which allow them to reach very high copy numbers within the
bacterial cell. Plasmids based on pBR322 and many cosmids are generally maintained at lower copy numbers. Very large
plasmids are often maintained at very low copy numbers per cell.
Origin of replication and copy number of various plasmids and cosmids
DNA construct Origin of replication Copy number Classification
Plasmids
pUC vectors pMB1* 500–700 High copy

2/3/2014 DNA Protocols & Applications
http://www.qiagen.com/knowledge-and-support/spotlight/protocols-and-applications-guide/dna/ 8/20
Back to top
pUC vectors pMB1* 500–700 High copy
pBluescript vectors ColE1 300–500 High copy
pGEM vectors pMB1* 300–400 High copy
pTZ vectors pMB1* >1000 High copy
pBR322 and derivatives pMB1* 15–20 Low copy
pQE vectors ColE1 ~30 Low copy
pREP4 P15A ~30 Low copy
pACYC and derivatives P15A 10–12 Low copy
pSC101 and derivatives pSC101 ~5 Very low copy
Cosmids
SuperCos pMB1* 10–20 Low copy
pWE15 ColE1 10–20 Low copy
* The pMB1 origin of replication is closely related to that of ColE1 and falls in the same incompatibility group. The high-copy plasmids listed
here contain mutated versions of this origin.
Bacterial cultivation media and antibiotics
Liquid media
Liquid cultures of E. coli can generally be grown in LB (Luria-Bertani) medium. Please note, however, that a number of
different LB broths, with different compositions, are commonly used. Different formulations contain different concentrations
of NaCl and give rise to varied yields of plasmid DNA. We recommend using the LB composition in the table LB media to
obtain highest yields of plasmid DNA.
LB media
Component Amount per liter
Tryptone 10 g
Yeast extract 5 g
NaCl 10 g
For preparation of 1 liter of LB medium, add 10 g NaCl, 10 g tryptone, and 5 g yeast extract to 950 ml distilled or deionized
water, and shake or stir until dissolved. Adjust the pH to 7.0 with 5 M NaOH. Adjust the volume of the solution to 1 liter with
distilled or deionized water. Decant into smaller aliquots and sterilize by autoclaving (see Sterilizing media).
Tip: It is advisable to autoclave liquid medium in several small bottles rather than in one large vessel to avoid possible
contamination of an entire batch. After autoclaving, do not use medium for 24 hours to ensure that it is properly sterilized
and free of contaminating microorganisms.
Tip: Antibiotics should be added to liquid medium immediately prior to use from stock antibiotic solutions that have been
filter-sterilized, distributed into aliquots, and stored in the dark at –20°C (see Antibiotics).
Sterilizing media
Sterilize liquid or solid media by autoclaving, using a pressure and time period suitable for the type of medium, bottle size,
and autoclave type.
Tip: Fill bottles only 3/4 full with medium and loosen the caps before autoclaving to avoid hot medium boiling over. Tighten
caps once the media is cool (<40°C) to keep it completely sterile.
Tip: Antibiotics and nutrients such as amino acids are inactivated by the high temperatures of an autoclave. They should
be sterilized by filtration through a filter unit with a pore size of 0.2 µm, and added to the cooled, autoclaved medium from
properly stored stock solutions.
Solid media
E. coli strains can generally be streaked and stored on LB plates containing 1.5% agar and the appropriate antibiotic(s).
Preparation: Prepare LB medium according to the composition given in Liquid media. Just before autoclaving, add 15 g
agar per liter and mix. After autoclaving, swirl the medium gently to distribute the melted agar evenly throughout the
solution. Take care that the hot liquid does not boil over when swirled.
Tip: Cool autoclaved agar medium to below 50°C (when you can hold it comfortably) before adding heat-sensitive
antibiotics and nutrients. Mix thoroughly to obtain an even concentration throughout the medium before pouring.
Tip: Pour plates in a laminar-flow hood or, if no hood is available, on a cleaned bench surface next to a Bunsen. Use 30–
35 ml medium per standard 90 mm petri dish (~30 plates per liter of medium).
After pouring plates, any air bubbles may be removed by passing the flame of a Bunsen burner briefly over the surface. Do
not linger with the flame as this may destroy antibiotics in sections of the plates.
Dry plates either directly after solidification or just before use by removing the lids and standing the plates in a laminar-flow
hood for 1 hour. Alternatively, if you do not have access to a hood, plates can be dried with the covers slightly open in a
37°C incubator for 30 min, or left upside down with lids on at room temperature for 2–3 days.
Tip: Store plates inverted at 4°C in a dark room or wrapped in aluminum foil to preserve light-sensitive antibiotics. Do not
store for longer than 3 months as antibiotics may degrade.
Antibiotics
Bacterial strains carrying plasmids or genes with antibiotic selection markers should always be cultured in liquid or on
solid medium containing the selective agent. Lack of antibiotic selection can lead to loss of the plasmid carrying the
genetic marker and potentially to selection of faster-growing mutants!
Tip: Prepare stock solutions of antibiotics separately from batches of liquid or solid media, sterilize by filtration, aliquot,
and store in the dark at –20°C. Recommended stock and working concentrations for commonly used antibiotics are
shown in the table Concentrations of commonly used antibiotics.
Tip: Before adding antibiotics to freshly autoclaved medium, ensure that the medium has cooled to below 50°C.
2/3/2014 DNA Protocols & Applications
http://www.qiagen.com/knowledge-and-support/spotlight/protocols-and-applications-guide/dna/ 9/20
Back to top
Back to top
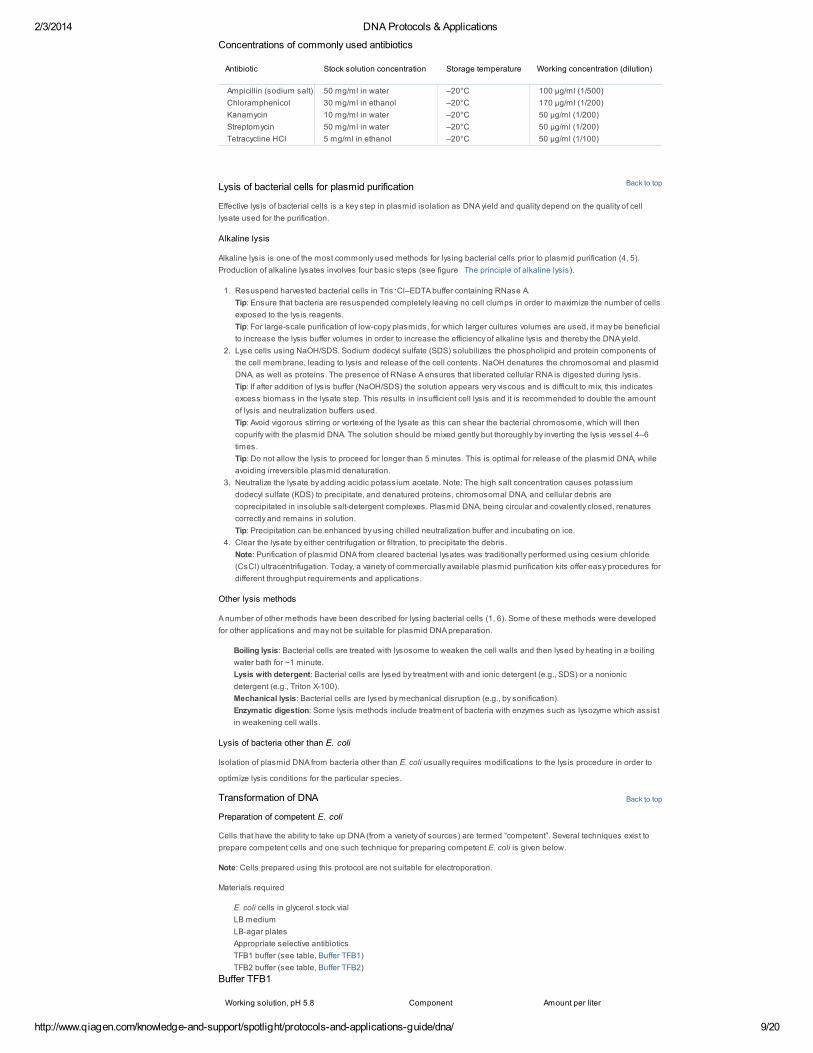
Concentrations of commonly used antibiotics
Antibiotic Stock solution concentration Storage temperature Working concentration (dilution)
Ampicillin (sodium salt) 50 mg/ml in water –20°C 100 µg/ml (1/500)
Chloramphenicol 30 mg/ml in ethanol –20°C 170 µg/ml (1/200)
Kanamycin 10 mg/ml in water –20°C 50 µg/ml (1/200)
Streptomycin 50 mg/ml in water –20°C 50 µg/ml (1/200)
Tetracycline HCl 5 mg/ml in ethanol –20°C 50 µg/ml (1/100)
Lysis of bacterial cells for plasmid purification
Effective lysis of bacterial cells is a key step in plasmid isolation as DNA yield and quality depend on the quality of cell
lysate used for the purification.
Alkaline lysis
Alkaline lysis is one of the most commonly used methods for lysing bacterial cells prior to plasmid purification (4, 5).
Production of alkaline lysates involves four basic steps (see figure The principle of alkaline lysis).
1. Resuspend harvested bacterial cells in Tris·Cl–EDTA buffer containing RNase A.
Tip: Ensure that bacteria are resuspended completely leaving no cell clumps in order to maximize the number of cells
exposed to the lysis reagents.
Tip: For large-scale purification of low-copy plasmids, for which larger cultures volumes are used, it may be beneficial
to increase the lysis buffer volumes in order to increase the efficiency of alkaline lysis and thereby the DNA yield.
2. Lyse cells using NaOH/SDS. Sodium dodecyl sulfate (SDS) solubilizes the phospholipid and protein components of
the cell membrane, leading to lysis and release of the cell contents. NaOH denatures the chromosomal and plasmid
DNA, as well as proteins. The presence of RNase A ensures that liberated cellular RNA is digested during lysis.
Tip: If after addition of lysis buffer (NaOH/SDS) the solution appears very viscous and is difficult to mix, this indicates
excess biomass in the lysate step. This results in insufficient cell lysis and it is recommended to double the amount
of lysis and neutralization buffers used.
Tip: Avoid vigorous stirring or vortexing of the lysate as this can shear the bacterial chromosome, which will then
copurify with the plasmid DNA. The solution should be mixed gently but thoroughly by inverting the lysis vessel 4–6
times.
Tip: Do not allow the lysis to proceed for longer than 5 minutes. This is optimal for release of the plasmid DNA, while
avoiding irreversible plasmid denaturation.
3. Neutralize the lysate by adding acidic potassium acetate. Note: The high salt concentration causes potassium
dodecyl sulfate (KDS) to precipitate, and denatured proteins, chromosomal DNA, and cellular debris are
coprecipitated in insoluble salt-detergent complexes. Plasmid DNA, being circular and covalently closed, renatures
correctly and remains in solution.
Tip: Precipitation can be enhanced by using chilled neutralization buffer and incubating on ice.
4. Clear the lysate by either centrifugation or filtration, to precipitate the debris.
Note: Purification of plasmid DNA from cleared bacterial lysates was traditionally performed using cesium chloride
(CsCl) ultracentrifugation. Today, a variety of commercially available plasmid purification kits offer easy procedures for
different throughput requirements and applications.
Other lysis methods
A number of other methods have been described for lysing bacterial cells (1, 6). Some of these methods were developed
for other applications and may not be suitable for plasmid DNA preparation.
Boiling lysis: Bacterial cells are treated with lysosome to weaken the cell walls and then lysed by heating in a boiling
water bath for ~1 minute.
Lysis with detergent: Bacterial cells are lysed by treatment with and ionic detergent (e.g., SDS) or a nonionic
detergent (e.g., Triton X-100).
Mechanical lysis: Bacterial cells are lysed by mechanical disruption (e.g., by sonification).
Enzymatic digestion: Some lysis methods include treatment of bacteria with enzymes such as lysozyme which assist
in weakening cell walls.
Lysis of bacteria other than E. coli
Isolation of plasmid DNA from bacteria other than E. coli usually requires modifications to the lysis procedure in order to
optimize lysis conditions for the particular species.
Transformation of DNA
Preparation of competent E. coli
Cells that have the ability to take up DNA (from a variety of sources) are termed “competent”. Several techniques exist to
prepare competent cells and one such technique for preparing competent E. coli is given below.
Note: Cells prepared using this protocol are not suitable for electroporation.
Materials required
E. coli cells in glycerol stock vial
LB medium
LB-agar plates
Appropriate selective antibiotics
TFB1 buffer (see table, Buffer TFB1)
TFB2 buffer (see table, Buffer TFB2)
Buffer TFB1
Working solution, pH 5.8 Component Amount per liter

2/3/2014 DNA Protocols & Applications
http://www.qiagen.com/knowledge-and-support/spotlight/protocols-and-applications-guide/dna/ 10/20
Back to top
100 mM RbCl RbCl 12.1 g
50 mM MnCl2 MnCl2·4H2O 9.9 g
30 mM potassium acetate Potassium acetate 2.9 g
10 mM CaCl2 CaCl2 1.1 g
15% glycerol Glycerol 15 ml
Adjust pH to 5.5 and sterilize by f iltration.
Buffer TFB2
Working solution, pH 6.8 Component Amount per liter
100 mM MOPS MOPS 2.1 g
50 mM RbCl RbCl 1.2 g
75 mM CaCl2 CaCl2 8.3 g
15% glycerol Glycerol 15 ml
Adjust pH to 6.5 w ith KOH and sterilize by f iltration.
1. Remove a trace of E. coli cells from the glycerol stock vial with a sterile toothpick or inoculating loop, and streak it out
on LB-agar plates containing an appropriate concentration of the relevant selective antibiotic(s) (see Antibiotics). If the
host strain has already been cultured and stored at 2–8°C (cultures can be stored at 2–8°C for up to 3 months without
any significant loss of viability), streak out bacteria from those stocks.
2. Incubate at 37°C overnight.
3. Pick a single colony and inoculate 10 ml LB medium containing relevant antibiotic(s). Grow overnight at 37°C.
4. Add 1 ml overnight culture to 100 ml prewarmed LB medium containing the relevant antibiotic(s) in a 500 ml flask, and
shake at 37°C until an OD600 of 0.5 is reached (approximately 90–120 min).
5. Cool the culture on ice for 5 min, and transfer the culture to a sterile, round-bottom centrifuge tube.
6. Collect the cells by centrifugation at low speed (5 min, 4000 x g, 4°C).
7. Discard the supernatant carefully. Always keep the cells on ice.
8. Resuspend the cells gently in cold (4°C) TFB1 buffer (30 ml for a 100 ml culture) and keep the suspension on ice for
an additional 90 min.
9. Collect the cells by centrifugation (5 min, 4000 x g, 4°C).
10. Discard the supernatant carefully. Always keep the cells on ice.
11. Resuspend the cells carefully in 4 ml ice-cold TFB2 buffer.
12. Prepare aliquots of 100–200 µl in sterile microcentrifuge tubes and freeze in liquid nitrogen or a dry-ice–ethanol mix.
Store the competent cells at –70°C.
Transformation of competent E. coli
Transformation is the process in which plasmid DNA is introduced into a bacterial host cell. Several methods exist for
transformation of bacterial cells, one of which is given below.
Competent E. coli cells (see Preparation of competent E. coli)
SOC medium (see table SOC medium)
LB-agar plates (see Solid media)
SOC medium
Component Amount per liter
Tryptone 20 g
Yeast extract 5 g
NaCl 0.5 g
Dissolve, then add:
250 mM KCl 10 ml
2 M MgCl2 5 ml
Autoclave, cool, then add:
1 M sterile glucose 20 ml
Do not sterilize by autoclaving; f ilter the solution through a 0.2 µm filter instead.
1. Transfer an aliquot of the DNA to be transformed (10 µl or less) into a cold sterile 1.5 ml microcentrifuge tube, and
keep it on ice.
2. Thaw an aliquot of frozen competent E. coli cells on ice.
3. Gently resuspend the cells and transfer 100 µl of the cell suspension into the microcentrifuge tube with the plasmid
DNA, mix carefully, and keep on ice for 20 min.
4. Transfer the tube to a 42°C water bath or heating block for 90 s.
5. Add 500 µl SOC medium to the cells and incubate for 60–90 min at 37°C.
Tip: Shaking increases transformation efficiency.
6. Plate out 50, 100, and 200 µl aliquots on LB-agar plates containing the relevant antibiotic(s). Incubate the plates at
37°C overnight until colonies develop.
Positive control to check transformation efficiency
Transform competent cells with 1 ng of a control plasmid containing an antibiotic resistance gene. Plate onto LB-agar
plates containing the relevant antibiotic(s). Compare the number of colonies obtained with the control plasmid to the
number obtained with the plasmid of interest to compare transformation efficiency.
Negative control to check antibiotic activity
Transform cells with 20 µl of TE. Plate at least 200 µl of the transformation mix on a single LB-agar plate containing the
relevant antibiotic(s). An absence of colonies on the plates indicates that the antibiotic is active.
Isopropanol precipitation of DNA
2/3/2014 DNA Protocols & Applications
http://www.qiagen.com/knowledge-and-support/spotlight/protocols-and-applications-guide/dna/ 11/20
Back to top
Back to top
Back to top
Isopropanol precipitation of DNA
Alcohol precipitation is commonly used for concentrating, desalting, and recovering nucleic acids.
Precipitation is mediated by high concentrations of salt and the addition of either isopropanol or ethanol. Since less
alcohol is required for isopropanol precipitation, this is the preferred method for precipitating DNA from large volumes. In
addition, isopropanol precipitation can be performed at room temperature, which minimizes co precipitation of salt that
interferes with downstream applications.
1. Adjust the salt concentration if necessary, for example, with sodium acetate (0.3 M, pH 5.2, final concentration) or
ammonium acetate (2.0–2.5 M, final concentration).
2. Add 0.6–0.7 volumes of room-temperature isopropanol to the DNA solution and mix well.
Tip: Use all solutions at room temperature to minimize co-precipitation of salt.
Tip: Do not use polycarbonate tubes for precipitation as polycarbonate is not resistant to isopropanol.
3. Centrifuge the sample immediately at 10,000–15,000 x g for 15–30 min at 4°C.
Tip: Centrifugation should be carried out at 4°C to prevent overheating of the sample. (When precipitating from small
volumes, centrifugation may be carried out at room temperature.)
Tip: Genomic DNA can alternatively be precipitated by spooling the DNA using a glass rod following addition of
isopropanol. The spooled DNA should be transferred immediately to a microfuge tube containing an appropriate
buffer and redissolved (see step 9).
4. Carefully decant the supernatant without disturbing the pellet.
Tip: Marking the outside of the tube before centrifugation allows the pellet to be more easily located. Pellets from
isopropanol precipitation have a glassy appearance and may be more difficult to see than the fluffy salt-containing
pellets resulting from ethanol precipitation.
Tip: Care should be taken when removing the supernatant as pellets from isopropanol precipitation are more loosely
attached to the side of the tube.
Tip: Carefully tip the tube with the pellet on the upper side to avoid dislodging the pellet.
Tip: For valuable samples, the supernatant can be retained until recovery of the precipitated DNA has been verified.
5. Wash the DNA pellet by adding 1–10 ml (depending on the size of the preparation) of room-temperature 70% ethanol.
This removes co-precipitated salt and replaces the isopropanol with the more volatile ethanol, making the DNA easier
to redissolve.
6. Centrifuge at 10,000–15,000 x g for 5–15 min at 4°C.
Tip: Centrifuge the tube in the same orientation as previously to recover the DNA into a compact pellet.
7. Carefully decant the supernatant without disturbing the pellet.
8. Air-dry the pellet for 5–20 min (depending on the size of the pellet).
Tip: Do not overdry the pellet (e.g., by using a vacuum evaporator) as this will make DNA, especially high-molecular-
weight DNA, difficult to redissolve.
9. Redissolve the DNA in a suitable buffer.
Tip: Choose an appropriate volume of buffer according to the expected DNA yield and the desired final DNA
concentration.
Tip: Use a buffer with a pH of 7.5–8.0, as DNA does not dissolve easily in acidic buffers. (If using water, check pH.)
Tip: Redissolve by rinsing the walls to recover all the DNA, especially if glass tubes have been used. To avoid
shearing the DNA, do not pipet or vortex.
Tip: High-molecular-weight DNA, such as genomic DNA, should be redissolved very gently to avoid shearing, e.g., at
room temperature overnight or at 55°C for 1–2 h with gentle agitation.
Storage of DNA
Purified DNA should be stored at –20°C or –70°C under slightly basic conditions (e.g., Tris×Cl, pH 8.0 or TE buffer; see
tables 1 mM Tris×Cl and TE buffer) because acidic conditions can cause hydrolysis of DNA. Avoid repeated freeze-thawing
as this will lead to precipitates.
Diluted solutions of nucleic acids (e.g., dilution series used as standards) should be stored in aliquots (in siliconized
tubes, where possible) and thawed once only. This avoids adsorption of nucleic acids to the tube walls, which would
reduce the concentration of nucleic acids in solution.
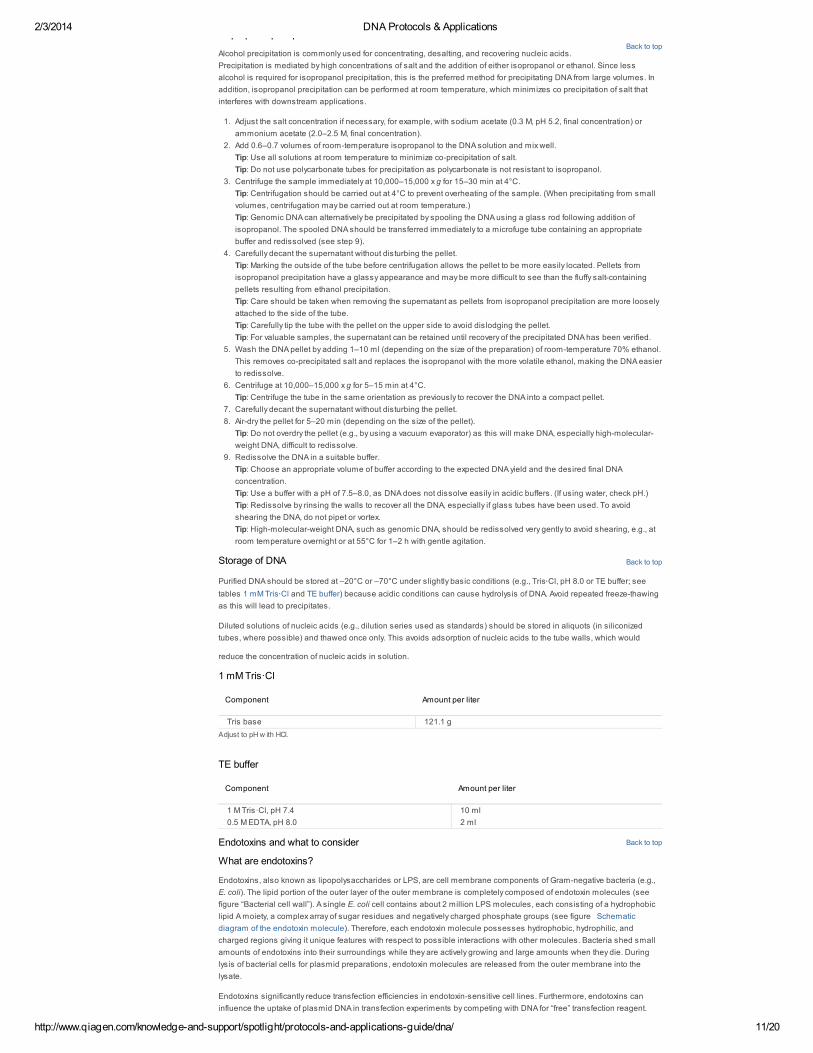
1 mM Tris·Cl
Component Amount per liter
Tris base 121.1 g
Adjust to pH w ith HCl.
TE buffer
Component Amount per liter
1 M Tris·Cl, pH 7.4 10 ml
0.5 M EDTA, pH 8.0 2 ml
Endotoxins and what to consider
What are endotoxins?
Endotoxins, also known as lipopolysaccharides or LPS, are cell membrane components of Gram-negative bacteria (e.g.,
E. coli). The lipid portion of the outer layer of the outer membrane is completely composed of endotoxin molecules (see
figure “Bacterial cell wall”). A single E. coli cell contains about 2 million LPS molecules, each consisting of a hydrophobic
lipid A moiety, a complex array of sugar residues and negatively charged phosphate groups (see figure Schematic
diagram of the endotoxin molecule). Therefore, each endotoxin molecule possesses hydrophobic, hydrophilic, and
charged regions giving it unique features with respect to possible interactions with other molecules. Bacteria shed small
amounts of endotoxins into their surroundings while they are actively growing and large amounts when they die. During
lysis of bacterial cells for plasmid preparations, endotoxin molecules are released from the outer membrane into the
lysate.
Endotoxins significantly reduce transfection efficiencies in endotoxin-sensitive cell lines. Furthermore, endotoxins can
influence the uptake of plasmid DNA in transfection experiments by competing with DNA for “free” transfection reagent.
Overall, endotoxins represent a non-controllable variable in transfection experiment setup. They are invisible on agarose

2/3/2014 DNA Protocols & Applications
http://www.qiagen.com/knowledge-and-support/spotlight/protocols-and-applications-guide/dna/ 12/20
Back to top
Overall, endotoxins represent a non-controllable variable in transfection experiment setup. They are invisible on agarose
gels and impossible to detect by optical density and influence the outcome and reproducibility of results and making them
difficult to compare and interpret.
Endotoxin contamination of different plasmid preparation methods
The chemical structure and properties of endotoxin molecules and their tendency to form micellar structures lead to
copurification of endotoxins with plasmid DNA. For example, in CsCl ultracentrifugation, the CsCl-banded DNA is easily
contaminated with endotoxin molecules, which have a similar density in CsCl to plasmid–ethidium bromide complexes.
On size-exclusion resins, the large size of the micellar form of endotoxin causes the molecule to behave like a large DNA
molecule; and in anion-exchange chromatography, the negative charges present on the endotoxin molecule can interact
with anion-exchange resins, thus leading to copurification of endotoxins with the plasmid DNA.
However, the level of endotoxin contamination found in plasmid DNA is dependent on the purification method used.
How are endotoxins measured?
Historically, endotoxins were measured in a clotting reaction between the endotoxin and a clottable protein in the
amoebocytes of Limulus polyphemus, the horseshoe crab.
Today much more sensitive photometric tests (e.g., Kinetic-QCL Test from BioWhittaker, Inc.) are used, which are based
on a Limulus amoebocyte lysate (LAL) and a synthetic color-producing substrate. LPS contamination is usually expressed
in endotoxin units (EU). Typically, 1 ng LPS corresponds to 1–10 EU.
Influence of endotoxins on biological applications
Endotoxins strongly influence transfection of DNA into primary cells and sensitive cultured cells, and increased endotoxin
levels lead to sharply reduced transfection efficiencies. Furthermore, it is extremely important to use endotoxin-free
plasmid DNA for gene therapy applications, since endotoxins cause fever, endotoxic shock syndrome, and activation of the
complement cascade in animals and humans.
Endotoxins also interfere with in vitro transfection into immune cells such as macrophages and B cells by causing
nonspecific activation of immune responses. These responses include the induced synthesis of immune mediators such
as IL-1 and prostaglandin. It is important to make sure that plasticware, media, sera, and plasmid DNA are free of LPS
contamination to avoid misinterpretation of experimental results.
Endotoxin-free plasticware and glassware
To avoid recontamination of plasmid DNA after initial endotoxin removal, we recommend using only new plasticware
which is certified to be pyrogen- or endotoxin-free. Endotoxin-free or pyrogen-free plasticware can be obtained from many
different suppliers.
Endotoxins adhere strongly to glassware and are difficult to remove completely during washing. Standard laboratory
autoclaving procedures have little or no effect on endotoxin levels. Moreover, if the autoclave has previously been used for
bacteria, the glassware will become extensively contaminated with endotoxin molecules. Heating glassware at 180°C
overnight is recommended to destroy any attached endotoxin molecules.
It is also important not to recontaminate the purified endotoxin-free DNA by using reagents that are not endotoxin-free.
Quantification of DNA
Reliable measurement of DNA concentration is important for many applications in molecular biology. Spectrophotometry
and fluorometry are commonly used to measure both genomic and plasmid DNA concentration. Spectrophotometry can
be used to measure microgram quantities of pure DNA samples (i.e., DNA that is not contaminated by proteins, phenol,
agarose, or RNA). Fluorometry is more sensitive, allowing measurement of nanogram quantities of DNA, and furthermore,
the use of Hoechst 33258 dye allows specific analysis of DNA.
Spectrophotometry
DNA concentration can be determined by measuring the absorbance at 260 nm (A260) in a spectrophotometer using a
quartz cuvette. For greatest accuracy, readings should be between 0.1 and 1.0. An absorbance of 1 unit at 260 nm
corresponds to 50 µg genomic DNA per ml (A260 =1 for 50 µg/ml; based on a standard 1 cm path length. This relation is
valid only for measurements made at neutral pH, therefore, samples should be diluted in a low-salt buffer with neutral pH
(e.g., Tris·Cl, pH 7.0). An example of the calculation involved in nucleic acid quantification when using a
spectrophotometer (see Spectrophotometric measurement of DNA concentration).
When working with small amounts of DNA, such as purified PCR products or DNA fragments extracted from agarose gels,
quantification via agarose gel analysis may be more effective (see Agarose gel).
Tip: If you use more than one cuvette to measure multiple samples, the cuvettes must be matched.
Tip: Spectrophotometric measurements do not differentiate between DNA and RNA, so RNA contamination can lead to
overestimation of DNA concentration.
Tip: Phenol has an absorbance maximum of 270–275 nm, which is close to that of DNA. Phenol contamination mimics
both higher yields and higher purity, because of an upward shift in the A260 value.
Effects of solvents on spectrophotometric readings
Absorption of nucleic acids depends on the solvent used to dissolve the nucleic acid (7). A260 values are reproducible
when using low-salt buffer, but not when using water. This is most likely due to differences in the pH of the water caused
by the solvation of CO2 from air. A260/A280 ratios measured in water also give rise to a high variability between readings
(see figure Effect of solvent on A260/A280 ratio) and the ratios obtained are typically <1.8, resulting in reduced sensitivity to
protein contamination (7). In contrast, A260/A280 ratios measured in a low-salt buffer with slightly alkaline pH are generally
reproducible.
Effect of RNA contamination on spectrophotometric readings
2/3/2014 DNA Protocols & Applications
http://www.qiagen.com/knowledge-and-support/spotlight/protocols-and-applications-guide/dna/ 13/20
Back to top
Effect of RNA contamination on spectrophotometric readings
Depending on the DNA isolation method used, RNA will be co-purified with genomic DNA. RNA may inhibit some
downstream applications, but it will not inhibit PCR. Spectrophotometric measurements do not differentiate between DNA
and RNA, so RNA contamination can lead to overestimation of DNA concentration. RNA contamination can sometimes be
detected by agarose gel analysis with routine ethidium bromide staining, although not quantified effectively. RNA bands
appear faint and smeary and are only detected in amounts ≥25–30 ng (0.5:1 RNA:DNA ratio).
Treatment with RNase A will remove contaminating RNA; this can either be incorporated into the purification procedure or
performed after the DNA has been purified. Prior to use, ensure that the RNase A solution has been heat-treated to
destroy any contaminating DNase activity. Alternatively, use DNase-free RNase purchased from a reliable supplier.
RNA contamination of plasmid DNA can be a concern depending on the method used for plasmid preparation. Methods
using alkaline lysis with phenol extraction cannot separate RNA from plasmid DNA, leading to high levels of RNA
contamination. Advanced anion-exchange technology allows isolation of high-molecular-weight genomic DNA that is free
of RNA.
Purity of DNA
The ratio of the readings at 260 nm and 280 nm (A260/A280) provides an estimate of DNA purity with respect to
contaminants that absorb UV light, such as protein. The A260/A280 ratio is influenced considerably by pH. Since water is
not buffered, the pH and the resulting A260/A280 ratio can vary greatly. Lower pH results in a lower A260/A280 ratio and
reduced sensitivity to protein contamination (7). For accurate A260/A280 values, we recommend measuring absorbance in
a slightly alkaline buffer (e.g., 10 mM Tris·Cl, pH 7.5). Be sure to zero the spectrophotometer with the appropriate buffer.
Pure DNA has an A260/A280 ratio of 1.7–1.9. Scanning the absorbance from 220–320 nm will show whether there are
contaminants affecting absorbance at 260 nm. Absorbance scans should show a peak at 260 nm and an overall smooth
shape.
Fluorometry
Fluorometry allows specific and sensitive measurement of DNA concentration by use of a fluorescent dye; with common
dyes including Hoechst dyes and PicoGreen.
Hoechst 33258 has little affinity for RNA, allowing accurate quantification of DNA samples that are contaminated with RNA.
It shows increased emission at 458 nm when bound to DNA. DNA standards and samples are mixed with Hoechst 33258
and measured in glass or acrylic cuvettes using a scanning fluorescence spectrophotometer or a dedicated filter
fluorometer set at an excitation wavelength of 365 nm and an emission wavelength of 460 nm. The sample
measurements are then compared to the standards to determine DNA concentration.
Tip: As Hoechst 33258 preferentially binds AT-rich DNA, use standards with a similar base composition to the sample
DNA.
PicoGreen is a highly sensitive measure of dsDNA and can measure as little as 20 pg dsDNA in a 200 µl assay volume.
Indeed, DNA concentrations from 500 pg/ml to 500 ng/ml can all be measures using a single dye concentration. The
assay is optimized to minimize the fluorescence contributions of RNA and ssDNA, such that dsDNA can be accurately
quantified in the presence of equimolar concentrations of ssDNA and RNA with minimal effect on the quantitative results.
Agarose gel
Agarose gel analysis enables quick and easy quantification of DNA, especially for small DNA fragments (such as PCR
products). As little as 20 ng DNA can be detected by agarose gel electrophoresis with ethidium bromide staining. The DNA
sample is run on an agarose gel alongside known amounts of DNA of the same or a similar size. The amount of sample
DNA loaded can be estimated by comparison of the band intensity with the standards either visually (see figure Agarose
gel analysis of plasmid DNA) or using a scanner or imaging system. Be sure to use standards of roughly the same size
as the fragment of interest to ensure reliable estimation of the DNA quantity, since large fragments interchelate more dye
than small fragments and give a greater band intensity.
More precise agarose gel quantification can be achieved by densitometric measurement of band intensity and
comparison with a standard curve generated using DNA of a known concentration. In most experiments the effective range
for comparative densitometric quantification is between 20 and 100 ng.
Tip: The amount of DNA used for densitometric quantification should fall within the linear range of the standard curve.
See DNA analysis using analytical gels, for further information on agarose gel electrophoresis.
Restriction endonuclease digestion of DNA
Principle of restriction digestion
Many applications require conversion of genomic DNA into conveniently sized fragments by restriction endonuclease
digestion. This yields DNA fragments of a convenient size for downstream manipulations. Restriction endonucleases are
bacterial enzymes that bind and cleave DNA at specific target sequences. Type II restriction enzymes are the most widely
used in molecular biology applications. They bind DNA at a specific recognition site, consisting of a short palindromic
sequence, and cleave within this site, e.g., AGCT (for AluI), GAATTC (for EcoRI), and so on. Isoschizomers are different
enzymes that share the same specificity, and in some cases, the same cleavage pattern.
Tip: Isoschizomers may have slightly different properties that can be very useful. For example, the enzymes MboI and
Sau3A have the same sequence specificities, but MboI does not cleave methylated DNA, while Sau3A does. Sau3A can
therefore be used instead of MboI where necessary.
Selecting suitable restriction endonucleases
The following factors need to be considered when choosing suitable restriction enzymes:
Fragment size
Methylation sensitivity
Blunt-ended/sticky-ended fragments
Compatibility of reaction conditions (where more than one enzyme is used)

2/3/2014 DNA Protocols & Applications
http://www.qiagen.com/knowledge-and-support/spotlight/protocols-and-applications-guide/dna/ 14/20
Compatibility of reaction conditions (where more than one enzyme is used)
Fragment size
Restriction enzymes with shorter recognition sequences cut more frequently than those with longer recognition
sequences. For example, a 4 base pair (bp) cutter will cleave, on average, every 44 (256) bases, while a 6 bp cutter
cleaves every 46 (4096) bases.
Tip: Use 6 bp cutters for mapping genomic DNA or YACs, BACs, or P1s, as these give fragments in a suitable size range
for cloning.
Methylation
Many organisms have enzymes called methylases that methylate DNA at specific sequences. Not all restriction enzymes
can cleave their recognition site when it is methylated. Therefore the choice of restriction enzyme is affected by its
sensitivity to methylation. In addition, methylation patterns differ in different species, also affecting the choice of restriction
enzyme.
The CpG dinucleotide occurs about 5 times less frequently in mammalian DNA than would be expected by chance,
and most restriction enzymes with a CpG dinucleotide in their recognition site do not cleave if the cytosine is
methylated. Therefore many enzymes with CpG in their recognition site, such as EagI, NotI, and SalI, cleave
mammalian DNA only rarely.
Drosophila, Caenorhabditis, and some other species do not possess methylated DNA, and have a higher proportion
of CpG dinucleotides than mammalian species. Rare-cutter enzymes therefore cleave more frequently in these
species.
Plant DNA is highly methylated, so for successful mapping in plants, choose enzymes that either do not contain a CpG
dinucleotide in their recognition site (e.g., DraI or SspI) or that can cleave methylated CpG dinucleotides (e.g., BamHI,
KpnI, or TaqI).
Tip: Methylation patterns differ between bacteria and eukaryotes, so restriction patterns of cloned and uncloned DNA may
differ.
Tip: Methylation patterns also differ between different eukaryotes (see bullets above), affecting the choice of restriction
enzyme for construction genomic DNA libraries.
Blunt-ended/sticky-ended fragments
Some restriction enzymes cut in the middle of their recognition site, creating blunt-ended DNA fragments. However, the
majority of enzymes make cuts staggered on each strand, resulting in a few base pairs of single-stranded DNA at each
end of the fragment, known as “sticky” ends. Some enzymes create 5' overhangs and others create 3' overhangs. The type
of digestion affects the ease of downstream cloning:
Sticky-ended fragments can be easily ligated to other sticky-ended fragments with compatible single-stranded
overhangs, resulting in efficient cloning.
Blunt-ended fragments usually ligate much less efficiently, making cloning more difficult. However, any blunt-ended
fragment can be ligated to any other, so blunt-cutting enzymes are used when compatible sticky-ended fragments
cannot be generated – for example, if the polylinker site of a vector does not contain an enzyme site compatible with
the fragment being cloned.
Compatibility of reaction conditions
If a DNA fragment is to be cut with more than one enzyme, both enzymes can be added to the reaction simultaneously
provided that they are both active in the same buffer and at the same temperature. If the enzymes do not have compatible
reaction conditions, it is necessary to carry out one digestion, purify the reaction products, and then perform the second
digestion.
Restriction digest components
Water
DNA
Buffer
Enzyme
The amount of DNA digested depends on the downstream application and the genome size of the organism being
analyzed. We recommend using a minimum of 10 µg DNA per reaction for Southern blotting of mammalian and plant
genomic DNA. For mapping of cloned DNA, 0.2–1 µg DNA per reaction is adequate.
Tip: DNA should be free from contaminants such as phenol, chloroform, ethanol, detergents, or salt, as these may
interfere with restriction endonuclease activity.
One unit of restriction endonuclease completely digests 1 µg of substrate DNA in 1 hour. However, supercoiled plasmid
DNA generally requires more than 1 unit/µg to be digested completely. Most researchers add a 10-fold excess of enzyme
to their reactions in order to ensure complete cleavage.
Tip: Ensure that the restriction enzyme does not exceed more than 10% of the total reaction volume; otherwise the glycerol
in which the enzyme is supplied may inhibit digestion.
Reaction volume
Most digests are carried out in a volume between 10 and 50 µl. (Reaction volumes smaller than 10 µl are susceptible to
pipetting errors, and are not recommended.)
Setting up a restriction digestion
1. Pipet reaction components into a tube and mix well by pipetting.
Tip: Thorough mixing is extremely important.
Tip: The enzyme should be kept on ice and added last.
Tip: When setting up large numbers of digests, make a reaction master mix consisting of water, buffer, and enzyme,
and aliquot this into tubes containing the DNA to be digested.
2. Centrifuge the tube briefly to collect the liquid at the bottom.
3. Incubate the digest in a water bath or heating block, usually for 1–4 h at 37°C. However, some restriction enzymes

2/3/2014 DNA Protocols & Applications
http://www.qiagen.com/knowledge-and-support/spotlight/protocols-and-applications-guide/dna/ 15/20
Back to top
Back to top
3. Incubate the digest in a water bath or heating block, usually for 1–4 h at 37°C. However, some restriction enzymes
require higher (e.g., 50–65°C) while others require lower (e.g., 25°C) incubation temperatures.
4. For some downstream applications it is necessary to heat-inactivate the enzyme after digestion. Heating the reaction
to 65°C for 20 min after digestion inactivates the majority of enzymes that have optimal incubation temperature of
37°C. Note that some restriction enzymes are not fully inactivated by heat treatment.
Ligation of DNA
In order to construct new DNA molecules, DNA must first be digested using restriction endonucleases (see Restriction
endonuclease digestion of DNA). The individual components of the desired DNA molecule are purified and then combined
and treated with DNA ligase. The products of the ligation mixture are introduced into competent E. coli cells and
transformants are identified by appropriate genetic selection. Appropriate control ligations should also be performed (see
Preparation of competent E. coli and Transformation of competent E. coli).
Removal of 5' phosphates from linearized vector DNA can help prevent vector self-ligation and improve ligation efficiency.
To remove 5' phosphates from DNA, add calf intestinal phosphate (CIP) buffer and 1 U CIP and incubate for 30–60
minutes at 37°C. Once the reaction is complete, inactivate CIP by heating to 75°C for 15 minutes.
1. A typical ligation reaction is set up as per the table Typical ligation reaction.
2. Incubate for 1–24 h at 15°C.
Tip: Simple ligations with two fragments having 4 bp 3' or 5' overhanging ends require much less ligase than more
complex ligations or blunt-end ligations. The quality of the DNA will also affect the amount of ligase needed.
Tip: Ligation of sticky-ends is usually carried out at 12–15°C to maintain a balance between annealing of the ends
and the activity of the enzyme. Higher temperatures make annealing of the ends difficult, while lower temperatures
diminish ligase activity.
Tip: Blunt-end ligations are usually performed at room temperature since annealing is not a factor, though the enzyme
is unstable above 30°C. Blunt-end ligations require about 10–100-times more enzyme than sticky-end ligations in
order to achieve an equal efficiency.
3. Introduce 1–10 µl of the ligated products into competent E. coli cells and select for transformants using the genetic
marker present on the vector (for further information, see Preparation of competent E. coli” and “Transformation of
competent E. coli).
4. From individual E. coli transformants, purify plasmid or phage DNAs by miniprep procedure and determine their
structures by restriction mapping.
Tip: It is recommended to include two controls in every transformation experiment: A “mock” transformation without
DNA and a transformation with a known amount of closed circular plasmid DNA.
Typical ligation reaction
Component Amount
Component DNAs 0.1–5 µg
Ligase buffer Variable
10 mM ATP 1 µl
T4 DNA ligase 20–500 U
Controls are essential if things go wrong. For example, colonies on plates that receive mock-transformed bacteria may
indicate that the medium lacks the correct antibiotic. An absence of colonies on plates receiving bacteria transformed with
plasmids under construction can only be interpreted if a positive control using a standard DNA has been included. See
Bacterial cultivation media and antibiotics for further information on transformation controls.
DNA analysis using analytical gels
Gels allow separation and identification of nucleic acids based on charge migration. Migration of nucleic acid molecules in
an electric field is determined by size and conformation, allowing nucleic fragments of different sizes to be separated.
However, the relationship between the fragment size and rate of migration is non-linear, since larger fragments have
greater frictional drag and are less efficient at migrating through the polymer.
Agarose gel analysis is the most commonly used method for analyzing DNA fragments between 0.1 and 25 kb, while
pulse-field gel electrophoresis enables analysis of DNA fragments up to 10,000 kb. This section provides useful hints for
effective gel analysis of DNA.
Pouring an agarose gel
Agarose concentration
The concentration of agarose used for the gel depends primarily on the size of the DNA fragments to be analyzed. Low
agarose concentrations are used to separate large DNA fragments, while high agarose concentrations allow resolution of
small DNA fragments (see table Concentration of agarose used for separating fragments of different sizes). Most gels are
run using standard agarose, although some special types of agarose are available for particular applications. For
example, low-melt agarose allows in situ enzymatic reactions and can therefore be used for preparative gels. Genomic
DNA can be isolated directly from cells immobilized in low-melt agarose gels (see reference 6 for more information).
Tip: Use ultrapure-quality agarose since impurities such as polysaccharides, salts, and proteins can affect the migration
of DNA. Agarose quality is particularly important when running high-percentage agarose gels.
Concentration of agarose used for separating fragments of different sizes
Agarose concentration (% w/v) DNA fragment range (kb)
0.3* 5–60
0.5 1–30
0.7 0.8–12
1.0 0.5–10
1.2 0.4–7
1.5 0.2–3
2.0* 0.1–2
Adapted from references 1 and 6.

2/3/2014 DNA Protocols & Applications
http://www.qiagen.com/knowledge-and-support/spotlight/protocols-and-applications-guide/dna/ 16/20
Back to top
Adapted from references 1 and 6.
* Most gels are run using standard agarose, although some special types of agarose are available for particular applications, and for very
high or low agarose concentrations. For example, low -melt agarose allow s in situ enzymatic reactions and can be used for preparative
gels.
Electrophoresis buffers
The most commonly used buffers for agarose gel electrophoresis are TBE (Tris·borate–EDTA) and TAE (Tris·acetate–
EDTA) (see tables TAE, TBE, and Gel loading buffer). Although more frequently used, TAE has a lower buffering capacity
than TBE and is more easily exhausted during extended electrophoresis. TBE gives better resolution and sharper bands,
and is particularly recommended for analyzing fragments <1 kb.
The drawback of TBE is that the borate ions in the buffer form complexes with the cis-diol groups of sugar monomers and
polymers, making it difficult to extract DNA fragments from TBE gels using traditional methods.
TAE
1x working solution composition 50x stock solution components per liter Amount per liter
40 mM Tris·acetate Tris base 242 g
1 mM EDTA Glacial acetic acid 57.1 ml
– 0.5 M EDTA, pH 8.0 100 ml
TBE
0.5x working solution composition 5x stock solution components per liter Amount per liter
40 mM Tris·borate Tris base 54 g
1 mM EDTA Boric acid 27.5 ml
– 0.5 M EDTA, pH 8.0 20 ml
Gel loading buffer
6x working solution composition 5x stock solution components per 10 ml Amount per 10 ml
0.25% bromophenol blue Bromophenol blue 25 mg
0.25% xylene cyanol FF Xylene cyanol FF 25 mg
40% (w/v) sucrose* Sucrose 5 ml
* 15% Ficoll (Type 400) or 30% glycerol can be used instead of sucrose.
Pouring the gel
1. Prepare enough 1x electrophoresis buffer both to pour the gel and fill the electrophoresis tank.
2. Add an appropriate amount of agarose (depending on the concentration required) to an appropriate volume of
electrophoresis buffer (depending on the type of electrophoresis apparatus being used) in a flask or bottle.
Tip: The vessel should not be more than half full. Cover the vessel to minimize evaporation.
Tip: Always use the same batch of buffer to prepare the agarose as to run the gel since small differences in ionic
strength can affect migration of DNA.
3. Heat the slurry in a microwave or boiling water bath, swirling the vessel occasionally, until the agarose is dissolved.
Tip: Ensure that the lid of the flask is loose to avoid build-up of pressure. Be careful not to let the agarose solution boil
over as it becomes super-heated.
Tip: If the volume of liquid reduces considerably during heating due to evaporation, make up to the original volume
with distilled water. This will ensure that the agarose concentration is correct and that the gel and the electrophoresis
buffer have the same buffer composition.
4. Cool the agarose to 55–60°C.
5. Pour the agarose solution onto the gel tray to a thickness of 3–5 mm. Insert the comb either before or immediately
after pouring the gel. Leave the gel to set (30–40 min).
Tip: Ensure that there is enough space between the bottom of the comb and the glass plate (0.5–1.0 mm) to allow
proper formation of the wells and avoid sample leakage.
Tip: Make sure that there are no air bubbles in the gel or trapped between the wells.
6. Carefully remove the comb and adhesive tape, if used, from the gel. Fill the tank containing the gel with
electrophoresis buffer.
Tip: Add enough buffer to cover the gel with a depth of approximately 1 mm liquid above the surface of the gel. If too
much buffer is used the electric current will flow through the buffer instead of the gel.
Running an agarose gel
Agarose gel electrophoresis allows analysis of DNA fragments between 0.1 and 25 kb (e.g., genomic DNA digested with a
frequently cutting restriction endonuclease), while pulse-field gel electrophoresis enables analysis of DNA fragments up
to 10,000 kb (e.g., undigested genomic DNA or genomic DNA digested with rare cutting restriction endonucleases). The
amount of genomic DNA loaded onto a gel depends on the application, but in general, loading of too much DNA should be
avoided as this will result in smearing of the DNA bands on the gel.
Gel loading buffer (see table Gel loading buffer) must be added to the samples before loading and serves three main
purposes:
To increase the density of the samples to ensure that they sink into the wells on loading.
To add color to the samples through use of dyes such as bromophenol blue or xylene cyanol, facilitating loading.
To allow tracking of the electrophoresis due to co-migration of the dyes with DNA fragments of a specific size.
Molecular-weight markers should always be included on a gel to enable analysis of DNA fragment sizes in the samples.
See table Commonly used DNA markers in agarose gel electrophoresis for commonly used markers.
Commonly used DNA markers in agarose gel electrophoresis
l HindIII f X174 HaeIII

2/3/2014 DNA Protocols & Applications
http://www.qiagen.com/knowledge-and-support/spotlight/protocols-and-applications-guide/dna/ 17/20
Back to top
l HindIII l HindIII–EcoR1 EcoR1 f X174 HaeIII
21,130 21,226 21,226 1353
9416 5184 7421 1078
6557 4973 5804 872
4361 4268 5643 603
2322 3530 4878 310
2027 2027 3530 281
564 1904 271
125 1584 234
1375 194
947 118
831 72
564
125
Preparation of samples
1. Add 1 volume of gel loading buffer to 6 volumes DNA sample and mix.
Samples should always be mixed with gel loading buffer prior to loading on a gel.
Tip: Do not use sample volumes close to the capacity of the wells, as samples may spill over into adjacent wells
during loading.
Tip: Be sure that all samples have the same buffer composition. High salt concentrations, for example in some
restriction buffers, will retard the migration of the DNA fragments.
Ensure that no ethanol is present in the samples, as this will cause samples to float out of the wells on loading.
Agarose gel electrophoresis
1. Apply samples in gel loading buffer to the wells of the gel.
Prior to sample loading, remove air bubbles from the wells by rinsing them with electrophoresis buffer.
Tip: Make sure that the entire gel is submerged in the electrophoresis buffer.
Tip: To load samples, insert the pipet tip deep into the well and expel the liquid slowly. Take care not to break the
agarose with the pipet tip.
Tip: Once samples are loaded, do not move the gel tray/tank as this may cause samples to float out of the wells.
Tip: Be sure to always include at least one lane of appropriate molecular-weight markers.
2. Connect the electrodes so that the DNA will migrate towards the anode (positive electrode).
Tip: Electrophoresis apparatus should always be covered to protect against electric shocks.
3. Turn on the power supply and run the gel at 1–10 V/cm until the dyes have migrated an appropriate distance. This will
depend on the size of DNA being analyzed, the concentration of agarose in the gel, and the separation required.
Tip: Avoid use of very high voltages which can cause trailing and smearing of DNA bands in the gel, particularly with
high-molecular-weight DNA.
Tip: Monitor the temperature of the buffer periodically during the run. If the buffer becomes overheated, reduce the
voltage.
Tip: Melting of an agarose gel during the electrophoresis is a sign that the buffer may have been incorrectly prepared
or has become exhausted during the run.
Tip: For very long runs, e.g., overnight runs, use a pump to recycle the buffer.
Pulse-field gel electrophoresis
1. Apply samples in gel loading buffer to the wells of the gel.
Tip: Pulse-field gel electrophoresis uses high voltages, so TBE buffer, which has greater buffering capacity than TAE
buffer, should be used.
Tip: Prior to sample loading, remove air bubbles from the wells by rinsing them with electrophoresis buffer.
Tip: Make sure that the entire gel is submerged in the running buffer.
Tip: To load samples, insert the pipet tip deep into the well and expel the liquid slowly. Take care not to break the
agarose with the pipet tip.
Tip: Once samples are loaded, do not move the gel tray/tank as this may cause samples to float out of the wells.
Tip: Be sure to always include at least one lane of appropriate molecular-weight markers.
2. Connect the electrodes so that the DNA will migrate towards the anode (positive electrode).
Tip: Electrophoresis apparatus should always be covered to protect against electric shocks.
3. Turn on the power supply and run the gel at 170 V with a switch interval of 5–40 s until the dyes have migrated an
appropriate distance. This will depend on the size of DNA being analyzed, the concentration of agarose in the gel, and
the separation required.
Tip: Monitor the temperature of the buffer periodically during the run. If the buffer becomes heated, reduce the voltage.
Tip: Melting of an agarose gel during the electrophoresis is a sign that the buffer may have been incorrectly prepared
or has become exhausted during the run.
Tip: For very long runs, e.g., overnight runs, use a pump to recycle the buffer.
Visual analysis of the gel
Staining
To allow visualization of the DNA samples, agarose gels are stained with an appropriate dye. The most commonly used
dye is the intercalating fluorescent dye ethidium bromide, which can be added either before or after the electrophoresis
(see table Comparison of ethidium bromide staining methods). Alternatives include recently introduced commercial dyes
such as SYBR Green.
Tip: Stock solutions of ethidium bromide (generally 10 mg/ml) should be stored at 4°C in a dark bottle or bottle wrapped in
aluminum foil.
Addition of ethidium bromide prior to electrophoresis — add ethidium bromide at a concentration of 0.5 µg/ml to the
melted and subsequently cooled agarose, that is, just before pouring the gel.
Mix the agarose–ethidium bromide solution well to avoid localized staining.
Addition of ethidium bromide after electrophoresis — soak the gel in a 0.5 µg/ml solution of ethidium bromide (in water

2/3/2014 DNA Protocols & Applications
http://www.qiagen.com/knowledge-and-support/spotlight/protocols-and-applications-guide/dna/ 18/20
Back to top
Addition of ethidium bromide after electrophoresis — soak the gel in a 0.5 µg/ml solution of ethidium bromide (in water
or electrophoresis buffer) for 30–40 minutes.
Tip: Rinse the gel with buffer or water before examining it to remove excess ethidium bromide.
Tip: Staining buffer can be saved and re-used.
Note: Ethidium bromide is a powerful mutagen and is very toxic. Wear gloves and take appropriate safety precautions
when handling. Use of nitrile gloves is recommended as latex gloves may not provide full protection. After use, ethidium
bromide solutions should be decontaminated as described in commonly used manuals (1, 6).
Visualization
Ethidium bromide–DNA complexes display increased fluorescence compared to the dye in solution. This means that
illumination of a stained gel under UV light (254–366 nm) allows bands of DNA to be visualized against a background of
unbound dye. The gel image can be recorded by taking a Polaroid photograph or using a gel documentation system.
Tip: UV light can damage the eyes and skin. Always wear suitable eye and face protection when working with a UV light
source.
Tip: UV light damages DNA. If DNA fragments are to be extracted from the gel, use a lower intensity UV source if possible
and minimize exposure of the DNA to the UV light.
Comparison of ethidium bromide staining methods
Addition of ethidium bromide prior to electrophoresis Addition of ethidium bromide after electrophoresis
Faster and more convenient procedure Slower procedure requiring additional step
Allows monitoring of migration during electrophoresis Does not allow monitoring of migration during
electrophoresis
Requires decontamination of gel tanks and comb No decontamination of gel tanks and comb necessary
More ethidium bromide is required Usually less ethidium bromide is required
Electrophoretic mobility of linear DNA fragments is reduced
by ~15% No interference with electrophoretic mobility
Analysis of DNA by Southern blotting
Southern blotting is a widely used technique that allows analysis of specific DNA sequences. DNA is usually first
converted into conveniently sized fragments by restriction digestion. The DNA is next run through an agarose gel (6).
Southern blotting (named after its inventor, E.M. Southern) refers to the transfer of the DNA to a nylon or nitrocellulose
membrane by capillary transfer. The DNA of interest can be identified by hybridization to radioactive or chemiluminescent
probes and visualized by autoradiography or staining.
Many variations on the Southern blotting procedure exist. A standard protocol is described here together with recipes for
buffers and solutions.
Equipment required
Whatman 3MM filter paper
Blotting membrane
Paper towels, a stack of approximately 15–20 cm
Plastic wrap
Two glass or Plexiglas plates
Buffer tray (e.g., glass casserole dish) capable of holding 1–2 liters of buffer
Support (to be placed in the buffer tray)
Flat weight, approximately 1 kg
Oven, at 80°C, or UV transilluminator
Orbital shaker
Preparation of gels for Southern blotting
Fragmentation of large DNA molecules (optional)
DNA fragments longer than 10 kb do not transfer to blotting membranes efficiently. In order to facilitate their transfer, these
fragments are reduced in size, either by acid depurination or by UV irradiation.
Acid depurination — immediately after gel electrophoresis, place the gel in a solution of 0.2 M HCl, so that it is completely
covered. Agitate gently for 10 minutes. During this period the color of the bromophenol blue in the samples will change
from blue to yellow, indicating that the gel has been completely saturated with the acid. Rinse the gel briefly in distilled
water.
Tip: The depurination step should not last too long, since very short fragments attach less firmly to the membrane.
Tip: Depurinated gels may yield “fuzzy” bands on the final autoradiograph, presumably because of increased diffusion of
the DNA during transfer. Depurination is therefore recommended only when fragments larger than 10 kb are to be
transferred.
UV irradiation — expose the gel to UV light at a wavelength of 254 nm from a source operating at 30 W, for 30–60
seconds.
Denaturation
Double-stranded DNA must be denatured in order to create suitable hybridization targets. Completely cover the gel with
denaturation buffer (see table Denaturation buffer) and incubate for 30 minutes with gentle shaking. If acid depurination
was used to denature the DNA, the bromophenol blue will return to its original color during this incubation.
Neutralization
Remove the denaturation buffer and completely cover the gel in neutralization buffer (see table Neutralization buffer).
Incubate for 30 minutes with gentle shaking.

2/3/2014 DNA Protocols & Applications
http://www.qiagen.com/knowledge-and-support/spotlight/protocols-and-applications-guide/dna/ 19/20
Back to top
Denaturation buffer
Composition of working solution Component Amount per liter
1.5 M NaCl NaCl 87.7 g
0.5 M NaOH NaOH 20 g
Neutralization buffer
Composition of working solution Component Amount per liter
1 M Tris·Cl Tris base 121.1 g
1.5 M NaCl NaCl 87.7 g
Buffer should be pH 7.4. Adjust to pH 7.4 w ith HCl.
20x SSC
Composition of working solution Component Amount per liter
3 M NaCl NaCl 175.3 g
0.3 M Sodium citrate Sodium citrate-H2O 88.2 g
Adjust to pH 7.4 w ith NaOH.
Assembling the blotting apparatus
1. Place a support larger than the gel in a tray containing 10x SSC (see table 20x SSC), and cover the support with a
glass or Plexiglas plate (see figure Southern blot setup).
2. Cut two lengths of Whatman 3MM paper wider than the gel, long enough to fit under the gel and reach to the bottom of
the dish on either side. Wet the sheets briefly in 10x SSC, and place them on the glass plate. Remove any air bubbles
between the paper and the support by rolling a pipet several times back and forth over the surface.
3. Cut one sheet of blotting membrane and two sheets of Whatman 3MM paper about 1 mm larger than the gel on each
side.
Tip: Always wear gloves when working with blotting membranes. Handle membranes carefully by the edges or using
clean blunt-ended forceps.
4. Place the prepared gel upside-down on the platform. Remove any air bubbles trapped between the gel and the
platform by rolling a pipet several times back and forth over the gel.
5. Surround the gel with plastic wrap. This ensures that the 10x SSC moves only through the gel and not around it.
6. Place the precut blotting membrane on top of the gel so that it covers the entire surface. Do not move the blotting
membrane once it has been placed on the gel. Remove any air bubbles between the paper and the support as
described in step 4.
7. Briefly wet the two precut sheets of Whatman 3MM paper in 10x SSC, and place them on top of the nylon membrane.
Again, remove any trapped air bubbles as described in step 4.
8. Place a 15–20 cm stack of dry paper towels on top of the filter paper.
Tip: Make sure that the plastic wrap surrounding the gel prevents contact of the paper towels with the 10x SSC and the
wet filter paper under the gel. Ensure that the towels do not droop over since they can cause liquid to flow around the
gel instead of through it.
9. Place a second glass or Plexiglas plate on top of the paper towels. Place the weight on top of the plate.Let the transfer
proceed for 12–18 h.
Tip: Transfer efficiency is improved by removing the wet paper towels and replacing them with dry ones at least once
during the transfer.
Fixing the DNA to the blot
1. After the transfer is complete, remove the weight, paper towels, and the two sheets of filter paper. Turn over the gel
and the blotting membrane together, and lay them, gel-side up, on a sheet of dry filter paper. Mark the positions of the
gel lanes on the membrane using a ballpoint pen or a soft-lead pencil. Peel the gel from the membrane. If desired,
keep the gel to assess the efficiency of DNA transfer, otherwise discard.
Before removing the gel from the blotting membrane, ensure that the gel lanes are marked so that they can be later
identified.
In order to assess the efficiency of DNA transfer, stain the gel with ethidium bromide after blotting to see how much
DNA remains.
2. Fix the DNA to the blot, either by baking (see step 3) or by UV-crosslinking (see step 4).
Tip: UV-crosslinking generally gives better results and enhanced sensitivity compared with baking. However, effective
crosslinking requires optimization of the system.
3. Use either this step or step 4: To fix the DNA to the membrane by baking, first let the blot air-dry on a sheet of filter
paper, then place between two sheets of filter paper, and bake at 80°C for 2 h. Proceed to step 5.
4. Use either this step or step 3: To fix the DNA by UV-crosslinking, first protect the surface of the membrane by covering
the UV source (e.g., a transilluminator) with plastic wrap. Then take the damp blot and expose the side with DNA to
the UV source for a predetermined length of time. Proceed to step 5.
Tip: It is important to optimize the system for UV-crosslinking. To do this, prepare a blot with several control DNA
samples. Cut the blot into separate strips for each lane, and irradiate each blot for different times, varying from 0.5 to 5
min. Hybridize all the blots together and determine which time gives the optimal signal intensity. It is important to use
the same conditions (UV wavelength, distance from UV source) for each experiment. It is also important to calibrate
the system routinely, as the energy emitted from a UV bulb is reduced with use.
Tip: UV light can damage the eyes and skin. Always wear suitable eye and face protection.
5. If the blot will not be used immediately, store it at room temperature covered in plastic wrap.
DNA cleanup
Cleanup of DNA is often a prerequisite for efficient downstream applications such as cloning, sequencing, microarray
analysis, or amplification.
The use of a dedicated kit for this application may be necessary, since kits can vary depending on the type of reaction and
DNA fragment size (e.g., PCR products, gel extraction, enzymatic reactions, nucleotide removal, dye terminator removal)
and the required elution volume.

2/3/2014 DNA Protocols & Applications
http://www.qiagen.com/knowledge-and-support/spotlight/protocols-and-applications-guide/dna/ 20/20
Investor Relations SiteMap Privacy Policy Trademarks & Disclaimers Change Location Change Language
Contact QIAGEN: Contact Technical Service Contact Customer Care More Contacts © QIAGEN 2013. All rights reserved
Back to top
Back to top
and the required elution volume.
Standard PCR cleanup only requires the removal of ~20 b oligos. In next-generation sequencing (NGS) library preparation,
often, much larger primers — almost in the range of a PCR amplicon — must be removed, and PCR cleanup may not be
sufficient. For this specialized “size selection” procedures, dedicated kits or PEG-based precipitation (8) are necessary.
References
1. Ausubel, F.M., et al. (1991) Current Protocols in Molecular Biology. New York: John Wiley and Sons.
2. Animal Genome Size Database — www.genomesize.com.
3. Systma, K.K., Givnish, T.J., Smith, J.F., and Hahn, W.J. (1993) Collection and storage of land plant samples for
macromolecular comparisons. Methods Enzymol. 234, 23.
4. Birnboim, H.C., and Doly, J. (1979) A rapid alkaline lysis procedure for screening recombinant plasmid DNA. Nucl.
Acids. Res. 7, 1513.
5. Birnboim, H.C. (1983) A rapid alkaline extraction method for the isolation of plasmid DNA. Methods Enzymol. 100, 243.
6. Sambrook, J., Fritsch, E.F., and Maniatis, T. (2012) Molecular Cloning: A Laboratory Manual. 4th ed. Cold Spring
Harbor, NY: Cold Spring Harbor Laboratory.
7. Wilfinger, W.W., Mackey, M., and Chomczynski, P. (1997) Effect of pH and ionic strength on the spectrophotometric
assessment of nucleic acid purity. BioTechniques 22, 474.
8. Lis, T., and Schleif, R. (1975) Size fractionation of double-stranded DNA by precipitation with polyethylene glycol.
Nucleic Acids Res. 2, 383.
Resources Back to top
RNA 1
PCR 1
Whole Genome Amplification 1
Next Generation Sequencing 1
Epigenetics 1
Transfection 1
Protein 1
Animal Cell Culture 1
RNA Protocols and Applications Guide
This section describes considerations for isolation and
quantification of RNA from different sample sources and RNA
storage. It also deals with RNAi and the use of siRNA,
together with miRNA, mimics, and inhibitors.
Item actions