dmd#19604 - pkdiet · dmd#19604 4 silymarin, an ... determine preliminary point estimates and...
TRANSCRIPT

DMD#19604
1
Title Page
Title: The Pharmacokinetics of Silymarin is Altered in Patients with Hepatitis C Virus and
Nonalcoholic Fatty Liver Disease and Correlates with Plasma Caspase-3/7 Activity
Authors: Sarah J. Schrieber, Zhiming Wen, Manoli Vourvahis, Philip C. Smith, Michael W.
Fried, Angela D. M. Kashuba, and Roy L. Hawke.
Division of Pharmacotherapy & Experimental Therapeutics, UNC Eshelman School of
Pharmacy (SJS, ZW, MV, PCS, ADMK, RLH); and Division of Gastroenterology and
Hepatology, School of Medicine (MWF), University of North Carolina, Chapel Hill, NC, USA.
DMD Fast Forward. Published on June 19, 2008 as doi:10.1124/dmd.107.019604
Copyright 2008 by the American Society for Pharmacology and Experimental Therapeutics.

DMD#19604
2
Running Title Page
Running Title: Pharmacokinetics of Silymarin is Altered in Liver Disease Patients
Corresponding Author: Roy L. Hawke, Pharm.D., Ph.D.
Division of Pharmacotherapy and Experimental Therapeutics
UNC Eshelman School of Pharmacy,
CB #7360, Kerr Hall Rm 3310
Chapel Hill, NC 27599-7360
Fax: 919-962-0644
Email: [email protected]
Document
Text pages …………… 17
Tables ………………… 3
Figures ……………… 4
References …………… 40
Words in Abstract …… 250
Words in Introduction … 720
Words in Discussion …… 1286
ABBREVIATIONS
HCV, hepatitis C virus; SC, silychristin; SD, silydianin; SA, silybin A; SB, silybin B; ISA,
isosilybin A; ISB, isosilybin B; LC-MS, liquid chromatography-mass spectrometry; HPLC, high
performance liquid chromatography; Cmax, maximum plasma concentration; Tmax, peak time at
Cmax; t1/2, terminal elimination half-life; CL/F, apparent clearance; AUC0→24h, area under the
plasma concentration-time curve from time 0 to 24 hours; ALT, alanine aminotransaminase

DMD#19604
3
ABSTRACT Background/Aims: Silymarin, used by 30 - 40% of liver disease patients, is
comprised of 6 major flavonolignans each of which may contribute to silymarin’s
hepatoprotective properties. Previous studies have only described the pharmacokinetics for two
flavonolignans, silybin A and silybin B, in healthy volunteers. The aim of this study was to
determine the pharmacokinetics of the major silymarin flavonolignans in liver disease patients.
Methods: Healthy volunteers and three patient cohorts were administered a single, 600 mg oral
dose of milk thistle extract and fourteen blood samples were obtained over 24 hours. Results:
Silybin A and B accounted for 43% of the exposure to the sum of total silymarin flavonolignans
in healthy volunteers and only 31 - 38% in liver disease cohorts due to accumulation of
silychristin (20 - 36%). AUC0-24h for the sum of total silymarin flavonolignans were 2.4-, 3.3-,
and 4.7-fold higher for hepatitis C virus (HCV) noncirrhosis, nonalcoholic fatty liver disease
(p≤0.03), and HCV cirrhosis cohorts (p≤0.03), respectively, compared to healthy volunteers
(AUC0-24h=2021 ng*h/ml). Caspase-3/7 activity correlated with the AUC0-24h for the sum of all
silymarin conjugates among all subjects (R2=0.52), and was 5-fold higher in HCV cirrhosis
cohort (p≤0.005 vs healthy). No correlation was observed with other measures of disease
activity including plasma ALT, IL-6, and 8-isoprostane F2α, a measure of oxidative stress.
Conclusions: These findings suggest that the pharmacokinetics of silymarin is altered in patients
with liver disease. Patients with cirrhosis had the highest plasma caspase-3/7 activity and also
achieved the highest exposures for the major silymarin flavonolignans.

DMD#19604
4
Silymarin, an extract of milk thistle (Silybum marianum), is an herbal medicine that has
been used for centuries to self-treat liver disease. High public perception of silymarin’s
therapeutic benefits is suggested from the use of this complementary alternative medicine by 30-
40% of patients with liver disease (Russo et al., 2001). Silymarin is comprised of six major
flavonolignans: silybin A; silybin B; isosilybin A; isosilybin B; silychristin; and silydianin.
Antioxidant (Psotova et al., 2002; Kren et al., 2000), anti-inflammatory/immunomodulatory
(Manna et al., 1999; Schumann et al., 2003), and anti-fibrotic (Crocenzi et al., 2006) properties
of silymarin have been demonstrated in various in vitro and animal models. Whether one or
more of these six silymarin flavonolignans are responsible for potentially hepatoprotective
effects in patients with liver disease is unknown.
Oxidative stress, inflammation, and fibrosis are characteristics of chronic liver disease,
and provide the rationale for investigations on the effect of silymarin on disease progression in
the absence of direct antiviral activity. Although silymarin appears to be well tolerated, the
therapeutic benefits of silymarin have not been consistently demonstrated in various liver disease
populations (Saller et al., 2001; Jacobs et al., 2002; Rambaldi et al., 2007; Mayer et al., 2005).
For example, changes in standard surrogate clinical endpoints, such as serum alanine
aminotransaminase (ALT), have not been observed in patients with chronic hepatitis C and early
stage of disease (Buzzelli et al., 1994; Par et al., 2000; Tanamly et al., 2004; Gordon et al.,
2006). Other studies suggest silymarin may have anti-fibrotic activity and may decrease the
complications of liver disease and mortality in patients with cirrhotic disease (Ferenci et al.,
1989; Pares et al., 1998; Lucena et al., 2002). In addition, silymarin has been shown to reduce
insulin resistance and lipid peroxidation in cirrhotic diabetic patients (Velussi et al., 1997) which
are metabolic complications also observed in patients with non-alcoholic steatohepatitis.

DMD#19604
5
However, the use of different silymarin regimens and lack of information on the silymarin
exposures attained in these various patient populations make it difficult to draw conclusions on
the efficacy of silymarin and on which patient population should be targeted for further clinical
investigation.
The pharmacokinetics for only two of the six major silymarin flavonolignans, silybin A
and silybin B, have been extensively studied since they are also contained in two phospholipid
formulations with better bioavailability, silipide and silybin-phytosome. However, neither of
these formulations has been studied in patients with liver disease, while the pharmacokinetics of
silymarin has only been described in healthy volunteers (Weyhenmeyer et al., 1992; Rickling et
al., 1995; Wen et al., 2008). Extensive first-pass phase 2 metabolism presumably accounts for
the low systemic exposures that have been observed with customary doses of silymarin. For
example, plasma AUCs for total flavonolignans (which reflect parent plus conjugated
flavonolignans) have been reported to be 3- to 4-fold and 12- to 36-fold higher for silybin A and
silybin B, respectively, compared to AUCs for parent flavonolignans (Weyhenmeyer et al., 1992;
Rickling et al., 1995; Wen et al., 2008). Silymarin conjugates likely undergo primarily biliary
excretion since only about 5% of the dose is recovered as conjugates in urine (Lorenz et al.,
1984; Weyhenmeyer et al., 1992). Silymarin’s disposition may be altered in liver disease since
some phase 2 conjugation pathways and transporter proteins that could be involved in the active
transport of flavonolignans have been shown to be decreased in patients with liver disease
(Congiu et al., 2002; Guardigli et al., 2005; Hinoshita et al., 2001). Thus, differences in
silymarin’s pharmacokinetics and systemic exposures may account for inconsistencies in clinical
outcomes that have been observed between patients with mild and cirrhotic liver disease.
DMD#19604
6
To determine if silymarin’s disposition is influenced by the severity or type of liver
disease, we conducted a single dose pharmacokinetic study with a standardized milk thistle
extract in three patient cohorts that differed by stage and type of liver disease. A healthy
volunteer cohort was also included for comparison to patient cohorts and for reference to
previous investigations. The pharmacokinetics of six major silymarin flavonolignans and their
conjugates were determined and correlated with ALT and with 8-isoprostane F2α and caspase-3/7
activity, as plasma measures of oxidative stress and apoptosis, respectively. Sulfate and
glucuronide conjugate pools for the major silymarin flavonolignans were also examined to gain
additional insight on how liver disease might influence silymarin’s metabolism and disposition.

DMD#19604
7
Materials and Methods Subjects and Study Design. This single-dose, open-label, non-randomized study enrolled 5
subjects into each of the four cohorts (n=20). The primary objective of this study was to
determine preliminary point estimates and variance information for the pharmacokinetic
parameters AUC, Cmax, tmax, CL/F, and t1/2 in healthy volunteers and in patients diagnosed with
either HCV and minimal liver disease or cirrhosis, or nonalcoholic fatty liver disease (NAFLD)
receiving a single 600 mg dose of milk thistle extract. Assuming an absence of disease effects,
the selected sample size of N = 5 per each cohort was based on historical experience in healthy
subjects and not on statistical considerations. However, an a priori power calculation suggested
that a two-sided t-test would have 90% power to detect a 2.5-fold increase in the AUC for total
silybin A + silybin B at an α=0.05 using previously reported mean and variance data from
healthy volunteers (Weyhenmeyer et al. 1992).
Male and female subjects aged 18 to 65 years with a body weight ≥ 50 kg were eligible
without regard to smoking status. A healthy volunteer cohort was identified by medical history,
screening physical examination, vital signs, and clinical laboratory measurements. Two chronic
HCV patient cohorts consisted of non-responders to interferon-based therapies; one cohort
without cirrhosis (Metavir stage I or II) and the other with cirrhosis (Metavir stage III or IV).
The final patient cohort consisted of NAFLD patients confirmed by a diagnostic biopsy within
six months of study participation or by serologies that confirmed the exclusion of other liver
diseases. Exclusion criteria included: pregnant or lactating females; other active liver diseases;
HIV co-infection; history of pancreatic or biliary disease; acute illness that would interfere with
drug absorption; allergy or hypersensitivity reaction to milk thistle or any of its components; use
of any silymarin-containing product within 30 days prior to enrollment; or use of alcohol within

DMD#19604
8
48 hours of enrollment. Concomitant use of oral contraceptives or inhibitors or inducers of
cytochrome P450 3A4 or 2C9 were also excluded due to theoretical concerns for potential drug
interactions (Beckmann-Knopp et al., 2000).
Subjects were fasted overnight for 8 to 12 hours and then received a single, 480 mg oral
dose of silymarin administered as two 300 mg milk thistle capsules with approximately 240 ml
of water. A low-fat research breakfast, lunch, and dinner was served immediately after each
dose. Meals were served between 8:30-9:00 am, 12:00-1:30 pm, and 5:00-7:00 pm. Fourteen
serial blood samples were collected at time points 0, 0.25, 0.5, 0.75, 1, 1.5, 2, 3, 4, 5, 6, 8, 12,
and 24 hours after silymarin dosing.
The study was conducted at the Verne S. Caviness General Clinical Research Center at
the University of North Carolina at Chapel Hill. The study protocol and subject-informed
consent were approved by The University of North Carolina institutional review board, and the
study was conducted according to the Declaration of Helsinki. All subjects provided written
informed consent before enrollment.
Silymarin Dose. A common, commercially available milk thistle extract used by many patients
seen at the University of North Carolina Hepatitis Clinic (Nutraceutical Sciences Institute®
(NSI), Boynton Beach, FL) was selected for investigation. According to manufacturer’s
labeling, each capsule contained 300 mg milk thistle extract prepared from seed and was
standardized as 80% (240 mg) silymarin. All doses were administered from Lot No. 0418901.
The specific flavonolignan content of this milk thistle extract has been previously determined by
our laboratory (Wen et al., 2008) as follows: 37.7 mg, silybin A; 58.8 mg, silybin B; 14.8 mg,
isosilybin A; 6.3 mg, isosilybin B; 39.2 mg, silychristin; and 15.3 mg, silydianin. Therefore,

DMD#19604
9
these six flavonolignans account for 172 mg, or 57%, of the 300 mg milk thistle extract
contained in each capsule (Wen et al., 2008).
Silymarin Flavonolignan Plasma Concentrations. Whole blood samples were collected in two
3 ml EDTA-lined tubes (K2-EDTA tubes; BD, Franklin Lakes, NJ, USA) and centrifuged at
2400 rpm for 10 minutes at 4oC. The plasma was collected, frozen, and stored at -20oC until
analysis. Plasma concentrations of the six silymarin flavonolignans were quantified using a
recently described LC-MS method (Wen et al., 2008). Briefly, 100 µl aliquots of the plasma
samples were used to determine parent (i.e. nonconjugated) or total (i.e. parent + conjugates)
flavonolignan concentrations after a 6 hour incubation at 37º C, in the absence or presence of a
mixture of sulfatase (80 U/ml) and β-glucuronidase (8000 U/ml) (Sigma-Aldrich, St. Louis,
MO), respectively. Plasma concentrations of flavonolignan conjugate were estimated by taking
the difference in parent flavonolignan plasma concentrations before and after enzymatic
hydrolysis with β-glucuronidase and sulfatase. This subtraction method provides an estimate of
plasma concentrations of silymarin conjugates expressed in terms of “Parent Flavonolignan
Equivalents”. Plasma samples were also incubated with either enzyme separately to study the
effect of liver disease on silymarin’s two pathways of phase 2 metabolism. Concentrations of
sulfate and glucuronide conjugates were determined at the Tmax, 1.5 hours post-dose, for silybin
B and isosilybin A (see Figure 3) since they exhibited the highest Cmax and AUC0-24h for total
flavonolignan concentrations in plasma among the six flavonolignans.
Flavonolignans were separated using an Agilent HP 1050 LC system (Palo Alto, CA) and
a Luna C18 column (50 × 2.0 mm i.d., 3 µm) and a methanol: 1% acetic acid (44:56 v/v, pH 2.8)
mobile phase with isocratic elution at a flow rate of 0.3 ml/min and a run time of 12 minutes.

DMD#19604
10
MS analysis and detection were conducted using an API 100 LC/MS system (PerkinElmer Sciex,
Toronto, Canada) with a TurboIonspray interface in the negative ESI ionization mode. The limit
of detection and linear quantitative range for the six silymarin flavonolignans were 2-1000 ng/ml
and 5-1000 ng/ml, respectively. Intra- and inter-day precisions were 1.7 - 11%, and 4.5 - 14%,
respectively. For authentic reference standards, the composition of silybin (Silibinin, Sigma-
Aldrich, St. Louis, MO) was confirmed to be a mixture of silybin A (SA) and silybin B (SB) by
LC-ESI-MS and the specific contents of SA and SB were analyzed to be 48% and 52%,
respectively. Silychristin (SC) was obtained from ChromaDex (Santa Ana, CA), and silydianin
(SD) was purchased from U.S. Pharmacopoeia (USP; Rockville, MD). Isosilybin A (ISA) and
isosilybin B (ISB) reference standards were obtained as a generous gift from Ulrich Mengs
(Madaus GmbH).
Measures of Liver Disease Activity. Plasma IL-6 (Quantikine HS, R&D Systems®,
Minneapolis, MN, USA) and 8-isoprostane F2α (Direct ELISA, Assay Designs®, Ann Arbor, MI,
USA) concentrations were determined according to manufacturer instructions. Plasma caspase-
3/7 activity (Caspase-GLO® 3/7 Assay, Promega®, Madison, WI, USA) was measured using a
recently described method by Seidel and colleagues (Seidel et al., 2005) with the following
modifications: plasma was diluted 1:10 in buffer and incubated with substrate for 2 hours.
Pharmacokinetic and Statistical Analysis. Pharmacokinetic parameters including: area under
plasma concentration-time curve from time 0 to 24 hours (AUC0-24h); maximum plasma
concentration (Cmax); time to Cmax (tmax); apparent clearance (total oral clearance divided by
bioavailability, (CL/F)); and terminal half-life (t1/2) were calculated for the six parent and total

DMD#19604
11
silymarin flavonolignans for each subject using noncompartmental methods, WinNonlin-Pro
(version 4.1; Pharsight Corp, Mountain View, CA, USA). AUC was calculated by the linear
up/log down trapezoidal method to the last time point (AUC0-24h). For CL/F calculations, the
dose of each silymarin flavonolignan was determined from their specific content in the NSI milk
thistle product as described above. All pharmacokinetic parameters are reported as geometric
means with their 95% confidence intervals. A one-way ANOVA was conducted on natural log-
transformed data using the Dunnett's multiple comparison to test for significant differences
between the healthy control group and each of the three different liver disease patient cohorts,
p<0.05 significant (SAS JMP 6.0.0; SAS Institute, Care, NC, USA).

DMD#19604
12
Results
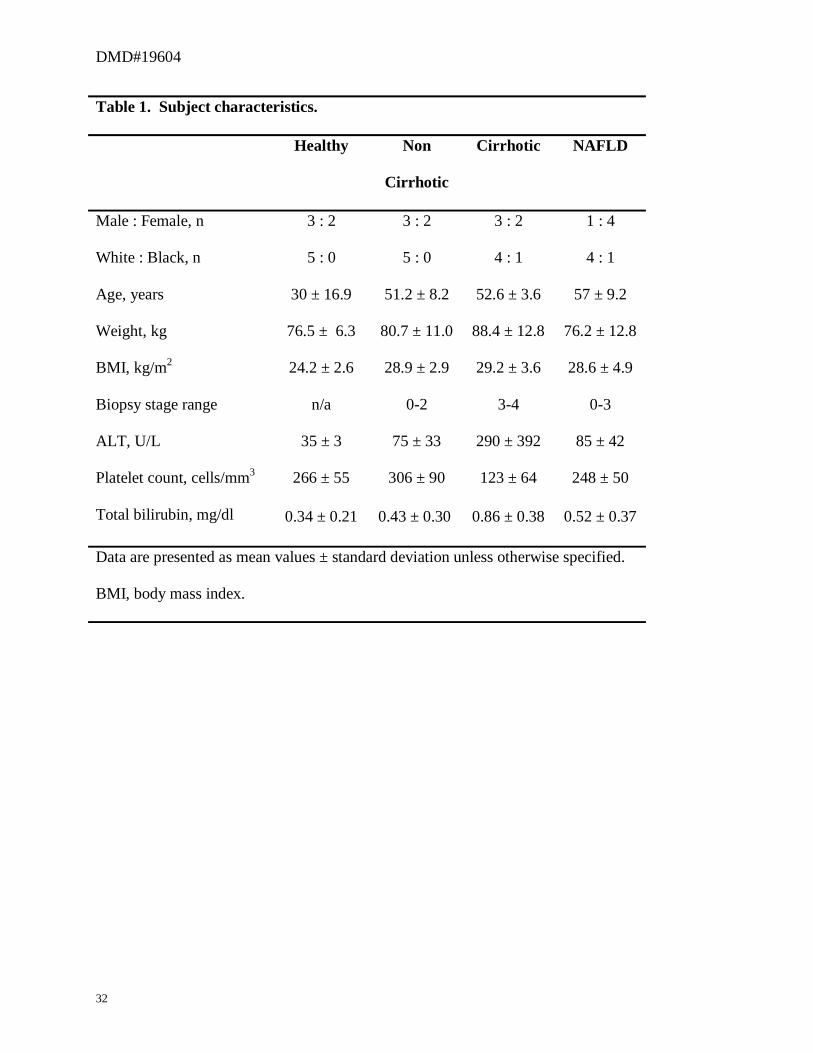
Subjects. The demographics for study participants are presented in Table 1. The mean age for
the three patient cohorts was approximately 20 years older than the healthy cohort. Serum ALT
(normal, male: 19 - 72 U/L; female: 12 - 48 U/L) was approximately 2-fold higher for both HCV
noncirrhosis and NAFLD cohorts, and approximately 4-fold higher for the HCV cirrhosis cohort
compared to the healthy cohort. The HCV cirrhosis cohort was characterized by a lower platelet
count (normal 155 - 440 cells/mm3) while total bilirubin (normal 0 - 1.2 mg/dl) was similar
across all cohorts indicative of well-compensated liver disease. Renal function was normal
(CrCl >60 ml/min) for all study subjects.
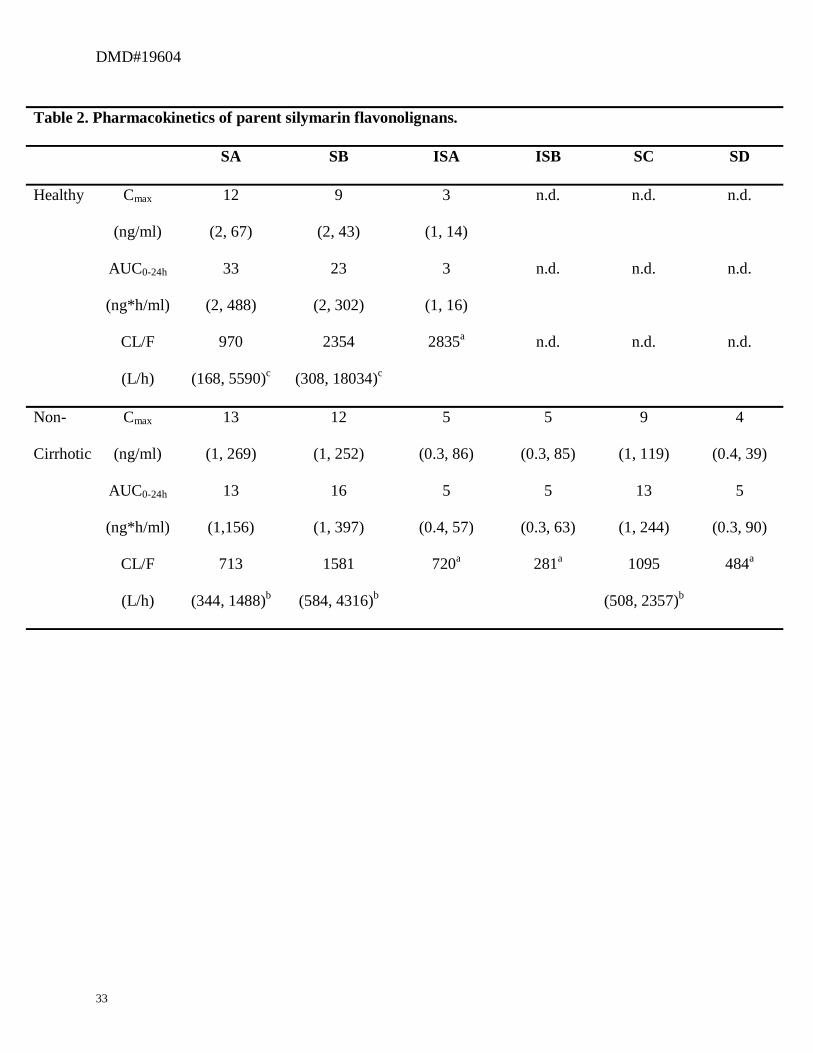
Pharmacokinetics of Parent Silymarin Flavonolignans. The plasma Cmax and AUC0-24h for
six major silymarin flavonolignans are presented in Table 2. Silybin A and silybin B were the
main flavonolignans in the plasma for all cohorts and their Cmax ranged from 12 ng/ml (healthy)
up to 69 ng/ml (HCV cirrhosis), and from 9 ng/ml (healthy) up to 40 ng/ml (NAFLD),
respectively. Silybin A and silybin B exposures (AUC0-24h) were also higher in patient cohorts
compared to the healthy cohort. Cmax and AUC0-24h for the other silymarin flavonolignans (ISA,
ISB, SC, and SD) were only consistently quantifiable in the liver disease cohorts. The HCV
cirrhosis cohort had the highest AUC0-24h for all silymarin flavonolignans. Absorption from the
gastrointestinal tract was rapid for all cohorts as indicated by a median Tmax between 0.5 to 2
hours for the various flavonolignans. By 6 hours post-dose, flavonolignan concentrations had
fallen below the detection limit in a majority of subjects due to short elimination half-lives (0.6
to 1.6 hours) for the silymarin flavonolignans observed in all cohorts (data not shown).

DMD#19604
13
The apparent clearances for the six major silymarin flavonolignans have not been
previously reported and are also presented in Table 2. CL/F’s for silybin A and silybin B were
between 27 - 48% and 33 - 51% lower, respectively, in the HCV cohorts compared to the healthy
cohort. However, these differences were not detected as significant due to large inter-subject
variability. CL/F for the NAFLD cohort was comparable to the healthy cohort.
These data suggest that both liver disease etiology and disease stage may be associated
with decreases in the clearance of parent silymarin flavonolignans that may result in increased
exposures compared to those observed in healthy volunteers.
Pharmacokinetics of Total Silymarin Flavonolignans. Table 3 depicts the plasma Cmax and
AUC0-24h for the total (parent + conjugates) concentration of each silymarin flavonolignan, which
were determined following complete enzymatic hydrolysis of conjugates (sulfates and
glucuronides) as described in Materials and Methods. Cmax and AUC0-24h for the total
concentration of each silymarin flavonolignan were increased by similar extents (1.8- to 6.3-fold
and 1.2- to 9.9-fold, respectively) in patient cohorts compared to healthy volunteers. The highest
exposures were observed for silybin B, isosilybin A, and silychristin across all disease cohorts,
and were highest in the HCV cirrhosis cohort (p≤0.02). To determine exposures to the total
amount of the six silymarin flavonolignans in blood for each cohort, AUC0-24h for the total
concentration of each flavonolignan were summed and evaluated across the four cohorts. AUC0-
24h for the sum of total silymarin flavonolignans were 2.4-, 3.3-, and 4.7-fold higher for the HCV
noncirrhosis, NAFLD (p≤0.03), and HCV cirrhosis (p≤0.03) cohorts, respectively, compared to
healthy volunteers (AUC0-24h=2021 ng*h/ml).

DMD#19604
14
Terminal elimination half-lives for the silymarin flavonolignans ranged from 4 to 10
hours for the healthy cohort compared to 8 to 25 hours in the patient cohorts. The effect of liver
disease on the plasma pharmacokinetics for total silymarin flavonolignans is best depicted by
comparing the concentration vs time profiles between healthy and HCV cirrhosis cohorts for
each silymarin flavonolignan. As seen in Figure 1, the concentration versus time profiles for
each of the six total silymarin flavonolignans were elevated in patients with HCV cirrhosis
(Panel B) over the 24 hour sampling period compared to those in healthy volunteers (Panel A).
Time versus concentration profiles for the HCV noncirrhotic and NALFD cohorts were
intermediate to those of the healthy and HCV cirrhosis cohorts and are reflected in the AUC0-24h
data depicted in Table 3.
Pharmacokinetics of Silymarin Flavonolignan Conjugates. To more clearly determine the
influence of disease type and severity on the disposition of silymarin conjugates, a “conjugate
pool” concentration was calculated at each time point for all cohorts. First, the conjugate
(sulfates + glucuronides) concentrations for each silymarin flavonolignan were obtained from the
difference between parent (Table 2) and total (Table 3) plasma concentrations. Then the
conjugate concentrations for all six silymarin flavonolignans were summed to obtain a “Sum
silymarin conjugates” concentration. Figure 2 depicts for each cohort, the concentration versus
time profiles for Sum silymarin conjugates expressed in terms of “Parent Flavonolignan
Equivalents”. These concentration data were used to determine the Sum silymarin conjugates
AUC0-24h which are also depicted in Figure 2 (see Table inset). Compared to healthy volunteers,
Sum silymarin conjugates AUC0-24h were 2.4-, 3.3-, and 4.7-fold greater in HCV noncirrhosis,
NAFLD, and HCV cirrhosis cohorts, respectively. The Sum silymarin conjugates Cmax (data not

DMD#19604
15
shown) and AUC0-24h were significantly elevated in the NAFLD and HCV cirrhosis cohorts
compared to the healthy cohort (p≤0.03). These increases in Sum silymarin conjugates AUC0-24h
are similar to the increases observed for the sum of total silymarin flavonolignans AUC0-24h since
flavonolignan conjugates account for 97 - 99% of total flavonolignan concentrations. The
elimination half-life for patient cohorts ranged from 8 to 10 hours compared to 4 hours for the
healthy cohort. Although the 24 hour sampling interval did not allow precise estimates of the
terminal elimination phase, these data suggest that the elimination of silymarin conjugates is
more prolonged in liver disease.
Silymarin Flavonolignan Metabolism. Figure 3 depicts the relative proportions of glucuronide
conjugates for silybin B and isosilybin A, which were between 77 - 86% and 14 - 23%,
respectively, across all cohorts. While the primary route of metabolism was glucuronidation for
silybin B, and sulfation for isosilybin A, there were no significant effects of disease severity or
type on the extent of their conjugation. These data indicate that the higher silymarin
flavonolignan conjugate exposures observed in patient cohorts did not reflect alterations in
preferred pathways of phase 2 metabolism.
Measures of Disease Activity. To determine if changes in Sum silymarin conjugates AUC0-24h
were associated with various measures of liver disease activity, the Sum silymarin conjugates
AUC0-24h was correlated with measures of oxidative stress and apoptosis in plasma for each of
the twenty subjects. As seen in Figure 4, the Sum silymarin conjugates AUC0-24h correlated with
plasma caspase-3/7 activity (R2=0.52, p<0.001), a measure of apoptosis. Compared to healthy
volunteers, plasma caspase-3/7 activity was 1.3-, 1.1-, and 4.7-fold higher in HCV noncirrhosis,

DMD#19604
16
NAFLD, and HCV cirrhosis (p≤0.005) cohorts, respectively. In contrast, no correlations were
observed with plasma concentrations of either 8-isoprostane F2α (Figure 3 inset), a biomarker of
oxidative stress, or between IL-6 or ALT across all patients, and significant differences between
cohorts were not detected (data not shown).

DMD#19604
17
Discussion
Single daily doses of silymarin up to 1260 mg per day (Gordon et al., 2006; Huber et al.,
2005) have only been studied in patients with early stage liver disease while other trials in
patients with advanced disease have utilized three times daily doses of 140 or 150 mg (Ferenci et
al., 1989; Pares et al., 1998; Lucena et al., 2002). Previous clinical trials have failed to include
measures of silymarin exposure and the inconsistent reports of silymarin’s clinical benefits may
reflect variation in the exposures attained due to either the effects of liver disease on silymarin’s
pharmacokinetics, or the different dosing regimens utilized. This is the first investigation of the
pharmacokinetics of the six major silymarin flavonolignans and their conjugates in patients with
different types and stages of liver disease. Exposures for parent silymarin flavonolignans were
generally higher in patient cohorts, especially for isosilybin A, isosilybin B, and silychristin
which were not detected in healthy volunteers. However, these exposures were not maintained
past six hours post-dose due to low Cmax concentrations and short half-lives. These data suggest
that the silymarin dosing regimens currently used by patients to self-treat their liver disease, or
previously evaluated in clinical trials, may not provide adequate plasma exposures to obtain the
antioxidant, anti-inflammatory, or anti-fibrotic benefits of silymarin.
Previous silymarin pharmacokinetic studies in healthy subjects have underestimated total
silymarin exposures since they have only focused on silybin A and silybin B, which are the
major silymarin flavonolignans in milk thistle extracts. Silybin A and silybin B comprised 56%
of the flavonolignans in the milk thistle extract used in this study (Wen et al., 2008) but they
accounted for only 43% of the sum of total silymarin flavonolignans exposure in healthy
volunteers. In patients with liver disease, silybin A and silybin B accounted for even less of the
sum of total silymarin flavonolignans (31 - 38%) due the accumulation of silychristin which

DMD#19604
18
accounted for 18% in healthy subjects and 20 - 36% in patients with liver disease. All of the
silymarin flavonolignans have been shown to have potent antioxidant activity (Psotova et al.,
2002; Kvasnicka et al., 2003), and therefore they may contribute significantly to the clinical
effects of silymarin in patients with liver disease.
The increases in peak plasma concentrations and exposures for parent silymarin
flavonolignans in patients with liver disease most likely reflect increased intestinal absorption by
the gastrointestinal tract and not decreased phase 2 conjugation by either the gut or liver since
total silymarin conjugates were also increased. Hepatic and gastrointestinal tissues share many
of the same drug transporters that are involved in the absorption of flavonolignans (Morris and
Zhang, 2006; Cermak and Wolffran, 2006), and biliary obstruction results in changes in
transporter expression in both rat liver and intestine (Kamisako and Ogawa, 2007). Since hepatic
expression of many of these drug transporters may be down-regulated in chronic HCV
(Hinoshita et al., 2001), the increased absorption of silymarin flavonolignans may reflect a
similar down-regulation of transporters within the gastrointestinal tract, such as multidrug
resistance protein 2 (MRP2), that might normally limit the absorption of silymarin
flavonolignans.
In our study, the most significant alteration in the disposition of silymarin in patients with
liver disease was reflected in the plasma concentrations for the sum of total silymarin
flavonolignans where exposures were 2.4- to 4.7- fold higher in patient cohorts compared to
healthy volunteers. The difference in the mean age between the healthy cohort (30 ± 17 years)
and liver disease cohorts (e.g. 53 ± 4 years HCV cirrhosis) may be a limitation to our study
because of the potential for age-related differences in metabolism. However, it is unlikely that
the 2.4- to 4.7-fold differences in silymarin exposures between liver disease cohorts and healthy
DMD#19604
19
volunteers can be explained by age differences since ages overlap between cohorts and
significant influences of age on the disposition of drugs that primarily undergo high first-pass,
phase 2 metabolism by the glucuronosyl transferase system have not been observed.
The extent of phase 2 conjugation by either glucuronidation or sulfation pathways for
silybin B and isosilybin A was unaffected by liver disease stage or type. Therefore, the elevated
plasma levels of phase 2 conjugates of silymarin may result primarily from alterations in hepatic
excretion processes rather than from increased phase 2 metabolism. Similar increases in
flavonolignan exposures have been reported in a rat model of cirrhosis where an approximately
2-fold increase in plasma AUC for silybin A and B conjugates was correlated with a 50%
reduction in the bile to blood exposure ratio for silybin A and B conjugates in cirrhotic rats
compared to control (Wu et al., 2008). In humans, decreased biliary excretion of flavonolignan
conjugates may potentially influence the efficacy of silymarin due to reduced enterohepatic
recycling and return of parent flavonolignans via portal blood. In addition, different types of
liver disease or liver injury have been shown to induce different changes in the expression of
hepatic transporters in humans (Barnes et al., 2007) and in animal models (Lickteig et al., 2006).
Our data suggest that one measure of liver disease activity, a simple biochemical assay of
caspase-3/7 activity in blood, may be useful for predicting the disposition of drugs that undergo
extensive conjugation and biliary elimination like silymarin in patients with liver disease. In
chronic HCV patients, apoptosis and serum caspase-3/7 activity correlate with liver disease
grade and stage (Seidel et al., 2005; Calabrese et al., 2000; Bantel et al., 2001; Bantel et al.,
2004). Caspase-3/7 activity reflects the net contributions of several activators of apoptosis
because of their downstream location in both the intrinsic and extrinsic pathways of apoptosis.
In contrast to caspase-3/7 activity, plasma levels of 8-isoprostane F2α, IL-6, and serum ALT

DMD#19604
20
values did not correlate with AUC0-24h for Sum silymarin conjugates. Altered hepatic expression
of biliary transporters was shown to be independent of the inflammation and oxidative stress
associated with bile duct-ligation (Wagner et al., 2005). Therefore, other components of disease
activity, perhaps related to the development of cirrhosis, may account for the association
between caspase-3/7 activity and altered disposition of silymarin conjugates which was most
apparent in the HCV cirrhotic cohort. Alternatively, hepatocytes undergoing apoptosis may
represent that fraction of the liver with decreased ability to eliminate conjugates of silymarin
flavonolignans.
It is not known whether parent or conjugated silymarin flavonolignans are responsible for
silymarin’s purported therapeutic effects since both silybin and its 7-glucuronide conjugate have
demonstrated antioxidant activity in vitro at a concentration of 330 µM (Kren et al., 2000).
Recently, the anti-viral activity of a standardized silymarin extract was demonstrated in an in
vitro cell culture model of HCV replication at concentrations ranging between 20 µM - 40 µM
(Polyak et al., 2007). In our study, the peak plasma concentration for all silymarin
flavonolignans combined only amounted to 0.5 µM (225 ng/ml) for HCV patients with cirrhosis,
who achieved the highest levels of exposure following a customary dose of silymarin.
Therefore, customary doses of silymarin are not likely to achieve the plasma concentrations
required for the antioxidant and antiviral effects of silymarin.
Silymarin exposures have been underestimated in previous studies because of their
failure to quantitate the six major silymarin flavonolignans. Therefore, future clinical
investigations should be directed towards an evaluation of the independent roles of the major
silymarin flavonolignans and their conjugates to determine their effects in various liver disease
populations. However, before such studies are undertaken, pharmacokinetic studies that examine

DMD#19604
21
higher, multiple daily silymarin dose regimens in patients with liver disease are needed to
identify regimens that provide optimal 24 hour exposures. To this end, a Phase I double-blind,
randomized clinical trial has been undertaken to evaluate the safety, tolerability, and
pharmacokinetics of silymarin in a dose escalation manner in both non-cirrhotic HCV and
NAFLD patients.

DMD#19604
22
Acknowledgements. We thank Trang Nguyen for her assistance with sample preparation. We
thank Dr. Sonia Miranda for her assistance with the caspase-3/7 and 8-isoprostane F2α assays.
We thank Dr. Heyward Hull for providing statistical consultation.

DMD#19604
23
References
Bantel H, Lugering A, Poremba C, Lugering N, Held J, Domschke W, Schulze-Osthoff K (2001)
Caspase activation correlates with the degree of inflammatory liver injury in chronic hepatitis C
virus infection. Hepatology 34:758-767.
Bantel H, Lugering A, Heidemann J, Volkmann X, Poremba C, Strassburg CP, Manns MP,
Schulze-Osthoff K (2004) Detection of apoptotic caspase activation in sera from patients with
chronic HCV infection is associated with fibrotic liver injury. Hepatology 40:1078-1087.
Barnes SN, Aleksunes LM, Augustine L, Scheffer GL, Goedken MJ, Jakowski AB, Pruimboom-
Brees IM, Cherrington NJ, Manautou JE (2007) Induction of hepatobiliary efflux transporters in
acetaminophen-induced acute liver failure cases. Drug Metab Dispos 35:1963-1969.
Beckmann-Knopp S, Rietbrock S, Weyhenmeyer R, Bocker RH, Beckurts KT, Lang W, Hunz
M, Fuhr U (2000) Inhibitory effects of silibinin on cytochrome P-450 enzymes in human liver
microsomes. Pharmacol Toxicol 86:250-256.
Buzzelli G, Moscarella S, Barbagli, Marena C, Gentilini P (1994) Therapeutic effect of silipide
in patients with chronic hepatic C non responders (NTs) to interferon (IFN) treatment. J Hepatol
21:S100.

DMD#19604
24
Calabrese F, Pontisso P, Pettenazzo E, Benvegnu L, Vario A, Chemello L, Alberti A, Valente M
(2000) Liver cell apoptosis in chronic hepatitis C correlates with histological but not biochemical
activity or serum HCV-RNA levels. Hepatology 31:1153-1159.
Cermak R, Wolffran S (2006) The potential of flavonolignans to influence drug metabolism and
pharmacokinetics by local gastrointestinal mechanisms. Current Drug Metabolism 7:729-744.
Congiu M, Mashford ML, Slavin JL, Desmond PV (2002) UDP Glucuronosyltransferase mRNA
levels in human liver disease. Drug Metab Dispos 30:129–134.
Crocenzi FA, Roma MG (2006) Silymarin as a new hepatoprotective agent in experimental
cholestasis: new possibilities for an ancient medication. Curr Med Chem13:1055-1074.
Ferenci P, Dragosics B, Dittrich H, Frank H, Benda L, Lochs H, Meryn S, Base W, Schneider B
(1989) Randomized controlled trial of silymarin treatment in patients with cirrhosis of the liver. J
Hepatol 9:105-113.
Gordon A, Hobbs DA, Bowden DS, Bailey MJ, Mitchell J, Francis AJ, Roberts SK (2006)
Effects of silybum marianum on serum hepatitis C virus RNA, alanine aminotransferase levels
and well-being in patients with chronic hepatitis C. J Gastroenterol Hepatol 21:275-280.

DMD#19604
25
Guardigli M, Marangi M, Casanova S, Grigioni WF, Roda E, Roda A (2005)
Chemiluminescence quantitative immunohistochemical determination of MRP2 in liver biopsies.
J Histochem Cytochem 53:1451-1457.
Hinoshita E, Taguchi K, Inokuchi A, Uchiumi T, Kinukawa N, Shimada M, Tsuneyoshi M,
Sugimachi K, Kuwano M (2001) Decreased expression of an ATP-binding cassette transporter,
MRP2, in human livers with hepatitis C virus infection. J Hepatol 35:765-773.
Huber R, Futter I, Ludtke R (2005) Oral silymarin for chronic hepatitis C—a retrospective
analysis comparing three dose regimens. Eur J Med Res 10:68–70.
Jacobs BP, Dennehy C, Ramirez G, Sapp J, Lawrence VA (2002) Milk thistle for the treatment
of liver disease: a systematic review and meta-analysis. Am J Med 113:506-515.
Kamisako T, Ogawa H (2007) Effect of bile duct obstruction on the expression of intestinal
mRNA related to cholesterol and bile acid metabolism in the rat. J Gastroenterol Hepatol
22:125–131.
Kren V, Ulrichova J, Kosina P, Stevenson D, Sedmera P, Prikrylova V, Halada P, Simanek V
(2000) Chemoenzymatic prepration of silibin β-glucuronides and their biological evaluation.
Drug Metab Dispos 28:1513-1517.
DMD#19604
26
Kvasnicka F, Biba B, Sevcik R, Voldrich M, Kratka J (2003) Analysis of the active components
of silymarin. J Chromatogr A 90:239-45.
Lickteig AJ, Fisher CD, Augustine LM, Aleksunes LM, Besselsen DG, Slitt AL, Manautou JE,
Cherrington NJ (2007) Efflux transporter expression and acetaminophen metabolite excretion are
altered in rodent models of non-alcoholic fatty liver disease. Drug Metab Dispos 35:1970-1980.
Lorenz D, Lucker PW, Mennicke WH, Wetzelsberger N (1984) Pharmacokinetic studies with
silymarin in human serum and bile. Methods Find Exp Clin Pharmacol 6:655-661.
Lucena MI, Andrade RJ, de la Cruz JP, Rodriguez-Mendizabal M, Blanco E, Sanchez de la
Cuesta F (2002) Effects of silymarin MZ-80 on oxidative stress in patients with alcoholic
cirrhosis. Results of a randomized, double-blind, placebo-controlled clinical study. Int J Clin
Pharmacol Ther 40:2-8.
Manna SK, Mukhopadhyay A, Van NT, Aggarwal BB (1999) Silymarin suppresses TNF-
induced activation of NF-kappa B, c-Jun N-terminal kinase, and apoptosis. J Immunol 163:6800-
6809.
Mayer KE, Myers RP, Lee SS (2005) Silymarin treatment of viral hepatitis: a systematic review.
J Viral Hepat 12:559-567.

DMD#19604
27
Morris ME, Zhang Z (2006) Flavonolignan-drug interactions: effects of flavonolignans on ABC
transporters. Life Sciences 78:2116-2130.
Par A, Roth E, Rumi G Jr, Kovacs Z, Nemes J, Mozsik G (2000) Oxidative stress and
antioxidant defense in alcoholic liver disease and chronic hepatitis C. Orv Hetil 141:1655-1659.
Pares A, Planas R, Torres M, Caballeria J, Viver JM, Acero D, Panes J, Rigau J, Santos J, Rodes
J (1998) Effects of silymarin in alcoholic patients with cirrhosis of the liver: results of a
controlled, double-blind, randomized and multicenter trial. J Hepatol 28:615-621.
Polyak SJ, Morishima C, Shuhart MC, Want CC, Liu Y, Lee DYW (2007) Inhibition of T cell
inflammatory cytokines, hepatocyte NF-kappaB Signaling, and HCV infection by standardized
silymarin. Gastroenterology 132:1925-1936.
Psotova J, Chlopcikova S, Grambal F, Simanek V, Ulrichova J (2002) Influence of silymarin and
its flavonolignans on doxorubicin-iron induced lipid peroxidation in rat heart microsomes and
mitochondria in comparison with quercetin. Phytother Res 16:S63-67.
Rambaldi A, Jacobs BP, Iaquinto G, Gluud C (2007) Milk thistle for alcoholic and/or hepatitis B
or C virus liver diseases. Cochrane Database Syst Rev 4:CD003620.
Rickling, B., Hans, B., Kramarczyk, R., Krumbiegel, G., Weyhenmeyer, R (1995) Two high-
performance liquid chromatographic assays for the determination of free and total silibinin

DMD#19604
28
diastereomers in plasma using column switching with electrochemical detection and reversed-
phase chromatography with ultraviolet detection. J Chromatogr B Biomed Appl 670:267-277.
Russo MW, Esposite S, Borwn Jr RS, Foulgar KC, Jacobson IM (2001) Complementary
alternative medicine (CAM) use amongst patients with chronic hepatitis C infection (HCV)
(abstr). Gastroenterology 120:A409.
Saller R, Meier R, Brignoli R (2001) The use of silymarin in the treatment of liver diseases.
Drugs 61:2035-2063.
Schumann J, Prockl J, Kiemer AK, Vollmar AM, Bang R, Tiegs G (2003) Silibinin protects mice
from T cell-dependent liver injury. J Hepatol 39:333-340.
Seidel N, Volkmann X, Langer F, Flemming P, Manns MP, Schulze-Osthoff K, Bantel H (2005)
The extent of liver steatosis is chronic hepatitis C virus infection is mirrored by caspase activity
in serum. Hepatology 42:113-120.
Tanamly MD, Tadros F, Labeeb S, Makld H, Shehata M, Mikhail N, Magder LS, Afdhal NH,
Medhat A, Abdel-Hamid M (2004) Randomised double-blinded trial evaluating silymarin for
chronic hepatitis C in an Egyptian village: study description and 12-month results. Dig Liver Dis
36:752–759.

DMD#19604
29
Velussi, M., Cernigoi, A.M., De Monte, A., Dapas, F., Caffau, C., Zili, M (1997) Long-term
(12 months) treatment with an anti-oxidant drug (silymarin) is effective on hyperinsulinemia,
exogenous insulin need and malondialdehyde levels in cirrhotic diabetic patients. J Hepatol
26:871-879.
Wagner M, Zollner G, Fickert P, Gumhold J, Silbert D, Fuchsbichler A, Gujral JS, Zatloukal K,
Denk H, Jaeschke H, Trauner M (2005) Hepatobiliary transporter expression in ICAM-/- and lpr
mice after common bile duct ligation is independent of the degree of inflammation and oxidative
stress. Drug Metab Dispos 35:1694-1699.
Wen Z, Dumas TE, Schrieber SJ, Hawke RL, Fried MW, Smith PC (2008) Pharmacokinetics and
metabolic profile of free, conjugated and total silymarin flavonolignans in human plasma after
oral administration of milk thistle extract. Drug Metab Dispos 36:65-72.
Weyhenmeyer R, Mascher H, Birkmayer J (1992) Study on dose-linearity of the
pharmacokinetics of silibinin diastereomers using a new steriospecific assay. Int J Clin
Pharmacol Ther Toxicol 30:134-138.
Wu JW, Lin LC, Hung SC, Lin CH, Chi CW, Tsai TH (2008) Effect of silibinin on the
pharmacokinetics of pyrazinamide and pyrazinoic acid in rats. Drug Metab Dispos 36:589-596.

DMD#19604
30
Footnote
This work was supported by the National Institute of Health grants # K24 DK066144 and #
RR00046, from the General Clinical Research Centers program of the Division of Research
Resources.

DMD#19604
31
FIGURE LEGENDS
Figure 1. Total (parent + conjugated) concentration vs time profiles of the six major
silymarin flavonolignans in healthy volunteers (Panel A) and HCV patients with cirrhosis
(Panel B).
Panel A contains the legend for Figure 1. The linear quantitative range for the six silymarin
flavonolignans by the LC-MS assay is 5 - 1000 ng/ml.
Figure 2. Sum silymarin conjugates vs time profile for each cohort.
Table inset depicts the geometric means (95% CI) for Sum silymarin conjugates AUC0-24h,
(expressed as “Parent Flavonolignan Equivalents”), *p≤0.03, comparisons to the healthy cohort.
Figure 3. The percent (%) of total conjugates that are glucuronides for silybin B and
isosilybin B at 1.5- hrs post-dose.
Bars represent the cohorts: healthy, open; HCV noncirrhotic, gray; cirrhotic cohort, black; and
NAFLD, white-hatched.
Figure 4. Correlation of Sum silymarin conjugates AUC0-24h (expressed as “Parent
Flavonolignan Equivalents”) with measures of liver disease activity among all study
participants.
Caspase 3/7 activity correlated with Sum silymarin conjugates AUC0-24h (R2=0.52, p<0.001).
Plasma 8-isoprostane F2α did not correlate with Sum silymarin conjugates AUC0-24h (R2=0.01,
p>0.9), see Figure inset. RLU, relative light units.
DMD#19604
32
Table 1. Subject characteristics.
Healthy
Non
Cirrhotic
Cirrhotic NAFLD
Male : Female, n 3 : 2 3 : 2 3 : 2 1 : 4
White : Black, n 5 : 0 5 : 0 4 : 1 4 : 1
Age, years 30 ± 16.9 51.2 ± 8.2 52.6 ± 3.6 57 ± 9.2
Weight, kg 76.5 ± 6.3 80.7 ± 11.0 88.4 ± 12.8 76.2 ± 12.8
BMI, kg/m2 24.2 ± 2.6 28.9 ± 2.9 29.2 ± 3.6 28.6 ± 4.9
Biopsy stage range n/a 0-2 3-4 0-3
ALT, U/L 35 ± 3 75 ± 33 290 ± 392 85 ± 42
Platelet count, cells/mm3 266 ± 55 306 ± 90 123 ± 64 248 ± 50
Total bilirubin, mg/dl 0.34 ± 0.21 0.43 ± 0.30 0.86 ± 0.38 0.52 ± 0.37
Data are presented as mean values ± standard deviation unless otherwise specified.
BMI, body mass index.
DMD#19604
33
Table 2. Pharmacokinetics of parent silymarin flavonolignans.
SA SB ISA ISB SC SD
Cmax
(ng/ml)
12
(2, 67)
9
(2, 43)
3
(1, 14)
n.d. n.d. n.d.
AUC0-24h
(ng*h/ml)
33
(2, 488)
23
(2, 302)
3
(1, 16)
n.d. n.d. n.d.
Healthy
CL/F
(L/h)
970
(168, 5590)c
2354
(308, 18034)c
2835a n.d. n.d. n.d.
Cmax
(ng/ml)
13
(1, 269)
12
(1, 252)
5
(0.3, 86)
5
(0.3, 85)
9
(1, 119)
4
(0.4, 39)
AUC0-24h
(ng*h/ml)
13
(1,156)
16
(1, 397)
5
(0.4, 57)
5
(0.3, 63)
13
(1, 244)
5
(0.3, 90)
Non-
Cirrhotic
CL/F
(L/h)
713
(344, 1488)b
1581
(584, 4316)b
720a 281a 1095
(508, 2357)b
484a

DMD#19604
34
Table 2 (continued). Pharmacokinetics of parent silymarin flavonolignans.
SA SB ISA ISB SC SD
Cmax
(ng/ml)
69
(45, 107)
33
(3, 385)
11
(1, 156)
15
(2, 104)
5
(0.3, 91)
n.d.
AUC0-24h
(ng*h/ml)
41
(3, 549)
149
(115, 195)
12
(1, 191)
16
(2, 115)
7
(0.2, 251)
n.d.
Cirrhotic
CL/F
(L/h)
509
(389, 667)
1156
(614, 2165)c
505
(208, 1222)b
402
(240, 675)c
541 a n.d.
Cmax
(ng/ml)
61
(24, 157)
40
(14, 110)
n.d. 5
(0.3, 62)
n.d. n.d.
AUC0-24h
(ng*h/ml)
40
(19, 43)
84
(43, 166)
n.d.
4
(0.4, 51)
n.d.
n.d.
NAFLD
CL/F
(L/h)
904
(454, 1800)
3019
(1422, 6438)
n.d.
349a n.d. n.d.
Data are presented as geometric means (95% CI). Not determined (n.d.) indicates concentrations below limit of
quantitation. Geometric means for CL/F reflect n=5 unless otherwise specified: athe average of only two values,
bn=3, cn=4.

DMD#19604
35
Table 3. Pharmacokinetics of total (parent + conjugated) silymarin flavonolignans.
SA SB ISA ISB SC SD
Cmax
(ng/ml)
37
(23, 61)
106
(63, 177)
71
(32, 157)
41
(21, 80)
37
(18, 76)
12
(2, 64)
Healthy
AUC0-24h
(ng*h/ml)
256
(118, 557)
617
(327, 1164)
491
(243, 993)
251
(145, 436)
355
(169, 745)
51
(3, 807)
Cmax
(ng/ml)
73
(19, 282)
269
(73, 995)
131
(40, 422)
76
(21, 274)
144
(49, 423)
39
(12, 131)
Non
Cirrhotic
AUC0-24h
(ng*h/ml)
301
(100, 901)
1195
(374, 3823)
858
(282, 2610)
494
(154, 1588)
1699
(633, 4564)*
228
(82, 634)
Cmax
(ng/ml)
151
(71, 319)*
551
(309, 982)*
339
(160, 720)*
193
(110, 338)*
147
(68, 318)*
75
(33, 171)*
Cirrhotic
AUC0-24h
(ng*h/ml)
685
(265, 1776)*
2899
(1082, 7767)*
2231
(641, 7760)*
1254
(478, 3287)*
1841
(802, 4226)*
507
(167, 1542)
Cmax
(ng/ml)
124
(56, 278)*
430
(215, 860)*
216
(96, 485)
137
(55, 343)*
190
(100, 361)*
68
(43, 108)*
NAFLD
AUC0-24h
(ng*h/ml)
521
(342, 795)
1720
(943, 3137)
1279
(690, 2371)
706
(406, 1230)
2043
(1170, 3566)*
352
(252, 493)
Data are presented as geometric means (95% CI), *p≤0.02, comparisons to the healthy cohort.


Figure 2.
AUC0-24h (ng*h/ml) ▲ Healthy 1966 (1018, 3797)
○ NonCirrhotic 4675 (1641, 13306)
□ Cirrhotic 9246 (3447, 24810)*
■ NAFLD 6477 (3761, 11148)*

