dlr 1 q16 earnings presentation
TRANSCRIPT

April 28, 2016

1 SUPERIOR RETURNS
Deliver superior risk-adjusted total shareholder returns
2 CAPITAL ALLOCATION
Prudently allocate capital to opportunistically extend global campus footprint
3 PRODUCT OFFERINGS
Drive higher returns on the asset base by diversifying product offerings
4 OPERATING EFFICIENCIES
Achieve operating efficiencies to accelerate growth in cash flow and value per share
Our FocusOur philosophy is to deliver superior returns to our shareholders by
capitalizing on our core competencies and tailoring them to meet the ever
growing and evolving data center needs of our customers
The Next HorizonThree-Year Guideposts
2

-
20
40
60
Boston Chicago Dallas Houston N Virginia NY Metro Phoenix Silicon Valley
Current Supply New Construction Digital Realty Inventory
-
20
40
60
Boston Chicago Dallas Houston N Virginia NY Metro Phoenix Silicon Valley
Current Supply New Construction Digital Realty InventoryCurrent Supply (1)
U.S. Major Market Data Center Supply (1)
Supply Steady in Major U.S. Markets
1) Reflects management’s estimates of available supply, including sub-lease availability. 2) Represents Digital Realty’s available finished data center space and available active data center construction.
3
in megawatts 1Q16
4Q15in megawatts
Digital Realty Inventory (2)
Current Supply (1) Digital Realty Inventory (2)

Data Center Supply in PerspectiveThe Fundamentals Glass is Half-Full
Source: Digital Realty internal estimates and datacenterHawk. 1) Per datacenterHawk. Excludes owner-occupied data centers. 2) Calculated as 2015 market absorption divided by current data center construction. 4
NORTHERN VIRGINIA DALLAS
National MarketsConstruction concentratedin markets characterized byrobust leasing velocity and
high visibility of demand
Single-Digit Vacancy RatesCurrent occupancy rates as well
as recent deliveries are at or above 90% leased
LTM Market Absorption Outpacing Construction2015 market absorption > 2x
current constructionpipelines
Occupancy Rate (1Q16)
Market (1)
91%
CHICAGO
Market Inventory (1)
DLR
92%
Occupancy Rate (1Q16)
Market (1)
95%DLR
98%
Occupancy Rate (1Q16)
Market (1)
90%DLR
94%
Market Inventory (1) Market Inventory (1)
2x 3x 2x
MarketAbsorption-to-Construction (2)
MarketAbsorption-to-Construction (2)
MarketAbsorption-to-Construction (2)
434 MW
479 MW
489 MW
3Q15 4Q15 1Q16
245 MW
252 MW
262 MW
3Q15 4Q15 1Q16
165 MW
174 MW
190 MW
3Q15 4Q15 1Q16
19 MW95% Leased
LTM Digital Realty Deliveries
12 MW100% Leased
LTM Digital Realty Deliveries
7 MW83% Leased
LTM Digital Realty Deliveries

4Q15 CALLFebruary 25, 2016
CURRENTApril 25, 2016
BETTER / WORSE 2016E 2017E
Global GDP Growth Forecast (1) 2016E: 3.4% 2016E: 3.2% q 3.2% 3.5%
U.S. GDP Growth Forecast (1) 2016E: 2.6% 2016E: 2.4% q 2.4% 2.5%
U.S. Unemployment Rate (2) 4.9% 5.0% p 4.8% 4.6%
Inflation Rate – U.S. Annual CPI Index (2) 1.4% 0.9% q 1.3% 2.2%
Crude Oil ($/barrel) (3) $30 $43 p $40 $52
Control of White House, Senate and HoR (4) D,R,R D,R,R tu D,R,R D,R,R
One-Month Libor (USD) (2) 0.4% 0.4% p 0.7% 1.0%
10-Yr U.S. Treasury Yield (2) 1.7% 1.9% p 2.2% n/a
GBP-USD (2) 1.44 1.45 p 1.46 1.50
EUR-USD (2) 1.11 1.13 p 1.09 1.10
S&P 500 (2) 1,918 (YTD -5.9%); P/E: 17.3x 2,088 (YTD 2.8%); P/E: 19.1x p 17.8x 15.6x
NASDAQ 100 (2) 4,130 (YTD -9.3%); P/E: 20.5x 4,474 (YTD -2.6%); P/E: 22.5x p 18.4x 16.0x
RMZ (2)
Average FFO Multiple (5)
1,038 (YTD -5.4%)14.6x
1,141 (YTD 4.7%)16.2x
p
16.2x n/a
IT Spending Growth Worldwide (6) 2016E: 1.7% 2016E: 1.6% q 1.6% 2.7%
Server Shipment Worldwide (7) 2016E: 6.1% 2016E: 6.2% p 6.2% 2.9%
Global Data Center to Data Center IP Traffic (8)
31%CAGR 2014 - 2019E
31%CAGR 2014 - 2019E
tu31%
CAGR 2014 - 2019E
Global Cloud IP Traffic (8) 33%CAGR 2014 - 2019E
33%CAGR 2014 - 2019E
tu33%
CAGR 2014 - 2019E
Decelerating Global Economic Growth OutlookData Center Demand Drivers Are a Bright Spot
5
MA
CR
OEC
ON
OM
ICIN
TER
EST
RA
TES
EQU
ITY
M
AR
KET
SIN
DU
STR
Y
1) IMF World Economic Outlook – April 2016.2) Bloomberg – April 2016.3) Bloomberg, NY Mercantile Exchange WTI Crude Oil (Front Month).4) Moody’s Analytics Presidential Election Model – April 2016.
5) Citi – February 2016 and April 2016.6) Gartner: IT Spending, Worldwide, Constant Currency, 4Q15 / December 2015 and 1Q16 / April 2016.7) Gartner: Servers Forecast Worldwide, 4Q15 / December 2015 and 1Q16 / April 2016.8) Cisco Global Cloud Index: Forecast and Methodology, 2013-2019 - October 2015.

FinancialResults

Telx ScorecardOn Track to Meet or Exceed Key 2016 Financial Targets
7
OPERATING REVENUE
2016UNDERWRITING
TARGET
CORE EBITDA (1)
1Q15ACTUAL
1) Represents Telx EBITDA adjusted for non-cash rent expense, non-cash compensation and excludes synergies. For a definition of Core EBITDA and a reconciliation to net income (loss), see the Appendix.
EXPENSE SYNERGIES
Completed / On-Track Slightly Behind Off-Track
$30.4 million
$148+ million
$83.5 million
$385+ million
1Q16ACTUAL
$91.7 million $38.4 million
2Q16
3Q16
$15+ million

$0
$20
$40
$60
1Q 2Q 3Q 4Q 1Q 2Q 3Q 4Q 1Q 2Q 3Q 4Q 1Q 2Q 3Q 4Q 1Q 2Q 3Q 4Q 1Q 2Q 3Q 4Q 1Q 2Q 3Q 4Q 1Q
Historical Lease SigningsAnnualized GAAP Base Rent (2)
Sustained Leasing MomentumHunting and Farming
1) Includes signings for new and re-leased space. 2) GAAP rental revenues include total rent for new lease and expansions. The timing between lease signing and lease commencement (and receipt of rents) may be significant.
$ in millions
8
2009 2010 2011 2012 2013 2014 2015 2016
Product TypeTotal s.f. Signed (1)
Annualized GAAPBase Rent / s.f. (2)
Annualized GAAPBase Rent (2)
Turn-Key Flex® 149,958 $216 $32.4 million
Powered Base Building® – $0 $0 million
Colocation 22,904 $265 $6.1 million
Non-Technical 40,958 $23 $0.9 million
Total 213,820 $184 $39.4 million
Connectivity contributesan additional $7.5 million

Healthy Backlog Sets a Solid FoundationSolid Pre-Leasing De-Risks New Market Entry
Note: Amounts shown represent GAAP annualized base rent from signed but not yet commenced leases and are based on current estimates of future lease commencement timing.
Actual results may vary from current estimates. The lag between lease signing and lease commencement (and receipt of rents) may be significant. Expected commencement date at time of signing.
9
$90
$84
$39 $33
$
$25
$50
$75
$100
$125
4Q15 Backlog Signings Commencements 1Q16 Backlog
$ in millions
$50
$90
$31
$9
2016 2017 2018+ Total Backlog
Backlog Roll-Forward + Commencement Timing
Commencements Total BacklogCurrent Period Backlog Signings
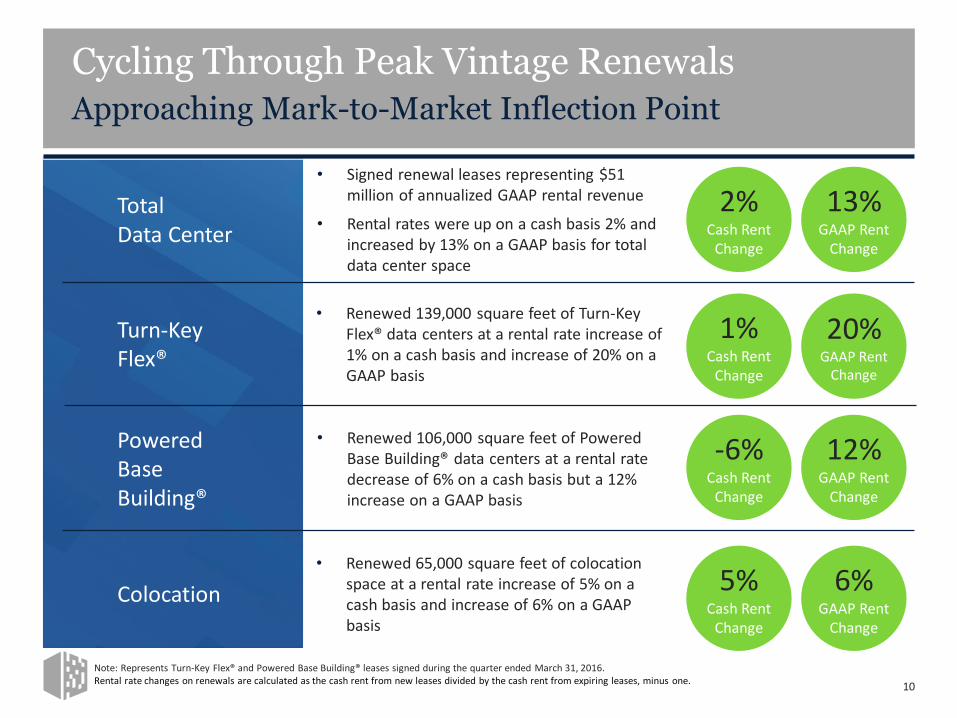
Note: Represents Turn-Key Flex® and Powered Base Building® leases signed during the quarter ended March 31, 2016.Rental rate changes on renewals are calculated as the cash rent from new leases divided by the cash rent from expiring leases, minus one.
Cycling Through Peak Vintage RenewalsApproaching Mark-to-Market Inflection Point
10
• Signed renewal leases representing $51 million of annualized GAAP rental revenue
• Rental rates were up on a cash basis 2% and increased by 13% on a GAAP basis for total data center space
13%GAAP Rent
Change
2%Cash Rent
Change
20%GAAP Rent
Change
1%Cash Rent
Change
6%GAAP Rent
Change
5%Cash Rent
Change
• Renewed 139,000 square feet of Turn-Key Flex® data centers at a rental rate increase of 1% on a cash basis and increase of 20% on a GAAP basis
• Renewed 65,000 square feet of colocation space at a rental rate increase of 5% on a cash basis and increase of 6% on a GAAP basis
TotalData Center
Turn-KeyFlex®
Colocation
12%GAAP Rent
Change
-6%Cash Rent
Change
• Renewed 106,000 square feet of Powered Base Building® data centers at a rental rate decrease of 6% on a cash basis but a 12% increase on a GAAP basis
PoweredBase Building®

$0.01 $0.01 $0.02
$0.03
$1.10
$1.20
$1.30
$1.40
$1.50
1Q16 Core FFO Consensus
Digital RealtyNOI
TelxEBITDA
Digital RealtyG&A
LowerInterest Expense
1Q16 Core FFOActualConsensus (1)
1Q16 Results Ahead of PlanOperating Outperformance + Interest Savings Drive Upside
Note: Core FFO is a non-GAAP financial measure. For a description of Core FFO and a reconciliation to net income, NOI, and Telx EBITDA, see the Appendix.
1) Based on FactSet consensus estimates as of April 27, 2016.
1Q16 Core FFO/ Share Reconciliation
Actual
$1.42
Consensus
$1.35
11

6.8%
7.9%
9.2%
10.5%
4.3% 5.0%
11.7% 12.7%
0%
5%
10%
15%
20%
25%
1Q16 / 1Q15Revenue Growth
1Q16 / 1Q15Adjusted EBITDA Growth
1Q16 / 1Q15Same-Capital Cash
NOI Growth
1Q16 / 1Q15Core FFO / Sh Growth
2016E / 2015Core FFO / Sh Growth
24.0%
25.4%
22.9%
24.3%
7.9%
6.5%
25%
As Reported Constant-Currency Total Including Telx
Constant-Currency GrowthFX Represents ~ 150 bps Drag on Reported Results
Note: Constant-currency, Adjusted EBITDA, Same-Capital Cash NOI and Core FFO are non-GAAP financial measures. For a description of these measures see the Appendix.
12

$0.1
$1.0
$0.0 $0.1 $0.2
$0.0
$1.0
$2.4
$0.8
$0.0 $0.0
$1.0
$2.0
$3.0
2015 2016 2017 2018 2019 2020 2021 2022 2023 2024 2025
Secured Mortgage Debt Unsecured Prudential Shelf Facility Pro Rata Share of JV Debt
Unsecured Notes Unsecured Term Loan Unsecured Global Facility
Unsecured Green Bonds
$0.7
(1)
Extended Global Unsecured Revolving Credit Facility and Term Loan Maturities to 2021 and 2023
(3) (4)
($ in billions)
Debt Maturity Schedule as of March 31, 2016No Bar Too Tall; Nominal Near-Term Maturities
13
(2)
Revolver Capacity (5)
$1.5 Bn
Debt Profile (6)
Weighted Average Debt Maturity 5.7 Yrs
Weighted Average Coupon 3.6%
% Unsecured Debt 96.0%
1) Total excludes $404,000 of net loan premiums and $175,000 of deferred financing costs. Balances and exchange rates as of March 31, 2016. 2) Represents Digital Realty’s pro rata share of four unconsolidated joint venture loans. 3) Term loan balance was $1.6 billion as of April 22, 2016. 4) Global Revolving Credit Facility balance was $80.0 million as of April 22, 2016. The unrestricted cash balance was $92.4 million as of April 22, 2016. 5) Reflects Global Revolving Credit Facility capacity of $2.0 billion less $691.2 million outstanding as of March 31, 2016. 6) As of March 31, 2016. Assumes extension of options.
Secured Mortgage Debt (1)
Unsecured Term Loan (3)
Pro Rata Share of JV Debt (2)
Unsecured Global Facility (4)

$0.1
$1.0
$0.0 $0.1 $0.2
$0.0
$1.0
$1.8
$0.8 $0.7
$0.0
$1.0
$2.0
$3.0
2015 2016 2017 2018 2019 2020 2021 2022 2023 2024 2025
Secured Mortgage Debt Unsecured Prudential Shelf Facility Pro Rata Share of JV Debt
Unsecured Notes Unsecured Term Loan Unsecured Global Facility
Unsecured Green Bonds
$0.7
(1)
Extended Global Unsecured Revolving Credit Facility and Term Loan Maturities to 2021 and 2023
(3) (4)
($ in billions)
Debt Maturity Schedule Pro Forma for EurobondNo Bar Too Tall; Nominal Near-Term Maturities
14
(2)
Revolver Capacity (5)
$1.9 Bn
Debt Profile (6)
Weighted Average Debt Maturity 6.8 Yrs
Weighted Average Coupon 3.8%
% Unsecured Debt 96.0%
Note: Pro forma for the offering of 600 million Euro aggregate principal amount of Digital Euro Finco, LLC’s 2.625% Notes due 20241) Total excludes $404,000 of net loan premiums and $175,000 of deferred financing costs. Balances and exchange rates as of March 31, 2016. 2) Represents Digital Realty’s pro rata share of four unconsolidated joint venture loans. 3) Term loan balance was $1.6 billion as of April 22, 2016. 4) Global Revolving Credit Facility balance was $80.0 million as of April 22, 2016. The unrestricted cash balance was $92.4 mil lion as of April 22, 2016. 5) Reflects Global Revolving Credit Facility capacity of $2.0 billion less $80.0 million outstanding as of April 22, 2016. 6) As of April 22, 2016. Assumes extension of options.
Secured Mortgage Debt (1)
Unsecured Term Loan (3)
Pro Rata Share of JV Debt (2)
Unsecured Global Facility (4)

Extending the Global FootprintEntered new target market with Frankfurt land acquisition, signed anchor tenant for first project in Japan
Achieving Operating EfficienciesReported 1Q16 core FFO / share of $1.42, seven cents ahead of consensus
Raised GuidanceRevised 2016 core FFO / share outlook from $5.45-$5.60 to $5.55-$5.65
Strengthened the Balance SheetRefinanced line of credit, completed inaugural Euro bond offering in April
15
Recreate S&U on
previous page in
Column Graphs
Consistent Execution on Strategic VisionDelivering Current Results, Seeding Future Growth
Successful 1Q16 Initiatives

Appendix

Definitions of Non-GAAP Financial Measures
The information included in this presentation contains certain non-GAAP financial measures that management believes are helpful in understanding our business, as further described below. Our definition and calculation of non-
GAAP financial measures may differ from those of other REITs, and, therefore, may not be comparable. The non-GAAP financial measures should not be considered an alternative to net income or any other GAAP measurement
of performance and should not be considered an alternative to cash flows from operating, investing or financing activities as a measure of liquidity.
FUNDS FROM OPERATIONS (FFO)
We calculate funds from operations, or FFO, in accordance with the standards established by the National Association of Real Estate Investment Trusts, or NAREIT. FFO represents net income (loss) (computed in accordance with
GAAP), excluding gains (or losses) from sales of property, excluding a gain from a pre-existing relationship, impairment charges, real estate related depreciation and amortization (excluding amortization of deferred financing
costs) and after adjustments for unconsolidated partnerships and joint ventures. Management uses FFO as a supplemental performance measure because, in excluding real estate related depreciation and amortization and gains
and losses from property dispositions and after adjustments for unconsolidated partnerships and joint ventures, it provides a performance measure that, when compared year over year, captures trends in occupancy rates,
rental rates and operating costs. We also believe that, as a widely recognized measure of the performance of REITs, FFO will be used by investors as a basis to compare our operating performance with that of other REITs.
However, because FFO excludes depreciation and amortization and captures neither the changes in the value of our properties that result from use or market conditions, nor the level of capital expenditures and capitalized
leasing commissions necessary to maintain the operating performance of our properties, all of which have real economic effect and could materially impact our financial condition and results from operations, the utility of FFO as
a measure of our performance is limited. Other REITs may not calculate FFO in accordance with the NAREIT definition and, accordingly, our FFO may not be comparable to such other REITs’ FFO. Accordingly, FFO should be
considered only as a supplement to net income computed in accordance with GAAP as a measure of our performance.
CORE FUNDS FROM OPERATATIONS (Core FFO)
We present core funds from operations, or core FFO, as a supplemental operating measure because, in excluding certain items that do not reflect core revenue or expense streams, it provides a performance measure that, when
compared year over year, captures trends in our core business operating performance. We calculate core FFO by adding to or subtracting from FFO (i) termination fees and other non-core revenues, (ii) transaction expenses, (iii)
loss from early extinguishment of debt, (iv) change in fair value of contingent consideration, (v) severance-related accrual, equity acceleration, and legal expenses, (vi) bridge facility fees and (vii) other non-core expense
adjustments. Because certain of these adjustments have a real economic impact on our financial condition and results from operations, the utility of core FFO as a measure of our performance is limited. Other REITs may not
calculate core FFO in a consistent manner. Accordingly, our core FFO may not be comparable to other REITs' core FFO. Core FFO should be considered only as a supplement to net income computed in accordance with GAAP as a
measure of our performance.
CONSTANT CURRENCY CORE FUNDS FROM OPERATIONS
We calculate constant-currency core funds from operations by adjusting the core funds from operations for foreign currency translations.
ADJUSTED FUNDS FROM OPERATIONS (AFFO)
We present adjusted funds from operations, or AFFO, as a supplemental operating measure because, when compared year over year, it assesses our ability to fund dividend and distribution requirements from our operating
activities. We also believe that, as a widely recognized measure of the operations of REITs, AFFO will be used by investors as a basis to assess our ability to fund dividend payments in comparison to other REITs, including on a per
share and unit basis. We calculate AFFO by adding to or subtracting from core FFO (i) non-real estate depreciation, (ii) amortization of deferred financing costs, (iii) amortization of debt discount/premium, (iv) non-cash stock-
based compensation expense, (v) non-cash stock-based compensation expense, (vi) straight-line rent revenue, (vii) straight-line rent expense, (viii) above- and below-market rent amortization, (ix) non-cash tax expense, (x)
capitalized leasing compensation, (xi) recurring capital expenditures and (xii) capitalized internal leasing commissions. Other REITs may not calculate AFFO in a consistent manner. Accordingly, our AFFO may not be comparable to
other REITs’ AFFO. AFFO should be considered only as a supplement to net income computed in accordance with GAAP as a measure of our performance.
17

Definitions of Non-GAAP Financial Measures (cont.)
EBITDA AND ADJUSTED EBITDA:
We believe that earnings before interest, loss from early extinguishment of debt, income taxes and depreciation and amortization, or EBITDA, and Adjusted EBITDA (as defined below), are useful
supplemental performance measures because they allow investors to view our performance without the impact of non-cash depreciation and amortization or the cost of debt and, with respect to
Adjusted EBITDA, change in fair value of contingent consideration, severance related accrual, equity acceleration, and legal expenses, transaction expenses, (gain) loss on sale of property, (gain) loss
on settlement of pre-existing relationship with Telx, other non-core expense adjustments, non-controlling interests, and preferred stock dividends. Adjusted EBITDA is EBITDA excluding change in fair
value of contingent consideration, severance related accrual, equity acceleration, and legal expenses, transaction expenses, gain (loss) on sale of property, gain on settlement of pre-existing
relationship with Telx, other non-core expense adjustments, non-controlling interests, and preferred stock dividends. In addition, we believe EBITDA and Adjusted EBITDA are frequently used by
securities analysts, investors and other interested parties in the evaluation of REITs. Because EBITDA and Adjusted EBITDA are calculated before recurring cash charges including interest expense and
income taxes, exclude capitalized costs, such as leasing commissions, and are not adjusted for capital expenditures or other recurring cash requirements of our business, their utility as a measure of
our performance is limited. Other REITs may calculate EBITDA and Adjusted EBITDA differently than we do; accordingly, our EBITDA and Adjusted EBITDA may not be comparable to such other REITs’
EBITDA and Adjusted EBITDA. Accordingly, EBITDA and Adjusted EBITDA should be considered only as supplements to net income computed in accordance with GAAP as a measure of our financial
performance.
NET OPERATING INCOME (NOI) AND CASH NOI
Net Operating Income (NOI) and Cash NOI: Net operating income, or NOI, represents rental revenue, interconnection revenue and tenant reimbursement revenue less utilities, rental property
operating expenses, repair and maintenance expenses, property taxes and insurance expenses (as reflected in the statement of operations). NOI is commonly used by stockholders, company
management and industry analysts as a measurement of operating performance of the company’s rental portfolio. Cash NOI is NOI less straight-line rents and above and below market rent
amortization. Cash NOI is commonly used by stockholders, company management and industry analysts as a measure of property operating performance on a cash basis. However, because NOI and
cash NOI exclude depreciation and amortization and capture neither the changes in the value of our properties that result from use or market conditions, nor the level of capital expenditures and
capitalized leasing commissions necessary to maintain the operating performance of our properties, all of which have real economic effect and could materially impact our results from operations, the
utility of NOI and cash NOI as measures of our performance is limited. Other REITs may not calculate NOI and cash NOI in the same manner we do and, accordingly, our NOI and cash NOI may not be
comparable to such other REITs’ NOI and cash NOI. Accordingly, NOI and cash NOI should be considered only as supplements to net income computed in accordance with GAAP as measures of our
performance.
SAME-CAPITAL CASH NOI
Same-capital Cash NOI is Cash NOI (as defined above) calculated for “Same-capital” properties. “Same-capital” properties are defined as properties owned as of December 31, 2013 with less than 5%
of total rentable square feet under development and excludes properties that were undergoing, or were expected to undergo, development activities in 2014-2015, properties classified as held for
sale, and properties sold or contributed to joint ventures for all periods presented.
18

Reconciliation of Non-GAAP Items To Their Closest GAAP Equivalent
19
Digital Realty Trust, Inc. and Subsidiaries
Reconciliation of Net Income Available to Common Stockholders to Funds From Operations (FFO)
(in thousands, except per share and unit data)
(unaudited)
Three Months Ended
March 31, 2016
Net income (loss) available to common stockholders $ 39,125
Adjustments:
Noncontrolling interests in operating partnership 663
Real estate related depreciation and amortization (1) 166,912
Real estate related depreciation and amortization related to investment inunconsolidated joint ventures 2,803
Gain on sale of properties (1,097)
Gain on settlement of pre-existing relationships with Telx -
FFO available to common stockholders and unitholders $ 208,406
Basic FFO per share and unit $ 1.40
Diluted FFO per share and unit $ 1.39
Weighted average common stock and units outstanding
Basic 149,048
Diluted 149,916
(1) Real estate related depreciation and amortization was computed as follows:
Depreciation and amortization per income statement 169,016
Non-real estate depreciation (2,104)
$ 166,912
Three Months Ended
March 31, 2016
FFO available to common stockholders and unitholders -- basic and diluted $ 208,406
Weighted average common stock and units outstanding 149,048
Add: Effect of dilutive securities 868
Weighted average common stock and units outstanding -- diluted 149,916
Digital Realty Trust, Inc. and Subsidiaries
Reconciliation of Funds From Operations (FFO) to Core Funds From Operations (CFFO)
(in thousands, except per share and unit data)
(unaudited)
Three Months Ended
March 31, 2016
FFO available to common stockholders and unitholders -- diluted $ 208,406
Termination fees and other non-core revenues (3) (91)
Significant transaction expenses 1,900
Loss from early extinguishment of debt 964
Change in fair value of contingent consideration (4) -
Severance accrual and equity acceleration (5) 1,448
Other non-core expense adjustments (6) (1)
CFFO available to common stockholders and unitholders -- diluted $ 212,626
Diluted CFFO per share and unit $ 1.42
(3) Includes one-time fees, proceeds and certain other adjustments that are not core to our business.
(4) Relates to earn-out contingency in connection with Sentrum Portfolio acquisition.
(5) Relates to severance charges related to the departure of company executives.
(6) Includes reversal of accruals and certain other adjustments that are not core to our business.

Reconciliation of Non-GAAP Items To Their Closest GAAP Equivalent
20
Digital Realty Trust, Inc. and Subsidiaries
Reconciliation of Net Income Available to Common Stockholders to Earnings Before Interest, Taxes, Depreciation and Amortization (EBITDA) and Adjusted EBITDA
(in thousands)
(unaudited)
Three Months Ended
March 31, 2016
Net income (loss) available to common stockholders $ 39,125
Interest 57,261
Loss from early extinguishment of debt 964
Taxes 2,109
Depreciation and amortization 169,016
EBITDA 268,475
Change in fair value of contingent consideration -
Severance accrual and equity acceleration 1,448
Transactions 1,900
Gain on sale of properties (1,097)
Other non-core expense adjustments (1)
Noncontrolling interests 784
Preferred stock dividends 22,424
Adjusted EBITDA $ 293,933
Digital Realty Trust, Inc. and Subsidiaries
Reconciliation of Same Capital Cash Net Operating Income
(in thousands)
(unaudited)
Three Months Ended
March 31, 2016
Rental revenues $ 213,408
Tenant reimbursements - Utilities 34,147
Tenant reimbursements - Other 17,060
Interconnection and other 1,465
Total Revenue 266,080
Utilities 35,554
Rental property operating 20,433
Repairs & maintenance 16,528
Property taxes 15,782
Insurance 1,522
Total Expenses 89,819
Net Operating Income $ 176,261
Less:
Stabilized straight-line rent $ 2,254
Above and below market rent 2,543
Cash Net Operating Income $ 171,464

Reconciliation of Non-GAAP Items To Their Closest GAAP Equivalent
21
Reconciliation of Core EBITDA(unaudited)
(in thousands)
Net loss (1,705)$
Income tax benefit (86)
Interest expense, net 871
Depreciation & amortization 33,726
EBITDA 32,806$
Plus: Non-Cash Rent 7,762
Plus: Non-Cash Compensation 115
Less: Synergies (2,276)
Core EBITDA 38,408$

Forward-Looking Statements
The information included in this presentation contains forward-looking statements. Such statements are based on management’s beliefs and assumptions made based on information currently available to
management. Such forward-looking statements include statements relating to: our economic outlook; opportunities and strategies, including ROIC, recycling assets and capital, and sources of growth; the
expected effect of foreign currency translation adjustments on our financials; business drivers; sources and uses; our expected development plans and completions, including timing, total square footage, IT
capacity and raised floor space upon completion; expected availability for leasing efforts, sales incentive program, mid-market and colocation initiatives; organizational initiatives; joint venture opportunities;
occupancy and total investment; our expected investment in our properties; our estimated time to stabilization and targeted returns at stabilization of our properties; our expected future acquisitions;
acquisitions strategy; available inventory and development strategy; the signing and commencement of leases, and related rental revenue; lag between signing and commencement of leases; our expected
same store portfolio growth; our expected growth and stabilization of development completions and acquisitions; our expected mark-to-market rates on lease expirations, lease rollovers and expected rental
rate changes; our expected yields on investments; our expectations with respect to capital investments at lease expiration on existing Turn-Key Flex space; barriers to entry; competition; debt maturities;
lease maturities; our expected returns on invested capital; estimated absorption rates; our other expected future financial and other results, and the assumptions underlying such results; our top investment
markets and market opportunities; our ability to access the capital markets; expected time and cost savings to our customers; our customers’ capital investments; our plans and intentions; future data center
utilization, utilization rates, growth rates, trends, supply and demand, and demand drivers; datacenter outsourcing trends; datacenter expansion plans; estimated kW/MW requirements; growth in the
overall Internet infrastructure sector and segments thereof; the replacement cost of our assets; the development costs of our buildings, and lead times; estimated costs for customers to deploy or migrate to
a new data center; capital expenditures; the effect new leases and increases in rental rates will have on our rental revenues and results of operations; lease expiration rates; our ability to borrow funds under
our credit facilities; estimates of the value of our development portfolio; our ability to meet our liquidity needs, including the ability to raise additional capital; credit ratings; capitalization rates, or cap rates,
potential new markets; dividend payments and our dividend policy; projected financial information and covenant metrics; annualized; other forward-looking financial data; leasing expectations; our exposure
to tenants in certain industries; our expectations and underlying assumptions regarding our sensitivity to fluctuations in foreign exchange rates and energy prices; and the sufficiency of our capital to fund
future requirements. You can identify forward-looking statements by the use of forward-looking terminology such as “believes,” “expects,” “may,” “will,” “should,” “seeks,” “approximately,” “intends,”
“plans,” “pro forma,” “estimates” or “anticipates” or the negative of these words and phrases or similar words or phrases which are predictions of or indicate future events or trends and discussions which do
not relate solely to historical matters. Such statements are subject to risks, uncertainties and assumptions, are not guarantees of future performance and may be affected by known and unknown risks,
trends, uncertainties and factors that are beyond our control that may cause actual results to vary materially. Some of the risks and uncertainties include, among others, the following: the impact of current
global economic, credit and market conditions; current local economic conditions in our geographic markets; decreases in information technology spending, including as a result of economic slowdowns or
recession; adverse economic or real estate developments in our industry or the industry sectors that we sell to (including risks relating to decreasing real estate valuations and impairment charges); our
dependence upon significant tenants; bankruptcy or insolvency of a major tenant or a significant number of smaller tenants; defaults on or non-renewal of leases by tenants; our failure to obtain necessary
debt and equity financing; risks associated with using debt to fund our business activities, including re-financing and interest rate risks, our failure to repay debt when due, adverse changes in our credit
ratings or our breach of covenants or other terms contained in our loan facilities and agreements; financial market fluctuations; changes in foreign currency exchange rates; our inability to manage our
growth effectively; difficulty acquiring or operating properties in foreign jurisdictions; our failure to successfully integrate and operate acquired or developed properties or businesses, including Telx; the
suitability for our properties and data center infrastructure, delays or disruptions in connectivity, failure of our physical infrastructure or services or availability of power; risks related to joint venture
investments, including as a result of our lack of control of such investments; delays or unexpected costs in development of properties; decreased rental rates, increased operating costs or increased vacancy
rates; increased competition or available supply of data center space; our inability to successfully develop and lease new properties and development space; difficulties in identifying properties to acquire
and completing acquisitions; our inability to acquire off-market properties; our inability to comply with the rules and regulations applicable to reporting companies; our failure to maintain our status as a
REIT; possible adverse changes to tax laws; restrictions on our ability to engage in certain business activities; environmental uncertainties and risks related to natural disasters; losses in excess of our
insurance coverage; changes in foreign laws and regulations, including those related to taxation and real estate ownership and operation; and changes in local, state and federal regulatory requirements,
including changes in real estate and zoning laws and increases in real property tax rates. The risks described above are not exhaustive, and additional factors could adversely affect our business and financial
performance, including those discussed in our annual report on Form 10-K for the year ended December 31, 2015, as amended, and subsequent filings with the Securities and Exchange Commission. We
expressly disclaim any responsibility to update forward-looking statements, whether as a result of new information, future events or otherwise.
22