diy > perform your own revenue cycle assessment keystone aaham winter meeting march 13, 2013...
TRANSCRIPT

DIY > Perform your own Revenue Cycle Assessment
Keystone AAHAM Winter MeetingMarch 13, 2013
Presented by Mary Carpenter, FACHEInsight Health Partners, LLC
Keystone AAHAM Winter MeetingMarch 13, 2013
Page 2
Before you Start
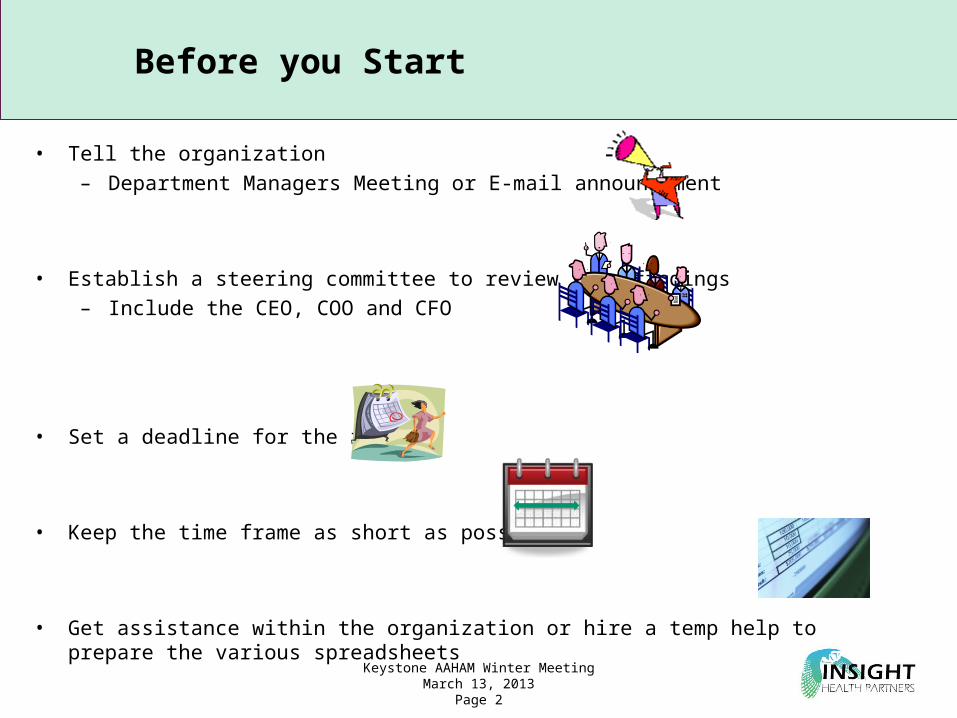
• Tell the organization– Department Managers Meeting or E-mail announcement
• Establish a steering committee to review your findings– Include the CEO, COO and CFO
• Set a deadline for the report
• Keep the time frame as short as possible
• Get assistance within the organization or hire a temp help to prepare the various spreadsheets

Keystone AAHAM Winter MeetingMarch 13, 2013
Page 3
Before you Start
• Data you will need to complete the assessment:– Net and Gross Revenue by month for the prior 12 months– Bad Debt Expense from the P & L by month for the prior 12 months– Volume of patients for the prior 12 month period (or most recent fiscal year end) by
Inpatient, Outpatient and Emergency– Payer mix for most recent month end– Net (from Balance Sheet) and Gross Accounts receivable by month for the prior 12 months– Aged accounts receivable by month for the prior 12 months– Most recent month ending credit balance amount– Charity and Bad Debt write-offs by month for the prior 12 months– Worked FTEs for two recent pay periods that don’t include a holiday– Denials by reason by month for prior 12 months
• Alternative calculation can be performed with Total Gross Charges, Total Cash and Total Adjustments for one month – at least 8 months prior
– Total Point of Service collections total for the prior 12 months– Number of open billed accounts for prior month– Website with the spreadsheets referenced in this presentation:
http://www.insighthp.com/DIYRevCycleAssessment

Keystone AAHAM Winter MeetingMarch 13, 2013
Page 4
Deployment PlanDetailed RecommendationsTimelineOngoing Reporting
Deployment PlanDetailed RecommendationsTimelineOngoing Reporting
DeterminationInvestmentROI
DeterminationInvestmentROI
Step 4:Opportunity Identification & Required Effort Step 4:Opportunity Identification & Required Effort
Indicator presentationComparison with industry benchmarks
Indicator presentationComparison with industry benchmarks
Step 3:KPI & BenchmarkingStep 3:KPI & Benchmarking
Revenue Cycle Assessment: Project Steps

Keystone AAHAM Winter MeetingMarch 13, 2013
Page 5
Patient Access and Pre-arrival Services
Keystone AAHAM Winter MeetingMarch 13, 2013
Page 6
Revenue Cycle > Patient Access & Pre-Arrival Services
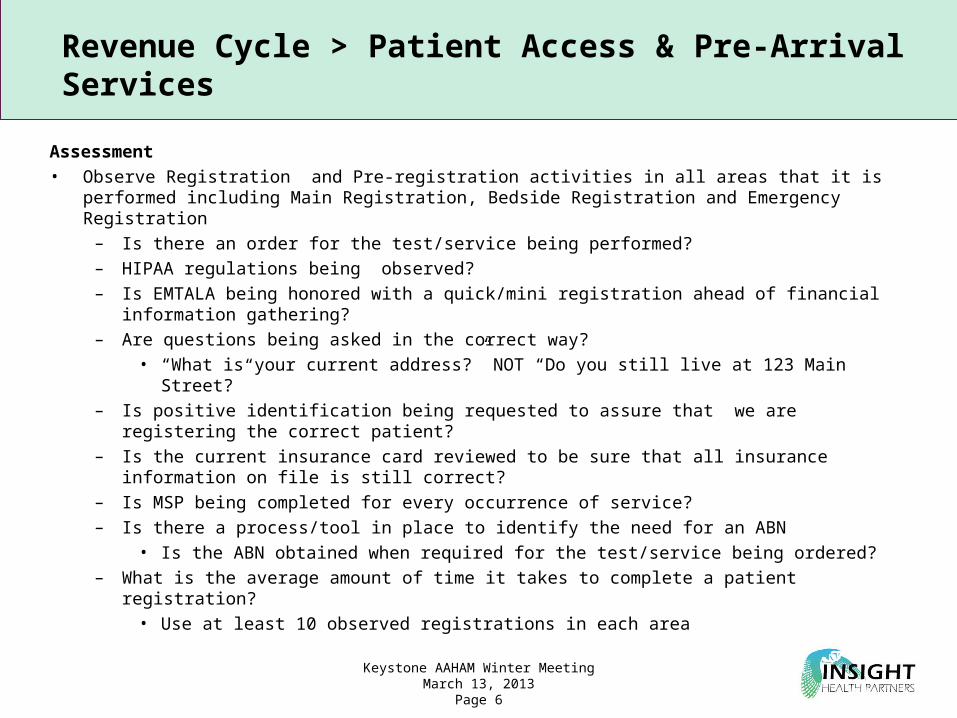
Assessment• Observe Registration and Pre-registration activities in all areas that it is performed including Main
Registration, Bedside Registration and Emergency Registration– Is there an order for the test/service being performed?– HIPAA regulations being observed?– Is EMTALA being honored with a quick/mini registration ahead of financial information gathering?– Are questions being asked in the correct way?
• “What is your current address?” NOT “Do you still live at 123 Main Street?”– Is positive identification being requested to assure that we are registering the correct patient?– Is the current insurance card reviewed to be sure that all insurance information on file is still correct?– Is MSP being completed for every occurrence of service?– Is there a process/tool in place to identify the need for an ABN
• Is the ABN obtained when required for the test/service being ordered?– What is the average amount of time it takes to complete a patient registration?
• Use at least 10 observed registrations in each area

Keystone AAHAM Winter MeetingMarch 13, 2013
Page 7
Revenue Cycle > Patient Access & Pre-Arrival Services
Assessment• Using the Calculation worksheet (DIYRC-Point of Service), identify the potential Point of Service
collections based on your hospital’s volumes and payer mix
• Once you’ve identified the potential, then identify ways to achieve the improved collections like:– Incentive program– Patient Liability estimator– Reporting that identifies payments not collected
POS Collections Opportunity Conservative Aggressive
IP Opportunity 71,867$ 92,401$ OP Opportunity 152,799$ 196,456$ ER Opportunity 177,253$ 227,896$
Total Opportunity $ 401,919 $ 516,752
Possible Time of Service Collections OpportunityPOS Collections Opportunity Conservative Aggressive
Total Possible Opportunity 401,919$ 516,752$ Current POS Collections 18,000$ 18,000$
Total Opportunity $ 383,919 $ 498,752
Keystone AAHAM Winter MeetingMarch 13, 2013
Page 8
Revenue Cycle > Patient Access & Pre-Arrival Services
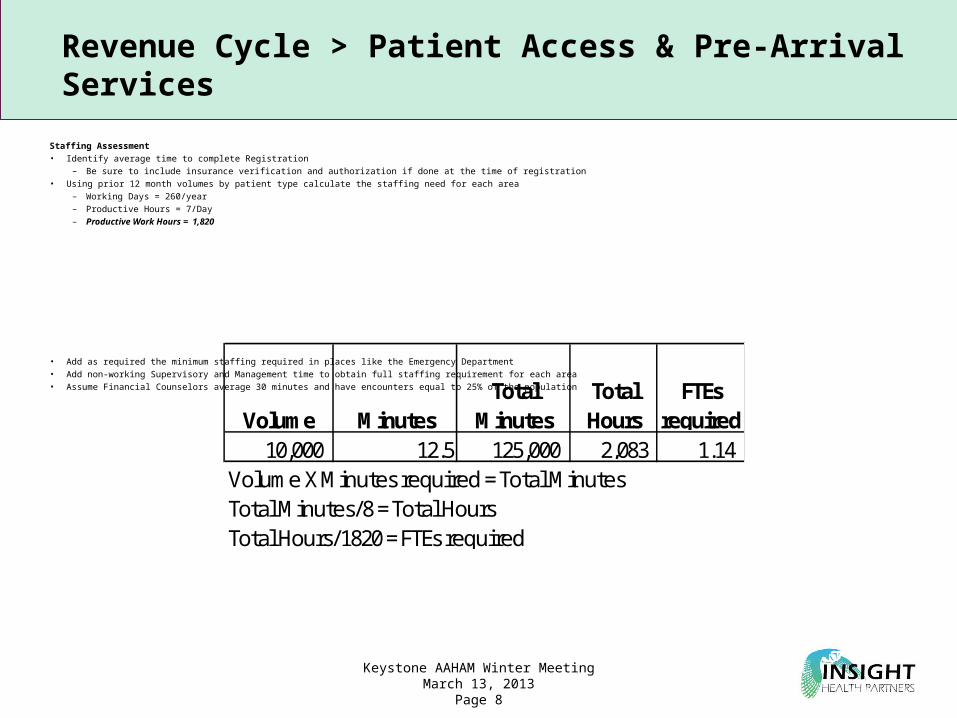
Staffing Assessment• Identify average time to complete Registration
– Be sure to include insurance verification and authorization if done at the time of registration• Using prior 12 month volumes by patient type calculate the staffing need for each area
– Working Days = 260/year– Productive Hours = 7/Day– Productive Work Hours = 1,820
• Add as required the minimum staffing required in places like the Emergency Department• Add non-working Supervisory and Management time to obtain full staffing requirement for each area• Assume Financial Counselors average 30 minutes and have encounters equal to 25% of the population
Volume MinutesTotal
MinutesTotal Hours
FTEs required
10,000 12.5 125,000 2,083 1.14 Volume X Minutes required = Total MinutesTotal Minutes/8 = Total HoursTotal Hours/1820 = FTEs required

Keystone AAHAM Winter MeetingMarch 13, 2013
Page 9
Revenue Cycle > Patient Access & Pre-Arrival Services
Staffing Assessment• Prepare a future state organizational chart if your FTE requirements are different from your current state
Patient AccessDirector1.0 FTE
Patient AccessServices Mgr
1.0 FTE
Pt Access Auth/Reg Mgr.
1.0 FTE
Pt AccessLead
1.0 FTECashier/Financial
Counselor1.0 FTE
FinancialCounselor2.0 FTE
Insurance Authorization
Specialist1.0 FTE
ED PAS Coordinators
16.0 FTE
CentralScheduler4.0 FTE
Main PAS Coordinators
5.0 FTE
Current State
Patient AccessManager1.0 FTE
LeadED
1.0 FTE
Cashier/FinancialCounselor1.0 FTE
Ins AuthSpecialist/FC
1.0
ED PAS Coordinators
10.0 FTE
Main PAS Coordinators
4.0 FTE
Future State
FinancialCounselor1.0 FTE
Cost Center 040172100 33 FTEs Cost Center 040172100 19 FTEs

Keystone AAHAM Winter MeetingMarch 13, 2013
Page 10
Patient Financial Services
Keystone AAHAM Winter MeetingMarch 13, 2013
Page 11
Revenue Cycle > Patient Financial Services
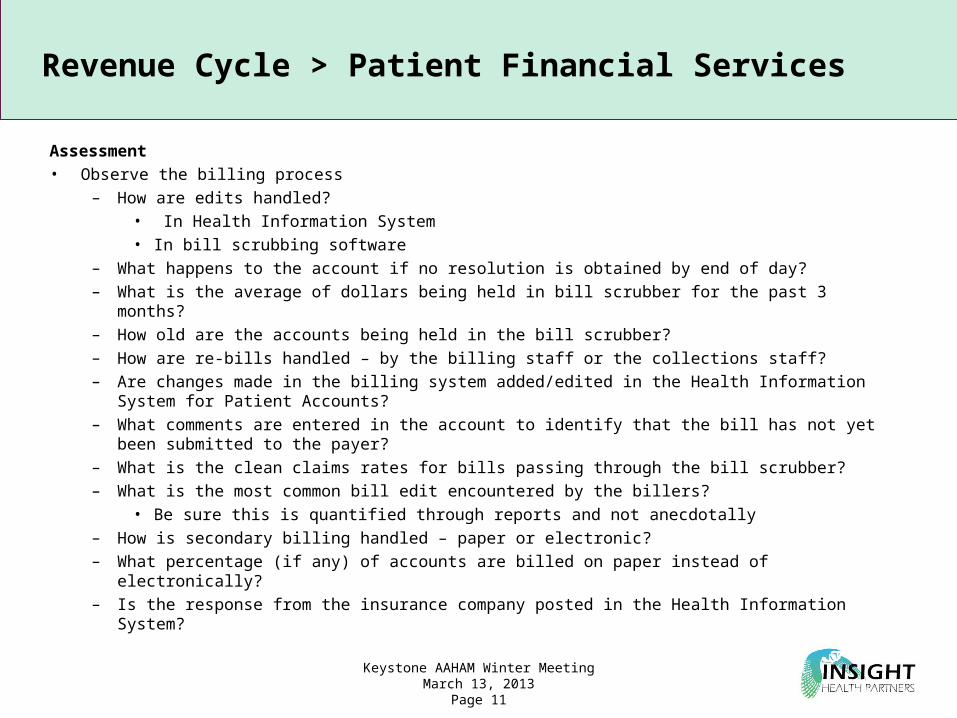
Assessment• Observe the billing process
– How are edits handled?• In Health Information System• In bill scrubbing software
– What happens to the account if no resolution is obtained by end of day?– What is the average of dollars being held in bill scrubber for the past 3 months?– How old are the accounts being held in the bill scrubber?– How are re-bills handled – by the billing staff or the collections staff?– Are changes made in the billing system added/edited in the Health Information System for Patient
Accounts?– What comments are entered in the account to identify that the bill has not yet been submitted to the
payer?– What is the clean claims rates for bills passing through the bill scrubber?– What is the most common bill edit encountered by the billers?
• Be sure this is quantified through reports and not anecdotally– How is secondary billing handled – paper or electronic?– What percentage (if any) of accounts are billed on paper instead of electronically?– Is the response from the insurance company posted in the Health Information System?

Keystone AAHAM Winter MeetingMarch 13, 2013
Page 12
Revenue Cycle > Patient Financial Services
Assessment• Observe the collector process
– Are web sites used appropriately?– When calling to follow up, does the collector overcome objections?
• Using billing data to challenge the assertion that claim in not on file– Does the collector understand the Payer guidelines and timely filing and appeal deadlines?– Does the collector frequently re-bill the insurance company instead of calling?– Are canned comments being used to save time and track productivity?– Are multiple accounts queried with the same payer in the same call?– If faxing additional information, does the collector call back to assure the information was received?– If Medical Records are requested, does the collector ask for specifics about what portion of the
record is required to adjudicate the claim?– If there is a COB issue, does the collector attempt to conference the patient in on the call?– How does the collector prioritize their work?
• Work lists generated automatically?• Accounts worked from list?

Keystone AAHAM Winter MeetingMarch 13, 2013
Page 13
Revenue Cycle > Patient Financial Services
Assessment• Observe the transaction posting process
– What percentage of transaction posting is handled through electronic remittance?– Are transaction posting personnel working transactions by exception or are they working a
remittance?– Are co-pays, coinsurance and deductible being recorded in the account?– Are payment variances routinely identified through the posting process?– How are payment variances and denials communicated to the proper staff?– Are all payments posted by end of business each day?– Does the lockbox provide an electronic remittance file for posting self pay and other payments?– How are credit card payments posted?– What reconciliation process is in place to be sure that payments posted balance with cash receipts
for the day?– How are non-contractual adjustments posted?
• By collection staff?• By transaction team with appropriate approvals?• Combination of these?
– How are small balance adjustments handled?– Are there any automatic adjustments like Bad Debt at certain dollar values?

Keystone AAHAM Winter MeetingMarch 13, 2013
Page 14
Revenue Cycle > Patient Financial Services
Staffing Assessment• Using HARA data is the easiest way to determine adequate staffing• HARA reports are available from Aspen Publishing• Most recent HARA report has the following averages for hospitals:
– 2,582 open accounts per biller– 5,165 open accounts per collector
• Transaction posting staff can be assessed based on percentage of transactions that are manual versus electronic
– Observe and calculate the average time to key individual transactions – Using the minutes methodology described for Patient Access Services, calculate FTEs required for this
function– Using the transaction rejection list, use the minutes methodology described above and calculate the
FTEs require based on volumes

Keystone AAHAM Winter MeetingMarch 13, 2013
Page 15
Revenue Cycle > Dashboard
# Description Jan-12 Feb-12 Mar-12 Apr-12
A/R Days Calculation
1 Gross Revenue 203,154 209,904 219,062 192,309
2 ADR 3 Month 6,865 6,795 6,871 6,903
3 Net Revenue 40,166 42,638
4 ADR 3 Month 1,328 1,338 900 474
Accounts Receivable
5 Accounts Receivable Gross 336,113 333,726 349,130 321,720
6 Gross A/R Days Outstanding 49.0 49.1 50.8 46.6
7 Net Accounts Receivable 47,244 43,272
8 Net A/R Days Outstanding 35.6 32.4 - -
9 Total Discharged, not final billed (incl Outpt) 36,045 38,847 37,787 34,335
10 Total DNFB Days 5.3 5.7 5.5 5.0
11 Billed Accounts Receivable 250,477 248,858 257,028 241,907
12 Billed Accounts Receivable Days 36.5 36.6 37.4 35.0
A/R Aging Dollars
13 Inhouse 49,590 46,020 54,315 45,478
14 Discharged, not final billed 36,045 38,847 37,787 34,335
15 0-30 58,654 53,796 56,802 58,700
16 31-60 35,293 35,095 35,673 30,838
17 61-90 21,761 24,530 27,028 19,612
Total Accounts Receivable 336,113 333,726 349,130 321,720
AR >90 as a percentage of billed AR 53.8% 54.4% 53.5% 54.9%
Cash
23 Patient cash posted on HIS for the month 27,512 28,265 27,600 28,143
24 Cash as a percentage of Gross Revenue (60 day lag) 13.1% 13.3% 13.6% 13.4%
25 Cash as a percentage of Net Revenue (60 day lag) 66.0%
26 Net revenue as a percentage of gross revenue
27 POS Collections 19 22
Other Key Indicators
28 Number of Open Billed Accounts 186,490 187,173 197,142 191,224
29 Credit Balance Dollars 19,656 17,965
30 Credit Balance Days - - 2.86 2.60
Assessment• Using the data you gathered in
advance of the project, enter the data on the dashboard (DIYRC-Dashboard)

Keystone AAHAM Winter MeetingMarch 13, 2013
Page 16
Account Life Cycle
Keystone AAHAM Winter MeetingMarch 13, 2013
Page 17
Revenue Cycle > Account Life Cycle > Unbilled Management
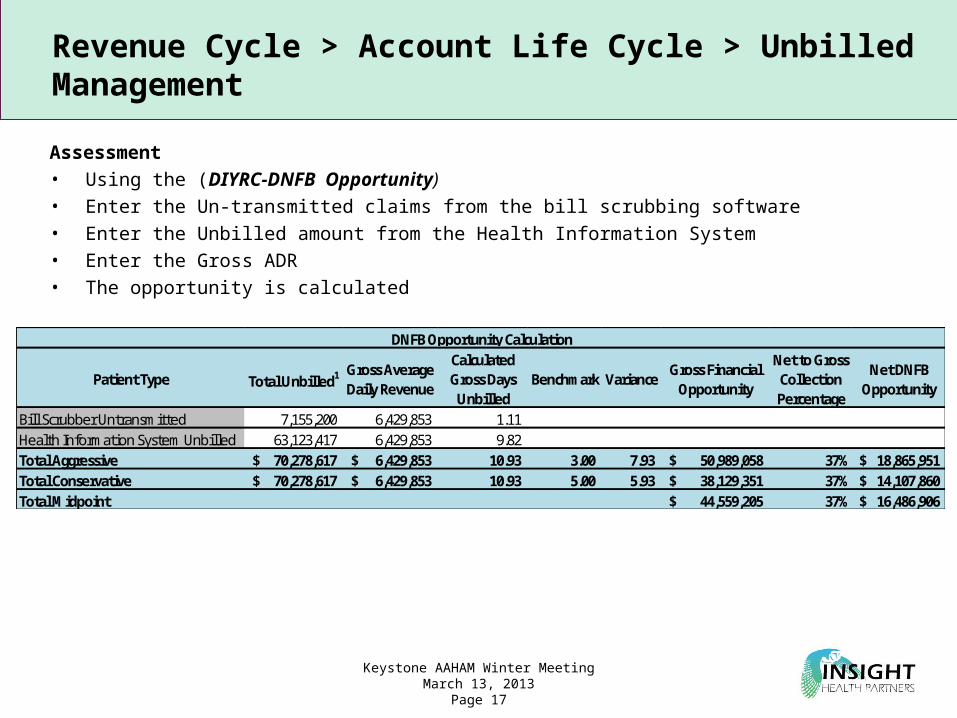
Assessment• Using the (DIYRC-DNFB Opportunity)• Enter the Un-transmitted claims from the bill scrubbing software• Enter the Unbilled amount from the Health Information System• Enter the Gross ADR• The opportunity is calculated
Patient Type Total Unbilled1 Gross Average Daily Revenue
Calculated Gross Days
UnbilledBenchmark Variance
Gross Financial Opportunity
Net to Gross Collection Percentage
Net DNFB Opportunity
Bill Scrubber Untransmitted 7,155,200 6,429,853 1.11 Health Information System Unbilled 63,123,417 6,429,853 9.82 Total Aggressive 70,278,617$ 6,429,853$ 10.93 3.00 7.93 50,989,058$ 37% 18,865,951$ Total Conservative 70,278,617$ 6,429,853$ 10.93 5.00 5.93 38,129,351$ 37% 14,107,860$ Total Midpoint 44,559,205$ 37% 16,486,906$
DNFB Opportunity Calculation

Keystone AAHAM Winter MeetingMarch 13, 2013
Page 18
Revenue Cycle > Account Life Cycle > Follow-Up
Assessment• Enter total Gross Billed AR from dashboard• Enter AR > 90 from the dashboard• Enter the Net to Gross ratio calculated in the dashboard• Be sure to adjust if your billed accounts receivable is in a net state
AR Opportunity Calculation AggressiveTotal Gross Billed AR $14,104,121AR Over 90 (Adj for DNFB) $3,678,128
AR > 90 as % of Total AR 26.08%Benchmark 20.00%% Opportunity 6.08%
Gross $ Opportunity $857,304Net to Gross Factor 37.00%Net Opportunity $317,202Collection Opportunity 60%Net $ Opportunity $190,321Midpoint
Keystone AAHAM Winter MeetingMarch 13, 2013
Page 19
Revenue Cycle > Account Life Cycle > Denials Management
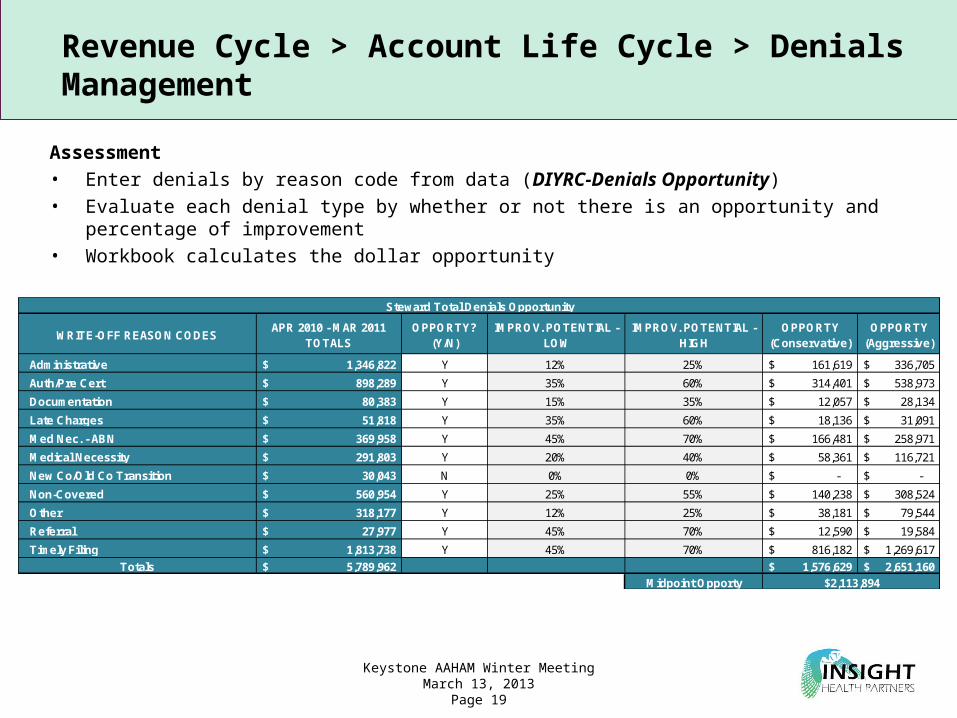
Assessment• Enter denials by reason code from data (DIYRC-Denials Opportunity)• Evaluate each denial type by whether or not there is an opportunity and percentage of improvement• Workbook calculates the dollar opportunity
WRITE-OFF REASON CODESAPR 2010 - MAR 2011
TOTALSOPPORTY?
(Y/N)IMPROV. POTENTIAL -
LOWIMPROV. POTENTIAL -
HIGHOPPORTY
(Conservative)OPPORTY
(Aggressive)
Administrative 1,346,822$ Y 12% 25% 161,619$ 336,705$
Auth/Pre Cert 898,289$ Y 35% 60% 314,401$ 538,973$
Documentation 80,383$ Y 15% 35% 12,057$ 28,134$
Late Charges 51,818$ Y 35% 60% 18,136$ 31,091$
Med Nec. - ABN 369,958$ Y 45% 70% 166,481$ 258,971$
Medical Necessity 291,803$ Y 20% 40% 58,361$ 116,721$
New Co/Old Co Transition 30,043$ N 0% 0% -$ -$
Non-Covered 560,954$ Y 25% 55% 140,238$ 308,524$
Other 318,177$ Y 12% 25% 38,181$ 79,544$
Referral 27,977$ Y 45% 70% 12,590$ 19,584$
Timely Filing 1,813,738$ Y 45% 70% 816,182$ 1,269,617$
Totals 5,789,962$ 1,576,629$ 2,651,160$
Midpoint Opporty $2,113,894
Steward Total Denials Opportunity
Keystone AAHAM Winter MeetingMarch 13, 2013
Page 20
Revenue Cycle > Account Life Cycle > Denials Management
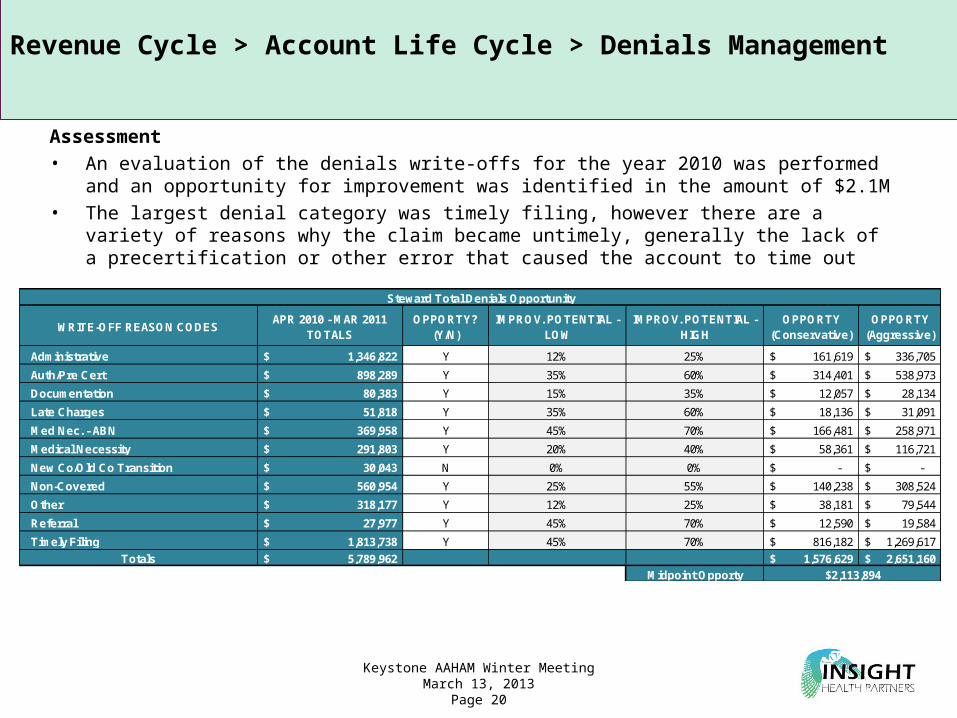
Assessment• An evaluation of the denials write-offs for the year 2010 was performed and an opportunity for
improvement was identified in the amount of $2.1M• The largest denial category was timely filing, however there are a variety of reasons why the claim became
untimely, generally the lack of a precertification or other error that caused the account to time out
WRITE-OFF REASON CODESAPR 2010 - MAR 2011
TOTALSOPPORTY?
(Y/N)IMPROV. POTENTIAL -
LOWIMPROV. POTENTIAL -
HIGHOPPORTY
(Conservative)OPPORTY
(Aggressive)
Administrative 1,346,822$ Y 12% 25% 161,619$ 336,705$
Auth/Pre Cert 898,289$ Y 35% 60% 314,401$ 538,973$
Documentation 80,383$ Y 15% 35% 12,057$ 28,134$
Late Charges 51,818$ Y 35% 60% 18,136$ 31,091$
Med Nec. - ABN 369,958$ Y 45% 70% 166,481$ 258,971$
Medical Necessity 291,803$ Y 20% 40% 58,361$ 116,721$
New Co/Old Co Transition 30,043$ N 0% 0% -$ -$
Non-Covered 560,954$ Y 25% 55% 140,238$ 308,524$
Other 318,177$ Y 12% 25% 38,181$ 79,544$
Referral 27,977$ Y 45% 70% 12,590$ 19,584$
Timely Filing 1,813,738$ Y 45% 70% 816,182$ 1,269,617$
Totals 5,789,962$ 1,576,629$ 2,651,160$
Midpoint Opporty $2,113,894
Steward Total Denials Opportunity