dixy group/media/files/d/dixy/presentations/2016/3q16 fin... · total sg&a expenses 19,973...
TRANSCRIPT
DIXY Group 3Q and 9m 2016 IFRS Results Investors & Analysts Presentation
November 2016
2
Content and liability disclaimer
The information contained in this presentation or enclosed herewith is providedand intended for informational purposes only and should not be relied on for anyinvestment decisions. The information provided in the presentation includesassumptions and financial information on DIXY Group operations and expectationswhich are "indicative". Specifically, some of the 2008-2015 information presentedis taken from the DIXY Group management information system and as such maybe unaudited and may include accruals and estimates. Except for numbers whichcan be traced to the audited Consolidated Financial statements for the yearsended 31 December 2007-2015 the numbers may not have been subjected to anyaudit testing nor have the IFRS policies necessarily been applied to thesenumbers/calculations. All DIXY Group companies information provided in thispresentation is provided on an "as is" basis. DIXY Group believes and has doneeverything within its power to ensure the information is not misleading,nevertheless DIXY Group does not take any responsibility for the accuracy orcompleteness of the information. Likewise, for the forward looking informationprovided, these are based upon the DIXY Group management high level, longerterm views and not on detailed budgeting or forecasting principles. Theaddressees of the presentation should not take these numbers as the true andaccurate numbers and as such not disseminate, or refer to these numbers for anypurpose other than for the purpose they were given, namely for informationalpurpose. A person who uses the information contained in this presentation doesso at his/her own risk.
3
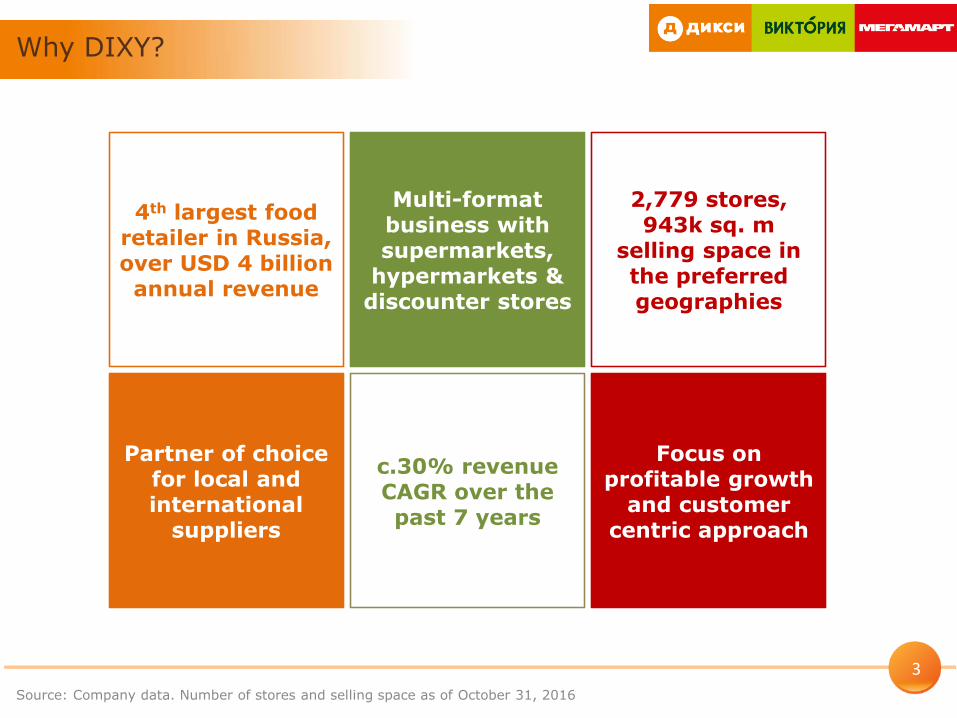
Source: Company data. Number of stores and selling space as of October 31, 2016
Why DIXY?
4th largest food retailer in Russia,over USD 4 billion annual revenue
Multi-format business with supermarkets,
hypermarkets & discounter stores
Focus on profitable growth
and customer centric approach
c.30% revenue CAGR over the past 7 years
2,779 stores, 943k sq. m
selling space in the preferred geographies
Partner of choice for local and international
suppliers
4
DIXY Group Q3 & 9m 2016 Financials
5
Source: Company data
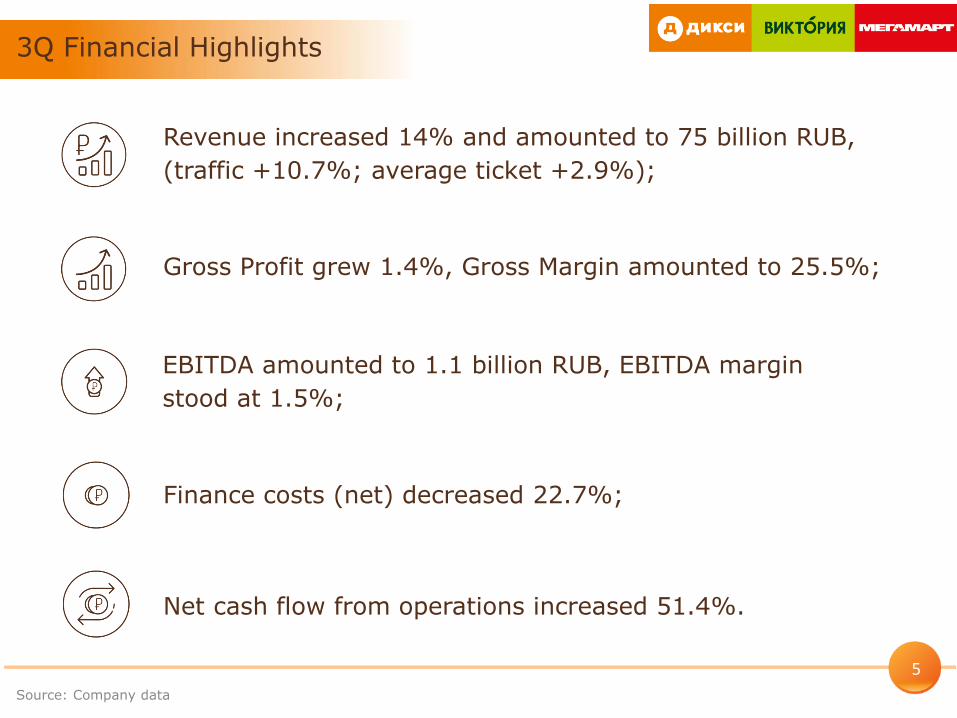
3Q Financial Highlights
Net cash flow from operations increased 51.4%.
Revenue increased 14% and amounted to 75 billion RUB,
(traffic +10.7%; average ticket +2.9%);
Gross Profit grew 1.4%, Gross Margin amounted to 25.5%;
EBITDA amounted to 1.1 billion RUB, EBITDA margin
stood at 1.5%;
Finance costs (net) decreased 22.7%;
6
Source: Company data
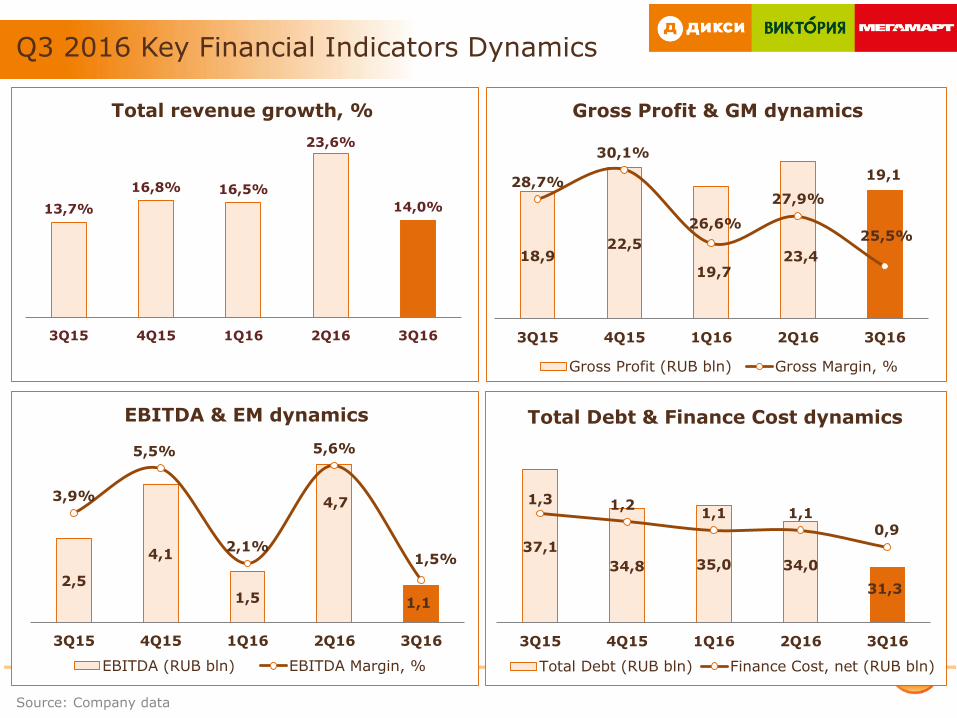
Q3 2016 Key Financial Indicators Dynamics
Gross Profit & GM dynamicsTotal revenue growth, %
18,922,5
19,723,4
19,128,7%
30,1%
26,6%
27,9%
25,5%
3Q15 4Q15 1Q16 2Q16 3Q16
Gross Profit (RUB bln) Gross Margin, %
13,7%
16,8% 16,5%
23,6%
14,0%
3Q15 4Q15 1Q16 2Q16 3Q16
EBITDA & EM dynamics
2,5
4,1
1,5
4,7
1,1
3,9%
5,5%
2,1%
5,6%
1,5%
3Q15 4Q15 1Q16 2Q16 3Q16
EBITDA (RUB bln) EBITDA Margin, %
Total Debt & Finance Cost dynamics
37,1
34,8 35,0 34,0
31,3
1,3 1,21,1 1,1
0,9
3Q15 4Q15 1Q16 2Q16 3Q16
Total Debt (RUB bln) Finance Cost, net (RUB bln)
7
Source: Company data
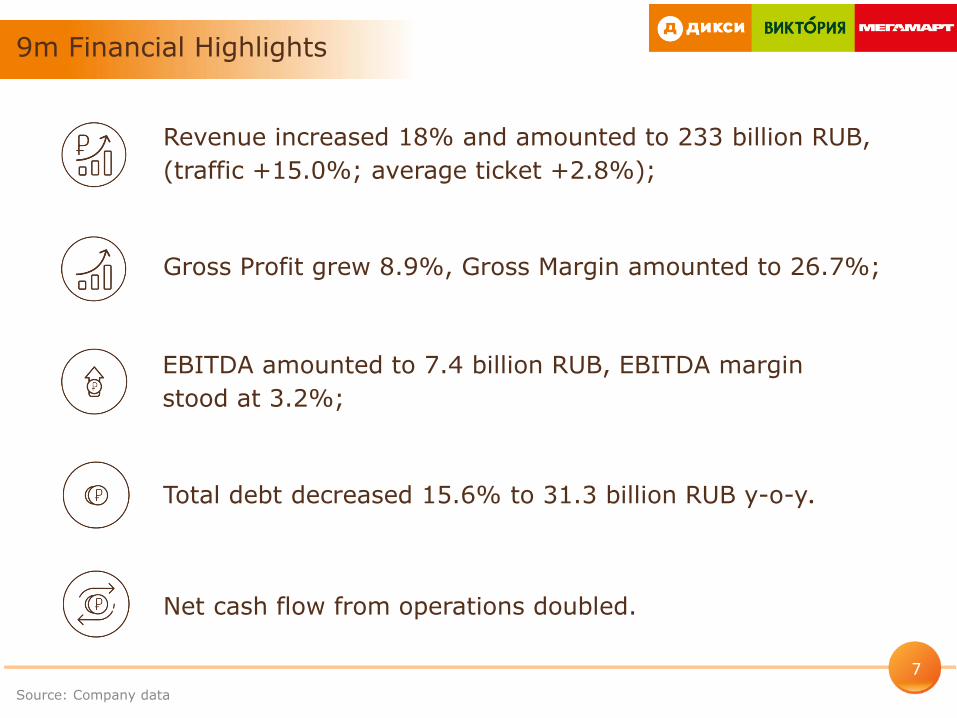
9m Financial Highlights
Net cash flow from operations doubled.
Revenue increased 18% and amounted to 233 billion RUB,
(traffic +15.0%; average ticket +2.8%);
Gross Profit grew 8.9%, Gross Margin amounted to 26.7%;
EBITDA amounted to 7.4 billion RUB, EBITDA margin
stood at 3.2%;
Total debt decreased 15.6% to 31.3 billion RUB y-o-y.
8
Source: Company data
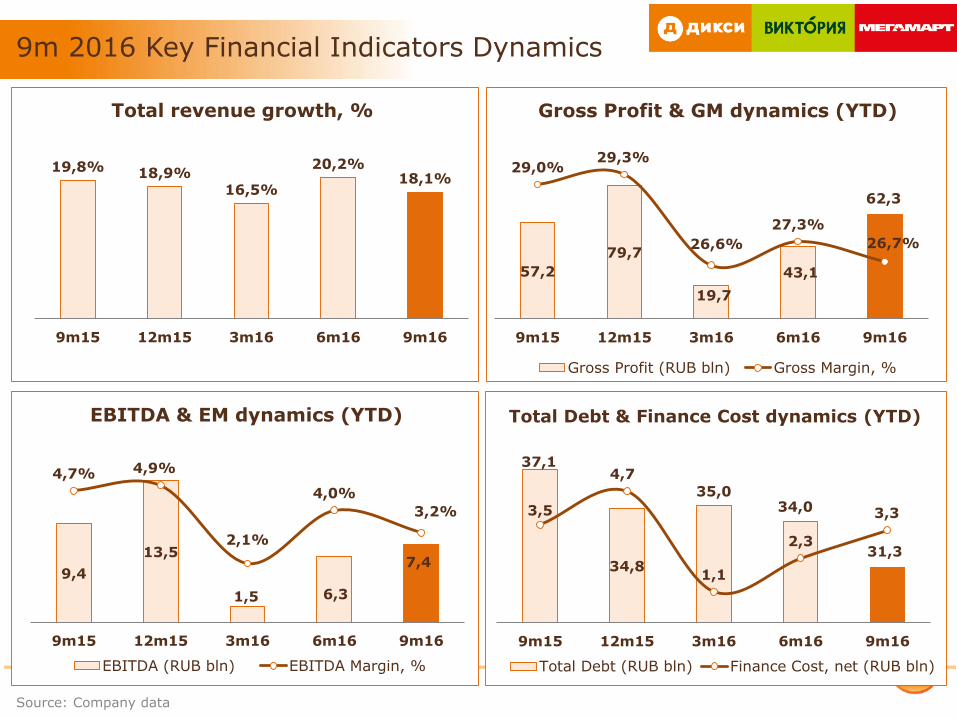
Gross Profit & GM dynamics (YTD)Total revenue growth, %
57,2
79,7
19,7
43,1
62,3
29,0%29,3%
26,6%
27,3%
26,7%
9m15 12m15 3m16 6m16 9m16
Gross Profit (RUB bln) Gross Margin, %
EBITDA & EM dynamics (YTD)
9,4
13,5
1,5 6,3
7,4
4,7% 4,9%
2,1%
4,0%
3,2%
9m15 12m15 3m16 6m16 9m16
EBITDA (RUB bln) EBITDA Margin, %
Total Debt & Finance Cost dynamics (YTD)
37,1
34,8
35,034,0
31,3
3,5
4,7
1,1
2,3
3,3
9m15 12m15 3m16 6m16 9m16
Total Debt (RUB bln) Finance Cost, net (RUB bln)
19,8% 18,9%16,5%
20,2%18,1%
9m15 12m15 3m16 6m16 9m16
9m 2016 Key Financial Indicators Dynamics
9
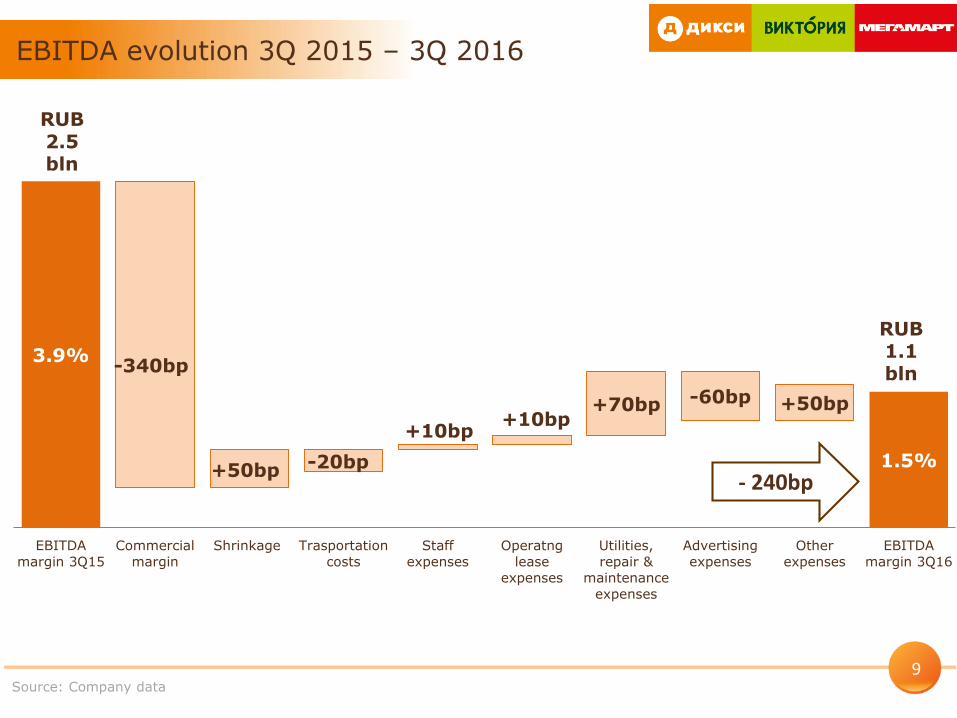
3.9%
0,9%
1.5%
-340bp
+50bp -20bp
+10bp+10bp
+70bp -60bp +50bp
EBITDA
margin 3Q15
Commercial
margin
Shrinkage Trasportation
costs
Staff
expenses
Operatng
lease
expenses
Utilities,
repair &
maintenance
expenses
Advertising
expenses
Other
expenses
EBITDA
margin 3Q16
EBITDA evolution 3Q 2015 – 3Q 2016
Source: Company data
RUB 2.5 bln
RUB 1.1bln
- 240bp
10
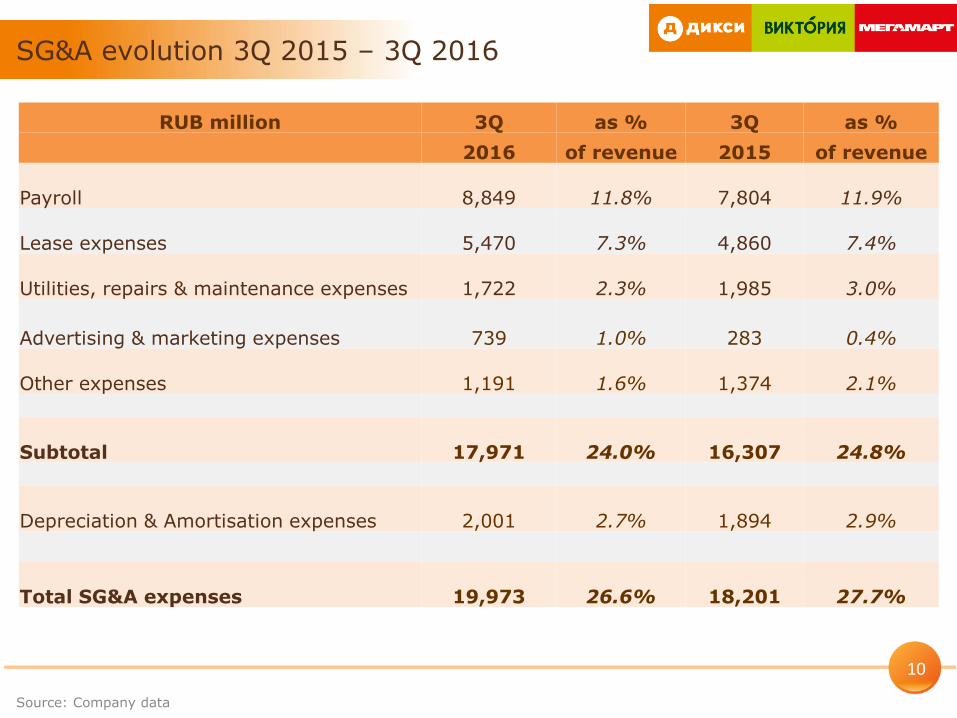
RUB million 3Q as % 3Q as %
2016 of revenue 2015 of revenue
Payroll 8,849 11.8% 7,804 11.9%
Lease expenses 5,470 7.3% 4,860 7.4%
Utilities, repairs & maintenance expenses 1,722 2.3% 1,985 3.0%
Advertising & marketing expenses 739 1.0% 283 0.4%
Other expenses 1,191 1.6% 1,374 2.1%
Subtotal 17,971 24.0% 16,307 24.8%
Depreciation & Amortisation expenses 2,001 2.7% 1,894 2.9%
Total SG&A expenses 19,973 26.6% 18,201 27.7%
SG&A evolution 3Q 2015 – 3Q 2016
Source: Company data
11
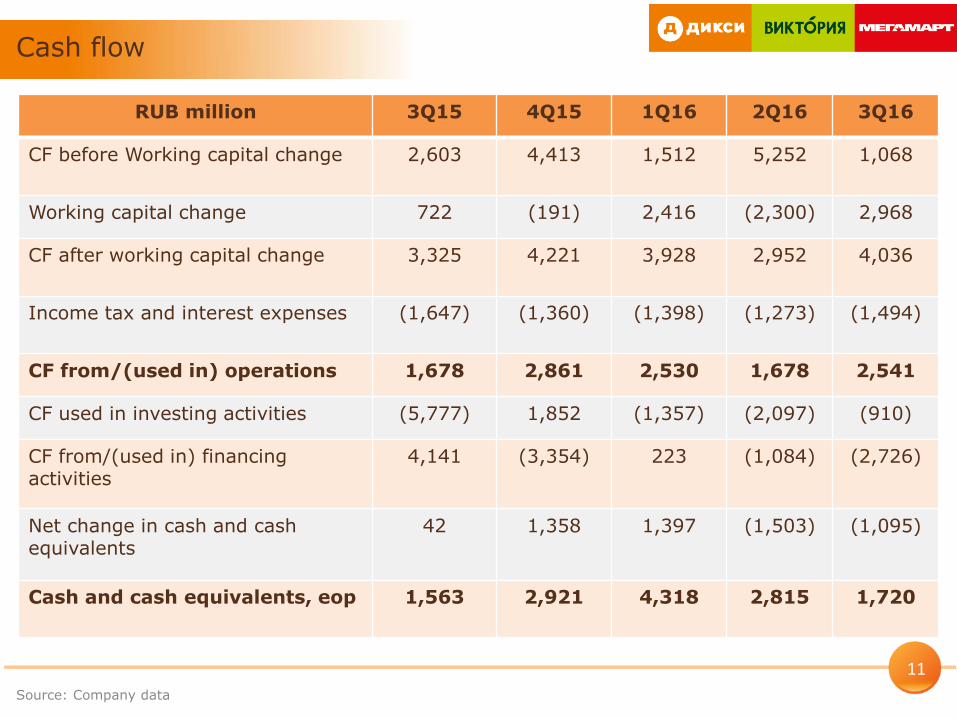
Cash flow
RUB million 3Q15 4Q15 1Q16 2Q16 3Q16
CF before Working capital change 2,603 4,413 1,512 5,252 1,068
Working capital change 722 (191) 2,416 (2,300) 2,968
CF after working capital change 3,325 4,221 3,928 2,952 4,036
Income tax and interest expenses (1,647) (1,360) (1,398) (1,273) (1,494)
CF from/(used in) operations 1,678 2,861 2,530 1,678 2,541
CF used in investing activities (5,777) 1,852 (1,357) (2,097) (910)
CF from/(used in) financing activities
4,141 (3,354) 223 (1,084) (2,726)
Net change in cash and cash equivalents
42 1,358 1,397 (1,503) (1,095)
Cash and cash equivalents, eop 1,563 2,921 4,318 2,815 1,720
Source: Company data
12
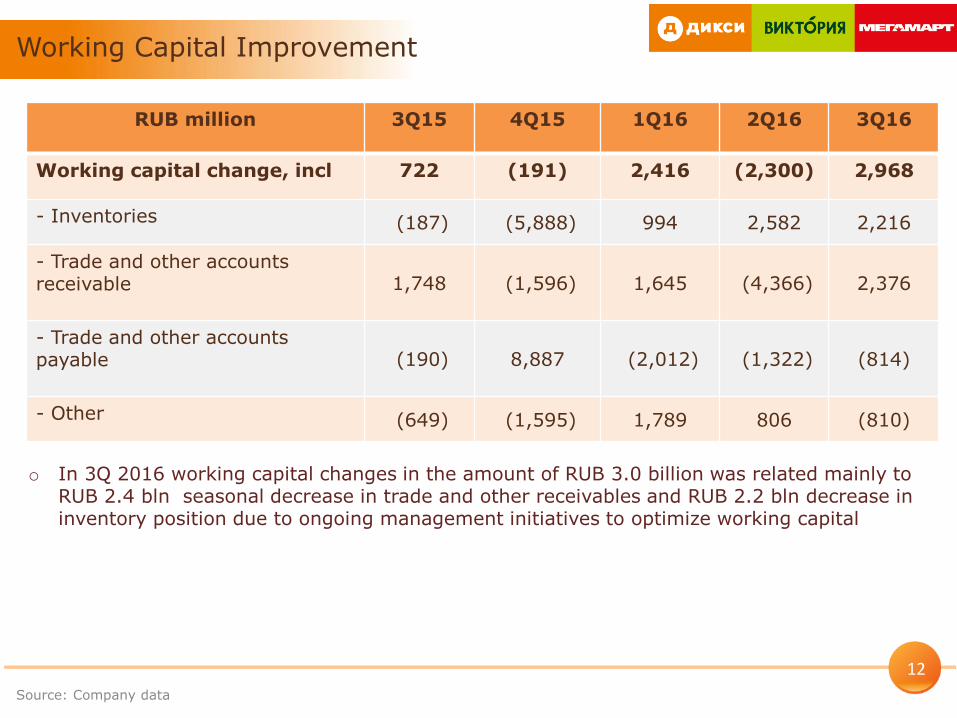
Working Capital Improvement
RUB million 3Q15 4Q15 1Q16 2Q16 3Q16
Working capital change, incl 722 (191) 2,416 (2,300) 2,968
- Inventories (187) (5,888) 994 2,582 2,216
- Trade and other accounts receivable 1,748 (1,596) 1,645 (4,366) 2,376
- Trade and other accounts payable (190) 8,887 (2,012) (1,322) (814)
- Other (649) (1,595) 1,789 806 (810)
Source: Company data
o In 3Q 2016 working capital changes in the amount of RUB 3.0 billion was related mainly to RUB 2.4 bln seasonal decrease in trade and other receivables and RUB 2.2 bln decrease in inventory position due to ongoing management initiatives to optimize working capital
13
Appendix. DIXY Group Historical Financial Data
14
Source: Company data
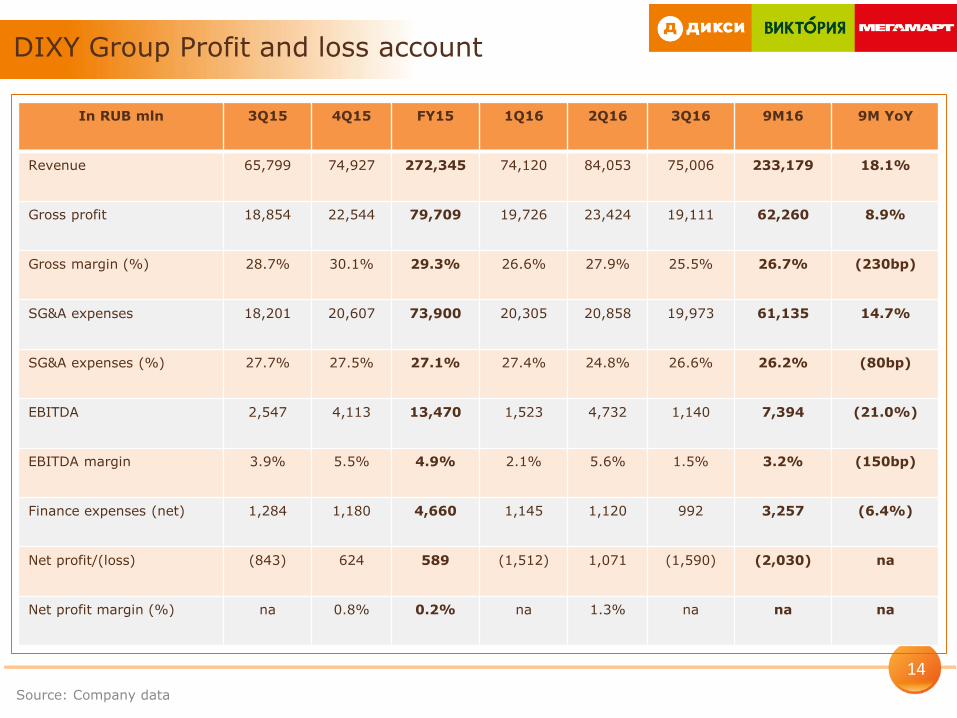
DIXY Group Profit and loss account
In RUB mln 3Q15 4Q15 FY15 1Q16 2Q16 3Q16 9M16 9M YoY
Revenue 65,799 74,927 272,345 74,120 84,053 75,006 233,179 18.1%
Gross profit 18,854 22,544 79,709 19,726 23,424 19,111 62,260 8.9%
Gross margin (%) 28.7% 30.1% 29.3% 26.6% 27.9% 25.5% 26.7% (230bp)
SG&A expenses 18,201 20,607 73,900 20,305 20,858 19,973 61,135 14.7%
SG&A expenses (%) 27.7% 27.5% 27.1% 27.4% 24.8% 26.6% 26.2% (80bp)
EBITDA 2,547 4,113 13,470 1,523 4,732 1,140 7,394 (21.0%)
EBITDA margin 3.9% 5.5% 4.9% 2.1% 5.6% 1.5% 3.2% (150bp)
Finance expenses (net) 1,284 1,180 4,660 1,145 1,120 992 3,257 (6.4%)
Net profit/(loss) (843) 624 589 (1,512) 1,071 (1,590) (2,030) na
Net profit margin (%) na 0.8% 0.2% na 1.3% na na na
15
Source: Company data
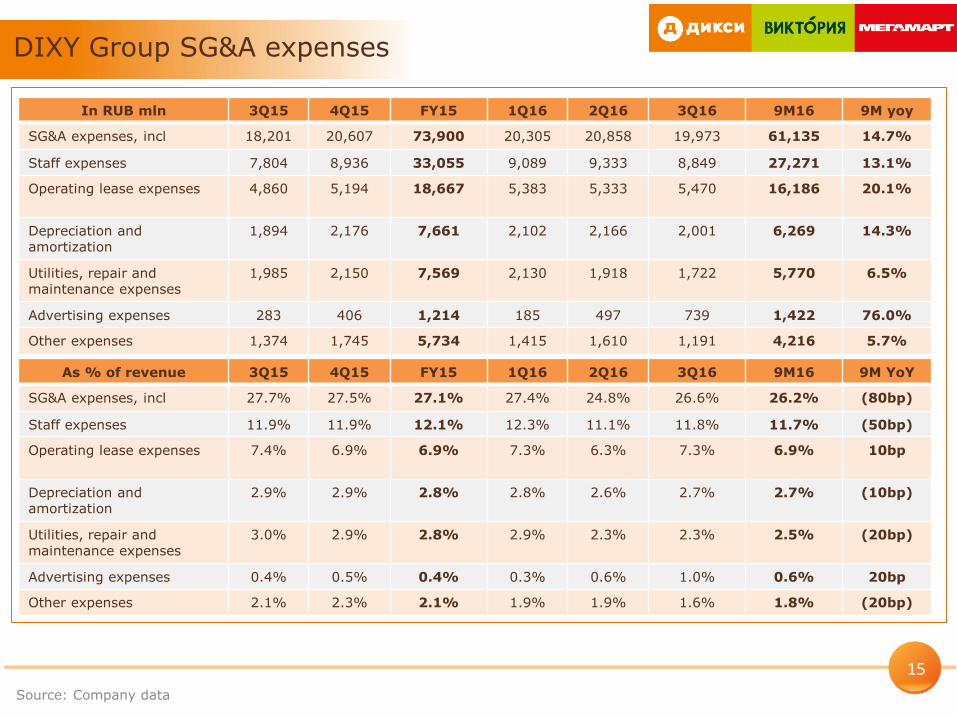
DIXY Group SG&A expenses
In RUB mln 3Q15 4Q15 FY15 1Q16 2Q16 3Q16 9M16 9M yoy
SG&A expenses, incl 18,201 20,607 73,900 20,305 20,858 19,973 61,135 14.7%
Staff expenses 7,804 8,936 33,055 9,089 9,333 8,849 27,271 13.1%
Operating lease expenses 4,860 5,194 18,667 5,383 5,333 5,470 16,186 20.1%
Depreciation and amortization
1,894 2,176 7,661 2,102 2,166 2,001 6,269 14.3%
Utilities, repair and maintenance expenses
1,985 2,150 7,569 2,130 1,918 1,722 5,770 6.5%
Advertising expenses 283 406 1,214 185 497 739 1,422 76.0%
Other expenses 1,374 1,745 5,734 1,415 1,610 1,191 4,216 5.7%
As % of revenue 3Q15 4Q15 FY15 1Q16 2Q16 3Q16 9M16 9M YoY
SG&A expenses, incl 27.7% 27.5% 27.1% 27.4% 24.8% 26.6% 26.2% (80bp)
Staff expenses 11.9% 11.9% 12.1% 12.3% 11.1% 11.8% 11.7% (50bp)
Operating lease expenses 7.4% 6.9% 6.9% 7.3% 6.3% 7.3% 6.9% 10bp
Depreciation and amortization
2.9% 2.9% 2.8% 2.8% 2.6% 2.7% 2.7% (10bp)
Utilities, repair and maintenance expenses
3.0% 2.9% 2.8% 2.9% 2.3% 2.3% 2.5% (20bp)
Advertising expenses 0.4% 0.5% 0.4% 0.3% 0.6% 1.0% 0.6% 20bp
Other expenses 2.1% 2.3% 2.1% 1.9% 1.9% 1.6% 1.8% (20bp)

For investor relations purposes, please contact:Denis Davydov, Head of IR
T: + 7 (495) 223-3337 ext. 2135Irina Karacharskova, Senior IR manager
T: + 7 (495) 223-3337 ext. 2146Email: [email protected]