division of inspection services · pdf file5 inspection services annual report . division of...
TRANSCRIPT

Division of Inspection Services 2009 Annual Report
Inspection Services Annual Report 0

1 Inspection Services Annual Report

Acknowledgments
The following individuals contributed to this publication (in alphabetical order): Amadou Ba
Amel Clifford
Asif Maan
Avnee Jivabhai
Charles Goodman
Christina Burnie
Edward Hard
Eddy Zhou
Elaine Wong
Erica Jue
Inge Biggs
Jenna Areias
Kevin Richardson
Kiley Mason
Lisa Gonzales
Natalie Krout-Greenberg
Nirmal Saini
Rick Jensen
Roland Carlson
Sarva Gunjur
Stan Kobata
Steve Patton
Steve Siegel
Thea Lee
Tiffany Tu
Tony Herrera
Special thanks to all CAC staff Compiled By: Cristina Arrizón
Division of Inspection Services 2009 Annual Report Arnold Schwarzenegger, Governor A.G. Kawamura, Secretary Published by the California Department of Food and Agriculture Sacramento, CA 95814
Inspection Services Annual Report 2

3 Inspection Services Annual Report
Table of Contents
TABLE OF CONTENTS
Page 4 Mission Statement Page 5 Executive Summary Pages 8-9 Center for Analytical Chemistry (CAC) Program Summary Past Challenges and Future Goals Pages 9-10 Highlights and Community Outreach Pages 10-12 Pesticide Residue Laboratories Detected Pesticide in Surveillance Samples County Investigative Samples Page 13 Dairy Chemistry Laboratory Pages 14-15 USDA-Pesticide Data Program Pages 15-16 Quality Assurance Unit Pages 16-17 Environmental Safety Laboratory Page 17 Worker Health & Safety Page 19 Feed & Fertilizer / Product Compliance Pages 20-21 CDFA Programs: Integrated Pest Control (IPC) and Pests Detection & Emergency Projects (PDEP) Page 21 Accomplishments for 2009
Page 23 Feed, Fertilizers, Livestock Drugs, and Egg Regulatory Services
Pages 24-29 Feed and Livestock Drugs Inspection Programs Pages 29-30 Safe Animal Feed Education Program Pages 31-36 Fertilizing Materials Inspection Program Pages 36-40 Fertilizer Research and Education Program Pages 40-43 Shell Egg Quality Control Program Page 45 Inspection and Compliance
Pages 46-47 Shipping Point Inspection Program Page 48 Standardization Program Page 49 Avocado Inspection Program

Pages 50-51 Direct Marketing Program (Certified Farmers Market Program)
Page 52 Citrus Program Pages 53-54 California Organic Program Pages 56-58 Office of Pesticide Consultation & Analysis
Page 56-57 Program Summary, Trends/Issues from 2009 Page 58 Accomplishments for 2009 Pages 59-60 Phone Directory
Page 59 Retirements
Inspection Services Annual Report 4

5 Inspection Services Annual Report
Division of Inspection Services Mission Statement To provide professional services that support and contribute to a safe,
abundant, quality food supply; environmentally sound agricultural practices; and an equitable marketplace for California agriculture.

Executive Summary
In 2009, the Division used the strategic planning process to enhance program activities and identify future program direction. Representatives from industry as well as local, state, and federal government officials provided input to this process. This process allowed for operational clarity and transparency for all programs. As a result, each of the Division’s branches has begun the process of restructuring at both the branch and program levels. For example, one of the major results of the restructuring was the emergence of the Office of Pesticide Consultation & Analysis (OPCA). Formerly attached to CDFA’s executive office, OPCA was relocated within the Inspection Division in May 2009. Each program now has dedicated supervisors and field staff to focus solely on each of the functions, which has increased the programs’ capability. Restructuring has provided the opportunity for the Division’s programs to enhance their outreach and education efforts to both clients and colleagues outside of the Department. This included opportunities for clients to attend various workshops and training sessions. The programs also allowed colleagues from outside of California to work closely with staff to learn more about the Division’s operations as well as policies and procedures related to various projects.
THE DIVISION FULFILLS ITS MISSION BY PROVIDING THE FOLLOWING SERVICES:
• Inspect fruits, vegetables and nuts to ensure that maturity, grade, size, weight, packaging and labeling meet the consumers’ quality expectations.
• Conduct chemical analysis in support of food and environmental safety.
• Perform verification audits to ensure good handling and agricultural practices are used to contribute to a safe food supply.
• Ensure fertilizer, animal feed, and livestock drugs are safe and effective, and meet the quality and quantity guaranteed by the manufacturer. This helps prevent toxins and contaminants from entering the food chain.
• Monitor the marketplace to provide California consumers with eggs that are
wholesome, properly labeled, refrigerated, and of established quality while maintaining fair and equitable marketing standards in the California egg industry.
• Enforcement of provisions of the law that govern certified farmers’ markets and the sale of foods labeled as organic.
• OPCA’s role is to consult with the Department of Pesticide Regulation (DPR) on new pesticide rulemakings prior to public notice.
The strategic planning committee, along with the efforts of various programs, identified the need for additional regulations throughout the programs. With the recommendation by the committees, staff has begun to develop needed regulations to provide consistent and fair enforcement to the agricultural industry. In 2009, the Division has provided additional enforcement throughout its programs to ensure its customers the highest level of service. This included an increase in audits and random inspections by staff. Additionally, the Division continues to examine the structure of its programs and make required adjustments to meet future challenges.
Inspection Services Annual Report 6

7 Inspection Services Annual Report

PROGRAM SUMMARY The mission of the Center for Analytical Chemistry (CAC) is to provide impartial, timely, accurate, and cost effective analytical services. The CAC supports regulatory and research agencies in their enforcement activities and studies. CAC’s stakeholders and clients include the US Department of Agriculture (USDA), the Environmental Protection Agency (EPA), the California Department of Pesticide Regulation (CDPR), the Department of Boating and Waterways, the Food Emergency Response Network (FERN) and various programs within CDFA such as the Feed, Fertilizer, Livestock Drugs, and Egg Regulatory Services Branch (FFLDERS), the Organic Program, the Millfeed program and the Animal Health and Food Safety Services division. The CAC is a state of the art chemistry laboratory facility comprising of two main sections, Food Safety and Environmental Safety, with laboratories located in Sacramento and Anaheim. The Center also has an independent
Quality Assurance unit that is responsible for the Center’s Quality Management System and to monitor the Center’s continuing performance. We are ISO-17025:2005 accredited by the American Association for Laboratory Accreditation (A2LA) organization.
Center for Analytical Chemistry
To establish and maintain stakeholders’ confidence in the quality of our services, our staff continually receives training from experts in the field. In the past year, the CAC has hosted many workshops and seminars offered by representatives from instrument manufacturers and vendors. These seminars are invaluable as staff is exposed to the latest advances in analytical instrumentation. In addition to striving to remain technically current, the CAC also keeps abreast of environmental issues that affect our client’s missions to ensure the program’s relevance. The Center has offered the facility as a forum for stakeholders and organizations to discuss issues concerning industry’s evolving needs and how the CAC can adapt to deal with these challenges.
PAST CHALLENGES AND FUTURE GOALS The CAC faces many challenges such as reduction in workforce and funding. To maintain the same level of quality service, the Center recognizes the need to constantly improve program efficiency. The CAC’s laboratories have made improvements to analytical methods to conserve resources and increase production while improving quality of results. The USDA-Pesticide Data Program (USDA-PDP) laboratory successfully transitioned to a QUick, Easy, CHEap, Rugged, and Safe (QuEChERS) extraction method that
uses 85% less solvent, reduces waste by 90%, reduces extraction time by 70% and results in a 30% cost saving. In tandem with the extraction method change, the analysis method was significantly improved by taking advantage of a software upgrade to decrease assay time and increase capacity of the LiquidChromatography Mass spectrometry (LCMS) analysis. With the furloughs, it was challenging to complete projects in a timely manner. The center modified operational
Inspection Services Annual Report 8
9 Inspection Services Annual Report
protocols in order to handle the workload with the reduced work hours. Samples batch size was increased, and research was conducted to improve analytical method efficiency. Our plan for the future is to employ advanced technology in instrumentation
and data processing to streamline operation and enhance the quality of results. We will also work with instrument manufacturers and software developers to ensure that new products enhance our system performance.
HIGHLIGHTS AND COMMUNITY OUTREACH The CAC has an aggressive community outreach program. Our employees participated in various educational programs, such as being judges for a science fair at a local elementary school or invited speakers at local colleges. The Center also hosted many meetings and workshops as well as conducting tours of the Center for foreign delegations. The objective of these events is to exchange ideas and share experiences.
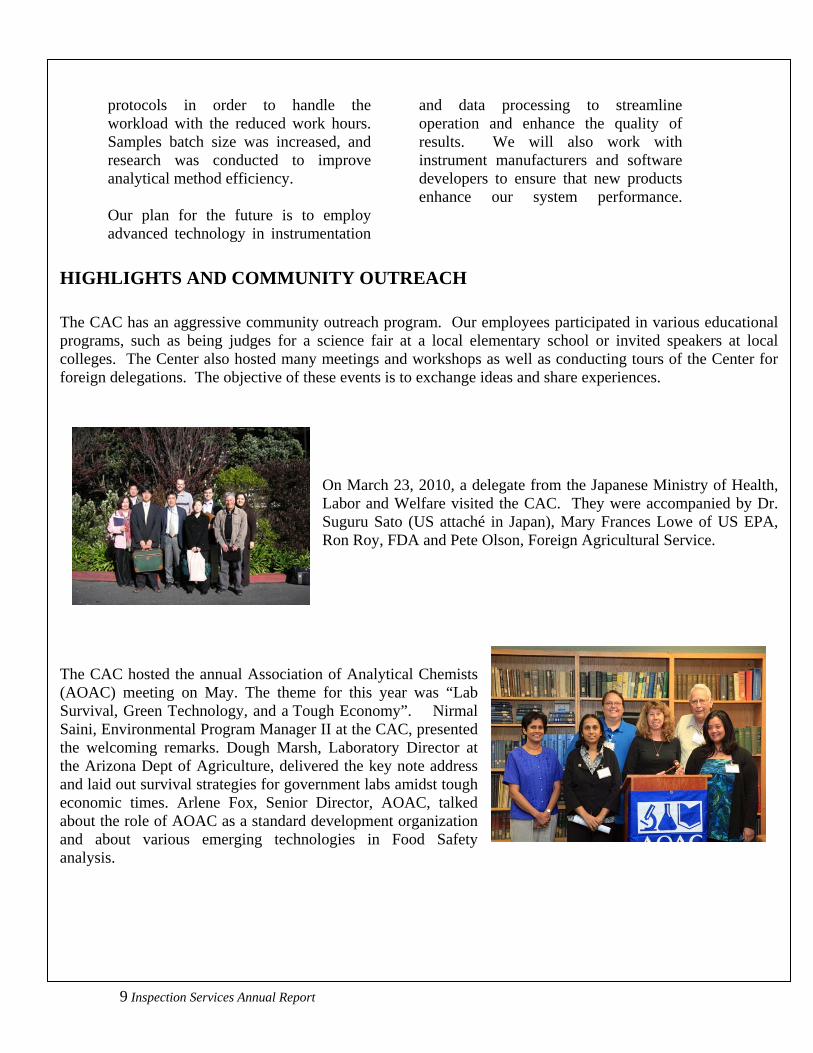
On March 23, 2010, a delegate from the Japanese Ministry of Health, Labor and Welfare visited the CAC. They were accompanied by Dr. Suguru Sato (US attaché in Japan), Mary Frances Lowe of US EPA, Ron Roy, FDA and Pete Olson, Foreign Agricultural Service.
The CAC hosted the annual Association of Analytical Chemists (AOAC) meeting on May. The theme for this year was “Lab Survival, Green Technology, and a Tough Economy”. Nirmal Saini, Environmental Program Manager II at the CAC, presented the welcoming remarks. Dough Marsh, Laboratory Director at the Arizona Dept of Agriculture, delivered the key note address and laid out survival strategies for government labs amidst tough economic times. Arlene Fox, Senior Director, AOAC, talked about the role of AOAC as a standard development organization and about various emerging technologies in Food Safety analysis.

The CAC, together with Thermo Fisher Scientific, conducted a tour of the laboratory for a delegation from the Beijing Municipal Import & Export Bureau. The visitors represented top level management of the organization. They were interested in the CDFA organizational structure and CAC’s Food Safety program.
The CAC has been actively taking part in the annual State Scientist Day events. This year’s theme was "Discover Science!”. The goal of these events is to promote science education and encourage students to explore a career in science.
The CAC was one of the recipients of the Home Land Security Fund this year. The much needed funding was used to purchase both a gas and a liquid chromatograph each interfaced with tandem mass spectrometers for the Anaheim Pesticide Residue (PR) laboratory. These two pieces of instruments allowed Anaheim lab to develop its own LCMSMS and GCMSMS analytical methodologies that would enhance the lab’s capacity to monitor for chemical contaminants in food.
Pesticide Residue Laboratories
The Pesticide Residue (PR) laboratories in the Food Safety section CAC assists the growers, the County Agricultural Commissioners and the State regulatory agencies by providing agrochemical analyses on food and environmental samples. In the State Residue Monitoring (SRM) program, PR laboratories perform chemical analyses on produce in the channels of trade to ensure compliance with US-EPA tolerance regulation, assure the quality of the food supply and collect data for dietary risk assessment. Additionally, PR laboratories assist the California county agricultural commissioners in investigations of pesticide drifts and illness related to pesticides misuse in the County Investigative (CI) program. In 2009, PR laboratories analyzed 3439 market surveillance samples of more than 180 different commodities in the SRM program and 516 samples of more than 30 different matrices in the CI program. Of the surveillance samples, only 3% were found to have violation. Of these violative samples, 82% were imported products.
.
Inspection Services Annual Report 10

11 Inspection Services Annual Report
0 20 40 60 80 100 120 140 160 180
478
220
32
1734
11642
25
8512
869
145
320
1712
126
13
150
251
1701
276
45
134
1112
391
213
3219
4465
15
2124
17
36121
46111
2857
413
37334
145
ACEPHATE
ALDICARB …
AZOXYSTROBIN
BIFENTHRIN
CAPTAN
CARBOFURAN
CHLOROTHALONIL
CHLORPYRIFOS
CLOTHIANIDIN
CYPHENOTHRIN
DDE
DELTAMETHRIN
DICLORAN
DIELDRIN
DIMETHOATE
DINOTEFURAN
ENDOSULFAN II
ESFENVALERATE
FENAMIDONE
FENAMIPHOS …
FENTHION
FLONICAMID
IMAZALIL
IMIDACLOPRID
IPRODIONE
MALATHION
METHANOL
METHOMYL
METHYL …
PERMETHRIN
PHORATE …
PHOSMET
PROFENOFOS
PYRACLOSTROBIN
QUINOXYFEN
SPINOSAD
THIABENDAZOLE, …
TRIADIMEFON
TRIFLOXYSTROBIN
D e tected Pesticide inSurveillance Samples
Surveillance Samples
Of the total market surveillance samples
tested in 2009, about 55 % were domestic, 42 % were imported and the rest were of
undetermined origin
The findings of the Residue Monitoring Program have been consistent over the years: the majority of produce samples have had no
pesticide residues detected
PR laboratories’ data show the overall safety of produce grown and consumed in California
Of the 74 pesticides detected, Endosulfan is
the most commonly found
Beginning in August, Sacramento PR laboratory started a Liquid Chromatography- Mass Spectrometry (LCMS) screen on two commodities as a pilot study in collaboration with the Department of Pesticide Regulation (DPR). The LCMS analysis expands the regular multi-residue method (MRS) screen list by adding 50 more recently-registered pesticides that are not amenable to traditional detection system currently used in the MRS. The LCMS pilot project will continue with new commodities to ensure its success. Anaheim PR staff is getting trained on the new screen and the laboratory will implement the LCMS screen as part of its procedure.

County Investigative Samples In 2009, thirty counties in California sent a total of 516 samples to PR laboratories to test for 749 analyses on more than 30 different types of matrices. The majority of these samples are for drift investigations. The most requested analysis was Oxyflourfen herbicide. The most common type of samples sent was swabs.
MRS Screen
Chlorpyrifos, 44
Fenthion, 32
Oxyflourfen, 54
Pendimethalin, 46
Sulfur, 46
Almond leaves, 18
FOLIAGE, 200
Soil, 27
SWAB, 178
ALMOND ALMOND LEAVE APPLE BAITBEE CARROT CELERY CLOTHCLOTHING CONCENTRATE FOLIAGE GRASSHAY LEAVES LETTUCE LIQUIDMINERAL MIX OAT ONION ORANGEPANTS PAPER PISTACHIO FOLIAGE PLANT MATERIALPRUNE SHIRT SOIL SWABSWEATSHIRT TANK MIX TOMATO FOLIAGE WATERWEED WHEAT
Beside the new screen in the SRM program, labs also made many modifications to the single analyses methods in the CI program to utilize the LCMS instrument which gives unequivocal identification of targeted chemicals of interest. Our goal for the future is to move away from selective detector instrumentations and start using mass spectrometry detectors as screening tools. Both gas and liquid chromatograph mass spec instruments will expand laboratories’ technical capability and strengthen program’s ability to monitor for a wide range of new pesticides.
Inspection Services Annual Report 12
13 Inspection Services Annual Report
Dairy Chemistry Laboratory
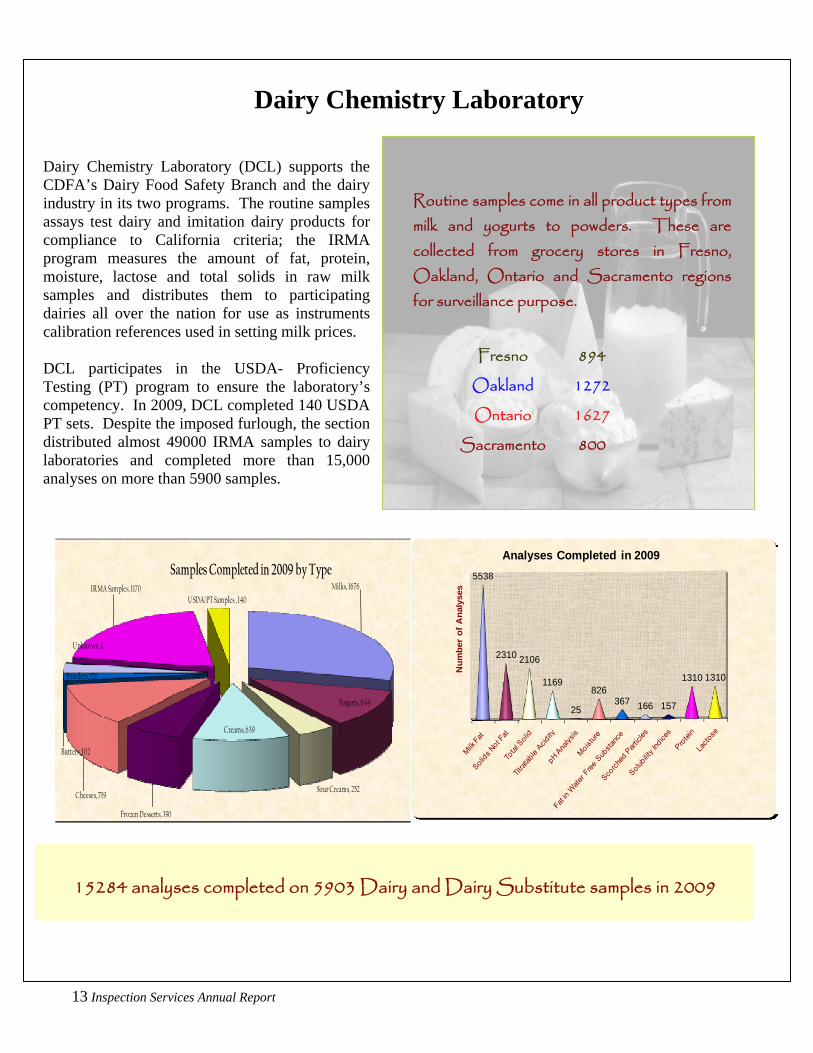
Dairy Chemistry Laboratory (DCL) supports the CDFA’s Dairy Food Safety Branch and the dairy industry in its two programs. The routine samples assays test dairy and imitation dairy products for compliance to California criteria; the IRMA program measures the amount of fat, protein, moisture, lactose and total solids in raw milk samples and distributes them to participating dairies all over the nation for use as instruments calibration references used in setting milk prices. DCL participates in the USDA- Proficiency Testing (PT) program to ensure the laboratory’s competency. In 2009, DCL completed 140 USDA PT sets. Despite the imposed furlough, the section distributed almost 49000 IRMA samples to dairy laboratories and completed more than 15,000 analyses on more than 5900 samples.
Routine samples come in all product types from milk and yogurts to powders. These are collected from grocery stores in Fresno, Oakland, Ontario and Sacramento regions for surveillance purpose.
Fresno 894 Oakland 1272 Ontario 1627
Sacramento 800
Milks, 1676
Yogurts, 644
Sour Creams, 252
Creams, 639
Frozen Desserts, 390
Cheeses, 719
Butters, 102
Powders, 170
Unknown, 1
IRMA Samples, 1170USDA/PT Samples , 140
Samples Completed in 2009 by Type 5538
2310 2106
1169
25
826367 166 157
1310 1310
Analyses Completed in 2009
Num
ber
of A
naly
ses
15284 analyses completed on 5903 Dairy and Dairy Substitute samples in 2009

USDA-Pesticide Data Program
California is one of the participating states in the US Department of Agriculture (USDA) Pesticide Data Program (PDP). PDP was tasked to develop statistically-reliable national data for pesticide residues in foods most likely consumed by children. PDP’s data are used by the Environmental Protection Agency (EPA) in pesticides re-registration activities in accordance with the 1996 Food Quality Protection Act (FQPA). PDP’s data are also used by other governmental agencies and the agricultural community to better understand the relationship of pesticide residues to agriculture practices; enhance integrated pest management and provide information to support the export of U.S. commodities. 2009 began with a challenge for CA-PDP: to validate and implement a completely new extraction procedure in response to the
world wide shortage of acetonitrile (ACN), the solvent used for extraction. The published QuEChERS method was modified to conform to our lab’s current technology, chemicals of interest and commodities. With this new method, ACN usage per sample was decreased from 100mL to 15mL. Generation of solvent waste was greatly reduced. The QuEChERS method also increased efficiency through batch processing of sample sets and decreased variability that resulted from performing multiple extraction and cleanup steps for individual samples. CA – PDP validated over 200 analytes on 11 commodities using this QuEChERS method. The PDP laboratory monitored for 200 pesticides in 2310 samples and performed 530 QA samples in 2009.
60 4618 0
118
19 27 32 22 10 1535
65
12
13913
26
4575 56
93
1537
14
120
0
51 2691
50
8719
5811
64
205
189
28
10
162
25
12
27
12 14
50
114
106 106
22
64
3617
104
133 70 62
27
64
18
94
59
2913
116 14
Acetamiprid
Azoxystrobin
Boscalid
Captan
Chlorproph
am
Cyprod
inil
Diphe
nylamine
Endo
sulfan I
Endo
sulfan II
Endo
sulfan sulfate
Flud
ioxonil
Imazalil
Imidacloprid
Malathion
Metho
xyfeno
zide
Perm
ethrin cis
Perm
ethrin trans
Pyraclostrob
in
Pyrimethanil
Quino
xyfen
Spinosad
A
Thiabe
ndazole
Thiametho
xam
Trifloxystrob
in
25 Most Frequently Found Chemicals SW
ST
SP
PO
OG
GR
CU
AP
SW= Sweet Potatoes, ST= Strawberries, SP= Spinach, PO= Potatoes,
Inspection Services Annual Report 14

15 Inspection Services Annual Report
OG= Oranges, GR= Grapes, CU= Cucumbers, AP= Apples.
The numbers represent the positive findings in various commodities.
Besides changing the extraction method to improve efficiency, the PDP section took advantage of a software upgrade to simplify data processing and improve consistency of results. The future plan is to use technology to further streamline the program’s operation. For example, retiring selective GC detectors and migrating all analyses to tandem mass spectrometry detection systems which offer intrinsic, definitive data confirmation. PDP continues to work with USDA to implement automated data transfer from a local database to the USDA remote data system with the ultimate goal of completely eliminating manual data entry.
Quality Assurance Unit
The Quality Assurance Unit (QAU) monitors work product quality throughout the CAC to assure management and clients that facilities, equipment, personnel, methods, practices, records and controls are in conformance with its policies and procedures, and are in compliance with the International Organization for Standardization ISO 17025:2005 standard. The unit conducts internal audits of all lab sections within the Center for specific test methods identified in the scope of accreditation and issues corrective actions when necessary. QAU also manages and
assesses client feedback for continuous system improvement. QAU reviews the data output and methodologies validation of PDP program; provides an important service of Proficiency Evaluation (PE) testing, coordinated by the AOAC and USDA, to the CAC and national laboratories as a tool for maintaining competence; and ensures the Center maintain its accreditation to ISO 17025:2005. In 2009, QAU reviewed more than 120 data sets and distributed seven rounds of PE test samples to participating laboratories.
Commodity Com. Code
# Smpls
# Pos. finds
# Avg. Pos
Finds/Smple
Apple AP 210 781 3.7 Asparagus AS 210 32 0.2 Canned Bean BC 210 12 0.1 Corn CS 210 0 0.0 Cucumber CU 210 576 2.7 Grape GR 210 780 3.7 Orange OG 210 421 2.0 Potato PO 210 319 1.5 Spinach SP 210 811 3.9 Strawberry ST 210 1135 5.4 Sweet Potato SW 210 65 0.3 Total 2310 4932 2.1
2009 Data Summary
AP AS BC CS CU GR OG PO SP ST SW
210 210 210 210 210 210 210 210 210 210 210
781
32 12 0
576
780
421
319
811
1135
653.7 0.2 0.1 0.0 2.7 3.7 2.0 1.5 3.9 5.4 0.3
Commodity
# Samples# Positive finds

Number of PDP Data Sets reviewed in 2009
March, 10
April, 14
May,7
June, 20July, 9August, 11
, September11
O ctober, 13
December, 9 Febuary, 8
November, 17January, 6
PE sets distributed to participating laboratories in 2009
Month Program Matrix # Of Chemicals February AOAC Green Beans 10
April USDA Beef 12 June AOAC Pears 10 July USDA Oranges, Apples, Pears 1 (Formetanate)
August USDA Sweet corn 12 October AOAC Cucumbers 10
November USDA Canned beans 12 QAU distributed seven PE sets to participating laboratories in 2009
Environmental Safety Laboratory (ESL) The Environmental Monitoring (EMon) laboratory provides analytical testing to monitor the environmental fate of pesticides and their metabolites in all areas except food. With an inter-agency agreement with the California Department of Pesticide Regulation (CDPR), this section performs primarily testing of air and water samples to monitor the amounts of pesticides potentially contributing to air quality problems from volatile organic compounds (VOC’s), surface water, and ground water contamination issues. The ESL also supports several CDFA Programs such as Pierce’s Disease Control Program, Asian Citrus Psyllid treatment, Gypsy moth treatment, and omega 3-fatty acid in eggs label claim testing.
Inspection Services Annual Report 16
17 Inspection Services Annual Report
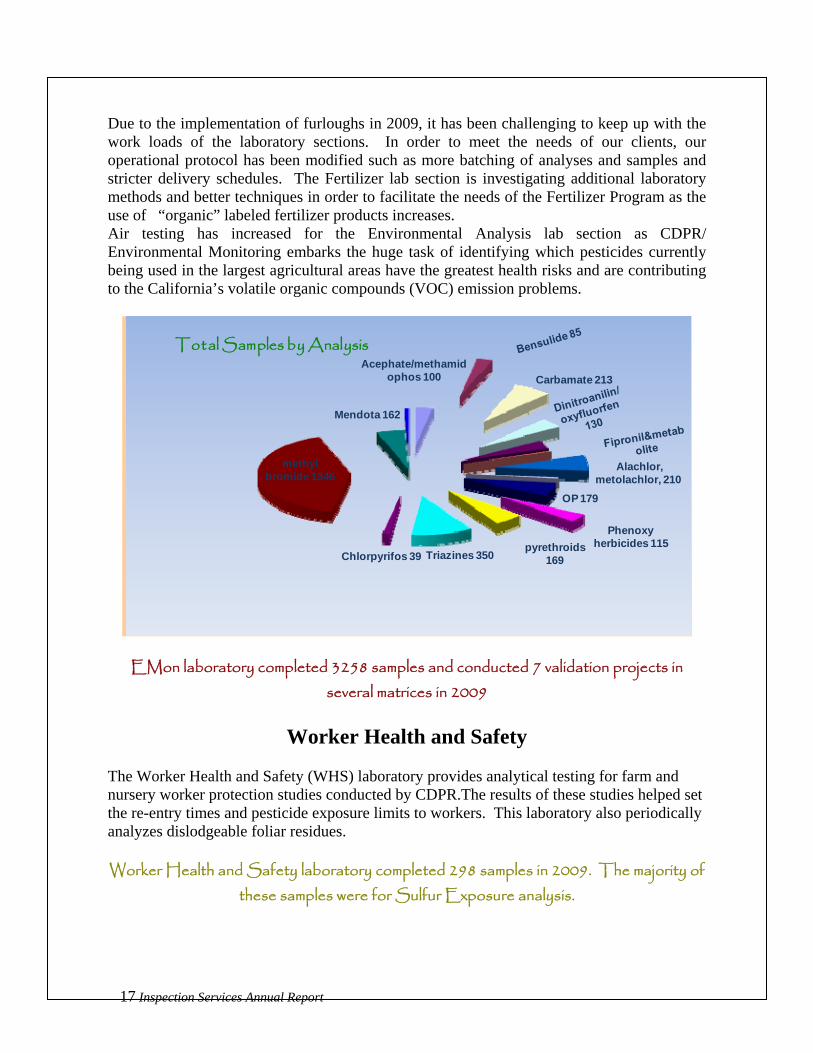
Due to the implementation of furloughs in 2009, it has been challenging to keep up with the work loads of the laboratory sections. In order to meet the needs of our clients, our operational protocol has been modified such as more batching of analyses and samples and stricter delivery schedules. The Fertilizer lab section is investigating additional laboratory methods and better techniques in order to facilitate the needs of the Fertilizer Program as the use of “organic” labeled fertilizer products increases. Air testing has increased for the Environmental Analysis lab section as CDPR/ Environmental Monitoring embarks the huge task of identifying which pesticides currently being used in the largest agricultural areas have the greatest health risks and are contributing to the California’s volatile organic compounds (VOC) emission problems.
Acephate/methamidophos 100 Carbamate 213
Alachlor, metolachlor, 210
OP 179
Phenoxy herbicides 115pyrethroids
169Triazines 350Chlorpyrifos 39
methyl bromide 1346
Mendota 162
Total Samples by Analysis
EMon laboratory completed 3258 samples and conducted 7 validation projects in several matrices in 2009
Worker Health and Safety
The Worker Health and Safety (WHS) laboratory provides analytical testing for farm and nursery worker protection studies conducted by CDPR.The results of these studies helped set the re-entry times and pesticide exposure limits to workers. This laboratory also periodically analyzes dislodgeable foliar residues. Worker Health and Safety laboratory completed 298 samples in 2009. The majority of
these samples were for Sulfur Exposure analysis.

Inspection Services Annual Report 18
Feed and Fertilizer The Feed and Fertilizer laboratory provides chemical analyses for the Feed, Fertilizer, Livestock Drugs, and Egg Regulatory Services Branch (FFLDERS). The analyses performed on feed samples are microscopy, minerals, proximates, drugs, vitamins, and mycotoxins for compliance to laws and regulations governing the feed industry. Analyses done on fertilizer samples include the three major plant nutrients (nitrogen, phosphorus and potassium), secondary and micronutrients (i.e. calcium, iron, magnesium, zinc, etc.) and anions (i.e. nitrates, chlorides, sulfates, chlorates, etc.), heavy metals (i.e. lead, arsenic, selenium, etc.). Organic fertilizers are tested for label compliance.
Total Feed Samples processed in 2009
Total Number of Samples Received 1,581 Routine Samples 689 Priority Samples 143 Partial Rush Samples 176 Rush Samples 566 Total Number of Assays Requested 8,337 Routine Assays 4,933 Rush Assays 3,404 Eggs for Omega 3-Fatty Acids 7 Total Number of Samples Analyzed 1,581 Average Number of Assays per Sample 5.3
Total Fertilizer Samples processed in 2009
Total Number of Samples Received 1,299 Routine Samples 1122 Priority Samples 28 Partial Rush Samples 40 Rush Samples 109 Total Number of Samples Analyzed 1,299 Total Number of Assays Requested 6,833 Routine Assays 6,064 Rush Assays 769 Average Number of Assays per Sample 5.3
Product Compliance
The Product Compliance laboratory with an inter-agency agreement with CDPR and USEPA performs primarily label compliance testing of pesticide formulations and quaternary ammonium chlorides (cleaning agents). These products range from cans of insect sprays, mosquito repellent wipes, insecticidal chalk, to citronella oil. 48 USEPA samples and 81 high concentration and unusual (non food or environmental) samples from state and counties were completed in 2009.

19 Inspection Services Annual Report
CDFA Programs: Integrated Pest Control (IPC) and Pests Detection and Emergency Projects (PDEP)
Wide varieties of sample matrices are received and processed through the Environmental Safety Laboratory for these CDFA branches. Emergency eradication projects occur every year without warning due to finding of invasive pests that enter California. Along with the eradication efforts, any application of pesticides or herbicides into the environment must be monitored with testing. Sample matrices range from river water to air.
pesticide screen Carbamate screen cyfluthrin
Imidacloprid Tank mixes vegetation pesticide screen
Fluridone diquat tryclopyr
Copper
Total PD/EP and IPC samples completed by analysis. Numbers represent total analysis done in both projects in 2009.
The Environmental Safety Laboratory, through an inter-agency agreement, provides all chemical testing support for herbicides applied into waterways as part of the National Pollution Discharge Elimination System (NPDES) federal guidelines for the Department of Boating and Waterways.

Inspection Services Annual Report 20
Department of Boating and Waterways has the responsibility of keeping California’s boating waterways free of aquatic weeds. In 2009,
the ESL completed 351 samples for 4 herbicides
Fluridone 78Glyphosate 492,4-D 83Agridex 141
Highlights of 2009 The Feed and Fertilizer labs have been able to transfer the majority of their elemental work onto the Inductively Coupled Plasma (ICP) analyzer which has promoted efficiency and given the laboratory an additional means of verification of analyses. Method development is an important part of the Emon laboratory section’s procedure. Section performs method development and validation for every analysis requested by clients. Some of the requests for 2009 are bensulide in water and para-dichlorobenzene in several matrices from blankets to clothing. 2009 brought the Environmental Analysis section two gas chromatograph mass spectrometers (GCMS) set up specifically for air analysis from summa canisters and a new liquid chromatograph tandem mass spectrometer (LCMSMS). The LCMSMS was used for sub parts per billion water analyses of pesticides.

21 Inspection Services Annual Report

2009 Annual Report Feed, Fertilizer, Livestock Drugs & Egg Regulatory
Services Branch
Inspection Services Annual Report 22

23 Inspection Services Annual Report
Feed, Fertilizer, Livestock Drugs, and Egg Regulatory Services
Feed and Livestock Drugs Inspection Program
The Livestock Drug Program regulates over-the-counter livestock drugs. Fees collected from licensing and registration funds this program. A Livestock Drug Registration Certificate must be obtained for each over-the-counter livestock drug prior to offering it for sale in California. The program reviews the livestock drug labels and data for safety and efficacy. Labeling requirements specifically identify route, dosage, and withdrawal information to eliminate a drug residue in food products derived from livestock animals. Each location that offers restricted livestock drugs for sale must hold a license with the State of California and maintain records of drug sales.
PROGRAM SUMMARY The Feed Inspection Program (FIP), working in conjunction with the feed industry, ensures a clean and wholesome supply of meat, milk, and eggs. Feed and Livestock Drug Inspectors and Special Investigators located throughout the state conduct routine sampling and inspection, conduct quality assurance inspections of manufacturing facilities, respond to consumer complaints, and enforce the feed laws and regulations.
TRENDS/ISSUES FROM 2009 In addition to focusing on quality assurance, the primary spotlight of the inspection program is on feed safety. Analyses are run for mycotoxins (i.e., aflatoxins), medication residues, heavy metals, pesticides, toxic minerals, and prohibited mammalian protein under the bovine spongiform encephalopathy (BSE) rule. The FIP also works under reimbursement contract with the U.S. Food and Drug Administration (FDA) to perform investigational audits under BSE rule 21 CFR 589.2000 and 21 CFR 589.2001 and conducts tissue residue investigations stemming from the improper use and administration of livestock drugs.
In response to bovine spongiform encephalopathy (BSE), also known as Mad Cow Disease, the BSE Rule 21 CFR 589.2000 was implemented in 1997. In April 2008, the rule was amended to include 21 CFR 589.2001. The amendment prohibits the use of certain cattle material (spinal column and brain tissue from cattle over 30 months of age) in animal feed and requires its removal prior to the remaining meat and bone meal being used as animal feed. This new rule became effective October 2009. The FIP field staff was trained with the new checklist and performed routine BSE Investigations throughout the state in 2009.
FIP is entirely industry funded. Manufacturers and distributors of commercial feed are required to hold a license for each business location. Any person who distributes commercial feed (with the exception of whole grains and whole hays when unmixed) to a consumer-buyer in California is required to pay an inspection tonnage fee on commercial feed sold. On July 1, 2009 the FIP lowered the tonnage tax from 0.12 to 0.9 cents per ton.
With the economy impacts still playing a critical role in commodity prices, agricultural markets, and the dairy industry, consumers are focusing on formulating their feed rations on a least cost basis. This poses an increased challenge to the Feed Inspection Program, as investigative staff is finding an increase in the amount of unapproved feed ingredients in the channels

of trade by firms trying to reduce the cost of feed inputs. In 2009 the commercial feed ingredient with the most compliance problems was almond hulls. The feed inspection program quarantined 81,226 tons of almond hulls for quality issues, damage, and adulteration with aflatoxin. FIP held meetings with the industry and brokers of almond hulls and advised almond hullers on sampling and testing protocols to insure their products meet the regulatory specifications In 2009, the Feed Inspection Program continued to make progress with high violating firms by working on comprehensive sampling summary reports detailing firms with the highest violation rates. This summary report enabled the program to objectively align their investigative staff and sampling parameters based on the risk assessment of commodities and manufacturing practices. A formal contract was initiated with the University of California, Riverside, Animal Health and Food Safety laboratory in 2008 and testing continued in 2009. The feed program tested poultry layer rations running Salmonella Screens and also tested imported ingredients that FDA had identified as testing positive for Salmonella coming into the United States, including Canola Meal. Analysis of these products is related to the program’s top priority of feed and food safety. ACCOMPLISHMENTS FOR 2009 In 2009 The Feed, Fertilizer and Livestock Drugs Inspection Program embarked on a massive reconstruction of what was formerly known as the INSPECT Database. The new database will include online: Licensing, sample and inspection results for the feed industry, Certificates of Free Sale, Certificate of Movement, Quarantines,
Restricted Livestock Drug registration, and several other functions for both the Feed and Livestock Drugs Program to be more efficient with day to day operations, and to enhance turn- around time to industry, providing them with a better service. This project required an abundance amount of time and resources for the entire branch; the project is scheduled for completion mid, 2010. The Feed and Livestock Drugs Inspection Program contracts with FDA each year to perform 125 BSE and 75 tissue residue investigational assignments. The program continues to foster a coordinated sampling plan with incoming feed sources at the border stations. Enhanced communication efforts between the Feed and Livestock Drugs Program and other CDFA branches, such as Animal Health and Food Safety Services, Milk and Dairy Food Safety, and Meat and Poultry Inspection, have been promoted to enhance interagency work toward food safety measures. The program has attended meetings of the Association of American Feed Control Officials (AAFCO), National Animal Supplement Council (NASC), Animal Feed Safety Systems (AFSS), and several FDA meetings and trainings including training on the New BSE Rule 21 CFR 589.2001 in Omaha, NE. The program also attended the Department of Texas State Chemists; Hazard Analysis Critical Control Points (HACCP) training course and Texas A&M and HACCP training for the rest of the field staff is scheduled for April 2010.
The Feed Inspection Program and Safe Animal Feed Education Program Hosted the Association of American Feed Control
Officials (AAFCO) Mid Year Meeting, held in Bass Lake, CA in May 2009. Additionally, the program has participated as a speaker at various organized functions,
Inspection Services Annual Report 24
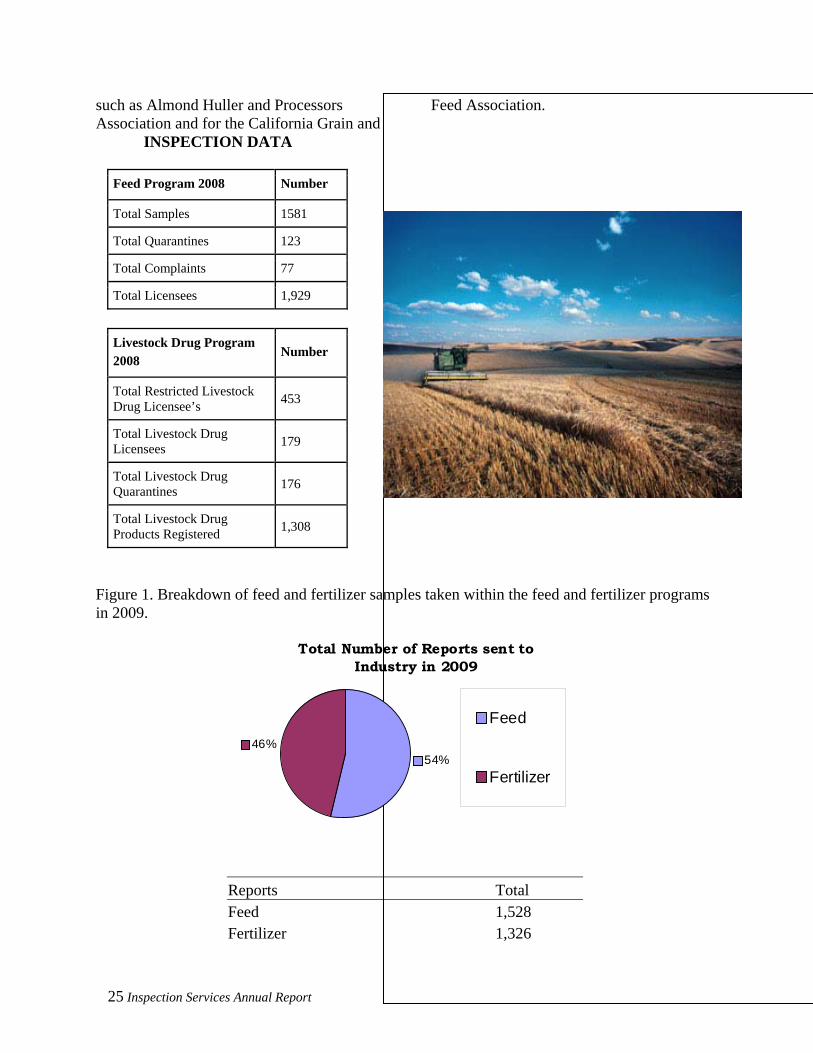
such as Almond Huller and Processors Association and for the California Grain and
Feed Association.
INSPECTION DATA
Feed Program 2008 Number
Total Samples 1581
Total Quarantines 123
Total Complaints 77
Total Licensees 1,929
Livestock Drug Program 2008
Number
Total Restricted Livestock Drug Licensee’s 453
Total Livestock Drug Licensees 179
Total Livestock Drug Quarantines 176
Total Livestock Drug Products Registered 1,308
Figure 1. Breakdown of feed and fertilizer samples taken within the feed and fertilizer programs in 2009.
Total Number of Reports sent to Industry in 2009
54%46%
Feed
Fertilizer
Reports Total Feed 1,528 Fertilizer 1,326
25 Inspection Services Annual Report
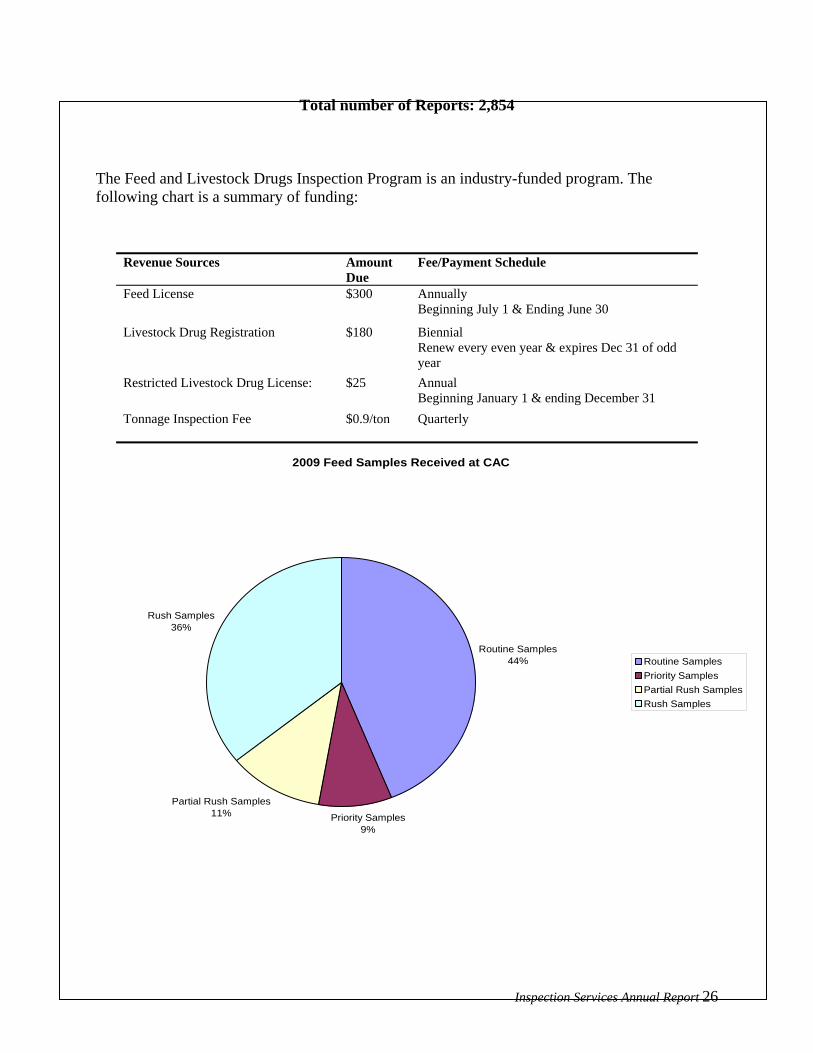
Total number of Reports: 2,854
The Feed and Livestock Drugs Inspection Program is an industry-funded program. The following chart is a summary of funding:
Revenue Sources Amount Due
Fee/Payment Schedule
Feed License $300 Annually Beginning July 1 & Ending June 30
Livestock Drug Registration $180 Biennial Renew every even year & expires Dec 31 of odd year
Restricted Livestock Drug License:
$25 Annual Beginning January 1 & ending December 31
Tonnage Inspection Fee
$0.9/ton Quarterly
2009 Feed Samples Received at CAC
Routine Samples44%
Priority Samples9%
Partial Rush Samples11%
Rush Samples36%
Routine SamplesPriority SamplesPartial Rush SamplesRush Samples
Inspection Services Annual Report 26

27 Inspection Services Annual Report
Figure 2. Breakdown of the status of feed samples sent to the Center for Analytical Chemistry by the Feed and Livestock Drugs Inspection Program.

Inspection Services Annual Report 28
Feed & Food Safety Assays
36%
Total Assays64%
2009 Feed Assay Chart Protein
15%
Fat9%
Fiber
Aflatoxin Fumonisin Pesticide Screen Heavy Metals Medicated Calcium Selenium
FiberMicroscopy
FatProtein
Selenium7%
Calcium 10%
Fu1%
Pesticide Screen
Heavy Metals3%
Medicated7%
monisin2%
16%
Microscopy 1
%Aflatoxin
29%
Figure 3. (above) Shows a breakdown of the analysis in relationship to feed and food safety sampling focus in the FIP. Feed & Food Safety Assays Total
Aflatoxin 2260 Fumonisin 124 Calcium and Selenium 1331 Heavy Metals 161 Medicated 664 Prohibited Mammalian Protein 22 Pesticide Screen 93
Feed & Food Safety Assay Total: 4655
Total number of feed assays performed by
Center for Analytical Chemistry Lab in 2009: 8,337
Percent of Feed and Food Safety Assays Performed in Relation to Total Assays
Figure 4. (Right) Percent of total Feed and Food Safety Assays in relation with total assays.

29 Inspection Services Annual Report
Figure 5 (Right) Shows the alignment of the Feed and Livestock Drug Programs Inspectors/Special Investigators throughout CA, by county.
Safe Animal Feed Education Program PROGRAM SUMMARY The Safe Animal Feed Education (SAFE) Program is entirely industry funded. The program was developed in collaboration with the commercial feed industry to promote a cooperative relationship to ensure safe feed. Established in 2005, two primary elements of the program are: 1. Outreach and Education
- Proper use of medicated feed - Biosecurity - Proper handling and use of
concentrated feed supplements - Compliance with a federal rule
designed to prevent bovine spongiform encephalopathy (BSE)
2. Comprehensive Voluntary Feed Quality Assurance - Staff conducts a 380-point voluntary
feed quality assurance audit The SAFE Program conducted a mycotoxin survey on corn grain sold in California. As a result of the study findings, the Feed Inspection Program
continues to sample grains for mycotoxins on a regular basis. Routine aflatoxin and fumonisin testing is an integral part of the program’s efforts toward feed safety. Aflatoxins are a known fungal carcinogen, occurring in crops around the world and contaminating up to 25 percent of the world food supply. Currently, California has one of the most stringent tolerance limits on aflatoxins in animal feed designed to prevent aflatoxin from contaminating milk. QUALITY ASSURANCE AUDITS The review of operations includes: - Evaluation of manufacturing practices - Quality assurance protocols - Process controls - Ingredient storage - Record keeping - Product labeling - Compliance with laws and regulations

ACCOMPLISHMENTS FOR 2009 The SAFE Program recognized several feed mills with a certificate of acknowledgement for outstanding scores on the SAFE Feed Quality Assurance Audit; recognizing Hazard Analysis and Critical Control Principles, Standard Operating Procedures, and Good Manufacturing Practices. The Program also enhanced service to industry by conducting several mixer profiles at feedmills throughout CA. This profile was able to assist firms, on a voluntary basis, by giving them a detailed look at how effective their feed mixer is working on producing an even, uniform mix of feed throughout an entire load/batch for regulatory compliance. All medicated feed produced in CA must be manufactured according to approved levels. The data provided to manufacturers on protein, moisture, mineral concentrations, and medication levels of their feed being manufactured. SAFE also worked with the Animal Health Animal Disposal Group in 2009 and is participating in outreach and education efforts for FDA’s New BSE Rule 21 CFR 589.2001. SAFE Program Activities in 2009
On-Farm Mixer Studies 4 Industry Mixer Profiles 7 Quality Assurance Audits 8
Inspection Services Annual Report 30

31 Inspection Services Annual Report
Table 1 provides the percent distribution
of these licenses within and outside of California. Licenses are valid for a two-year period and December 31, 2008, marked the expiration of all licenses. Renewals commenced January 1, 2009, at a cost of $100 per license and will be valid until December 31, 2010. License renewal notices were distributed to all licensees by the FMIP on November 17, 2008.
FERTILIZING MATERIALS INSPECTION PROGRAM PROGRAM SUMMARY The Fertilizing Materials Inspection Program (FMIP) is responsible for regulating fertilizers in the State of California. The program ensures consumers receive fertilizing materials that are safe and effective and meet the quality and quantity guaranteed by the manufacturer.
Licensee Location Number
# Percentage
% In California 994 55
Other U.S. States 695 38.5 International 118 6.5
Total 1807 100
TRENDS/ISSUES FOR 2009 Licensing
All manufacturers and distributors of fertilizing materials are required to obtain a license from the program prior to engaging in any fertilizer related activities. In 2009 the program maintained 1807 licenses of fertilizer manufacturers and distributors; 994 of these licenses were for manufacturers and distributors in California, 865 for manufacturers and distributors in other U.S. states, and 118 internationally.
Table 1. Locations of licenses maintained by the program.
Registration Fertilizer products are sold and distributed with a label informing consumers of product details, such as contents. In 2009, 5358 product labels were registered with the program (data collected September 2009). Figure 1 shows the product labels reviewed and registered for the different types of fertilizing material product labels. Figure 2 describes the label review process.

Issue Registration
Cirtificate
Registration ApplicationLabelsFeesData
PROCESSING DESKOffice Technicians
REGISTRATION DESKLabel Review by Research Analysts
Environmental Scientist Consultation
Labels Comply with FAC and CCR
Data entry for Online Product Database
Appro
ve La
bels
Labels Do Not Comply with FAC
and CCR
Dis
appr
ove
Labe
ls
Request Label Revisions
TECHNICAL DESK Environmental Scientist
Senior Environmental Research ScientistUniversity of California Consultation
Review of Efficacy DataScientific Research
Environmental Considerations
Figure 1. The distribution of registered fertilizer product labels by type in 2009
2493
1451
863
551
0
500
1000
1500
2000
2500
3000
Specialty Fertilizer Agricultural Mineral Packaged SoilAmendments
Aux. Soil & PlantSubstances
Num
ber o
f Lab
els
Figure 2. Schematic showing the fertilizer label registration and review process. Squares indicate a processing unit while the ovals indicate action items.
Inspection Services Annual Report 32

33 Inspection Services Annual Report
The program reviews conventional fertilizer labels and fertilizer labels used for organic production. Prior to review by FMIP, fertilizer labels for organic food production require third party certification verifying product compliance with the National Organic Program Standards. In some cases, registrants must submit experimental field trials using the products (efficacy data) to verify label claims. The program’s Staff Environmental Scientist reviews these claims. The FMIP program also consults with the University of California, Davis to obtain feedback on efficacy data.
Fertilizer Sampling and Inspection The program has been mandated by the legislature and supported by the industry to sample and verify that label nutrient guarantees are met. In 2009, the program sampled and evaluated 1,299 fertilizer products. Figure 3 shows the distribution of the assays performed on fertilizer samples. A total of 6,833 assays were run and Nitrogen, Phosphorus, and Potassium represent 55% of all assays run in 2009. Figure 4 provides a distribution of the status of the samples submitted for analysis. Rush or priority submission status indicates there was a need to obtain the results of the laboratory analysis quickly and is based on a time sensitive fertilizer situation. The majority of samples are submitted on a routine basis.
Thiamine (Vitamin B1)
Nitrogen22%
Phosphoric Acid16%
Potash17%
Boron3%
Calcium 5%
Chlorine1%
Cobalt0%
Copper2%
Iron 6%
Magnesium 4%
Manganese4%
Molybdenum 2%
Sodium 0%
Sulfur9%
Zinc6%
Gypsum Equivalent0%Calcium Carbonate
0% Humic Acid
2%
0%
NitrogenPhosphoric AcidPotashBoronCalcium ChlorineCobaltCopperIronMagnesium ManganeseMolybdenumSodium SulfurZincCalcium CarbonateGypsum EquivalentThiamine (Vitamin B1)Humic Acid
Figure 3. Distribution of fertilizer assays

2009 Fertilizer Samples Received at CAC
Routine Samples87%
Priority Samples2%
Partial Rush Samples3%
Rush Samples8%
Routine SamplesPriority SamplesPartial Rush SamplesRush Samples
Figure 4. Distribution of samples submitted for laboratory analysis by status.
In addition to the regular sampling of products, field inspectors are trained to identify if labels from commercial bulk products, not requiring FMIP registration, are in compliance with labeling laws and regulations. The inspectors are also trained to verify that fertilizer companies and distributors are licensed, educate manufacturers on the state’s laws and regulations, check for heavy metal warnings on labels, address field activities related to complaints, and conduct investigations. Inspectors are given the authority to take regulatory action, such as quarantining products for those in violation.
At present, the field component of the program includes four special investigators and two fertilizer inspectors. The field operations reach full capacity with the current number of special investigators and fertilizer inspectors. Figure 5 shows the distribution of the field staff according to the different regions. Each region has one fertilizer inspector. This distribution was based on fertilizer use and crop distribution in the state, compiled as part of the 2008 strategic planning study for the FMIP.
Inspection Services Annual Report 34

35 Inspection Services Annual Report
Tonnage The laws that govern FMIP require the program to maintain and publish an annual report on the distribution of fertilizers within the state. The program publishes the tonnage distribution report in the state every six months. The report identifies tons of nitrogen, phosphorus, and potassium used from either January to June or July through December. The same time periods are used to identify distribution of tons of agricultural minerals by use (e.g., farm or non-farm use), by form (e.g., liquid or dry), by county, by different types (e.g., sodium nitrate or potassium sulfate), and by comparison of current use trends with previous years. According to the most recent tonnage report, approximately 2.9 million tons of fertilizers were distributed in the state
from January to June 2009. About 90 percent of fertilizer distribution reported to the FMIP was for agricultural farm use while 10 percent was for home and garden use. These reports are made available to the public through university libraries and similar organizations. Fees An industry funded assessment and fee on the sale of fertilizing materials is used to support the operation and growth of the program. Currently, the assessment is 1 mill ($ 0.001) per dollar of fertilizer sales. In addition, a new license and fertilizing materials label registration fee is $100, label registration renewal fees are $100, and the license renewal fee is $50. These assessments and fees support the licensing, product label registration, inspections, and daily operations of the program.
Figure 5. The distribution of fertilizer field inspectors throughout the State of California. Each geographic region, as indicated by a different color, will have one fertilizer field inspector.

ACCOMPLISHMENTS FOR 2009 On October 11, 2009, Governor Arnold Schwarzenegger signed the Assembly Bill (AB) 856 (Caballero, Chapter 257, Statutes of 2009). AB 856 authorizes the Department to charge label registration fee for organic input material not to exceed $500 per product with the revenue deposited into the Organic Input Material Account, which this bill will create in the Food and Agriculture Fund, and makes these funds available upon appropriation for the purpose of implementation of AB 856. AB 856 requires the California Department of Food and Agriculture (CDFA) to perform scientific review, and registration of each product label for organic input material to ensure the product meets the National Organic Program standards for production of organic food and crops. AB 856 also required CDFA to inspect organic input material manufacturers at least once a year to verify their product label claims.
New regulation pertaining to the disclosure of ingredients and trade secrets for fertilizing material was added to the California Code of Regulations. The regulation establishes procedure for claiming protection of trade secrets. Information meeting trade secret requirements will be held from the public disclosure unless the department has determined that disclosure is necessary to protect against an unreasonable risk of injury to health or the environment. Based on the strategic planning recommendations, the staffing of the inspection team was completed in 2009. This has allowed the program to focus resources and enforcement tools where
risk of violations is the highest. The assay violation rate has been decreased from 28% in 2008 to 24% in 2009. To achieve full compliance, outreach activities are necessary educational tools. The program completed a second Fertilizing Materials Licensing and Registration Workshop in Fresno on July 30, 2009. A total of 70 participants representing 54 firms attended the free workshop. Topics addressed in the workshop were the laws and regulations that govern the program, licensing, label registration and requirements, tonnage reporting, mill assessments, and interpreting sample analysis reports. The purpose of the workshop was to educate members of the fertilizer industry about the state laws and regulations and daily functions of the FMIP. FERTILIZER RESEARCH AND EDUCATION PROGRAM PROGRAM SUMMARY The Fertilizer Research and Education Program (FREP) facilitates and coordinates research activities by providing funding for fertilizer research and development and by disseminating fertilizer educational materials and information. FREP is designed to serve farmers and other users of fertilizing materials, agricultural service professionals, university extension personnel, public agencies, and agricultural consultants. In fact, one of FREP’s key goals is to ensure that research results generated from the program are distributed to and used by farmers and the fertilizer industry. The Technical Advisory Subcommittee (TASC) of the Fertilizer Inspection Advisory Board guides FREP. This
Inspection Services Annual Report 36

37 Inspection Services Annual Report
subcommittee includes growers, fertilizer industry professionals, state government scientists, and university extension and research personnel. The TASC directs FREP activities, including reviewing, selecting, and (after peer review) recommending to the FIAB annual funding for a limited number of specific FREP research and education projects. TRENDS/ISSUES FOR 2009 Each year TASC determines specific research priorities to fund in the following year. In 2009 the following research priorities were compiled: updating nutrient requirements, improving fertilizer efficiency in drip irrigated micro-irrigation systems, increasing fertilizer efficiency through cost-benefit analysis, and devising innovative techniques to improve fertilizer use efficiency. TASC uses these guidelines to determine which projects receive funding for the following year. However, given the fact that FREP research has been broadly applied, other research areas are also considered by TASC as criteria for funding. They include: • Site-specific fertilizer technologies:
Demonstrating and quantifying applications for site-specific crop management technologies and best management practices related to precision agriculture.
• Diagnostic tools for improved
fertility/fertilizer recommendations:
Developing field and laboratory tests for predicting crop nutrient response that can aid in making fertilizer recommendations.
• Nutrient/pest interactions and
nutrient/growth regulator inter-actions: Demonstrating or providing practical information to growers and production consultants on nutrient/pest interactions.
• Education and public information:
Creating and implementing educational activities that will result in adoption of fertilizer management.
• Practices and technologies that
improve impaired water bodies. FREP funding can also be used for different types of activities including on-farm demonstrations that exhibit improved profitability, reduced risk or increased ease of management.
• Programs to educate growers,
fertilizer dealers, students, teachers, and the general public about the relationships between fertilizers, food, nutrition, and the environment.
• Preparation of publications, slide
sets, videotapes, conferences, field days, and other outreach activities, and additional areas that support FREP’s mission, such as air quality, tillage, crop rotation, economics of fertilizer use, and cropping systems.

Listed below are the titles from the proposals selected in 2009 to receive funding from 2010 to 2012. Measuring and modeling nitrous oxide emissions from California corn, cotton, and vegetable cropping systems. Improved Methods for Nutrient Tissue Testing in Alfalfa. Citrus Yield and Fruit Size Can Be Sustained for Trees Irrigated with 25% or 50% Less Water by Supplementing Tree Nutrition with Foliar Fertilization. Developing Testing Protocols to Assure the Quality of Fertilizer Materials for Organic Agriculture. Improving Pomegranate Fertigation and Nitrogen Use Efficiency with Drip Irrigation Systems. Towards Development of Foliar Fertilization Strategies for Pistachio to Increase Total Yield and Nut Size and Protect the Environment - A proof-of-concept project. European Pear Growth and Cropping: Optimizing Fertilizer Practices Based on Seasonal Demand and Supply with Emphasis on Nitrogen Management.
Funding is generally limited to $50,000 per year for up to three years. However, large, multi-disciplinary projects may be considered at higher funding levels.
FREP began funding projects in 1991. The majority of FREP projects have taken place in the Central Valley. The distribution of projects funded varies greatly in scientific discipline and agricultural commodity. Nutrient testing and irrigation/fertigation studies, together, make up over 50 percent of the projects funded. The distribution of projects focusing on the various agricultural commodities is more evenly distributed. Vegetable, field, fruit, and multiple crop projects have all been funded in equal proportion. FREP activities in 2009 included funding to determine baseline nitrous oxide levels from different nitrogen fertilizers used in agricultural systems. This mode of research stemmed from Assembly Bill 32, (Nunez, Chapter 488, Statute as of 2006), which requires the California Air Resources Board (CARB) and California Energy Commission (CEC) to address environmental greenhouse gas reduction. Nitrous oxide is a greenhouse gas. Its use and contribution to the greenhouse inventory was evaluated by CARB. Scientists from FREP and Fertilizing Materials Inspection Program collaborated with CARB to fund research to determine fundamental gaps in the nitrous oxide knowledge base regarding fertilizer. For instance, a major aspect of the research will determine the baseline nitrous oxide levels from different agricultural crops with and without nitrogen fertilizers. This research is expected to be completed in 2012. Figures 1 through 3, on the following pages, illustrates the distribution of FREP funded projects between geographic region, scientific discipline, and agricultural commodity since the beginning of FREP in 1991.
Inspection Services Annual Report 38

39 Inspection Services Annual Report
CDFA FREP Projects by Location
1990-2009
Central Coast12%
Central Valley60%
Desert3%
Other1%
South Coast5%
Statewide19%
Figure 1. CDFA FREP Projects by Location
CDFA FREP Projects by Discipline1990-2009
Compost/Cover Crops3%
Educational15%
Fertilizer Practices12%
Heavy Metals1%
Irrigation/Fertigation19%
Nutrient/Soil Testing34%
Other4%
Pest Interactions3%
Precision Agriculture7%
Air Quality2%
Figure 2. CDFA FREP Projects by Discipline

CDFA FREP Projects by Commodity1990-2009
Field Crops21%
Fruits21%
Multiple22%
Nursery/Horticulture4%
Nuts9%
Soil1%
Turfgrass1%
Vegetable20%
Fruits/Nuts1%
Figure 3. CDFA FREP Projects by Discipline
SHELL EGG QUALITY CONTROL PROGRAM PROGRAM SUMMARY Shell Egg Quality Control (EQC) Program monitors egg quality at production, wholesale, and retail levels. The goal is to provide California consumers with eggs that are wholesome, properly labeled, refrigerated, and of established quality and grade, while maintaining fair and equitable marketing standards in the California egg industry. The program is funded through mill assessment and registration fees paid by the in-state and out-of-state shell egg producers, packers, and shippers. The EQC program partners with various county agricultural commissioners’ to perform production, wholesale and retail inspections. The program also enforces and controls the movement of restricted and inedible
TRENDS/ISSUES FROM 2009 Fiscal year 2009/2010 San Diego and Santa Clara counties added retail inspection work to their egg contracts. Those counties had an increase of eggs available to inspect due to increased population. In the past there have been five counties doing retail work now seven counties in California will be inspecting at retail. The Shell Egg Advisory Committee approved the increased work because food safety for the consumer is an extremely important issue.
eggs through the USDA Shell Egg Surveillance Program.
Inspection Services Annual Report 40

41 Inspection Services Annual Report
PROGRAM ORGANIZATION The Egg Quality Control Program is divided into three regional areas, Northern/Coastal District, Central District, and Southern District. Each district supervisor is responsible for training and oversight of county inspectors in their district. The EQC contracts with 16 counties statewide - seven counties in the northern/coastal district, four counties in the central district, and five counties in the southern district - to perform shell egg inspections at the egg production, wholesale, and retail outlets in their respective counties. Contracts vary from county to county, depending on the type of inspection work performed: production, wholesale, retail, and federal shell egg surveillance. The state has been divided into three districts to provide oversight and training to county department of agriculture inspectors. The following map shows boundaries of each district with the program staff contact information for each district. DISTRICT SUPERVISORS MAP ACCOMPLISHMENTS The EQC Program has completed its annual 2009 egg training workshops for county agricultural commissioners’ staff. Four regional workshops were conducted last year, two in Southern California, one in Central California, and one in Northern California. County inspectors are trained on state and federal laws and regulations to ensure consistency and uniform application of standards throughout California. USDA also provides training for its Shell Egg Surveillance Program. Fifty-two county inspectors participated in the 2009 workshops.
SUMMARY OF SHELL EGG INSPECTIONS The following table provides a breakdown of county inspection activity statewide for state regulatory enforcement for fiscal year 2008/09 (July 2008 - June 2009). The information is compiled from county reports submitted to the EQC program and consists of inspection work performed at production, wholesale, and retail facilities. Violations (non-compliance) are issued when eggs fail to pass laws and regulations pertaining to shell eggs. These rejected eggs are put “Off-Sale” until they are brought into compliance.

Fiscal Year 2008-09 Activities Production Wholesale Retail Total Premises Inspected
929
961
260
2,150
Shell Eggs Inspected (Dozens)
3,160,017
3,697,691
210,946
7,668,654
Violations Issued
243
260
100
603
Combination Defects Rejected (Dozens)
68,309
18,873
295
87,477
Inedible Rejected (Dozens)
2,589
35
0
2,624
Loss Rejected (Dozens)
40,506
18,016
60
58,582
Dirties Rejected (dozens)
11,990
4,937
1,500
18,427
Checks Rejected (Dozens)
129,475
85,176
3,774
218,425
Misc. Rejected (Dozens)
4,872
22,843
159
27,874
Table 1. Eggs can be rejected for a number of reasons. Some of the most common type of defect rejections are for Checks (cracked eggs), Dirty (fecal or yolk material adhering to shell), Inedible (any type of rot), Loss (large blood or meat spots, bloody whites), and Combination Defects (multiple defects). FEDERAL SHELL EGG SURVEILLANCE A producer with 3,000 or more birds must register with USDA under the Shell Egg Surveillance Program. Also, any company that repacks and re-grades eggs is considered a Grading Station and must register. These facilities are inspected once a quarter to control the use and movement of restricted and inedible egg product. Hatcheries are also inspected once a year under this program. These inspections are under a reimbursable contract with USDA. State and county inspectors must be licensed by USDA to perform this type of work. Any eggs retained for grading violation require a release visit, and whenever eggs are retained a follow-up visit is also required.
Inspection Services Annual Report 42

43 Inspection Services Annual Report
Number of Producers/ Grading Stations 52
Number of Hatcheries 19
Number of Annual Hatchery Visits 19
Number of Initial Quarterly Visits 256
Number of Release Visits Per Year 18
Number of Follow-Up Visits Per Year 18
Table 2. The above table provides a breakdown of the numbers related to the Federal Shell Egg Surveillance Program.

Inspection Services Annual Report 44

45 Inspection Services Annual Report
2009 Annual Report 2009 Annual Report
Inspection Inspection And And
Compliance Compliance

SHIPPING POINT INSPECTION PROGRAM PROGRAM SUMMARY The Shipping Point Inspection Program provides optional third party grading and certification service, and third party food safety verification audits to the fruit, nut, and vegetable industries throughout California. A Federal-State Cooperative Agreement with USDA authorizes the California Department of Food an Agriculture inspectors to use federal grade standards for fresh produce, and issue federal-state inspection certificates recognized nationally and internationally. TRENDS/ ISSUES FROM 2009 Food Safety continues to be an important part of the Shipping Point Inspection Program (SPI). The success of SPI’s Food Safety Auditing Verification program for the California and Arizona Leafy Green industry and California Fresh Tomato industry has become a model for other commodities groups to follow. There has been a sharp increase in the number of USDA Good Agriculture Practice / Good Handling (GAP/ GHP) verification audits being requested at the farm level rather than only at the packing house level.
Inspection and Compliance
In 2009, SPI provided GAP/GHP audits on the following commodities: Cherries Cabbage Cauliflower Pears Broccoli Olives Celery Tomatoes Cucumbers Apricots Table Grapes Kiwifruit Potatoes Turnips Carrots Squash Onions Apples Pomegranates Persimmons Garlic Lettuce: Romaine Red Leaf Green Leaf Spinach Stone Fruit: Peaches Plums Nectarines Pluots Apriums Peppers: Jalapenos Serrano Anaheim Bell Sweet Berries: Blueberries Strawberries Nuts: Walnuts Almonds Pistachios Melons: Cantaloupes Honeydews Horned Watermelon Orange Blush
Food Safety and Labeling Requirement Inspections by Number(1,349 Total Inspections)
87
660
46
556
GHP/GAP Audits
Leafy Green
CTF
COOL Audits
Citrus: Grapefruit Limes Tangelos Mandarin Pomeloes Citron Minneolas Navels Valencias Cara Caras Lemons Tangerines Clementines Oranges
Chart 1. Food Safety Inspections by Number
Inspection Services Annual Report 46

47 Inspection Services Annual Report
In addition, the Country of Origin Labeling (COOL) program, a labeling law that requires retailers, such as full line grocery stores, supermarkets and club warehouse stores, to notify their customers with information regarding the source of certain foods such as ground and muscle cuts of beef, lamb and pork, farm-raised and wild fish and shellfish, peanuts, and fresh and frozen fruits and vegetables, became effective late 2008. As a result, the COOL program has become a larger part of the SPI program more than doubling in size from 209 inspections in 2008 to 556 in 2009. ACCOMPLISHMENTS FOR 2009 A total of 82,215 SPI inspections were completed. These inspections include 6,364 federal inspections, 4,387 Import inspections 31,520 tree nut, 17,247 Grape, 1,224 Tree Fruit, 9,076 Other Fruit, 12,829 vegetable row crops and 171 other vegetable inspections. In addition to these inspections, SPI conducted 1,349 food safety/ product verification audits. These audits include 87 Good Handling Practice/Good Agriculture Practices (GHP/GAP) audits, 660 Leafy Green audits, 46 tomato audits and 556 Country of Origin Labeling (COOL) audits.
Chart 2. SPI Inspections by Number
SPI Inspections by Number(82,818 Total Inspections)
6,3644,387
31,520
17,247
1,224
9,076
12,829171
Federal Inspections
Import
Tree Nut
Grape
Tree Fruit
Other Fruit
Vegetable Row
Other Vegetable
SPI Inspections by Pound(41,551,235 Total Pounds)
283,447
1,349,455
7,532,262
773,928
4,537,708
5,066,520
8,462
21,999,453
Federal Inspections
Import
Tree Nut
Grape
Tree Fruit
Other Fruit
Vegetable Row
Other Vegetable
Chart 3. SPI Inspections by Pound (hundredweight)
SPI Import Inspections by Number (5,251 Total Inspections)
1,193
456
248
322
2,847
185Avocados
Kiwifruit
Grapes
Onions
Tomatoes
Other
Chart 4. Import Inspections by Number

STANDARDIZATION PROGRAM
Inspection Services Annual Report 48
PROGRAM SUMMARY
Standardization statutes establish minimum standards for maturity, quality size, standard container and pack, and container markings. The Standardization Program ensures enforcement of quality standards, container, labeling, sizing, and maturity requirements at: packing, storage, and field distribution centers; certified farmers’ markets; and port of entry facilities. The Standardization Program provides services and a regulatory framework to assist industry efforts to increase consumer confidence in the food supply. Standardization inspections take place in fields and packinghouses, wholesale markets, retail distribution centers, retail outlets, and highway inspection stations. TRENDS/ISSUES FROM 2009
The Standardization Program has continued its efforts to cross utilize inspectors. The same state personnel are now enforcing regulations for the Standardization, Direct Marketing, and Organic programs. This cost-sharing effort benefits all programs by encouraging increased efficiencies. A successful piloting of the enforcement model for the Direct Marketing Program
showed that the model is transferable to the Standardization Program. State personnel performed five audits of stone fruit, melon, lettuce, citrus, and table grape handling operations to ensure the proper assessment rate is being followed. In order to ensure equity, handlers were randomly selected without regard to the location or size of the operation. These audits were intended to provide education to the industry and ensure compliance, as necessary. Approximately five to ten audits are expected to be completed in 2010. Revenue from the Standardization Program is down slightly, possibly due to the state’s ongoing drought and a decline in farmed acreage. ACCOMPLISHMENTS FOR 2009
A total of 1,897 non-compliance notices and 495 disposal orders were issued, 395,560 containers (representing a 77% increase from 2008) and 2,808 bins were rejected (Table 1). These rejections include 31,596 cartons of citrus, 37,628 cartons of tomatoes, 9,081 cartons of grapes, and 3,179 cartons of watermelons. Non-compliances for the most common regulated commodities are shown in Chart 1.
0
50
100
150
200
250
300
350
Citrus
Cantaloupes
Tomatoes
Watermelo
ns
Cherries
Table Grapes
Honeydews
Commodities
Non
Com
plian
ces
Chart 1. Number of non-compliance notices for the most common regulated commodities
NCs Issued 1,897 Containers 395,560 Number of Bins 2,808 Disposal Orders 495 Commodities 68
Table 1. Standardization Program Non-Compliance (NC) Report. Period of July 1, 2008 through June 30, 2009.

49 Inspection Services Annual Report
AVOCADO INSPECTION PROGRAM PROGRAM SUMMARY The Avocado Inspection Program ensures enforcement of quality standards, container, labeling, sizing, weights, maturity, and proof of ownership requirements at packing, storage, field distribution centers, and port of entry facilities. The goal is to protect the industry and consumers by providing uniform inspection to ensure that all avocados comply with minimum standards. TRENDS/ISSUES FROM 2009 With a shrinking resource base, the Avocado Inspection Program has been seeking reductions and consolidations to streamline operations. Avocado trees are still recovering from the freeze and other adverse weather conditions. Lack of fruit sizing has been due to colder soil temperatures. The small crop was due to water cut backs, freeze, and other weather related issues. Due to the past dry years coupled with reservoirs at all time lows, many water agencies have placed the avocado communities they serve under mandatory or voluntary cut backs in water usage. These cut backs can range anywhere from 10% to as high as 30%. In addition to the shortages, water rates will be on the increase in many areas as of January 1, 2009. ACCOMPLISHMENTS FOR 2009 Weights: A total of 215 non-compliance notices were issued, 15,484 cartons rejected and 27,183 weight tests were performed (Table 1). Size/Count: A total of 30 non-compliance notices were issued, 1,942 cartons rejected and
3,768 size/count tests were performed (Table 2). Maturity: A total of 52 non-compliance notices were issued, 901 cartons rejected and 1,536 maturity tests were performed (Table 3). The assessment rate was set at the maximum rate permitted by the Food and Agricultural Code Section 44975(a). Remittance fees based on crop size are .25 cents per hundred pounds weight. TABLES 1, 2 & 3
Weight Report: July 1, 2008 - June 30, 2009 Number of Weight Tests 27,183 Number of Non-Compliances 215 Cartons Rejected 15,484
Size/Count Report: July 1, 2008-June 30, 2009
Number of Size/Count Tests 3,768 Number of Non-Compliances 30 Cartons Rejected 1,942
Maturity Report: July 1, 2008 - June 30, 2009
Number of Maturity Tests 1,536 Number of Non Compliances 52 Cartons Rejected 901
1
2
3

DIRECT MARKETING PROGRAM (PREVIOUSLY REFERRED TO AS
CALIFORNIA FARMERS MARKET PROGRAM) PROGRAM SUMMARY
The Direct Marketing Program is responsible for enforcing the statutes governing certified farmers’ markets and produce sold at or near the point of production. Exemptions are provided to producers through the Department’s Standardization regulations for minimum size, labeling, standard pack, and containers. These exemptions allow the sale of produce directly to the public without disrupting the normal flow of commercial wholesaling. The Direct Marketing Program provides opportunities for certified producers to directly market their agricultural products at over 600 certified farmers’ markets throughout the state and enables non-profit organizations, community supported agricultural organizations, and local government agencies to operate certified farmers’ markets in both rural and urban areas throughout the state.
TRENDS/ISSUES IN 2009
The enactment of AB 2168 (Jones) (Ch. 447, Stats. of 2008) further expanded the Direct Marketing Program to allow Community Supported Agricultural Organizations and other private organizations to take advantage of these same exemptions, encouraging additional opportunities to provide fresh
fruits, vegetables, and nuts to areas that may otherwise be excluded. In a cooperative effort with industry and stakeholders, the Direct Marketing Program recently drafted regulations intended to implement the provisions of Assembly Bill 2168 (Ch. 447, Stats. of 2008) and ameliorate enforcement
mechanisms for the Certified Farmers’ Market Program. California producers continue to search for new and innovative methods to market their products directly to consumers, such as continued support for community supported agricultural organizations, electronic benefit transfer collection, online purchasing, and trading groups. In 2010/2011 The Direct Marketing Program will be developing an online registration and database program that will increase functionality and ease of access for its customers. ACCOMPLISHMENTS FOR 2009
California’s direct marketing industry continues to show signs of growth. Based on a recent survey conducted by CDFA, the number of certified farmers’ markets has increased from 550 to 610 (see Chart 1). Encouraged by the Certified Farmers’ Market Advisory Committee, the model for state enforcement of certified farmers’ markets was implemented with success. Inspectors from the Direct Marketing Program, Standardization Program, and State Organic Program are currently being cross-trained and utilized to enforce Direct Marketing regulations throughout the state. This method is a cost effective way of
460
480
500
520
540
560
580
600
620
Num
ber o
f CFM
s in
CA
2007-2008 2008-2009 2009-2010
Chart 1. Trend in California for Certified Farmers’ Markets
ensuring uniformity throughout the state. A total of ten certified farmers’ markets are selected randomly for inspection every three months. Cumulatively, 40 randomly
Inspection Services Annual Report 50

51 Inspection Services Annual Report
selected markets are inspected per year on a programmatic basis, including satellite markets, referred to as such due to their proximity to the selected farmers markets. Table 1 provides an overview of certified farmer’s market enforcement action for 2009.
FY 2009 Counties Inspected Number of Markets
Producers Inspected
Number of Non-Compliances
1st Qtr Los Angeles-San Luis Obispo-Shasta-Humboldt-Sonoma-Contra Costa-Alameda-Orange-San Bernardino-San Diego-Fresno
15 219 7
2nd Qtr Monterey - Ventura - Kern - Stanislaus-San Francisco - Marin - Solano 11 196 26
3rd Qtr Los Angeles - San Francisco - Santa Clara 9 183 11
4th Qtr Sacramento - Yolo - Sonoma - Contra Costa Santa Clara - Santa Barbara - Los Angeles - Orange
9 157 15
Totals 44 755 59
Table 1. Certified Farmers Market enforcement activity for 2009

Inspection Services Annual Report 52
CITRUS PROGRAM
PROGRAM BACKGROUND
The Citrus Program is responsible for protecting the industry and the general public from substandard product and ensuring that the established minimum maturity and quality standards are met. In addition, the Citrus Program is responsible for providing industry with current and accurate data regarding the state’s citrus acreage and citrus crop information. TRENDS/ISSUES FROM 2009
A new method of determining citrus maturity, Brim A, is currently being tested
to compare its effectiveness to the standard eight point ratio currently being used. The procedure for testing remains unchanged, but the formula for calculating the soluble solid/acid ratio would change under this new formula. ACCOMPLISHMENTS FOR 2009
The enactment of AB 281 (De Leon) (Ch. 426, Statutes of 2009) established the California Citrus Pest and Disease Prevention Committee (CCPDPC) in order to prevent and control citrus diseases in California. The CCPDPC consists of 17 members (14 producers in the citrus fruit industry, 2 nursery operators, and a public member) appointed by the CDFA Secretary. The CCPDPC is authorized to levy assessment fees for the purpose of preventing and controlling citrus diseases within California. The Citrus Program is responsible for collecting fees levied by the CCPDPC. The Citrus Program is currently in the process of developing an online registration and database program that will increase functionality and ease of access for its customers.
Commodity Non Compliances Cartons Bins
Oranges 104 8,049 283 Mandarins 90 4,885 0 Limes 79 18,201 0 Lemons 9 313 0 Grapefruit 9 138 0 Total 291 31,586 283
Table 1. Regulated Citrus by Commodity for 2009

53 Inspection Services Annual Report
CALIFORNIA ORGANIC PROGRAM CALIFORNIA STATE ORGANIC PROGRAM PROGRAM SUMMARY
ThOrganic Program (SOP) is responsible for enforcing the federal Organic Foods Production Act of 1990, the California Organic Products Act of 2003, and state and federal organic regulations. These statutes and regulations protect consumers, producers, handlers, processors, and retailers by establishing standards under which fresh agricultural products may be sold and labeled as organic. The Department’s continued support and enforcement of organic farming and production methods provides an opportunity for consumers to purchase products that are grown, handled, and processed in accordance with national organic standards. TRENDS/ISSUES FROM 2009
In 2009, the organic industry continued to grow and approximately 340 new operations registered with the SOP. In December 2008, SOP staff, the California Organic Products Advisory Committee (COPAC), and various stakeholders formed the Organic Products Technical Planning Committee to review and evaluate the SOP’s policies and procedures. As a result of the work of the Technical Planning Committee, the SOP developed regulations, expected to be filed with the Office of Administrative Law in the summer of 2010. The proposed regulations are designed to establish a spot inspection program to ensure that organic production and handling
operations are following the provisions of the Food and Agricultural Code and the Code of Federal Regulations; implement technical changes to the SOP’s registration program; provide a system to ensure that complaints related to organic products are investigated in a timely manner; and authorize CDFA personnel, county agricultural commissioners, and the operation’s accredited certifying agent to collect samples for laboratory analysis during the investigative process in order to determine compliance with the California Organic Products Act of 2003 and the Code of Federal Regulations.
ACCOMPLISHMENTS FOR 2009
The SOP revised its existing organic registration forms and letters to meet statutory needs and industry expectations while making the forms more user friendly for the organic industry. In addition, the SOP developed and implemented a Quality Systems Manual that includes all policies and procedures for the administration of all aspects of the SOP. All SOP forms and letters are included in the Quality Systems Manual
Year Total New Registrants
e Department’s California State
2009 340 2008 354 2007 442 2006 380 2005 306 2004 266
Fiscal Year* Registration Revenue
2009 $970,098 (projected) 2008 $991,778 2007 $916,544 2006 $814,397 2005 $654,558

for uniformity, consistency, and control complexities of program administration. The development of the database is part of an overhaul of all electronic data collection systems within Inspection Services, and a critical component to modernization and resource allocation of the SOP.
m
Inspection Services Annual Report 54
easures.
s mmenced preliminary new database and online
eduled for early 2011)
The SOP ha coork on a w
registration program (schcompletion in late 2010 tothat will meet the growing demands and

Inspection Services Annual Report 55
2009 Annual Report Office of Pesticide
Consultation & Analysis (OPCA)
Inspection Services Annual Report 56

OO icepeicepe CC RR r so
ti cctct mm ww rynaryna
ii ent alternatives to those
cals facing stringent ent alternatives to those
cals facing stringent
PR G Formeoff , Ins ctionOP A’s rDepartme(DP ) on
fun ion is supported withof the pesticide mill assessfunds DPR, and is implemme orandum of agreemen
et een the two sister agencies. In ar ing out its consultative role, OPCA a ges a series of outside research
cts, primarily with the University of California, which provide a source of unbiased expertise regarding potential regulatory impacts and the viability of pest managempesticide chemregulatory pressure.
RAM SUMMARY
rly attached to CDFA’s executive OPCA was relocated within the
Division in May 2009. ole is to consult with the nt of Pesticide Regulation new pesticide rulemakings
prio to public notice. Such consultation is a tatutory obligation instituted in resp nse to CDFA’s surrender of its pes cide regulatory authority to the nas ent DPR in 1991. The consultation
a small slice ment that ented via a t (MOA)
RAM SUMMARY
rly attached to CDFA’s executive OPCA was relocated within the
Division in May 2009. ole is to consult with the nt of Pesticide Regulation new pesticide rulemakings
prior to public notice. Such consultation is a statutory obligation instituted in response to CDFA’s surrender of its pesticide regulatory authority to the nascent DPR in 1991. The consultation
a small slice ment that ented via a t (MOA)
bbccmcontramcontra
TRENDS/ISSUES FROM 2009 OPCA’s primarycarried over fromDPR’s volatile o(VOC) rulemaking, designed to reduce
focus during 2009, prior years, was
rganic compound
smog-forming airborne pesticide emissions in keeping with the State Implementation Plan (SIP). During the year work continued on three research projects dealing with VOC issues: (1) an ongoing UC Davis agricultural
department study of ffects, a UC Cooperative
Extension analysis of alternatives to emulsifiable concentrate pesticides having high VOC emission potentials, nd a USDA/ARS analysis of various ethods (including tarps, water seals
nd organic amendments) designed to wer fumigant emissions.
In September DPR notified OPCA under the MOA that it might deny California registration of methyl iodide, the long-awaited fumigant replacement for methyl bromide (which continues to be phased out under the Montreal Protocol treaty that protects the stratospheric ozone layer). OPCA asked UC Davis to perform a quick-turnaround economic
pact study to support CDFA’s
economicseconomic e
amalo
im
57 Inspection Services Annual Report

c
su
Inspection Services Annual Report 58
on ltative comments to DPR, which ecember.
ase
the ce
ve e;
R in
of
unknowns (particularly the dicey regulatory future of major fumigant alternatives), flagged three particularly vulnerable crops: cut flowers, nursery, and strawberries. CDFA’s comments urged DPR to consolidate its disparate fumigant reviews into a single proceeding, and redirect its Pest Management Alliance grant funding into research geared toward reducing grower dependence upon fumigants.
lso during 2009, the UC Cooperative
nalysis made considerable progress, ’s
gant d the
2010).
carried a deadline of early D ACCOMPLISHMENTS FOR 2009 In April, the UC Davis agricultural economics department completed a cstudy of VOC regulatory impacts in Ventura County, which was published on CDFA’s website. Toward the end of the year, based on results of UCD’s excellent short-notipreliminary economic study (finalized inMay 2010) of methyl iodide non-registration, OPCA drafted consultaticomments for CDFA’s executive officthe comments were forwarded to DPDecember. The economic study, although subject to irresolvable uncertainty given the substantial array
AExtension emulsifiable concentrateaand was nearly 50% complete by yearend. Finally, the USDA/ARS fumiemissions reduction study completefield trials, and work commenced on their final report (due mid-year in

59 Inspection Services Annual Report
PHONE IRECTORY
DEN R FOR ANALYTICAL C TE
CHEMISTRY 3292 Meadowview Road Sacramento, CA 95832 Office: 916-262-1431 Fax: 916-262-1572 Nirmal Saini, Environmental Program Manager II Inge Biggs, Senior Environmental Scientist, Pesticide Data Program Sarva Gunjur, Senior Environmental Scientist, Quality Assurance Stan Kobata, Senior Environmental Scientist, Feed/Fertilizer Laboratory Amel Clifford, Senior Environmental Scientist, Pesticide Residue Laboratory Steve Siegel, Senior Environmental Scientist, Environmental Analysis Laboratory Tiffany Tu, Environmental Program Manager I, Food Safety Section Elaine Wong, Environmental Program Manager I, Environmental Safety Section Anaheim Lab 169 iberty AvenuAnaheim, CA 92801 Office: 714-680-7901 Eddy Zhou, Senior E vironmental Scientist FEED, FERTILIZER,
E. L e
n
LIVESTOCKDRUGS AND EGG REGULATORY SERVICES 560 J Street, Suite 220 Sacramento, CA 95814 Mailing Address 1220 N Street Sacramento, CA 95814 Office: 916-445-0444 Fax: 916-445-2171 Asif A. Maan, Branch Chief Ext. 3414 Operations Support Dale Rice, Program Supervisor Ext. 3429 Feed and Livestock Drug Inspection Program Jenna Areias, Acting Program Supervisor Ext. 3409 Inspectors Bakersfield Office: 559-452-9683 Chris Hansen Fax: 559-452-9459 El Centro Office: 760-356-4673
Percy Mejia Fax: 760-356-3073 Tim Walters Fresno Office: 559-452-9687
Frank Delgado Fax: 559-452-9459
Northern California Coun Danquah O
Ontario ly Moore
Oan
209-avidson
Safe Animal Feed EduE Sp
2 Fax: 209-942-1386
aterials IAmadou Ba,
O
Oichael Gingles
s Angeles O
Oe Fax: 510-
cramento Office: 916-445-0444 Marshall Stoddard Fax: 916-227-3220
Danielle House Fertilizer Research Education Program Edward Hard, FREP Research Program
Anthony Herrera, Program Supervisor Ext. 3505 Northern California/Coastal District Lisa Gonzales Office 916-445-4328 Fax: 916-445-0232
Central District Stacey Hughes Office: 559-297-5430 Fax: 559-297-5430
Southern California Fred Helenihi Office: 714-848-1340 Fax: 714-848-1340 INSPECTION AND COMPLIANCE
nties ffice: 916-445-0444
Fax: 916-359-0830 Office: 909-930-9689 Fax: 909-930-9453 ffice: 209-942-6197
Fax: 209-941-4039 942-6194 Fax: 209-942-1386
cation Program Jenna Areias, SAF ecialist Office: -942-6143
Fertilizing M Ext. 3419 Inspectors Fresno Justin Petty Kern MLo
Nick YoungOakland Pierre LabossierSa
Agyema
ShelSan Joaquin
Cyril HuismStockton Office:
Mike D Killeen Sanders
09
nspection Program Program Supervisor
ffice: 559-452-9687 Fax: 559-452-9459 ffice: 559-452-9179 Fax: 559-452-9459 ffice: 909-930-9689 Fax: 909-930-9458 ffice: 510-715-6399
534-5149
Specialist Ext. 3505 Egg Quality Control Program
560 J Street, Suite 220 Sacramento, CA 95814 Mailing Address 1220 N Street Sacramento, CA 95814 Office: 916-445-2180 Fax: 916-445-2427 Rick Jensen, Branch Chief Ext. 3459 Operations Support Cyd Mayo, Prog Supervisor Ext. 3465 Inspection and Food Safety Unit Steve Thomas, Branch Chief I4 Office: 559-595-8000 Fax: 559-595-8008
Grapes, Root egetables, and
s, Pears, Cherries, Tomatoes, Kiwifruit, Citrus, Processing
gin
Ceres Office: 209-537-0733 Steve Faulks Fax: 209-537-2314 Chico Office: 530-898-8427 Bruce Teramoto Fax: 530-898-9034 Fax: Lomo/Peaches 530-695-082440 Coachella Office: 760-347-2614 Mark Reis Fax: 760-347-2619 Dinuba Office: 559-595-8000 John Rodgers Fax: 559-595-8008 Oxnard Office: 805-207-8175 Melvin Nakaba Salinas Office: 831-769-8079 Roxann Bramlage Fax: 831-769-8099 Shafter Office: 661-391-4730 Greg Dake Fax: 661-391-4735 Ukiah Office: 707-467-9021 Kerman Office: 559-846-7323 Randy Pritchard Fax: 559-846-7336 Lodi Office: 209-333-5300 Marcee Yount Office: 209-333-5303 Fax: 209-333-5305 Riverside Office: 951-769-6897 Randy Richey Fax: 951-769-6916 San Diego Office: 619-661-6355 Charlie Priest Fax: 619-661-6963 Compliance Unit
SPI Commodity Programs Vickie Baker, Program Supervisor Office: 559-595-8000 Fax: (559-595-8008 (Tree Nuts, Almonds, Crops, Melons, Mixed VTree Fruits) Edward Brown, Program Supervisor Office: 559-595-8000 Fax: 559-595-8008 (Military Inspection
Inspections) BIQMS and Country of OriLabeling (COOL) Vickie Baker, Program Supervisor Office: 916-346-3062 Fax: 916-670-6387 District Offices Brawley Office: 760-344-6177 Roxann Bramlage Fax: 760-344-1463
Steve Patton, Branch Chief I (T&D) Ext. 3512 Standardization/Certified Farmers Market Susan Shelton, Supervising Special Investigator (T&D) Ext. 3439 Northern District Andrew Valero, Supervisor Office: 559-456-4603 Fax: 559-456-4603

Southern District Investigator
3294
cial Ext. 3462
stigator Ext. 3464
Ext. 3514
OFFICE OF PESTICIDE Julius Francisco, Central District Mario Cortez, Supervisor
Cell: 805-431- Organics Program Dave Carlson, Senior Spe
Investigator aul Collins, Senior InveP
Brian Cote, Special Investigator
Avocado Program/Lab Charles Goodman, Research Manager Office: 916-445-0409 Dave Luscher, Senior Agricultural Biologist Office: 916-445-0326 Donella Boreham, Supervisor Office: 760-743-4712 Fax: 760-747-2279 Voicemail: (760) 739-7700326 USDA Federal Program Tony Souza, Program Manager Office: 916-332-4758 Fax: 916-332-4360
CONSULTATION & ANALYSIS
67
ior 445-0326
4
560 "J" Street # 220 Sacramento, CA 95814 Office: 916-445-0398 Fax: 916-445-03 C Office: 916-445-04
harles Goodman, Research Manager 09
ave Luscher, Sen gricultural D ABiologist Office: 916-
nt l John Steggall, Staff Environme aScientist Office: 916-445-248
Inspection Services Annual Report 60

Inspection Services Annual Report 61
This rep d in memory of
worked ction in the Food Safety 2008 afte ore than 25 years, and passed
away on May 2010…
g Division of Inspection Services’ Staff Members ho retired in 2009:
Center for Analytical Chemistry
C Program Supervisor, is currently spending his time cruising the oceans with his wife.
former Environmental Scientist, now enjoying his retirement by reading
books he’s collected over the years as well as traveling the world.
Feed and Livestock Drug Inspection Program
Patricia “Kelsey” Olson
Inspection & Compliance
Helen Glacy Robert Ferrier
Herbert Ray Green
Tedmund Oda Gerry Miller
Carol Roberts John Galvan
…who are busy traveling to foreign lands, consulting, restoring classic cars, fishing and enjoying spending time with family…
Thank you for your service!
ort is dedicate
Karen Hefner, who at the Pesticide Residue se Laboratory, retired in r working at the CAC for m
…And the followin
w
Ton Joe, former CA
Vincent Quan,

Inspection Services Annual Report 62
California Department of Food and Agriculture Division of Inspection Services
1220 N Street, Sacramento, CA 95814 www.cdfa.ca.gov