dividends:(follow(up( - new york...
TRANSCRIPT

DIVIDENDS: FOLLOW UP Changing dividend policy is hard to do, but not doing it can be worse.

The Investment DecisionInvest in assets that earn a return
greater than the minimum acceptable hurdle rate
The Financing DecisionFind the right kind of debt for your firm and the right mix of debt and
equity to fund your operations
The Dividend DecisionIf you cannot find investments that make your minimum acceptable rate, return the
cash to owners of your business
Hurdle Rate4. Define & Measure Risk5. The Risk free Rate6. Equity Risk Premiums7. Country Risk Premiums8. Regression Betas9. Beta Fundamentals10. Bottom-up Betas11. The "Right" Beta12. Debt: Measure & Cost13. Financing Weights
Investment Return14. Earnings and Cash flows15. Time Weighting Cash flows16. Loose Ends
Financing Mix17. The Trade off18. Cost of Capital Approach19. Cost of Capital: Follow up20. Cost of Capital: Wrap up21. Alternative Approaches22. Moving to the optimal
Financing Type23. The Right Financing
Dividend Policy24. Trends & Measures25. The trade off26. Assessment27. Action & Follow up28. The End Game
Valuation29. First steps30. Cash flows31. Growth32. Terminal Value33. To value per share34. The value of control35. Relative Valuation
Set Up and Objective1: What is corporate finance2: The Objective: Utopia and Let Down3: The Objective: Reality and Reaction
36. Closing Thoughts

3
A PracFcal Framework for Analyzing Dividend Policy
How much did the firm pay out? How much could it have afforded to pay out?!What it could have paid out! What it actually paid out!Net Income! Dividends!- (Cap Ex - Depr’n) (1-DR)! + Equity Repurchase!- Chg Working Capital (1-DR)!= FCFE!
Firm pays out too little!FCFE > Dividends! Firm pays out too much!
FCFE < Dividends!
Do you trust managers in the company with!your cash?!Look at past project choice:!Compare! ROE to Cost of Equity!
ROC to WACC!
What investment opportunities does the !firm have?!Look at past project choice:!Compare! ROE to Cost of Equity!
ROC to WACC!
Firm has history of !good project choice !and good projects in !the future!
Firm has history!of poor project !choice!
Firm has good !projects!
Firm has poor !projects!
Give managers the !flexibility to keep !cash and set !dividends!
Force managers to !justify holding cash !or return cash to !stockholders!
Firm should !cut dividends !and reinvest !more !
Firm should deal !with its investment !problem first and !then cut dividends!

4
A Dividend Matrix
Quality of projects taken: ROE versus Cost of EquityPoor projects Good projects
Cash Surplus + Good ProjectsMaximum flexibility in setting dividend policy
Cash Surplus + Poor ProjectsSignificant pressure to pay out more to stockholders as dividends or stock buybacks
Cash Deficit + Good ProjectsReduce cash payout, if any, to stockholders
Cash Deficit + Poor ProjectsCut out dividends but real problem is in investment policy.
5
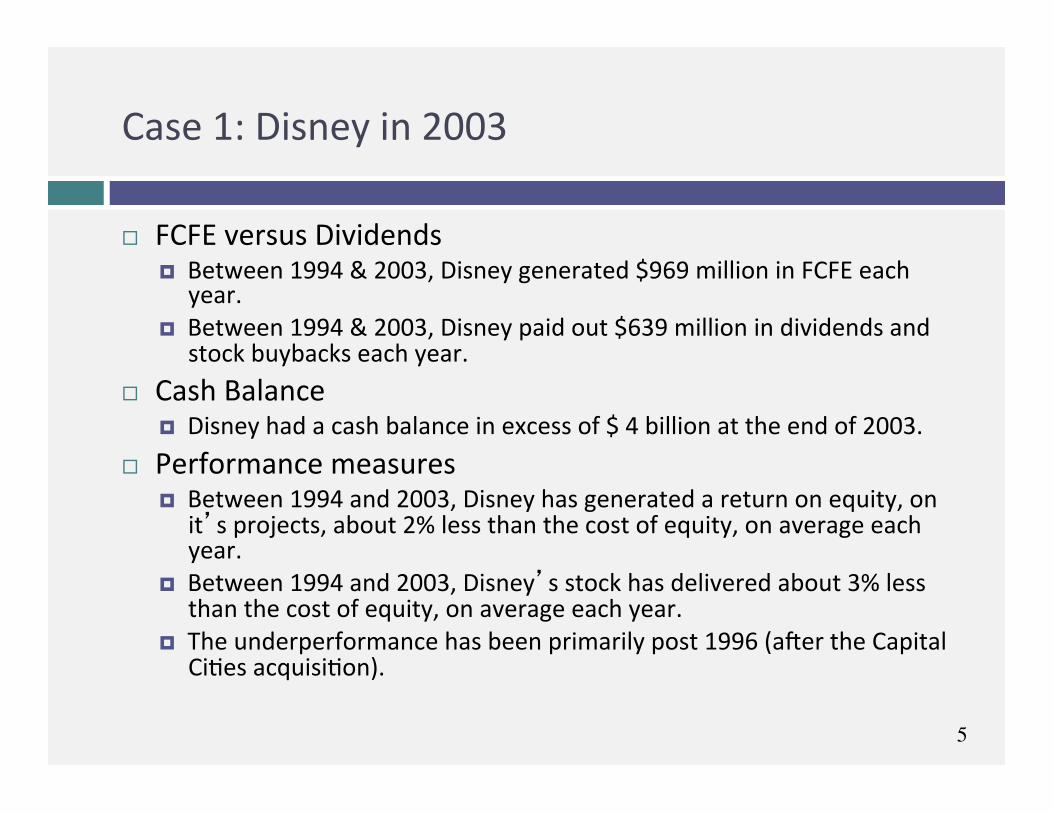
Case 1: Disney in 2003
¨ FCFE versus Dividends ¤ Between 1994 & 2003, Disney generated $969 million in FCFE each
year. ¤ Between 1994 & 2003, Disney paid out $639 million in dividends and
stock buybacks each year. ¨ Cash Balance
¤ Disney had a cash balance in excess of $ 4 billion at the end of 2003. ¨ Performance measures
¤ Between 1994 and 2003, Disney has generated a return on equity, on it’s projects, about 2% less than the cost of equity, on average each year.
¤ Between 1994 and 2003, Disney’s stock has delivered about 3% less than the cost of equity, on average each year.
¤ The underperformance has been primarily post 1996 (a\er the Capital CiFes acquisiFon).

6
Can you trust Disney’s management?
¨ Given Disney’s track record between 1994 and 2003, if you were a Disney stockholder, would you be comfortable with Disney’s dividend policy?
a. Yes b. No ¨ Does the fact that the company is run by Michael Eisner, the CEO for the last 10 years and the iniFator of the Cap CiFes acquisiFon have an effect on your decision.
a. Yes b. No

7
Following up: Disney in 2009
¨ Between 2004 and 2008, Disney made significant changes: ¤ It replaced its CEO, Michael Eisner, with a new CEO, Bob Iger, who at
least on the surface seemed to be more recepFve to stockholder concerns.
¤ Its stock price performance improved (posiFve Jensen’s alpha) ¤ Its project choice improved (ROC moved from being well below cost of
capital to above) ¨ The firm also shi\ed from cash returned < FCFE to cash
returned > FCFE and avoided making large acquisiFons. ¨ If you were a stockholder in 2009 and Iger made a plea to
retain cash in Disney to pursue investment opportuniFes, would you be more recepFve? a. Yes b. No

8
Final twist: Disney in 2013
¨ Disney did return to holding cash between 2008 and 2013, with dividends and buybacks amounFng to $2.6 billion less than the FCFE (with a target debt raFo) over this period.
¨ Disney conFnues to earn a return on capital well in excess of the cost of capital and its stock has doubled over the last two years.
¨ Now, assume that Bob Iger asks you for permission to withhold even more cash to cover future investment needs. Are you likely to go along?
a. Yes b. No

9
Case 2: Vale – Dividends versus FCFE
Aggregate Average Net Income $57,404 $5,740 Dividends $36,766 $3,677 Dividend Payout Ratio $1 $1 Stock Buybacks $6,032 $603 Dividends + Buybacks $42,798 $4,280 Cash Payout Ratio $1 Free CF to Equity (pre-debt) ($1,903) ($190) Free CF to Equity (actual debt) $1,036 $104
Free CF to Equity (target debt ratio) $19,138 $1,914
Cash payout as % of pre-debt FCFE FCFE negative Cash payout as % of actual FCFE 4131.08% Cash payout as % of target FCFE 223.63%

10
Vale: Its your call..
¨ Vale’s managers have asked you for permission to cut dividends (to more manageable levels). Are you likely to go along? a. Yes b. No
¨ The reasons for Vale’s dividend problem lie in it’s equity structure. Like most Brazilian companies, Vale has two classes of shares -‐ common shares with voFng rights and preferred shares without voFng rights. However, Vale has commiked to paying out 35% of its earnings as dividends to the preferred stockholders. If they fail to meet this threshold, the preferred shares get voFng rights. If you own the preferred shares, would your answer to the quesFon above change? a. Yes b. No

11
Case 3: BP: Summary of Dividend Policy: 1982-‐1991
Summary of calculations Average Standard Deviation Maximum Minimum
Free CF to Equity $571.10 $1,382.29 $3,764.00 ($612.50) Dividends $1,496.30 $448.77 $2,112.00 $831.00 Dividends+Repurchases $1,496.30 $448.77 $2,112.00 $831.00
Dividend Payout Ratio 84.77% Cash Paid as % of FCFE 262.00%
ROE - Required return -1.67% 11.49% 20.90% -21.59%

12
BP: Just Desserts!

13
Managing changes in dividend policy
14
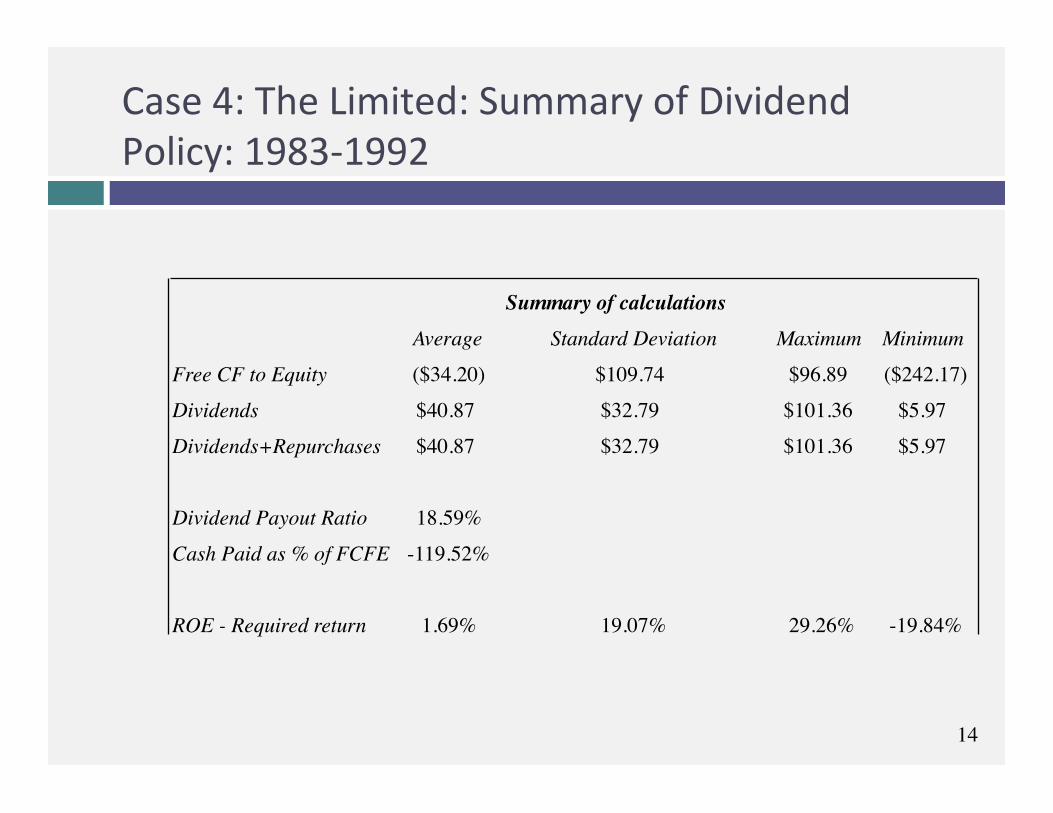
Case 4: The Limited: Summary of Dividend Policy: 1983-‐1992
Summary of calculations Average Standard Deviation Maximum Minimum
Free CF to Equity ($34.20) $109.74 $96.89 ($242.17) Dividends $40.87 $32.79 $101.36 $5.97 Dividends+Repurchases $40.87 $32.79 $101.36 $5.97
Dividend Payout Ratio 18.59% Cash Paid as % of FCFE -119.52%
ROE - Required return 1.69% 19.07% 29.26% -19.84%

15
Growth Firms and Dividends
¨ High growth firms are someFmes advised to iniFate dividends because its increases the potenFal stockholder base for the company (since there are some investors -‐ like pension funds -‐ that cannot buy stocks that do not pay dividends) and, by extension, the stock price. Do you agree with this argument? a. Yes b. No
¨ Why?

16
5. Tata Motors
Aggregate Average Net Income $421,338.00 $42,133.80 Dividends $74,214.00 $7,421.40 Dividend Payout Ratio 17.61% 15.09% Stock Buybacks $970.00 $97.00 Dividends + Buybacks $75,184.00 $7,518.40 Cash Payout Ratio 17.84% Free CF to Equity (pre-debt) ($106,871.00) ($10,687.10) Free CF to Equity (actual debt) $825,262.00 $82,526.20 Free CF to Equity (target debt ratio) $47,796.36 $4,779.64 Cash payout as % of pre-debt FCFE FCFE negative Cash payout as % of actual FCFE 9.11% Cash payout as % of target FCFE 157.30%
Negative FCFE, largely because of acquisitions.

17
6 ApplicaFon Test: Assessing your firm’s dividend policy
¨ Compare your firm’s dividends to its FCFE, looking at the last 5 years of informaFon.
¨ Based upon your earlier analysis of your firm’s project choices, would you encourage the firm to return more cash or less cash to its owners?
¨ If you would encourage it to return more cash, what form should it take (dividends versus stock buybacks)?

18
Read Chapter 11
Task Compare the
cash returned at your company to what is could have & make a judgment on whether its
policies have to change.