dividend policy reddy - nse · 1 dividend policy of indian corporate firms y subba reddy∗...
TRANSCRIPT
1
Dividend Policy Of Indian Corporate Firms Y Subba Reddy∗
Introduction
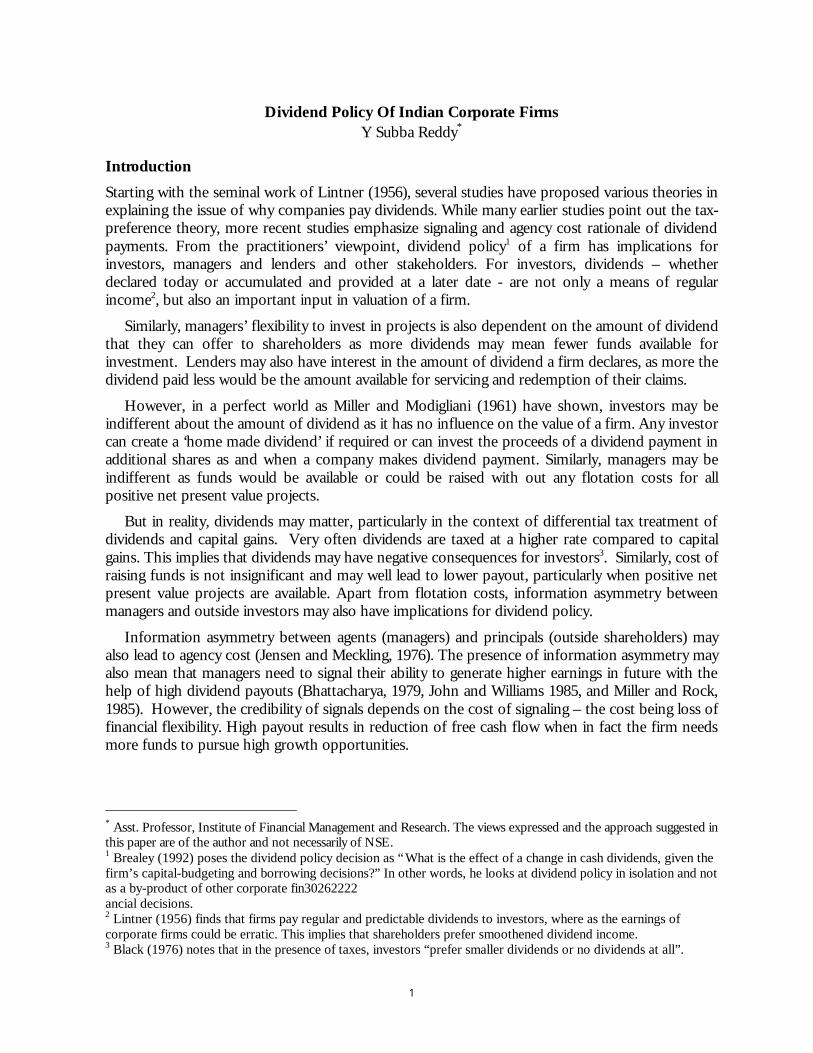
Starting with the seminal work of Lintner (1956), several studies have proposed various theories in explaining the issue of why companies pay dividends. While many earlier studies point out the tax-preference theory, more recent studies emphasize signaling and agency cost rationale of dividend payments. From the practitioners’ viewpoint, dividend policy1 of a firm has implications for investors, managers and lenders and other stakeholders. For investors, dividends – whether declared today or accumulated and provided at a later date - are not only a means of regular income2, but also an important input in valuation of a firm.
Similarly, managers’ flexibility to invest in projects is also dependent on the amount of dividend that they can offer to shareholders as more dividends may mean fewer funds available for investment. Lenders may also have interest in the amount of dividend a firm declares, as more the dividend paid less would be the amount available for servicing and redemption of their claims.
However, in a perfect world as Miller and Modigliani (1961) have shown, investors may be indifferent about the amount of dividend as it has no influence on the value of a firm. Any investor can create a ‘home made dividend’ if required or can invest the proceeds of a dividend payment in additional shares as and when a company makes dividend payment. Similarly, managers may be indifferent as funds would be available or could be raised with out any flotation costs for all positive net present value projects.
But in reality, dividends may matter, particularly in the context of differential tax treatment of dividends and capital gains. Very often dividends are taxed at a higher rate compared to capital gains. This implies that dividends may have negative consequences for investors3. Similarly, cost of raising funds is not insignificant and may well lead to lower payout, particularly when positive net present value projects are available. Apart from flotation costs, information asymmetry between managers and outside investors may also have implications for dividend policy.
Information asymmetry between agents (managers) and principals (outside shareholders) may also lead to agency cost (Jensen and Meckling, 1976). The presence of information asymmetry may also mean that managers need to signal their ability to generate higher earnings in future with the help of high dividend payouts (Bhattacharya, 1979, John and Williams 1985, and Miller and Rock, 1985). However, the credibility of signals depends on the cost of signaling – the cost being loss of financial flexibility. High payout results in reduction of free cash flow when in fact the firm needs more funds to pursue high growth opportunities.
∗ Asst. Professor, Institute of Financial Management and Research. The views expressed and the approach suggested in this paper are of the author and not necessarily of NSE. 1 Brealey (1992) poses the dividend policy decision as “What is the effect of a change in cash dividends, given the firm’s capital-budgeting and borrowing decisions?” In other words, he looks at dividend policy in isolation and not as a by-product of other corporate fin30262222 ancial decisions. 2 Lintner (1956) finds that firms pay regular and predictable dividends to investors, where as the earnings of corporate firms could be erratic. This implies that shareholders prefer smoothened dividend income. 3 Black (1976) notes that in the presence of taxes, investors “prefer smaller dividends or no dividends at all”.
2
One of the striking aspects that have been noticed in recent periods is the lower dividend paid by corporate firms in the US as observed by Fama and French (2001). They attribute the decline to changing firm characteristics of size, earnings and growth.
In the Indian context, various studies conducted to analyse the dividend payment pattern of corporate firms have given out various results. Mahapatra and Sahu (1993) found that cash flow is a major determinant of dividend followed by net earnings, Bhat and Pandey (1994) found that managers perceive current earnings as the most significant factor. Narasimhan and Vijayalaksmi (2002) found that there is no influence of insider ownership on dividend behaviour of firms.
However, from the above Indian studies, it is still not clear as to what is the dividend payment pattern of firms in India and why do they initiate and omit dividend payments or reduce or increase dividend payments. Hence it is proposed to analyze the dividend payout of firms in India and analyze the dividend initiations and omissions and other changes in dividends and the signals that these events convey.
Database and Methodology
The present study examines the dividend behavior of Indian corporate firms over the period 1990-01 for all companies that are listed for trading on one of the two major exchanges namely National Stock Exchange (NSE) and Bombay Stock Exchange (BSE) during the period 1989-90 to 2000-01.
To analyze the trends in dividend payment pattern, number of companies paying dividend as percentage of total firms, average dividend paid, dividend per share, payout ratio, and dividend yield are computed for the period 1990 to 2001. Further, the entire sample is categorized into payers and non-payers to examine the trends in dividends across different subgroups. Payers are those firms that have paid dividend in the current year, where as non-payers have not paid dividend in the current year.
To analyze signaling hypothesis, consistent with Healey and Palepu, earnings patterns of firms initiating and omitting dividend for 3 years before the year of event and 3 years after event are examined. For this part of the analysis, a firm is classified as initiator if it has paid dividend in the current year but has not paid dividends for the preceding 3 years. Similarly a firm is categorized as omission firm, if the firm has not currently paid dividend but has paid dividend in the preceding three years.
Analysis pertaining to initiations and omissions only cover a particular sample of extreme events and excludes firms not having a dividend track record of less than 3 years. In order to cover other dividend events like dividend reductions and increases in the following we arrive at yet another sample. To analyze the relationship between dividends and losses a sample is drawn with firms having consistent profitability and dividend track records during 1990–95 and who have earnings and dividend information for the period 1996–01. The importance of annual losses on dividend reductions and annual dividend omissions has been analyzed with the help of logit analysis. Similarly to examine the influence of past and future levels of earnings logit analysis has been employed on the subset for event years 1997 and 1998.
Findings of Study
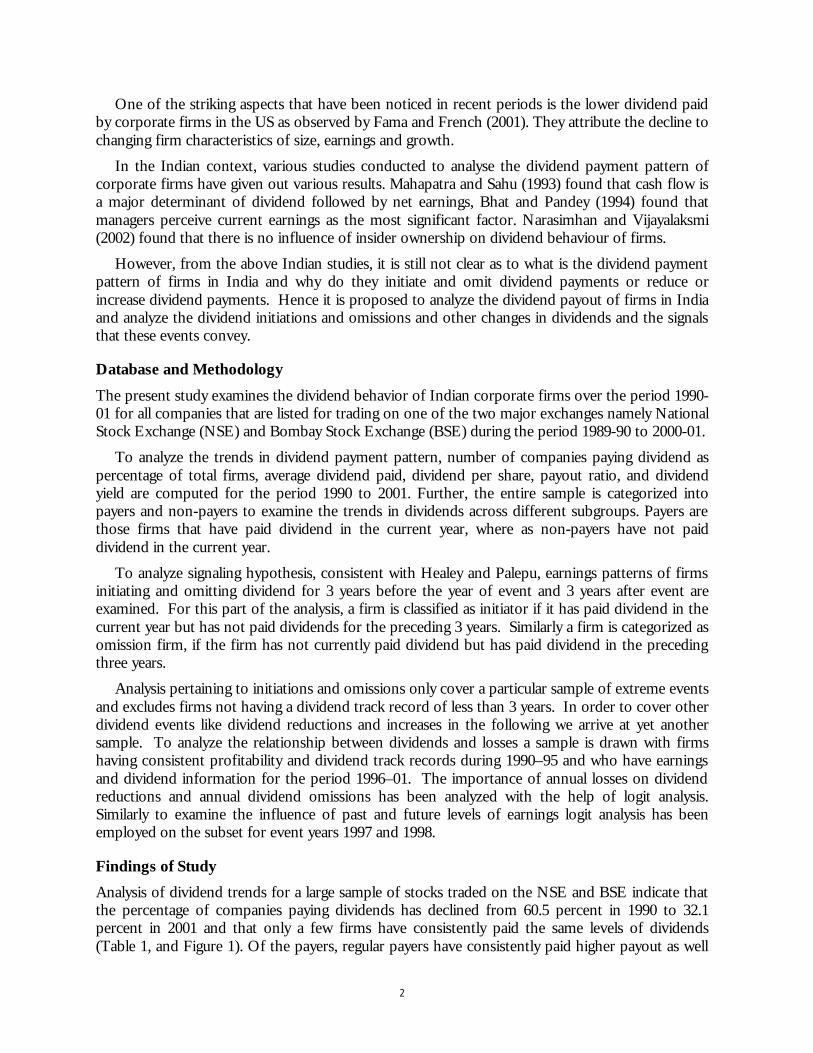
Analysis of dividend trends for a large sample of stocks traded on the NSE and BSE indicate that the percentage of companies paying dividends has declined from 60.5 percent in 1990 to 32.1 percent in 2001 and that only a few firms have consistently paid the same levels of dividends (Table 1, and Figure 1). Of the payers, regular payers have consistently paid higher payout as well
3
as higher average dividend compared to that of current payers (Figure 2). Initiators have always paid higher levels of dividend yield compared to that of other payers. Further, smaller indices appear to have higher dividends compared to that of larger indices. Industry trends indicate that firms in the electricity, mining and diversified industries have paid higher dividends where as textile companies have paid less dividends (Table 2).
Table 1
Trend in Dividend Payments During 1990-2001
Year Paid Dividend Not Paid Dividend
Total Number of Firms
No. % No. % 1990 1033 60.50 674 39.50 1707 1991 1272 58.20 912 41.80 2184 1992 1533 61.20 972 38.80 2505 1993 1823 58.90 1274 41.10 3097 1994 2333 58.00 1687 42.00 4020 1995 2775 54.30 2340 45.70 5115 1996 2723 48.60 2877 51.40 5600 1997 2386 40.80 3469 59.20 5855 1998 2101 35.10 3879 64.90 5980 1999 2007 32.10 4241 67.90 6248 2000 1988 31.90 4237 68.10 6225 2001 1531 32.10 3235 67.90 4766
Figure 1 Dividend Behaviour of Indian Corporate Firms During
1990 - 2001 (in %)
0%
10%
20%
30%
40%
50%
60%
70%
80%
1990 1992 1994 1996 1998 2000
Year
% o
f Firm
s
% Non-Payers % Payers
Figure 2
1% Trimmed Dividend Per Share by Payer Type
0.05
0.1
0.15
0.2
0.25
0.3
0.35
1991 1993 1995 1997 1999 2001
Year
DPS
(in R
s.)
Current Payers Initiators Regular Payers Total
Table 2
Industry-wise Dividend Per Share (DPS) During 1990-2001 (in Rs.) INDUSTRY 1990 1991 1992 1993 1994 1995 1996 1997 1998 1999 2000 2001 FIRMS Chemicals and Plastics .14 .15 .14 .12 .17 .15 .12 .17 .17 .18 .27 .25 1138 Diversified .19 .21 .26 .20 .20 .19 .21 .22 .21 .22 .27 .21 184 Electricity .13 .10 .11 .11 .11 .10 .12 .09 .10 .10 .13 .10 58 Financial Services .08 .11 .13 .34 .24 .21 .28 .12 .15 .14 .19 .18 1097 Food and Beverages .20 .20 .18 .23 .31 .47 .49 .58 .85 .21 .16 .13 745 Machineray .12 .13 .14 .14 .13 .13 .17 .19 .12 .14 .14 .14 1065 Metals and Metal Product .13 .11 .11 .09 .10 .10 .12 .09 .07 .06 .07 .07 555 Mining .05 .07 .06 .07 .09 .06 .07 .08 .13 .10 .11 .09 81 Misc. Manufacturing .12 .12 .14 .10 .11 .10 .10 .15 .06 .16 .21 .30 324 Non-Metallic Mineral Pro .10 .11 .11 .09 .09 .09 .10 .08 .08 .07 .09 .09 296
4
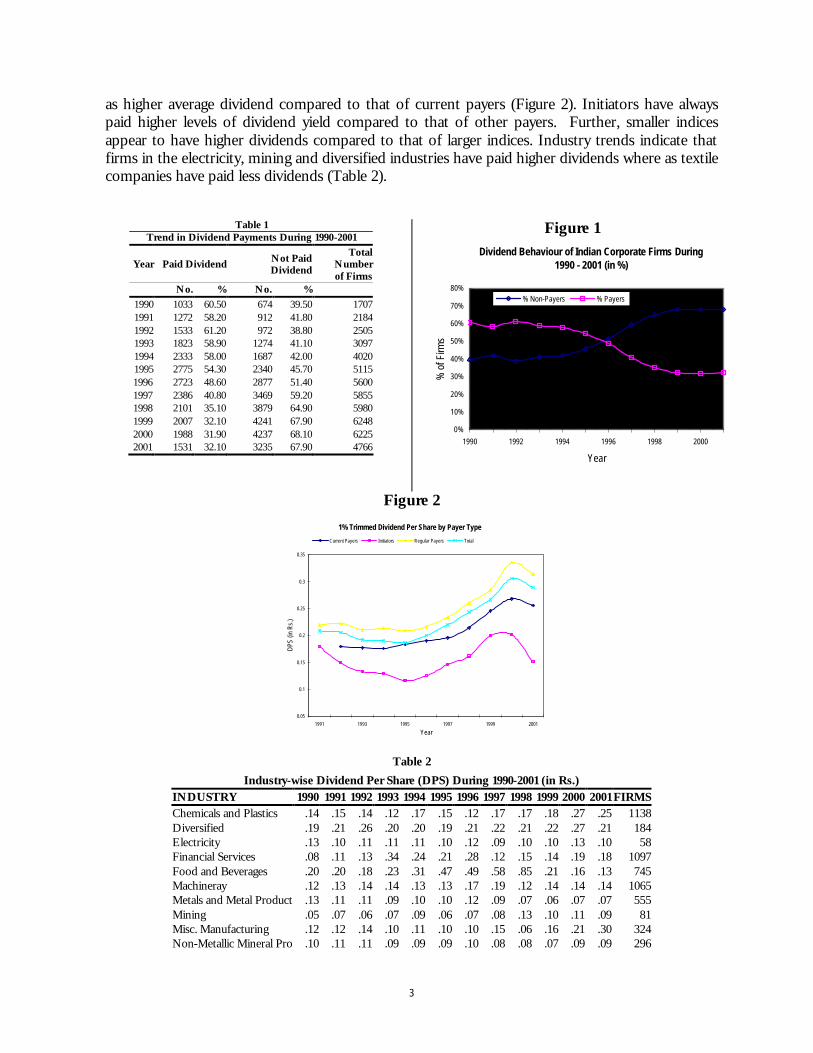
Other Services .17 .15 .17 .15 .13 .24 .38 .28 .42 .88 .73 .12 1264 Textiles .13 .14 .13 .11 .12 .09 .08 .06 .06 .05 .07 .06 750 Transport Equipment .12 .12 .12 .12 .13 .13 .15 .18 .16 .15 .21 .17 225
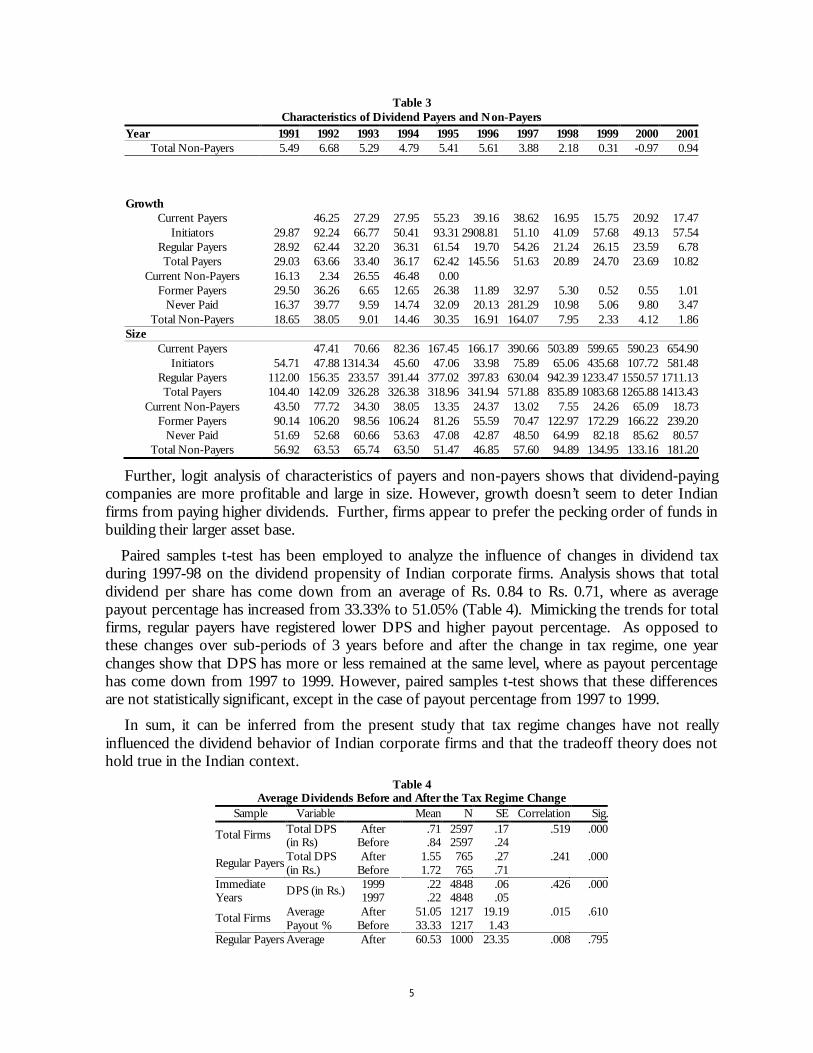
Payers on an average have more than twice the payoff on assets compared to that of non-payers (Table 3). This finding is consistent with Fama and French (2001). Of the payers Initiators appear to have on an average higher payoff on assets compared to current payers and regular payers, though their payoffs on assets have shown considerable fluctuations. Current payers and regular payers have similar levels of payoff on assets.
Of the non-payers, former payers appear to have higher payoff on assets compared to firms, which never paid dividends. Never paid in turn appears to higher payoff on assets compared to current non-payers. It can be concluded from the analysis that profitability has positive influence on the dividend payment of a corporate firm. Dividend payers are more profitable compared to non-payers. Further, corporate firms in general and non-dividend payers in particular have become less profitable.
An analysis of growth of assets shows that payers on an average have higher growth compared to that of non-payers. Payers have grown at percentages of 29.03 in 1991, 23.69 in 2000 and 10.82 in 2001 compared to 18.65, 4.12 and 1.86 in the corresponding years for non-payers. Of the payers initiators appear to have higher growth percentage compared to that of regular payers. Initiators have grown at percentages of 29.87 in 1991, 49.13 in 2000 and 57.54 in 2001 compared to 28.92, 23.59 and 6.78 in the corresponding years for regular payers. Regular payers in turn appear to have higher growth compared to that of current payers. Of the non-payers, never paid have on an average lower growth in assets compared to former payers and current payers. These findings are not consistent with Fama and French where they find never paid firms to have higher growth in assets compared to that of other non-payer and payer groups. Similar trends are observed with regard to growth opportunities as measured by R&D investment to total assets. Payers appear to have higher growth opportunities compared to non-payers.
Dividend payers appear to be much larger in size compared to that of non-payers. This observation is consistent with Fama and French (2001). Average size as measured by assets of payers averaged Rs. 104.4 crore in 1991 and Rs. 1413.43 in 2001 compared to that of Rs. 56.92 and Rs. 181.20 in the corresponding years for non-payers.
Of the payers, regular payers have higher assets compared to that of current payers. Current payers in turn have higher assets compared to initiators. Similarly, regular payers have grown an average asset base of Rs. 112 crore in 1991 to Rs. 1711 crore in 2001 compared to Rs. 54.71 crore and Rs. 581.48 core for initiators and Rs. 47.11 crore in 1992 and Rs. 654.9 crore for current payers.
Table 3 Characteristics of Dividend Payers and Non-Payers
Year 1991 1992 1993 1994 1995 1996 1997 1998 1999 2000 2001 Profitability
Current Payers 11.20 12.23 12.67 13.99 12.27 11.38 11.44 9.98 10.02 10.39 Initiators 9.79 15.15 12.57 15.19 13.66 11.25 10.86 2.56 17.02 14.95 14.20
Regular Payers 11.69 12.03 12.00 12.24 12.21 12.02 11.82 11.38 11.31 11.17 11.56 Total Payers 11.44 12.32 12.07 12.58 12.56 11.99 11.71 11.16 11.18 11.02 11.38
Current Non-Payers 6.58 5.16 3.69 3.16 1.99 3.67 2.36 1.71 6.30 -5.81 -3.63 Former Payers 10.24 7.41 6.23 5.37 5.94 9.06 4.81 1.89 0.05 -1.52 -0.04
Never Paid 4.44 6.71 5.29 4.91 5.73 3.89 3.19 2.51 0.63 -0.17 2.65
5
Table 3 Characteristics of Dividend Payers and Non-Payers
Year 1991 1992 1993 1994 1995 1996 1997 1998 1999 2000 2001 Total Non-Payers 5.49 6.68 5.29 4.79 5.41 5.61 3.88 2.18 0.31 -0.97 0.94
Growth
Current Payers 46.25 27.29 27.95 55.23 39.16 38.62 16.95 15.75 20.92 17.47 Initiators 29.87 92.24 66.77 50.41 93.31 2908.81 51.10 41.09 57.68 49.13 57.54
Regular Payers 28.92 62.44 32.20 36.31 61.54 19.70 54.26 21.24 26.15 23.59 6.78 Total Payers 29.03 63.66 33.40 36.17 62.42 145.56 51.63 20.89 24.70 23.69 10.82
Current Non-Payers 16.13 2.34 26.55 46.48 0.00 Former Payers 29.50 36.26 6.65 12.65 26.38 11.89 32.97 5.30 0.52 0.55 1.01
Never Paid 16.37 39.77 9.59 14.74 32.09 20.13 281.29 10.98 5.06 9.80 3.47 Total Non-Payers 18.65 38.05 9.01 14.46 30.35 16.91 164.07 7.95 2.33 4.12 1.86
Size Current Payers 47.41 70.66 82.36 167.45 166.17 390.66 503.89 599.65 590.23 654.90
Initiators 54.71 47.88 1314.34 45.60 47.06 33.98 75.89 65.06 435.68 107.72 581.48 Regular Payers 112.00 156.35 233.57 391.44 377.02 397.83 630.04 942.39 1233.47 1550.57 1711.13 Total Payers 104.40 142.09 326.28 326.38 318.96 341.94 571.88 835.89 1083.68 1265.88 1413.43
Current Non-Payers 43.50 77.72 34.30 38.05 13.35 24.37 13.02 7.55 24.26 65.09 18.73 Former Payers 90.14 106.20 98.56 106.24 81.26 55.59 70.47 122.97 172.29 166.22 239.20
Never Paid 51.69 52.68 60.66 53.63 47.08 42.87 48.50 64.99 82.18 85.62 80.57 Total Non-Payers 56.92 63.53 65.74 63.50 51.47 46.85 57.60 94.89 134.95 133.16 181.20
Further, logit analysis of characteristics of payers and non-payers shows that dividend-paying companies are more profitable and large in size. However, growth doesn’t seem to deter Indian firms from paying higher dividends. Further, firms appear to prefer the pecking order of funds in building their larger asset base.
Paired samples t-test has been employed to analyze the influence of changes in dividend tax during 1997-98 on the dividend propensity of Indian corporate firms. Analysis shows that total dividend per share has come down from an average of Rs. 0.84 to Rs. 0.71, where as average payout percentage has increased from 33.33% to 51.05% (Table 4). Mimicking the trends for total firms, regular payers have registered lower DPS and higher payout percentage. As opposed to these changes over sub-periods of 3 years before and after the change in tax regime, one year changes show that DPS has more or less remained at the same level, where as payout percentage has come down from 1997 to 1999. However, paired samples t-test shows that these differences are not statistically significant, except in the case of payout percentage from 1997 to 1999.
In sum, it can be inferred from the present study that tax regime changes have not really influenced the dividend behavior of Indian corporate firms and that the tradeoff theory does not hold true in the Indian context.
Table 4 Average Dividends Before and After the Tax Regime Change
Sample Variable Mean N SE Correlation Sig.After .71 2597 .17 .519 .000Total Firms Total DPS
(in Rs) Before .84 2597 .24 After 1.55 765 .27 .241 .000Regular Payers Total DPS
(in Rs.) Before 1.72 765 .71 1999 .22 4848 .06 .426 .000Immediate
Years DPS (in Rs.) 1997 .22 4848 .05 After 51.05 1217 19.19 .015 .610Total Firms Average
Payout % Before 33.33 1217 1.43 Regular Payers Average After 60.53 1000 23.35 .008 .795
6
Payout % Before 38.07 1000 1.68 1999 27.78 2987 2.65 .072 .000Immediate
Years Payout % 1997 35.87 2987 2.87
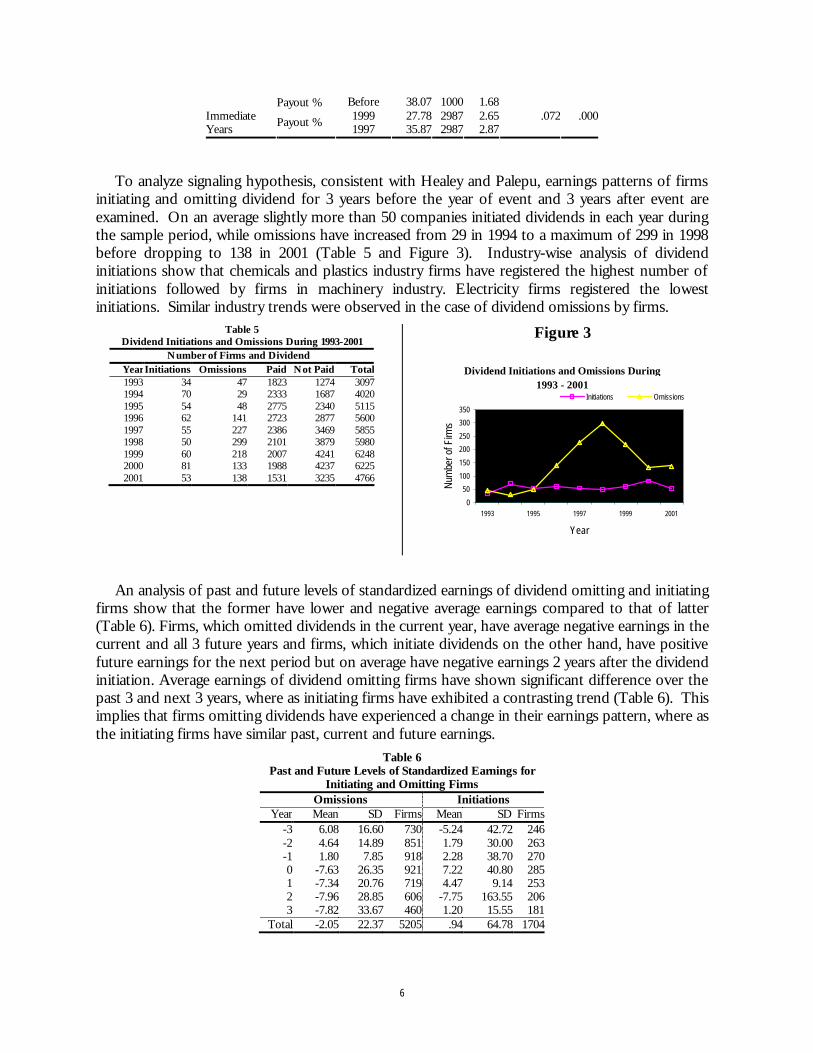
To analyze signaling hypothesis, consistent with Healey and Palepu, earnings patterns of firms initiating and omitting dividend for 3 years before the year of event and 3 years after event are examined. On an average slightly more than 50 companies initiated dividends in each year during the sample period, while omissions have increased from 29 in 1994 to a maximum of 299 in 1998 before dropping to 138 in 2001 (Table 5 and Figure 3). Industry-wise analysis of dividend initiations show that chemicals and plastics industry firms have registered the highest number of initiations followed by firms in machinery industry. Electricity firms registered the lowest initiations. Similar industry trends were observed in the case of dividend omissions by firms.
Table 5 Dividend Initiations and Omissions During 1993-2001
Number of Firms and Dividend Year Initiations Omissions Paid Not Paid Total 1993 34 47 1823 1274 30971994 70 29 2333 1687 40201995 54 48 2775 2340 51151996 62 141 2723 2877 56001997 55 227 2386 3469 58551998 50 299 2101 3879 59801999 60 218 2007 4241 62482000 81 133 1988 4237 62252001 53 138 1531 3235 4766
Figure 3
Dividend Initiations and Omissions During 1993 - 2001
0
50
100
150
200
250
300
350
1993 1995 1997 1999 2001
Year
Num
ber o
f Firm
s
Initiations Omissions
An analysis of past and future levels of standardized earnings of dividend omitting and initiating firms show that the former have lower and negative average earnings compared to that of latter (Table 6). Firms, which omitted dividends in the current year, have average negative earnings in the current and all 3 future years and firms, which initiate dividends on the other hand, have positive future earnings for the next period but on average have negative earnings 2 years after the dividend initiation. Average earnings of dividend omitting firms have shown significant difference over the past 3 and next 3 years, where as initiating firms have exhibited a contrasting trend (Table 6). This implies that firms omitting dividends have experienced a change in their earnings pattern, where as the initiating firms have similar past, current and future earnings.
Table 6 Past and Future Levels of Standardized Earnings for
Initiating and Omitting Firms Omissions Initiations
Year Mean SD Firms Mean SD Firms-3 6.08 16.60 730 -5.24 42.72 246-2 4.64 14.89 851 1.79 30.00 263-1 1.80 7.85 918 2.28 38.70 2700 -7.63 26.35 921 7.22 40.80 2851 -7.34 20.76 719 4.47 9.14 2532 -7.96 28.85 606 -7.75 163.55 2063 -7.82 33.67 460 1.20 15.55 181
Total -2.05 22.37 5205 .94 64.78 1704
7
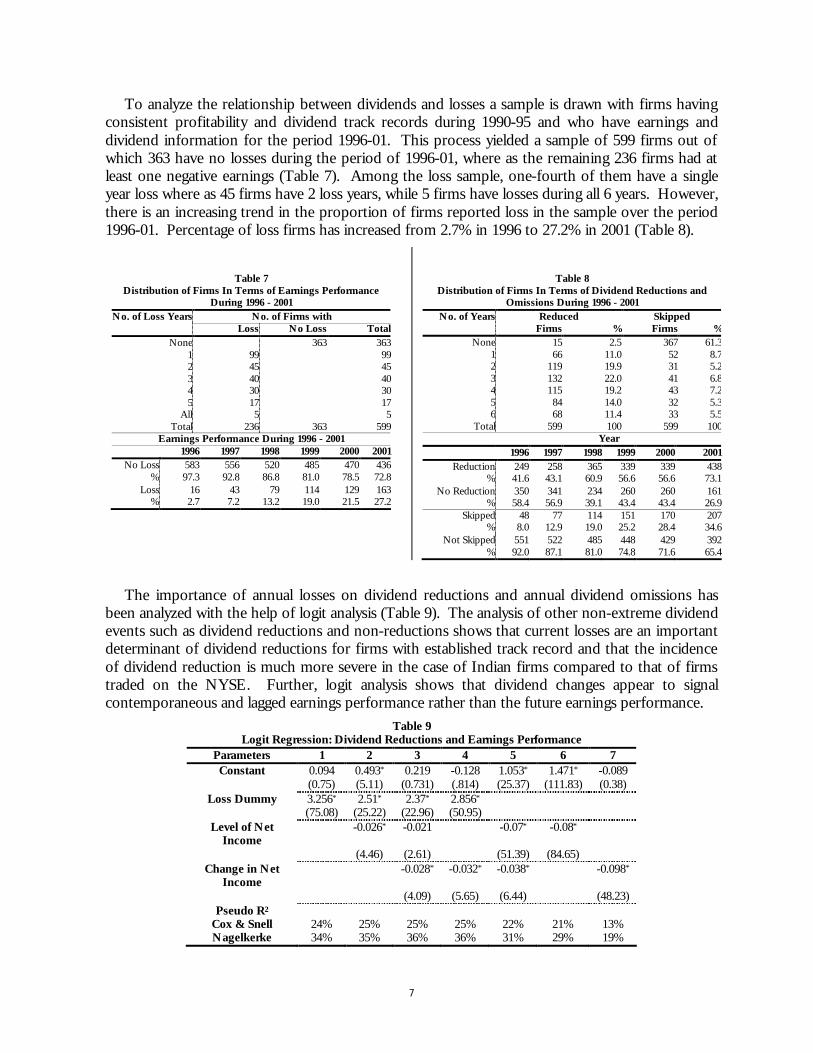
To analyze the relationship between dividends and losses a sample is drawn with firms having consistent profitability and dividend track records during 1990-95 and who have earnings and dividend information for the period 1996-01. This process yielded a sample of 599 firms out of which 363 have no losses during the period of 1996-01, where as the remaining 236 firms had at least one negative earnings (Table 7). Among the loss sample, one-fourth of them have a single year loss where as 45 firms have 2 loss years, while 5 firms have losses during all 6 years. However, there is an increasing trend in the proportion of firms reported loss in the sample over the period 1996-01. Percentage of loss firms has increased from 2.7% in 1996 to 27.2% in 2001 (Table 8).
Table 7
Distribution of Firms In Terms of Earnings Performance During 1996 - 2001
No. of Loss Years No. of Firms with Loss No Loss Total
None 363 3631 99 992 45 453 40 404 30 305 17 17
All 5 5Total 236 363 599
Earnings Performance During 1996 - 2001 1996 1997 1998 1999 2000 2001
No Loss 583 556 520 485 470 436% 97.3 92.8 86.8 81.0 78.5 72.8
Loss 16 43 79 114 129 163% 2.7 7.2 13.2 19.0 21.5 27.2
Table 8
Distribution of Firms In Terms of Dividend Reductions and Omissions During 1996 - 2001
No. of Years Reduced Skipped Firms % Firms %
None 15 2.5 367 61.31 66 11.0 52 8.72 119 19.9 31 5.23 132 22.0 41 6.84 115 19.2 43 7.25 84 14.0 32 5.36 68 11.4 33 5.5
Total 599 100 599 100Year
1996 1997 1998 1999 2000 2001Reduction 249 258 365 339 339 438
% 41.6 43.1 60.9 56.6 56.6 73.1No Reduction 350 341 234 260 260 161
% 58.4 56.9 39.1 43.4 43.4 26.9Skipped 48 77 114 151 170 207
% 8.0 12.9 19.0 25.2 28.4 34.6Not Skipped 551 522 485 448 429 392
% 92.0 87.1 81.0 74.8 71.6 65.4
The importance of annual losses on dividend reductions and annual dividend omissions has been analyzed with the help of logit analysis (Table 9). The analysis of other non-extreme dividend events such as dividend reductions and non-reductions shows that current losses are an important determinant of dividend reductions for firms with established track record and that the incidence of dividend reduction is much more severe in the case of Indian firms compared to that of firms traded on the NYSE. Further, logit analysis shows that dividend changes appear to signal contemporaneous and lagged earnings performance rather than the future earnings performance.
Table 9 Logit Regression: Dividend Reductions and Earnings Performance
Parameters 1 2 3 4 5 6 7 Constant 0.094 0.493* 0.219 -0.128 1.053* 1.471* -0.089
(0.75) (5.11) (0.731) (.814) (25.37) (111.83) (0.38) Loss Dummy 3.256* 2.51* 2.37* 2.856*
(75.08) (25.22) (22.96) (50.95) Level of Net
Income -0.026* -0.021 -0.07* -0.08*
(4.46) (2.61) (51.39) (84.65) Change in Net
Income -0.028* -0.032* -0.038* -0.098*
(4.09) (5.65) (6.44) (48.23) Pseudo R2
Cox & Snell 24% 25% 25% 25% 22% 21% 13% Nagelkerke 34% 35% 36% 36% 31% 29% 19%
8
Note: * significant at .05 level Figures in the parentheses are valid statistic values
Conclusion
The present study examines the dividend behavior of Indian corporate firms over the period 1990-01 and attempts to explain the observed behavior with the help of trade-off theory, and signaling hypothesis. Analysis of dividend trends for a large sample of stocks traded on the NSE and BSE indicate that the percentage of companies paying dividends has declined from 60.5 percent in 1990 to 32.1 percent in 2001 and that only a few firms have consistently paid the same levels of dividends. Further, narrower indices appear to have higher dividends compared to that of broader indices. Industry trends indicate that firms in the electricity, mining and diversified industries have paid higher dividends where as textile companies have paid less dividends.
Analysis of influence of tax regime changes shows that the tradeoff theory does not hold true in the Indian context, as Indian corporate firms on average do not appear to have increased dividend payments despite a tilt in tax regime in favor of more dividends.
Analysis of characteristics of payers and non-payers shows that dividend-paying companies are more profitable and large in size. However, growth doesn’t seem to deter Indian firms from paying higher dividends. Further, firms appear to prefer the pecking order of funds in building their larger asset base.
An analysis of signaling hypothesis shows that average earnings of dividend omitting firms have shown significant difference over the past 3 and next 3 years, where as initiating firms have exhibited a contrasting trend.
An analysis of other non-extreme dividend events such as dividend reductions and non-reductions shows that current losses are an important determinant of dividend reductions for firms with established track record. The incidence of dividend reduction is much more severe in the case of Indian firms compared to that of NYSE as analyzed by DeAngelo, DeAngelo and Skinner.
Future studies may examine the market reaction to dividend announcements, other possible determinants of dividend behavior such as flotation costs, and the relationships between dividend decision and financing and investment decisions.
References
1. Bhat, R. and I.M. Pandey (1994), “Dividend Decision: A Study of Managers’ Perceptions”, Decision, Vol. 21, No.s 1 & 2, January-June 1994.
2. Bhattacharya, S. (1979), “Imperfect Information, Dividend Policy, and ‘the bird in the hand’ Fallacy”, Bell Journal of Economics, Vol. 10,No.1, Spring, pp. 259-270.
3. Black, F. (1976), “The Dividend Puzzle”, Journal of Portfolio Management, Vol. 2, No. 2, Winter, pp. 5-8. 4. Brealey, R.A. (1994), “Does Dividend Policy Matter?” in Stern, J.M. and D.H. Chew (eds.), Revolution in
Corporate Finance, 2nd edition, Blackwell Publishers Inc., Cambridge, Massachusettes. 5. DeAngelo, H. L. DeAngelo and D.J. Skinner (1992), “Dividends and Losses”, Journal of Finance, Vol. 47,
No. 5, December, pp. 1837–1863. 6. Fama, E.F. and K.R. French (2001), “Disappearing Dividends: Changing Firm Characteristics or
Lower Propensity to Pay?”, Journal of Applied Corporate Finance, Vol. 14, No. 1, Spring, pp. 67-79. 7. Healey, P.M. and K.G. Palepu (1988), “Earnings Information Conveyed by Dividend Initiations and
Omissions”, Journal of Finanscial Economics, Vol. 21, No. 2, September, pp. 149-175. 8. Jensen, M.C. and W.H. Meckling (1976), “Theory of the firm: Managerial behavior, agency costs and
ownership structure”, Journal of Financial Economics, Vol. 3, No. 4 October, pp. 305-360.
9
9. John, K. and J. Williams (1985), “Dividends, Dilution, and Taxes: A Signaling Equilibrium”, Journal of Finance, Vol. 40, No. 4, pp. 1053-1070.
10. Lintner, J. (1956), “Distribution of Incomes Corporations Among Dividends, Retained Earnings and Taxes”, American Economic Review, Vol. 46, No.2, May, pp. 97-113.
11. Mahapatra, R.P. and P.K. Sahu (1993), “A Note on Determinants of Corporate Dividend Behaviour in India – An Econometric Analysis”, Decision, Vol. 20, No. 1, January-March, pp. 1-22.
12. Mishra, C. and V. Narender (1996), “Dividend Policies of SoEs in India – An Analysis”, Finance India, Vol. X, No. 3, September, pp. 633-645.
13. Miller, M.H. and F. Modigliani (1961), “Dividend Policy, Growth and the Valuation of Shares”, Journal of Business, Vol. 34, No. 4, October, pp. 411-433.
14. Miller, M. and K. Rock (1985), “Dividend Policy under Asymmetric Information”, Journal of Finance, Vol. 40, No. 4, pp. 1031-1051.
15. Mohanty, P. (1999), “Dividend and Bonus Policies of the Indian Companies”, Vikalpa, Vol.24, No. 4, October-December, pp. 35-42.
16. Narasimhan, M.S. and S. Vijayalakshmi (2002), “Impact of Agency Cost on Leverage and Dividend Policies”, The ICFAI Journal of Applied Finance, Vol. 8, No. 2, March, pp. 16-25.