diversity of cell-matrix adhesions - weizmann
TRANSCRIPT

INTRODUCTION
Focal contacts (FC) are specialized adhesion sites formedbetween cultured cells and the underlying extracellular matrix(ECM) (Burridge and Fath, 1989; Geiger et al., 1995; Gilmoreand Burridge, 1996; Yamada and Geiger, 1997). In theseregions, originally identified by electron microscopy(Abercrombie et al., 1971; Heath and Dunn, 1978) or byinterference reflection microscopy (Abercrombie and Dunn,1975; Izzard and Lochner, 1976), cells form close and tightadhesions to the underlying substratum. At their cytoplasmicaspects, FC are associated with bundles of actin filamentsthrough an electron-dense, multi-molecular complex, the sub-membrane plaque. In typical adherent cultured cells a largenumber (tens to hundreds) of distinct FC can be detected,ranging in size from less than a square micron to several squaremicrons. The number of FC, their size and distribution, canvary greatly from one cell to the other or even within a singlecell, and their morphological diversity may be affected bymultiple factors including the nature of the substratum,composition of the culture medium, incubation time afterplating, and cell density.
During the last several years, considerable information hasaccumulated on the molecular composition of FC. It wasshown that the transmembrane ‘adhesion receptors’ present inthese sites are members of the integrin superfamily (Hynes,1987, 1992; Schwartz et al., 1995). These molecules react,through their ecto-domains, with specific ECM molecules, andthrough their cytoplasmic tails with components of asubmembrane plaque that links them to the microfilamentsystem (Geiger et al., 1995; Yamada and Geiger, 1997). Thisplaque contains a multitude of proteins, some of whichparticipate in the physical linkage of the membrane receptorsto the cytoskeleton, while others are signal transductionmolecules, including different protein kinases, their substratesand various adapter proteins (Geiger et al., 1995; Jockusch etal., 1995; Kam et al., 1995; Yamada and Geiger, 1997). It isbelieved that the recruitment of these molecules to FC and theiractivation plays a central role in the generation of ‘adhesionsignals’ that are involved in the regulation of many cellularprocesses such as cell growth, differentiation or apoptosis(Clark and Brugge, 1995; Schwartz et al., 1995; Yamada, 1997;Yamada and Geiger, 1997). Recent studies have indicated thatthe assembly of FC is also stimulated by local tyrosine-specific
1655Journal of Cell Science 112, 1655-1669 (1999)Printed in Great Britain © The Company of Biologists Limited 1999JCS0106
In this study we have examined for molecular heterogeneityof cell-matrix adhesions and the involvement of actomyosincontractility in the selective recruitment of different plaqueproteins. For this purpose, we have developed a novelmicroscopic approach for molecular morphometry, basedon automatic identification of matrix adhesions, followedby quantitative immunofluorescence and morphometricanalysis. Particularly informative was fluorescence ratioimaging, comparing the local labeling intensities ofdifferent plaque molecules, including vinculin, paxillin,tensin and phosphotyrosine-containing proteins. Ratioimaging revealed considerable molecular heterogeneitybetween and within adhesion sites. Most striking were thedifferences between focal contacts, which are vinculin- andpaxillin-rich and contain high levels of phosphotyrosine,and fibrillar adhesions, which are tensin-rich and containlittle or no phosphotyrosine. Ratio imaging also revealedconsiderable variability in the molecular substructure ofindividual focal contacts, pointing to a non-uniform
distribution of phosphotyrosine and the different plaqueconstituents. Studying the quantitative relationshipsbetween the various components of the submembraneplaque indicated that the levels of vinculin, paxillin andphosphotyrosine in adhesion sites are positively correlatedwith each other and negatively correlated with the levels oftensin. Tyrosine phosphorylation of focal contacts washighly sensitive to cellular contractility, and wasdiminished within 5 minutes after treatment with thekinase inhibitor H-7, an inhibitor of actomyosincontractility. This was followed by the loss of paxillin andvinculin from the focal adhesions. Tensin-rich fibrillaradhesions were relatively insensitive to H-7 treatment.These findings suggest a role for contractility in thegeneration of matrix adhesion diversity.
Key words: Focal contact, Cell adhesion, Ratio imaging,Computerized microscopy
SUMMARY
Molecular diversity of cell-matrix adhesions
Eli Zamir1, Ben-Zion Katz2, Shin-ichi Aota3, Kenneth M. Yamada2, Benjamin Geiger1 and Zvi Kam1
1Department of Molecular Cell Biology, The Weizmann Institute of Science, Rehovot, Israel2Craniofacial Developmental Biology and Regeneration Branch, NIDCR, NIH, Bethesda, MD, USA3Biomolecular Engineering Research Institute, Osaka, Japan*Author for correspondence (e-mail: [email protected])
Accepted 25 March; published on WWW 11 May 1999

1656
protein phosphorylation and that the phosphorylation eventsare triggered by tension applied to the FC-anchored adhesioncomplexes by the attached bundles of actin filaments(Bershadsky et al., 1996).
It is intriguing that despite the extensive work for over twodecades and the vast information available on FC formationand organization, a definitive and unequivocal molecularcharacterization of these structures is not yet available. Forexample, it is not clear whether all submembrane plaques arebasically equivalent at a molecular level, nor how theircomposition is regulated. An application of computerizedmorphometry was reported recently to analyze gravitationaleffects on vinculin and FC morphology (Usson et al., 1997),but little is known about the molecular classes, organizationand quantitative dynamics of these adhesion sites.
To approach these questions, we have developed amicroscopic system that enables us to perform detailedquantitative morphometry of matrix adhesions. In this reportwe describe this experimental approach and its application toevaluate two hypotheses: (a) cell-matrix adhesions may not beuniform, but may instead consist of a range of distinctstructures that differ at the molecular level between and withinindividual adhesions; and (b) it may be possible to switch onor off rapidly the phosphorylation and assembly state of maturecell-matrix adhesions within minutes.
For rigorous, quantitative testing of these and other conceptsin cell-matrix adhesion, we present here a detailed procedurefor automated identification of matrix adhesions andcharacterization of their properties including their size, axialratio and labeling intensity for their various constituents, aswell as the calculation of fluorescence ratio imaging (FRI).This digital microscopy approach was applied here to culturedfibroblasts to test for the extent and types of molecularheterogeneity of their matrix adhesions. The results revealedan unexpected level of variability in the composition of thesematrix adhesions, extending even to different regions withinthe same adhesion site. Our findings establish three generalcategories of adhesion sites within a broad spectrum ofpopulations of matrix adhesions, namely ‘classical FC’ whichare extensively labeled for paxillin, vinculin andphosphotyrosine, ‘fibrillar adhesions’ which contain relativelylow levels of these characteristic proteins and instead containhigh levels of tensin, and ‘mosaic adhesions’ which contain acombination. We also show that treatment with the kinaseinhibitor H-7, which blocks actomyosin contraction (Volberget al., 1994; Tian et al., 1998) leads to a rapid loss ofphosphotyrosine from FC, which is then followed by theirdissociation. We further show that very shortly (<5 minutes)after H-7 withdrawal, well-formed FC with apparently normalmorphology and composition suddenly reconstitute, indicatinga high degree of potential plasticity.
MATERIALS AND METHODS
Cell culture and immunofluorescence stainingRat embryo fibroblasts (REF52) were plated on glass coverslips inDulbecco’s modified Eagle’s medium (DMEM) supplemented with10% fetal calf serum. For immunofluorescence labeling cells werefixed-permeabilized with 3% paraformaldehyde, 0.5% Triton X-100in PBS for 2 minutes, and post-fixed with 3% paraformaldehyde in
PBS for 30 minutes. The cells were then washed with PBS and stainedwith the primary antibodies for 1 hour. After washing with PBS, thecells were stained with the secondary antibodies, namely Cy3- orFITC-conjugated goat anti-mouse or goat anti-rabbit IgG. Finally, thecells were washed with PBS and mounted in Elvanol (Mowiol 4-88,Hoechst, Frankfurt, Germany).
H-7-induced inhibition of contractilityTo inhibit cellular contractility, REF52 cells were incubated with 60µM 1-(5-iso-quinolinylsulfonyl)-2-methylpiperazine (H-7; I-7016,Sigma Chemical Co., St Louis, MO, USA) for different periods oftime (Volberg et al., 1994; Tian et al., 1998). The cells were then fixedand double-labeled as described. Recovery was achieved by removalof the H-7-containing medium and further incubation of the cells innormal growth medium.
Immunochemical reagentsThe primary antibodies used in this study included: rabbit anti-vinculin (R695, Geiger 1979), rabbit anti-phosphotyrosine (PT40,kindly provided by Israel Pecht and Arie Licht, The WeizmannInstitute), monoclonal antibody (mAb) anti-vinculin (clone hVin-1,Sigma Chemical Co., St Louis, MO, USA), and mAbs anti-paxillinand anti-tensin (Transduction Laboratories, Lexington, KY, USA).Secondary antibodies (all from Jackson ImmunoResearchLaboratories Inc., West Grove, PA, USA) were Cy3-conjugated goatanti-rabbit F(ab′)2 fragment, Cy3-conjugated goat anti-mouse IgGH+L, FITC-conjugated F(ab′)2 fragment goat anti-mouse antibodyand FITC-conjugated goat anti-rabbit IgG F(ab′)2 fragment.
Generation of GFP-cytoskeletal molecules chimericproteinsFull-length chicken vinculin cDNA (Bendory et al., 1989; Price et al.,1989) and full-length human paxillin cDNA (kindly provided by K.Nakata, S. Miyamoto and K. Matsumoto, National Institute of Dentaland Craniofacial Research, National Institutes of Health, Bethesda,MD) were ligated in-frame into pGZ21 vector according to the methodof Kioka et al. (1999). pGZ21 contains a cytomegalovirus promoterand a green fluorescent protein (GFP) coding sequence with threeamino acid residue substitutions (S65A, V68L, and S72A) to increaseits fluorescence in mammalian cells (Cormack et al., 1996). REF52cells were transfected using the calcium phosphate method (Sambrooket al., 1989). Expression of each fusion protein was verified at theprotein level by western blotting utilizing monoclonal antibodies tovinculin or paxillin, as well as anti-GFP monoclonal antibody (data notshown). As an additional control, full-length chicken tensin was alsoexpressed as a GFP fusion protein (B.-Z. Katz, K. Matsumoto, S. Aota,D. Lin, S. Lin and K. M. Yamada, unpublished).
Computerized immunofluorescence microscopySpecimens were examined using an Axioskop microscope (Zeiss,Oberkochen, Germany) with selective fluorescence excitation andemission interference filters and quad-dichroic mirror (Chroma, VT,USA) that were positioned in the optical path by computer-drivenfilter wheels. Images were acquired using a scientific-grade cooledcharged-coupled device (CCD) camera (Model C220, PhotometricsCo., AZ, USA) with Texas Instruments 1024×1024 pixels chipreadout generating 12-bit digital data. Image acquisition andprocessing were controlled by a Silicon Graphics workstation model4D/35 (Mountain View, CA, USA) using modified Resolve3D andPrism software (Chen et al., 1990, 1995; Kam et al., 1993, 1997). Thissystem is currently produced by Applied Precision Inc. (Issaqua, WA,USA). In the present study cells were examined with a ×100/1.3NAplan-Neofluar objective (Zeiss, Oberkochen, Germany) resulting in apixel length of 0.118 µm. In order to correct for non-homogenousillumination and pixel-to-pixel variations in CCD sensitivities,correction files were prepared from a slide containing a thin layer ofhomogenous solution of rhodamine, using the Resolve3D software,
E. Zamir and others

1657Diversity of cell-matrix adhesions
and applied during the acquisition session. To ensure accuratealignment between the Cy3 image and the FITC image, cells wereimmunofluorescently stained for vinculin using a monoclonal anti-vinculin antibody followed by a mixture of Cy3-conjugated and FITC-conjugated goat anti-mouse antibodies. This slide was then used tomeasure, and correct, small shifts between the Cy3 and the FITCimages. These shifts were found to remain constant during theacquisition session (Kam et al., 1995).
Image filtrationMatrix adhesions, immunolabeled for their constituent proteins,appear as local intensity maxima (‘patches’) at the substrate focalplane. However, images often contain diffuse background, which isespecially prominent in thick regions of the cell. Subtraction of theaveraged image intensity within a rectangular box around each pixel(Eq. 1, Fig. 1), for a box size larger then matrix adhesions, but smallcompared to cell dimensions, ‘flattens’ this background (‘high-passfiltered image’, P f
ij) and facilitates interactive determination of auniform threshold level, Pf
min, that is well below staining intensity forall matrix adhesion patches, yet is above noise. The box-filter waschosen since it can be implemented in a fast algorithm. The box sizeused in this study was 4.7×4.7 µm. Following segmentation (seebelow); intensities and background levels were calculated from theunfiltered Pij images.
Equation 1High-pass filtration
where Pij and P fij are the intensities of pixel ij in the original and the
filtered image, respectively. (2b+1)2 defines a constant rectangulararea, equivalent to 4.7×4.7 µm.
Segmentation and quantitation of matrix adhesionsImage segments corresponding to individual matrix adhesions(‘patches’) were defined using a segmentation algorithm we named‘water’, which is based on a modified ‘lake’ algorithm (Soferman,1989). Usually, all adhesion sites in 4 representative cells were used asa basis for generation of quantitative data sets for each treatment. Thewater algorithm can be visually described as the emergence of peaksand their associated slopes as water recedes from a hilly landscape aftera flood. As water declines, new peaks appear (local maxima) andexisting hills expand their area. When two previously disjoinedmountains meet, the decision to merge them, or to regard them asseparate identities, depends on their size. The algorithm is implemented
Pqw
,P fij = Pij −
(2b + 1)2
^i+b
q=i−b^j+b
w=j−b
Fig. 1. Main stages in the segmentation of adhesionsites. Left, top: a typical fluorescence image ofvinculin-labeled REF52 cells. Note the relatively highdiffuse fluorescence in the perinuclear area, which iscommon to many immunolabeled preparations. Left,middle: the same field after high-pass filtration (boxsize: 40×40 pixels). The diffuse backgroundfluorescence disappeared while FC patches, includingrelatively small and faint ones, remained unchanged.Left, bottom: segmented ‘patches’, corresponding tovinculin-labeled matrix adhesions, as calculated by thewater software. To distinguish individual adhesions,they are artificially marked by random colors,demonstrating the separation of adjacent adhesions.Right column: for each image, a one-dimensional plotof fluorescence intensity along the marked broken lineis presented. The upper and middle panels present thefluorescence intensity along this line in the original andfiltered image, respectively. The 6 narrow peaks ineach graph correspond to 6 FC crossed by the line. Thebroad labeling that existed in the original image, butnot in the high-pass filtered image, corresponds to thediffuse staining in the perinuclear region. The bottompanel indicates the status of each pixel along this linein the patched image, where each pixel is eitherincluded in (‘status’ = 1) or excluded from (‘status’ =0) a segmented patch.

1658
for 2-D and 3-D images for any desired pixel connectivity, but wasapplied here in 2-D with 4-neighbors connectivity (i.e. each pixel has4 touching neighbors: up, down, right and left; all the other diagonalpixels are not considered connected). The inputs for the water routineare: the filtered image (P f
ij), a threshold for minimum pixel intensity(Pf
min), a threshold for minimum patch area (Apmin) and a critical patch
size for merging (Ammin). The output assigns a patch number Mij to each
pixel (ij), or zero to pixels that do not belong to any patch. The set ofinstructions in the water routine can be described as follows:
1. Sort the (ij) pixels in the high-pass filtered image according totheir intensity (P f
ij), forming a list in a decreasing order.2. Cycle over pixels (ij) in the sorted order, until P f
ij < Pfmin. At each
cycle, the pixel (ij) either:Case 1. Forms a new patch, if it is not touching any existing patch.Case 2. Is assigned to an existing patch, if it is touching one.Case 3. Merges patches, if it is touching more then one, and the
size of at least one of the connected patches is below the critical areafor merging Am
min (otherwise it is assigned to the first patch it touches).3. Exclude all patches smaller than the minimum area for patches
Apmin.The critical area for merging was typically set at 40 pixels (0.56
µm2). This value was empirically found to prevent fragmentation ofmatrix adhesions due to their internal structure, yet allowed separationof adjacent, yet distinct, matrix adhesions. To identify very largematrix adhesions with a granular texture, the critical area for mergingwas set to a much higher value of 300 pixels (4.2 µm2).
The water-generated mask, Mij (Fig. 1) allows calculation for eachmatrix adhesion (‘patch’) of various morphometric and fluorescentattributes based on the original image data (Fig. 2). The morphometricparameters used in this study include: area (Eq. 2), center of mass (Eq.3), axial ratio of best-fitted ellipse (Eq. 4), intensity (Eq. 5), and the
ratio between the intensities of two fluorophores (i.e. Cy3 and FITC)for each patch (for double-labeled samples). The equations used forcalculating these parameters are listed below:
Equation 2Patch area, Ak:
Equation 3Patch center of mass (ic
k , jck)
where the total intensity within patch k is:
Equation 4Patch axial ratio, Lk:
where Rklong and Rk
short are the length of the long and the short axes of
Rklong
Rkshort
Lk = ,
Pij .Tk = ^{ij|Mij =k}
Pij * j
; jck =ic
k =Tk
^{ij|Mij =k}
Pij * i
Tk
^{ij|Mij =k}
,
Ak = ^{ij|Mij=k}
1 .
E. Zamir and others
Fig. 2. Morphometry of matrix adhesions. Threemorphologically distinct types of adhesions recognizedby the water software are shown: (i) an arrowhead-shaped structure with homogenous fluorescenceintensity (A); (ii) a large structure with a granulartexture (B); (iii) a thin and elongated ‘beaded’ structure(C). The upper row presents the original images, andthe lower row presents the segmented image as definedby the water software. The short (Rk
short) and long(Rk
long) axes of the ellipses best fitted to these structuresare indicated by red lines. The calculated axial ratios(Lk, Eq. 4), areas (Ak, Eq. 2) and average intensities (Ik,Eq. 5) of each structure are indicated.

1659Diversity of cell-matrix adhesions
the ellipse best fitted to patch k. This ellipse axes were obtained bycalculating the Eigen values of the second moment matrix for Pij{ij|Mij=k}.
Equation 5Patch intensity, Ik:
The background intensity, Bk, is averaged locally from pixels aroundthe patch k that do not belong to any other patch.
Fluorescence ratio imaging (FRI)Images of cells, double-labeled by immunostaining for two proteincomponents of matrix adhesions, were acquired, high-pass filteredand aligned as described above. The high-pass filtration is critical forFRI since it abolishes the contribution of the background to the matrixadhesion intensity, and since it enables separation of backgroundnoise from the signal by a single threshold level. The ratio image wasthen computed and displayed (as schematically shown in Fig. 3). Inorder to avoid large ratio values due to low-intensity pixels in thedenominator, the ratio is clipped below some set threshold.Nevertheless, it is important to include in the ratio image informationabout the presence of labeling in the numerator, even when thedenominator is below threshold. For this purpose the ratio image wascalculated with two separate thresholds for the numerator anddenominator images, and assigned to each pixel in the ratio imagevalues according to the following considerations: (A) If both
numerator and denominator images were below threshold the ratioimage was set to zero. (B) If numerator was below threshold, butdenominator was above threshold, the ratio image was set to 0.1. (C)If the numerator was above threshold, but the denominator was belowthreshold the ratio image was set to 10. (D) When both images hadpixel values above their respective thresholds, the ratio value wasdisplayed in spectral, log scale, color look-up table (blue at minimum
Pij
1Bk =
^{ij|Mij =0 and (i−ic
k )2+(j−jck )2<Rlong2*1.2}
^{ij|Mij =0 and (i−ic
k )2+(j−jck )2<Rlong2*1.2}
.
Ik = −Bk .Tk
Ak
Fig. 3. Fluorescence ratio imaging (FRI). A schematic presentationof ratio imaging. The values within each square indicate the lightintensity of the corresponding pixels in the Cy3 and FITC images,following high-pass filtration and thresholding. A value of zero isassigned to pixels with intensity lower than the threshold P f
min forboth fluorophores. The ratio image, calculated as described, ispresented in the right panel. Note that: (a) pixels that are Cy3positive and FITC-negative are marked red and those that are Cy3-negative and FITC-positive are marked blue, and (b) ratio values(and colors) are not sensitive to the absolute intensity (compare, forexample, the two patches on the right).
Fig. 4. Immunostaining and FRI of GFP-tagged FCproteins. REF52 cells, transfected with GFP-vinculin (Vin), GFP-paxillin (Pax) or GFP-tensin(Ten) chimeras, were fixed and immunostained withprimary antibodies against the respective proteins(vinculin, paxillin or tensin), followed by Cy3-conjugated secondary antibodies. The rows presentthe Cy3 images in red, the GFP images in green andthe fluorescence ratio images in a spectrum scalerepresenting the ratio value.

1660
to red at maximum), which permitted presentation of ratio valuevariations over two orders of magnitude (from 0.1 to 10). To utilizethis range optimally, and to compensate for the differences in bindingconstants and photon yields of different secondary antibodies, all theratios were normalized linearly by a constant that shifts their averagetoward a ratio of 1. The ratio image was then scaled from 0.1 to 10,assigning a black color to case A, blue to case B, red to case C, anda color corresponding to the spectral scale that corresponds to the ratiobetween the Cy3 intensity and the FITC intensity to case D.
FRI of GFP-tagged versus immunofluorescently-labeled FC wasperformed by transfecting REF52 cells with cDNA encoding GFP-fusion proteins of vinculin, paxillin or tensin. Forty-eight hours later
the cells were fixed and immuno-labeled with antibodies to vinculin,paxillin or tensin (respectively), and Cy3-conjugated secondaryantibodies. FRI between the GFP and the Cy3 images was performedas described above.
RESULTS
Automated recognition and segmentation of cell-substrate adhesion sitesFC of REF52 cells were labeled for vinculin and automatically
E. Zamir and others
Fig. 5. FRI of vinculin and eitherpaxillin or tensin. REF52 cells, 48hours after plating, were double-labeled for vinculin and paxillin orvinculin and tensin using Cy3- andFITC-labeled antibodies, asindicated. The left columnpresents two-color labeling forvinculin, which was used as acontrol. The protein names arecolored red for Cy3 and green forFITC labeling (Vin, vinculin; Pax,paxillin; Ten, tensin). The rowspresent, from top to bottom, theCy3 images in red, the FITCimages in green, the superimposedimages in red and green, and theratio images in a spectrum scalerepresenting the value of the ratio.Note the uniform yellow color ofFC in the control vinculin/vinculinratio image due to uniform ratiosof superimposed red and green.

1661Diversity of cell-matrix adhesions
identified as described above (Fig. 1). The raw images of suchcells were often quite noisy, displaying diffuse staining in thenucleus or in a relatively thick region of the cytoplasm (Fig. 1,‘original image’). This background labeling was reduced usingthe high-pass filter, generating a relatively high-contrast imagewithout losing small or faint FC (Fig. 1, ‘filtered image’).Using the water algorithm, individual matrix-adhesion sitescould be identified and marked either by a dot on the originalraw image (not shown) or by random color presentation (Fig.1, ‘patched image’). The water system was capable ofdistinguishing close or even touching, yet distinct, adhesionsites. Rarely, apparently single adhesions were subdivided bythe water algorithm into two or more smaller FC due to thepresence of fine substructures within the FC itself. Such FCcould be merged manually. For each matrix-adhesion site, thearea, axial ratio, and intensity of patches recognized by thewater software were calculated (Fig. 2). In order to segmentvery large and granular adhesion sites (Fig. 2B,C) we used adifferent set of threshold values for water segmentation fromthose used to recognize the more homogeneous and smallerFC.
Molecular diversity of cell-matrix adhesions – FRIanalysisTo determine whether the immunofluorescence labelingintensity indeed represents the local concentrations of thevarious proteins, we transfected cells with cDNA encodingGFP chimeras of vinculin, paxillin or tensin, and 48 hours later(after the GFP-tagged molecules were fully incorporated into
adhesion sites) the cells were fixed and counter-labeled withantibodies to vinculin, paxillin or tensin, and then Cy3-labeledsecondary antibodies. FRI of such double labeling experiments(Fig. 4) indicated that, for the three proteins tested, FRI valueswere highly uniform, confirming that the immunofluorescencelabeling intensity accurately represents the local concentrationof the respective proteins.
To study the level of molecular heterogeneity of matrixadhesions, REF52 were fixed 48 hours after plating, anddouble-labeled for different pairs of plaque proteins, using amouse/rabbit combination of primary antibodies and thecorresponding FITC- and Cy3-labeled secondary antibodies.The pairs of primary antibodies used here included: vinculin-paxillin, tensin-vinculin, phosphotyrosine-paxillin, tensin-phosphotyrosine, and phosphotyrosine-vinculin. All of thesecomponents were previously known to localize to FC (Geigeret al., 1995; Yamada and Geiger, 1997). As a control for thereliability of the double-labeling approach, we calculated thevinculin-vinculin FRI following double labeling with rabbitand mouse antibodies.
Examination of this control sample (vinculin-vinculin, Fig.5, left column) revealed uniform ratio values both betweenand within FC. These nearly identical values of fluorescenceratios were found irrespective of local variations in vinculinlabeling intensity. Minor differences apparently do notcorrespond to definitive FC, and reflect low levels of diffusebackground labeling. Vinculin-paxillin FRI (Fig. 5, middlecolumn) revealed largely comparable distributions of the twoproteins in FC. Some sites, displaying vinculin-rich structures
Fig. 6. Variations in the distribution of vinculin,paxillin and tensin within individual matrixadhesions. Double labeling and FRI images ofindividual adhesion sites following double labelingof REF52 cells for vinculin and either paxillin ortensin. Cells were labeled, and images are presented,as described in the legend for Fig. 5. The individualadhesions are shown here at a higher magnification,to visualize their internal molecular sub-structure.
1662
with essentially no paxillin, corresponded to cell-celladhesions, which were previously shown to contain vinculinbut no paxillin (Turner et al., 1990). Examination of thetensin-vinculin pairs revealed very different distributionpatterns (Fig. 5, right column). Three distinct types ofadhesions were discerned: centrally-located adhesions whichwere tensin-rich, elongated FC at the cell periphery that werevinculin-rich, and smaller FC that displayed comparablefluorescence intensities of both proteins. These threepopulations were not randomly interspersed, but ratherclustered in different regions of the cell (Fig. 5). Examination
at higher power revealed highly non-uniform distributions ofthe two proteins, with distinct tensin-rich or vinculin-rich domains within individual adhesions (Fig. 6). Highmagnification images of vinculin-paxillin FRI (Fig. 6) werelargely uniform both within and between FC.
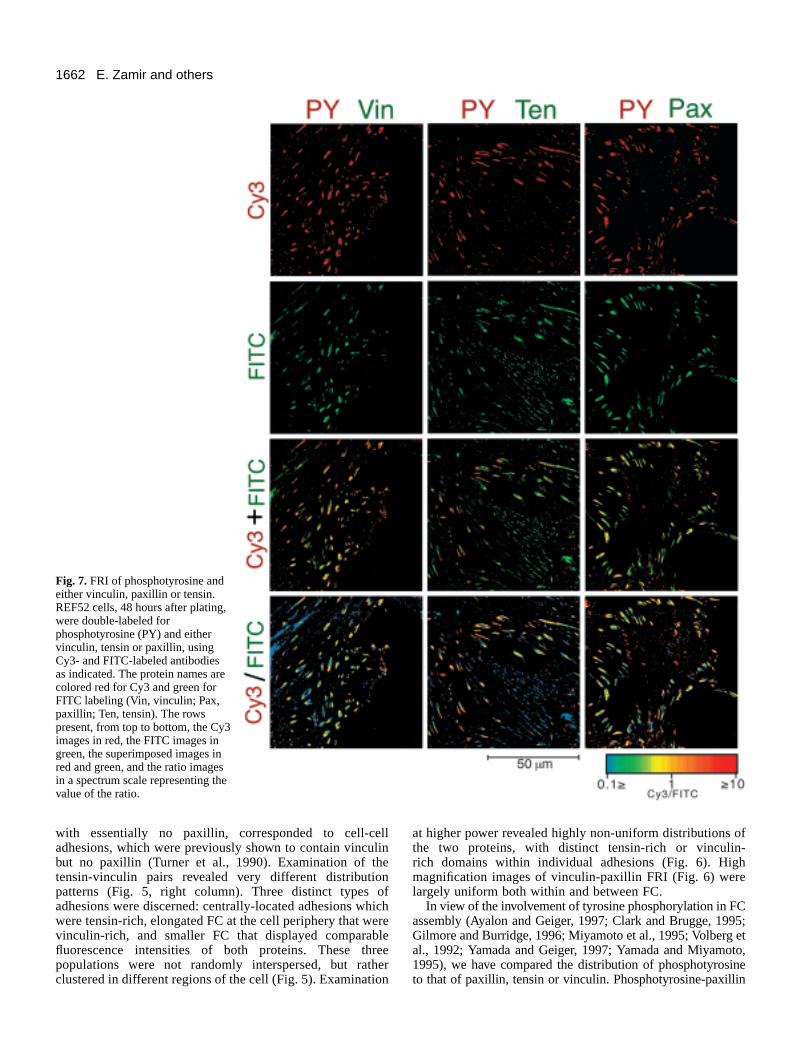
In view of the involvement of tyrosine phosphorylation in FCassembly (Ayalon and Geiger, 1997; Clark and Brugge, 1995;Gilmore and Burridge, 1996; Miyamoto et al., 1995; Volberg etal., 1992; Yamada and Geiger, 1997; Yamada and Miyamoto,1995), we have compared the distribution of phosphotyrosineto that of paxillin, tensin or vinculin. Phosphotyrosine-paxillin
E. Zamir and others
Fig. 7. FRI of phosphotyrosine andeither vinculin, paxillin or tensin.REF52 cells, 48 hours after plating,were double-labeled forphosphotyrosine (PY) and eithervinculin, tensin or paxillin, usingCy3- and FITC-labeled antibodiesas indicated. The protein names arecolored red for Cy3 and green forFITC labeling (Vin, vinculin; Pax,paxillin; Ten, tensin). The rowspresent, from top to bottom, the Cy3images in red, the FITC images ingreen, the superimposed images inred and green, and the ratio imagesin a spectrum scale representing thevalue of the ratio.

1663Diversity of cell-matrix adhesions
FRI pointed to a largely similar labeling of FC with uniformFRI (Fig. 7). Again, occasional phosphotyrosine-labeledpaxillin-negative structures at the cell periphery correspondedto cell-cell adherens junctions. Vinculin-phosphotyrosine FRIshowed less uniform patterns both between and within FC (Fig.7). The most striking differences observed, however, werebetween phosphotyrosine and tensin (Fig. 7) manifested by lowratios along the tensin-rich fibrillar adhesions located mainly atthe cell center, and ‘mosaic’ FRI images in more peripheral FCpointing to mutually exclusive distribution. Examination ofindividual adhesions revealed that in contrast to vinculin andpaxillin, phosphotyrosine was non-uniformly distributed alongFC and tended to be associated with the edges or the peripheryof FC (Fig. 8). Phosphotyrosine levels in fibrillar adhesionswere very low compared to tensin (Fig. 8). Moreover, even
when tensin and phosphotyrosine were associated with the samestructure, they usually did not overlap (Fig. 8).
To study the relationships between the morphology andcomposition of matrix adhesions, cells were labeled for tensinand phosphotyrosine, and the labeling intensities werecorrelated with the morphology of the adhesion sites.Phosphotyrosine was found to be primarily localized in round-to-ellipsoid (axial ratio <7) adhesions measuring 0.5-4 µm2
(Fig. 9A,B,C). In contrast, tensin was associated with threedistinct types of structures: (i) small (0.5-3 µm2) and rounded-to-ellipsoid (axial ratio <5) adhesions, (ii) elongated fibrillarstructures (axial ratio >7), and (iii) large (>8 µm2) androunded-to-ellipsoid (axial ratio <7) adhesions (Fig. 9A,B,C).In the non-fibrillar structures, the intensities of tensin andphosphotyrosine were variable compared to the rather uniform
Fig. 8. Variations in the distribution ofphosphotyrosine, vinculin, paxillin and tensinwithin individual matrix adhesions. Double labelingand FRI images of individual matrix adhesionsfollowing double labeling of REF52 cells forphosphotyrosine and either vinculin, paxillin ortensin (as in Fig. 6). Images are presented asdescribed in the legend to Fig. 5.

1664
prevalence of tensin in, and the absence of phosphotyrosinefrom, the fibrillar structures (Fig. 9A, compare to D). Theseresults established the existence of different molecular formsof adhesion sites with distinct shapes.
Quantitative evaluation of matrix adhesion diversityTo quantitatively determine the molecular relationships
between different constituents of cell-matrix adhesions, wecompared the labeling intensities of vinculin andphosphotyrosine in matrix adhesions to those of vinculin(control), paxillin and tensin (Fig. 10). As expected, therelation between the paired labeling for vinculin was linear,positive, and with a high coefficient of correlation(R=0.83±0.04). Paxillin labeling was also found to be strongly
E. Zamir and others
100
200
300
400
500
600
700
800
0 5 10 15 20 25
tensinPY
axial ratio
0
1
2
3
4
5
6
7
8
9
10
11
12
13
0 5 10 15 20 25
tensinPY
axial ratio
area
(µm
2 )
C
inte
nsity
(A
U)
100
200
300
400
500
600
700
800
0 1 2 3 4 5 6 7 8 9 10 11 12 13
tensinPY
area (µm2)in
tens
ity (
AU
)
B
0
0.1
0.2
0.3
0.4
0.5
0 5 10 15 20 25
axial ratio
(PY
/ te
nsin
) in
tens
ity r
atio
A
D
Fig. 9. Correlation between composition and morphological parameters in matrix adhesion sites. REF52 were double-stained forphosphotyrosine and tensin. The adhesion sites in four representative cells were segmented according to each type of staining separately, usingthe water algorithm. (A), (B) and (C) are scatter plots presenting the relationships between axial ratio (Lk, Eq. 4), intensity (Ik, Eq. 5) and area(Ak, Eq. 2) of adhesion sites segmented according to tensin labeling (black ‘x’) or phosphotyrosine labeling (red ‘o’). (D), Scatter plotpresenting the relationship between axial ratio and the phosphotyrosine to tensin fluorescence ratio. Segmentation was based on tensin labeling.

1665Diversity of cell-matrix adhesions
correlated with that of vinculin (R=0.73±0.08; Fig. 10). Tensin,on the other hand, showed no significant correlation withvinculin (R=0.05±0.21; Fig. 10).
Correlation of phosphotyrosine labeling intensity and that ofpaxillin, vinculin and tensin provided further insight into themolecular diversity of matrix adhesions. Both vinculin andpaxillin were found to be positively correlated withphosphotyrosine intensities (R=0.42±0.17 and R=0.32±0.14,respectively), though the correlation coefficients weresignificantly lower than those obtained for the paxillin-vinculinpair. Tensin on the other hand was negatively correlated withthe phosphotyrosine average intensity (R=-0.28±0.28; Fig. 10).
Effect of cellular contractility on the molecularorganization of matrix adhesionsAs previously shown, treatment of cells with the kinaseinhibitor H-7 leads to the loss of cellular contractility anddeterioration of stress fibers and FC (Volberg et al., 1994; Tianet al., 1998). To monitor the dynamics of the molecular
changes occurring in adhesion sites due to the modulation ofactomyosin contractility, we treated REF52 cells with 60 µMH-7 and examined the morphology and molecular organizationof adhesion sites.
As shown in Fig. 11, after 5 minutes of treatment with H-7,FC still had normal morphology and contained vinculin,paxillin and tensin, yet their phosphotyrosine content wasdramatically reduced. Upon longer treatment FC graduallydisappeared, and within 30 minutes almost no FC with normalmorphology were retained; only dot-like structures containingpaxillin and phosphotyrosine could be detected at the cellperiphery. Tensin, in these H-7-treated cells, was primarilyfound in small, scattered patches that were largely devoid ofphosphotyrosine, paxillin and vinculin. The nature of thesestructures is still unclear. A similar effect was also notedfollowing treatment of human foreskin fibroblasts with aspecific myosin light chain kinase inhibitor, ML-7 (data notshown).
This effect of H-7 was rapidly reversible, and well-formed
Vin PY
Vin
Pax
Ten
A
0
0.25
0.5
0.75
1
-0.75
-0.5
-0.25
0
0.25
0.5
0.75
1
corr
elat
ion
coef
fici
ent (
R)
Vin Pax Ten
Vin
PY
B
Fig. 10. Correlation between the labeling intensities of adhesion sites for different component molecules. REF52 were double-stained forvinculin or phosphotyrosine (with rabbit antibodies) and for vinculin or paxillin or tensin (with mouse mAb). Adhesion sites, in severalrepresentative cells per each paired staining, were segmented by the water software according to the vinculin or phosphotyrosine staining, andthe intensities in the segmented areas were calculated for each of the proteins. (A) Scatter plots and regression lines presenting the relationshipsbetween the intensities (Ik, Eq. 5) of the double-stained proteins, in a representative cell (per each staining). (B) The calculated average valuesof the coefficient of correlation between the labeling intensities for the two respective proteins.

1666
adhesion sites were reformed within 5 minutes after H-7removal. The newly formed FC had apparently normalmorphology, and their levels of paxillin, vinculin andphosphotyrosine were similar to those found in untreated cells(Fig. 12). Recovery of tensin in FC appeared to be somewhatslower.
DISCUSSION
The primary objective of the present study was to characterizethe molecular and structural diversity, as well as the plasticityof cell-matrix adhesions. Studies for over two decades haverevealed a multitude of so called ‘FC proteins,’ defined as suchon the basis of their general distribution pattern. Yet, a standardand unequivocal definition of FC, their overall molecularcompositions and potential diversity, have received relativelylittle attention. A major obstacle in approaching this issue in
the past has been the non-quantitative nature of mostmicroscopic studies of FC structure. Thus, matrix adhesionsare commonly viewed as a molecularly homogenous entity,containing a full repertoire of FC proteins (Burridge and Fath,1989; Geiger et al., 1995; Jockusch et al., 1995).
In this study, we challenge this view and establish, with thehelp of digital microscopy, that matrix adhesions are highlydiverse structures, both molecularly and morphologically, thatcan be subdivided into 3 main categories: (i) ‘classical FC’which are arrowhead shaped, and contain high levels ofphosphotyrosine, paxillin and vinculin, and relatively lowlevels of tensin, (ii) ‘fibrillar adhesions’ which are elongated(typical axial ratio >7) and contain relatively high levels oftensin and low phosphotyrosine, and (iii) ‘mosaic FC’ with thegeneral appearance of classical FC, yet with a highly non-uniform internal molecular structure. We further show thattreatment with the kinase inhibitor H-7, which blocksactomyosin-driven contractility, leads to a rapid loss of
E. Zamir and others
Fig. 11. FRI analysis following H-7-induced FC disassembly. REF52 cells, 48 hours after plating, were treated with 60 µM H-7 for 5, 15 or 30minutes, fixed and double-labeled for phosphotyrosine (PY) and either paxillin, vinculin or tensin, and for vinculin with either paxillin ortensin. Untreated cells were used as controls. The protein names are colored red for Cy3 and green for FITC labeling. The ratio images,between the Cy3 and the FITC image, are presented in a spectrum scale representing the ratio value.

1667Diversity of cell-matrix adhesions
phosphotyrosine from FC, followed by the disassembly of thestructure. Re-assembly is swift (<5 minutes), suggesting thateven large FC can be regenerated rapidly.
The key tool used here for studying matrix adhesiondiversity was digital microscopy and multiple imagesprocessing, which enabled identification and molecularmapping of these sites. The novel elements in this analysis,described here for the first time, are the use of the wateralgorithm, the definition of criteria for an automaticrecognition and segmentation of adhesion sites, and the
introduction of the ratio-imaging approach. Our initial attemptsto use uniform (size and/or intensity) thresholds in order toeliminate background labeling failed to resolve individualadhesions, and large clusters of FC were often identified as asingle structure. The water algorithm enabled identification oflocal ‘valleys’ which separate adjacent adhesion sites,resolving such clusters into the individual adhesions. Thesetting of critical area thresholds was selected empirically, sothat fine substructures within individual adhesions would notlead to excessive segmentation. This precaution was especially
Fig. 12. FRI analysis of FC recovery following H-7 treatment. REF52 cells, 24 hours after plating, were treated with 60 µM H-7 for 60minutes. After nearly all FC had disassembled (time ‘0’), the H-7 was washed out, and the cells were further incubated in H-7-free medium for5, 20 and 60 minutes, fixed and double-labeled as indicated, UT, untreated. The ratio images, between the Cy3 and the FITC image, arepresented in a spectrum scale representing the ratio value.

1668
critical for fibrillar adhesions with granular labeling texture(such as the one shown in Fig. 2C). As indicated above, thesegmentation process was carried out interactively, verifyingthat appropriate values of P f
min, Apmin and Am
min were selected,and allowing us to manually merge or separate adhesions. It ishowever noteworthy that such manual interventions wereneeded relatively rarely, and that the entire procedure enablesa very broad and unbiased sampling of matrix adhesion sites,allowing for reliable statistical analyses.
A source of potential concern addressed in this study wasthe reliability of quantitation by immunofluorescencemicroscopy, namely, to what extent local fluorescenceintensities accurately represent local concentrations of labeledproteins. This issue is relevant to interpretation ofimmunofluorescence data in general and is particularly criticalin a quantitative study such as this report. To approach thisissue, we compared the local intensities of fluorescence of GFPchimeras of vinculin, paxillin and tensin to the correspondingimmunofluorescence images. Pixel-by-pixel comparisons ofthese images confirmed that the two were very closelycorrelated, indicating that, in these systems, levels ofimmunofluorescence intensity faithfully represent local proteinconcentrations and are not significantly affected by factorssuch as antigen exposure or epitope instability. It isnevertheless clear that these values provide information on therelative levels of the proteins in question and do not provideabsolute protein concentrations.
A novel procedure described here is FRI of cytoskeletal andplaque proteins. As shown above, this approach was extremelyuseful in revealing the diversity in the molecular organizationand sub-cellular distribution of matrix adhesions. It is,however, important to highlight here both the potential andlimitation of this approach. The unique feature of FRI, whichis not attainable by simple superposition, is that it is highlysensitive to local differences in relative fluorescence stainingintensities of two proteins, irrespective of their absoluteintensities, thereby providing valuable information for evenfaintly labeled structures. The calculations are based on 12-bitdigital data, which are highly accurate even for faint structures.It should be emphasized that the calculated ratios are based onnormalized fluorescence intensities (compensating fordifferences in overall labeling intensities with FITC-labeledand Cy3-labeled antibodies) and, as indicated above, they donot reflect the absolute concentrations of each of the moleculesexamined.
However, the data presented here on the differentialdistribution of various components of the submembrane plaqueof matrix adhesions (vinculin, paxillin, tensin andphosphotyrosine) clearly document the diversity in themolecular organization of adhesion sites, as well as thepresence of distinct molecular subdomains within thesestructures. We have distinguished here between ‘classical’ FC,‘fibrillar’ adhesions, and ‘mosaic’ adhesions, based on thelabeling for the four FC antigens listed above. Yet, it is entirelypossible that systematic examination of additional plaquecomponents (i.e. talin, focal adhesion kinase, VASP, α-actinin,actin, etc.; Geiger et al., 1995) will provide morecomprehensive information on the detailed molecularorganization of each type of adhesive structure. Such analysisis currently underway.
Another parameter examined in this study is the temporal
sequence of molecular interaction involved in the formationand modulation of matrix adhesions. Based on previous data,we have used the kinase inhibitor H-7 for the suppression ofFC formation, and examined the disruption and reformation ofadhesive structures upon its addition and removal. It has beenpreviously shown that H-7 strongly suppresses actomyosin-driven contractility in cultured cells (Volberg et al., 1994) andthat this effect leads to deterioration of stress fibers and FC(Bershadsky et al., 1996; Volberg et al., 1994; Tian et al.,1998). FRI analysis of cells at different time points afteraddition of H-7 indicated that the earliest detectable responseto H-7 treatment was the loss of phosphotyrosine from FC. Itis not clear yet whether this reduction in local phosphotyrosinelevels is due to dephosphorylation in situ or to loss ofphosphorylated proteins from the adhesion site. This effect wasobserved as early as 5 minutes after the addition of H-7, thoughat that stage proteins such as vinculin and paxillin were stillretained in FC. Only following longer incubations a loss ofthese proteins from FC was observed along with deteriorationof FC structure. We therefore propose that local tension appliedby the actomyosin system may trigger local tyrosinephosphorylation, which, in turn, is important for the assemblyof the submembrane plaque.
In a separate study (B. Z. Katz et al., unpublished), we haveexamined the integrin specificity of the various matrixadhesions in human foreskin fibroblasts. We found thatclassical FC contain mainly αvβ3, are devoid of fibronectin andare tyrosine-phosphorylated. The fibrillar adhesions, on theother hand, are α5β1- and fibronectin-rich and are poorlylabeled for phosphotyrosine. It was further shown that localtyrosine phosphorylation heavily depends on matrixdeformability, whereas tensin distribution closely correlateswith that of α5β1.
The results presented here on the molecular organization ofmatrix adhesion diversity, and the possibilities offered by thedigital microscopic system described here, point to aremarkable molecular heterogeneity of these sites and offer anew classification of matrix adhesion subtypes. Furtherexamination of matrix adhesion diversity after exposure ofcells to a variety of additional experimental conditions such asdifferences in matrix molecules, growth factor stimulation,mechanical perturbations, microtubule reorganization and cellshape, may shed further light on the physiological assemblyand reorganization of cell adhesion sites.
We thank Ken Nakata, Shingo Miyamoto and Kazue Matsumoto(NIDCR, NIH) for the human paxillin cDNA. We express ourgratitude to Prof. Adi Shamir (Department of Applied Mathematics,the Weizmann Institute, Israel) for illuminating discussions. Thisstudy was supported by the Israel Science Foundation and the MinervaFoundation. BG holds the Erwin Neter Chair in Cell and TumorBiology. ZK holds the Israel Pollak Chair of Biophysics
REFERENCES
Abercrombie, M., Heaysman, J. E. and Pegrum, S. M. (1971). Thelocomotion of fibroblasts in culture. IV. Electron microscopy of the leadinglamella. Exp. Cell Res. 67, 359-367.
Abercrombie, M. and Dunn, G. A. (1975). Adhesions of fibroblasts tosubstratum during contact inhibition observed by interference reflectionmicroscopy. Exp. Cell Res. 92, 57-62.
Ayalon, O. and Geiger, B. (1997). Cyclic changes in the organization of cell
E. Zamir and others

1669Diversity of cell-matrix adhesions
adhesions and the associated cytoskeleton, induced by stimulation oftyrosine phosphorylation in bovine aortic endothelial cells. J. Cell Sci. 110,547-556.
Bendory, R., Salomon, D. and Geiger, B. (1989). Identification of two distinctfunctional domains on vinculin involoved in its association with focalcontacts. J. Cell Biol. 108, 2383-2393.
Bershadsky, A., Chausovsky, A., Becker, E., Lyubimova, A. and Geiger, B.(1996). Involvement of microtubules in the control of adhesion-dependentsignal transduction. Curr Biol. 6, 1279-1289.
Burridge, K. and Fath, K. (1989). Focal contacts: transmembrane links betweenthe extracellular matrix and the cytoskeleton. BioEssays. 10, 104-108.
Chen, H., Sedat, J. W. and Agard, D. A. (1990). Manipulation, display, andanalysis of three-dimensional biological images. In Handbook of BiologicalConfocal Microscopy (ed. J. B. Pawley), pp. 141-150. New York: PlenumPress.
Chen, H., Swedlow, J. R., Grote, M., Sedat, J. W. and Agard, D. A. (1995).Collection, processing, and display of digital three-dimensional images ofbiological specimens. In Handbook of Biological Confocal Microscopy (ed.J. B. Pawley), pp. 197-210. New York: Plenum Press.
Clark, E. A. and Brugge, J. S. (1995). Integrins and signal transductionpathways: the road taken. Science 268, 233-239.
Cormack, B. K., Valdivia, R. H. and Falkow, S. (1996). FACS-optimizedmutants of the green fluorescent protein (GFP). Gene 173, 33-38.
Geiger, B. (1979). A 130K protein from chicken gizzard: its localization at thetermini of microfilament bundles in cultured chicken cells. Cell 18, 193-205.
Geiger, B., Yehuda-Levenberg, S. and Bershadsky, A. D. (1995). Molecularinteractions in the submembrane plaque of cell-cell and cell-matrixadhesions. Acta Anat. (Basel). 154, 46-62.
Gilmore, A. P. and Burridge, K. (1996). Molecular mechanisms for focaladhesion assembly through regulation of protein-protein interactions.Structure 4, 647-651.
Heath, J. P. and Dunn, G. A. (1978). Cell to substratum contacts of chickfibroblasts and their relation to the microfilament system. A correlatedinterference-reflexion and high-voltage electron-microscope study. J. CellSci. 29, 197-212.
Hynes, R. O. (1987). Integrins: a family of cell surface receptors. Cell 48,549-554.
Hynes, R. O. (1992). Integrins: versatility, modulation, and signaling in celladhesion. Cell 69, 11-25.
Izzard, C. S. and Lochner, L. R. (1976). Cell-to-substrate contacts in livingfibroblasts: an interference reflexion study with an evaluation of thetechnique. J. Cell Sci. 21, 129-159.
Jockusch, B. M., Bubeck, P., Giehl, K., Kroemker, M., Moschner, J.,Rothkegel, M., Rudiger, M., Schluter, K., Stanke, G. and Winkler, J.(1995). The molecular architecture of focal adhesions. Annu. Rev. Cell. Dev.Biol. 11, 379-416.
Kam, Z., Jones, M. O., Chen, H., Agard, D. A. and Sedat, J. W. (1993).Design and construction of an optimal illumination system for quantitativewide-field multi-dimensional microscopy. Bioimaging 1, 71-81.
Kam, Z., Volberg, T. and Geiger, B. (1995). Mapping of adherens junctioncomponents using microscopic resonance energy transfer imaging. J. CellSci. 108, 1051-1062.
Kam, Z., Agard, D. A. and Sedat, J. W. (1997). Three-dimensionalmicroscopy in thich biological samples: a fresh approach for adjusting focusand correcting spherical aberration. Bioimaging 5, 40-49.
Kioka, N., Sakata, S., Kawauchi, T., Amachi, T., Akiyama, S. K., Okazaki,K., Yaen, C., Yamada, K. M. and Aota, S. I. (1999). Vinexin: a novelvinculin-binding protein with multiple SH3 domains enhances actincytoskeletal organization. J. Cell Biol. 144, 56-69.
Miyamoto, S., Teramoto, H., Coso, O. A., Gutkind, J. S., Burbelo, P. D.,Akiyama, S. K. and Yamada, K. M. (1995). Integrin function: molecularhierarchies of cytoskeletal and signaling molecules. J. Cell Biol. 131, 791-805.
Price, G. L., Jones, P., Davison, M. D., Patel, B., Bendori, R., Geiger, B.and Critchley, D. R. (1989). Primary sequence and domain structure ofchicken vinculin. Biochem. J. 259, 453-461.
Sambrook, J., Fritsch E. F. and Maniatis T. M. (1989). Molecular Cloning:A Laboratory Manual. Cold Spring Harbor, NY: Cold Spring HarborLaboratory Press.
Schwartz, M. A., Schaller, M. D. and Ginsberg, M. H. (1995). Integrins:emerging paradigms of signal transduction. Annu. Rev. Cell. Dev. Biol. 11,549-599.
Soferman, Z. (1989). Computerized Optical Microscopy. Doctoral thesis.Department of Applied Mathematics and Computer Science. WeizmannInstitute of Science, Rehovot, Israel.
Tian, B., Millar, C., Kaufman, P. L., Bershadsky, A., Becker, E. and Geiger,B. (1998). Effects of H-7 on the iris and ciliary muscle in monkeys. Arch.Ophthalmol. 116, 1070-1077.
Turner, C. E., Glenney, J. R., Jr. and Burridge, K. (1990). Paxillin: a newvinculin-binding protein present in focal adhesions. J. Cell Biol. 111, 1059-1068.
Usson, Y., Guignandon, A., Laroche, N., Marie-Helene, L. P. and Vico, L.(1997). Quantitation of cell-matrix adhesion using confocal image analysisof focal contact associated proteins and interference reflection microscopy.Cytometry 28, 298-304.
Volberg, T., Zick, Y., Dror, R., Sabanay, I., Gilon, C., Levitzki, A.and Geiger, B. (1992). The effect of tyrosine-specific proteinphosphorylation on the assembly of adherens-type junctions. EMBO J. 11,1733-1742.
Volberg, T., Geiger, B., Citi, S. and Bershadsky, A. D. (1994). Effect ofprotein kinase inhibitor H-7 on the contractility, integrity, and membraneanchorage of the microfilament system. Cell Motil Cytoskel. 29, 321-338.
Yamada, K. M. (1997). Integrin signaling. Matrix Biol. 16, 137-141.Yamada, K. M. and Geiger, B. (1997). Molecular interactions in cell adhesion
complexes. Curr. Opin. Cell Biol. 9, 76-85.Yamada, K. M. and Miyamoto, S. (1995). Integrin transmembrane signaling
and cytoskeletal control. Curr. Opin. Cell Biol. 7, 681-689.